EDUCAUSE Center for Applied Research
An Update
New EDUCAUSE Initiatives for 2002
• EDUCAUSE Core Data Survey
• Virtual Communities Initiative
• Institute for Computer Policy and Law
• Expansion of Regional Conferences
• Assuming responsibility for .edu
• HEBCA
• EDUCAUSE Center for Applied Research
Knowledge Based Organization
• Uses informed intuition
• Applies dialogue before deliberation
• Employs insights about effective practices
• Uses core competencies effectively
IT and Higher Education
• Overall expenditures over $250 billion• IT expenditures $5 - $10 billion• IT increasingly important• Higher ed is ‘on the cusp’
– New IT architecture– New pedagogy– New competitive landscape– New professional skills, impact and stature
Emerging Questions
• Are there ways to organize tools and programs to support a culture of evidence?
• Is there an architecture?• Can we increase, activate, accelerate or
better organize knowledge?• Are there ways to employ a culture of
evidence to enhance decisions and to increase the diffusion of positive innovations in higher education?
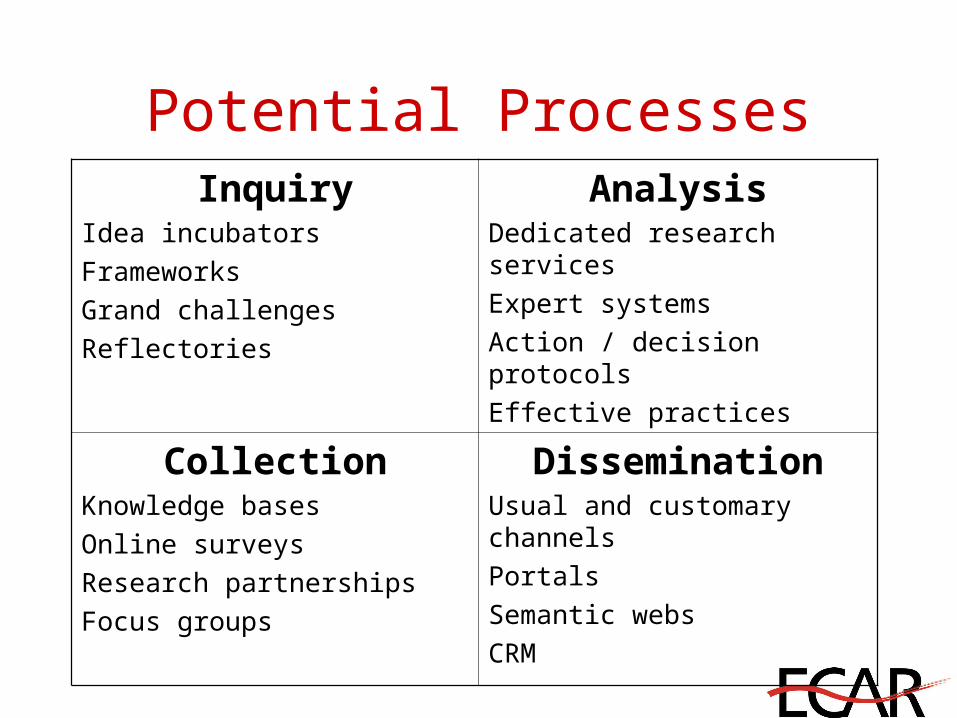
Potential ProcessesInquiry
Idea incubators
Frameworks
Grand challenges
Reflectories
AnalysisDedicated research services
Expert systems
Action / decision protocols
Effective practices
CollectionKnowledge bases
Online surveys
Research partnerships
Focus groups
DisseminationUsual and customary channels
Portals
Semantic webs
CRM

Conclusions
• We live in a time of uncertainty
• Higher education has a key role to play
• It’s about dualism not dichotomy
• The pace of change will accelerate
• Higher education’s shift to a culture of evidence is in everyone’s interest
Why ECAR?
“ECAR should become a research organization focused on the intersection of IT and higher education.”
EDUCAUSE Board of Directors
Mission
• To foster better decision-making through research and analysis about the role and implications of information technology in higher education
• To address several challenges facing higher education through a systematic program of research, education and outreach
Audiences
• EDUCAUSE members• CIOs• Presidents• Provosts• CFOs• Librarians• Deans• Faculty leaders

Research Bulletins
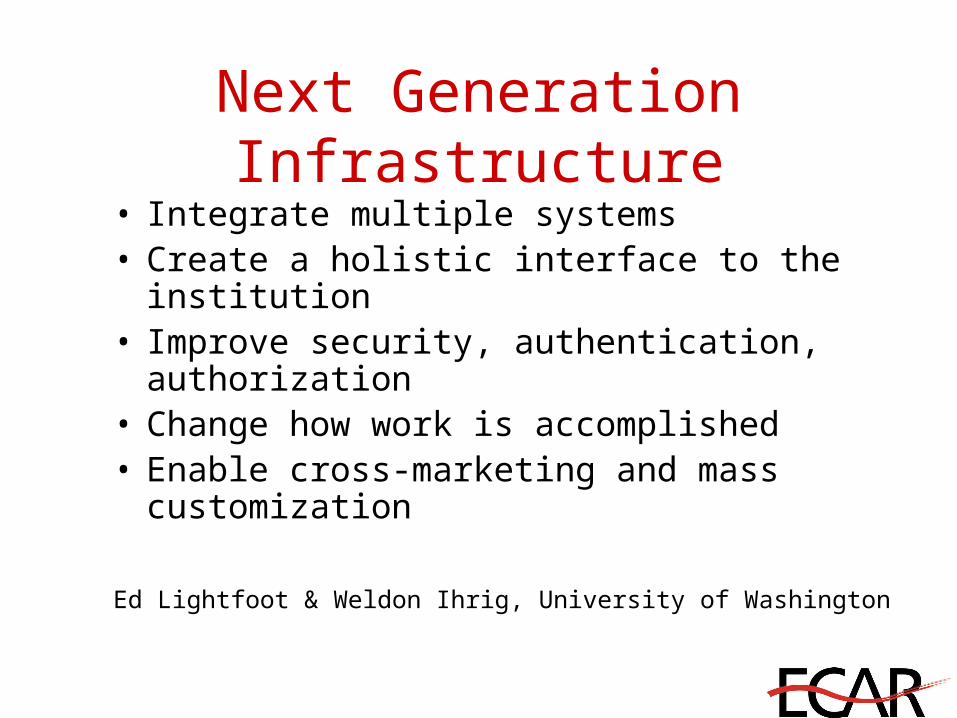
Next Generation Infrastructure• Integrate multiple systems• Create a holistic interface to the institution• Improve security, authentication,
authorization• Change how work is accomplished• Enable cross-marketing and mass
customization
Ed Lightfoot & Weldon Ihrig, University of Washington
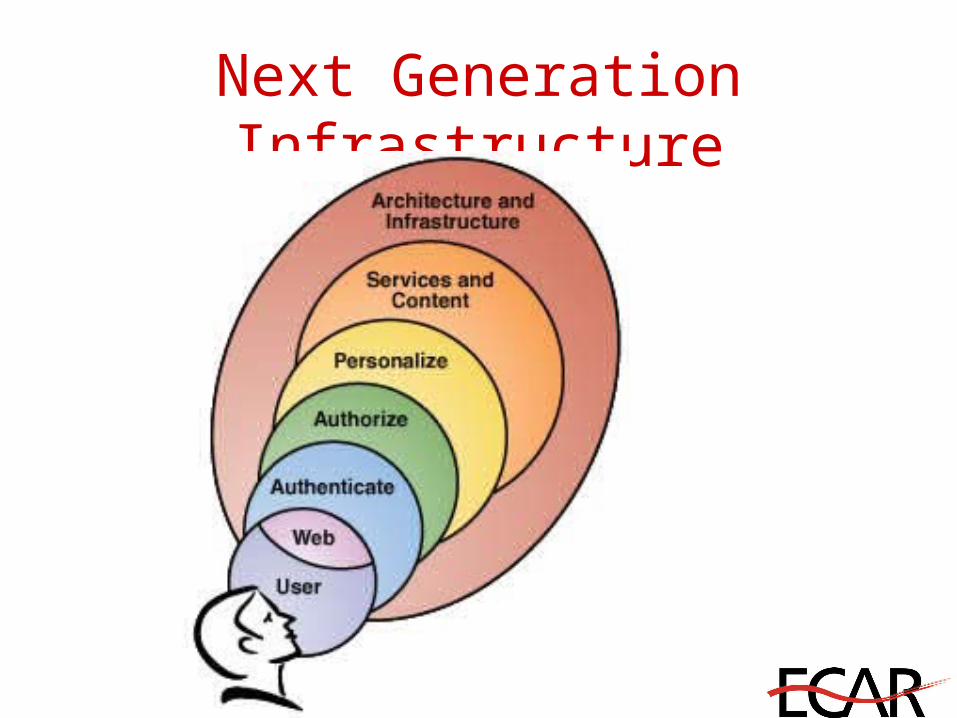
Next Generation Infrastructure
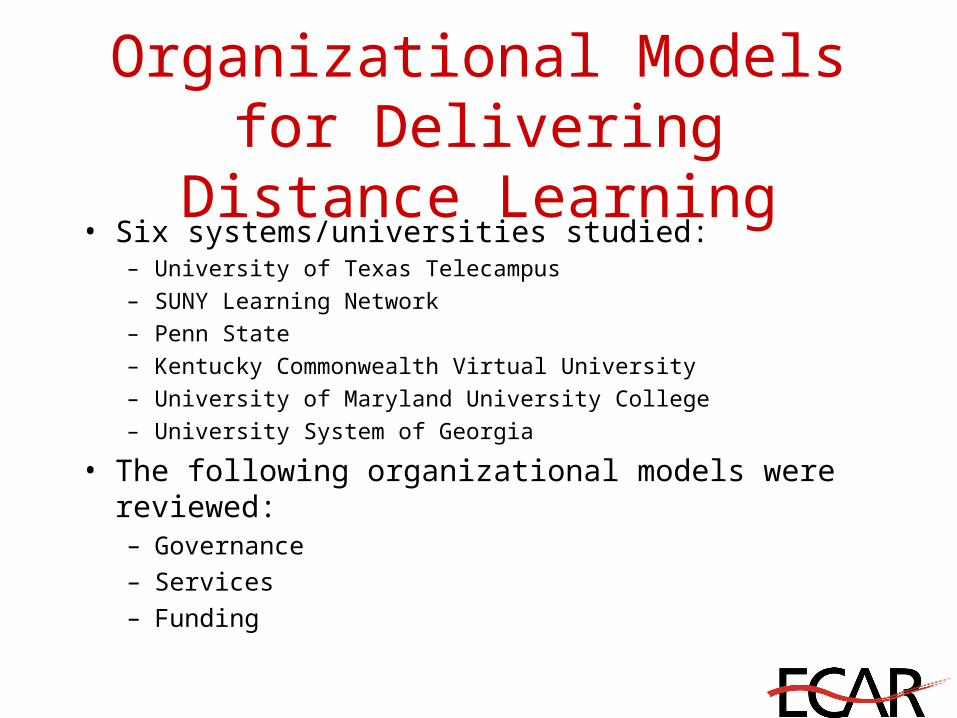
Organizational Models for Delivering Distance Learning
• Six systems/universities studied:– University of Texas Telecampus
– SUNY Learning Network
– Penn State
– Kentucky Commonwealth Virtual University
– University of Maryland University College
– University System of Georgia
• The following organizational models were reviewed:– Governance– Services– Funding
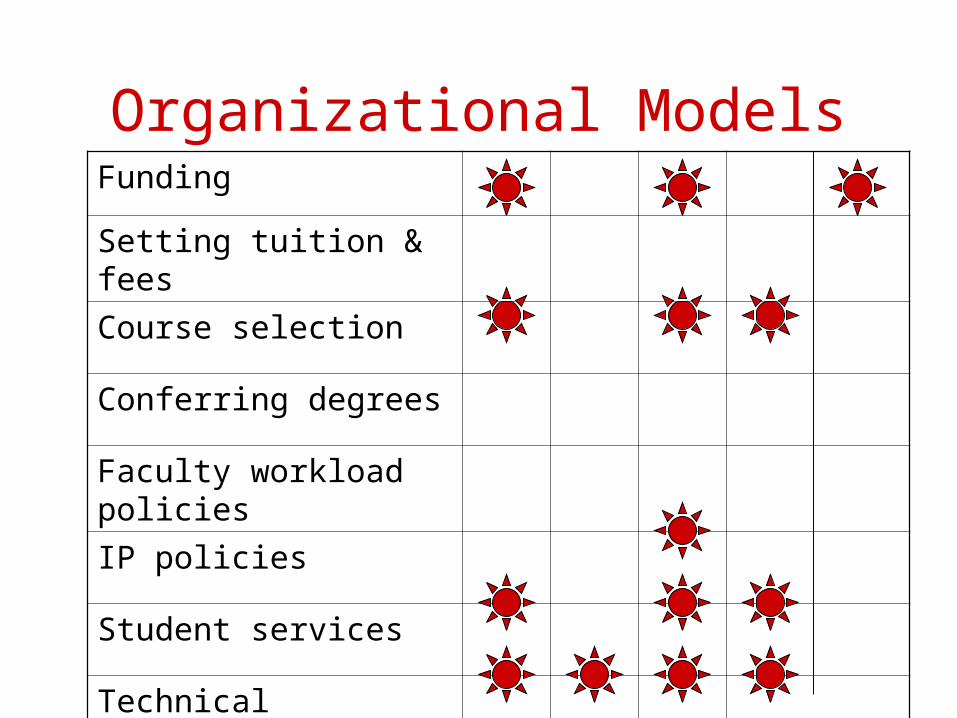
Organizational ModelsFunding
Setting tuition & fees
Course selection
Conferring degrees
Faculty workload policies
IP policies
Student services
Technical standards
Other Research Bulletins
• Framework for assessing costs of IT staff turnover
• Impact of course management systems
• Online learning communities
• Supporting learners with disabilities
• Implementation of IT strategic plans
• Records management in a digital world

Research Studies

The Outlook for ASP and IT Outsourcing in
Higher Education
The Outlook for ASP and IT Outsourcing in Higher Education
• Analyzes IT outsourcing in higher education• Issues include:
How is the IT outsourcing decision-making process organized?
What is the experience of institutions that outsource?Case Studies
• INPUT conducted research with survey of EDUCAUSE members, phone and on-site interviews
• Outsourcing market forecast - maybe
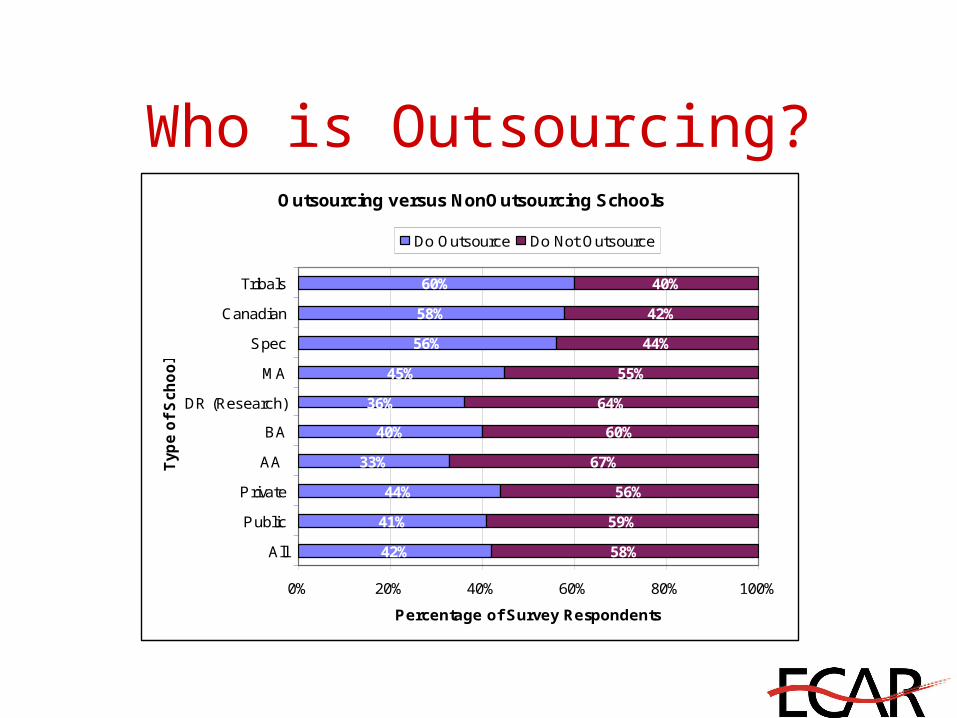
Who is Outsourcing?Outsourcing versus NonOutsourcing Schools
42%
41%
44%
33%
40%
36%
45%
56%
58%
60%
58%
59%
56%
67%
60%
64%
55%
44%
42%
40%
0% 20% 40% 60% 80% 100%
All
Public
Private
AA
BA
DR (Research)
MA
Spec
Canadian
Tribals
Typ
e o
f S
ch
oo
l
Percentage of Survey Respondents
Do Outsource Do Not Outsource
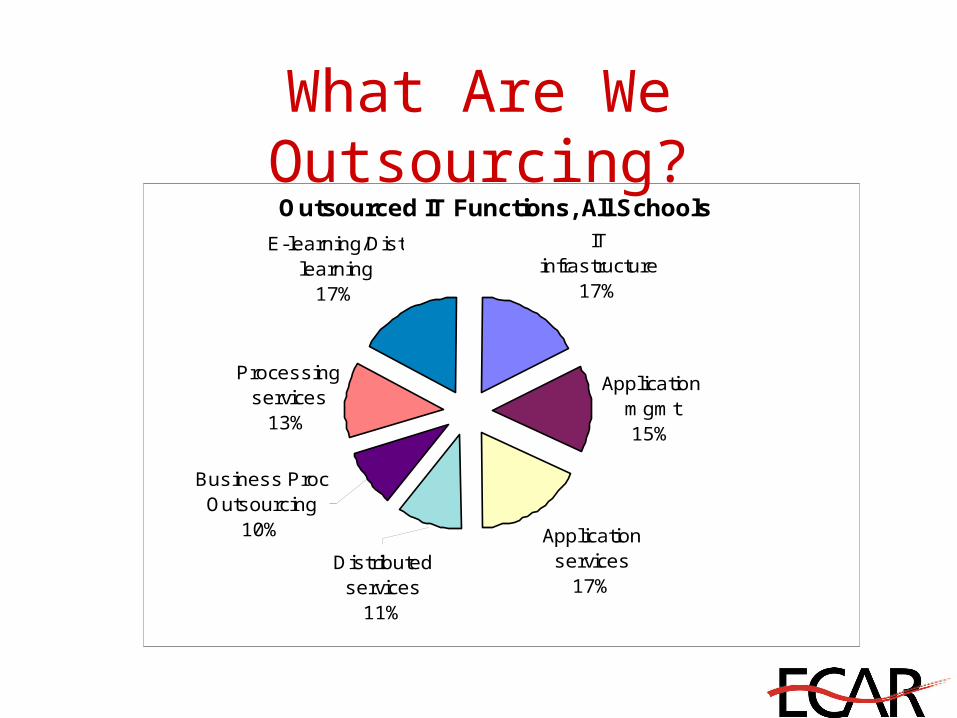
Outsourced IT Functions, All SchoolsIT
infrastructure17%
Application mgmt15%
Application services
17%
Processing services
13%
E-learning/Dist learning
17%
Distributed services
11%
Business Proc Outsourcing
10%
What Are We Outsourcing?
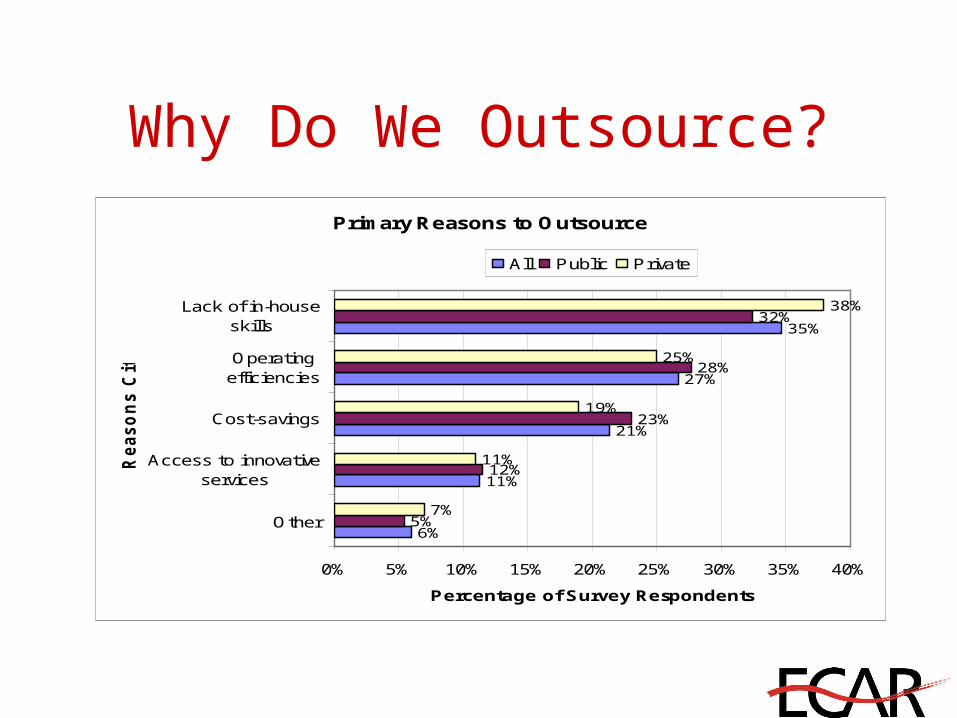
Primary Reasons to Outsource
6%
11%
21%
27%
35%
5%
12%
23%
28%
32%
7%
11%
19%
25%
38%
0% 5% 10% 15% 20% 25% 30% 35% 40%
Other
Access to innovativeservices
Cost-savings
Operatingefficiencies
Lack of in-houseskills
Reaso
ns C
ited
Percentage of Survey Respondents
All Public Private
Why Do We Outsource?
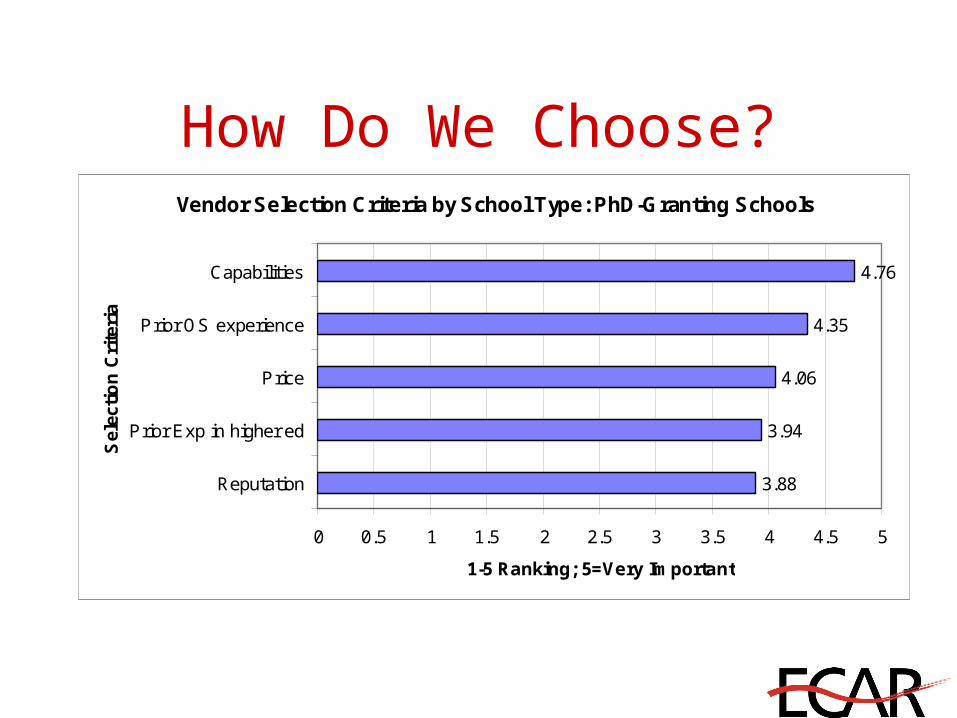
Vendor Selection Criteria by School Type: PhD-Granting Schools
3.88
3.94
4.06
4.35
4.76
0 0.5 1 1.5 2 2.5 3 3.5 4 4.5 5
Reputation
Prior Exp in higher ed
Price
Prior OS experience
Capabilities
Sel
ecti
on
Cri
teri
a
1-5 Ranking; 5=Very Important
How Do We Choose?
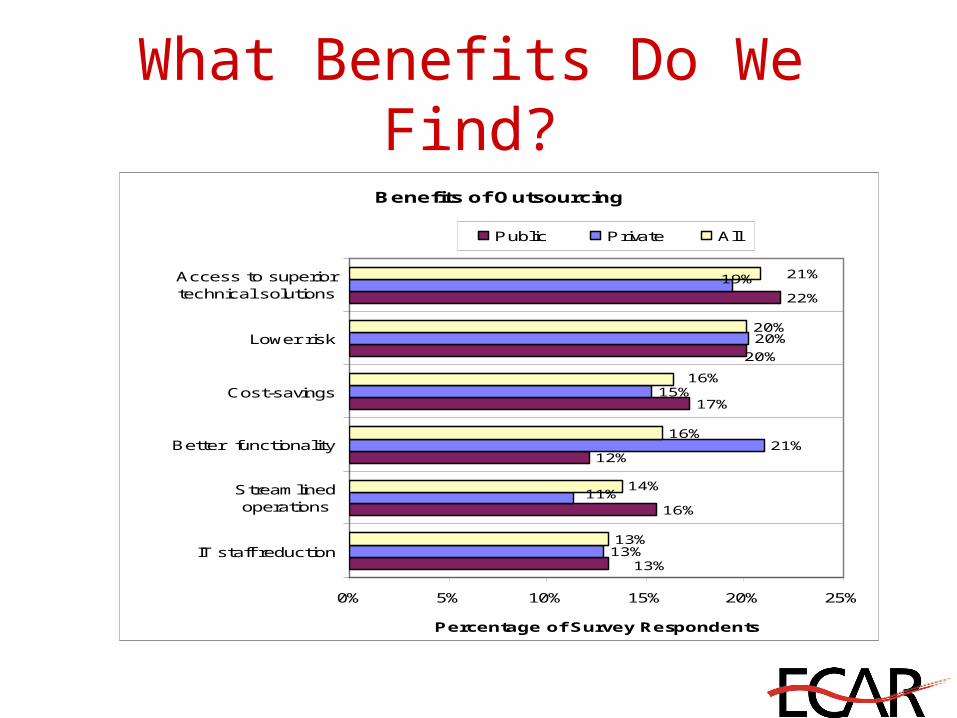
Benefits of Outsourcing
16%
12%
17%
22%
13%
21%
15%
20%
13%
16%
20%
20%
13%
11%
19% 21%
16%
14%
0% 5% 10% 15% 20% 25%
IT staff reduction
Streamlinedoperations
Better functionality
Cost-savings
Lower risk
Access to superiortechnical solutions
Percentage of Survey Respondents
Public Private All
What Benefits Do We Find?
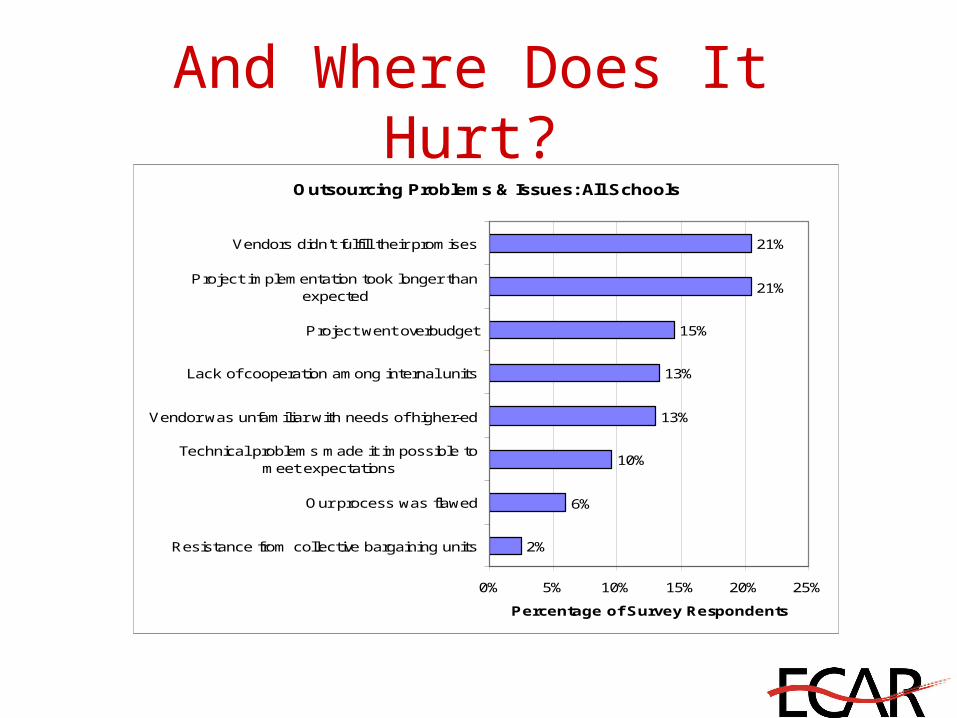
Outsourcing Problems & Issues: All Schools
2%
6%
10%
13%
13%
15%
21%
21%
0% 5% 10% 15% 20% 25%
Resistance from collective bargaining units
Our process was flawed
Technical problems made it impossible tomeet expectations
Vendor was unfamiliar with needs of higher-ed
Lack of cooperation among internal units
Project went overbudget
Project implementation took longer thanexpected
Vendors didn't fulfill their promises
Percentage of Survey Respondents
And Where Does It Hurt?
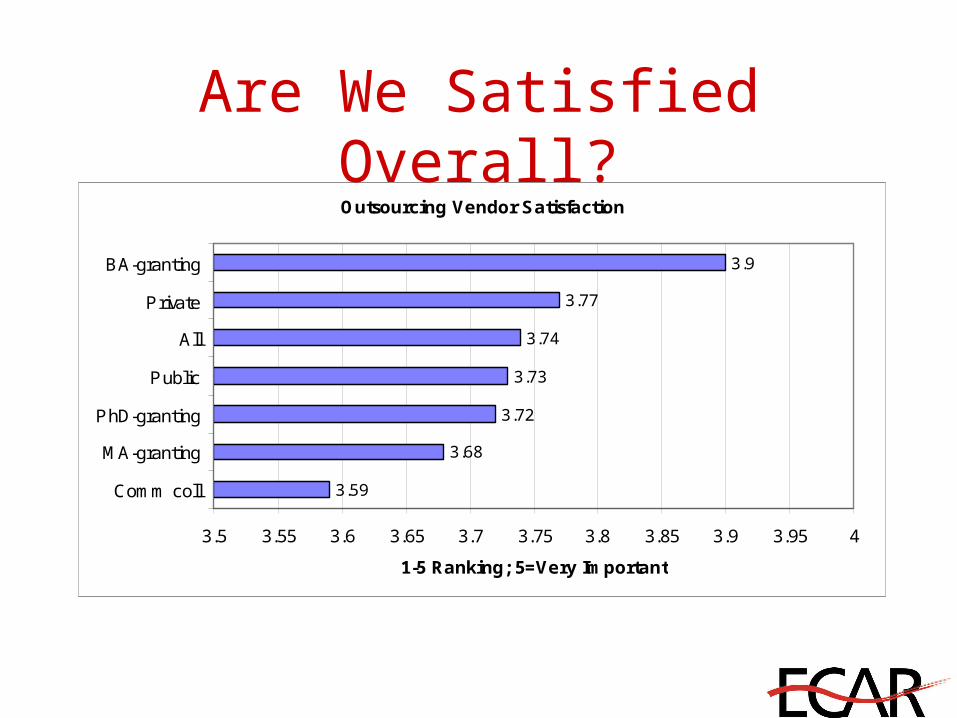
Outsourcing Vendor Satisfaction
3.59
3.68
3.72
3.73
3.74
3.77
3.9
3.5 3.55 3.6 3.65 3.7 3.75 3.8 3.85 3.9 3.95 4
Comm coll
MA-granting
PhD-granting
Public
All
Private
BA-granting
1-5 Ranking; 5=Very Important
Are We Satisfied Overall?
Trends in Wireless Communication
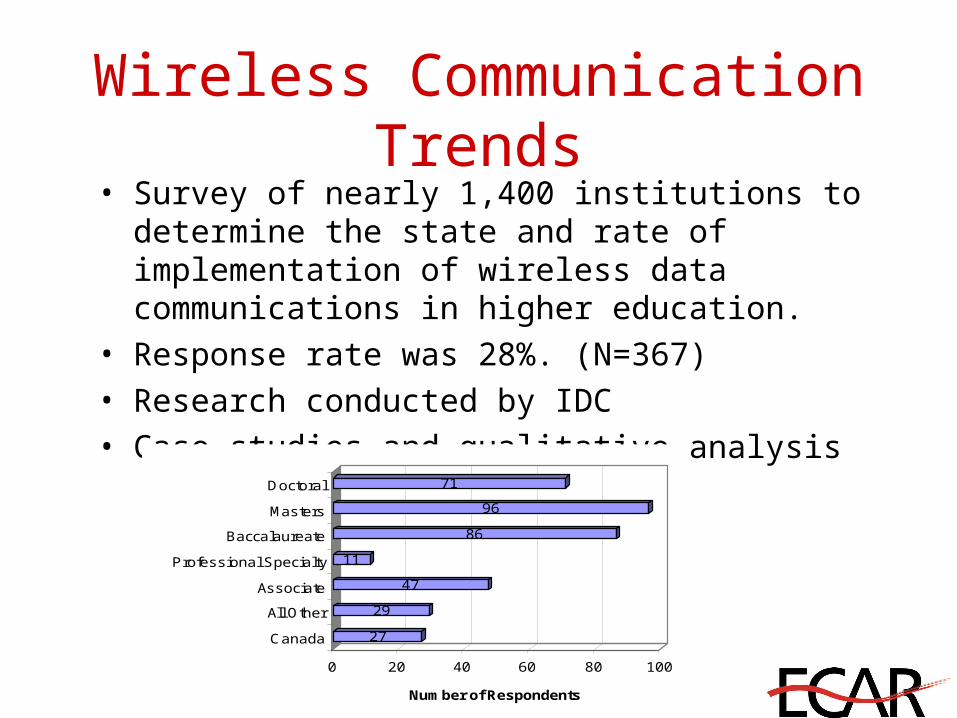
Wireless Communication Trends• Survey of nearly 1,400 institutions to determine the
state and rate of implementation of wireless data communications in higher education.
• Response rate was 28%. (N=367)• Research conducted by IDC• Case studies and qualitative analysis
27
29
47
11
86
96
71
0 20 40 60 80 100
Number of Respondents
Doctoral
Masters
Baccalaureate
Professional Specialty
Associate
All Other
Canada
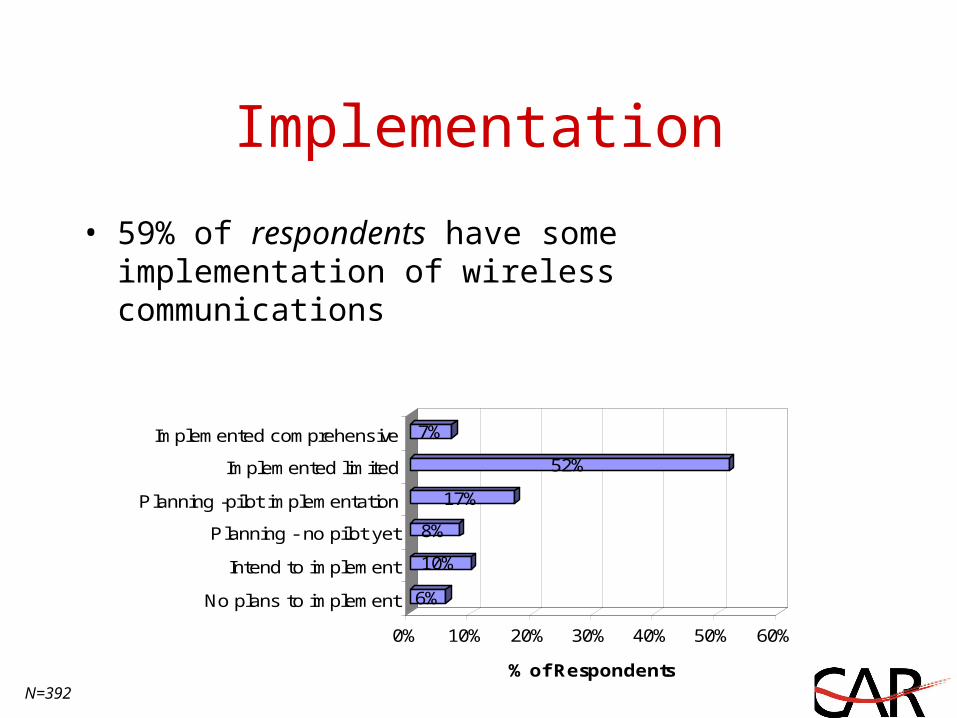
Implementation
• 59% of respondents have some implementation of wireless communications
6%
10%
8%
17%
52%
7%
0% 10% 20% 30% 40% 50% 60%
% of Respondents
Implemented comprehensive
Implemented limited
Planning -pilot implementation
Planning - no pilot yet
Intend to implement
No plans to implement
N=392
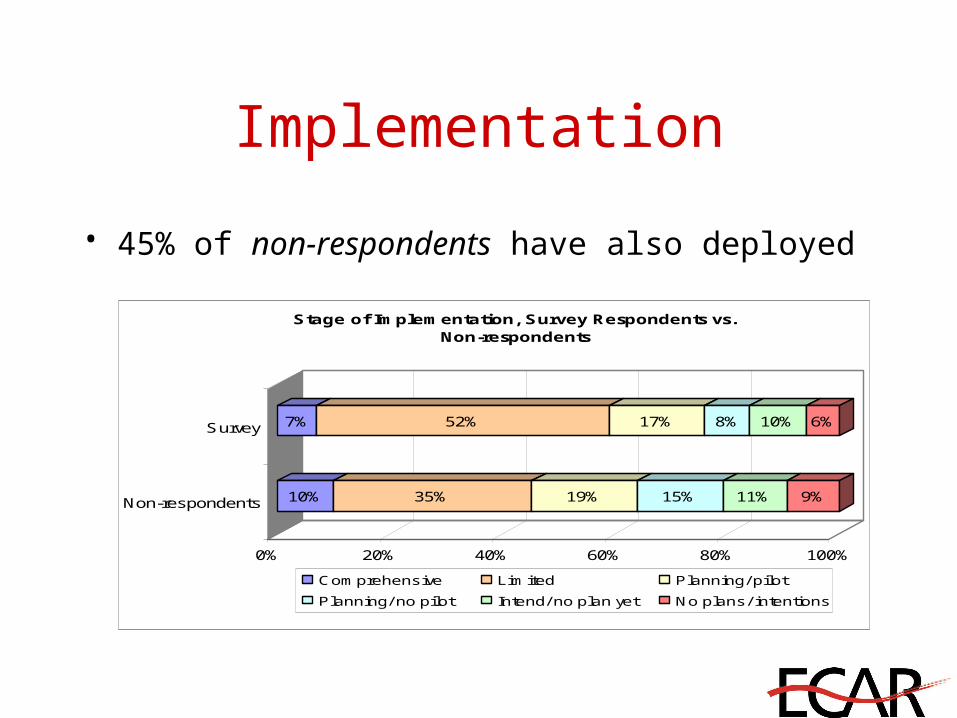
Implementation
• 45% of non-respondents have also deployed
10% 35% 19% 15% 11% 9%
7% 52% 17% 8% 10% 6%
0% 20% 40% 60% 80% 100%
Non-respondents
Survey
Stage of Implementation, Survey Respondents vs.Non-respondents
Comprehensive Limited Planning/ pilot
Planning/ no pilot Intend/ no plan yet No plans/ intentions
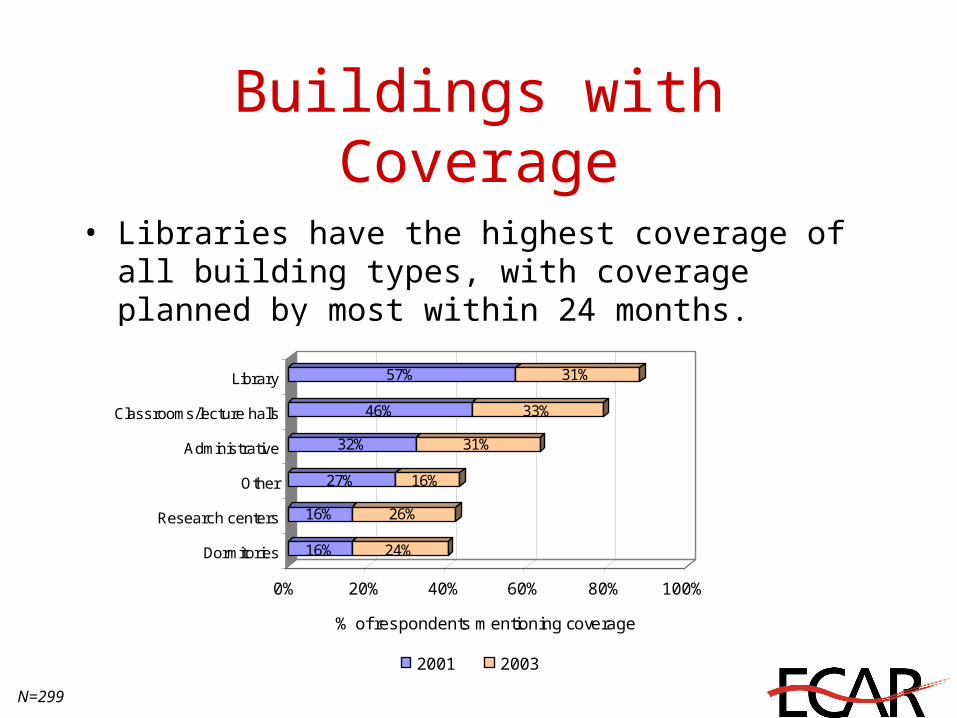
Buildings with Coverage
• Libraries have the highest coverage of all building types, with coverage planned by most within 24 months.
16% 24%
16% 26%
27% 16%
32% 31%
46% 33%
57% 31%
0% 20% 40% 60% 80% 100%
% of respondents mentioning coverage
Dormitories
Research centers
Other
Administrative
Classrooms/lecture halls
Library
2001 2003
N=299
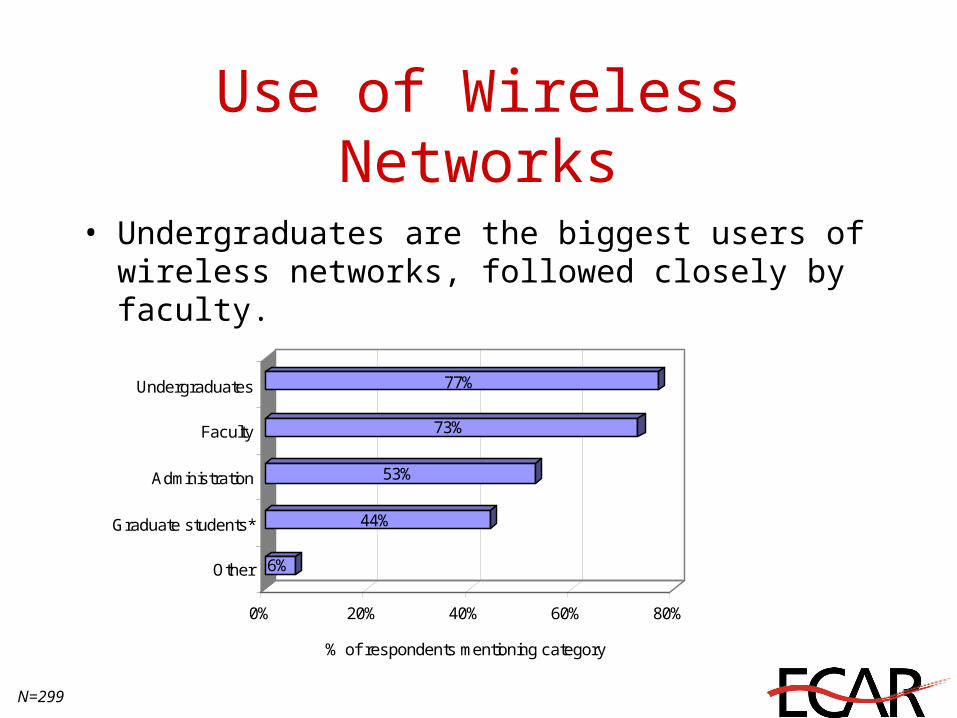
Use of Wireless Networks
• Undergraduates are the biggest users of wireless networks, followed closely by faculty.
6%
44%
53%
73%
77%
0% 20% 40% 60% 80%
% of respondents mentioning category
Undergraduates
Faculty
Administration
Graduate students*
Other
N=299
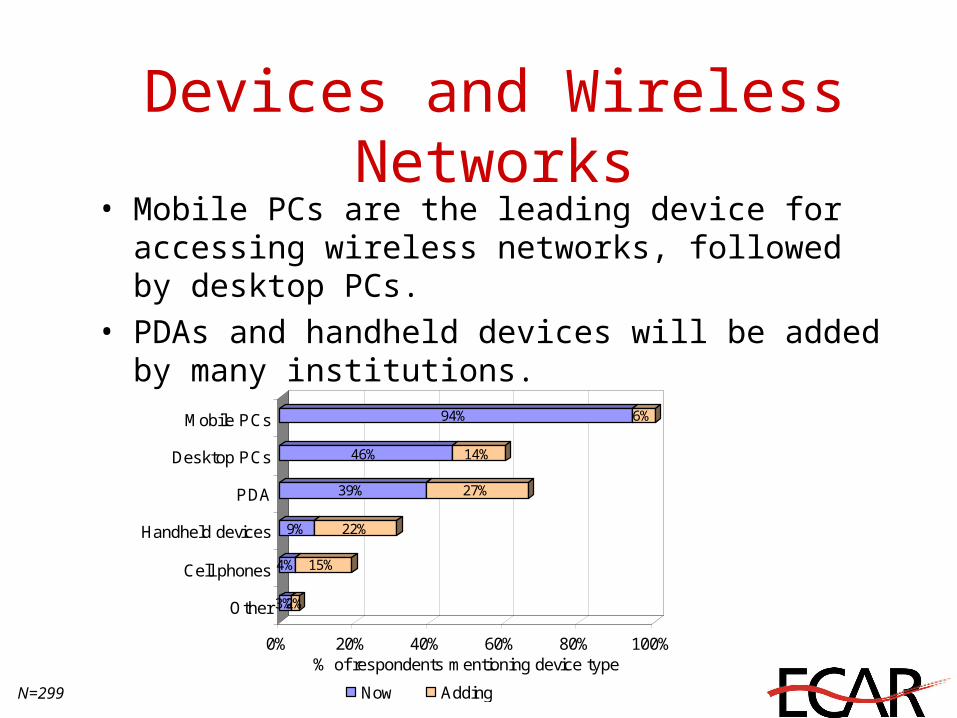
Devices and Wireless Networks• Mobile PCs are the leading device for accessing
wireless networks, followed by desktop PCs.• PDAs and handheld devices will be added by many
institutions.
3%2%
4% 15%
9% 22%
39% 27%
46% 14%
94% 6%
0% 20% 40% 60% 80% 100%% of respondents mentioning device type
Mobile PCs
Desktop PCs
PDA
Handheld devices
Cell phones
Other
Now AddingN=299
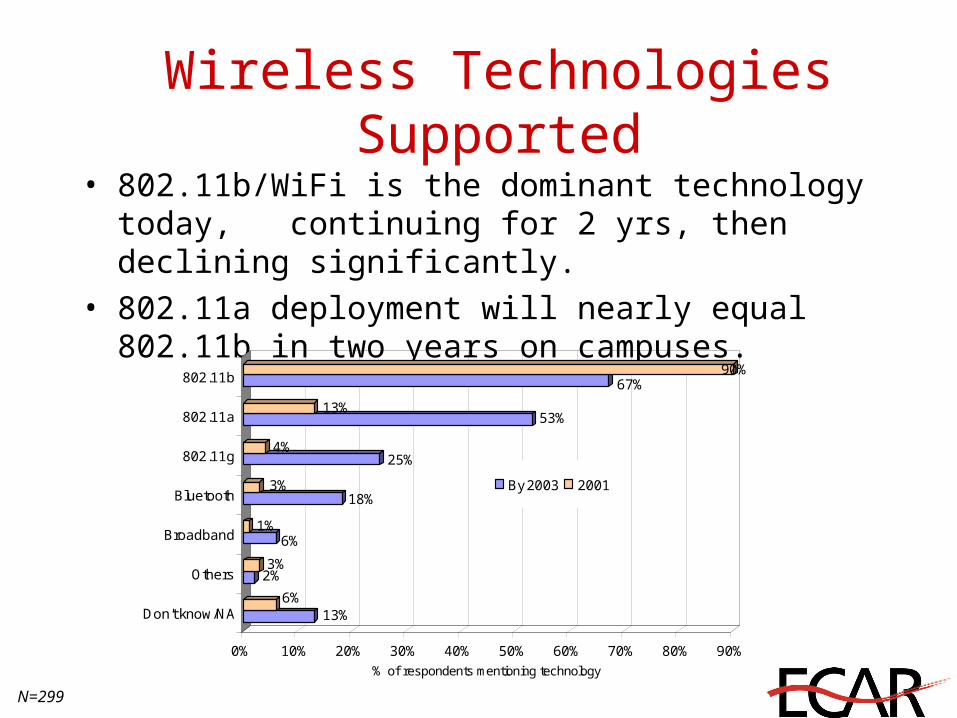
Wireless Technologies Supported• 802.11b/WiFi is the dominant technology today,
continuing for 2 yrs, then declining significantly. • 802.11a deployment will nearly equal 802.11b in two
years on campuses.
13%6%
2%3%
6%1%
18%3%
25%4%
53%13%
67%90%
0% 10% 20% 30% 40% 50% 60% 70% 80% 90%
% of respondents mentioning technology
802.11b
802.11a
802.11g
Bluetooth
Broadband
Others
Don't know/NA
By 2003 2001
N=299
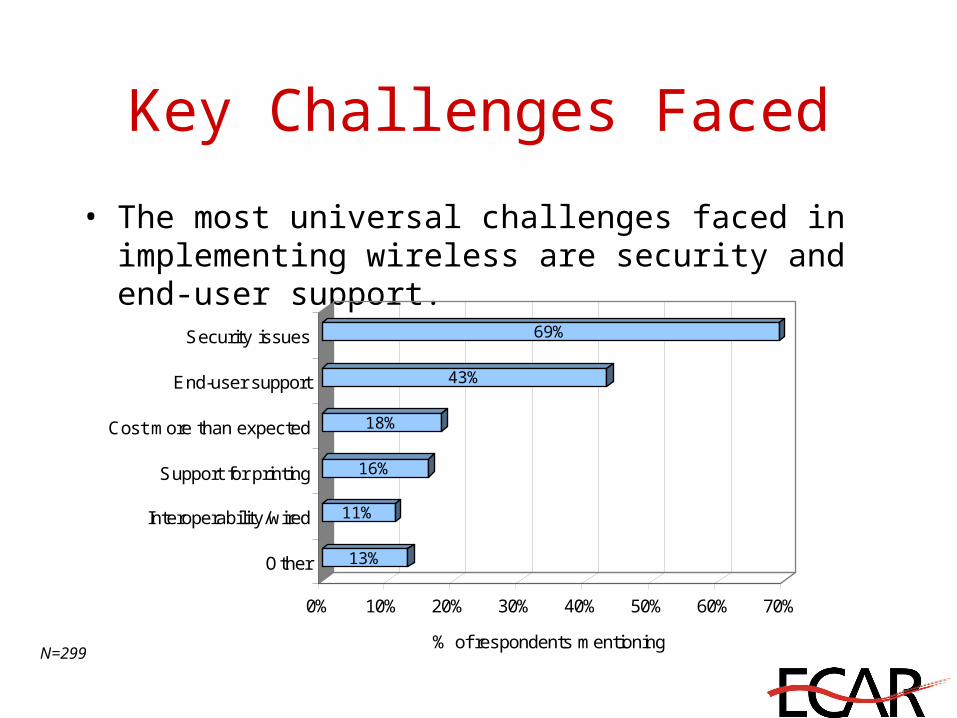
Key Challenges Faced
• The most universal challenges faced in implementing wireless are security and end-user support.
13%
11%
16%
18%
43%
69%
0% 10% 20% 30% 40% 50% 60% 70%
% of respondents mentioning
Security issues
End-user support
Cost more than expected
Support for printing
Interoperability/wired
Other
N=299
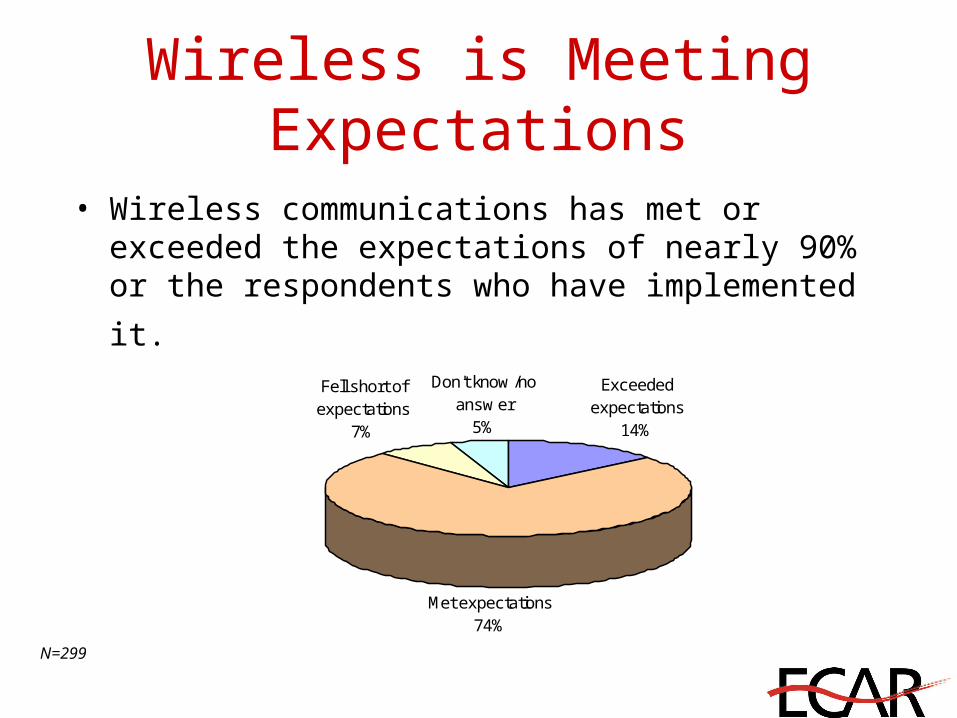
Wireless is Meeting Expectations
• Wireless communications has met or exceeded the expectations of nearly 90% or the respondents who
have implemented it.
Exceeded expectations
14%
Met expectations74%
Fell short of expectations
7%
Don't know /no answ er
5%
N=299
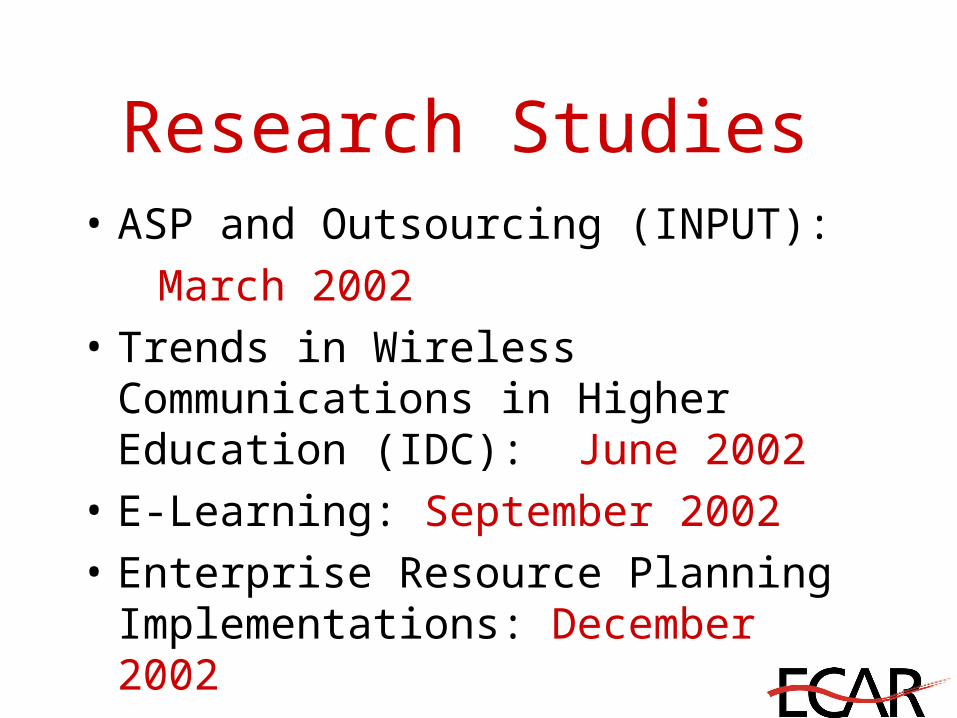
Research Studies • ASP and Outsourcing (INPUT):
March 2002
• Trends in Wireless Communications in Higher Education (IDC): June 2002
• E-Learning: September 2002
• Enterprise Resource Planning Implementations: December 2002
EDUCAUSE Center for Applied Research
www.educause.edu/ecar/
Recommended