Efficiency Investigation of LineStart Synchronous Reluctance MotorsMotor Simulation and Testing with Respectto Induction Machine for Industrial Application
Master’s thesis in Electric Power Engineering
Anton Kersten
Department of Energy and EnvironmentCHALMERS UNIVERSITY OF TECHNOLOGYGothenburg, Sweden 2017

Master’s thesis 2017
Efficiency Investigation of Line Start SynchronousReluctance Motors
Motor Simulation and Testing with Respectto Induction Machine for Industrial Application
Anton Kersten
Department of Energy and EnvironmentDivision of Electric Power Engineering
Chalmers University of TechnologyGothenburg, Sweden 2017
Efficiency Investigation of LineStart Synchronous Reluctance MotorsMotor Simulation and Testing with Respectto Induction Machine for Industrial ApplicationAnton Kersten
© Anton Kersten, 2017.
Supervisor: M.Sc. Daniel Pehrman, Department of Energy and EnvironmentExaminer: Professor Dr. Yujing Liu, Department of Energy and Environment
Master’s Thesis 2017Department of Energy and EnvironmentDivision of Electric Power EngineeringChalmers University of TechnologySE-412 96 GothenburgTelephone +46 31 772 1000
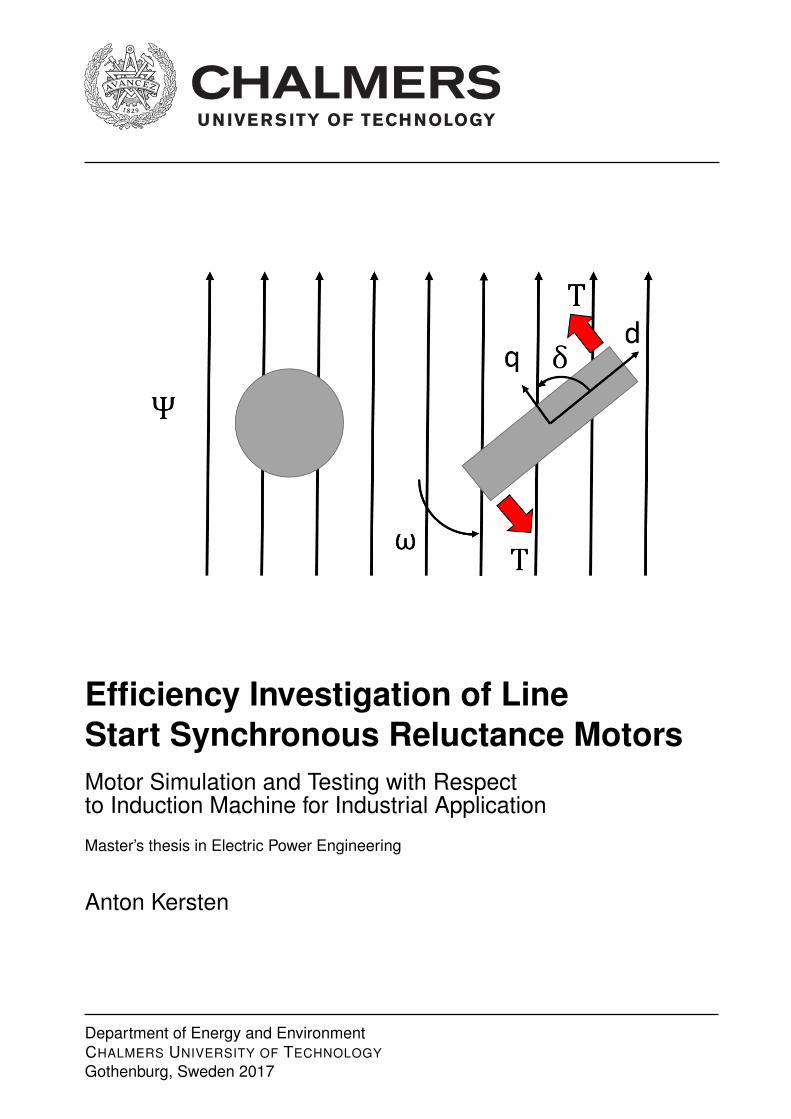
Cover: Illustration of the reluctance torque acting on an anisotropic shaped ironobject within a magnetic field, while the isotropic object keeps being unaffected.
iv
Efficiency Investigation of LineStart Synchronous Reluctance MotorsMotor Simulation and Testing with Respectto Induction Machine for Industrial ApplicationAnton KerstenDepartment of Energy and EnvironmentChalmers University of Technology
AbstractThe need to constrain global warming demands new sustainable and green technolo-gies. Line start synchronous reluctance machine technologies offer a big potentialfor future energy savings in industrial applications. Within this thesis the efficiencyand starting capability of a novel line start synchronous reluctance machine in com-parison to a common induction machine is analysed. For this purpose a simulationmodel and a test bench setup were used. With this new motor design a measuredefficiency enhancement at rated load from 89.3 % up to 92.0 % was achieved, corre-sponding to a loss reduction of about 27.6 %. For the chosen 4 kW four pole motorthe efficiency rating was improved from IE3 to IE4. Nevertheless a drawback is thelow synchronization capability, which limits the range of possible industry applica-tions.
Keywords: synchronous reluctance motor, line start, direct on-line, induction ma-chine, synchronization capability, efficiency enhancement.
v


AcknowledgementsFirst of all I would like to thank my examiner Professor Dr. Yujing Liu for hisguidance and support within this project and as my teacher. Additionally I wouldlike to thank my supervisor Daniel Pehrman for his assistance and support, whichmade this thesis a great success. Further I would like to express sincere gratitudeto Chalmers University of Technology, especially the staff of the division of ElectricPower Engineering, who helped me always with proper advice and supported me onmy career trajectory.
Anton Kersten, Gothenburg, May 2017
vii

Contents
List of Figures xi
List of Tables xiii
Nomenclature xv
1 Introduction 11.1 Background . . . . . . . . . . . . . . . . . . . . . . . . . . . . . . . . 11.2 Efficiency Classes and Regulations . . . . . . . . . . . . . . . . . . . . 11.3 Feasibility Study . . . . . . . . . . . . . . . . . . . . . . . . . . . . . 21.4 Aim . . . . . . . . . . . . . . . . . . . . . . . . . . . . . . . . . . . . 31.5 Problem Description . . . . . . . . . . . . . . . . . . . . . . . . . . . 31.6 Thesis Structure . . . . . . . . . . . . . . . . . . . . . . . . . . . . . . 3
2 Synchronous Reluctance Motor Theory 52.1 Basic Reluctance Concept . . . . . . . . . . . . . . . . . . . . . . . . 52.2 Synchronous Reluctance Machine . . . . . . . . . . . . . . . . . . . . 82.3 Line Start Synchronous Reluctance Machine . . . . . . . . . . . . . . 132.4 Synchronization Process . . . . . . . . . . . . . . . . . . . . . . . . . 17
3 Line Start Machine Design 19
4 Simulation Model and Test Setup 234.1 Simulation Model . . . . . . . . . . . . . . . . . . . . . . . . . . . . . 23
4.1.1 Solver Setting . . . . . . . . . . . . . . . . . . . . . . . . . . . 234.1.2 Meshing . . . . . . . . . . . . . . . . . . . . . . . . . . . . . . 234.1.3 Efficiency and Power Factor Calculation . . . . . . . . . . . . 24
4.2 Test Setup . . . . . . . . . . . . . . . . . . . . . . . . . . . . . . . . . 264.2.1 Testbench . . . . . . . . . . . . . . . . . . . . . . . . . . . . . 274.2.2 Measurements and Control . . . . . . . . . . . . . . . . . . . . 284.2.3 Implementation in LabView . . . . . . . . . . . . . . . . . . . 304.2.4 Efficiency and Power Factor Calculation . . . . . . . . . . . . 31
5 Measurement and Simulation Results 335.1 Test Bench and Setup Parameters . . . . . . . . . . . . . . . . . . . . 335.2 Steady State Temperature . . . . . . . . . . . . . . . . . . . . . . . . 345.3 Efficiency and Power Factor . . . . . . . . . . . . . . . . . . . . . . . 36
ix

Contents
5.4 Inertia . . . . . . . . . . . . . . . . . . . . . . . . . . . . . . . . . . . 385.5 Synchronization Capability . . . . . . . . . . . . . . . . . . . . . . . . 40
5.5.1 Start Capability - IM . . . . . . . . . . . . . . . . . . . . . . . 405.5.2 Synchronization Capability - LS-SynRM . . . . . . . . . . . . 41
6 Conclusion 45
7 Discussion and Future Work 477.1 Sustainability and Ethical Aspects . . . . . . . . . . . . . . . . . . . 47
7.1.1 Rare Earth Materials . . . . . . . . . . . . . . . . . . . . . . . 48
Bibliography 49
x

List of Figures
1.1 Efficiency classes in dependance of motor rating. . . . . . . . . . . . . 2
2.1 Illustration of the reluctance torque acting on an anisotropic shapediron object within a magnetic field, while the isotropic object keepsbeing unaffected. . . . . . . . . . . . . . . . . . . . . . . . . . . . . . 5
2.2 Flux density and magnetic field distribution for a round shaped ironobject when placed within a magnetic field for different orientations. 6
2.3 Flux density and magnetic field distribution for a rectangular shapediron object when placed within a magnetic field for different orienta-tions. . . . . . . . . . . . . . . . . . . . . . . . . . . . . . . . . . . . 6
2.4 Inductance(a) and torque(b) for the two iron shapes with respect tothe displacement angle δ. . . . . . . . . . . . . . . . . . . . . . . . . 7
2.5 Example of a four pole synchronous reluctance rotor with emphasizedd- and q-axis . . . . . . . . . . . . . . . . . . . . . . . . . . . . . . . . 9
2.6 Equivalent circuit of the SynRM in dq-components without iron losses.. . . . . . . . . . . . . . . . . . . . . . . . . . . . . . . . . . . . . . . 10
2.7 Phasor diagram of the SynRM. . . . . . . . . . . . . . . . . . . . . . 112.8 Reluctance torque in p.u. for different stator resistances in p.u.. . . . 122.9 Equivalent circuit of the line start SynRM in dq-components. . . . . 132.10 Cage torque of LS-SynRM for different slips. . . . . . . . . . . . . . . 162.11 Starting process for different loadings resulting in a failed and a suc-
cessful synchronization . . . . . . . . . . . . . . . . . . . . . . . . . . 17
3.1 Induction (a) and synchronous reluctance(b) machine design for thefour pole motor with 4 kW rated output power. . . . . . . . . . . . . 20
3.2 Rotor shape with barrier cut-offs. . . . . . . . . . . . . . . . . . . . 213.3 Line start SynRM rotors with aluminium(left) and copper(right) cage. 21
4.1 Mesh of the IM(a) and line start SynRM(b). . . . . . . . . . . . . . . 244.2 Schematic diagram of test setup indlucding test motor M1 and DC
machine M2. . . . . . . . . . . . . . . . . . . . . . . . . . . . . . . . . 264.3 Motor test bench including test and load motor. . . . . . . . . . . . . 274.4 Motor test bench with reduced inertia. . . . . . . . . . . . . . . . . . 274.5 Placement and fixture of the temperature sensors in the end winding
region. . . . . . . . . . . . . . . . . . . . . . . . . . . . . . . . . . . . 284.6 Test setup including both motors and torque sensor. . . . . . . . . . . 294.7 Connection desk of the electrical setup. . . . . . . . . . . . . . . . . . 29
xi
List of Figures
4.8 Control desk of the test setup. . . . . . . . . . . . . . . . . . . . . . . 304.9 Schematic diagram of implemented LabView program. . . . . . . . . 31
5.1 Stator winding temperature rise for the three test machines whenrunning on rated load. . . . . . . . . . . . . . . . . . . . . . . . . . . 34
5.2 Mean stator winding temperature for different loadings measured andapproximated. . . . . . . . . . . . . . . . . . . . . . . . . . . . . . . 35
5.3 Efficiency simulation and measurement results for all three machinesfor different loadings. . . . . . . . . . . . . . . . . . . . . . . . . . . . 36
5.4 Power factor simulation and measurement results for all three ma-chines for different loadings. . . . . . . . . . . . . . . . . . . . . . . . 37
5.5 Current(a) and Speed(b) for the different setups with respect to thedisplacement angle δ. . . . . . . . . . . . . . . . . . . . . . . . . . . 38
5.6 Speed(a) and torque(b) during the start up of the IM, if rated loadis applied. . . . . . . . . . . . . . . . . . . . . . . . . . . . . . . . . . 40
5.7 Reluctance torque at steady state(a) and cage torque at different slipspeeds(b) . . . . . . . . . . . . . . . . . . . . . . . . . . . . . . . . . . 41
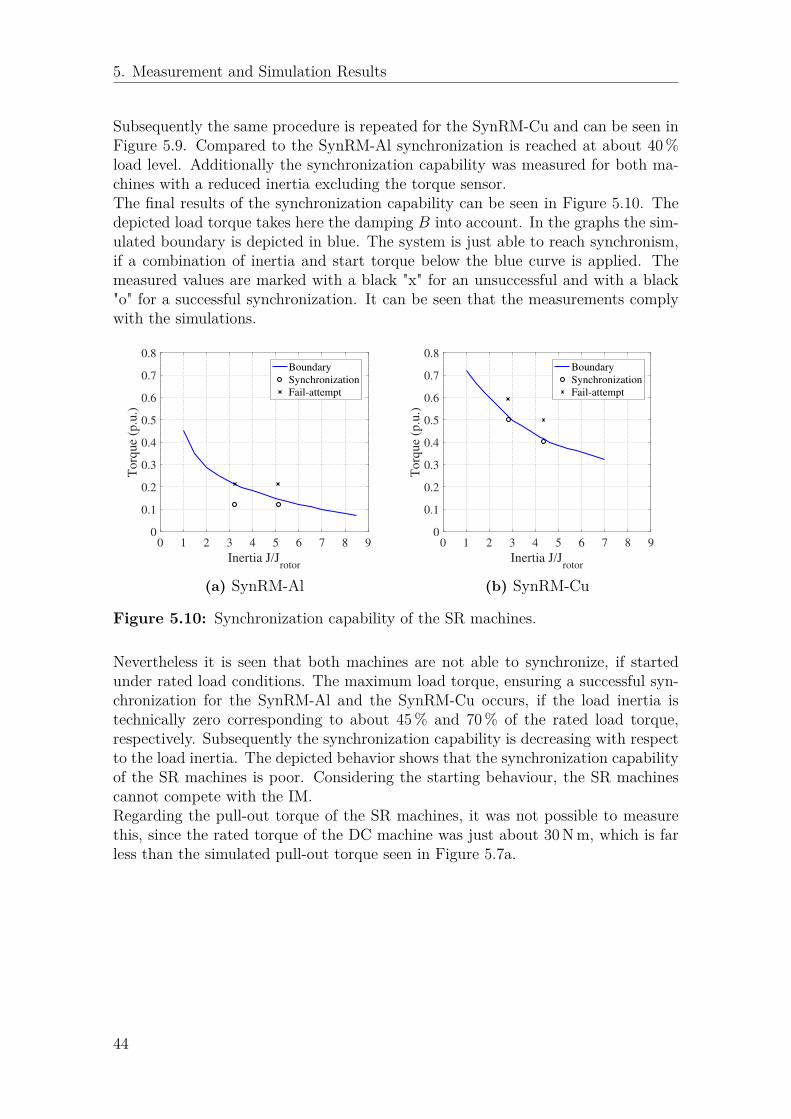
5.8 Synchronization capability measurement for the SynRM-Al. . . . . . 425.9 Synchronization capability measurement for the SynRM-Cu. . . . . . 435.10 Synchronization capability of the SR machines. . . . . . . . . . . . . 44
xii

List of Tables
5.1 Viscous damping constant B . . . . . . . . . . . . . . . . . . . . . . . 335.2 Motor efficiency for different loading. . . . . . . . . . . . . . . . . . . 365.3 Motor power factor for different loading. . . . . . . . . . . . . . . . . 375.4 System inertia with torque sensor. . . . . . . . . . . . . . . . . . . . . 395.5 System inertia without torque sensor. . . . . . . . . . . . . . . . . . . 395.6 Inertia of the machines’ rotors. . . . . . . . . . . . . . . . . . . . . . . 39
xiii

List of Tables
xiv
Nomenclature
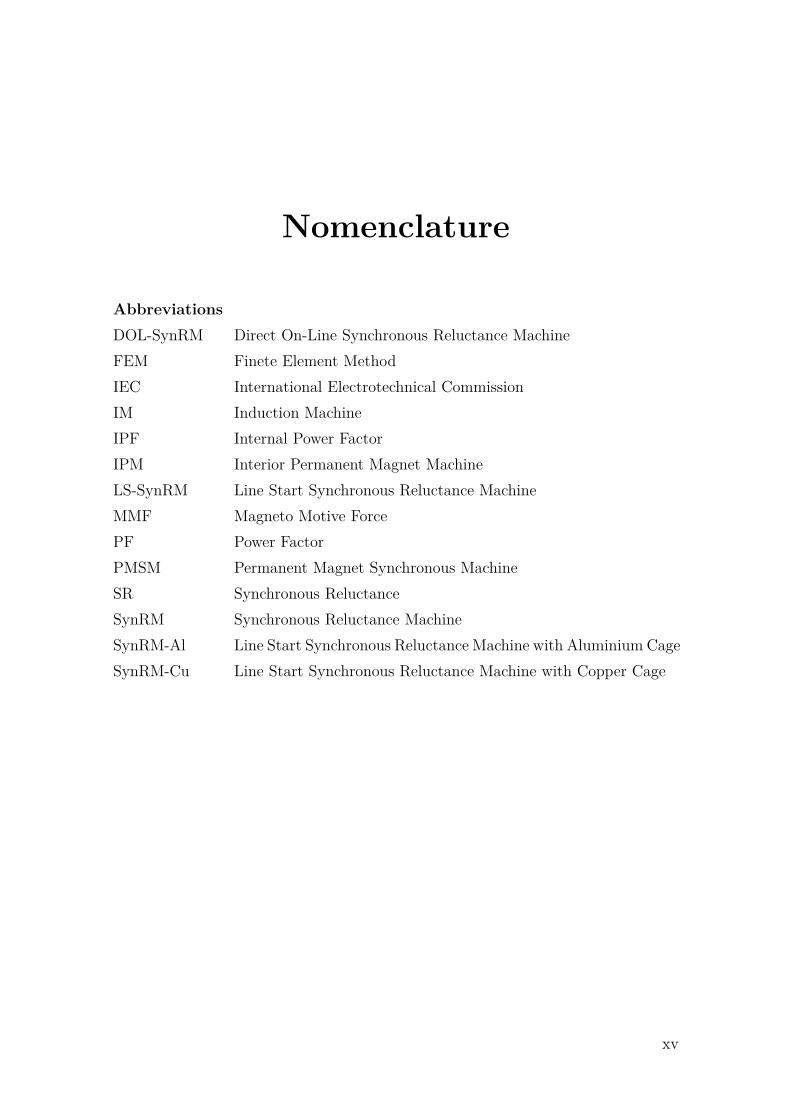
AbbreviationsDOL-SynRM Direct On-Line Synchronous Reluctance MachineFEM Finete Element MethodIEC International Electrotechnical CommissionIM Induction MachineIPF Internal Power FactorIPM Interior Permanent Magnet MachineLS-SynRM Line Start Synchronous Reluctance MachineMMF Magneto Motive ForcePF Power FactorPMSM Permanent Magnet Synchronous MachineSR Synchronous ReluctanceSynRM Synchronous Reluctance MachineSynRM-Al Line Start Synchronous Reluctance Machine with Aluminium CageSynRM-Cu Line Start Synchronous Reluctance Machine with Copper Cage
xv

Nomenclature
xvi

1Introduction
1.1 BackgroundTo reduce exhaust fumes like CO2 emissions and constrain global warming, naturalresources need to be used conscientiously and thoughtfully [1]. The worldwide energyconsumption of electrical motors corresponds to about 40 % of the entire electricalenergy production, while the average efficiency is about 88 % [2]. Increasing theefficiency of the used motors would lead to a decreased energy consumption andfollowing to less emissions. The most used motor type within the field of industryapplications is the induction machine. Its direct start ability makes it possible torun without an inverter. Furthermore the IM has a high robustness, whereby it cancope with sudden load changes easily. A common approach to improve the efficiencyof an induction machine is an increased dimensioning to reduce ohmic losses inthe stator windings and rotor bars. By this approach the machine often becomeslarge and bulky. Another opportunity to achieve a higher efficiency for the samedimensions, without using permanent magnets, could be a change using a differentmotor technology like a synchronous reluctance machine. Therefore a replacement ofthe IM’s rotor by a synchronous reluctance rotor, which is additionally equipped witha squirrel cage, was proposed in a previous study project. Thereby the machine iscapable to be started directly connected to the grid, rotor losses are decreased whenreaching synchronous speed and following the steady state efficiency is improved.This type of machine is often referenced as line start or direct on line synchronousreluctance machine, abbreviated DOL-SynRM or LS-SynRM, respectively.
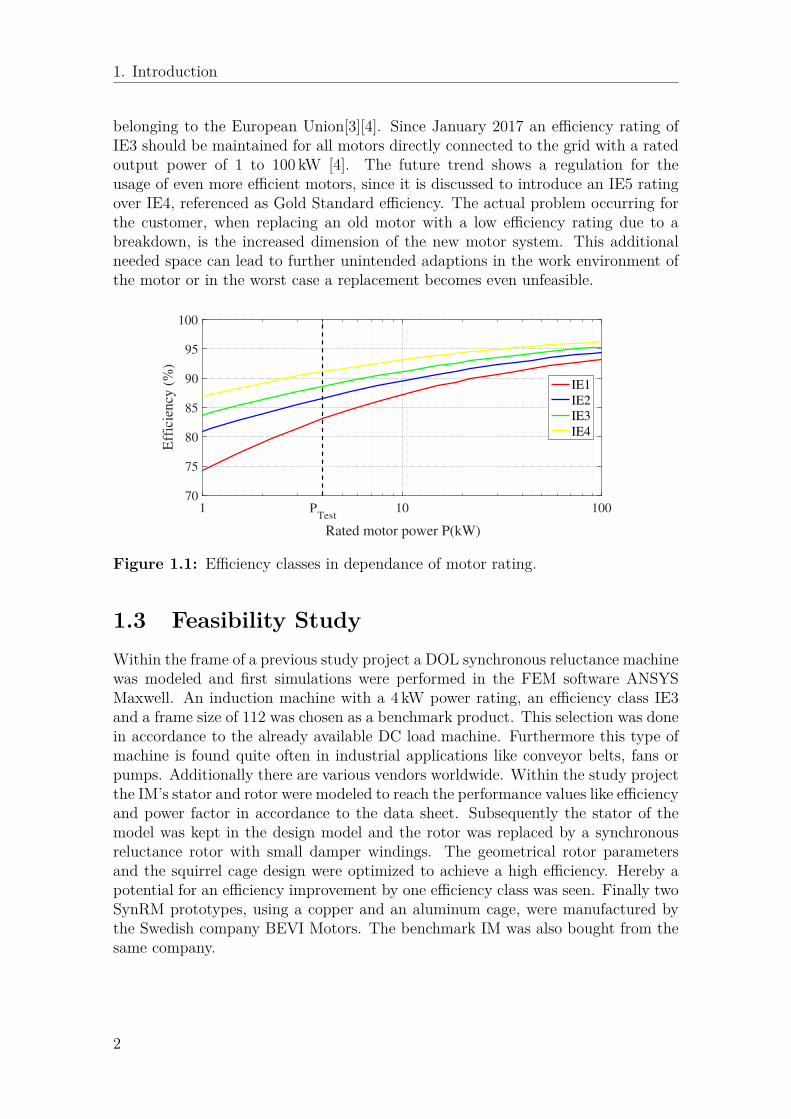
1.2 Efficiency Classes and RegulationsAs a common interest of society the usage of more efficient motors for industryapplications is regulated in many countries. Therefor motors are categorized intodifferent efficiency classes. For example the IEC standard 60034-30-1 is a measurethat classifies motors from IE1 to IE4, referred as classes Standard Efficiency toSuper Premium Efficiency, respectively. Figure 1.1 depicts the efficiency class ratingsfor different rated motor output power. Within the frame of this thesis work arated motor output power of 4 kW is considered, emphasized in the graphic bya dashed line. Referring to this IEC standard, the European Parliament tries toregulate the use of efficient electrical motors in industrial environments to reducethe electrical energy consumption. Thus the directive 640/2009 and the supplement04/2014 describe the energy usage and efficiency class regulation within the countries
1
1. Introduction
belonging to the European Union[3][4]. Since January 2017 an efficiency rating ofIE3 should be maintained for all motors directly connected to the grid with a ratedoutput power of 1 to 100 kW [4]. The future trend shows a regulation for theusage of even more efficient motors, since it is discussed to introduce an IE5 ratingover IE4, referenced as Gold Standard efficiency. The actual problem occurring forthe customer, when replacing an old motor with a low efficiency rating due to abreakdown, is the increased dimension of the new motor system. This additionalneeded space can lead to further unintended adaptions in the work environment ofthe motor or in the worst case a replacement becomes even unfeasible.
1 PTest
10 100
Rated motor power P(kW)
70
75
80
85
90
95
100
Eff
icie
ncy
(%
)
IE1
IE2
IE3
IE4
Figure 1.1: Efficiency classes in dependance of motor rating.
1.3 Feasibility StudyWithin the frame of a previous study project a DOL synchronous reluctance machinewas modeled and first simulations were performed in the FEM software ANSYSMaxwell. An induction machine with a 4 kW power rating, an efficiency class IE3and a frame size of 112 was chosen as a benchmark product. This selection was donein accordance to the already available DC load machine. Furthermore this type ofmachine is found quite often in industrial applications like conveyor belts, fans orpumps. Additionally there are various vendors worldwide. Within the study projectthe IM’s stator and rotor were modeled to reach the performance values like efficiencyand power factor in accordance to the data sheet. Subsequently the stator of themodel was kept in the design model and the rotor was replaced by a synchronousreluctance rotor with small damper windings. The geometrical rotor parametersand the squirrel cage design were optimized to achieve a high efficiency. Hereby apotential for an efficiency improvement by one efficiency class was seen. Finally twoSynRM prototypes, using a copper and an aluminum cage, were manufactured bythe Swedish company BEVI Motors. The benchmark IM was also bought from thesame company.
2
1. Introduction
1.4 AimThe efficiency enhancement of the 4 kW DOL synchronous reluctance machine com-pared to the benchmark induction machine with similar outer stator dimensionsshould be verified. Hereby the used design and simulation model should be assessedregarding its compliance with the obtained measurements. It should be shown, if therotor adaption of the machine could result in a higher IE efficiency rating withoutchanging the outer dimensions of the machine. Furthermore the starting capabilityof the synchronous reluctance machines should be determined for different loadings.
1.5 Problem DescriptionThe efficiency values and starting capability of the motors need to be determinedusing actual measurements and simulations. Finally the results should be comparedto the simulation model to verify it.The project can be divided into the following sub tasks.
1. A reasonable test setup should be built allowing a controllable loading of thethe AC motors.
2. Load tests and simulations should be performed to determine the machines’efficiencies and starting capabilities.
3. Simulated and actual results of the synchronous reluctance and induction ma-chines should be compared and assessed critically. Hereby the simulationmodel should be verified.
The lab environment to test the motors should be set up. A DC machine shouldbe used as a controllable load for the test motors. The needed voltage, current,torque, speed and temperature sensors should be implemented and a measurementacquisition system should be programmed. Hereby the sensors should be chosen tomeasure the electrical input power and the mechanical output power as accurate aspossible to lead to a proper efficiency measurement.Following, different tests should be performed measuring the motors’ efficiencies andstarting capabilities for different loadings.The obtained results should be used to improve the simulation model regarding thesteady state winding temperature and the system’s inertia. Following, the simulatedresults should then be compared with the actual results. Finally the machines’efficiencies and starting performances should be assessed.
1.6 Thesis StructureThe structure of this thesis report is divided into 7 chapters including the introduc-tion. The second chapter covers the basic principles of the synchronous reluctancemachine theory and the line start concept to reach synchronization. Following, abrief description of the prior designed line start reluctance machine is given. Thefourth chapter gives an overview about the FEM machine simulation models anda brief description of the lab setup for the actual machines. The subsequent chap-ter presents the results from the performed simulations and measurements of the
3

1. Introduction
machines, whereby those are assessed and compared . Subsequently a conclusionsummarizing the main results. Finally the report gives a brief discussion and men-tions possible future work tasks. Moreover the discussion includes a reflection onsome sustainable and ethical aspects with a focus on the mining of rare earth ma-terials. This aspect was chosen, because the efficiency enhancement of the deignedLS-SynRM was not achieved by harnessing permanent magnets.
4
2Synchronous Reluctance Motor
Theory
The following chapter gives a description about the basic reluctance principle andthe utilization in an electrical motor. Further the behavior of the SynRM, if a cageis added to the rotor of it to achieve a line start ability, is explained.
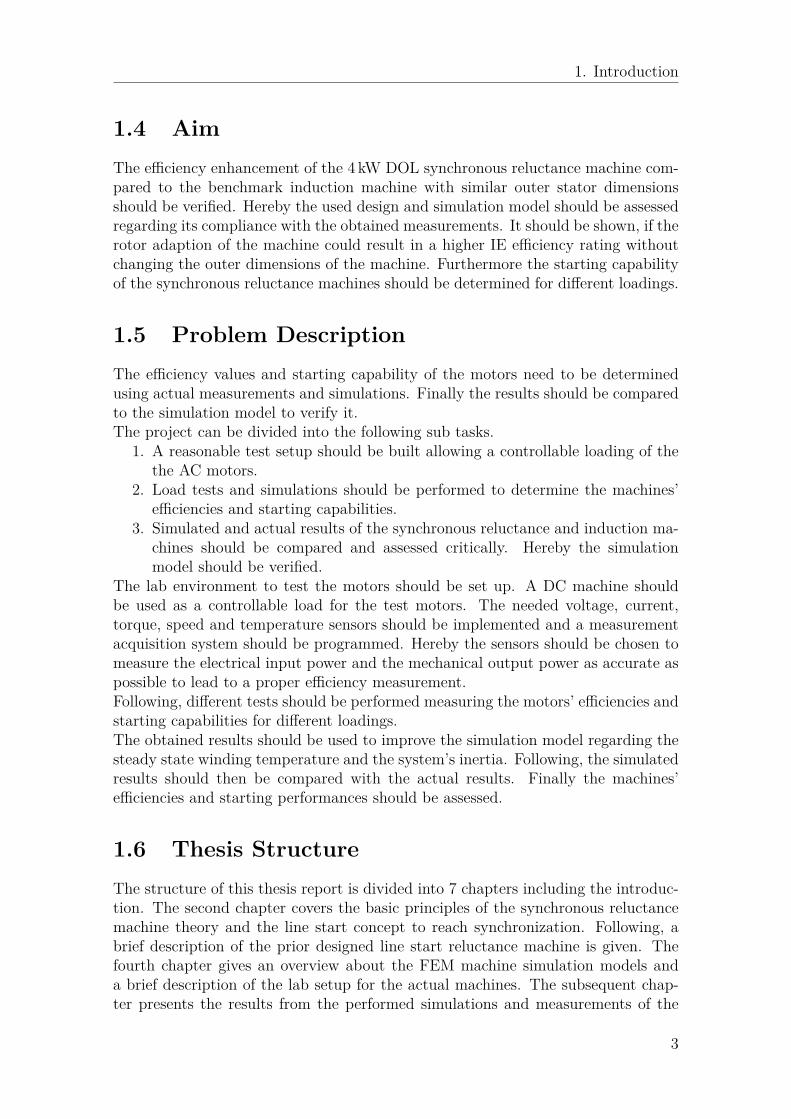
2.1 Basic Reluctance ConceptA reluctance machine is called like the utilized torque concept, which is illustratedin Figure 2.1. Here two different shaped iron objects are placed inside a magneticfield in air. The reluctance force tries to align the rectangular shaped iron object,while the round shaped object is unaffected [5]. This kind of principle is commonlyknown and it is for example utilized in a compass, where the metallic needle alignswith the magnetic field of the earth.
Figure 2.1: Illustration of the reluctance torque acting on an anisotropic shapediron object within a magnetic field, while the isotropic object keeps being unaffected.
The reason for this alignment force can be explained starting by the relation betweenwork and force. The general term for the physical work for a force along a certaindistance can be described as in (2.1), which can be rewritten to (2.2). This showsthat the torque T is caused by a change of the stored energy with respect to theangle δ.
W =∫ s2
s1
~Fd~s =∫ δ2
δ1
~Td~δ (2.1)
5
2. Synchronous Reluctance Motor Theory
T = dW
dδ(2.2)
Following, the magnetic energy stored in an inductor can be determined by itsinductance and the current or by the volume integral of the product of permeabilityand the square of the magnetic field quantity H, as described in (2.3).
W = 12I
2L(δ) = 12
∫∫∫V
BHdv = 12
∫∫∫V
µH2dv (2.3)
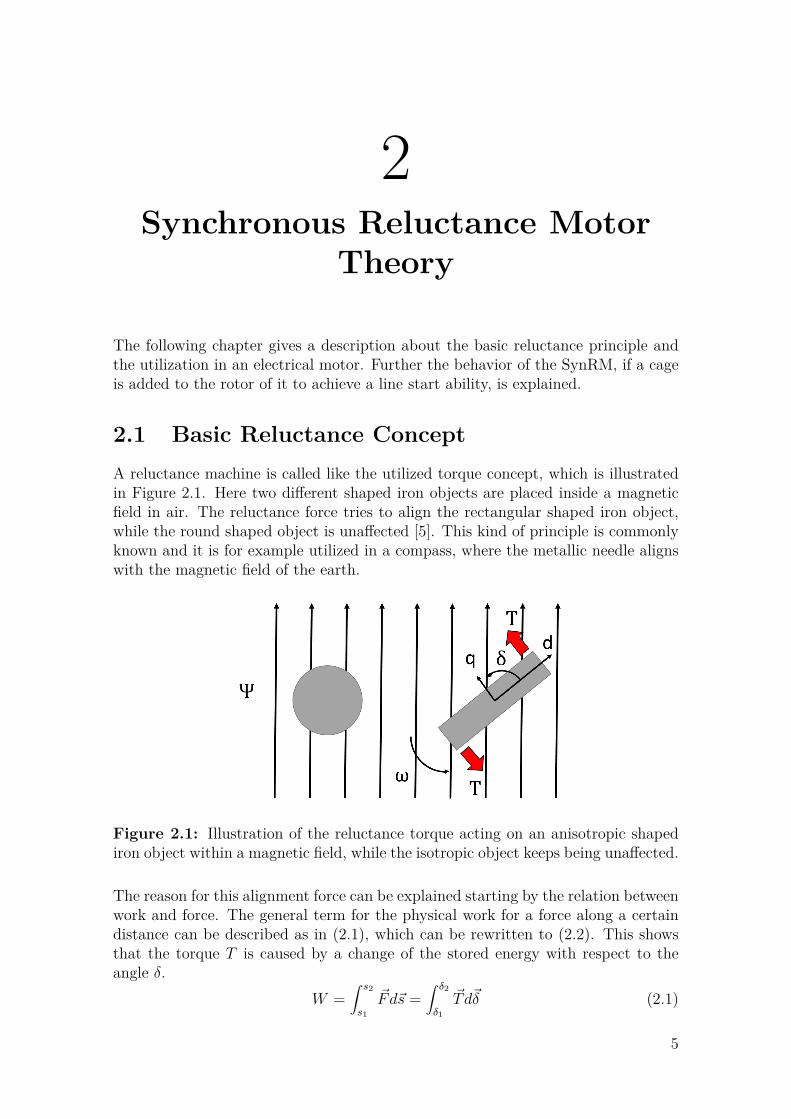
Figures 2.2 and 2.3 depict the magnetic field distribution and the flux density inand around the two different shaped iron objects obtained from a FEM simulationin COMSOL Multiphysics.
(a) δ = 90 (b) δ = 45 (c) δ = 0
Figure 2.2: Flux density and magnetic field distribution for a round shaped ironobject when placed within a magnetic field for different orientations.
(a) δ = 90 (b) δ = 45 (c) δ = 0
Figure 2.3: Flux density and magnetic field distribution for a rectangular shapediron object when placed within a magnetic field for different orientations.
6
2. Synchronous Reluctance Motor Theory
The objects are placed between two infinitely thin conductors, carrying a certainline current in opposite directions, whereby the created magnetic field is enhancedbetween the two conductors. Due to its high relative permeability the iron is alow reluctance path for the magnetic field and the flux is attracted to penetratethe objects resulting in a high flux density inside the iron. From Figure 2.2 it canbe seen that the field distribution and the magnetic flux density are unaffected bythe rotation of the round iron body. On the opposite, Figure 2.3 shows differentflux distributions and flux densities dependent on the rotational angle δ. Thereforthe magnetic energy density as described in (2.4) can be used in the FEM softwaretool, like depicted in (2.5), to determine the inductance for different displacements.Computing the derivative of the energy leads subsequently to the torque dependencyon δ.
wm = 12BH = 1
2µH2 (2.4)
L(δ) =∫∫∫V
2wmI2 dv (2.5)
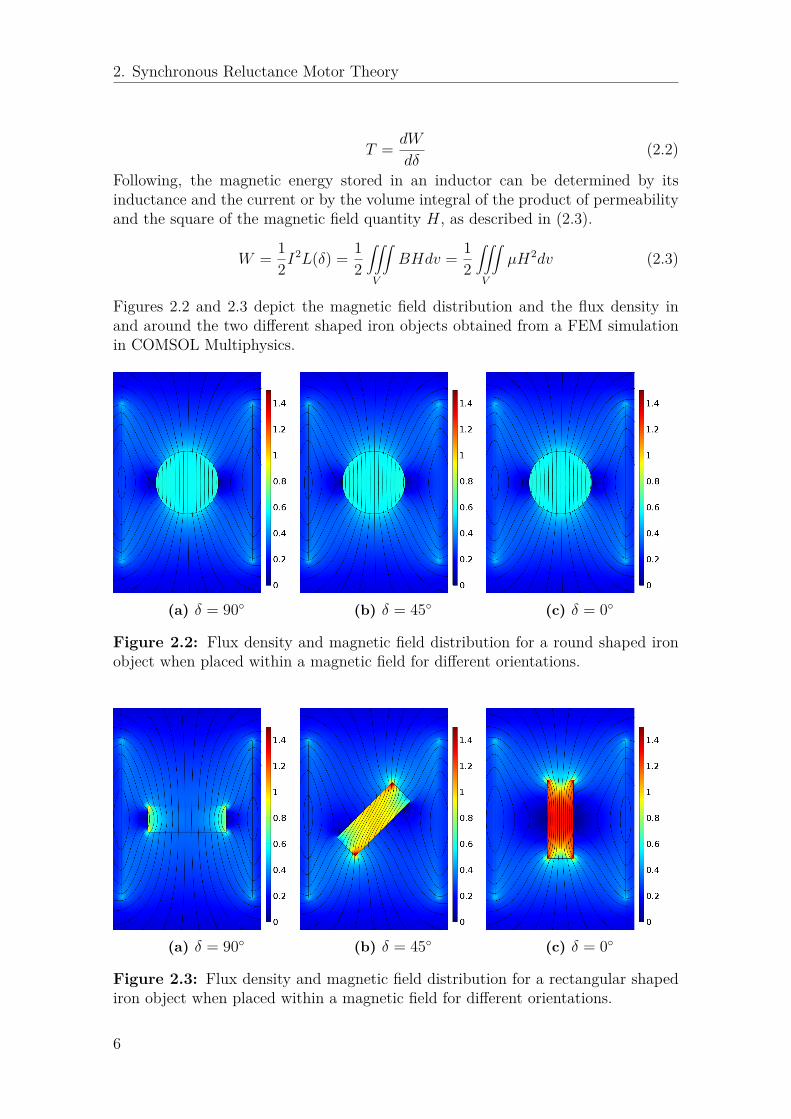
Figure 2.4 shows the obtained inductance and torque values for different displace-ments. It can be seen that the inductance of the rectangular object follows a trigono-metric function, whereas the circular shaped object’s inductance is kept constant.
-80 -60 -40 -20 0 20 40 60 80
Load angle (degree)
0
Lq-rec
Lcir
Ld-rec
Induct
ance
Lrectangle
Lcircle
(a) Inductance
-80 -60 -40 -20 0 20 40 60 80
Load angle (degree)
-Tmax
0
Tmax
Torq
ue
Trectangle
Tcircle
(b) Torque
Figure 2.4: Inductance(a) and torque(b) for the two iron shapes with respect tothe displacement angle δ.
7
2. Synchronous Reluctance Motor Theory
These obtained inductances cause a sinusoidal and zero torque behaviour in respectof the displacement δ, as seen in Figure 2.4b. Following the inductance of therectangular object is determined to follow a shape as described in (2.6).
L(δ) = Ld − Lq2 cos(−2δ) + Ld + Lq
2 (2.6)
Inserting (2.6) and (2.3) in (2.2) leads to (2.7), which in turn shows a sinusoidaltorque production in respect of the angle δ.
T = 12I
2Ld − Lq2 sin(2δ) (2.7)
The conclusion can be drawn that the system always tends to achieve a state result-ing in a minimal reluctance. The rectangular shaped object is experiencing a torqueacting on it as long the d-axis is not aligned with the magnetic flux, whereas thedepicted isotropic round shaped object’s reluctance does not change when rotatingin the magnetic field. Following there is no force acting on the round shaped object.The extent of the torque depends on the inductance ratio of the d- and q-axis andthe load angle or rather called current angle δ, defined as the angle between themagnetic field and the d-axis of the object. Changing the torque expression from(2.7) to (2.8), the torque can be expressed in dependence of the d- and q-current asin (2.9).
T = 12(Ld − Lq)I2sin(δ)cos(δ) (2.8)
T = 12(Ld − Lq)idiq (2.9)
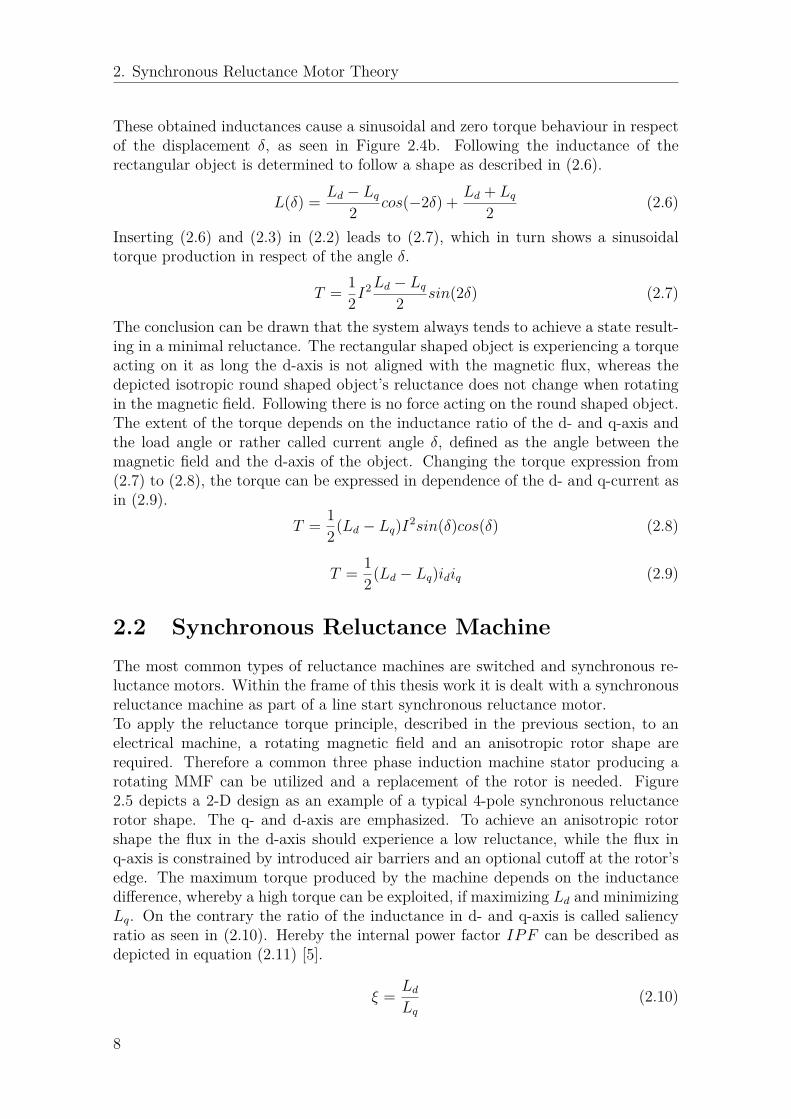
2.2 Synchronous Reluctance MachineThe most common types of reluctance machines are switched and synchronous re-luctance motors. Within the frame of this thesis work it is dealt with a synchronousreluctance machine as part of a line start synchronous reluctance motor.To apply the reluctance torque principle, described in the previous section, to anelectrical machine, a rotating magnetic field and an anisotropic rotor shape arerequired. Therefore a common three phase induction machine stator producing arotating MMF can be utilized and a replacement of the rotor is needed. Figure2.5 depicts a 2-D design as an example of a typical 4-pole synchronous reluctancerotor shape. The q- and d-axis are emphasized. To achieve an anisotropic rotorshape the flux in the d-axis should experience a low reluctance, while the flux inq-axis is constrained by introduced air barriers and an optional cutoff at the rotor’sedge. The maximum torque produced by the machine depends on the inductancedifference, whereby a high torque can be exploited, if maximizing Ld and minimizingLq. On the contrary the ratio of the inductance in d- and q-axis is called saliencyratio as seen in (2.10). Hereby the internal power factor IPF can be described asdepicted in equation (2.11) [5].
ξ = LdLq
(2.10)
8
2. Synchronous Reluctance Motor Theory
IPFmax = cosφ = ξ − 1ξ + 1 (2.11)
The number and size of barriers are chosen in a manner that a sinusoidal d-axis MMFin the air gap along the segments is achieved. A more detailed description about thedesign of synchronous reluctance rotors regarding torque, power and torque rippleoptimization can be found in [5].
Figure 2.5: Example of a four pole synchronous reluctance rotor with emphasizedd- and q-axis .
When using a three phase stator the torque expression needs to be adapted accordingto the number of pole pairs as seen in equation (2.12).
Te = 32np2 (Ld − Lq)idsiqs (2.12)
To produce a constant torque the rotor needs to revolve with the same speed asthe mains divided by the number of pole pairs. For this reason the SynRM cannotbe started directly connected to the grid. At synchronous speed the load torque ischanging in respect to the angle between the stator flux and the d-axis of the rotor,often called torque, load or current angle δ. If current control is used the torquecurve looks similar as for a common synchronous machine.The efficiency of a SynRM is usually higher than an induction machine’s efficiency,assuming same outer dimensioning. Due to the absence of the squirrel cage therotor losses are reduced. When running at synchronous speed the SynRM is ableto handle load changes easily and it can cope with overloading up to a certain loadangle without changing its efficiency significantly. The temperature in stator andespecially in the rotor are reduced. Considering its mechanical construction it isrobust and works without any brushes and commutators. One of its disadvantagesis the reduced power factor compared to the induction machine. Another drawbackis its non-start ability, if directly connected to the grid, due to the inertia of the rotorand the fast rotating magnetic field produced by the stator, similar like for PMSM,
9
2. Synchronous Reluctance Motor Theory
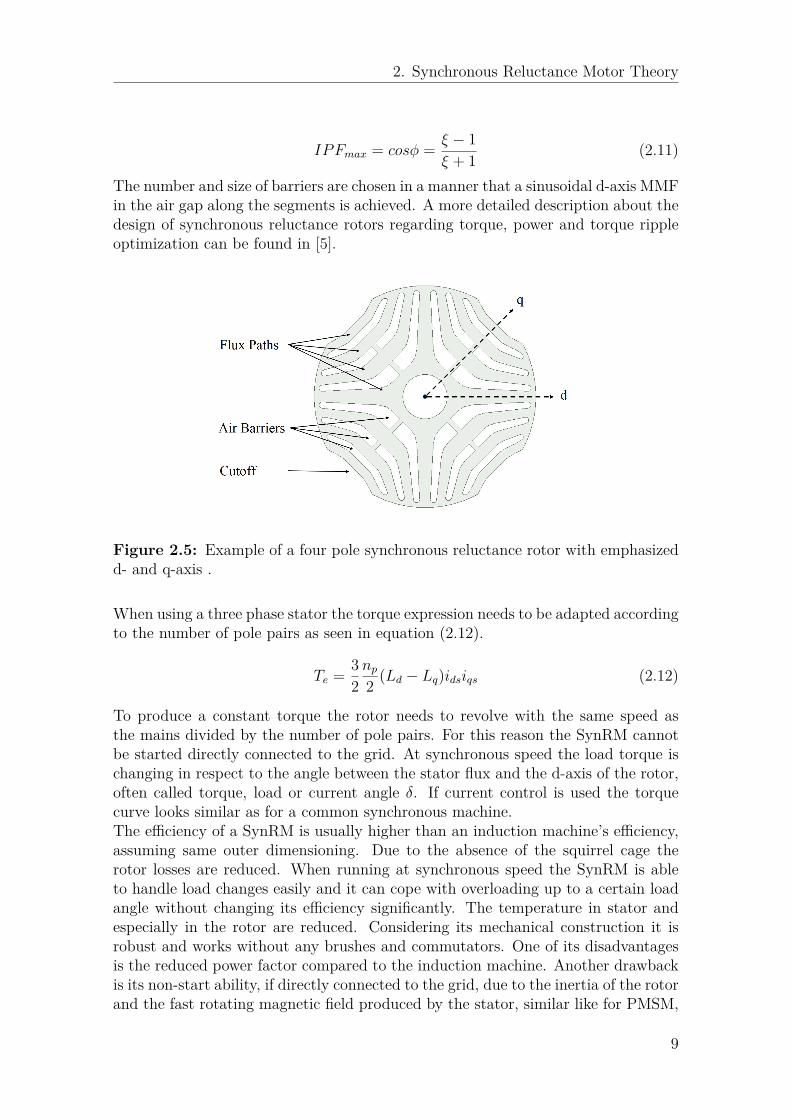
IPM or separately excited synchronous machines [5]. The equivalent circuit of theSynRM in d- and q-reference can be seen in Figure 2.6 [5]. The stator resistanceRs and leakage inductance Ls are independent of the d-and q-reference. Howeverthe magnetizing inductances Lmd and Lmq differ from each other, resulting also indifferent d- and q-flux linkages. Additionally there is a cross coupling effect of theback EMF, corresponding to the fluxes in d- and q-axis. The iron losses are notconsidered.
(a) d-reference
(b) q-reference
Figure 2.6: Equivalent circuit of the SynRM in dq-components without iron losses.
The equations (2.13) and (2.14) are the governing equations describing the electricalbehaviour of the synchronous reluctance machine neglecting saturation. Hereby Lsdand Lsq can be written as Lσs + Lmd and Lσs + Lmq, respectively.
vs = Rsis + dψsdt
+ jωsψs (2.13)
ψs = Lσsis +[Lmd 0
0 Lmq
]is (2.14)
A general term for the torque of a three phase machine is given in (2.15). Insertingthe stator flux and current lead to (2.16). If current excitation is applied the torquecan be expressed as in (2.17).
Te = 3np2 Im(ψ∗
s is) (2.15)
Te = 3np2 (ψsdisq − ψsqisd) = 3np
2 (Lsd − Lsq)isdisq (2.16)
10
2. Synchronous Reluctance Motor Theory
Te = 3np2 (Lsd − Lsq)Isin(δi)Icos(δi) = 3np
4 (Lsd − Lsq)I2sin(2δi) (2.17)
If voltage excitation is used the torque expression becomes different. Firstly thecurrents in (2.16) need to be expressed in dependence of the voltage. For thispurpose the stator flux and voltage in dq-quantities at steady state can be rewrittento (2.18) and (2.19), respectively.
ψsd = LsdIsd
ψsq = Lsq Isq(2.18)
[VsdVsq
]=[Rs −ωLsqωLsd Rs
] [IsdIsq
](2.19)
Solving (2.19) for the voltage vector by multiplying both sides of the matrix equationwith the admittance matrix, the obtained dq-quantities of the current can be writtenas in (2.20). The reactances are written as Xd and Xq.[
IsdIsq
]= 1R2s +XdXq
[Rs −Xd
Xq Rs
] [VsdVsq
](2.20)
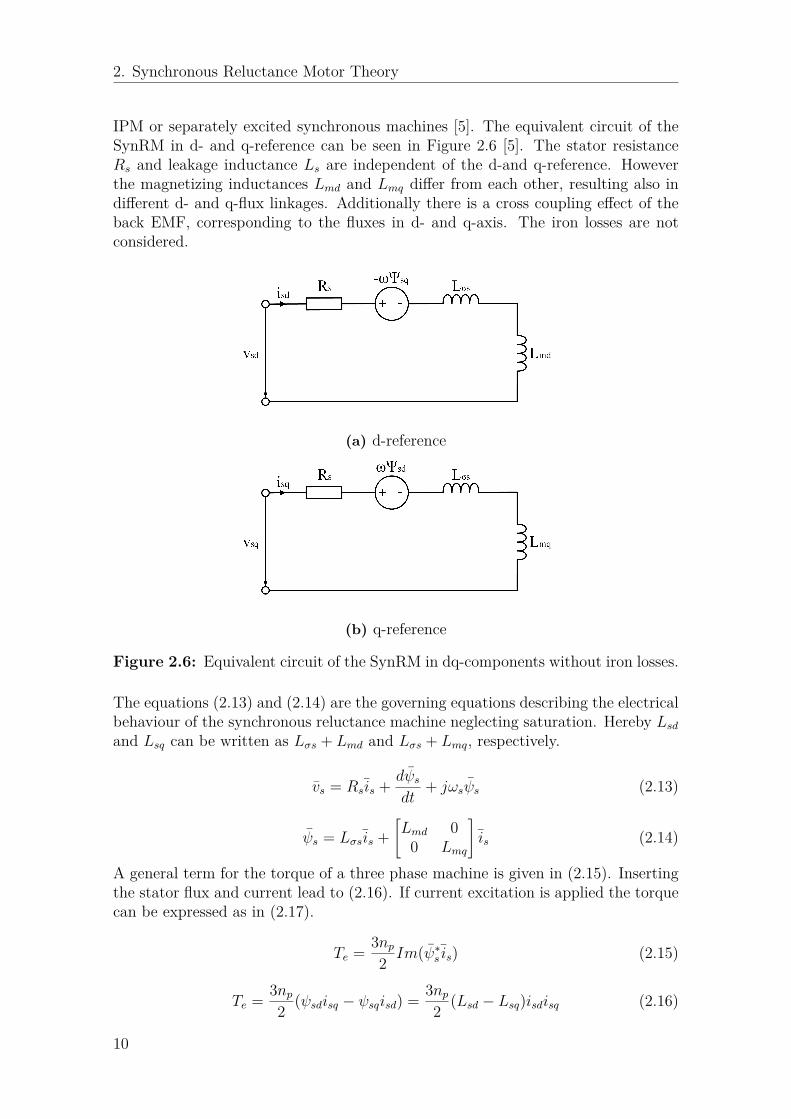
To express the voltage in dq-quantities the load or voltage angle δv as the displace-ment between the voltage phasor and the q-axis as seen in Figure 2.7 is introduced[6]. The dq-quantities of the supply voltage can then be expressed as in (2.21).
Figure 2.7: Phasor diagram of the SynRM.
11
2. Synchronous Reluctance Motor Theory
Vsd = −V sin(δv)Vsq = +V cos(δv)
(2.21)
When inserting (2.21) in (2.19) the dq-stator current is obtained. Inserting thestator current in the torque equation (2.16) leads to the final torque expression fora voltage excited SynRM (2.22).
Te =3np2 ·
V 2
2 ·(Lsd − Lsq)
(R2s +XdXq)2 · (XdXq −R2
s)sin(2δv)
+Rs(Xq −Xd)−Rs(Xq +Xd)cos(2δv)(2.22)
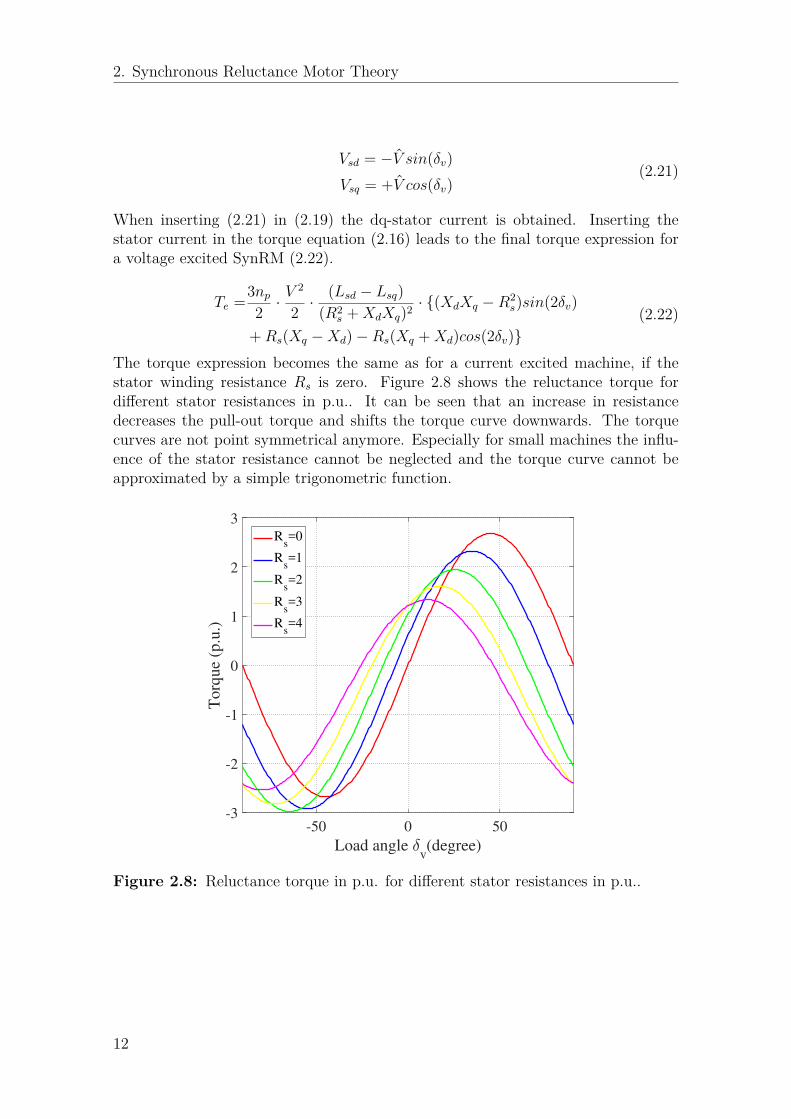
The torque expression becomes the same as for a current excited machine, if thestator winding resistance Rs is zero. Figure 2.8 shows the reluctance torque fordifferent stator resistances in p.u.. It can be seen that an increase in resistancedecreases the pull-out torque and shifts the torque curve downwards. The torquecurves are not point symmetrical anymore. Especially for small machines the influ-ence of the stator resistance cannot be neglected and the torque curve cannot beapproximated by a simple trigonometric function.
-50 0 50
Load angle v(degree)
-3
-2
-1
0
1
2
3
To
rqu
e (p
.u.)
Rs=0
Rs=1
Rs=2
Rs=3
Rs=4
Figure 2.8: Reluctance torque in p.u. for different stator resistances in p.u..
12
2. Synchronous Reluctance Motor Theory
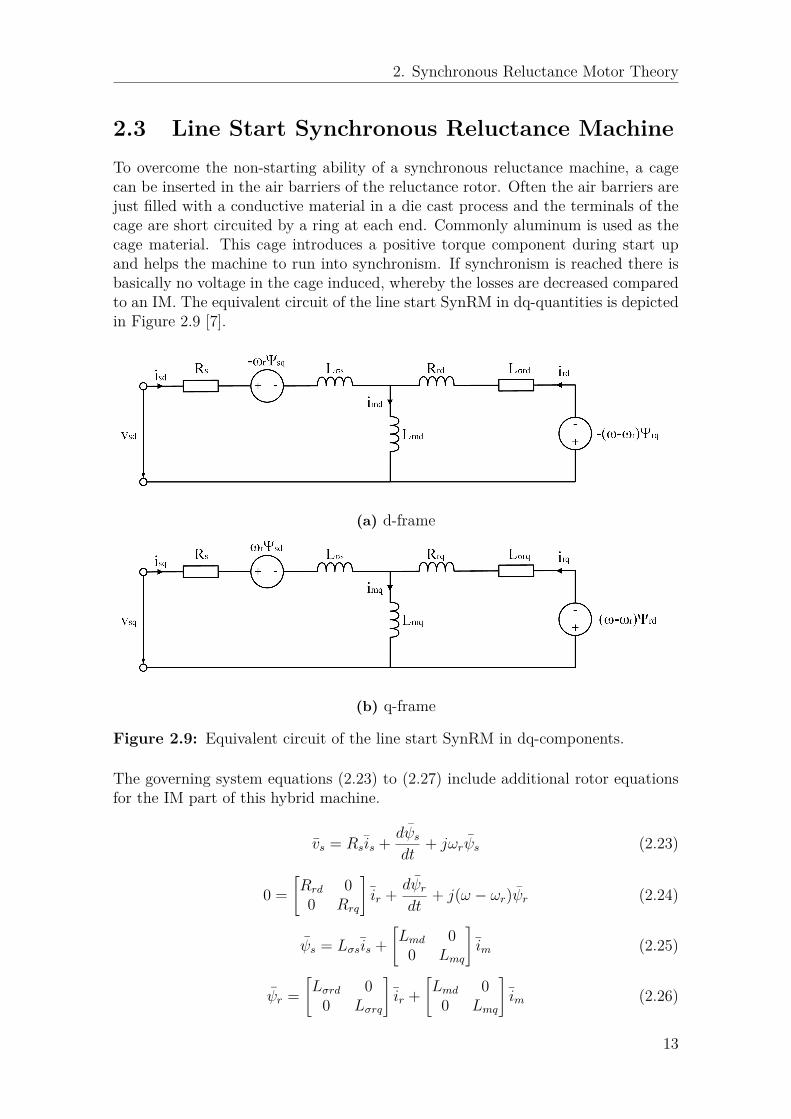
2.3 Line Start Synchronous Reluctance MachineTo overcome the non-starting ability of a synchronous reluctance machine, a cagecan be inserted in the air barriers of the reluctance rotor. Often the air barriers arejust filled with a conductive material in a die cast process and the terminals of thecage are short circuited by a ring at each end. Commonly aluminum is used as thecage material. This cage introduces a positive torque component during start upand helps the machine to run into synchronism. If synchronism is reached there isbasically no voltage in the cage induced, whereby the losses are decreased comparedto an IM. The equivalent circuit of the line start SynRM in dq-quantities is depictedin Figure 2.9 [7].
(a) d-frame
(b) q-frame
Figure 2.9: Equivalent circuit of the line start SynRM in dq-components.
The governing system equations (2.23) to (2.27) include additional rotor equationsfor the IM part of this hybrid machine.
vs = Rsis + dψsdt
+ jωrψs (2.23)
0 =[Rrd 00 Rrq
]ir + dψr
dt+ j(ω − ωr)ψr (2.24)
ψs = Lσsis +[Lmd 0
0 Lmq
]im (2.25)
ψr =[Lσrd 0
0 Lσrq
]ir +
[Lmd 0
0 Lmq
]im (2.26)
13
2. Synchronous Reluctance Motor Theory
im = is + ir (2.27)
The electrical torque during start up becomes a compound of the cage and theoscillating reluctance torque as seen in (2.28).
Te = 3np2 Im(ψ∗
s is) = Tcage + Trel (2.28)
To determine the cage and reluctance torque [7] of the machine while running up fordifferent slip speeds s, the system equations can be written as in (2.29) and (2.30). Itis assumed that the electrical transient is way faster than the mechanical transient.Consequently in steady state the time derivatives can be replaced by j(sw), whichis valid for sinusoidal phasors. The angular velocity of the phasors is sw using therotor frame as the reference.
Vsd = RsIsd + jsωψsd − ωrψsqVsq = RsIsq + jsωψsq + ωrψsd
(2.29)
0 = ReIrd + jsωψrd
0 = ReIrd + jsωψrq(2.30)
To eliminate the rotor currents from (2.30), these can be expressed using the currentdivider rule resulting in (2.31).
Ird = jsωLmdRrd + jsωLrd
Isd
Irq = jsωLmqRrq + jsωLrq
Isq
(2.31)
Consequently the stator flux can be written like in (2.32). Here the terms Zpd andZpq are called operational impedances.
ψsd =(Lsd −
jsωL2md
Rrd + jsωLrd
)Isd = ZpdIsd
ψsq =(Lsq −
jsωL2mq
Rrq + jsωLrq
)Isq = Zpq Isq
(2.32)
The relation of voltage and current can be written as in (2.33), which needs to besolved for the stator current by multiplying both sides with the admittance matrix.Through this equation (2.36) is obtained, whereby Dc is stated in (2.37).[
VsdVsq
]=[(Rs + jsωZpd) −(1− s)ωZpq(1− s)ωZpd (Rs + jsωZpq)
] [IsdIsq
](2.33)
14

2. Synchronous Reluctance Motor Theory
The stator voltage can be written as in (2.34). If the slip is not zero, the voltagequantities become rotating phasors in the dq-frame. Therefore the voltage for s 6= 0can be written as (2.35), whereby δv can be neglected.
Vsd = −V sin(sωt+ δv)Vsq = +V cos(sωt+ δv)
(2.34)
Vsd = jV
Vsq = V(2.35)
[IsdIsq
]= 1Dc
[(Rs + jsωZpq) (1− s)ωZpq−(1− s)ωZpd (Rs + jsωZpd)
] [jV
V
](2.36)
Dc = R2s + jsωRs(Zpd + Zpq) + (1− 2s)ω2ZpdZpq (2.37)
Nevertheless it is cumbersomely to obtain an analytical expression, which can behandled, for the currents and flux. Therefor the real and imaginary part of statorcurrent and flux are substituted by variables, which leads to (2.38), which in turncan be used to compute the torque recalling (2.15).
Isd = a+ jb
Isq = c+ jd
ψsd = e+ jf
ψsq = g + jh
(2.38)
From [7] the cage and reluctance torque contribution can be calculated accordingto the equations (2.39) to (2.42). The cage torque is a constant value for differentslip values. The cage is supposed to accelerate the machine’s speed to asynchronousspeed as close to synchronous speed as possible. On the other side it can be seenthat the reluctance torque contribution is a trigonometric function oscillating withtwice the slip frequency. The amplitude is also depending on the slip.
Te = Tcage + Trel · sin(2sωt− α) (2.39)
Tcage = 3np4 · (ce+ df − ga− bh) (2.40)
Trel = 3np4√
(ce+ bh− df − ga)2 + (ed+ cf − gb− ah)2 (2.41)
α = arctan
(gb+ ah− ed− cfce+ bh− df − ga
)(2.42)
15
2. Synchronous Reluctance Motor Theory
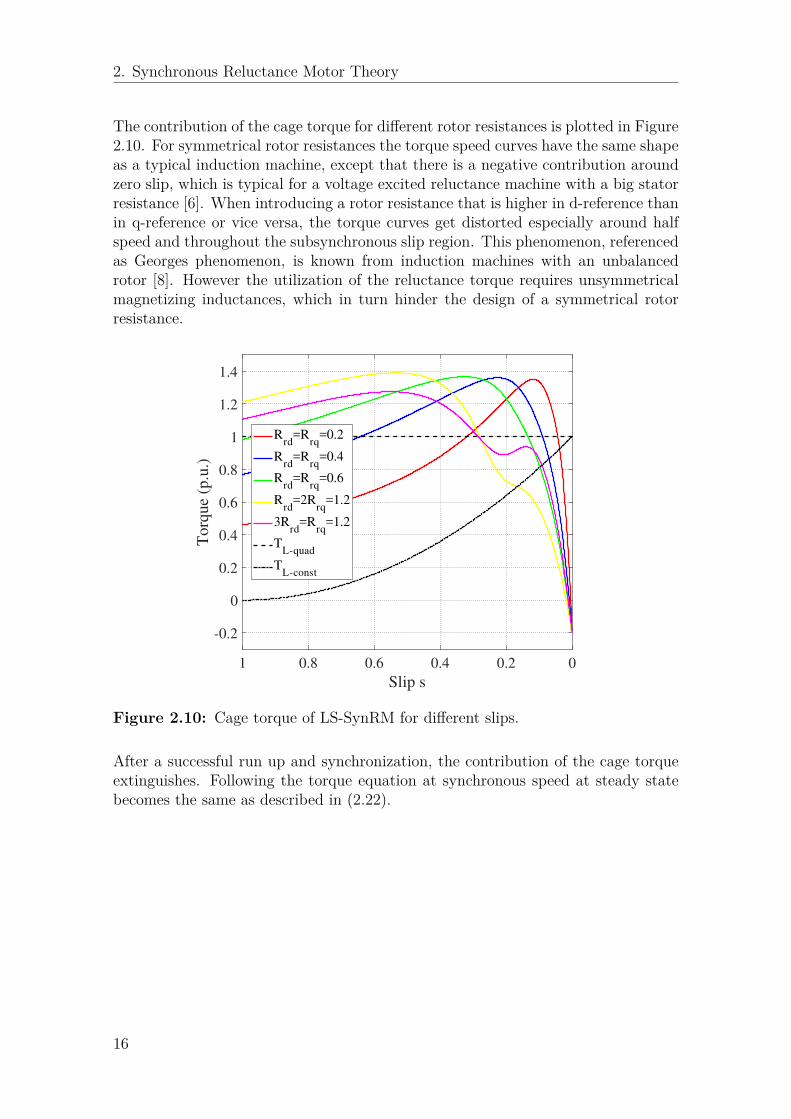
The contribution of the cage torque for different rotor resistances is plotted in Figure2.10. For symmetrical rotor resistances the torque speed curves have the same shapeas a typical induction machine, except that there is a negative contribution aroundzero slip, which is typical for a voltage excited reluctance machine with a big statorresistance [6]. When introducing a rotor resistance that is higher in d-reference thanin q-reference or vice versa, the torque curves get distorted especially around halfspeed and throughout the subsynchronous slip region. This phenomenon, referencedas Georges phenomenon, is known from induction machines with an unbalancedrotor [8]. However the utilization of the reluctance torque requires unsymmetricalmagnetizing inductances, which in turn hinder the design of a symmetrical rotorresistance.
00.20.40.60.81
Slip s
-0.2
0
0.2
0.4
0.6
0.8
1
1.2
1.4
To
rqu
e (p
.u.)
Rrd
=Rrq
=0.2
Rrd
=Rrq
=0.4
Rrd
=Rrq
=0.6
Rrd
=2Rrq
=1.2
3Rrd
=Rrq
=1.2
TL-quad
TL-const
Figure 2.10: Cage torque of LS-SynRM for different slips.
After a successful run up and synchronization, the contribution of the cage torqueextinguishes. Following the torque equation at synchronous speed at steady statebecomes the same as described in (2.22).
16
2. Synchronous Reluctance Motor Theory
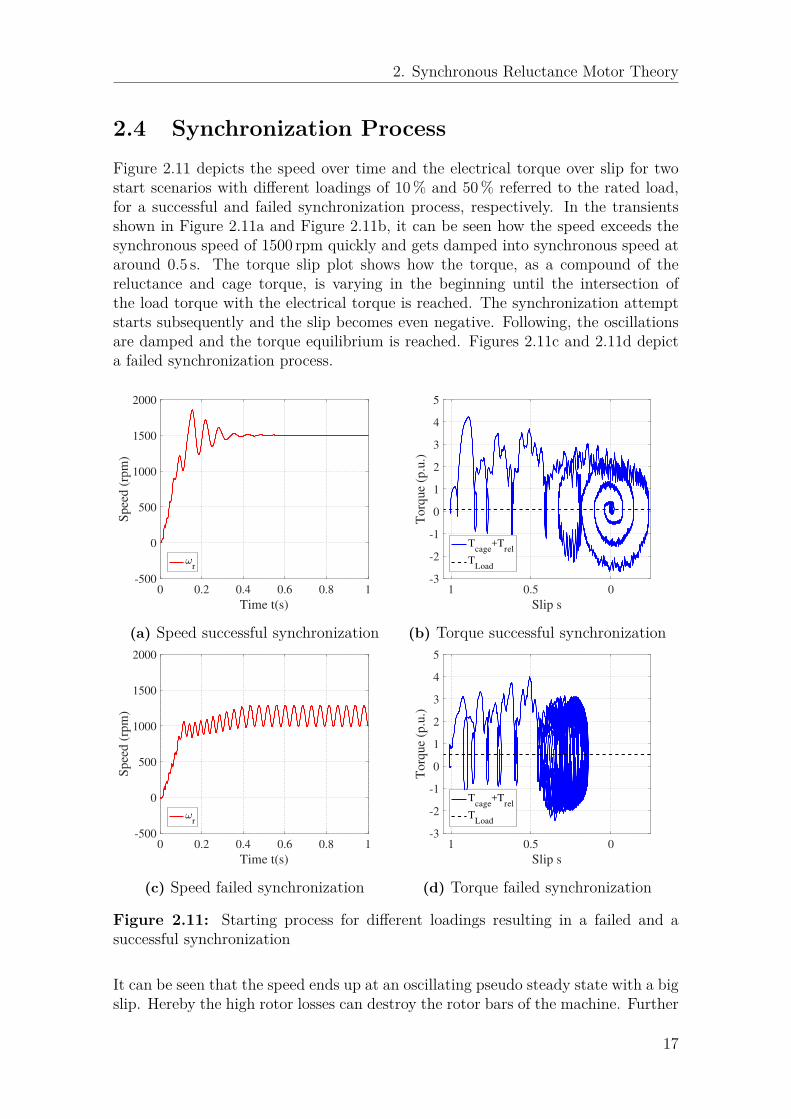
2.4 Synchronization ProcessFigure 2.11 depicts the speed over time and the electrical torque over slip for twostart scenarios with different loadings of 10 % and 50 % referred to the rated load,for a successful and failed synchronization process, respectively. In the transientsshown in Figure 2.11a and Figure 2.11b, it can be seen how the speed exceeds thesynchronous speed of 1500 rpm quickly and gets damped into synchronous speed ataround 0.5 s. The torque slip plot shows how the torque, as a compound of thereluctance and cage torque, is varying in the beginning until the intersection ofthe load torque with the electrical torque is reached. The synchronization attemptstarts subsequently and the slip becomes even negative. Following, the oscillationsare damped and the torque equilibrium is reached. Figures 2.11c and 2.11d depicta failed synchronization process.
0 0.2 0.4 0.6 0.8 1
Time t(s)
-500
0
500
1000
1500
2000
Spee
d (
rpm
)
r
(a) Speed successful synchronization
00.51
Slip s
-3
-2
-1
0
1
2
3
4
5
To
rqu
e (p
.u.)
Tcage
+Trel
TLoad
(b) Torque successful synchronization
0 0.2 0.4 0.6 0.8 1
Time t(s)
-500
0
500
1000
1500
2000
Spee
d (
rpm
)
r
(c) Speed failed synchronization
00.51
Slip s
-3
-2
-1
0
1
2
3
4
5
To
rqu
e (p
.u.)
Tcage
+Trel
TLoad
(d) Torque failed synchronization
Figure 2.11: Starting process for different loadings resulting in a failed and asuccessful synchronization
It can be seen that the speed ends up at an oscillating pseudo steady state with a bigslip. Hereby the high rotor losses can destroy the rotor bars of the machine. Further
17
2. Synchronous Reluctance Motor Theory
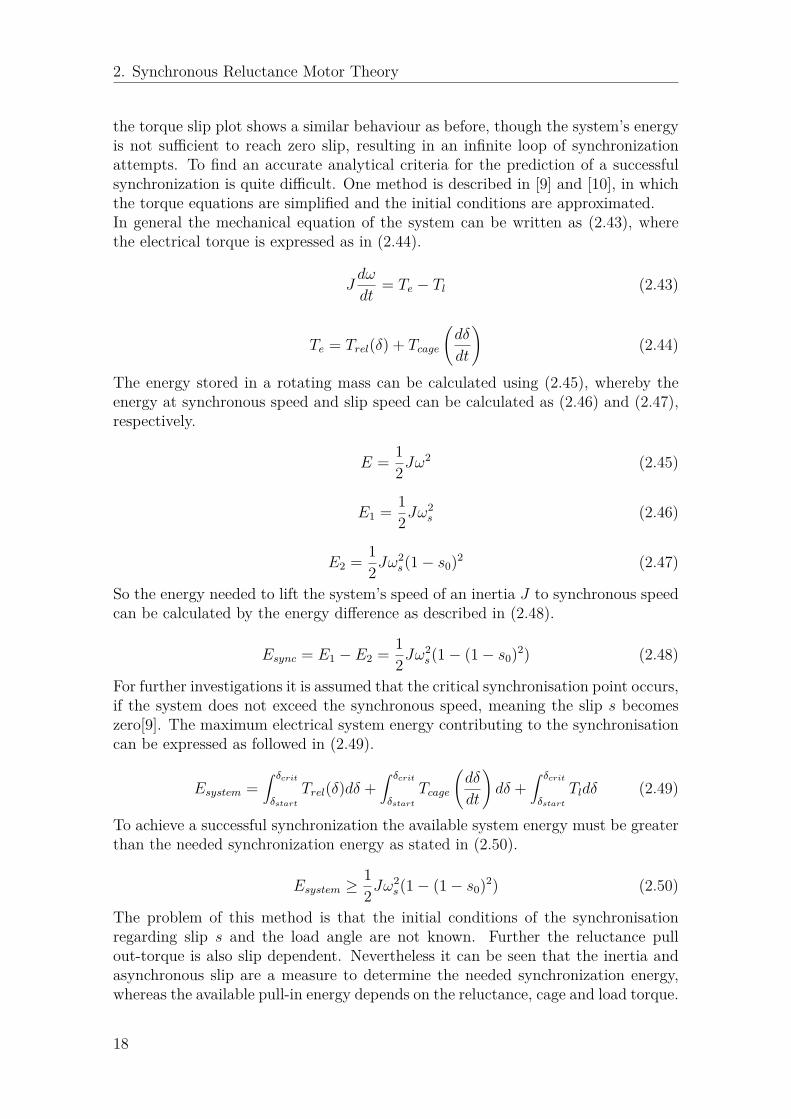
the torque slip plot shows a similar behaviour as before, though the system’s energyis not sufficient to reach zero slip, resulting in an infinite loop of synchronizationattempts. To find an accurate analytical criteria for the prediction of a successfulsynchronization is quite difficult. One method is described in [9] and [10], in whichthe torque equations are simplified and the initial conditions are approximated.In general the mechanical equation of the system can be written as (2.43), wherethe electrical torque is expressed as in (2.44).
Jdω
dt= Te − Tl (2.43)
Te = Trel(δ) + Tcage
(dδ
dt
)(2.44)
The energy stored in a rotating mass can be calculated using (2.45), whereby theenergy at synchronous speed and slip speed can be calculated as (2.46) and (2.47),respectively.
E = 12Jω
2 (2.45)
E1 = 12Jω
2s (2.46)
E2 = 12Jω
2s(1− s0)2 (2.47)
So the energy needed to lift the system’s speed of an inertia J to synchronous speedcan be calculated by the energy difference as described in (2.48).
Esync = E1 − E2 = 12Jω
2s(1− (1− s0)2) (2.48)
For further investigations it is assumed that the critical synchronisation point occurs,if the system does not exceed the synchronous speed, meaning the slip s becomeszero[9]. The maximum electrical system energy contributing to the synchronisationcan be expressed as followed in (2.49).
Esystem =∫ δcrit
δstart
Trel(δ)dδ +∫ δcrit
δstart
Tcage
(dδ
dt
)dδ +
∫ δcrit
δstart
Tldδ (2.49)
To achieve a successful synchronization the available system energy must be greaterthan the needed synchronization energy as stated in (2.50).
Esystem ≥12Jω
2s(1− (1− s0)2) (2.50)
The problem of this method is that the initial conditions of the synchronisationregarding slip s and the load angle are not known. Further the reluctance pullout-torque is also slip dependent. Nevertheless it can be seen that the inertia andasynchronous slip are a measure to determine the needed synchronization energy,whereas the available pull-in energy depends on the reluctance, cage and load torque.
18
3Line Start Machine Design
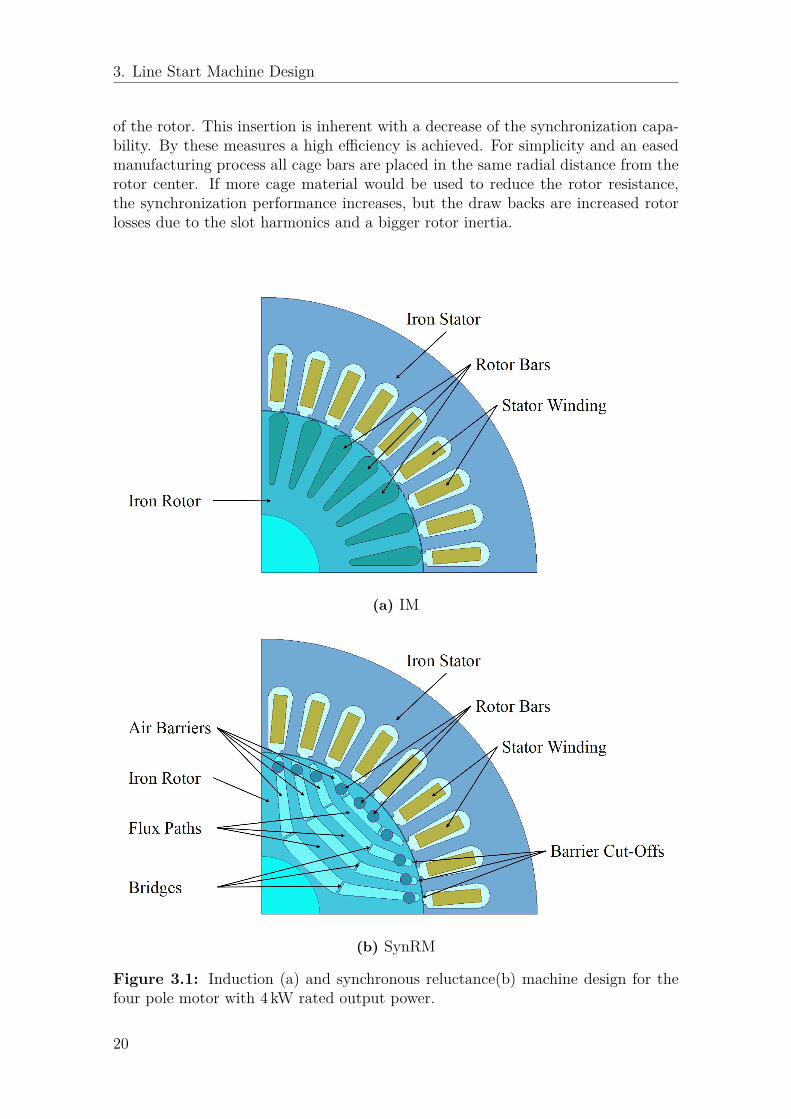
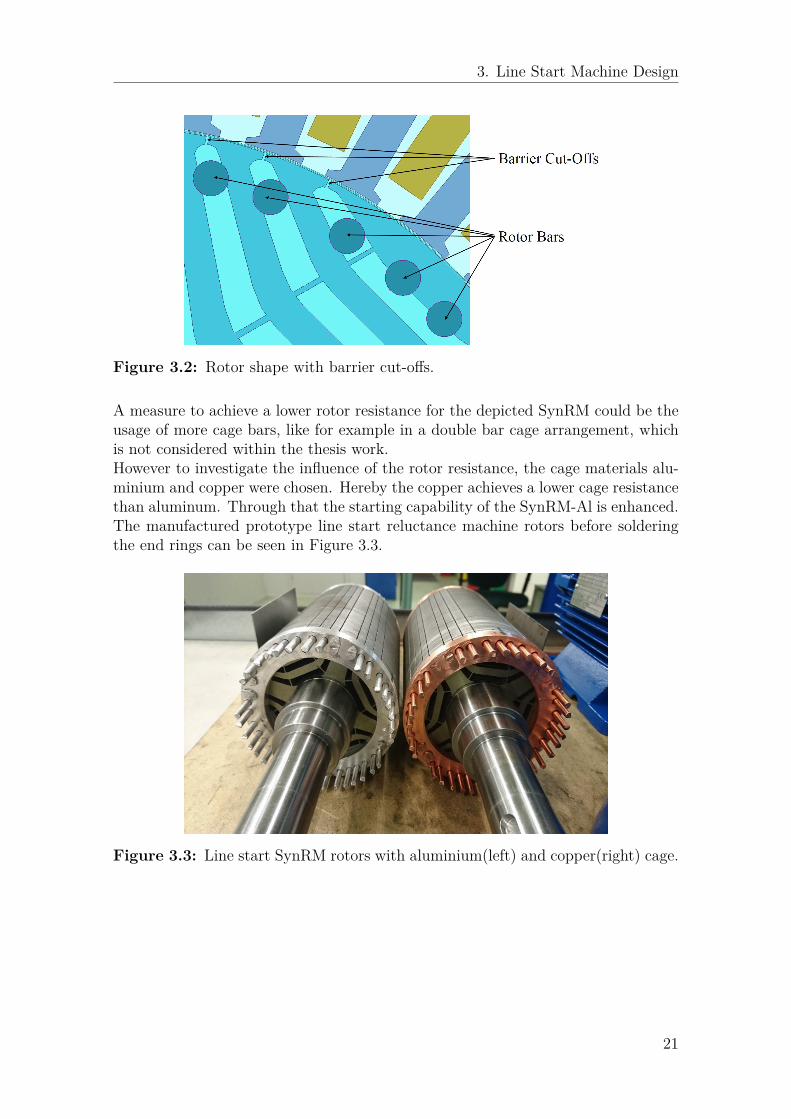
Within this chapter a brief introduction of the prior designed line start synchronousreluctance machine is given. Hereby the main focus of the design was the properplacement of the rotor cage bars and additional measures resulting in a high steadystate efficiency.Figures 3.1a and 3.1b show the cross-section of the IM benchmark motor and thedesigned line start synchronous reluctance machine, respectively. Due to symmetri-cal reasons just a quarter of the four pole machines is depicted. For both machinesthe same stator is used.The benchmark motor was chosen to have a rated efficiency of 88.6 % (IE3), powerfactor of 0.79 and a mechanical output power of 4 kW with 400 V phase voltage,while the machines’ windings are connected in delta.For the design and the simulations of the line start synchronous reluctance ma-chine the FEM software ANSYS Maxwell is used, in which a 2D one layer designmodel topology without thermal coupling was chosen. Thereby an acceptable trade-off between a short computation time and accurate simulation results for differentparametric sweep studies was achieved. For simplicity the steady state temperatureof the rotor bars and stator windings were set to an equal value. During the designstage it was assumed that the steady state temperature would reach around 50 % ofthe temperature rise of the corresponding insulation class F. Assuming an ambienttemperature of 40 C, the steady sate winding temperature was set to 80 C. Theload inertia was chosen to be about 15 % to 30 % of the rotor’s inertia, which isreasonable for a pump or a conveyor belt application with a quadratic load charac-teristic[11].When designing the synchronous reluctance machine the number of the reluctancerotor’s air barriers was chosen to be four. Hereby the torque ripple at rated loadwas kept to about 30 %. To ease the manufacturing process, no rotor skewing wasused, which in turn would decrease the torque ripple. A cut-off at the ends of eachair barrier was introduced, as seen in Figure 3.2, to reduce the leakage inductanceand losses in the rotor bars caused by the slot harmonics. Following two mechan-ical bridges for each air barrier were introduced to increase the rotor’s mechanicalstrength. In Figures 3.1b and 3.2 the dark blue circles depict the chosen cage with abar diameter of 4 mm. The ends of the bars are short circuited by a ring. These barsare placed in a manner that the flux paths are not significantly constraint and theleakage rotor flux is kept small. For example it can be seen that the bars are nevertotally surrounded by the rotor iron sheets. Moreover it can be seen that the cageis small compared to a complete filling of the air barriers. To reduce the losses inthe cage caused by the slot harmonics even further, it is inserted towards the center
19
3. Line Start Machine Design
of the rotor. This insertion is inherent with a decrease of the synchronization capa-bility. By these measures a high efficiency is achieved. For simplicity and an easedmanufacturing process all cage bars are placed in the same radial distance from therotor center. If more cage material would be used to reduce the rotor resistance,the synchronization performance increases, but the draw backs are increased rotorlosses due to the slot harmonics and a bigger rotor inertia.
(a) IM
(b) SynRM
Figure 3.1: Induction (a) and synchronous reluctance(b) machine design for thefour pole motor with 4 kW rated output power.
20
3. Line Start Machine Design
Figure 3.2: Rotor shape with barrier cut-offs.
A measure to achieve a lower rotor resistance for the depicted SynRM could be theusage of more cage bars, like for example in a double bar cage arrangement, whichis not considered within the thesis work.However to investigate the influence of the rotor resistance, the cage materials alu-minium and copper were chosen. Hereby the copper achieves a lower cage resistancethan aluminum. Through that the starting capability of the SynRM-Al is enhanced.The manufactured prototype line start reluctance machine rotors before solderingthe end rings can be seen in Figure 3.3.
Figure 3.3: Line start SynRM rotors with aluminium(left) and copper(right) cage.
21

3. Line Start Machine Design
22
4Simulation Model and Test Setup
The following chapter gives a brief description about the used simulation model andthe test bench setup used to conduct different load and starting tests on the testmotors to determine the efficiency and the starting capability.
4.1 Simulation ModelFor the simulations the FEM software ANSYS Maxwell is used. The excitationmode is set to voltage excitation 400 V three phase voltage, corresponding to themains. The mechanical system is modeled as one stiff inertia and a constant torqueload is used. The steel used and modeled is M470-50A. The cage is either modeledusing aluminum or copper, whereby a temperature dependence of the conductivityis implemented. The final steady state winding temperatures and inertia values aretaken from the actual test setup measurements.
4.1.1 Solver SettingFor the determination of the efficiency values the simulation time step is set to 50 µs,corresponding to a sample frequency of 20 kHz or 400 samples per electrical period.It was chosen in a manner that the harmonic content of the current and flux causedby the stator slots can be depicted with at least 20 samples per electrical period.From (4.1)[12] it can be seen that the order of the slot harmonics is dependent onthe stator slots S and the number of machine poles P . For the test motors the orderof the harmonic content is about 19, resulting in a frequency of 950 Hz.
nslot = S · 2P± 1 = 36 · 2
4 ± 1 = 18± 1 (4.1)
When determining the starting capability the simulation time step is reduced to0.5 ms, corresponding to a sample frequency of 2 kHz or 40 samples per electricalperiod. This measure was taken to reduce the computation time for each of thenumerous simulation cases.
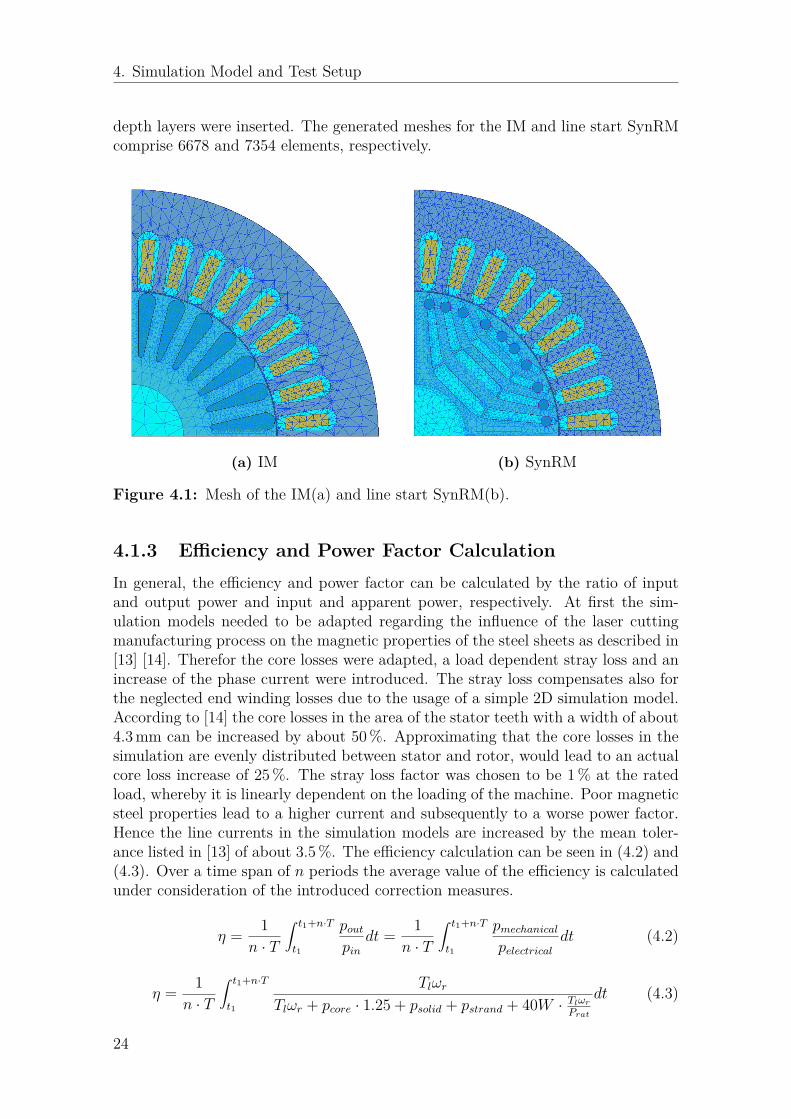
4.1.2 MeshingThe used FEM mesh of the motor models can be seen in Figure 4.1. The appliedmesh methods are length based, skin depth based and surface approximation. Theair gap was meshed in three layers and the rotor bars were meshed finer and skin
23
4. Simulation Model and Test Setup
depth layers were inserted. The generated meshes for the IM and line start SynRMcomprise 6678 and 7354 elements, respectively.
(a) IM (b) SynRM
Figure 4.1: Mesh of the IM(a) and line start SynRM(b).
4.1.3 Efficiency and Power Factor CalculationIn general, the efficiency and power factor can be calculated by the ratio of inputand output power and input and apparent power, respectively. At first the sim-ulation models needed to be adapted regarding the influence of the laser cuttingmanufacturing process on the magnetic properties of the steel sheets as described in[13] [14]. Therefor the core losses were adapted, a load dependent stray loss and anincrease of the phase current were introduced. The stray loss compensates also forthe neglected end winding losses due to the usage of a simple 2D simulation model.According to [14] the core losses in the area of the stator teeth with a width of about4.3 mm can be increased by about 50 %. Approximating that the core losses in thesimulation are evenly distributed between stator and rotor, would lead to an actualcore loss increase of 25 %. The stray loss factor was chosen to be 1 % at the ratedload, whereby it is linearly dependent on the loading of the machine. Poor magneticsteel properties lead to a higher current and subsequently to a worse power factor.Hence the line currents in the simulation models are increased by the mean toler-ance listed in [13] of about 3.5 %. The efficiency calculation can be seen in (4.2) and(4.3). Over a time span of n periods the average value of the efficiency is calculatedunder consideration of the introduced correction measures.
η = 1n · T
∫ t1+n·T
t1
poutpin
dt = 1n · T
∫ t1+n·T
t1
pmechanicalpelectrical
dt (4.2)
η = 1n · T
∫ t1+n·T
t1
Tlωr
Tlωr + pcore · 1.25 + psolid + pstrand + 40W · Tlωr
Prat
dt (4.3)
24

4. Simulation Model and Test Setup
The calculation of the power factor can be seen in (4.4) to (4.6). Here the averageactive and reactive power are calculated over a time span of n periods.
cosφ = P
S= P√
P 2 +Q2 (4.4)
P = 1n · T
∫ t1+n·T
t1Tlωr + pcore · 1.25 + psolid + pstrand + 40W · Tlωr
Pratdt (4.5)
Q = 1n · T
∫ t1+n·T
t1
1√3
[(vb − vc)ia + (vc − va)ib + (va − vb)ic]dt · 1.035 (4.6)
25
4. Simulation Model and Test Setup
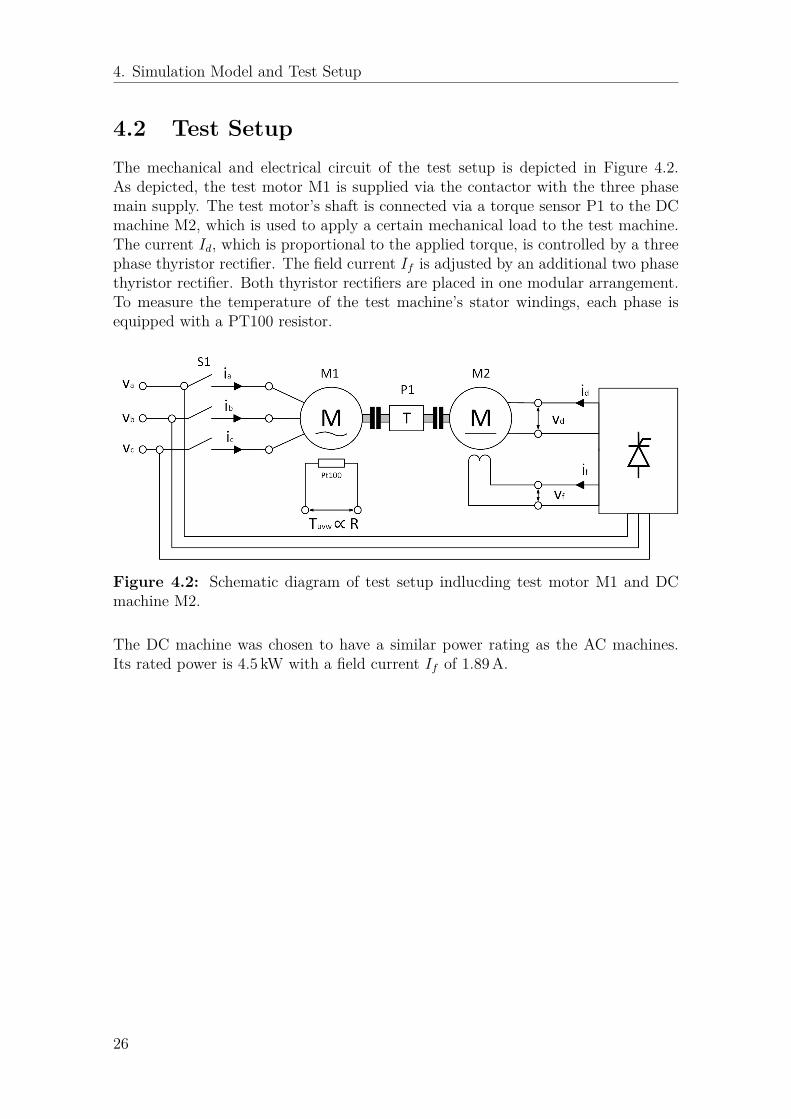
4.2 Test SetupThe mechanical and electrical circuit of the test setup is depicted in Figure 4.2.As depicted, the test motor M1 is supplied via the contactor with the three phasemain supply. The test motor’s shaft is connected via a torque sensor P1 to the DCmachine M2, which is used to apply a certain mechanical load to the test machine.The current Id, which is proportional to the applied torque, is controlled by a threephase thyristor rectifier. The field current If is adjusted by an additional two phasethyristor rectifier. Both thyristor rectifiers are placed in one modular arrangement.To measure the temperature of the test machine’s stator windings, each phase isequipped with a PT100 resistor.
Figure 4.2: Schematic diagram of test setup indlucding test motor M1 and DCmachine M2.
The DC machine was chosen to have a similar power rating as the AC machines.Its rated power is 4.5 kW with a field current If of 1.89 A.
26
4. Simulation Model and Test Setup
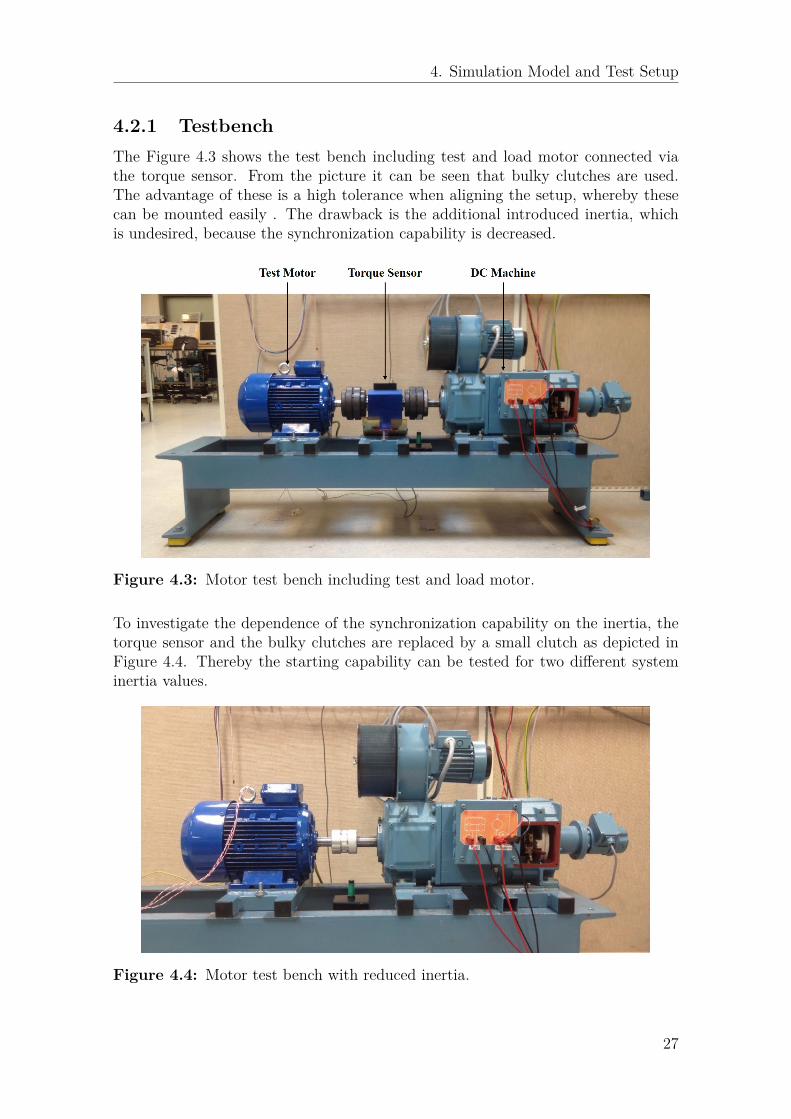
4.2.1 TestbenchThe Figure 4.3 shows the test bench including test and load motor connected viathe torque sensor. From the picture it can be seen that bulky clutches are used.The advantage of these is a high tolerance when aligning the setup, whereby thesecan be mounted easily . The drawback is the additional introduced inertia, whichis undesired, because the synchronization capability is decreased.
Figure 4.3: Motor test bench including test and load motor.
To investigate the dependence of the synchronization capability on the inertia, thetorque sensor and the bulky clutches are replaced by a small clutch as depicted inFigure 4.4. Thereby the starting capability can be tested for two different systeminertia values.
Figure 4.4: Motor test bench with reduced inertia.
27
4. Simulation Model and Test Setup
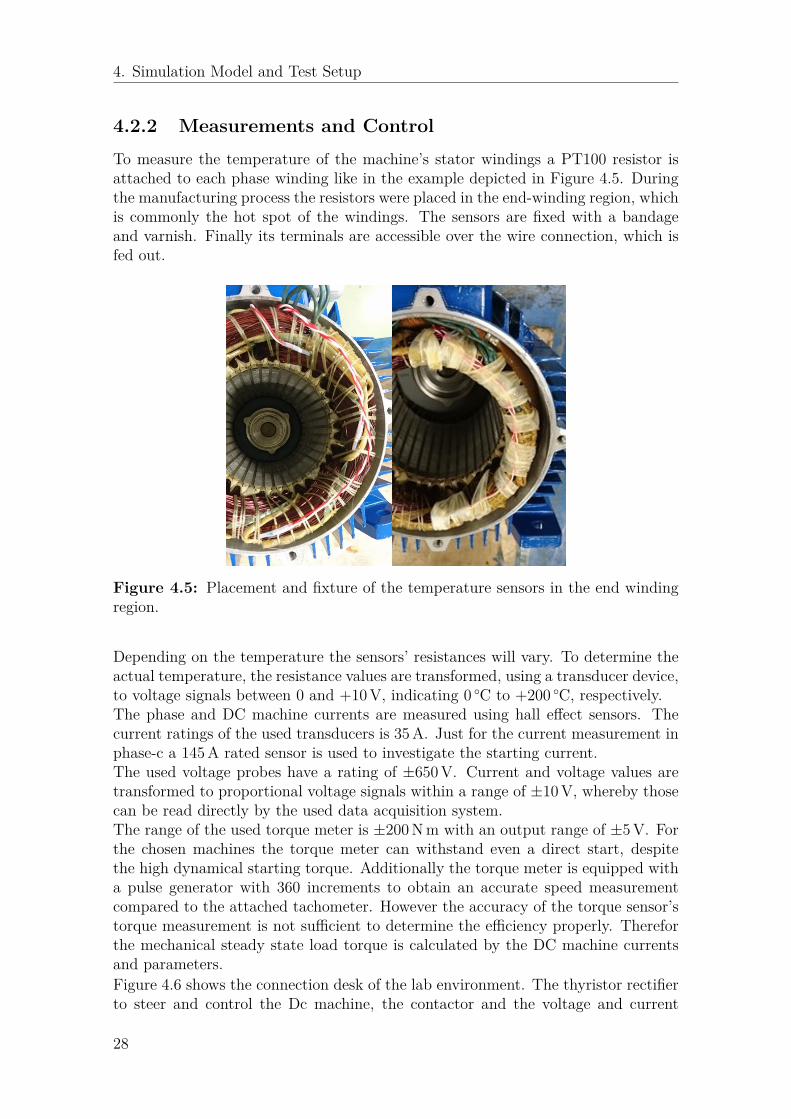
4.2.2 Measurements and ControlTo measure the temperature of the machine’s stator windings a PT100 resistor isattached to each phase winding like in the example depicted in Figure 4.5. Duringthe manufacturing process the resistors were placed in the end-winding region, whichis commonly the hot spot of the windings. The sensors are fixed with a bandageand varnish. Finally its terminals are accessible over the wire connection, which isfed out.
Figure 4.5: Placement and fixture of the temperature sensors in the end windingregion.
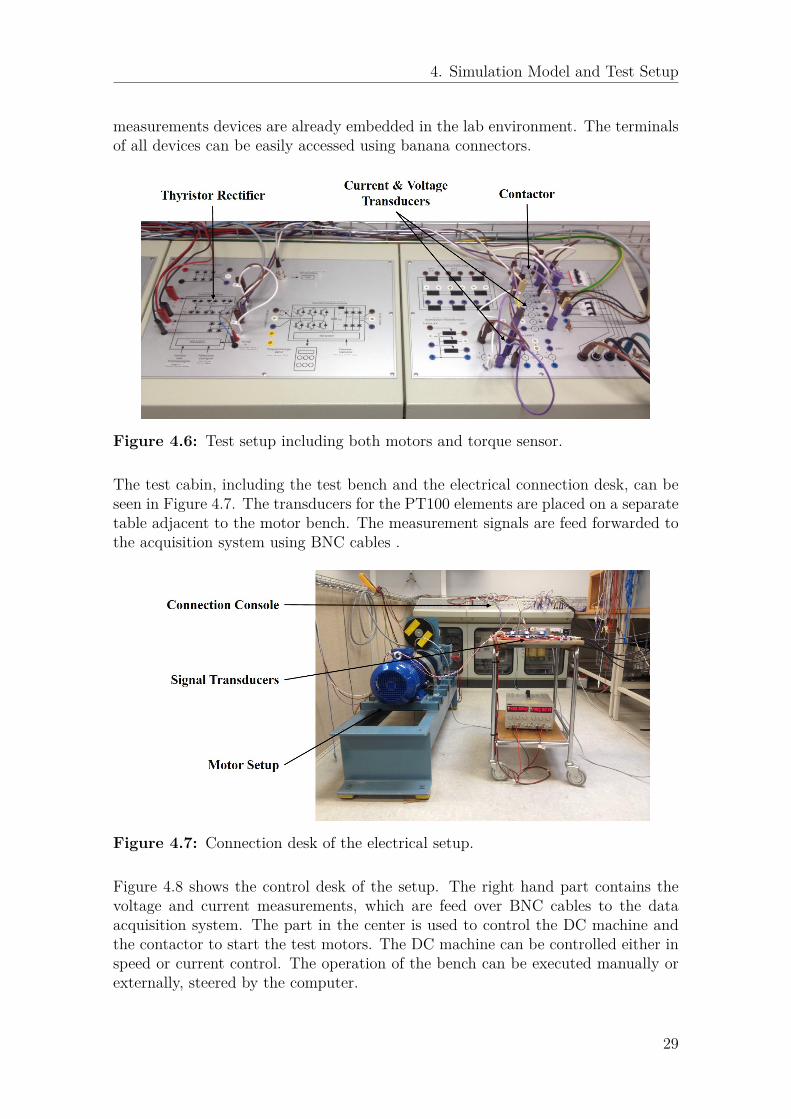
Depending on the temperature the sensors’ resistances will vary. To determine theactual temperature, the resistance values are transformed, using a transducer device,to voltage signals between 0 and +10 V, indicating 0 C to +200 C, respectively.The phase and DC machine currents are measured using hall effect sensors. Thecurrent ratings of the used transducers is 35 A. Just for the current measurement inphase-c a 145 A rated sensor is used to investigate the starting current.The used voltage probes have a rating of ±650 V. Current and voltage values aretransformed to proportional voltage signals within a range of ±10 V, whereby thosecan be read directly by the used data acquisition system.The range of the used torque meter is ±200 N m with an output range of ±5 V. Forthe chosen machines the torque meter can withstand even a direct start, despitethe high dynamical starting torque. Additionally the torque meter is equipped witha pulse generator with 360 increments to obtain an accurate speed measurementcompared to the attached tachometer. However the accuracy of the torque sensor’storque measurement is not sufficient to determine the efficiency properly. Thereforthe mechanical steady state load torque is calculated by the DC machine currentsand parameters.Figure 4.6 shows the connection desk of the lab environment. The thyristor rectifierto steer and control the Dc machine, the contactor and the voltage and current
28
4. Simulation Model and Test Setup
measurements devices are already embedded in the lab environment. The terminalsof all devices can be easily accessed using banana connectors.
Figure 4.6: Test setup including both motors and torque sensor.
The test cabin, including the test bench and the electrical connection desk, can beseen in Figure 4.7. The transducers for the PT100 elements are placed on a separatetable adjacent to the motor bench. The measurement signals are feed forwarded tothe acquisition system using BNC cables .
Figure 4.7: Connection desk of the electrical setup.
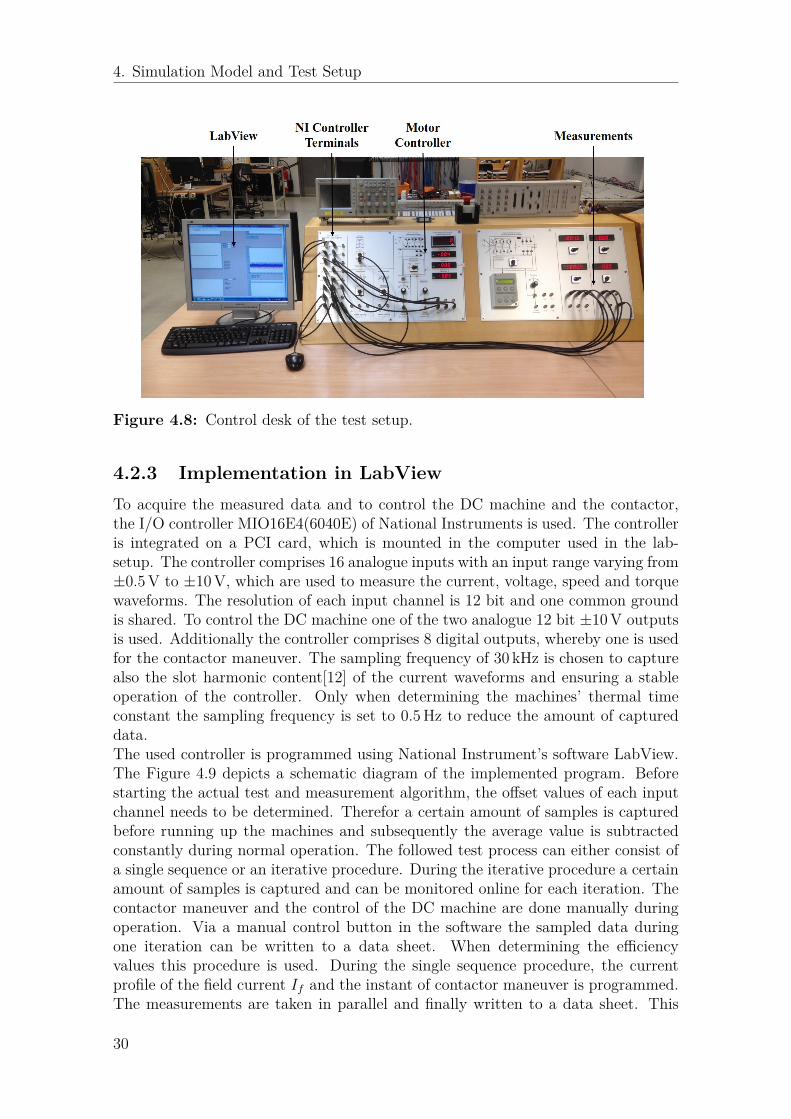
Figure 4.8 shows the control desk of the setup. The right hand part contains thevoltage and current measurements, which are feed over BNC cables to the dataacquisition system. The part in the center is used to control the DC machine andthe contactor to start the test motors. The DC machine can be controlled either inspeed or current control. The operation of the bench can be executed manually orexternally, steered by the computer.
29
4. Simulation Model and Test Setup
Figure 4.8: Control desk of the test setup.
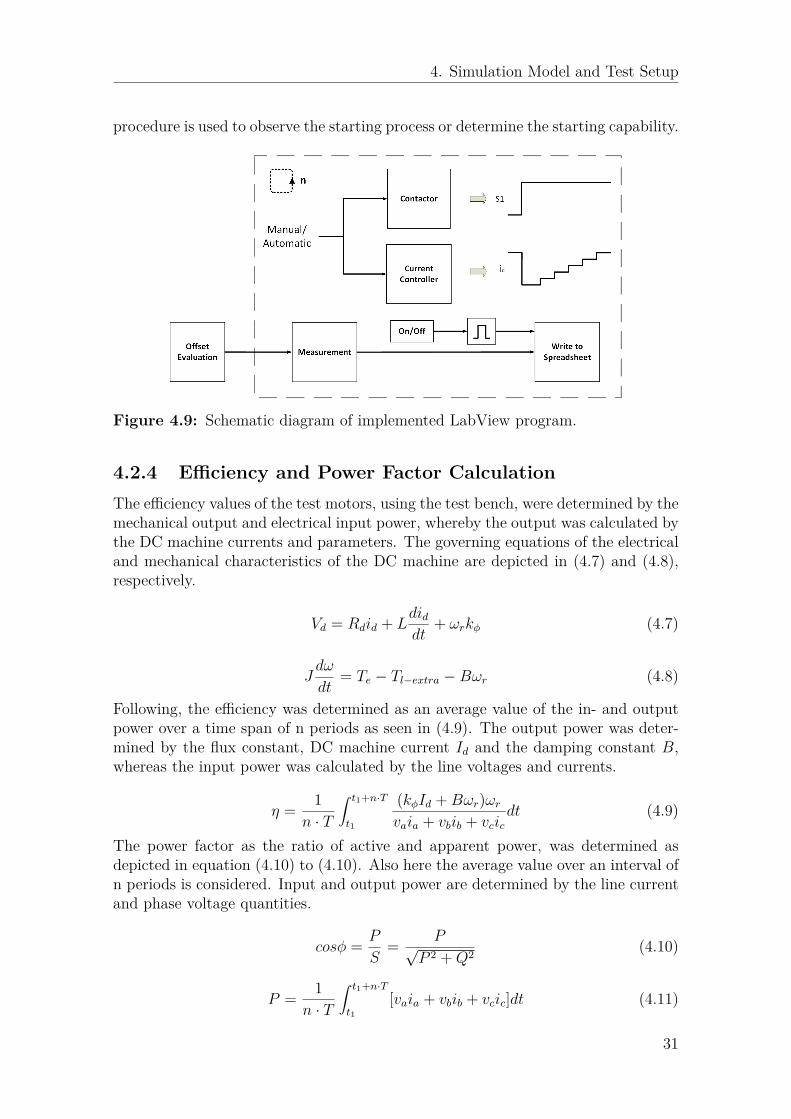
4.2.3 Implementation in LabViewTo acquire the measured data and to control the DC machine and the contactor,the I/O controller MIO16E4(6040E) of National Instruments is used. The controlleris integrated on a PCI card, which is mounted in the computer used in the lab-setup. The controller comprises 16 analogue inputs with an input range varying from±0.5 V to ±10 V, which are used to measure the current, voltage, speed and torquewaveforms. The resolution of each input channel is 12 bit and one common groundis shared. To control the DC machine one of the two analogue 12 bit ±10 V outputsis used. Additionally the controller comprises 8 digital outputs, whereby one is usedfor the contactor maneuver. The sampling frequency of 30 kHz is chosen to capturealso the slot harmonic content[12] of the current waveforms and ensuring a stableoperation of the controller. Only when determining the machines’ thermal timeconstant the sampling frequency is set to 0.5 Hz to reduce the amount of captureddata.The used controller is programmed using National Instrument’s software LabView.The Figure 4.9 depicts a schematic diagram of the implemented program. Beforestarting the actual test and measurement algorithm, the offset values of each inputchannel needs to be determined. Therefor a certain amount of samples is capturedbefore running up the machines and subsequently the average value is subtractedconstantly during normal operation. The followed test process can either consist ofa single sequence or an iterative procedure. During the iterative procedure a certainamount of samples is captured and can be monitored online for each iteration. Thecontactor maneuver and the control of the DC machine are done manually duringoperation. Via a manual control button in the software the sampled data duringone iteration can be written to a data sheet. When determining the efficiencyvalues this procedure is used. During the single sequence procedure, the currentprofile of the field current If and the instant of contactor maneuver is programmed.The measurements are taken in parallel and finally written to a data sheet. This
30
4. Simulation Model and Test Setup
procedure is used to observe the starting process or determine the starting capability.
Figure 4.9: Schematic diagram of implemented LabView program.
4.2.4 Efficiency and Power Factor CalculationThe efficiency values of the test motors, using the test bench, were determined by themechanical output and electrical input power, whereby the output was calculated bythe DC machine currents and parameters. The governing equations of the electricaland mechanical characteristics of the DC machine are depicted in (4.7) and (4.8),respectively.
Vd = Rdid + Ldiddt
+ ωrkφ (4.7)
Jdω
dt= Te − Tl−extra −Bωr (4.8)
Following, the efficiency was determined as an average value of the in- and outputpower over a time span of n periods as seen in (4.9). The output power was deter-mined by the flux constant, DC machine current Id and the damping constant B,whereas the input power was calculated by the line voltages and currents.
η = 1n · T
∫ t1+n·T
t1
(kφId +Bωr)ωrvaia + vbib + vcic
dt (4.9)
The power factor as the ratio of active and apparent power, was determined asdepicted in equation (4.10) to (4.10). Also here the average value over an interval ofn periods is considered. Input and output power are determined by the line currentand phase voltage quantities.
cosφ = P
S= P√
P 2 +Q2 (4.10)
P = 1n · T
∫ t1+n·T
t1[vaia + vbib + vcic]dt (4.11)
31

4. Simulation Model and Test Setup
Q = 1n · T
∫ t1+n·T
t1
1√3
[(vb − vc)ia + (vc − va)ib + (va − vb)ic]dt (4.12)
32
5Measurement and Simulation
Results
The following chapter presents the gained results from the measurements and sim-ulations. Further it is described how the information from the measurements areimplemented in the simulation model.
5.1 Test Bench and Setup ParametersThe flux constant kφ and the damping constant B, seen in (4.7) and (4.8), are impor-tant measures to determine the load represented by the DC machine, when runningthe actual test motors. To determine the flux constant the armature resistance Rd
needed to be determined first. Therefor a DC voltage was applied to the machinesterminals, whereby the armature inductance could be neglected at steady state andthe resistance was calculated by the measured current and voltage as seen in. (5.1).Subsequently the flux constant was determined by running the DC machine in noload operation at 1440 rpm, while the field current If was set to 1.89 A. Finally theflux constant was determined by the measured current and voltage as in (5.2).
Rd = VdId
= 9.94 V5.25 A = 1.893 Ω (5.1)
kφ = Vd −RdIaωr
= 218.1 V− 1.893 Ω · 1.113 A14402·π
60 rad s−1 = 1.4323 N m A−1 (5.2)
Furthermore the damping constant of the system for each motor setup needed tobe determined. For this purpose the DC machine was operated in no load. Herebythe machine was run for at least one hour, since the viscosity of the lubricant in thebearings is temperature dependent. The damping constant was then calculated asin (5.3) and the final values are depicted in Table 5.1.
B = Teωr
= kφIdωr
(5.3)
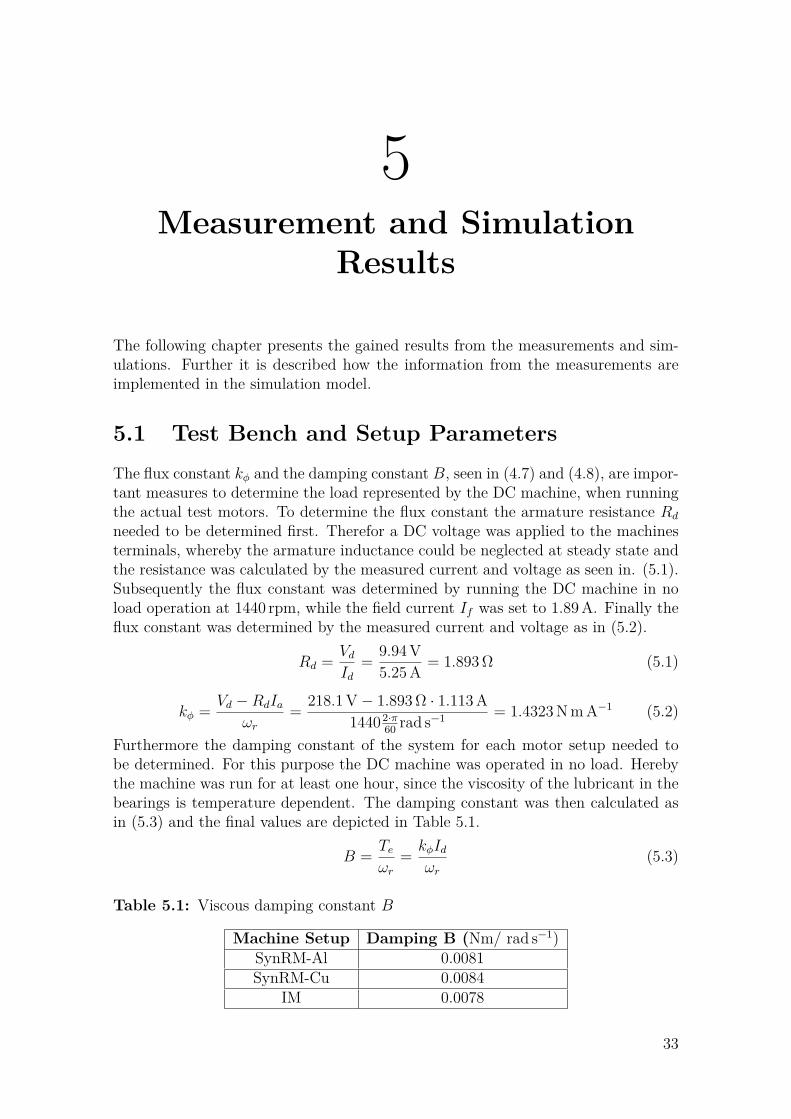
Table 5.1: Viscous damping constant B
Machine Setup Damping B (Nm/ rad s−1)SynRM-Al 0.0081SynRM-Cu 0.0084
IM 0.0078
33
5. Measurement and Simulation Results
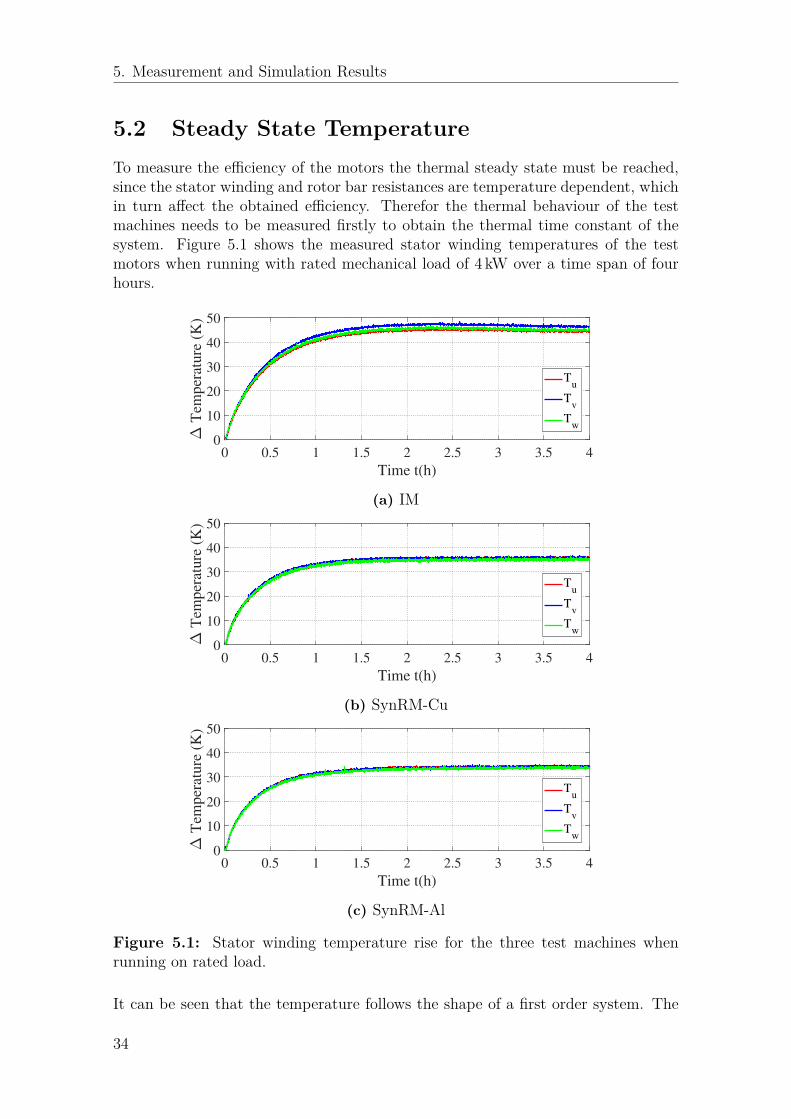
5.2 Steady State TemperatureTo measure the efficiency of the motors the thermal steady state must be reached,since the stator winding and rotor bar resistances are temperature dependent, whichin turn affect the obtained efficiency. Therefor the thermal behaviour of the testmachines needs to be measured firstly to obtain the thermal time constant of thesystem. Figure 5.1 shows the measured stator winding temperatures of the testmotors when running with rated mechanical load of 4 kW over a time span of fourhours.
0 0.5 1 1.5 2 2.5 3 3.5 4
Time t(h)
0
10
20
30
40
50
Tem
per
ature
(K
)
Tu
Tv
Tw
(a) IM
0 0.5 1 1.5 2 2.5 3 3.5 4
Time t(h)
0
10
20
30
40
50
Tem
per
ature
(K
)
Tu
Tv
Tw
(b) SynRM-Cu
0 0.5 1 1.5 2 2.5 3 3.5 4
Time t(h)
0
10
20
30
40
50
Tem
per
ature
(K
)
Tu
Tv
Tw
(c) SynRM-Al
Figure 5.1: Stator winding temperature rise for the three test machines whenrunning on rated load.
It can be seen that the temperature follows the shape of a first order system. The
34
5. Measurement and Simulation Results
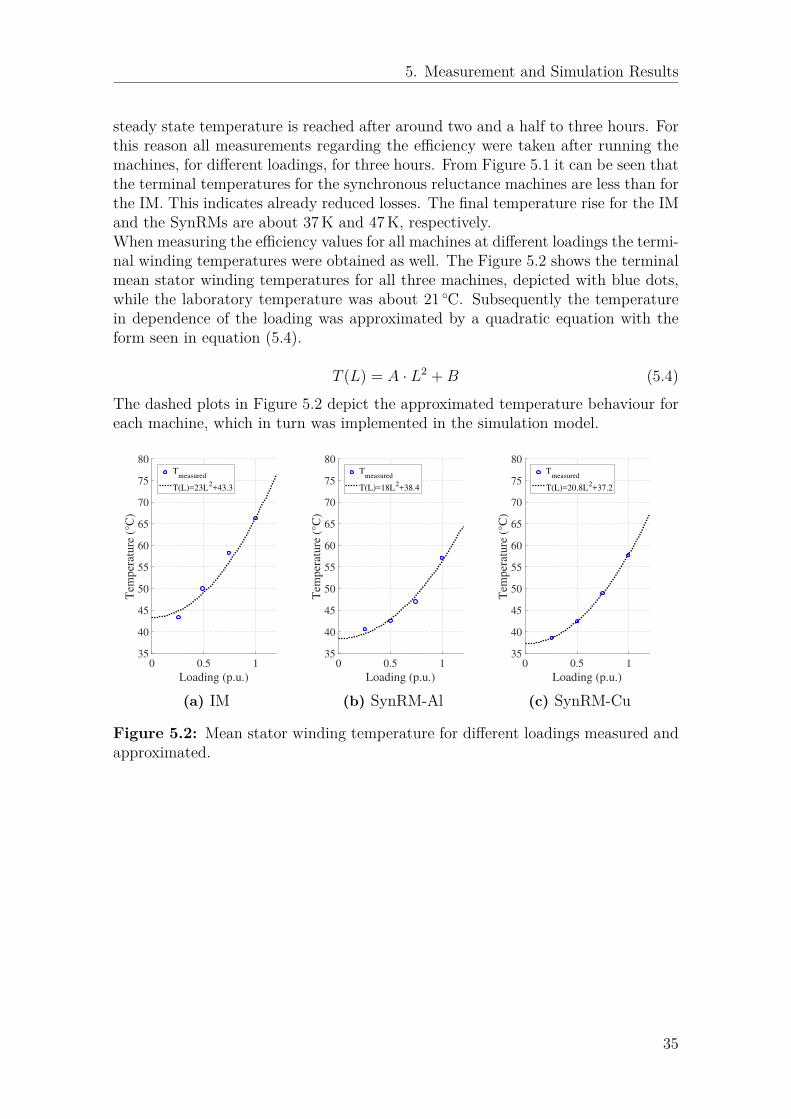
steady state temperature is reached after around two and a half to three hours. Forthis reason all measurements regarding the efficiency were taken after running themachines, for different loadings, for three hours. From Figure 5.1 it can be seen thatthe terminal temperatures for the synchronous reluctance machines are less than forthe IM. This indicates already reduced losses. The final temperature rise for the IMand the SynRMs are about 37 K and 47 K, respectively.When measuring the efficiency values for all machines at different loadings the termi-nal winding temperatures were obtained as well. The Figure 5.2 shows the terminalmean stator winding temperatures for all three machines, depicted with blue dots,while the laboratory temperature was about 21 C. Subsequently the temperaturein dependence of the loading was approximated by a quadratic equation with theform seen in equation (5.4).
T (L) = A · L2 +B (5.4)
The dashed plots in Figure 5.2 depict the approximated temperature behaviour foreach machine, which in turn was implemented in the simulation model.
0 0.5 1
Loading (p.u.)
35
40
45
50
55
60
65
70
75
80
Tem
per
ature
(°C
)
Tmeasured
T(L)=23L2+43.3
(a) IM
0 0.5 1
Loading (p.u.)
35
40
45
50
55
60
65
70
75
80
Tem
per
ature
(°C
)
Tmeasured
T(L)=18L2+38.4
(b) SynRM-Al
0 0.5 1
Loading (p.u.)
35
40
45
50
55
60
65
70
75
80
Tem
per
ature
(°C
)
Tmeasured
T(L)=20.8L2+37.2
(c) SynRM-Cu
Figure 5.2: Mean stator winding temperature for different loadings measured andapproximated.
35
5. Measurement and Simulation Results
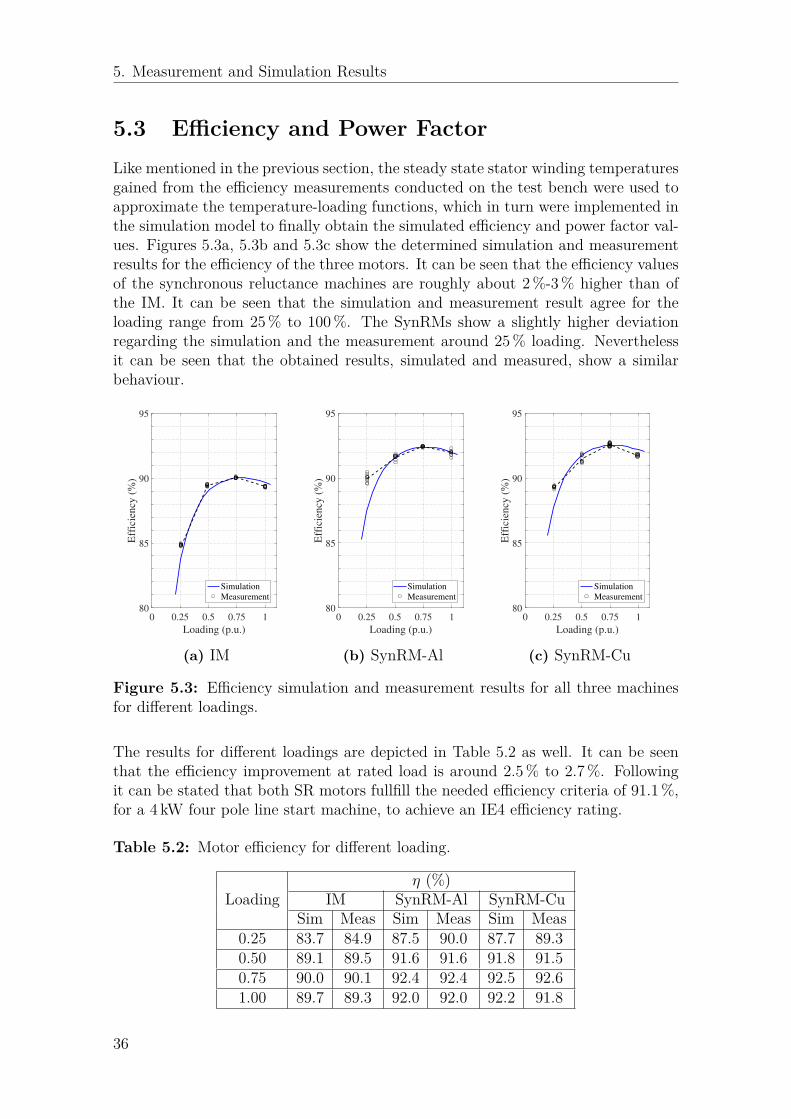
5.3 Efficiency and Power FactorLike mentioned in the previous section, the steady state stator winding temperaturesgained from the efficiency measurements conducted on the test bench were used toapproximate the temperature-loading functions, which in turn were implemented inthe simulation model to finally obtain the simulated efficiency and power factor val-ues. Figures 5.3a, 5.3b and 5.3c show the determined simulation and measurementresults for the efficiency of the three motors. It can be seen that the efficiency valuesof the synchronous reluctance machines are roughly about 2 %-3 % higher than ofthe IM. It can be seen that the simulation and measurement result agree for theloading range from 25 % to 100 %. The SynRMs show a slightly higher deviationregarding the simulation and the measurement around 25 % loading. Neverthelessit can be seen that the obtained results, simulated and measured, show a similarbehaviour.
0 0.25 0.5 0.75 1
Loading (p.u.)
80
85
90
95
Eff
icie
ncy
(%
)
Simulation
Measurement
(a) IM
0 0.25 0.5 0.75 1
Loading (p.u.)
80
85
90
95
Eff
icie
ncy
(%
)
Simulation
Measurement
(b) SynRM-Al
0 0.25 0.5 0.75 1
Loading (p.u.)
80
85
90
95
Eff
icie
ncy
(%
)
Simulation
Measurement
(c) SynRM-Cu
Figure 5.3: Efficiency simulation and measurement results for all three machinesfor different loadings.
The results for different loadings are depicted in Table 5.2 as well. It can be seenthat the efficiency improvement at rated load is around 2.5 % to 2.7 %. Followingit can be stated that both SR motors fullfill the needed efficiency criteria of 91.1 %,for a 4 kW four pole line start machine, to achieve an IE4 efficiency rating.
Table 5.2: Motor efficiency for different loading.
Loadingη (%)
IM SynRM-Al SynRM-CuSim Meas Sim Meas Sim Meas
0.25 83.7 84.9 87.5 90.0 87.7 89.30.50 89.1 89.5 91.6 91.6 91.8 91.50.75 90.0 90.1 92.4 92.4 92.5 92.61.00 89.7 89.3 92.0 92.0 92.2 91.8
36
5. Measurement and Simulation Results
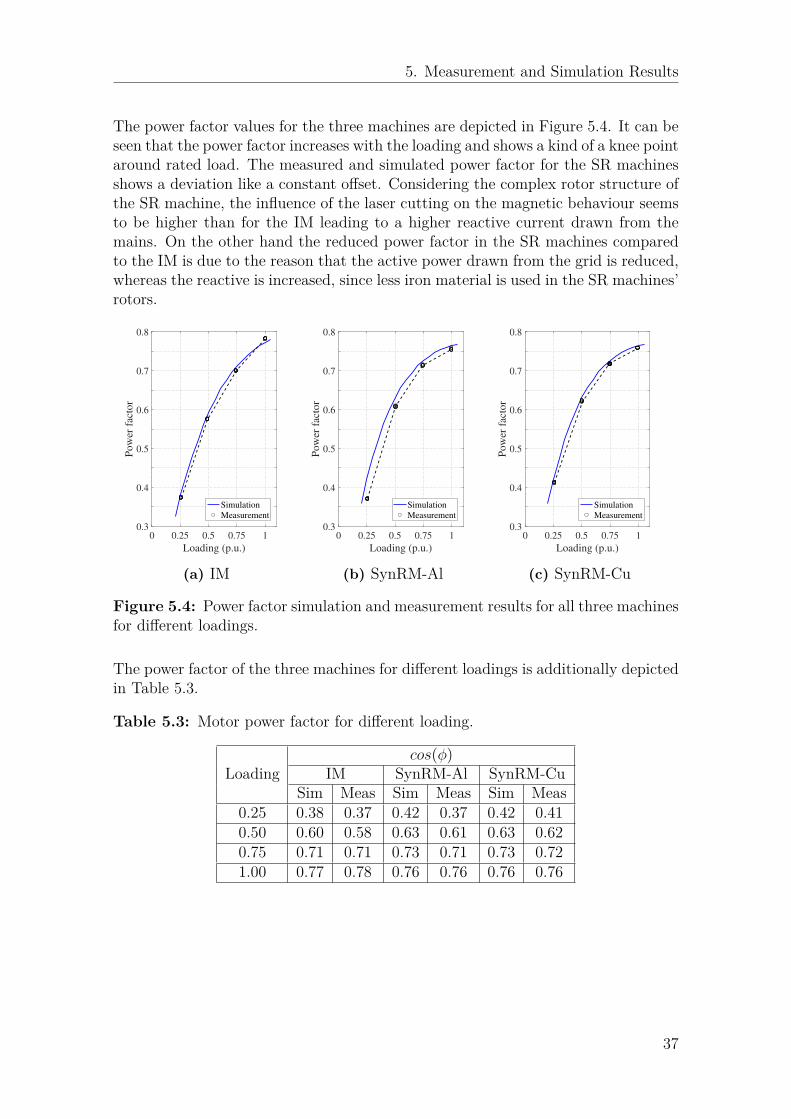
The power factor values for the three machines are depicted in Figure 5.4. It can beseen that the power factor increases with the loading and shows a kind of a knee pointaround rated load. The measured and simulated power factor for the SR machinesshows a deviation like a constant offset. Considering the complex rotor structure ofthe SR machine, the influence of the laser cutting on the magnetic behaviour seemsto be higher than for the IM leading to a higher reactive current drawn from themains. On the other hand the reduced power factor in the SR machines comparedto the IM is due to the reason that the active power drawn from the grid is reduced,whereas the reactive is increased, since less iron material is used in the SR machines’rotors.
0 0.25 0.5 0.75 1
Loading (p.u.)
0.3
0.4
0.5
0.6
0.7
0.8
Pow
er f
acto
r
Simulation
Measurement
(a) IM
0 0.25 0.5 0.75 1
Loading (p.u.)
0.3
0.4
0.5
0.6
0.7
0.8
Pow
er f
acto
r
Simulation
Measurement
(b) SynRM-Al
0 0.25 0.5 0.75 1
Loading (p.u.)
0.3
0.4
0.5
0.6
0.7
0.8
Pow
er f
acto
rSimulation
Measurement
(c) SynRM-Cu
Figure 5.4: Power factor simulation and measurement results for all three machinesfor different loadings.
The power factor of the three machines for different loadings is additionally depictedin Table 5.3.
Table 5.3: Motor power factor for different loading.
Loadingcos(φ)
IM SynRM-Al SynRM-CuSim Meas Sim Meas Sim Meas
0.25 0.38 0.37 0.42 0.37 0.42 0.410.50 0.60 0.58 0.63 0.61 0.63 0.620.75 0.71 0.71 0.73 0.71 0.73 0.721.00 0.77 0.78 0.76 0.76 0.76 0.76
37
5. Measurement and Simulation Results
5.4 Inertia
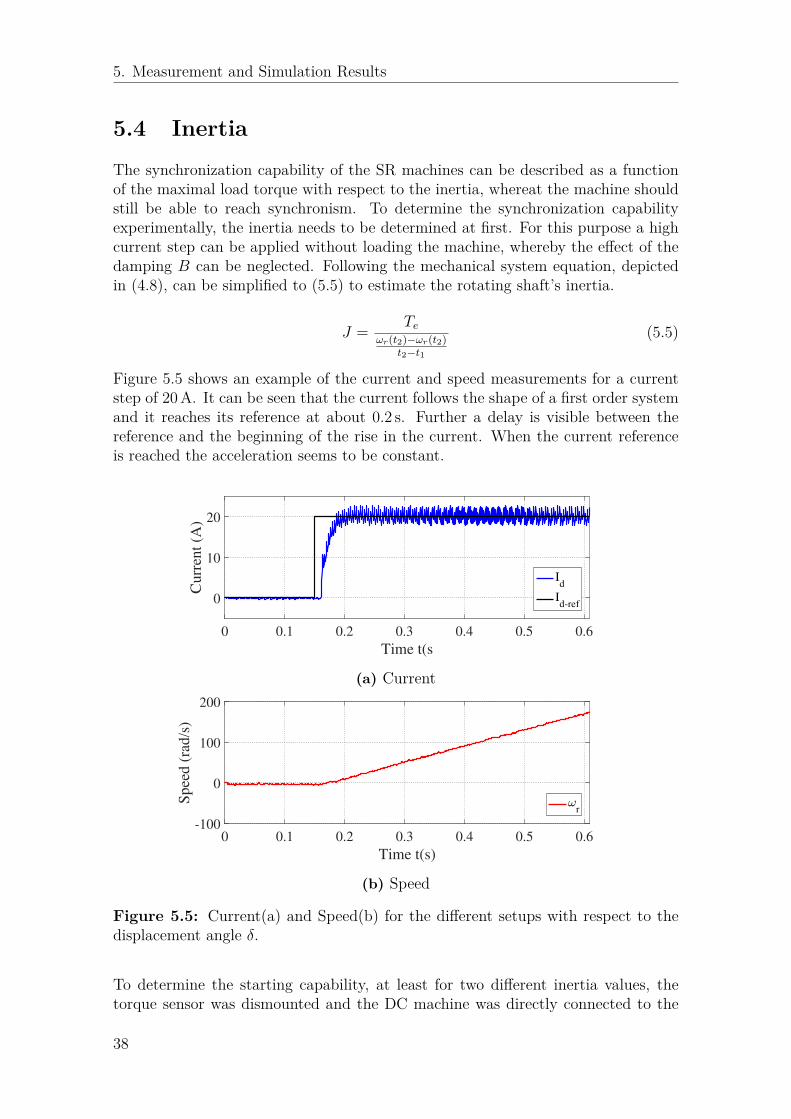
The synchronization capability of the SR machines can be described as a functionof the maximal load torque with respect to the inertia, whereat the machine shouldstill be able to reach synchronism. To determine the synchronization capabilityexperimentally, the inertia needs to be determined at first. For this purpose a highcurrent step can be applied without loading the machine, whereby the effect of thedamping B can be neglected. Following the mechanical system equation, depictedin (4.8), can be simplified to (5.5) to estimate the rotating shaft’s inertia.
J = Teωr(t2)−ωr(t2)
t2−t1
(5.5)
Figure 5.5 shows an example of the current and speed measurements for a currentstep of 20 A. It can be seen that the current follows the shape of a first order systemand it reaches its reference at about 0.2 s. Further a delay is visible between thereference and the beginning of the rise in the current. When the current referenceis reached the acceleration seems to be constant.
0 0.1 0.2 0.3 0.4 0.5 0.6
Time t(s
0
10
20
Curr
ent
(A)
Id
Id-ref
(a) Current
0 0.1 0.2 0.3 0.4 0.5 0.6
Time t(s)
-100
0
100
200
Spee
d (
rad/s
)
r
(b) Speed
Figure 5.5: Current(a) and Speed(b) for the different setups with respect to thedisplacement angle δ.
To determine the starting capability, at least for two different inertia values, thetorque sensor was dismounted and the DC machine was directly connected to the
38
5. Measurement and Simulation Results
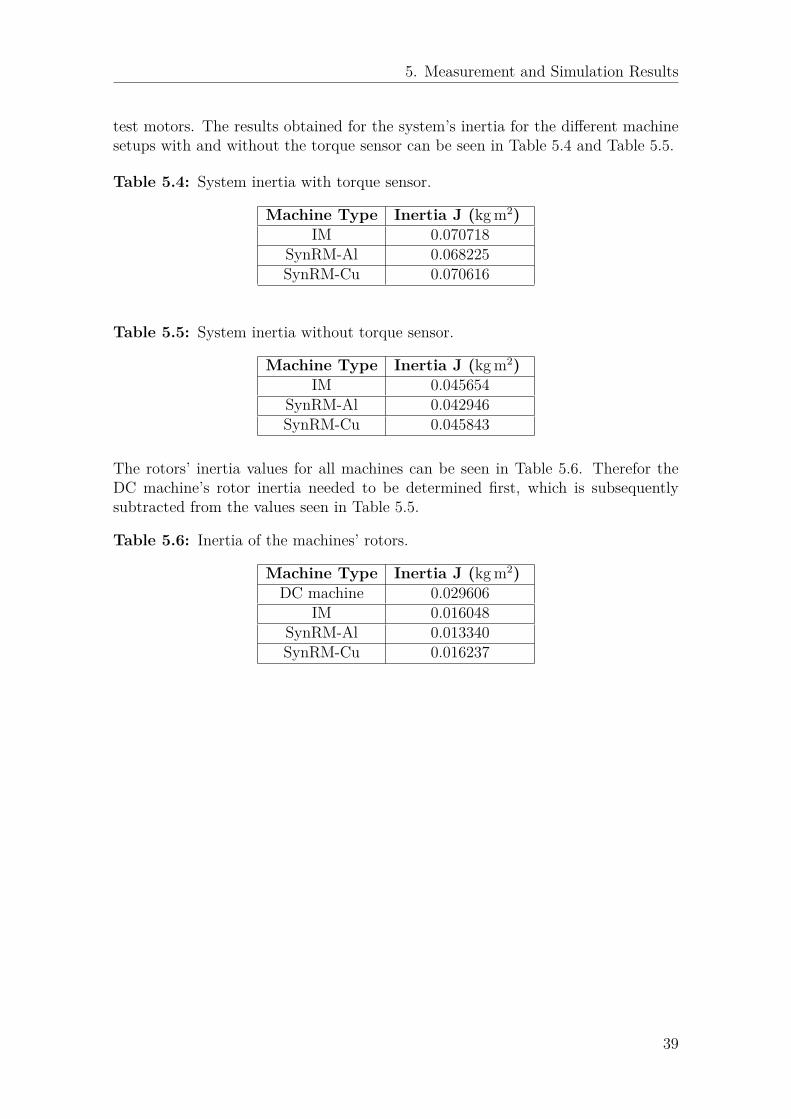
test motors. The results obtained for the system’s inertia for the different machinesetups with and without the torque sensor can be seen in Table 5.4 and Table 5.5.
Table 5.4: System inertia with torque sensor.
Machine Type Inertia J (kg m2)IM 0.070718
SynRM-Al 0.068225SynRM-Cu 0.070616
Table 5.5: System inertia without torque sensor.
Machine Type Inertia J (kg m2)IM 0.045654
SynRM-Al 0.042946SynRM-Cu 0.045843
The rotors’ inertia values for all machines can be seen in Table 5.6. Therefor theDC machine’s rotor inertia needed to be determined first, which is subsequentlysubtracted from the values seen in Table 5.5.
Table 5.6: Inertia of the machines’ rotors.
Machine Type Inertia J (kg m2)DC machine 0.029606
IM 0.016048SynRM-Al 0.013340SynRM-Cu 0.016237
39
5. Measurement and Simulation Results
5.5 Synchronization CapabilityWithin this section the starting performance results of the IM and the synchroniza-tion capability results of the SR machines are presented.
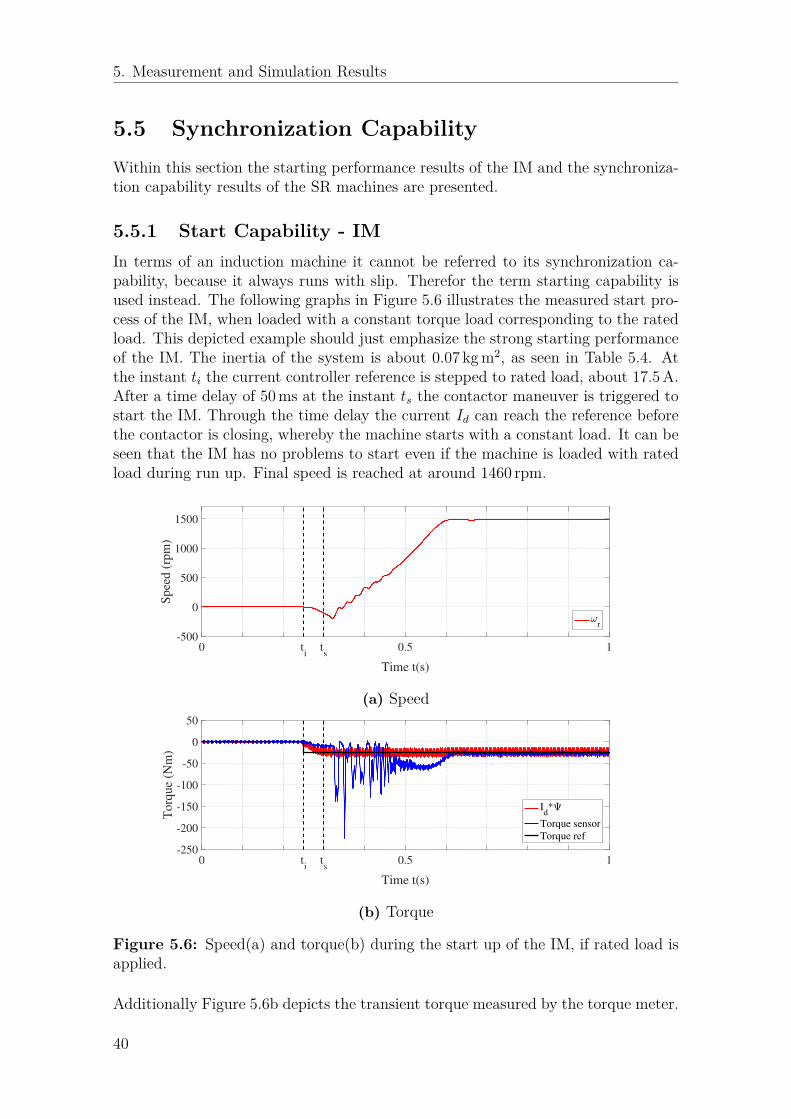
5.5.1 Start Capability - IMIn terms of an induction machine it cannot be referred to its synchronization ca-pability, because it always runs with slip. Therefor the term starting capability isused instead. The following graphs in Figure 5.6 illustrates the measured start pro-cess of the IM, when loaded with a constant torque load corresponding to the ratedload. This depicted example should just emphasize the strong starting performanceof the IM. The inertia of the system is about 0.07 kg m2, as seen in Table 5.4. Atthe instant ti the current controller reference is stepped to rated load, about 17.5 A.After a time delay of 50 ms at the instant ts the contactor maneuver is triggered tostart the IM. Through the time delay the current Id can reach the reference beforethe contactor is closing, whereby the machine starts with a constant load. It can beseen that the IM has no problems to start even if the machine is loaded with ratedload during run up. Final speed is reached at around 1460 rpm.
0 ti
ts
0.5 1
Time t(s)
-500
0
500
1000
1500
Spee
d (
rpm
)
r
(a) Speed
0 ti
ts
0.5 1
Time t(s)
-250
-200
-150
-100
-50
0
50
Torq
ue
(Nm
)
Id*
Torque sensor
Torque ref
(b) Torque
Figure 5.6: Speed(a) and torque(b) during the start up of the IM, if rated load isapplied.
Additionally Figure 5.6b depicts the transient torque measured by the torque meter.
40
5. Measurement and Simulation Results
Due to this typically high torque transient it was not possible to use a torque sensorwith a lower torque limit, which in turn would have had a higher measurementaccuracy and could have been used for the efficiency determination. Nonetheless itis seen that the IM has no difficulties to start with a high inertia and rated loadtorque, which indicates the strong starting capability of the IM.
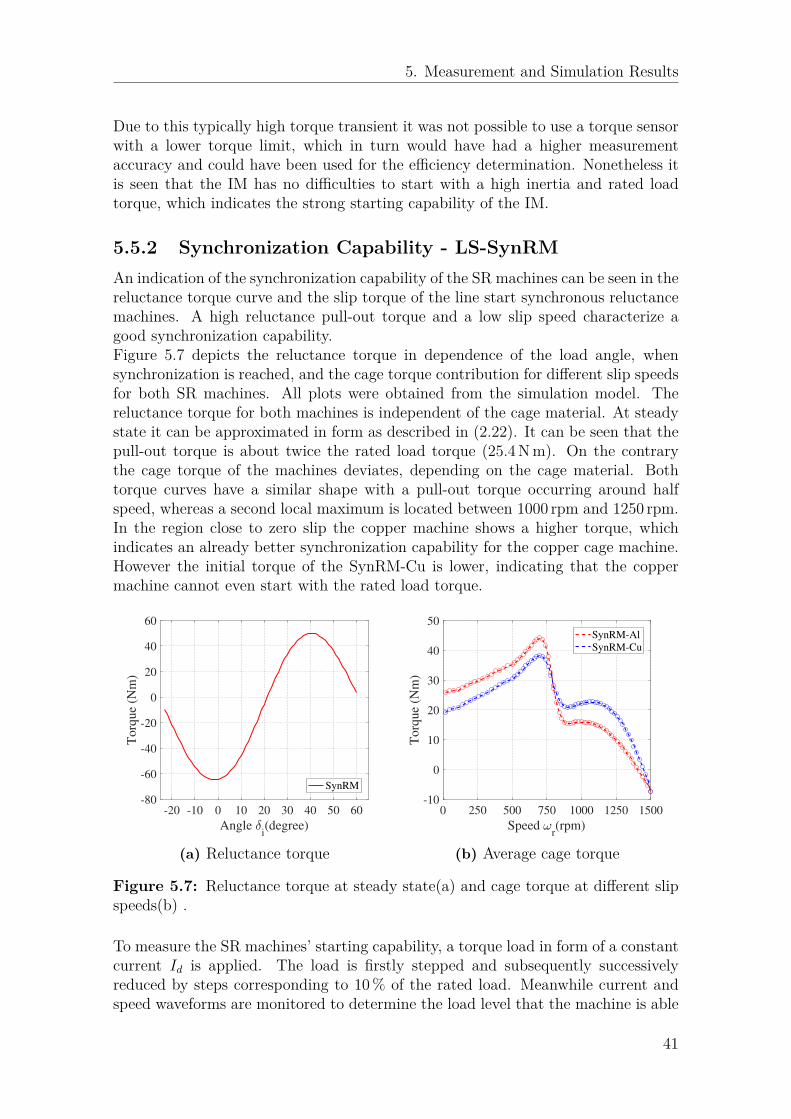
5.5.2 Synchronization Capability - LS-SynRMAn indication of the synchronization capability of the SR machines can be seen in thereluctance torque curve and the slip torque of the line start synchronous reluctancemachines. A high reluctance pull-out torque and a low slip speed characterize agood synchronization capability.Figure 5.7 depicts the reluctance torque in dependence of the load angle, whensynchronization is reached, and the cage torque contribution for different slip speedsfor both SR machines. All plots were obtained from the simulation model. Thereluctance torque for both machines is independent of the cage material. At steadystate it can be approximated in form as described in (2.22). It can be seen that thepull-out torque is about twice the rated load torque (25.4 N m). On the contrarythe cage torque of the machines deviates, depending on the cage material. Bothtorque curves have a similar shape with a pull-out torque occurring around halfspeed, whereas a second local maximum is located between 1000 rpm and 1250 rpm.In the region close to zero slip the copper machine shows a higher torque, whichindicates an already better synchronization capability for the copper cage machine.However the initial torque of the SynRM-Cu is lower, indicating that the coppermachine cannot even start with the rated load torque.
-20 -10 0 10 20 30 40 50 60
Angle i(degree)
-80
-60
-40
-20
0
20
40
60
To
rqu
e (N
m)
SynRM
(a) Reluctance torque
0 250 500 750 1000 1250 1500
Speed r(rpm)
-10
0
10
20
30
40
50
Torq
ue
(Nm
)
SynRM-Al
SynRM-Cu
(b) Average cage torque
Figure 5.7: Reluctance torque at steady state(a) and cage torque at different slipspeeds(b) .
To measure the SR machines’ starting capability, a torque load in form of a constantcurrent Id is applied. The load is firstly stepped and subsequently successivelyreduced by steps corresponding to 10 % of the rated load. Meanwhile current andspeed waveforms are monitored to determine the load level that the machine is able
41
5. Measurement and Simulation Results
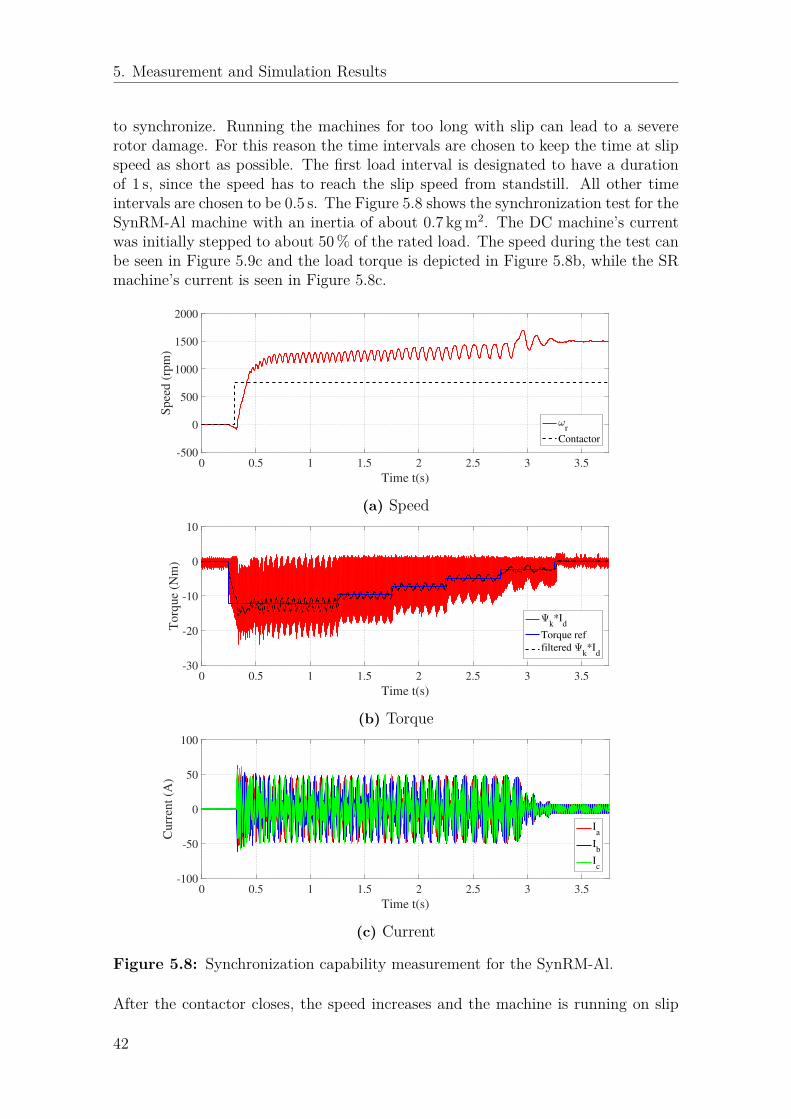
to synchronize. Running the machines for too long with slip can lead to a severerotor damage. For this reason the time intervals are chosen to keep the time at slipspeed as short as possible. The first load interval is designated to have a durationof 1 s, since the speed has to reach the slip speed from standstill. All other timeintervals are chosen to be 0.5 s. The Figure 5.8 shows the synchronization test for theSynRM-Al machine with an inertia of about 0.7 kg m2. The DC machine’s currentwas initially stepped to about 50 % of the rated load. The speed during the test canbe seen in Figure 5.9c and the load torque is depicted in Figure 5.8b, while the SRmachine’s current is seen in Figure 5.8c.
0 0.5 1 1.5 2 2.5 3 3.5
Time t(s)
-500
0
500
1000
1500
2000
Sp
eed
(rp
m)
r
Contactor
(a) Speed
0 0.5 1 1.5 2 2.5 3 3.5
Time t(s)
-30
-20
-10
0
10
To
rqu
e (N
m)
k*I
d
Torque ref
filtered k*I
d
(b) Torque
0 0.5 1 1.5 2 2.5 3 3.5
Time t(s)
-100
-50
0
50
100
Curr
ent
(A)
Ia
Ib
Ic
(c) Current
Figure 5.8: Synchronization capability measurement for the SynRM-Al.
After the contactor closes, the speed increases and the machine is running on slip
42
5. Measurement and Simulation Results
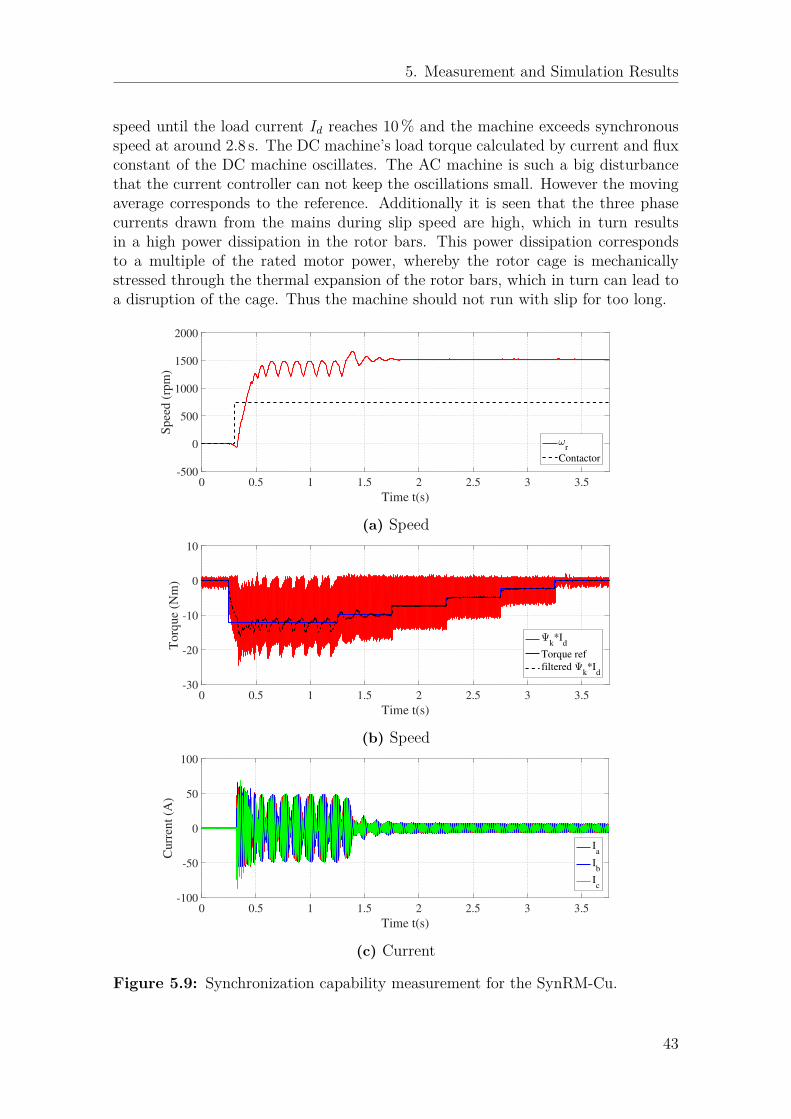
speed until the load current Id reaches 10 % and the machine exceeds synchronousspeed at around 2.8 s. The DC machine’s load torque calculated by current and fluxconstant of the DC machine oscillates. The AC machine is such a big disturbancethat the current controller can not keep the oscillations small. However the movingaverage corresponds to the reference. Additionally it is seen that the three phasecurrents drawn from the mains during slip speed are high, which in turn resultsin a high power dissipation in the rotor bars. This power dissipation correspondsto a multiple of the rated motor power, whereby the rotor cage is mechanicallystressed through the thermal expansion of the rotor bars, which in turn can lead toa disruption of the cage. Thus the machine should not run with slip for too long.
0 0.5 1 1.5 2 2.5 3 3.5
Time t(s)
-500
0
500
1000
1500
2000
Spee
d (
rpm
)
r
Contactor
(a) Speed
0 0.5 1 1.5 2 2.5 3 3.5
Time t(s)
-30
-20
-10
0
10
Torq
ue
(Nm
)
k*I
d
Torque ref
filtered k*I
d
(b) Speed
0 0.5 1 1.5 2 2.5 3 3.5
Time t(s)
-100
-50
0
50
100
Cu
rren
t (A
)
Ia
Ib
Ic
(c) Current
Figure 5.9: Synchronization capability measurement for the SynRM-Cu.
43
5. Measurement and Simulation Results
Subsequently the same procedure is repeated for the SynRM-Cu and can be seen inFigure 5.9. Compared to the SynRM-Al synchronization is reached at about 40 %load level. Additionally the synchronization capability was measured for both ma-chines with a reduced inertia excluding the torque sensor.The final results of the synchronization capability can be seen in Figure 5.10. Thedepicted load torque takes here the damping B into account. In the graphs the sim-ulated boundary is depicted in blue. The system is just able to reach synchronism,if a combination of inertia and start torque below the blue curve is applied. Themeasured values are marked with a black "x" for an unsuccessful and with a black"o" for a successful synchronization. It can be seen that the measurements complywith the simulations.
0 1 2 3 4 5 6 7 8 9
Inertia J/Jrotor
0
0.1
0.2
0.3
0.4
0.5
0.6
0.7
0.8
To
rqu
e (p
.u.)
Boundary
Synchronization
Fail-attempt
(a) SynRM-Al
0 1 2 3 4 5 6 7 8 9
Inertia J/Jrotor
0
0.1
0.2
0.3
0.4
0.5
0.6
0.7
0.8
To
rqu
e (p
.u.)
Boundary
Synchronization
Fail-attempt
(b) SynRM-Cu
Figure 5.10: Synchronization capability of the SR machines.
Nevertheless it is seen that both machines are not able to synchronize, if startedunder rated load conditions. The maximum load torque, ensuring a successful syn-chronization for the SynRM-Al and the SynRM-Cu occurs, if the load inertia istechnically zero corresponding to about 45 % and 70 % of the rated load torque,respectively. Subsequently the synchronization capability is decreasing with respectto the load inertia. The depicted behavior shows that the synchronization capabilityof the SR machines is poor. Considering the starting behaviour, the SR machinescannot compete with the IM.Regarding the pull-out torque of the SR machines, it was not possible to measurethis, since the rated torque of the DC machine was just about 30 N m, which is farless than the simulated pull-out torque seen in Figure 5.7a.
44
6Conclusion
Within the frame of this thesis the line start synchronous reluctance machines andthe benchmark induction machine were tested regarding the efficiency, power factorand starting capability. For the tests a simulation model, built in the FEM softwareANSYS Maxwell, was used and a test bench setup for the first prototypes and thebenchmark product were concluded.It can be said that the simulation results complied with the obtained measurements.The simulation models give a good prediction of the actual motor behaviour regard-ing efficiency, power factor and starting capability. It can be used for further testcases and design adaptions regarding the rotor geometry.Regarding the reluctance machines a reduction of the motor losses about up to27.6 % at rated load, compared to the induction machine, was achieved. On theopposite the power factor of the SR machines was slightly less than compared tothe IM. Regarding the power factor the simulation model had a small discrepancyreferring to the SR machines. The influence of the cutting effect on the magneticproperties of the steel sheets was taken into account for all three machines in asimilar manner. However the rotor structure of the SR machines is more complexand contains more cut edges, which in turn explains the deviation of the simulationresults compared to the measurements.The starting capability of the induction machine is independent of the load inertia,considering reasonable inertia values. The inertia just influences the time reachingfinal slip speed, but the final slip speed is solely dependent on the load torque. Thestrong starting capability is one of the major advantages of the IM compared tothe prototype SR machines. When starting the SR machines, synchronism must bereached to avoid high losses in the rotor bars, which in turn can destroy the machine.However it was seen that the synchronisation capability of the SR machines is justacceptable for low load inertia values and a small load torque. The copper cage,comprising a lower rotor resistance, had a better synchronization capability thanthe aluminum cage machine. Nevertheless the range of possible applications of theSR machines is quite limited compared to the IM.Some reasonable applications could be low inertia drives or applications, where theSR machines can be started under no load condition, like for example in an unloadedconveyor belt, a fan with a pitchable impeller or a pump with a throttle valve.
45

6. Conclusion
46

7Discussion and Future Work
From the the results it was seen that the efficiency enhancement of the SR machinesresulted theoretically in a higher efficiency rating. However the starting capabilitywas poor. The SR machines are not able to synchronize with a high load inertia orif fully loaded during start up.However as part of a future work the start performance for a quadratic load shouldbe determined, which is typical for the majority of industrial applications. Further-more the SR machines should be tested in actual application environments.Within the frame of the thesis the improvement of the stator design was not con-sidered. The relatively high stator resistance has a significant influence on thesynchronization capability. Regarding the design, a shortening of the SR machines’length and an increase in the frame size could result in a better synchronizationcapability. If the number of stator winding turns is kept, the stator resistance andthe rotor resistance would be decreased. Thereby the cage torque would contributeto a slip speed closer to synchronism. Hereby also the magnetizing inductance wouldbe decreased, but it was seen that there was still a margin of the reluctance pull-outtorque with respect to the nominal load torque.Further the cage design should be optimized to achieve symmetrical rotor resistancesin dq-quantities. Additionally a rotor skewing should be applied and ferrite magnetscould be inserted to achieve a better power factor, and following a better efficiency.
7.1 Sustainability and Ethical AspectsWithin the frame of the thesis it was shown how the efficiency of a common induc-tion machine can be easily improved by a rotor adaption. This line start reluctanceprinciple could be applied to various kinds of induction machines, whereby the effi-ciency enhancement would lead to less consumed electrical energy and following lessCO2 emissions, assuming the energy is produced by oil, coal or natural gas. Anotheradvantage of the machine is its robustness, since it does not need any brushes. Theassistance by permanent magnets could lead to a better power factor and a betterefficiency rating. Hereby just ferrite magnets should be used, because the assess-ment of a sustainable product should also consider the materials used in it, howthose are mined and further processed, the conditions for the labors and the overallinfluence on the environment. Within the design of the SR machines the use of rareearth materials was deliberately avoided due to several ethical reasons, which arediscussed in the subsequent section.

7. Discussion and Future Work
7.1.1 Rare Earth MaterialsNowadays rare earth materials are frequently used in electrical machines and elec-tronic devices. Especially in the field of electric machines a multiple times higherpower density, compared to the usage of ferrite magnets, can be achieved. In thiscontext Neodym and Samarium Cobalt belong to the most common types used forelectrical machinery in supposedly green technologies as in hybrid vehicles or windpower plant generators.Nevertheless the mining for these materials take a lot of effort and causes often atremendous ecological damage, if the necessary environmental precautions are nottaken properly. Commonly rare earth materials can be found as a by-product whenmining for iron. The iron oar contains small amounts of different rare earth mate-rials, which needs to be separated. This preparation takes a lot of effort, wherebytoxic chemicals and acids are used. Furthermore radioactive material like Thoriumneeds to be separated as well.The major exporter in the world is the country China, where the needed environ-mental precautions are not fullfilled. The toxic waste in form of sludge is often justdrained in big mud tanks under open sky. Thereby the chemicals and acids getinto to groundwater affecting the entire region surrounding the mine. Following thegroundwater cannot be used anymore for farming. Studies in the field of the miningof rare earth material show high cancer risks for the labors that are directly involvedin the preparation of the rare earth materials.The prices for rare earth materials have dropped for the past 5 years, whereby thesebecame more popular for electrical applications. However this low price can only besustained by the poor labor conditions and the disregard of toxic waste treatment.From an ethical and sustainable perspective these factors need to be taken intoaccount as well. Hereby the question arouses: Do the technical advantages usingrare earth materials in electrical devices outweigh the ecological and social damagecaused by the mining?[15]
48
Bibliography
[1] Fredrik Hedenus, Martin Persson, and Frances Sprei, Sustainable development.history, denition & the role of the engineer. 2015.
[2] Daniel Pehrman and Mathias Jones, “Start capability of industrial synchronousmotor with high efficiency”, Master’s Thesis in Electric Power Engineering,Chalmers University of Technology, Göteborg, 2014.
[3] European Parliament, Commission regulation (ec) no 640/2009, 22 July 2009.[4] European Parliament, Commission regulation (eu) no 4/2014, 6 January 2014.[5] Reza Rajabi Moghaddam, “Synchronous reluctance machine (synrm) in vari-
able speed drives (vsd) applications”, PhD Thesis, The Royal Institue of Tech-nology, KTH, Stockholm, May 2011.
[6] J.M. Stephenson and P.J. Lawrenson, “Average synchronous torque of syn-chronous machines, with particular reference to reluctance machines”, Proc.IEE Vol. 116, No 1969 June, University of Leeds, Leeds, December 1968.
[7] M. Gamba, G. Pellegrino, A. Vagati, and F. Villata, “Design of a line-start syn-chronous reluctance motor”, Electrical Machines & Drives Conference (IEMDC),2013 IEEE International, 2013.
[8] Harold L. Garbarino: Eric T.B. Gross, “The georges phenomenon - induc-tion motors with unbalanced rotor impedances”, AIEE Transactions RotatingMachinery, Illinois Institute of Technology, Chicago, August 1950.
[9] P.J. Lawrenson and M. Mathur, “Pull-in criterion for reluctance motors”, Proc.IEE, Vol.120,No 9, September 1973, University of Leeds, Leeds, January 1969.
[10] Sheikh F. Rabbi and M. Azizur Rahman, “Critical criteria for successful syn-chronization of line start-ipm motors”, IEEE Journal of emerging and selectedtopics in power electronics ,Vol. 2, No 2, June 2014, pp.348-358, University ofNewfoundland, St. Johns, December 2013.
[11] Estimation of pump moment of inertia – neutrium, 2013. [Online]. Available:https://neutrium.net/equipment/estimation- of- pump- moment- of-inertia/ (visited on 05/01/2017).
[12] CIRCUTOR, Slot harmonics in power generation systems. [Online]. Avail-able: http://circutor.com/en/documentation/articles/3119- slot-harmonics-in-power-generation-systems (visited on 05/08/2017).
49

Bibliography
[13] K.Bourchas, A.Stening, J. Soulard, A. Broddfalk,M. Lindenmo, M. Dahlén, F.Gyllensten, “Influence of cutting and welding on magnetic properties of elec-trical steel”, Electrical Machines (ICEM),2016 XXII International Conference,4.-7 September 2016.
[14] Yujing Liu, Kashif S.K., Sohail A. M., “Engineering considerations on addi-tional iron losses due to rotational fields and sheet cutting”, 18th InternationalConference on electrical Machines, 6-9 Sept. 2008.
[15] ARD, Schattenseite der windräder: Das schmutzige geheimnis sauberer win-dräder, TV series Panorama, (broadcasted on 4/28/2011).
50
Recommended