Elmos Interim Report July 1 − September 30, 2013 | 1
Interim Report Q3 2013
360° Elmos
2
3rd quarter 9 months
in million Euro or percent unless otherwise indicated
7/1 – 9/30/2013
7/1 – 9/30/20121 Change
1/1 – 9/30/2013
1/1 – 9/30/20121 Change
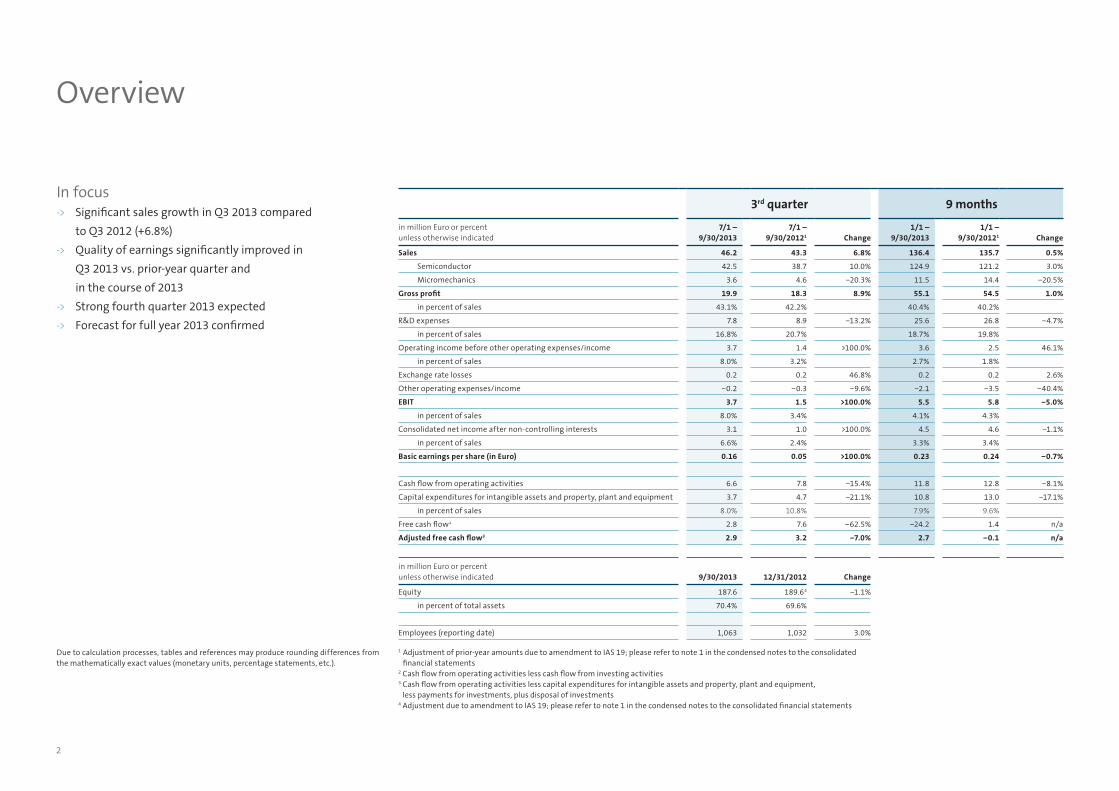
Sales 46.2 43.3 6.8% 136.4 135.7 0.5%
Semiconductor 42.5 38.7 10.0% 124.9 121.2 3.0%
Micromechanics 3.6 4.6 −20.3% 11.5 14.4 −20.5%
Gross profit 19.9 18.3 8.9% 55.1 54.5 1.0%
in percent of sales 43.1% 42.2% 40.4% 40.2%
R&D expenses 7.8 8.9 −13.2% 25.6 26.8 −4.7%
in percent of sales 16.8% 20.7% 18.7% 19.8%
Operating income before other operating expenses/income 3.7 1.4 >100.0% 3.6 2.5 46.1%
in percent of sales 8.0% 3.2% 2.7% 1.8%
Exchange rate losses 0.2 0.2 46.8% 0.2 0.2 2.6%
Other operating expenses/income −0.2 −0.3 −9.6% −2.1 −3.5 −40.4%
EBIT 3.7 1.5 >100.0% 5.5 5.8 −5.0%
in percent of sales 8.0% 3.4% 4.1% 4.3%
Consolidated net income after non-controlling interests 3.1 1.0 >100.0% 4.5 4.6 −1.1%
in percent of sales 6.6% 2.4% 3.3% 3.4%
Basic earnings per share (in Euro) 0.16 0.05 >100.0% 0.23 0.24 −0.7%
Cash flow from operating activities 6.6 7.8 −15.4% 11.8 12.8 −8.1%
Capital expenditures for intangible assets and property, plant and equipment 3.7 4.7 −21.1% 10.8 13.0 −17.1%
in percent of sales 8.0% 10.8% 7.9% 9.6%
Free cash flow2 2.8 7.6 −62.5% −24.2 1.4 n/a
Adjusted free cash flow3 2.9 3.2 −7.0% 2.7 −0.1 n/a
in million Euro or percent unless otherwise indicated 9/30/2013 12/31/2012 Change
Equity 187.6 189.64 −1.1%
in percent of total assets 70.4% 69.6% 70,1%
Employees (reporting date) 1,063 1,032 3.0%
1 Adjustment of prior-year amounts due to amendment to IAS 19; please refer to note 1 in the condensed notes to the consolidated financial statements2 Cash flow from operating activities less cash flow from investing activities3 Cash flow from operating activities less capital expenditures for intangible assets and property, plant and equipment, less payments for investments, plus disposal of investments4 Adjustment due to amendment to IAS 19; please refer to note 1 in the condensed notes to the consolidated financial statements
Overview
In focus -> Significant sales growth in Q3 2013 compared
to Q3 2012 (+6.8%)
-> Quality of earnings significantly improved in
Q3 2013 vs. prior-year quarter and
in the course of 2013
-> Strong fourth quarter 2013 expected
-> Forecast for full year 2013 confirmed
Due to calculation processes, tables and references may produce rounding differences from the mathematically exact values (monetary units, percentage statements, etc.).
Elmos Interim Report July 1 − September 30, 2013 | 3
Course of business Sales development and order situation
Elmos Semiconductor AG generated sales of 136.4 million in
the first nine months of 2013. Sales have thus remained stable
in comparison with the previous year (9M 2012: 135.7 million
Euro). Business continues to be determined strongly by the
precarious European economy.
Sales of the third quarter 2013 were increased by 6.8% to
46.2 million Euro (Q3 2012: 43.3 million Euro). Contrary to
expectations, sales turned out slightly below the preceding
quarter’s level related to the cut-off date (Q2 2013: 47.1 million
Euro).
The trend that combines weak business with European
automotive customers and a pleasant development in Asia is
still determining sales figures of carmakers and their suppliers
Interim group management report
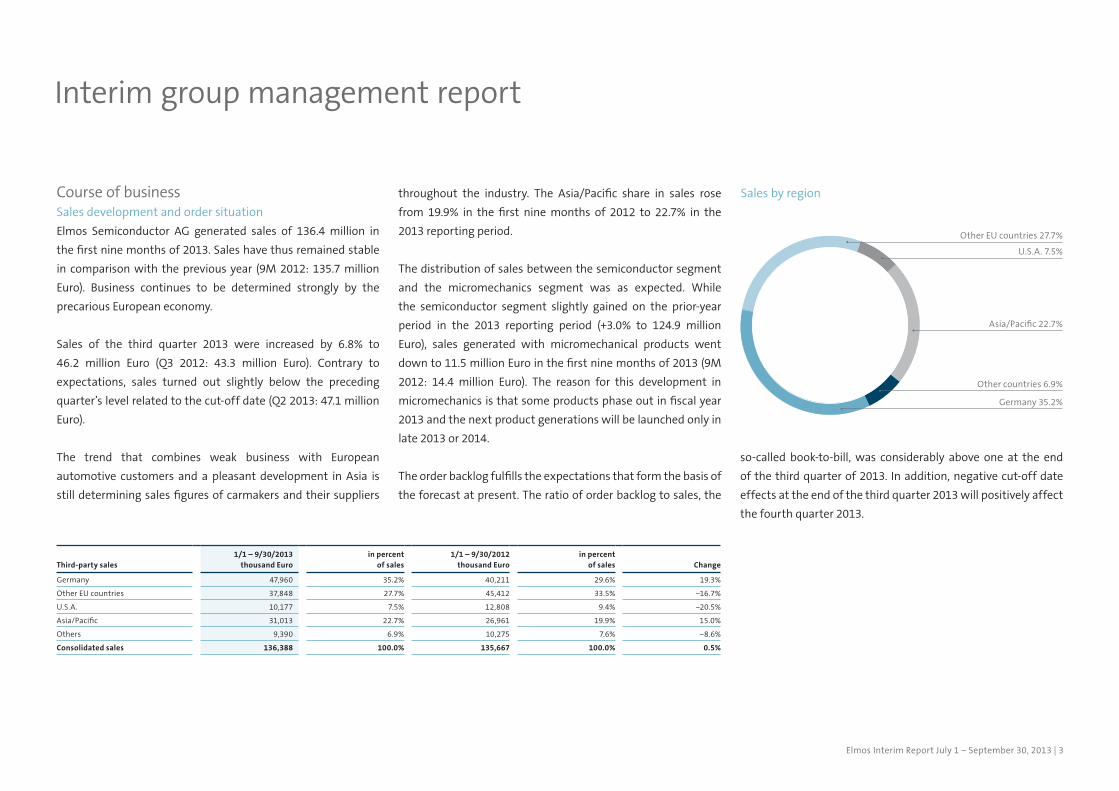
throughout the industry. The Asia/Pacific share in sales rose
from 19.9% in the first nine months of 2012 to 22.7% in the
2013 reporting period.
The distribution of sales between the semiconductor segment
and the micromechanics segment was as expected. While
the semiconductor segment slightly gained on the prior-year
period in the 2013 reporting period (+3.0% to 124.9 million
Euro), sales generated with micromechanical products went
down to 11.5 million Euro in the first nine months of 2013 (9M
2012: 14.4 million Euro). The reason for this development in
micromechanics is that some products phase out in fiscal year
2013 and the next product generations will be launched only in
late 2013 or 2014.
The order backlog fulfills the expectations that form the basis of
the forecast at present. The ratio of order backlog to sales, the
Sales by region
Other EU countries 27.7%
U.S.A. 7.5%
Asia/Pacific 22.7%
Other countries 6.9%
Germany 35.2%
Third-party sales1/1 – 9/30/2013
thousand Euro in percent
of sales1/1 – 9/30/2012
thousand Euro in percent
of sales Change
Germany 47,960 35.2% 40,211 29.6% 19.3%
Other EU countries 37,848 27.7% 45,412 33.5% −16.7%
U.S.A. 10,177 7.5% 12,808 9.4% −20.5%
Asia/Pacific 31,013 22.7% 26,961 19.9% 15.0%
Others 9,390 6.9% 10,275 7.6% −8.6%
Consolidated sales 136,388 100.0% 135,667 100.0% 0.5%
so-called book-to-bill, was considerably above one at the end
of the third quarter of 2013. In addition, negative cut-off date
effects at the end of the third quarter 2013 will positively affect
the fourth quarter 2013.
4
Profit situation, finances and asset situation
The cost of sales remained more or less stable year-over-year
at 81.3 million Euro for the first nine months of 2013 (9M 2012:
81.1 million Euro). Because of essentially unchanged sales, gross
profit and gross margin also changed only insignificantly. The
gross profit reached an amount of 55.1 million Euro in the re-
porting period, compared with 54.5 million Euro recorded for the
first nine months of 2012.
The gross profit for the third quarter of 2013 went up dispropor-
tionately to sales by 8.9% to 19.9 million Euro (Q3 2012: 18.3 mil-
lion Euro) so that the gross margin climbed from 42.2% to 43.1%.
Research and development expenses went down 4.7% to 25.6
million Euro in the first nine months of 2013 (9M 2012: 26.8 mil-
lion Euro). The main reason for this is a higher amount of R&D
subsidies in the third quarter of 2013. The R&D ratio was thus
reduced from 19.8% for the first nine months of 2012 to 18.7%
for the reporting period. Distribution expenses of the first nine
months went up slightly year-over-year from 13.1 million Euro
or 9.7% of sales to 13.6 million Euro or 10.0% of sales. Adminis-
trative expenses of 12.2 million Euro in the first nine months of
2013 remained stable in comparison with the prior-year period
(9M 2012: 12.1 million Euro ).
The slightly higher gross profit and the lower functional costs re-
sulted in an increase of the operating income by 1.1 million Euro
to 3.6 million Euro in the first nine months of 2013 (9M 2012: 2.5
million Euro). Accordingly, the margin climbed from 1.8% in the
first nine months of 2012 to 2.7% in the period under review. A
significant increase of the margin is notable in the course of the
year 2013. While it was still negative in the first quarter 2013 at
–1.5%, it reached a value of 1.2% in the second quarter 2013 and
rose to 8.0% in the third quarter of 2013.
Contrary to the operating income, earnings before interest
and taxes (EBIT) went slightly down in comparison with the
prior-year period. The EBIT came to 5.8 million Euro in the first
nine months of 2012 and to 5.5 million Euro in the reporting
period, equivalent to margins of 4.3% and 4.1% respectively. A
positive development is notable in the course of the year 2013
as well. The lower value as compared with the prior-year period
is essentially accounted for by income from the revaluation of
the old shares in MAZ, included in other operating income of the
prior-year period. The subsidiary’s first-time consolidation in the
second quarter of 2012 resulted in income of 1.8 million Euro.
In addition to the increase of the gross profit, the decrease of op-
erating expenses contributed to another improvement of the
EBIT margin of the third quarter 2013, considerably exceeding
the prior-year amount with 8.0% (Q3 2012: 3.4%). The increase
of the earnings margins is apparent both in comparison with
the prior-year quarter and in the course of the year 2013. This
improvement is mainly due to the efficiency increase brought
about by the continued conversion of production from 6 to
8-inch wafers.
At 4.5 million Euro for the first nine months 2013, the consoli-
dated net income attributable to owners of the parent almost
reached the prior-year level (9M 2012: 4.6 Mio. Euro) – due to the
reporting period’s better net financial result (9M 2013: even; 9M
2012: net financial expenses of 0.4 million Euro). This equals ba-
sic earnings per share of 0.23 Euro (9M 2012: 0.24 Euro).
The consolidated net income for the third quarter 2013 amount-
ed to 3.1 million Euro (Q3 2012: 1.0 million Euro), equivalent to
basic earnings per share of 0.16 Euro (Q3 2012: 0.05 Euro).
The cash flow from operating activities was roughly stable in
year-over-year comparison, reaching 11.8 million Euro in the first
nine months of 2013 (9M 2012: 12.8 million Euro). Capital expen-
ditures for intangible assets and property, plant and equipment
were 10.8 million Euro in the first nine months of 2013, or 7.9%
of sales (9M 2012: 13.0 million Euro, or 9.6% of sales). The adjust-
ed free cash flow (cash flow from operating activities less cap-
ital expenditures for intangible assets and property, plant and
equipment, less payments for investments, plus disposal of in-
vestments) came to 2.7 million Euro (9M 2012: –0.1 million Euro).
In the third quarter 2013, the adjusted free cash flow was 2.9
million Euro (Q3 2012: 3.2 million Euro), also reflecting an im-
provement in the course of the year.
Elmos Interim Report July 1 − September 30, 2013 | 5
China continues to be the auto industry’s growth driver. In the
first nine months of 2013, 11.6 million cars were registered.
This is a 20.8% gain compared with the prior-year period.
The German carmakers have a share of close to 22% in the
Chinese market, as reported by the German Association of the
Automotive Industry (VDA).
In other Asian countries, however, the market development
is negative: Car sales in India have gone down by almost 8%
to 1.9 million units so far this year. On the Japanese passenger
car market, roughly 5% fewer cars, altogether 3.5 million, were
registered in comparison with the year before.
The U.S. market continues its positive trend, recording
altogether 11.7 million light vehicles and thus about 8% more
registered cars in the reporting period.
Significant events
Group
Dr. Anton Mindl, CEO, and Nicolaus Graf von Luckner, CFO,
explained the 2012 annual result within the framework of the
annual press conference and the analysts’ conference held
on March 19, 2013.
Elmos held its 14th Annual General Meeting on May 24, 2013.
All items on the agenda were adopted by a large majority.
In addition to cash and cash equivalents in the amount of 19.2
million Euro, the Company holds 52.6 million Euro in long-term
and short-term securities (December 31, 2012: 55.6 million Euro
and 26.6 million Euro, respectively). Cash and cash equivalents
plus fungible securities altogether amounted to 71.8 million
Euro as of September 30, 2013, lower by comparison to Decem-
ber 31, 2012 (82.2 million Euro). Net cash also went down from
December 31, 2012 (39.3 million Euro), to 34.2 million Euro. The
main reasons for this are the payment of the dividend, the share
buyback scheme and capital expenditures. The equity ratio of
70.4% as of September 30, 2013 remained stable (December 31,
2012: 69.6%).
Economic environment
The worldwide car market continues to show major regional
differences. Compared with the previous year, however, in
September 2013 there are first signs of a slight recovery in
some countries of Western Europe.
The Western European car market was still 4% below the prior-
year level with close to 8.8 million new registrations in the
first nine months. The relevant Western European markets,
with the exception of Great Britain (+10.8%), showed negative
or very negative performances. According to the European
Automobile Manufacturers’ Association (ACEA), new passenger
car registrations went down from the prior-year period in Spain
(–1.6%), Germany (–6.0%), Italy (–8.3%), and France (–8.5%).
The Supervisory Board of Elmos has appointed Dr. Arne
Schneider (36) as new member of the Management Board
effective July 1, 2014. He will be responsible for Finances and
Administration. The acting CFO, Nicolaus Graf von Luckner
(64), will go into retirement as of June 30, 2014 and thus leave
the Management Board of Elmos Semiconductor AG. This
announcement was released in September.
Products
In the reporting period Elmos introduced the following new
products, among others:
- The IC 931.08 is designed especially for the interface
between thermopile sensor and microcontroller or
processor. One of the potential applications is a compact-
sized in-ear thermometer.
- The IC family 522.7x comprises highly efficient step-
down converters designed consistently for low quiescent
current draw and high efficiency. The achievable efficiency
rate exceeds 90%. Potential fields of use are industrial
applications in voltage supply systems.
- With the IC E527.16 based on the HALIOS® principle, Elmos
has presented a semiconductor specially designed for the
control of light and lighting fixtures. The new product
recognizes simple gestures such as approach or wiping
motions up to a distance of approx. 25 cm.
6
Elmos and SMI have announced a partnership with the
distributor Mouser Electronics Inc. Since April, Mouser
has been distributing mixed-signal semiconductors,
MEMS pressure sensors, HALIOS® sensors, and integrated
microsystems.
Furthermore, Elmos displayed its product portfolio at
the trade shows “embedded world 2013” in Nuremberg
and “electronica China” in Shanghai and received positive
customer response throughout.
On June 25, 2013 Elmos held a development workshop for
customers about industrial products. Its main focus was the
efficient integration of IO-Link, DC/DC and KNX products into
new as well as existing systems.
In June 2013 Elmos released the new product catalog
2013/14 containing many application examples and detailed
information.
Miscellaneous
Elmos has successfully implemented an energy management
system. It has been certified according to DIN EN ISO
50001. Its goal is to save energy. Components of the energy
management system are energy policy, the definition of
energy targets, the identification of energy savings potential,
the determination of measures, and reviews and monitoring.
Elmos has also reported that is has aligned its IC development
process with the requirements of ISO 26262. ISO 26262 is a
comprehensive international standard that focuses on the
functional safety of electric/electronic automotive systems.
Elmos participates in the ZVEI ad hoc workgroup ISO 26262.
In mid-September Elmos launched its new website. Clearly
laid out product pages, easy sample ordering, and all the facts
at a single glance: These were the priorities Elmos had defined
for redesigning its website. Moreover, the website is now
ready and optimized for mobile devices such as smartphones
and tablets.
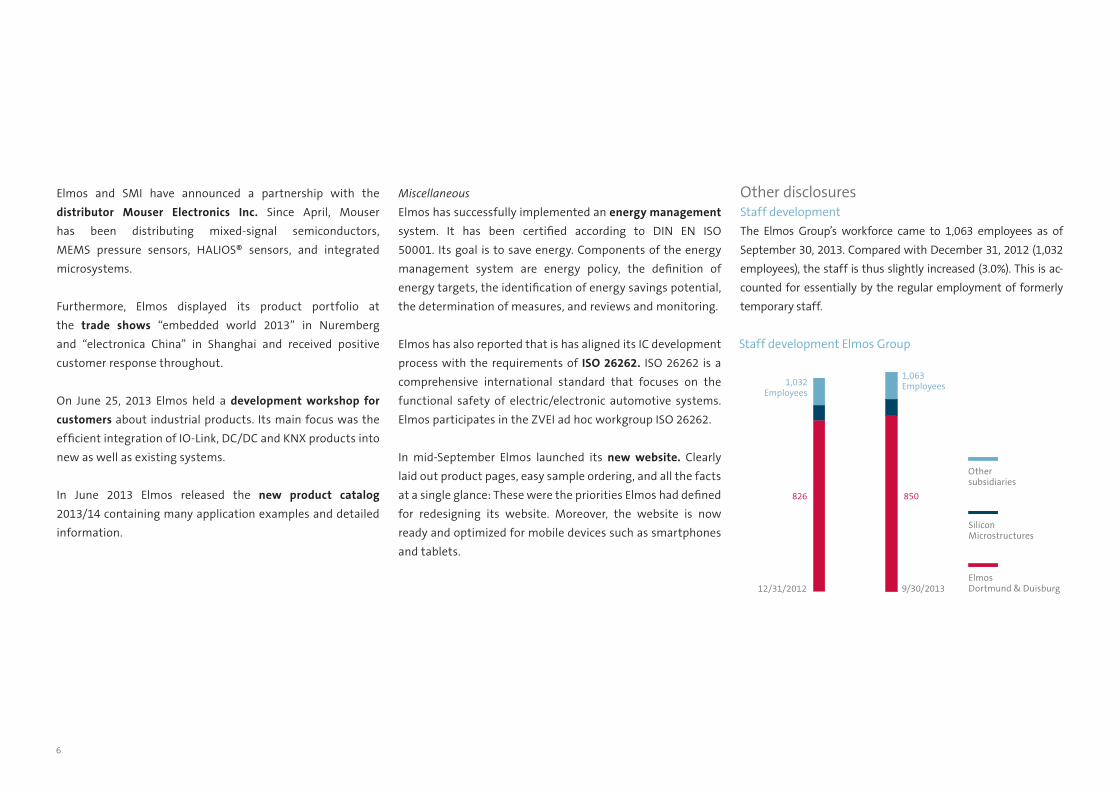
Staff development Elmos Group
1,032Employees
1,063Employees
826 850
12/31/2012 9/30/2013
SiliconMicrostructures
Othersubsidiaries
ElmosDortmund & Duisburg
Other disclosures Staff development
The Elmos Group’s workforce came to 1,063 employees as of
September 30, 2013. Compared with December 31, 2012 (1,032
employees), the staff is thus slightly increased (3.0%). This is ac-
counted for essentially by the regular employment of formerly
temporary staff.
Elmos Interim Report July 1 − September 30, 2013 | 7
Elmos share
Despite the persisting economic uncertainties in Europe, the
stock markets generally showed positive developments in the
first nine months of 2013. DAX (12.9%), TecDAX (30.8%), DAX
Sector Technology (22.1%) and Technology All Share (30.2%) all
reported gains. The very good performance of the third quar-
ter 2013 is especially worth noting. The Elmos share also had a
very good performance and climbed by 28.5% over the first nine
months of 2013.
The Elmos share closed on September 30, 2013 at 9.24 Euro.
Market capitalization amounted to 181.6 million Euro at that
date (based on 19.7 million shares issued). The stock price
reached its high on September 19, 2013 at 9.76 Euro and its low
on January 3, 2013 at 7.17 Euro (Xetra closing prices all). The
average daily trading volume of the first nine months of 2013
was 18.5 thousand shares (Xetra and Frankfurt floor) and was
thus below the 2012 average (23.8 thousand shares).
At the end of March 2013, Elmos completed its share buyback
plan launched in August 2012. Altogether 348,783 shares were
repurchased at an average share price of 7.57 Euro. This equals a
total purchase price of 2.6 million Euro. The portfolio of treasury
shares was reduced by servicing stock options with treasury
stock and through share-based remuneration. On September
30, 2013 Elmos Semiconductor AG held 327,697 treasury shares.
Altogether 97,460 stock options were exercised in the first nine
months of 2013, originating from the stock option plan of the
2009 tranche. As a part of these options were serviced with
treasury shares (54,690 shares) and another part by the creation
of conditional capital (42,770 shares), the share capital amounts
to 19,658,475 shares, or Euro, as of September 30, 2013.
Company boards
Supervisory Board
Prof. Dr. Günter Zimmer, chairman
Graduate physicist | Duisburg
Dr. Burkhard Dreher, deputy chairman
Graduate economist | Dortmund
Dr. Klaus Egger
Graduate engineer | Steyr-Gleink, Austria
Thomas Lehner
Graduate engineer | Dortmund
Sven-Olaf Schellenberg
Graduate physicist | Dortmund
Dr. Klaus Weyer
Graduate physicist | Penzberg
Management Board
Dr. Anton Mindl, chairman
Graduate physicist | Lüdenscheid
Nicolaus Graf von Luckner
Graduate economist | Oberursel
Reinhard Senf
Graduate engineer | Iserlohn
Dr. Peter Geiselhart
Graduate physicist | Ettlingen
8
make it the fourth year of decline in a row, recording almost 4
million units below the record year of 2007 (14.8 million units).
A growth of more than 5% is expected for the U.S. in 2013; for
China, even a double-digit growth rate is anticipated.
Outlook for the Elmos Group
Elmos has pursued a solid economic policy over the past years.
As a consequence of that, Elmos now stands on a secure finan-
cial foundation. Moreover, Elmos is highly regarded by the cus-
tomers; the deciding factors for this reputation were the power
of innovation, the high quality level, and the Company’s deliv-
ery reliability.
Elmos has the right products in order to benefit from a sound
economy. The current year’s ramp-up of several new products
continues to make us optimistic for this year despite the cur-
rently rather dim prospects for the automotive market so that
we confirm our growth forecast for 2013. Sales of the third
quarter 2013 were slightly lower than expected primarily on
account of cut-off-date related effects. Therefore and because
of the order backlog, we are expecting a strong fourth quarter
of 2013. Following three quarters with increasing earnings, the
margins will keep improving in the fourth quarter.
In 2013 Elmos anticipates a sales increase in the mid single-dig-
it percentage range based on essentially unchanged general
economic conditions. The EBIT margin will be above the 2012
level (6.3%). The adjusted free cash flow is expected to be posi-
tive. Capital expenditures are budgeted to amount to no more
than 15% of sales.
In the medium and long term, Elmos will benefit from the glob-
al megatrends: increasing urbanization, more renewable ener-
gy sources (and generally dealing with energy in an efficient
way), and more as well as environmentally sound mobility. To
all these dynamically growing market segments, Elmos will
make important contributions.
OutlookOpportunities and risks
Risk management and individual corporate risks and oppor-
tunities are described in our Annual Report 2012. No material
changes of the Company’s risks and opportunities as detailed
therein have occurred in the first nine months of 2013. No risks
are visible at present that could either separately or collectively
jeopardize the Company’s continued existence.
Economic framework
The general economic conditions for 2013 continue to be dis-
mal on account of the euro crisis. The resulting uncertain-
ty makes many customers hesitate when it comes to buying
a new car. While on the global scope a slight growth by 2% to
70.5 million units is expected for the passenger car market, the
European market remains the problem child. The German Asso-
ciation of the Automotive Industry (VDA) identifies the ever in-
creasing divide in the growth dynamics of relevant markets as
a challenge. VDA President Matthias Wissmann calls the auto-
motive year 2013 “a challenging year of hard work”, yet he an-
ticipates a modest stabilization to occur in the second half-year
2013. The VDA expects the Western European market to shrink
by about 5% to 11.1 million new cars in 2013 which would
8
Elmos Interim Report July 1 − September 30, 2013 | 9
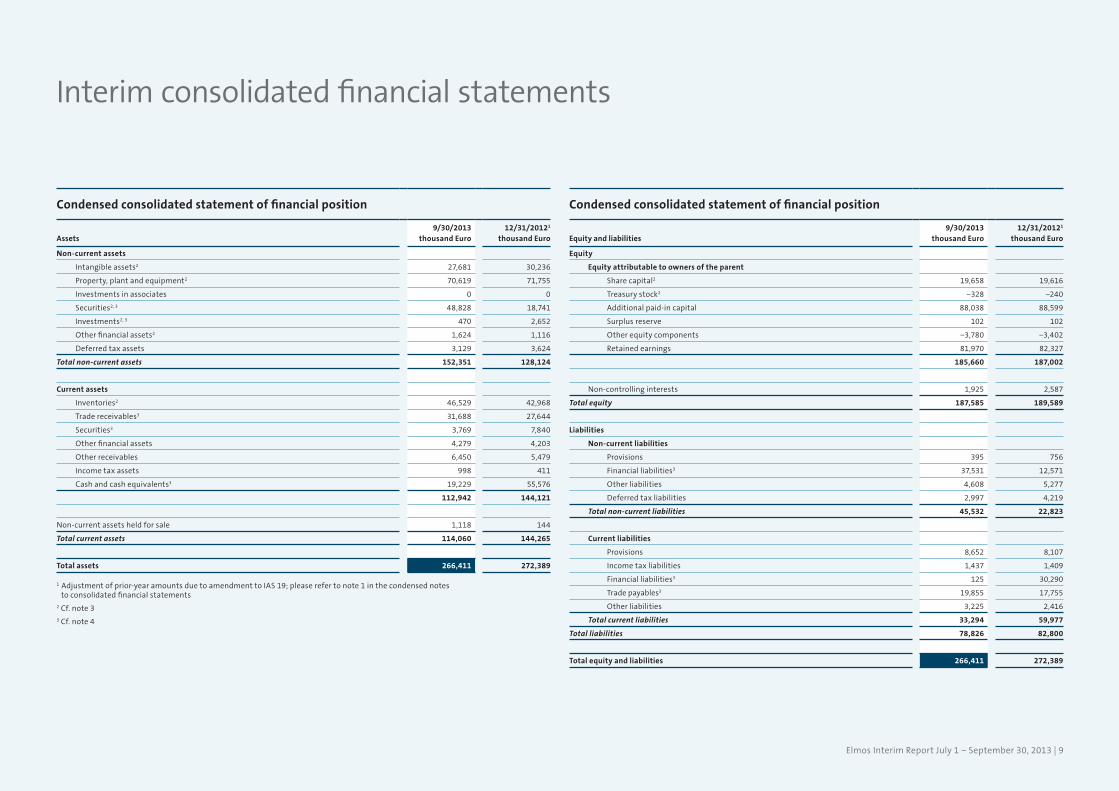
Interim consolidated financial statements
1 Adjustment of prior-year amounts due to amendment to IAS 19; please refer to note 1 in the condensed notes to consolidated financial statements 2 Cf. note 33 Cf. note 4
Condensed consolidated statement of financial position
Assets9/30/2013
thousand Euro12/31/20121
thousand Euro
Non-current assets
Intangible assets2 27,681 30,236
Property, plant and equipment2 70,619 71,755
Investments in associates 0 0
Securities2, 3 48,828 18,741
Investments2, 3 470 2,652
Other financial assets2 1,624 1,116
Deferred tax assets 3,129 3,624
Total non-current assets 152,351 128,124
Current assets
Inventories2 46,529 42,968
Trade receivables3 31,688 27,644
Securities3 3,769 7,840
Other financial assets 4,279 4,203
Other receivables 6,450 5,479
Income tax assets 998 411
Cash and cash equivalents3 19,229 55,576
112,942 144,121
Non-current assets held for sale 1,118 144
Total current assets 114,060 144,265
Total assets 266,411 272,389
Condensed consolidated statement of financial position
Equity and liabilities9/30/2013
thousand Euro12/31/20121
thousand Euro
Equity
Equity attributable to owners of the parent
Share capital2 19,658 19,616
Treasury stock2 −328 −240
Additional paid-in capital 88,038 88,599
Surplus reserve 102 102
Other equity components −3,780 −3,402
Retained earnings 81,970 82,327
185,660 187,002
Non-controlling interests 1,925 2,587
Total equity 187,585 189,589
Liabilities
Non-current liabilities
Provisions 395 756
Financial liabilities3 37,531 12,571
Other liabilities 4,608 5,277
Deferred tax liabilities 2,997 4,219
Total non-current liabilities 45,532 22,823
Current liabilities
Provisions 8,652 8,107
Income tax liabilities 1,437 1,409
Financial liabilities3 125 30,290
Trade payables3 19,855 17,755
Other liabilities 3,225 2,416
Total current liabilities 33,294 59,977
Total liabilities 78,826 82,800
Total equity and liabilities 266,411 272,389
10
1 Adjustment of prior-year amounts due to amendment to IAS 19; please refer to note 1 in the condensed notes to consolidated financial statements
1 Adjustment due to the amendment to IAS 19
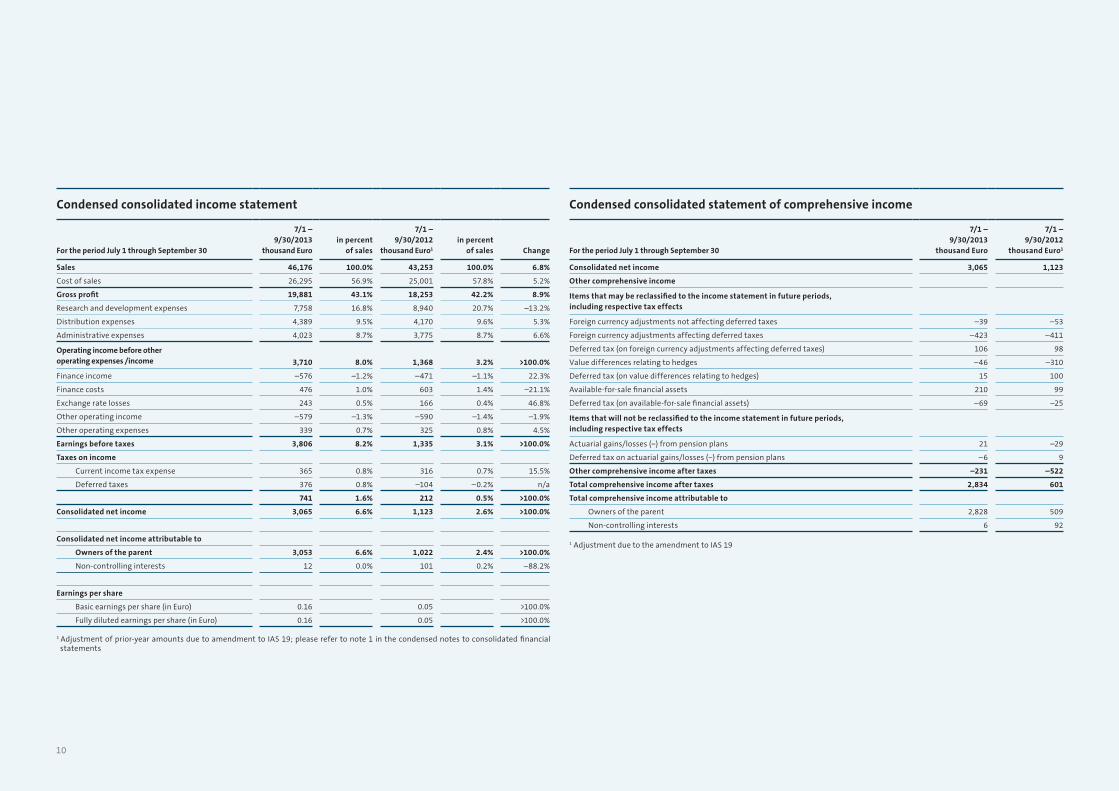
Condensed consolidated income statement
For the period July 1 through September 30
7/1 – 9/30/2013
thousand Euroin percent
of sales
7/1 – 9/30/2012
thousand Euro1
in percent of sales Change
Sales 46,176 100.0% 43,253 100.0% 6.8%
Cost of sales 26,295 56.9% 25,001 57.8% 5.2%
Gross profit 19,881 43.1% 18,253 42.2% 8.9%
Research and development expenses 7,758 16.8% 8,940 20.7% –13.2%
Distribution expenses 4,389 9.5% 4,170 9.6% 5.3%
Administrative expenses 4,023 8.7% 3,775 8.7% 6.6%
Operating income before other operating expenses /income 3,710 8.0% 1,368 3.2% >100.0%
Finance income –576 –1.2% –471 –1.1% 22.3%
Finance costs 476 1.0% 603 1.4% –21.1%
Exchange rate losses 243 0.5% 166 0.4% 46.8%
Other operating income –579 –1.3% –590 –1.4% –1.9%
Other operating expenses 339 0.7% 325 0.8% 4.5%
Earnings before taxes 3,806 8.2% 1,335 3.1% >100.0%
Taxes on income
Current income tax expense 365 0.8% 316 0.7% 15.5%
Deferred taxes 376 0.8% –104 –0.2% n/a
741 1.6% 212 0.5% >100.0%
Consolidated net income 3,065 6.6% 1,123 2.6% >100.0%
Consolidated net income attributable to
Owners of the parent 3,053 6.6% 1,022 2.4% >100.0%
Non-controlling interests 12 0.0% 101 0.2% –88.2%
Earnings per share
Basic earnings per share (in Euro) 0.16 0.05 >100.0%
Fully diluted earnings per share (in Euro) 0.16 0.05 >100.0%
Condensed consolidated statement of comprehensive income
For the period July 1 through September 30
7/1 – 9/30/2013
thousand Euro
7/1 – 9/30/2012
thousand Euro1
Consolidated net income 3,065 1,123
Other comprehensive income
Items that may be reclassified to the income statement in future periods, including respective tax effects
Foreign currency adjustments not affecting deferred taxes –39 –53
Foreign currency adjustments affecting deferred taxes –423 –411
Deferred tax (on foreign currency adjustments affecting deferred taxes) 106 98
Value differences relating to hedges –46 –310
Deferred tax (on value differences relating to hedges) 15 100
Available-for-sale financial assets 210 99
Deferred tax (on available-for-sale financial assets) –69 –25
Items that will not be reclassified to the income statement in future periods, including respective tax effects
Actuarial gains/losses (−) from pension plans 21 –29
Deferred tax on actuarial gains/losses (−) from pension plans –6 9
Other comprehensive income after taxes –231 –522
Total comprehensive income after taxes 2,834 601
Total comprehensive income attributable to
Owners of the parent 2,828 509
Non-controlling interests 6 92
Elmos Interim Report July 1 − September 30, 2013 | 11
1 Adjustment due to amendment to IAS 19
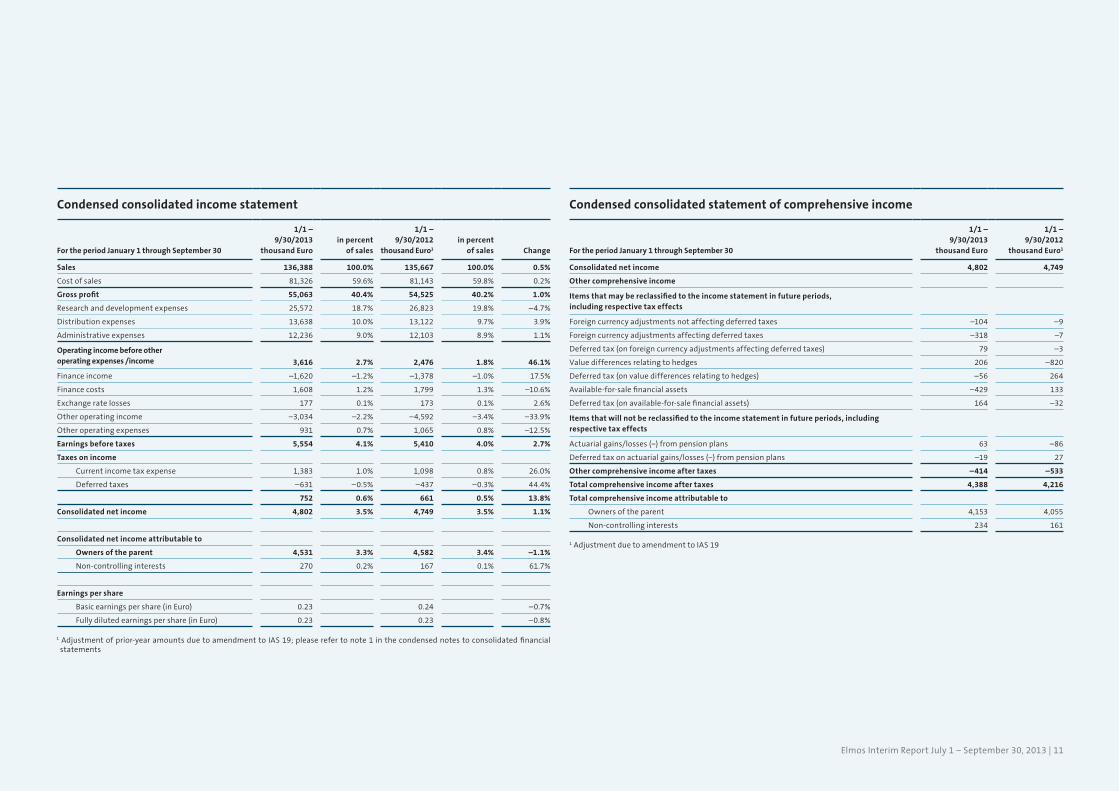
Condensed consolidated income statement
For the period January 1 through September 30
1/1 – 9/30/2013
thousand Euroin percent
of sales
1/1 – 9/30/2012
thousand Euro1
in percentof sales Change
Sales 136,388 100.0% 135,667 100.0% 0.5%
Cost of sales 81,326 59.6% 81,143 59.8% 0.2%
Gross profit 55,063 40.4% 54,525 40.2% 1.0%
Research and development expenses 25,572 18.7% 26,823 19.8% –4.7%
Distribution expenses 13,638 10.0% 13,122 9.7% 3.9%
Administrative expenses 12,236 9.0% 12,103 8.9% 1.1%
Operating income before other operating expenses /income 3,616 2.7% 2,476 1.8% 46.1%
Finance income –1,620 –1.2% –1,378 –1.0% 17.5%
Finance costs 1,608 1.2% 1,799 1.3% –10.6%
Exchange rate losses 177 0.1% 173 0.1% 2.6%
Other operating income –3,034 –2.2% –4,592 –3.4% –33.9%
Other operating expenses 931 0.7% 1,065 0.8% –12.5%
Earnings before taxes 5,554 4.1% 5,410 4.0% 2.7%
Taxes on income
Current income tax expense 1,383 1.0% 1,098 0.8% 26.0%
Deferred taxes –631 –0.5% –437 –0.3% 44.4%
752 0.6% 661 0.5% 13.8%
Consolidated net income 4,802 3.5% 4,749 3.5% 1.1%
Consolidated net income attributable to
Owners of the parent 4,531 3.3% 4,582 3.4% –1.1%
Non-controlling interests 270 0.2% 167 0.1% 61.7%
Earnings per share
Basic earnings per share (in Euro) 0.23 0.24 –0.7%
Fully diluted earnings per share (in Euro) 0.23 0.23 –0.8%
Condensed consolidated statement of comprehensive income
For the period January 1 through September 30
1/1 – 9/30/2013
thousand Euro
1/1 – 9/30/2012
thousand Euro1
Consolidated net income 4,802 4,749
Other comprehensive income
Items that may be reclassified to the income statement in future periods, including respective tax effects
Foreign currency adjustments not affecting deferred taxes –104 –9
Foreign currency adjustments affecting deferred taxes –318 –7
Deferred tax (on foreign currency adjustments affecting deferred taxes) 79 –3
Value differences relating to hedges 206 –820
Deferred tax (on value differences relating to hedges) –56 264
Available-for-sale financial assets –429 133
Deferred tax (on available-for-sale financial assets) 164 –32
Items that will not be reclassified to the income statement in future periods, including respective tax effects
Actuarial gains/losses (−) from pension plans 63 –86
Deferred tax on actuarial gains/losses (−) from pension plans –19 27
Other comprehensive income after taxes –414 –533
Total comprehensive income after taxes 4,388 4,216
Total comprehensive income attributable to
Owners of the parent 4,153 4,055
Non-controlling interests 234 161
1 Adjustment of prior-year amounts due to amendment to IAS 19; please refer to note 1 in the condensed notes to consolidated financial statements
12
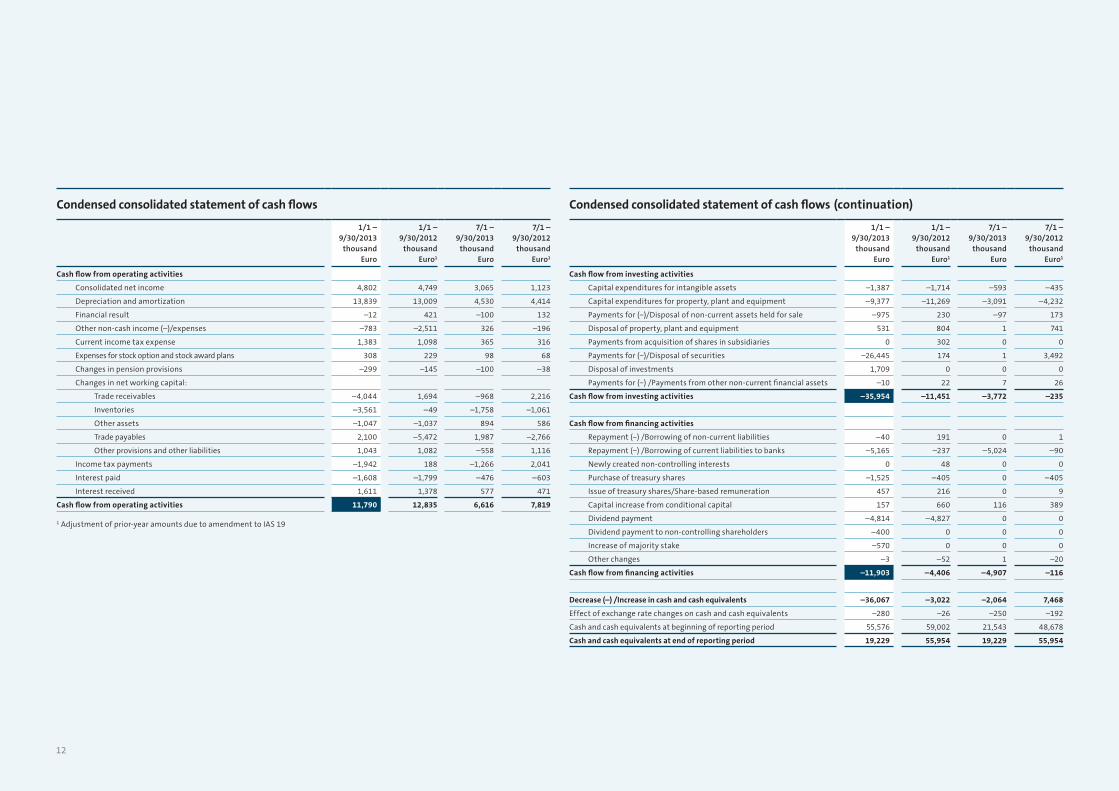
Condensed consolidated statement of cash flows
1/1 – 9/30/2013
thousand Euro
1/1 – 9/30/2012
thousand Euro1
7/1 – 9/30/2013
thousand Euro
7/1 – 9/30/2012
thousand Euro1
Cash flow from operating activities
Consolidated net income 4,802 4,749 3,065 1,123
Depreciation and amortization 13,839 13,009 4,530 4,414
Financial result –12 421 –100 132
Other non-cash income (–)/expenses –783 –2,511 326 –196
Current income tax expense 1,383 1,098 365 316
Expenses for stock option and stock award plans 308 229 98 68
Changes in pension provisions –299 –145 –100 –38
Changes in net working capital:
Trade receivables –4,044 1,694 –968 2,216
Inventories –3,561 –49 –1,758 –1,061
Other assets –1,047 –1,037 894 586
Trade payables 2,100 –5,472 1,987 –2,766
Other provisions and other liabilities 1,043 1,082 –558 1,116
Income tax payments –1,942 188 –1,266 2,041
Interest paid –1,608 –1,799 –476 –603
Interest received 1,611 1,378 577 471
Cash flow from operating activities 11,790 12,835 6,616 7,819
Condensed consolidated statement of cash flows
1/1 – 9/30/2013
thousand Euro
1/1 – 9/30/2012
thousand Euro1
7/1 – 9/30/2013
thousand Euro
7/1 – 9/30/2012
thousand Euro1
Cash flow from investing activities
Capital expenditures for intangible assets –1,387 –1,714 –593 –435
Capital expenditures for property, plant and equipment –9,377 –11,269 –3,091 –4,232
Payments for (−)/Disposal of non-current assets held for sale –975 230 –97 173
Disposal of property, plant and equipment 531 804 1 741
Payments from acquisition of shares in subsidiaries 0 302 0 0
Payments for (−)/Disposal of securities –26,445 174 1 3,492
Disposal of investments 1,709 0 0 0
Payments for (−) /Payments from other non-current financial assets –10 22 7 26
Cash flow from investing activities –35,954 –11,451 –3,772 –235
Cash flow from financing activities
Repayment (−) /Borrowing of non-current liabilities –40 191 0 1
Repayment (−) /Borrowing of current liabilities to banks –5,165 –237 –5,024 –90
Newly created non-controlling interests 0 48 0 0
Purchase of treasury shares –1,525 –405 0 –405
Issue of treasury shares/Share-based remuneration 457 216 0 9
Capital increase from conditional capital 157 660 116 389
Dividend payment –4,814 –4,827 0 0
Dividend payment to non-controlling shareholders –400 0 0 0
Increase of majority stake –570 0 0 0
Other changes –3 –52 1 –20
Cash flow from financing activities –11,903 –4,406 –4,907 –116
Decrease (–) /Increase in cash and cash equivalents –36,067 –3,022 –2,064 7,468
Effect of exchange rate changes on cash and cash equivalents –280 –26 –250 –192
Cash and cash equivalents at beginning of reporting period 55,576 59,002 21,543 48,678
Cash and cash equivalents at end of reporting period 19,229 55,954 19,229 55,954
(continuation)
1 Adjustment of prior-year amounts due to amendment to IAS 19
Elmos Interim Report July 1 − September 30, 2013 | 13
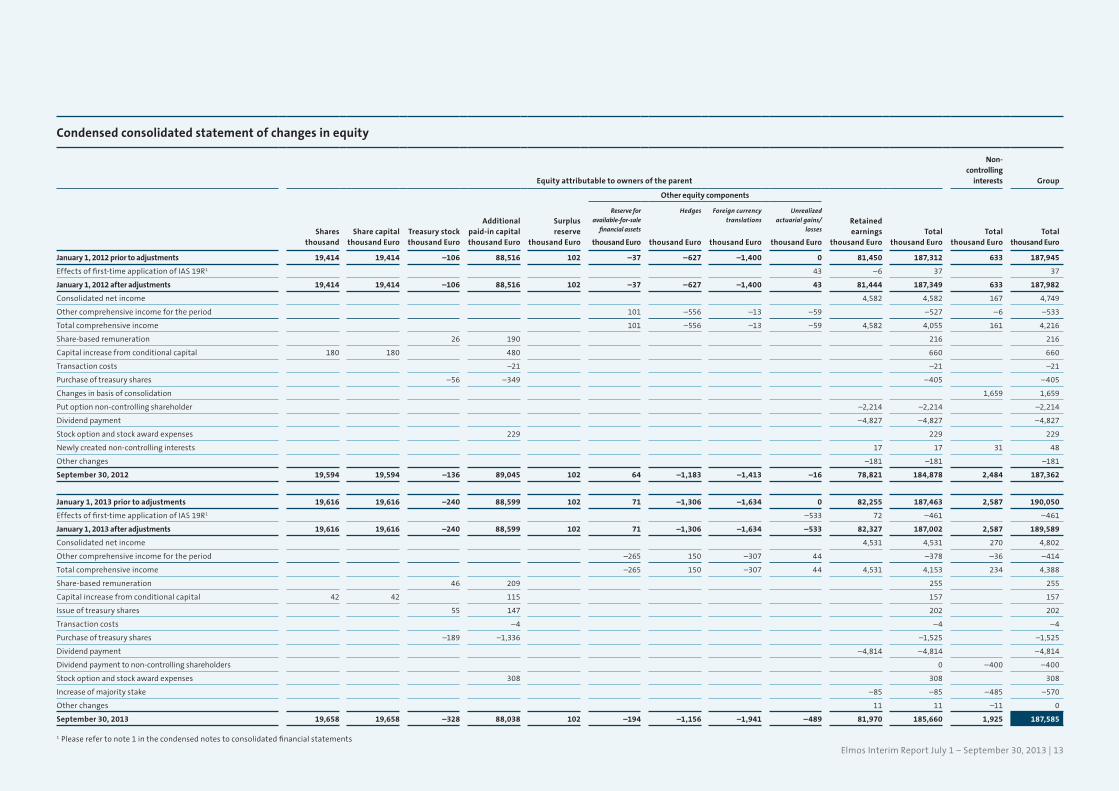
Condensed consolidated statement of changes in equity
Equity attributable to owners of the parent
Non-controlling
interests Group
Other equity components
Shares thousand
Share capital thousand Euro
Treasury stockthousand Euro
Additional paid-in capital thousand Euro
Surplus reserve
thousand Euro
Reserve for available-for-sale
financial assets
thousand Euro
Hedges
thousand Euro
Foreign currency translations
thousand Euro
Unrealized actuarial gains/
losses
thousand Euro
Retained earnings
thousand EuroTotal
thousand EuroTotal
thousand EuroTotal
thousand Euro
January 1, 2012 prior to adjustments 19,414 19,414 –106 88,516 102 –37 –627 –1,400 0 81,450 187,312 633 187,945
Effects of first-time application of IAS 19R1 43 –6 37 37
January 1, 2012 after adjustments 19,414 19,414 –106 88,516 102 –37 –627 –1,400 43 81,444 187,349 633 187,982
Consolidated net income 4,582 4,582 167 4,749
Other comprehensive income for the period 101 –556 –13 –59 –527 –6 –533
Total comprehensive income 101 –556 –13 –59 4,582 4,055 161 4,216
Share-based remuneration 26 190 216 216
Capital increase from conditional capital 180 180 480 660 660
Transaction costs –21 –21 –21
Purchase of treasury shares –56 –349 –405 –405
Changes in basis of consolidation 1,659 1,659
Put option non-controlling shareholder –2,214 –2,214 –2,214
Dividend payment –4,827 –4,827 –4,827
Stock option and stock award expenses 229 229 229
Newly created non-controlling interests 17 17 31 48
Other changes –181 –181 –181
September 30, 2012 19,594 19,594 –136 89,045 102 64 –1,183 –1,413 –16 78,821 184,878 2,484 187,362
January 1, 2013 prior to adjustments 19,616 19,616 –240 88,599 102 71 –1,306 –1,634 0 82,255 187,463 2,587 190,050
Effects of first-time application of IAS 19R1 –533 72 –461 –461
January 1, 2013 after adjustments 19,616 19,616 –240 88,599 102 71 –1,306 –1,634 –533 82,327 187,002 2,587 189,589
Consolidated net income 4,531 4,531 270 4,802
Other comprehensive income for the period –265 150 –307 44 –378 –36 –414
Total comprehensive income –265 150 –307 44 4,531 4,153 234 4,388
Share-based remuneration 46 209 255 255
Capital increase from conditional capital 42 42 115 157 157
Issue of treasury shares 55 147 202 202
Transaction costs –4 –4 –4
Purchase of treasury shares –189 –1,336 –1,525 –1,525
Dividend payment –4,814 –4,814 –4,814
Dividend payment to non-controlling shareholders 0 –400 –400
Stock option and stock award expenses 308 308 308
Increase of majority stake –85 –85 –485 –570
Other changes 11 11 –11 0
September 30, 2013 19,658 19,658 –328 88,038 102 –194 –1,156 –1,941 –489 81,970 185,660 1,925 187,585
1 Please refer to note 1 in the condensed notes to consolidated financial statements
14
The condensed interim consolidated financial statements for the 3rd quarter of 2013 were released
for publication in November 2013 pursuant to Management Board resolution.
1 // General informationElmos Semiconductor Aktiengesellschaft (“the Company” or “Elmos”) has its registered office in
Dortmund (Germany) and is entered in the register of companies maintained at Dortmund Dis-
trict Court (Amtsgericht), section B, no. 13698. The Articles of Incorporation are in effect in the
version of March 26, 1999, last amended by resolution of the Annual General Meeting of May 24,
2013.
The Company’s business is the development, manufacture and distribution of microelectronic
components and system parts (application specific integrated circuits, or in short: ASICs) as
well as technological devices with similar functions. The Company may conduct all transactions
suitable for serving the object of business directly or indirectly. The Company may establish
branches, acquire or lease businesses of the same or a similar kind or invest in them, and conduct
all business transactions that are beneficial to the Articles of Association. The Company is autho-
rized to conduct business in Germany as well as abroad.
In addition to its domestic branches, the Company has sales companies in Asia and the United
States and cooperates with other German and international companies in the development and
production of ASIC chips.
Basic principals of the preparation of financial statements
The condensed interim consolidated financial statements for the period January 1 through Sep-
tember 30, 2013 have been prepared in accordance with IAS 34: Interim Financial Reporting. These
financial statements do therefore not contain all the information and disclosures required for con-
solidated financial statements and should therefore be read in conjunction with the consolidated
financial statements for the fiscal year ended December 31, 2012.
Essential accounting policies and valuation methods
For the preparation of the condensed interim consolidated financial statements, the same
accounting policies and valuation methods have been adopted as were applied for the prepara-
tion of the consolidated financial statements for the fiscal year ended December 31, 2012, with
the exception of the following new or amended IFRS standards and interpretations listed below.
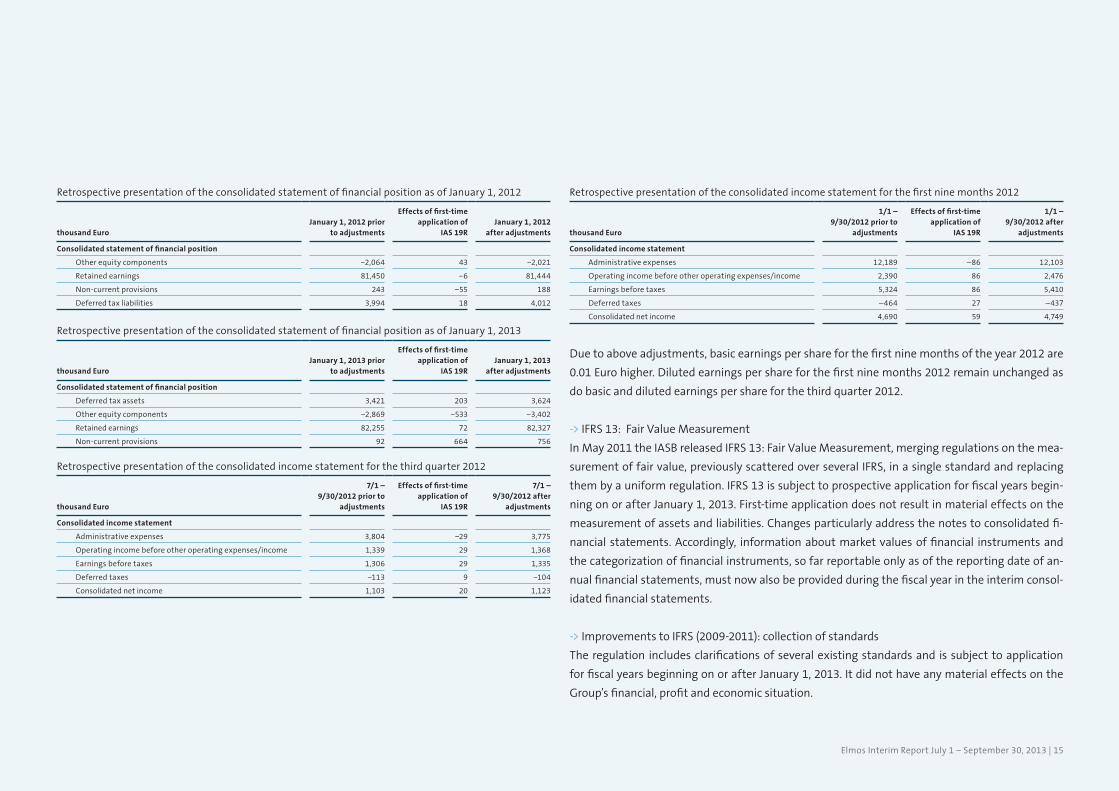
-> IAS 19: Employee Benefits (revised 2011)
In June 2011 the IASB released amendments to IAS 19: Employee Benefits that were adopted by
the EU in June 2012. The amendments to IAS 19 must generally be applied with retrospective ef-
fect for financial statements prepared for fiscal years beginning on or after January 1, 2013. So far
the Group has applied the so-called corridor method. Upon the elimination of the corridor method
by revised IAS 19, actuarial gains and losses have immediate effect on the consolidated statement
of financial position and result in an increase of pension provisions as well as a decrease in equi-
ty. From now on the consolidated income statement remains free of effects from actuarial gains
and losses as those are now to be entered in other comprehensive income. Elmos has adjusted the
reported prior-year amounts for effects from the amendments to IAS 19. For Elmos, the amend-
ments to IAS 19 result in the following effects:
Condensed notes to the consolidated financial statements
Elmos Interim Report July 1 − September 30, 2013 | 15
Retrospective presentation of the consolidated statement of financial position as of January 1, 2012
thousand EuroJanuary 1, 2012 prior
to adjustments
Effects of first-time application of
IAS 19RJanuary 1, 2012
after adjustments
Consolidated statement of financial position
Other equity components −2,064 43 −2,021
Retained earnings 81,450 −6 81,444
Non-current provisions 243 −55 188
Deferred tax liabilities 3,994 18 4,012
Retrospective presentation of the consolidated statement of financial position as of January 1, 2013
thousand EuroJanuary 1, 2013 prior
to adjustments
Effects of first-time application of
IAS 19RJanuary 1, 2013
after adjustments
Consolidated statement of financial position
Deferred tax assets 3,421 203 3,624
Other equity components −2,869 −533 −3,402
Retained earnings 82,255 72 82,327
Non-current provisions 92 664 756
Retrospective presentation of the consolidated income statement for the third quarter 2012
thousand Euro
7/1 –9/30/2012 prior to
adjustments
Effects of first-time application of
IAS 19R
7/1 –9/30/2012 after
adjustments
Consolidated income statement
Administrative expenses 3,804 −29 3,775
Operating income before other operating expenses/income 1,339 29 1,368
Earnings before taxes 1,306 29 1,335
Deferred taxes −113 9 −104
Consolidated net income 1,103 20 1,123
Retrospective presentation of the consolidated income statement for the first nine months 2012
thousand Euro
1/1 –9/30/2012 prior to
adjustments
Effects of first-time application of
IAS 19R
1/1 –9/30/2012 after
adjustments
Consolidated income statement
Administrative expenses 12,189 –86 12,103
Operating income before other operating expenses/income 2,390 86 2,476
Earnings before taxes 5,324 86 5,410
Deferred taxes –464 27 –437
Consolidated net income 4,690 59 4,749
Due to above adjustments, basic earnings per share for the first nine months of the year 2012 are
0.01 Euro higher. Diluted earnings per share for the first nine months 2012 remain unchanged as
do basic and diluted earnings per share for the third quarter 2012.
-> IFRS 13: Fair Value Measurement
In May 2011 the IASB released IFRS 13: Fair Value Measurement, merging regulations on the mea-
surement of fair value, previously scattered over several IFRS, in a single standard and replacing
them by a uniform regulation. IFRS 13 is subject to prospective application for fiscal years begin-
ning on or after January 1, 2013. First-time application does not result in material effects on the
measurement of assets and liabilities. Changes particularly address the notes to consolidated fi-
nancial statements. Accordingly, information about market values of financial instruments and
the categorization of financial instruments, so far reportable only as of the reporting date of an-
nual financial statements, must now also be provided during the fiscal year in the interim consol-
idated financial statements.
-> Improvements to IFRS (2009-2011): collection of standards
The regulation includes clarifications of several existing standards and is subject to application
for fiscal years beginning on or after January 1, 2013. It did not have any material effects on the
Group’s financial, profit and economic situation.
16
Estimates and assumptions
The Company recognizes provisions for pension and partial retirement obligations pursuant to IAS
19. An actuarial interest rate of 3.5% has been applied for pension obligations in 2013 (December
31, 2012: 3.5%) and of 1.4% for partial retirement obligations (December 31, 2012: 3.5%).
Exceptional business transactions
There were no exceptional business transactions in the first nine months of 2013.
Basis of consolidation
There were neither additions to nor disposals from the basis of consolidation in the first nine
months of 2013.
As of acquisition date January 1, 2013, 26.1% of the shares in GED Gärtner-Electronic-Design GmbH,
Frankfurt/Oder were acquired. Following this increase of the already existing majority stake, Elmos
Semiconductor AG holds 100% of the shares in this affiliate.
Seasonal and economic impact on business operations
The general economic conditions for 2013 continue to be affected negatively by the euro crisis.
The resulting uncertainty makes many customers hesitate when it comes to buying a new car. The
German Association of the Automotive Industry (VDA) identifies the ever increasing divide in the
growth dynamics of relevant markets as a challenge. The business of Elmos Semiconductor AG is
not subject to material seasonal fluctuations.
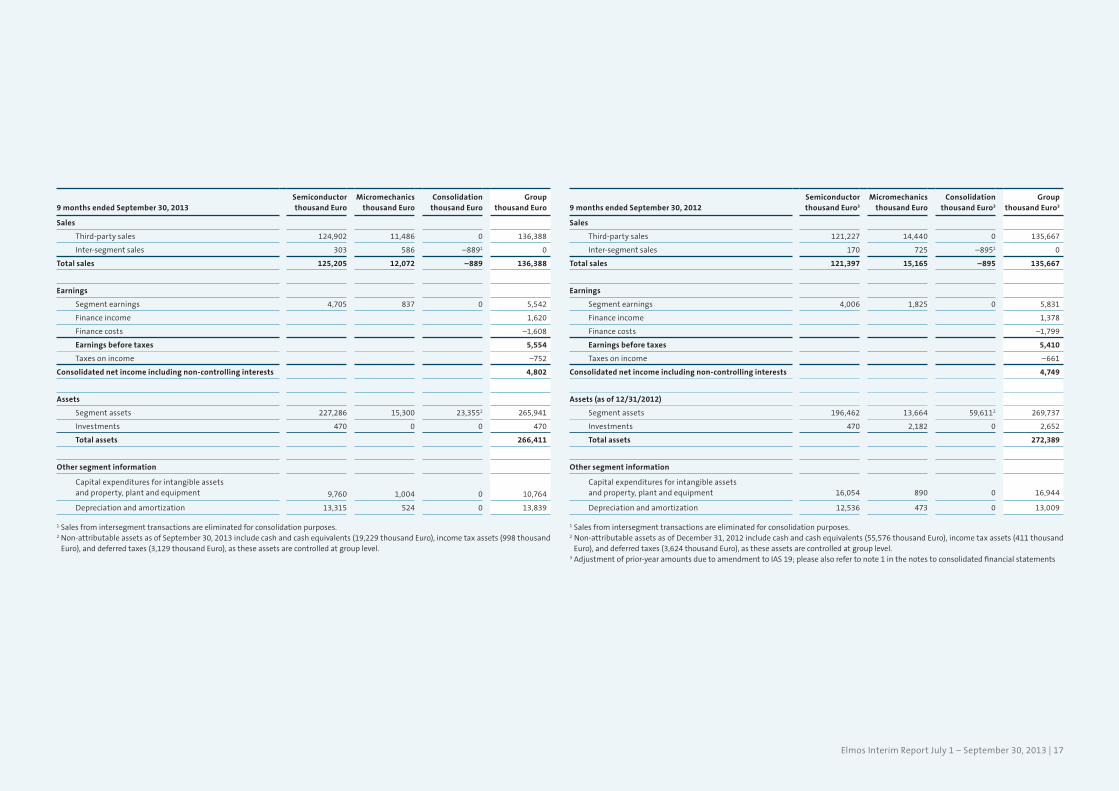
2 // Segment reporting The business segments correspond to the Elmos Group’s internal organizational and reporting
structure. The definition of segments considers the different products and services supplied by
the Group. The accounting principles of the individual segments correspond to those applied by
the Group.
The Company divides its business activities into two segments. The semiconductor business is
operated through the various national subsidiaries and branches in Germany, the Netherlands,
South Africa, Asia, and the U.S.A. Sales in this segment are generated predominantly with elec-
tronics for the automotive industry. In addition, Elmos operates in the markets for industrial and
consumer goods and provides semiconductors e.g. for applications in household appliances, pho-
to cameras, installation and building technology, and machine control. Sales in the microme-
chanics segment are generated by the subsidiary SMI in the U.S.A. Its product portfolio includes
micro-electro-mechanical systems (MEMS) which are primarily silicon-based high-precision pres-
sure sensors. The following tables provide information on sales and earnings (for the period Janu-
ary 1 through September 30, 2013 and 2012, respectively) as well as on assets of the Group’s busi-
ness segments (as of September 30, 2013 and December 31, 2012).
Elmos Interim Report July 1 − September 30, 2013 | 17
1 Sales from intersegment transactions are eliminated for consolidation purposes.2 Non-attributable assets as of September 30, 2013 include cash and cash equivalents (19,229 thousand Euro), income tax assets (998 thousand Euro), and deferred taxes (3,129 thousand Euro), as these assets are controlled at group level.
1 Sales from intersegment transactions are eliminated for consolidation purposes.2 Non-attributable assets as of December 31, 2012 include cash and cash equivalents (55,576 thousand Euro), income tax assets (411 thousand Euro), and deferred taxes (3,624 thousand Euro), as these assets are controlled at group level.3 Adjustment of prior-year amounts due to amendment to IAS 19; please also refer to note 1 in the notes to consolidated financial statements
9 months ended September 30, 2013Semiconductor thousand Euro
Micromechanicsthousand Euro
Consolidation thousand Euro
Group thousand Euro
Sales
Third-party sales 124,902 11,486 0 136,388
Inter-segment sales 303 586 –8891 0
Total sales 125,205 12,072 –889 136,388
Earnings
Segment earnings 4,705 837 0 5,542
Finance income 1,620
Finance costs –1,608
Earnings before taxes 5,554
Taxes on income –752
Consolidated net income including non-controlling interests 4,802
Assets
Segment assets 227,286 15,300 23,3552 265,941
Investments 470 0 0 470
Total assets 266,411
Other segment information
Capital expenditures for intangible assets and property, plant and equipment 9,760 1,004 0 10,764
Depreciation and amortization 13,315 524 0 13,839
9 months ended September 30, 2012Semiconductorthousand Euro3
Micromechanicsthousand Euro
Consolidationthousand Euro3
Group thousand Euro3
Sales
Third-party sales 121,227 14,440 0 135,667
Inter-segment sales 170 725 –8951 0
Total sales 121,397 15,165 –895 135,667
Earnings
Segment earnings 4,006 1,825 0 5,831
Finance income 1,378
Finance costs –1,799
Earnings before taxes 5,410
Taxes on income –661
Consolidated net income including non-controlling interests 4,749
Assets (as of 12/31/2012)
Segment assets 196,462 13,664 59,6112 269,737
Investments 470 2,182 0 2,652
Total assets 272,389
Other segment information
Capital expenditures for intangible assets and property, plant and equipment 16,054 890 0 16,944
Depreciation and amortization 12,536 473 0 13,009
18
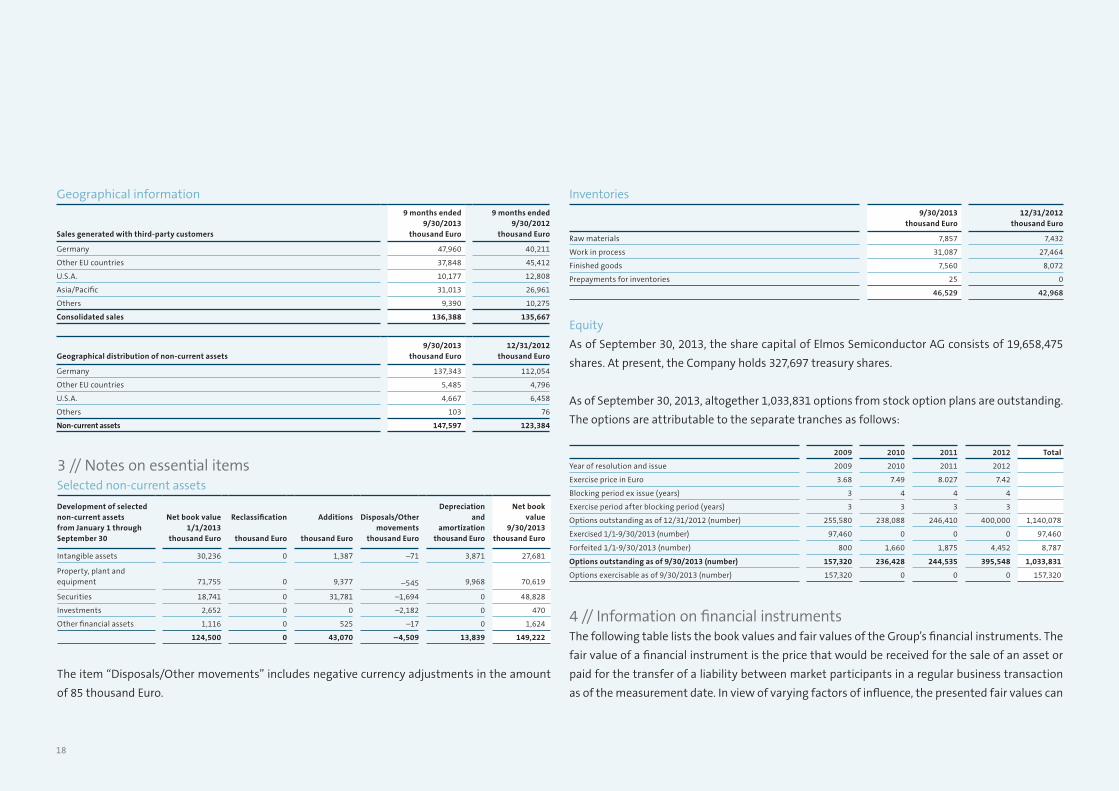
Geographical information
Sales generated with third-party customers
9 months ended 9/30/2013
thousand Euro
9 months ended 9/30/2012
thousand Euro
Germany 47,960 40,211
Other EU countries 37,848 45,412
U.S.A. 10,177 12,808
Asia/Pacific 31,013 26,961
Others 9,390 10,275
Consolidated sales 136,388 135,667
Geographical distribution of non-current assets9/30/2013
thousand Euro12/31/2012
thousand Euro
Germany 137,343 112,054
Other EU countries 5,485 4,796
U.S.A. 4,667 6,458
Others 103 76
Non-current assets 147,597 123,384
3 // Notes on essential itemsSelected non-current assets
Development of selected non-current assets from January 1 through September 30
Net book value1/1/2013
thousand Euro
Reclassification
thousand Euro
Additions
thousand Euro
Disposals/Other movements
thousand Euro
Depreciation and
amortization thousand Euro
Net book value
9/30/2013thousand Euro
Intangible assets 30,236 0 1,387 –71 3,871 27,681
Property, plant and equipment 71,755 0 9,377 –545 9,968 70,619
Securities 18,741 0 31,781 –1,694 0 48,828
Investments 2,652 0 0 –2,182 0 470
Other financial assets 1,116 0 525 –17 0 1,624
124,500 0 43,070 –4,509 13,839 149,222
The item “Disposals/Other movements” includes negative currency adjustments in the amount
of 85 thousand Euro.
Inventories 9/30/2013
thousand Euro12/31/2012
thousand Euro
Raw materials 7,857 7,432
Work in process 31,087 27,464
Finished goods 7,560 8,072
Prepayments for inventories 25 0
46,529 42,968
Equity
As of September 30, 2013, the share capital of Elmos Semiconductor AG consists of 19,658,475
shares. At present, the Company holds 327,697 treasury shares.
As of September 30, 2013, altogether 1,033,831 options from stock option plans are outstanding.
The options are attributable to the separate tranches as follows:
2009 2010 2011 2012 Total
Year of resolution and issue 2009 2010 2011 2012
Exercise price in Euro 3.68 7.49 8.027 7.42
Blocking period ex issue (years) 3 4 4 4
Exercise period after blocking period (years) 3 3 3 3
Options outstanding as of 12/31/2012 (number) 255,580 238,088 246,410 400,000 1,140,078
Exercised 1/1-9/30/2013 (number) 97,460 0 0 0 97,460
Forfeited 1/1-9/30/2013 (number) 800 1,660 1,875 4,452 8,787
Options outstanding as of 9/30/2013 (number) 157,320 236,428 244,535 395,548 1,033,831
Options exercisable as of 9/30/2013 (number) 157,320 0 0 0 157,320
4 // Information on financial instruments The following table lists the book values and fair values of the Group’s financial instruments. The
fair value of a financial instrument is the price that would be received for the sale of an asset or
paid for the transfer of a liability between market participants in a regular business transaction
as of the measurement date. In view of varying factors of influence, the presented fair values can
Elmos Interim Report July 1 − September 30, 2013 | 19
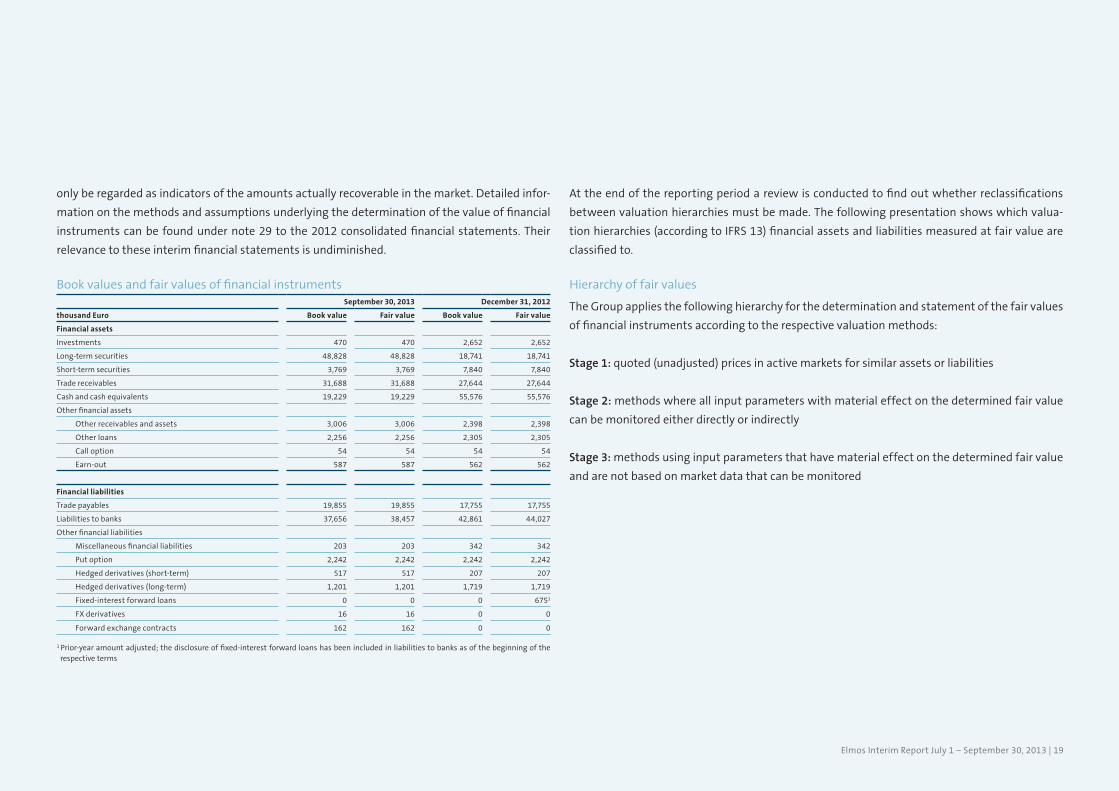
only be regarded as indicators of the amounts actually recoverable in the market. Detailed infor-
mation on the methods and assumptions underlying the determination of the value of financial
instruments can be found under note 29 to the 2012 consolidated financial statements. Their
relevance to these interim financial statements is undiminished.
Book values and fair values of financial instruments September 30, 2013 December 31, 2012
thousand Euro Book value Fair value Book value Fair value
Financial assets
Investments 470 470 2,652 2,652
Long-term securities 48,828 48,828 18,741 18,741
Short-term securities 3,769 3,769 7,840 7,840
Trade receivables 31,688 31,688 27,644 27,644
Cash and cash equivalents 19,229 19,229 55,576 55,576
Other financial assets
Other receivables and assets 3,006 3,006 2,398 2,398
Other loans 2,256 2,256 2,305 2,305
Call option 54 54 54 54
Earn-out 587 587 562 562
Financial liabilities
Trade payables 19,855 19,855 17,755 17,755
Liabilities to banks 37,656 38,457 42,861 44,027
Other financial liabilities
Miscellaneous financial liabilities 203 203 342 342
Put option 2,242 2,242 2,242 2,242
Hedged derivatives (short-term) 517 517 207 207
Hedged derivatives (long-term) 1,201 1,201 1,719 1,719
Fixed-interest forward loans 0 0 0 6751
FX derivatives 16 16 0 0
Forward exchange contracts 162 162 0 0
At the end of the reporting period a review is conducted to find out whether reclassifications
between valuation hierarchies must be made. The following presentation shows which valua-
tion hierarchies (according to IFRS 13) financial assets and liabilities measured at fair value are
classified to.
Hierarchy of fair values
The Group applies the following hierarchy for the determination and statement of the fair values
of financial instruments according to the respective valuation methods:
Stage 1: quoted (unadjusted) prices in active markets for similar assets or liabilities
Stage 2: methods where all input parameters with material effect on the determined fair value
can be monitored either directly or indirectly
Stage 3: methods using input parameters that have material effect on the determined fair value
and are not based on market data that can be monitored
1 Prior-year amount adjusted; the disclosure of fixed-interest forward loans has been included in liabilities to banks as of the beginning of the respective terms
20
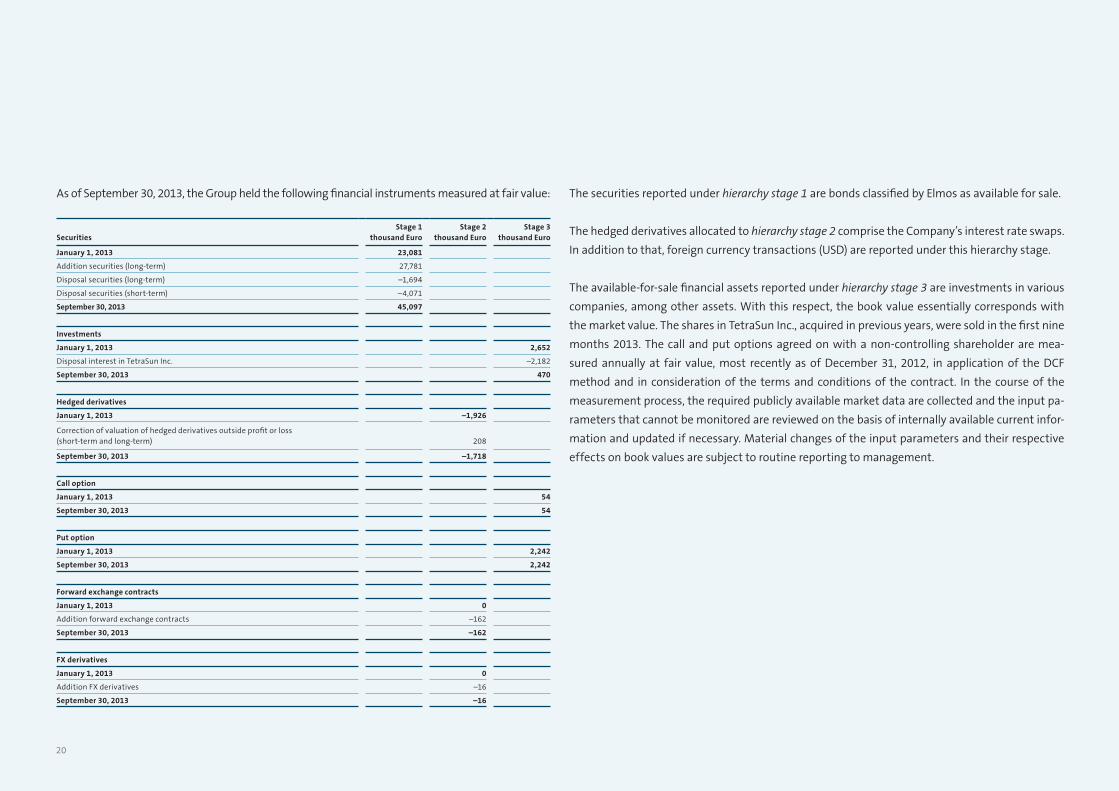
As of September 30, 2013, the Group held the following financial instruments measured at fair value:
SecuritiesStage 1
thousand EuroStage 2
thousand EuroStage 3
thousand Euro
January 1, 2013 23,081
Addition securities (long-term) 27,781
Disposal securities (long-term) –1,694
Disposal securities (short-term) –4,071
September 30, 2013 45,097
Investments
January 1, 2013 2,652
Disposal interest in TetraSun Inc. –2,182
September 30, 2013 470
Hedged derivatives
January 1, 2013 –1,926
Correction of valuation of hedged derivatives outside profit or loss (short-term and long-term) 208
September 30, 2013 –1,718
Call option
January 1, 2013 54
September 30, 2013 54
Put option
January 1, 2013 2,242
September 30, 2013 2,242
Forward exchange contracts
January 1, 2013 0
Addition forward exchange contracts –162
September 30, 2013 –162
FX derivatives
January 1, 2013 0
Addition FX derivatives –16
September 30, 2013 –16
The securities reported under hierarchy stage 1 are bonds classified by Elmos as available for sale.
The hedged derivatives allocated to hierarchy stage 2 comprise the Company’s interest rate swaps.
In addition to that, foreign currency transactions (USD) are reported under this hierarchy stage.
The available-for-sale financial assets reported under hierarchy stage 3 are investments in various
companies, among other assets. With this respect, the book value essentially corresponds with
the market value. The shares in TetraSun Inc., acquired in previous years, were sold in the first nine
months 2013. The call and put options agreed on with a non-controlling shareholder are mea-
sured annually at fair value, most recently as of December 31, 2012, in application of the DCF
method and in consideration of the terms and conditions of the contract. In the course of the
measurement process, the required publicly available market data are collected and the input pa-
rameters that cannot be monitored are reviewed on the basis of internally available current infor-
mation and updated if necessary. Material changes of the input parameters and their respective
effects on book values are subject to routine reporting to management.
Elmos Interim Report July 1 − September 30, 2013 | 21
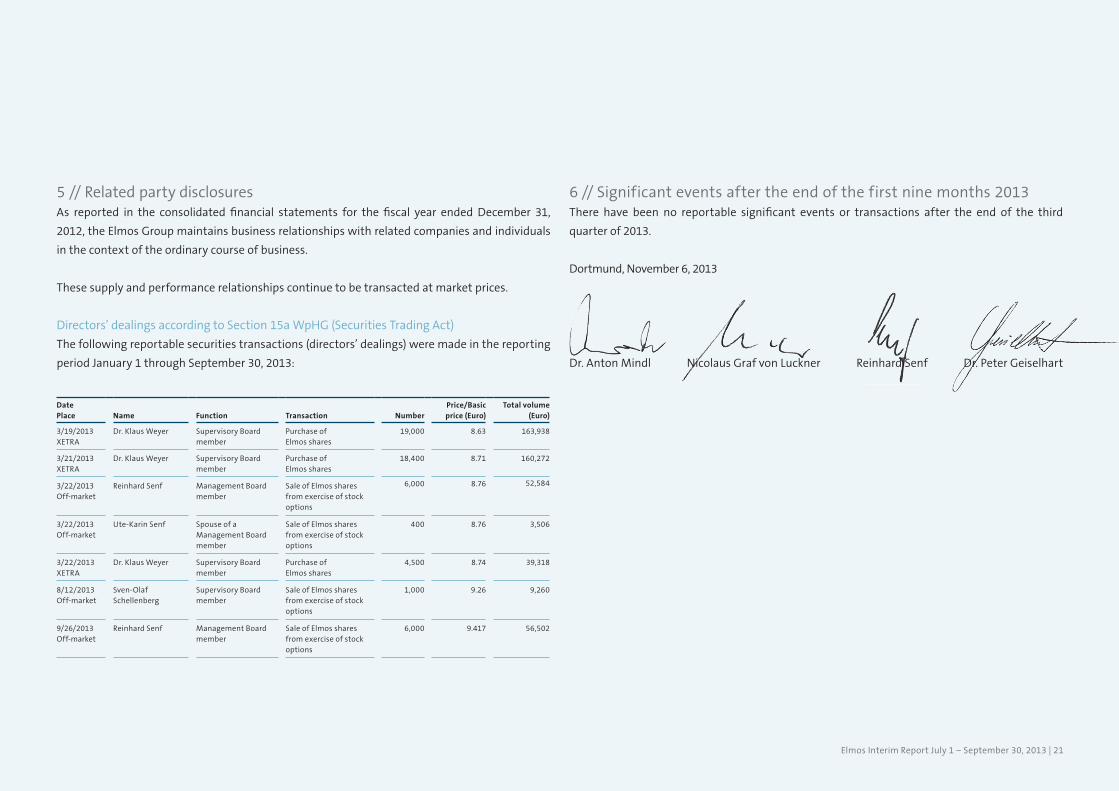
5 // Related party disclosures As reported in the consolidated financial statements for the fiscal year ended December 31,
2012, the Elmos Group maintains business relationships with related companies and individuals
in the context of the ordinary course of business.
These supply and performance relationships continue to be transacted at market prices.
Directors’ dealings according to Section 15a WpHG (Securities Trading Act)
The following reportable securities transactions (directors’ dealings) were made in the reporting
period January 1 through September 30, 2013:
DatePlace Name Function Transaction Number
Price/Basic price (Euro)
Total volume (Euro)
3/19/2013XETRA
Dr. Klaus Weyer Supervisory Board member
Purchase ofElmos shares
19,000 8.63 163,938
3/21/2013XETRA
Dr. Klaus Weyer Supervisory Board member
Purchase ofElmos shares
18,400 8.71 160,272
3/22/2013Off-market
Reinhard Senf Management Board member
Sale of Elmos shares from exercise of stock options
6,000 8.76 52,584
3/22/2013Off-market
Ute-Karin Senf Spouse of a Management Board member
Sale of Elmos shares from exercise of stock options
400 8.76 3,506
3/22/2013XETRA
Dr. Klaus Weyer Supervisory Board member
Purchase ofElmos shares
4,500 8.74 39,318
8/12/2013 Off-market
Sven-Olaf Schellenberg
Supervisory Board member
Sale of Elmos shares from exercise of stock options
1,000 9.26 9,260
9/26/2013 Off-market
Reinhard Senf Management Board member
Sale of Elmos shares from exercise of stock options
6,000 9.417 56,502
6 // Significant events after the end of the first nine months 2013 There have been no reportable significant events or transactions after the end of the third
quarter of 2013.
Dortmund, November 6, 2013
Dr. Anton Mindl Nicolaus Graf von Luckner Reinhard Senf Dr. Peter Geiselhart
22
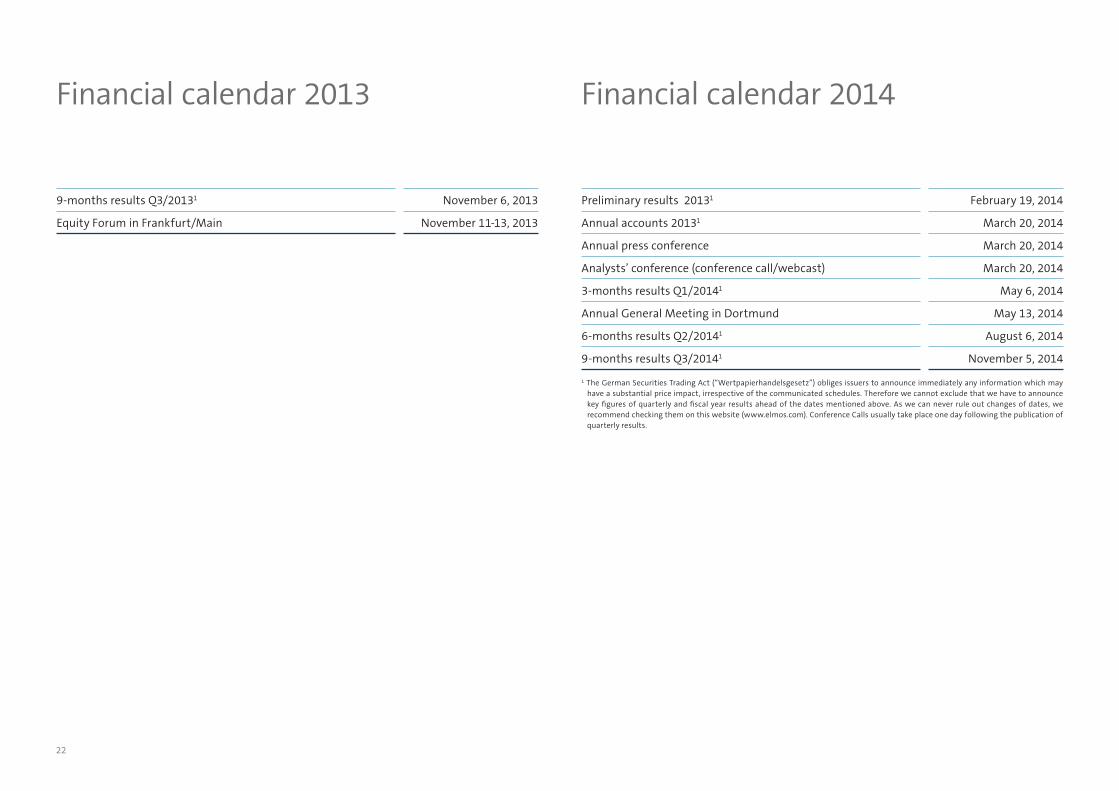
Financial calendar 2013 Financial calendar 2014
9-months results Q3/20131 November 6, 2013
Equity Forum in Frankfurt/Main November 11-13, 2013
Preliminary results 20131 February 19, 2014
Annual accounts 20131 March 20, 2014
Annual press conference March 20, 2014
Analysts’ conference (conference call/webcast) March 20, 2014
3-months results Q1/20141 May 6, 2014
Annual General Meeting in Dortmund May 13, 2014
6-months results Q2/20141 August 6, 2014
9-months results Q3/20141 November 5, 2014
1 The German Securities Trading Act (“Wertpapierhandelsgesetz”) obliges issuers to announce immediately any information which may have a substantial price impact, irrespective of the communicated schedules. Therefore we cannot exclude that we have to announce key figures of quarterly and fiscal year results ahead of the dates mentioned above. As we can never rule out changes of dates, we recommend checking them on this website (www.elmos.com). Conference Calls usually take place one day following the publication of quarterly results.
Elmos Interim Report July 1 − September 30, 2013 | 23
Janina Rosenbaum | Investor Relations
Phone + 49 (0) 231 - 75 49 - 287
Fax + 49 (0) 231 - 75 49 - 548
This interim report is released on November 6, 2013 in English and German. Both versions are availa-
ble for download on the Internet at www.elmos.com.
We are happy to send you additional informative material free of charge on your request.
Contact | Imprint
This report contains statements directed to the future that are based on assumptions and estimates made by the Elmos management. Even though we assume the underlying expectations of our statements to be realistic, we cannot guarantee these expectations will prove right. The assumptions may carry risks and uncertainties, and as a result actual events may differ materially from the current statements made with respect to the future. Among the factors that could cause such differences are changes in economic and business conditions, fluctuations of exchange rates and interest rates, the introduction of competing products, lack of acceptance of new products, and changes in business strategy. Elmos neither intends nor as-sumes any obligation to update its statements with respect to future events.
This English translation is for convenience purposes only.
24
Elmos Semiconductor AG
Heinrich-Hertz-Straße 1
44227 Dortmund | Germany
Phone + 49 (0) 231 - 75 49 - 0
Fax + 49 (0) 231 - 75 49 - 149
[email protected] | www.elmos.com
Recommended