Journal of Vocational Behavior, 6, 217-234 (1975)
Employee Perceptions of the Work Environment and Mental Health: A Suggestive Study
JAMES F. GAVIN Colorado State University
The purpose of this study was to examine a model for investigating employee mental health in industrial environments and, more particularly, to determine the extent to which a worker’s perceptions of the environment covaried with mental health criteria. The managerial segments of two divisions of a 35,000 employee company were represented in this study. Jn general, it was found that employees who perceived the environment as having clarity in the organizational structures, little administrative inter- ference in work processes, equitable reward systems, and trust and con- sideration for employees tended to have more favorable scores on mental health indices. Also, some differences between the two work environments, as well as between male and female employees, were noted and discussed.
The past decade has evidenced a significant redirection of studies concerning the mental health of industrial workers. Beginning with the works of Kornhauser (1965) and Kahn and his associates (Kahn, Wolfe, Quinn, Snoek & Rosenthal, 1964), attention seems to have shifted from an emphasis solely on the person (cf. Heron, 1952; Peck & Parsons, 1956; for examples) to one which viewed the organizational environment as an important determinant of workers’ mental health.1 Kornhauser’s study, for example, argued strongly for “situational” determinants of mental health-independent of the worker’s personality make-up. Kahn et al. also noted the importance of such job characteristics as role ambiguity and role conflict as causative influences on the job-related strains of industrial employees.
Representative of this current trend in industrial mental health research is the premise that the psychological well-being of workers in a function of both person and environment variables and their interaction (cf. Kahn &
The author expresses his appreciation to John Hamilton for his assistance in the data analyses and to Jacob Hautaluoma and Terry Dickenson for their helpful critique of an earlier draft of this paper. Requests for reprints should be addressed to Dr. James F. Gavin, Department of Psychology, Colorado State University, Fort Collins, CO 80523.
1A notable exception to this statement can be found in the emphases of Michigan’s Institute for Social Research on environmental factors dating back to the early 1950s.
217
Copyright @ 1975 by Academic Press. Inc. All rights of reproduction in any form reserved.
218 JAMES F. GAVIN
Mental Health
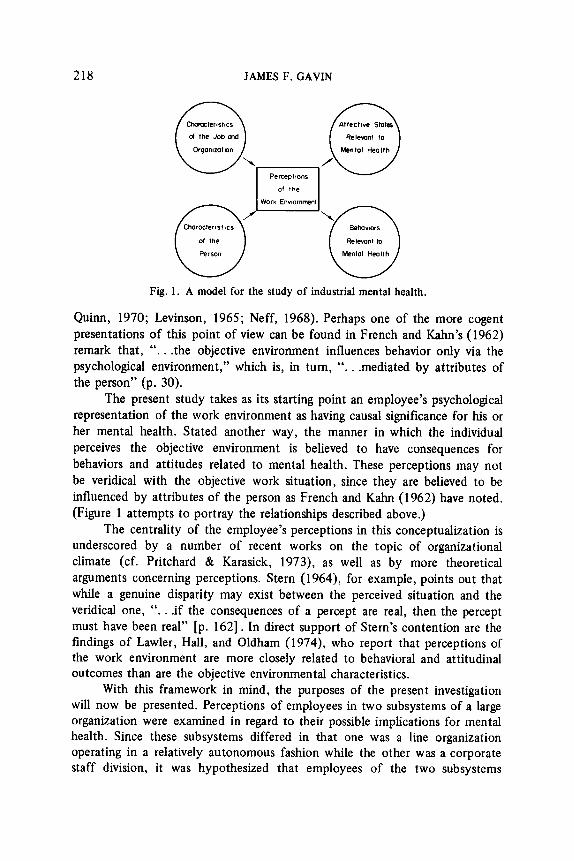
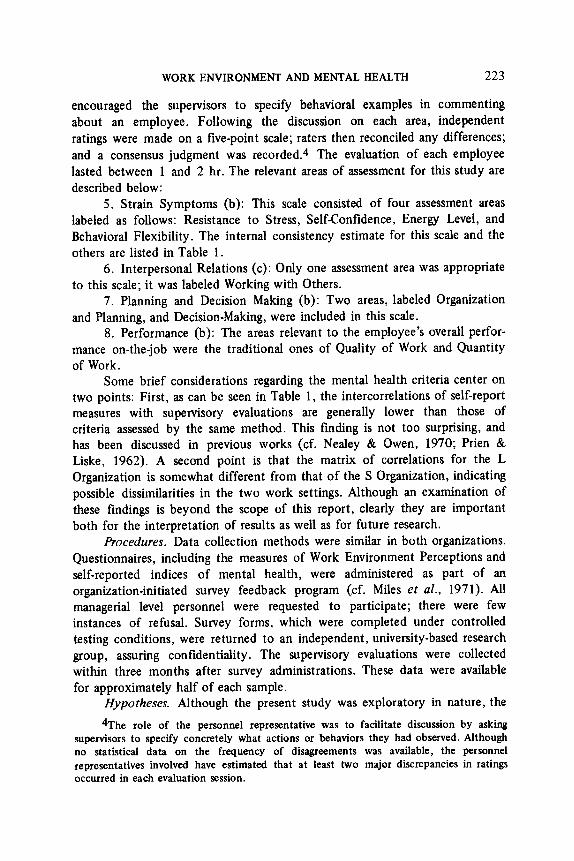
Fig. 1. A model for the study of industrial mental health.
Quinn, 1970; Levinson, 1965; Neff, 1968). Perhaps one of the more cogent presentations of this point of view can be found in French and Kahn’s (1962) remark that, “. . .the objective environment influences behavior only via the psychological environment,” which is, in turn, “. . .mediated by attributes of the person” (p. 30).
The present study takes as its starting point an employee’s psychological representation of the work environment as having causal significance for his or her mental health. Stated another way, the manner in which the individual perceives the objective environment is believed to have consequences for behaviors and attitudes related to mental health. These perceptions may not be veridical with the objective work situation, since they are believed to be influenced by attributes of the person as French and Kahn (1962) have noted. (Figure 1 attempts to portray the relationships described above.)
The centrality of the employee’s perceptions in this conceptualization is underscored by a number of recent works on the topic of organizational climate (cf. Pritchard & Karasick, 1973), as well as by more theoretical arguments concerning perceptions. Stern (1964), for example, points out that while a genuine disparity may exist between the perceived situation and the veridical one, “. . .if the consequences of a percept are real, then the percept must have been real” [p. 1621. In direct support of Stern’s contention are the findings of Lawler, Hall, and Oldham (1974), who report that perceptions of the work environment are more closely related to behavioral and attitudinal outcomes than are the objective environmental characteristics.
With this framework in mind, the purposes of the present investigation will now be presented. Perceptions of employees in two subsystems of a large organization were examined in regard to their possible implications for mental health. Since these subsystems differed in that one was a line organization operating in a relatively autonomous fashion while the other was a corporate staff division, it was hypothesized that employees of the two subsystems
WORKENVIRONMENTANDMENTAL HEALTH 219
would differ significantly in their perceptions of the work environment, as well as on mental health measures (Hypothesis 1).
A second area for investigation had to do with the relationship of employee perceptions to criteria of mental health suggested by the work of Jahoda (1958) among others (French & Kahn, 1962; Indik, Seashore & Slesinger, 1964; Zander & Quinn, 1962). A rather broad hypothesis underlying this aspect of the study was that perceptions of the work environment would have significant relationships with mental health criteria (Hypothesis 2). A further interest of this research concerned possible differences between the two work environments in correlations of employee perceptions with the mental health criteria (Hypothesis 3). Underlying this exploration was the assumption that the implications for mental health of employee perceptions might tend to differ depending upon the nature or characteristics of the organization, i.e., the “setting.”
The final area of inquiry in this study dealt with the issue of possible sex differences in work environment perceptions and mental health. Few studies in the literature of industrial mental health have reported data on sex differences (cf. Meltzer, 1964, for one exception), a possible side effect of employment practices favoring male workers. However, a reasonable argument could be made that males and females will differ in their “frames of reference” regarding work (cf. Alper, 1974; Helson, 1972) and, therefore, will vary in their perceptions of the work environment (Hypothesis 4). Further, it might be reasoned that these perceptions will have different implications for mental health, depending upon the sex of the worker (Hypothesis 5). These issues, then, were to be explored within the context of this study.
METHOD
Settings. Two subsystems of a 35,000 employee domestic airline partici- pated in this study. One was a regional center for the airline, while the other was the corporate management information and data processing organization; both employed approximately 3,000 members. The divisions of the airline represented different systems functions in that the first was a “production” or line organization, while the other served more of a staff or “adaptive/mainte- nance” function (Katz & Kahn, 1966). In subsequent sections, they will be referred to as the Line (L) and Staff(S) organizations.
Participants. In both organizations, research was conducted on the managerial employees only. Management in L and S differed in the following ways: Those in L were slightly older (XL = 40; 2s = 35), had more years in the company (yL = 12; & = 6), and had somewhat less formal education. These differences are consistent with the “professional” orientation of the
220 JAMES F. GAVIN
staff organization vis-a-vis that of the line division. Of the 257 participants in L, 54 were female (21%); 33 (or 15%) of 214 were female in S.
Instruments. Three sets of measures were relevant to this study: Work environment perceptions, mental health criteria as described by the worker, and mental health criteria as evaluated by an individual’s supervisors.
Work environment perceptions. A 106-item questionnaire was used to measure six dimensions derived from a principal-axis analysis and varimax rotation (cf. Gavin & Howe, 1974, for additional details).
A brief description of these dimensions is provided below; the figure in parentheses is coefficient alpha based on those items which loaded .35 or higher on the dimension.2
1. Clarity and Efficiency of Structure (.89): The degree to which organizational policies and guidelines are clearly defmed; responsibility is assigned; methods and procedures are kept current; and decisions are timely and appropriate.
2. Hindrance (.83): The extent to which inefficient work procedures and “administrivia” interfere with successful completion of tasks.
3. Rewards (.90): The extent to which employees feel that rewards are adequate and fair, and that sufficient opportunities exist for growth and advancement.
4. Esprit (.84): The degree to which employees express feelings of pride, loyalty, cooperation, and friendliness in their work activities.
5. Managerial Trust and Consideration (.91): The degree to which management places trust and confidence in subordinates by allowing them sufficient latitude in their work. This dimension also concerns the extent to which management encourages “innovation” in employee work behaviors.
6. Challenge and Risk (.67): The extent to which policies and practices encourage high standards of work performance and reasonable risk-taking among employees.
Dimension scores were computed by weighting the standardized item scores with factor loadings. It should be noted that although Hindrance is described in a negative manner, high scores on this as well as the other dimen- sions indicate more favorable perceptions, -e.g., less hindrance in this instance.
Since the method of deriving these dimensions included an orthogonal rotational procedure, the intercorrelations among the dimensions are understand- ably low. The range of correlations between dimensions was from - .15 to .20.
Mental health criteria, Four dimensions of “positive mental health” (Jahoda, 1958) suggested by previous investigators were assessed in this study;
2The decision to use .35 as a cutoff for including items in reliability estimation was based on the criteria of simple structure and psychological meaningfulness. That is, by using the .35 level interpretable factors could be described whose items tended to have loadings of .35 or more on only one factor.
WORK ENVIRONMENT AND MENTAL HEALTH 221
they were: (a) growth, development and self-actualization (French & Kahn, 1962; Jahoda, 1958; Maslow, 1943); (b) environmental mastery, including measures of performance and job strain (French & Kahn, 1962; Indik, et al., 1964; Zander & Quinn, 1962); (c)interpersonal relations (French & Kahn, 1962; Jahoda, 1958; Zander & Quinn, 1962); and (d) satisfaction (French & Kahn, 1962; Gurin, Veroff, & Feld, 1960; Zander & Quinn, 1962). These dimensions were operationalized in instruments administered to the workers, as well as to their supervisors.
The self-report measures which were obtained through responses to a survey questionnaire included the following (the letter in parentheses refers to one of the above mental health dimensions believed to be assessed by the scale):
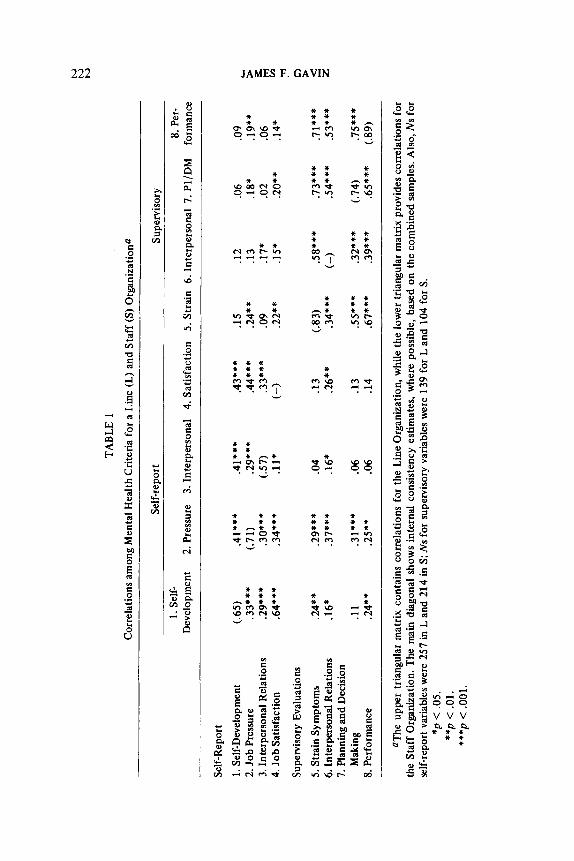
1. Self-Development Scale (a): The five items in this scale were assessed along five points ranging from “strongly agree” to “strongly disagree.” Sample items include: “I am getting valuable experience on my present job,” and “I have adequate opportunity to use my special skills and talents.” The internal consistency estimate (coefficient alpha) for this scale, as well as for the others, is reported in the main diagonal of Table 1.
2. Job-Related Pressure Scale (b): Similar in nature to the measure reported by Indik et al. (1964), this scale contained six items having the same format as described above. Sample items include: “My boss is continually pressuring me to get the job done,” and “I have too much work to do.”
3. Interpersonal Relations Scale (c): The two items in this scale, assessed in the same manner as described above, were: “I have a good relationship with employees in my work group,” and “All in all, the employees I work with are helpful and friendly to me.”
4. Job Satisfaction Scale (d): The index of job satisfaction was virtually identical to that reported by Gurin et al. (1960) and was assessed on a four-point scale, ranging from “very satisfied” to “very dissatisfied,” with no neutral category. It was phrased as follows: “Taking all things into considera- tion, I am -with my job.”
The supervisory evaluations were obtained as part of a new, company- wide assessment program for managerial-level employees. The format which was strictly adhered to in all cases is described as follows: Two levels of supervision above the individual being assessed met with a representative of the Personnel Department and completed a 19-item appraisal form. For each of the 19 areas to be rated, a behavioral check-list was provided as an aid to supervisors in discussing relevant job activities. 3 The personnel representative
3A staff psychologist in this organization helped develop the behavioral checklists from incidents described to him by management personnel. To illustrate, under the category of “Resistence to Stress,” such behaviorally-oriented items as the following were included on the check-list; Reports headaches once a week or more. Is “jittery” in meetings (e.g., sweats easily, taps pencil nervously), is sick or absent during “peak” work periods.
TABL
E 1
Cor
rela
tions
am
ong
Men
tal
Hea
lth C
riter
ia f
or a
Lin
e (L
) an
d S
taff
(S)
Org
aniz
atio
n”
Sel
f-rep
ort
Supe
rvis
ory
1. S
elf-
8. P
er-
Dev
elop
men
t 2.
Pre
ssur
e 3.
Inte
rper
sona
l 4.
Sat
isfa
ctio
n 5.
Stra
in
6. In
terp
erso
nal
7. P
l/DM
fo
rman
ce
Self-
Rep
ort
1. S
elf-D
evel
opm
ent
2. J
ob P
ress
ure
3. In
terp
erso
nal
Rel
atio
ns
4. J
ob S
atis
fact
ion
Supe
rvis
ory
Eval
uatio
ns
5. S
train
Sym
ptom
s 6.
inte
rper
sona
l R
elat
ions
7.
Pla
nnin
g an
d D
ecis
ion
Mak
ing
8. P
erfo
rman
ce
C.6
5)
.41*
**
.41*
**
.43*
**
.1.5
.1
2 .0
6 .0
9 .3
3***
(.7
1)
.29*
**
.44*
**
.24*
* .1
3 .1
8*
.19*
* .2
9***
.3
0***
(5
7)
.33*
**
.09
.17*
.0
2 .0
6 .6
4***
.3
4***
.1
1*
C-1
.2
2**
.15*
.2
0**
.14*
.24*
* .2
9***
.0
4 .1
3 (.W
.5
8***
.7
3***
.7
1***
.1
6*
.37*
**
.16*
.2
6**
.34*
**
C-1
.5
4* *
* .5
3***
.ll
.31*
**
.06
.13
.ss*
**
.32*
**
(.74)
.1
5***
.2
4**
.25*
* .0
6 .1
4 .6
7***
.3
9***
.6
5***
09
)
aThe
upp
er t
riang
ular
mat
rix
cont
ains
cor
rela
tions
fo
r th
e Li
ne O
rgan
izat
ion,
w
hile
the
low
er t
riang
ular
mat
rix
prov
ides
cor
rela
tions
for
th
e S
taff
Org
aniz
atio
n. T
he m
ain
diag
onal
sho
ws
inte
rnal
co
nsis
tenc
y es
timat
es,
whe
re p
ossi
ble,
bas
ed o
n th
e co
mbi
ned
sam
ples
. Als
o, N
s fo
r se
lf-re
port
varia
bles
wer
e 25
7 in
L a
nd 2
14 in
S; N
s fo
r su
perv
isor
y va
riabl
es w
ere
139
for
L an
d 10
4 fo
r S.
*p
< .
05.
**p
< .O
l. **
*p
< .O
Ol.
WORK ENVIRONMENT AND MENTAL HEALTH 223
encouraged the supervisors to specify behavioral examples in commenting about an employee. Following the discussion on each area, independent ratings were made on a five-point scale; raters then reconciled any differences; and a consensus judgment was recorded. 4 The evaluation of each employee lasted between 1 and 2 hr. The relevant areas of assessment for this study are described below:
5. Strain Symptoms (b): This scale consisted of four assessment areas labeled as follows: Resistance to Stress, Self-Confidence, Energy Level, and Behavioral Flexibility. The internal consistency estimate for this scale and the others are listed in Table 1.
6. Interpersonal Relations (c): Only one assessment area was appropriate to this scale; it was labeled Working with Others.
7. Planning and Decision Making (b): Two areas, labeled Organization and Planning, and Decision-Making, were included in this scale.
8. Performance (b): The areas relevant to the employee’s overall perfor- mance on-the-job were the traditional ones of Quality of Work and Quantity of Work.
Some brief considerations regarding the mental health criteria center on two points: First, as can be seen in Table 1, the intercorrelations of self-report measures with supervisory evaluations are generally lower than those of criteria assessed by the same method. This finding is not too surprising, and has been discussed in previous works (cf. Nealey & Owen, 1970; Prien & Liske, 1962). A second point is that the matrix of correlations for the L Organization is somewhat different from that of the S Organization, indicating possible dissimilarities in the two work settings. Although an examination of these findings is beyond the scope of this report, clearly they are important both for the interpretation of results as well as for future research.
Procedures. Data collection methods were similar in both organizations. Questionnaires, including the measures of Work Environment Perceptions and self-reported indices of mental health, were administered as part of an organization-initiated survey feedback program (cf. Miles ef al., 1971). All managerial level personnel were requested to participate; there were few instances of refusal. Survey forms, which were completed under controlled testing conditions, were returned to an independent, university-based research group, assuring confidentiality. The supervisory evaluations were collected within three months after survey administrations. These data were available for approximately half of each sample.
Hypotheses. Although the present study was exploratory in nature, the
4The role of the personnel representative was to facilitate discussion by asking supervisors to specify concretely what actions or behaviors they had observed. Although no statistical data on the frequency of disagreements was available, the personnel representatives involved have estimated that at least two major discrepancies in ratings occurred in each evaluation session.
224 JAMES F. GAVIN
following suggestive hypotheses have been made to guide the research analyses:
Hypothesis 1. Employees in the two work systems will differ in their perceptions of the work environment, as well as on measures of mental health.
Hypothesis 2. Perceptions of the work environment will be significantly related to measures of mental health.
Hypothesis 3. The correlations between work environment perceptions and mental health criteria will be different for the two work systems.
Hypothesis 4. Males and females will differ in their perceptions of the work environment, as well as on measures of mental health.
Hypothesis 5. The correlations between work environment perceptions and mental health criteria will be different for males and females.
RESULTS
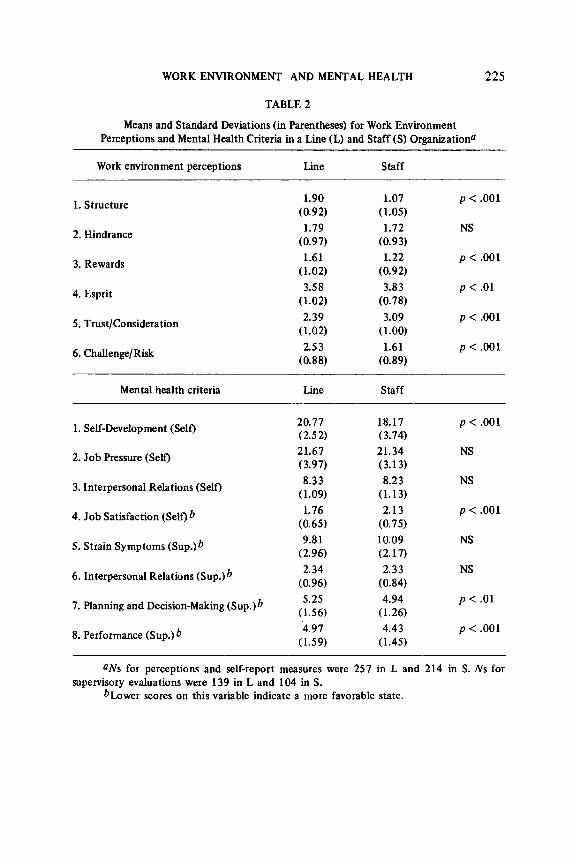
Work environment differences (Hypothesis 1). Using a one-way analysis of variance design, employee perceptions of the two work environments were found to differ significantly along five of the six dimensions studied (see Table 2). Employees in the line organization, as contrasted with the staff organization members, viewed the environment as having more structure, more adequate and fair rewards, somewhat lower “esprit,” less managerial considera- tion and trust, and more challenge and encouragement of risk-taking in the work setting. Both employee groups tended to perceive similar degrees of hindrance.
Another way in which the two environments were contrasted was in terms of the mental health measures. These results, as presented in the bottom half of Table 2, indicate differences on the Self-Development Scale (L > S) and the overall measure of job satisfaction (L > S), for the self-report variables, and on the Planning and Decision-Making and Performance criteria (S > L), for the supervisory-based criteria. While the meaning of the. super- visory rating differences is not immediately apparent, they might be accounted for by different performance standards across the two settings.
Overall, it would appear that the hypothesis of differences between the two environments, particularly with respect to Work Environment Perceptions, was supported.
Correlarions between work environment perceptions and mental health criteria (Hypotheses 2 and 3). The results of these analyses as presented in Table 3 provide general support for the “influence”5 of an employee’s perceptions of the work environment on various criteria of mental health
%ince the nature of this study was correlational, it was impossible to assess causal directions, thus necessitating an assumpfion that the perceptual indices were casual.
WORK ENVIRONMENT AND MENTAL HEALTH 225
TABLE 2
Means and Standard Deviations (in Parentheses) for Work Environment Perceptions and Mental Health Criteria in a Line (L) and Staff(S) Organizationa
Work environment perceptions Line Staff
1. Structure 1.90 1.07 p < .OOl (0.92) (1.05)
2. Hindrance 1.79 1.72 NS (0.97) (0.93)
3. Rewards 1.61 1.22 p < .OOl (1.02) (0.92)
4. Esprit 3.58 3.83 p < .Ol (1.02) (0.78)
5. Trust/Consideration 2.39 3.09 p < .OOl (1.02) (1.00)
6. Challenge/Risk 253 1.61 p < .OOl (0.88) (0.89)
Mental health criteria Line Staff
1. Self-Development (Self) 20.77 18.17 p < .OOl (2.5 2) (3.74)
2. Job Pressure (Self) 21.67 21.34 NS (3.97) (3.13)
3. Interpersonal Relations (Self) 8.33 8.23 NS (1.09) (1.13)
4. Job Satisfaction (Self) b 1.76 2.13 p < .OOl (0.65) (0.75)
5. Strain Symptoms (Sup.)b 9.81 10.09 NS (2.96) (2.17)
6. Interpersonal Relations (Sup.)b 2.34 2.33 NS
(0.96) (0.84)
7. Planning and Decision-Making (Sup.Jb 5.25 4.94 p< .Ol (1.56) (1.26)
8. Performance (Sup.)b 4.97 4.43 p < .OOl (1.59) (1.45)
aNs for perceptions and self-report measures were 257 in L and 214 in S. Ns for supervisory evaluations were 139 in L and 104 in S.
bL.ower scores on this variable indicate a more favorable state.
226 JAMES F. GAVIN
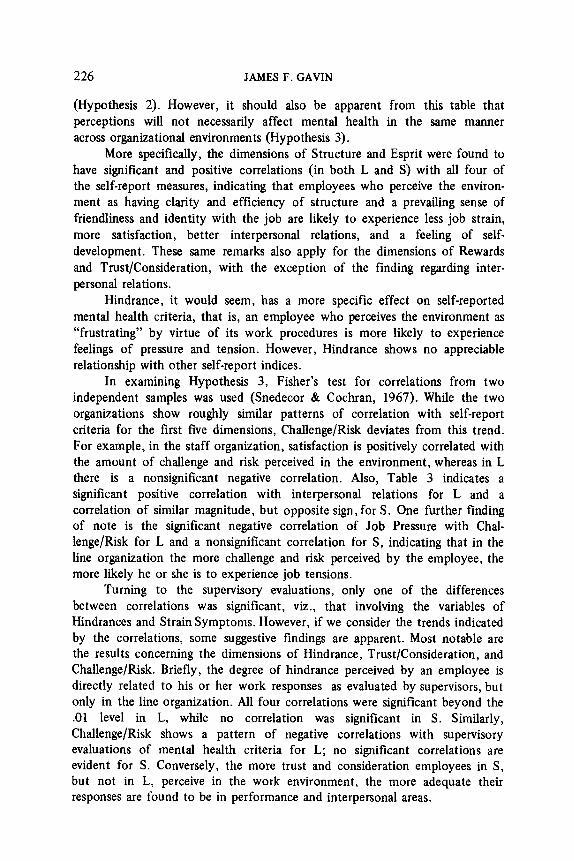
(Hypothesis 2). However, it should also be apparent from this table that perceptions will not necessarily affect mental health in the same manner across organizational environments (Hypothesis 3).
More specifically, the dimensions of Structure and Esprit were found to have significant and positive correlations (in both L and S) with all four of the self-report measures, indicating that employees who perceive the environ- ment as having clarity and efficiency of structure and a prevailing sense of friendliness and identity with the job are likely to experience less job strain, more satisfaction, better interpersonal relations, and a feeling of self- development. These same remarks also apply for the dimensions of Rewards and Trust/Consideration, with the exception of the finding regarding inter- personal relations.
Hindrance, it would seem, has a more specific effect on self-reported mental health criteria, that is, an employee who perceives the environment as “frustrating” by virtue of its work procedures is more likely to experience feelings of pressure and tension. However, Hindrance shows no appreciable relationship with other self-report indices.
In examining Hypothesis 3, Fisher’s test for correlations from two independent samples was used (Snedecor & Co&ran, 1967). While the two organizations show roughly similar patterns of correlation with self-report criteria for the first five dimensions, Challenge/Risk deviates from this trend. For example, in the staff organization, satisfaction is positively correlated with the amount of challenge and risk perceived in the environment, whereas in L there is a nonsignificant negative correlation. Also, Table 3 indicates a significant positive correlation with interpersonal relations for L and a correlation of similar magnitude, but opposite sign, for S. One further finding of note is the significant negative correlation of Job Pressure with Chal- lenge/Risk for L and a nonsignificant correlation for S, indicating that in the line organization the more challenge and risk perceived by the employee, the more likely he or she is to experience job tensions.
Turning to the supervisory evaluations, only one of the differences between correlations was significant, viz., that involving the variables of Hindrances and Strain Symptoms. However, if we consider the trends indicated by the correlations, some suggestive findings are apparent. Most notable are the results concerning the dimensions of Hindrance, Trust/Consideration, and Challenge/Risk. Briefly, the degree of hindrance perceived by an employee is directly related to his or her work responses as evaluated by supervisors, but only in the line organization. All four correlations were significant beyond the .Ol level in L, while no correlation was significant in S. Similarly, Challenge/Risk shows a pattern of negative correlations with supervisory evaluations of mental health criteria for L; no significant correlations are evident for S. Conversely, the more trust and consideration employees in S, but not in L, perceive in the work environment, the more adequate their responses are found to be in performance and interpersonal areas.
TABL
E 3
Cor
rela
tions
betw
een
Wor
k En
viro
nmen
t Per
cept
ions
and
Men
tal H
ealth
Crit
eria
for
a L
ine
(L)
and
Sta
ff(S
) O
rgan
izat
ion0
Trus
t/ M
ultip
le R
S
truct
ure
Hin
dran
ce
Rew
ards
Es
prit
Con
side
ratio
n C
halle
nge/
Ris
k
L S
L S
L s
L S
L S
L S
L S
Self-
Rep
ort
1. S
elf-D
evel
opm
ent
.51*
**
.fj5*
**
.2lI*
**
.20*
*
2. J
ob P
ress
ure
.65*
**
.54*
**
.22*
**
.26*
**
3. In
terp
erso
nal
Rel
atio
ns
.59*
**
.46*
* .2
5***
.1
7**
4. J
ob S
atis
fact
ion
.52*
**
.72*
**
.17*
* .2
9***
Supe
rvis
ory E
valu
atio
ns
5. S
train
Sym
ptom
s .3
8**
.20
.04
.06
6. In
terp
erso
nal
Rel
atio
ns
.31*
.3
6+
-.06
-.13
7. P
lann
ing a
nd
Dec
isio
n Mak
ing
.36*
* .2
9 -.0
4 -.0
2
8. P
erfo
rman
ce
.38*
* .3
1 -.0
8 -.0
4
-.06
.lO
.24*
**
.21*
**
-.02
-.07
-09
.ll
.26*
**
.Ol
.20*
* .lO
.24*
* .O
S
.24*
* .1
3
,22*
**
.36*
**
.24*
**
.21*
**
.oo
.09
.33*
**
.49*
**
.21*
* .1
8*
.14*
.2
4**
.21*
* .2
5**
.16*
.1
5*
.29*
**
.39*
c*
.52*
**
.29*
**
.14*
.16*
.ll
.18*
*
.22*
**
.25*
**
.3g*
**
.26*
**
.03
.06 .oo
.09
.22*
**
.46+
**
.09
.21*
**
.33*
**
.29*
**
-.26*
**
-.08
.06
.lO
.19*
* -.1
5*
.25*
**
.27*
**
-.09
.31*
**
.I2
.09
-.20*
* .o
o
.oo
.22*
* -.1
3 -.0
6
.03
.17*
-.2
1**
-.06
.03
.19*
-.2
2**
-.04
flNs
for
Line
Org
aniz
atio
n w
ere
257
for
corre
latio
ns w
ith s
elf-r
epor
t cr
iteria
and
139
for
supe
rvis
ory
eval
uatio
ns. N
s fo
r S
taff
Org
aniz
atio
n w
ere
214
for
for
self-
repo
rt an
d 10
4 fo
r su
perv
isor
y ev
alua
tions
. -In
dica
tes
that
und
erlin
ed c
orre
latio
ns a
re s
igni
fican
tly d
iffer
ent
from
eac
h ot
her a
t .05
leve
l. dn
dica
tes
that
un
derli
ned
corre
latio
ns a
re s
igni
fican
tly d
iffer
ent
from
eac
h ot
her
at .O
l lev
el.
*p <
.05.
**
p <
.Ol.
***p
<
,001
.
228 JAMES F. GAVIN
The one dimension on which the two organizations appear somewhat uniform is that of Rewards, where the more favorable the perception of reward systems, the better employee work responses tend to be-according to supervisors. As judged by the multiple correlations in Table 3, however, perceptions seem to account for more variance in supervisory ratings of mental health in the line than in the staff organization.
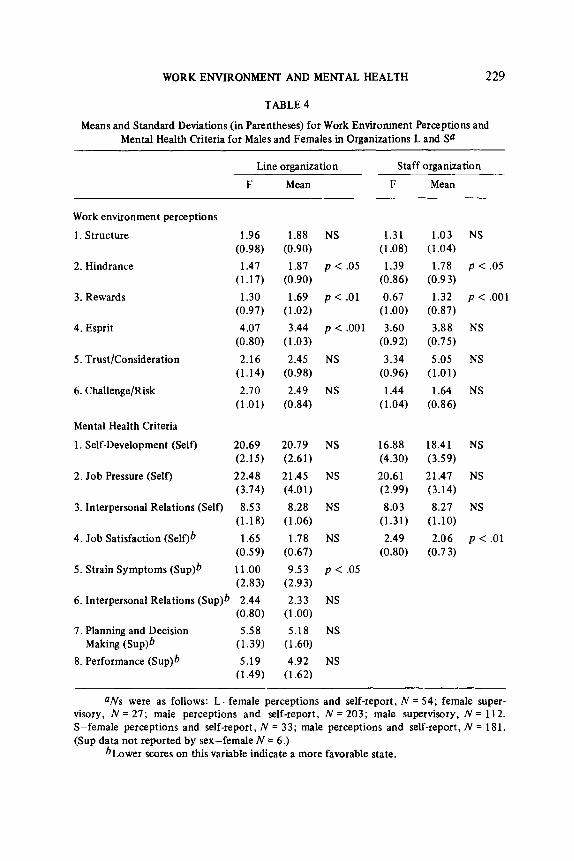
Sex differences in perceptions and mental health (Hypothesis 4). Two consistent findings emerge when we examine Work Environment Perceptions for males and females: Differences which were examined with a one-way analysis of variance design indicate that, first, females tend to perceive more administrative interference and other hindrances in the work environment and, second, males tend to perceive the work organization as being more equitable in its reward systems (e.g., pay and promotions). The only other difference was found in the line organization, where females perceived a higher level of “esprit” than did males.
On the self-reported mental health criteria, only one significant difference between sexes was found: females in S tended to feel significantly less satisfied with their jobs than males. For the supervisory evaluation, where comparisons could not be made for S due to the small number of females (N= 6) with supervisory data, females in L were noted as showing more symptoms of strain according to their supervisors.
Taken as a whole, these contrasts while not overwhelmingly supportive of Hypothesis 4, do indicate areas for further research, particularly with respect to the differential ratings on strain by supervisors, as well as the perceptual differences on Hindrance and Rewards.
Sex differences in correlations (Hypothesis 5). In describing differences between males and females, only those for which significant differences between the correlational values were found will be discussed (Table 5). Only 13 out of 72 or 18% of these differences were significant at the .I0 level or beyond,6 thereby providing weak support for the hypothesis of differential “impacts” of work environment perceptions. In spite of this, some of these results may be suggestive. For example, females, when compared to males in the staff organization, seem to respond with fewer feelings of pressure to environments they perceive as more structured. Similarly, such perceptions of structure also seem to foster more positive feelings about relationships with co-workers for females. On the other hand, males in L show more positive feelings about their self-development when they perceive management as evidencing trust and considerate behavior toward subordinates; females mani- fest no such relationship. A related finding is noted for the satisfaction
knee this part of the research was more for heuristic value than for hypothesis testing, the less conservative alpha-level of .lO was considered appropriate.
WORK ENVIRONMENT AND MENTAL HEALTH 229
TABLE 4
Means and Standard Deviations (in Parentheses) for Work Environment Perceptions and Mental Health Criteria for Males and Females in Organizations L and S”
Work environment perceptions
Line organization Staff organization
F Mean F Mean
1. Structure 1.96 (0.98)
2. Hindrance 1.47 (1.17)
3. Rewards 1.30 (0.97)
4. Esprit 4.07 (0.80)
5. Trust/Consideration 2.16 (1.14)
6. Challenge/Risk 2.70 (1.01)
Mental Health Criteria
1. Self-Development (Self) 20.69 (2.15)
2. Job Pressure (Self) 22.48 (3.74)
3. Interpersonal Relations (Self) 8.53 (1.18)
4. Job Satisfaction (Self)b 1.65 (0.59)
5. Strain Symptoms (Sup)b 11.00 (2.83)
1.88 NS 1.31 (0.90) (1.08)
1.87 p < .05 1.39 (0.90) (0.86)
1.69 p < .Ol 0.67 (1.02) (1.00) 3.44 p < .OOl 3.60
(1.03) (0.92)
2.45 NS 3.34 (0.98) (0.96)
2.49 NS 1.44 (0.84) (1.04)
20.79 (2.61)
21.45 (4.01)
8.28 (1.06)
1.78 (0.67)
9.53 (2.93)
NS 16.88 (4.30)
NS 20.61 (2.99)
NS 8.03 (1.31)
NS 2.49 (0.80)
p < .05
6. Interpersonal Relations (Sup)b 2.44 2.33 NS (0.80) (1.00)
7. Planning and Decision 5.58 5.18 NS Making (Sup@ (1.39) (1.60)
8. Performance (Sup)b 5.19 4.92 NS (1.49) (1.62)
1.03 NS (1.04)
1.78 p < .05 (0.9 3)
1.32 p < ,001 (0.87)
3.88 NS (0.7 5)
5.05 NS (1.01)
1.64 NS (0.86)
18.41 NS (3.59)
21.47 NS (3.14)
8.27 NS (1.10)
2.06 p < .Ol (0.7 3)
eNs were as follows: L-female perceptions and self-report, N = 54; female super- visory, N = 27; male perceptions and self-report, N = 203; male supervisory, N = 112. S-female perceptions and self-report, N = 33; male perceptions and self-report, N = 181. (Sup data not reported by sex-female N = 6.)
bLower scores on this variable indicate a more favorable state.
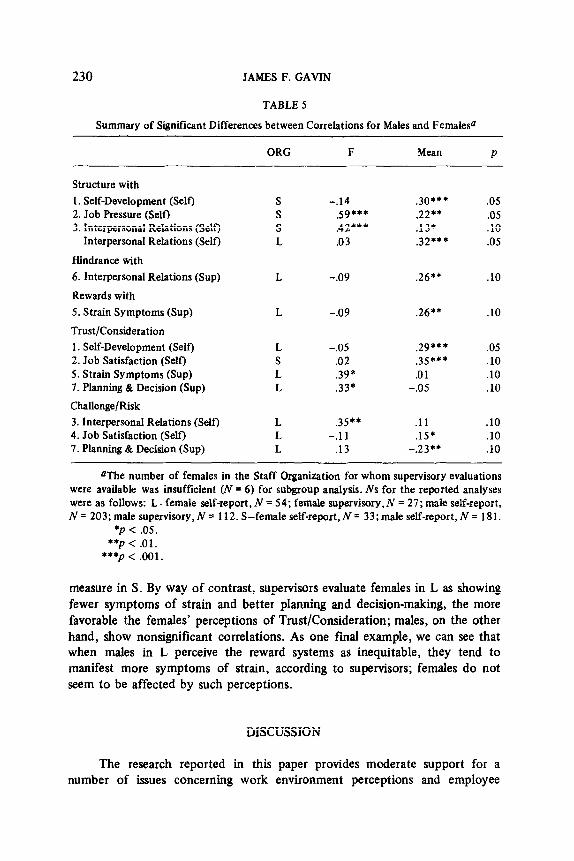
230 JAMES F. GAVIN
TABLE 5
Summary of Significant Differences between Correlations for Males and Females”
ORG F Mean P
Structure with 1. Self-Development (Self) 2. Job Pressure (Se10 3. Interpersonal Relations (Self)
Interpersonal Relations (Self)
Hindrance with 6. Interpersonal Relations (Sup)
Rewards with 5. Strain Symptoms (Sup)
Trust/Consideration 1. Self-Development (Self) 2. Job Satisfaction (Self) 5. Strain Symptoms (Sup) 7. Planning & Decision (Sup) Challenge/Risk 3. Interpersonal Relations (Self) 4. Job Satisfaction (Self) 7. Planning & Decision (Sup)
S S S L
L
L
L S L L
L L L
-.I4 .59*** .42*** .03
-.05 .02 .39* .33*
.35** -.ll
.13
.30***
.22**
.13+
.32***
.26**
.26**
.29***
.35***
.Ol -.05
.11
.15* -.23*+
.05 .05 .lO .05
.lO
.lO
.05
.lO
.lO
.lO
.lO
.lO
.lO
aThe number of females in the Staff Organization for whom supervisory evaluations were available was insufficient (N = 6) for subgroup analysis. Ns for the reported analyses were as follows: L-female self-report, N = 54; female supervisory,N = 27; male self-report, N = 203; male supervisory, N = 112. S-female self-report, N = 33; male self-report, N = 181.
*p < .05. **p < .Ol.
***p < .OOl.
measure in S. By way of contrast, supervisors evaluate females in L as showing fewer symptoms of strain and better planning and decision-making, the more favorable the females’ perceptions of Trust/Consideration; males, on the other hand, show nonsignificant correlations. As one final example, we can see that when males in L perceive the reward systems as inequitable, they tend to manifest more symptoms of strain, according to supervisors; females do not seem to be affected by such perceptions.
DISCUSSION
The research reported in this paper provides moderate support for a number of issues concerning work environment perceptions and employee
WORKENVIRONMENTANDMENTALHEALTH 231
mental health. It had been noted in the proposed model (Fig. 1) that employee perceptions of the work environment could be viewed as a function of characteristics of the environment, as well as those of individual perceivers. In examining data from the line and staff organizations, clear differences emerged on five of the six dimensions of Work Environment Perceptions (Table 2). For example, personnel in the line organization tended to view their work environment as being more clearly structured, as having more equitable reward systems, and providing greater challenge and encouragement of reasonable risk-taking. On the other hand, the staff organization showed greater “esprit” and more trusting and considerate supervisory behaviors, according to members’ perceptions. Some differences were also noted in the mental health criteria between these organizations.
When the issue of possible sex differences was explored, it was found that females (in both L and S), as compared to males, tended to perceive the environment/as being more “frustrating” and having less equitable rewards. It was also found that supervisors evaluated females as showing more signs of job related strain (Table 4). The implications of these results are difficult to discern given the absence of comparable analyses in other investigations. Perhaps females are treated differentially on the job, particularly in regard to rewards and administrative interference. Concerning the sex difference in job related strain, previous research (cf. Indik et al., 1964) provides some support for the belief that females, rather than actually experiencing more tension and strain, are simply more open in discussing such matters, thereby giving supervisors the impression that they are less resilient than men. Further research will be required to clarify these and other issues regarding sex differences.
In general, though, it can be said that an employee’s perceptions of the work environment do seem to vary depending upon personal and organiza- tional characteristics. Previous research by this author (Gavin, in press) further supports this notion.
Another major consideration of this study had to do with the relation- ships between work environment perceptions and measures of employee mental health (Table 3). The findings on this issue strongly supported the hypothesis that employee perceptions vary in systematic ways with criteria of mental health. In general, the more clearly structured the environment, the less hindrance, the more equitable the reward systems, and the more trust and consideration manifested by supervisors, the more positive the employees’ mental health. These findings are further supported by some related investiga- tions. Lyons (1971), for example, noted that role clarity, which may be seen as similar to the Structure dimension, varied inversely with job tensions. Kahn et al. (1964) also reported that tension scores were significantly higher under norms favoring low “rules orientation” (i.e., low Structure). In accord with the results for the Trust/Consideration dimension, Argyris (1962) predicts that
232 JAMES F. GAVIN
as interpersonal trust decreases within the organization, various facets of employee mental health also decline.
Another interesting finding in this connection was the tendency for employees in the line organization who perceived high degrees of challenge and risk in the work environment to have poorer mental health scores. This did not seem to be the case for the line organization. Perhaps what this implies, in a general sense, is that the impact of environmental perceptions on mental health must be considered contextually. In this instance, it may be that challenge and risk are viewed as somewhat threatening within a line organization; whereas in a staff organization such emphases are not as salient to the worker.
It might also be noted that while the relationships between work perceptions and self-report measures tended to be somewhat stronger than those for the supervisory criteria, 44% of the latter correlations were significant beyond the .OS level. This would seem to hold importance from two perspectives: First, the fact that work perceptions correlated with both subjective and more “objective” indices of mental health strengthens the basic argument of this research; and second, the significant correlations between supervisory measures and perceptions would tend to mitigate somewhat any attempt to account for the work perception-self-report correlations solely in terms of method variance.
A final issue in this research had to do with differences between correlations of perceptions and mental health for females and males (Table 5). Underlying this exploration was the notion that females may have different responses to their environmental perceptions than males, largely as a function of dissimilar “frames of reference.” While only a few significant differences were found, some suggestions for future investigations in this area can be noted. Of particular interest were the differential correlations concerning the dimensions of Structure and Trust/Consideration. It might well be, for example, that given the current status of females in the work force (cf. O’Toole, 1973) situations perceived as being somewhat “hostile” (low Trust/Consideration) and ambiguous (low Structure) create more symptoms of tension and strain for females than for males. While such remarks are clearly speculative, th,: underlying concerns seem worthy of additional research.
REFERENCES
Alper, T. The relationship between role orientation and achievement motivation in college women. Journal of Persona&y, 1973,41, 9-31.
Argyris, C. Interpersonal competence and organizational effectiveness. Homewood, IL: The Dorsey Press, 1962.
French, J. P. R., Jr., & Kahn, R. L. A programmatic approach to studying the industrial environment and mental health. Journal of Social Issues. 1962, 18, l-47.
WORK ENVIRONMENT AND MENTAL HEALTH 233
Gavin, J. F. Organizational climate as a function of personal and organizational variables. Journal of Applied Psychology, in press.
Gavin, J. F., & Howe, J. G. Perceived organizational climate: Some theoretical and empirical considerations. Unpublished manuscript, Colorado State University, 1974.
Gurin, G., Veroff, J., & Feld, S. Americans view their mental health: A nationwide interview survey. New York: Basic Books, 1960. Chapter VI.
Heron, A. A psychological study of occupational adjustment. Journal of Applied Psychology, 1952, 36, 385-387.
Helson, R. The changing image of the career woman. Journal of Social Issues, 1972, 28, 3346.
Indik, B. P., Seashore, S. E., & Slesinger, J. Demographic correlates of psychological strain. Journal of Abnormal and Social Psychology, 1964, 69, 26-38.
Jahoda, M. Current concepts of positive mental health. New York: Basic Books, 1958. Kahn, R., Wolfe, D., Quinn, R., Snoek, J., & Rosenthal, R. Organizational stress: Studies
in role conflict and ambiguity. New York: John Wiley & Sons, 1964. Kahn, R. L., & Quinn, R. P. Role stress: A framework for analysis. In A. McLean (Ed.),
Mental health and work organizations. New York: Rand McNally, 1970. Pp. 50-l 15.
Katz, D., & Kahn, R. L. The social psychology of organizations. New York: John Wiley & Sons, 1966.
Kornhauser, A. Mental health of the industrial worker: A Detroit study. New York: John Wiley & Sons, 1965.
Lawler, E. E., III, Hall, D. T., & Oldham, G. R. Organizational climate: Relationship to organizational structure, process, and performance. Organizational Behavior and Human Performance, 1974, 11, 139-155.
Levinson, H. Reciprocation: The relationship between man and organization. Administra- tive Science Quarterly, 1965, 9, 370-390.
Lyons, T. F. Role clarity, need for clarity, satisfaction, tension, and withdrawal. Organizational Behavior and Human Performance, 1971,6,99-l 10.
Maslow, A. A theory of human motivation. Psychological Review, 1943, 50, 370-396. Meltzer, H. Age and sex differences in workers’ perceptions of happiness for self and
others. Journal of Genetic Psychology, 1964, 105, l-l 1. Miles, M. B., Homstein, H. A., Calder, P. H., Callahan, D. M., & Schiavo, R. S. Data
feedback: A rationale. In H. A. Hornstein, B. B. Bunker, W. W. Burke, M. Cindes, & R. J. Lewicki (Eds.), Social intervention: A behavioral science approach. New York: The Free Press, 1971, Pp. 310-315.
Nealey, S. M., & Owen, T. W. Multitrait-multimethod analysis of predictors and criteria of nursing performance. Organizational Behavior and Human Performance, 1970, 5, 348-365.
Neff, W, S. Work and human nature. New York: Atherton Press, 1968. Q’Toole, J. (Chm.) Work in America. Report of a special task force to the Secretary of
Health, Education and Welfare. Cambridge, MA: MIT Press, 1973. Peck, R. F., & Parsons, J. W. Personality factors and work output: Four studies of
factory workers. Personnel Psychology, 1956, 9, 49-79. Prien, E. P., & Liske, R. E. Assessments of higher-level personnel. III. Rating criteria: A
comparative analysis of supervisory ratings and incumbent self-ratings of job performance. Personnel Psychology, 1962, 15, 187-194.
Pritchard, R. D., & Karasick, B. W. The effects of organizational climate on managerial job performance and job satisfaction. Organizational Behavior and Human Perfor- mance, 1973,9, 126-146.
234 JAMES F. GAVIN
Snedecor, G. W., & Cochran, W. G. Statistical methods. Ames, IA: The Iowa State University Press, 1967.
Stern, G. G. B = f (P,E). Journal of Personality Assessment, 1964, 28, 161-168. Zander, A., & Quinn, R. The social environment and mental health: A review of past
research at the Institute for Social Research. Journal of .‘hcial Issues, 1962, 18, 48-66.
Received: June 28, 1974.
Recommended