ENSC 427 COMMUNICATION
NETWORKS
SPRING2014
Final Project
High Resolution Video Streaming over
Wi-Fi, WiMAX and LTE
Group #: 15
Team Members:
Chen, Chris (Yi), 301069165 ([email protected])
Sheng, Sheng, 301084558 ([email protected])
Yoo, Jeff, 301120667 ([email protected])
Website: www.sfu.ca/~cyc19
SFU
1 | P a g e
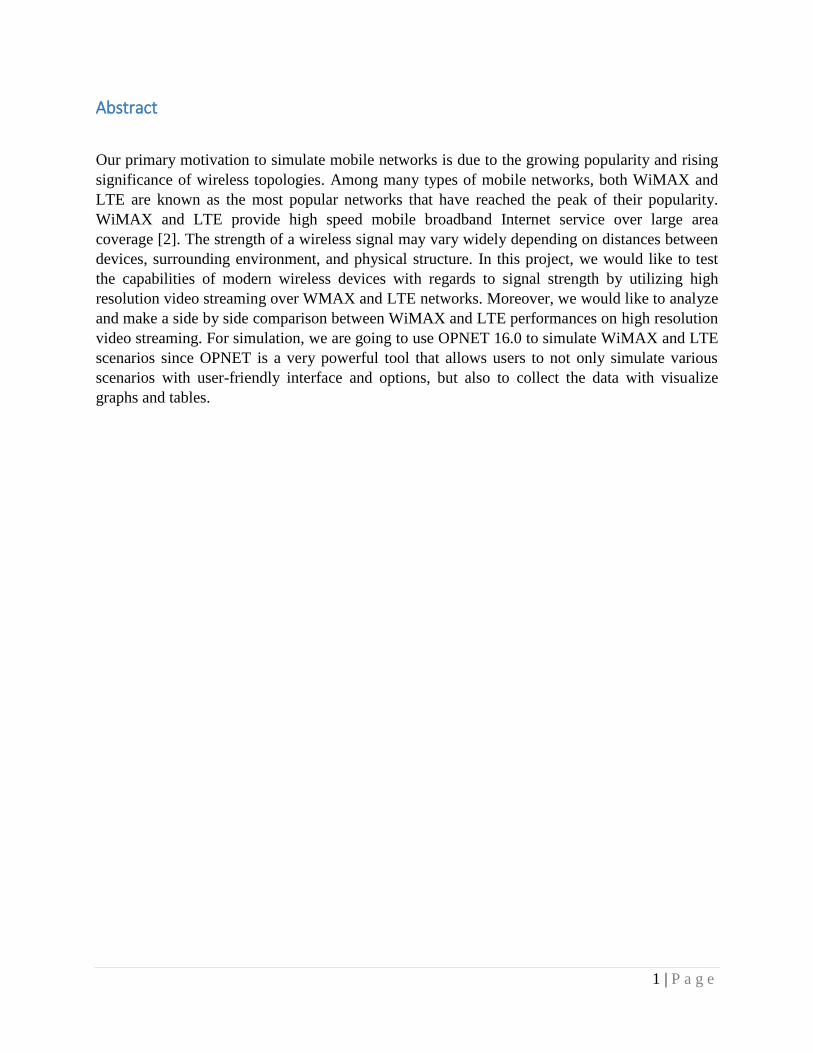
Abstract
Our primary motivation to simulate mobile networks is due to the growing popularity and rising
significance of wireless topologies. Among many types of mobile networks, both WiMAX and
LTE are known as the most popular networks that have reached the peak of their popularity.
WiMAX and LTE provide high speed mobile broadband Internet service over large area
coverage [2]. The strength of a wireless signal may vary widely depending on distances between
devices, surrounding environment, and physical structure. In this project, we would like to test
the capabilities of modern wireless devices with regards to signal strength by utilizing high
resolution video streaming over WMAX and LTE networks. Moreover, we would like to analyze
and make a side by side comparison between WiMAX and LTE performances on high resolution
video streaming. For simulation, we are going to use OPNET 16.0 to simulate WiMAX and LTE
scenarios since OPNET is a very powerful tool that allows users to not only simulate various
scenarios with user-friendly interface and options, but also to collect the data with visualize
graphs and tables.
2 | P a g e
Table of Contents Abstract.......................................................................................................................................................................... 1
1. Introduction ........................................................................................................................................................... 3
2. Backgrounds ......................................................................................................................................................... 4
I. High Resolution Video Streaming .................................................................................................................... 4
II. WiMAX ....................................................................................................................................................... 4
III. LTE .............................................................................................................................................................. 4
3. Application Design ............................................................................................................................................... 4
I. YouTube Application Configurations .............................................................................................................. 4
II. YouTube Profile Configuration ................................................................................................................... 7
4. System Design ...................................................................................................................................................... 7
I. Wi-Fi – Network Topologies ............................................................................................................................ 8
II. Wi-Fi – Configurations .............................................................................................................................. 10
III. WiMAX – Network Topologies ................................................................................................................. 11
IV. WiMAX – Configurations .......................................................................................................................... 12
V. LTE – Network Topologies........................................................................................................................ 14
Scenario 1: Arrangement of User Equipments (UE) in one direction: ................................................................ 14
Scenario 2: Arrangement of User Equipments (UE) in multiple locations: ........................................................ 15
VI. LTE – Configurations ................................................................................................................................ 16
5. Simulation Results .............................................................................................................................................. 17
I. Wi-Fi Throughput ........................................................................................................................................... 17
II. WiMAX Throughput .................................................................................................................................. 18
III. LTE Throughput ........................................................................................................................................ 19
Scenario 1: Same Direction ................................................................................................................................ 19
Scenario 2: Different Locations .......................................................................................................................... 20
IV. Delay .......................................................................................................................................................... 21
Wi-Fi Delay ........................................................................................................................................................ 21
WiMAX Delay .................................................................................................................................................... 22
LTE Delay .......................................................................................................................................................... 22
6. Wrap Up .............................................................................................................................................................. 24
I. Conclusion ...................................................................................................................................................... 24
II. Future Work ............................................................................................................................................... 25
7. References ........................................................................................................................................................... 26
3 | P a g e
1. Introduction
Technology has been advancing more dramatically and quickly than ever before these days.
Thanks to the technological development, new 4G wireless communication networks, like LTE
and WiMAX, are being implemented and are greatly contributing to the field of mobile
telecommunications. LTE and WiMAX applications are utilized not only in mobile technology,
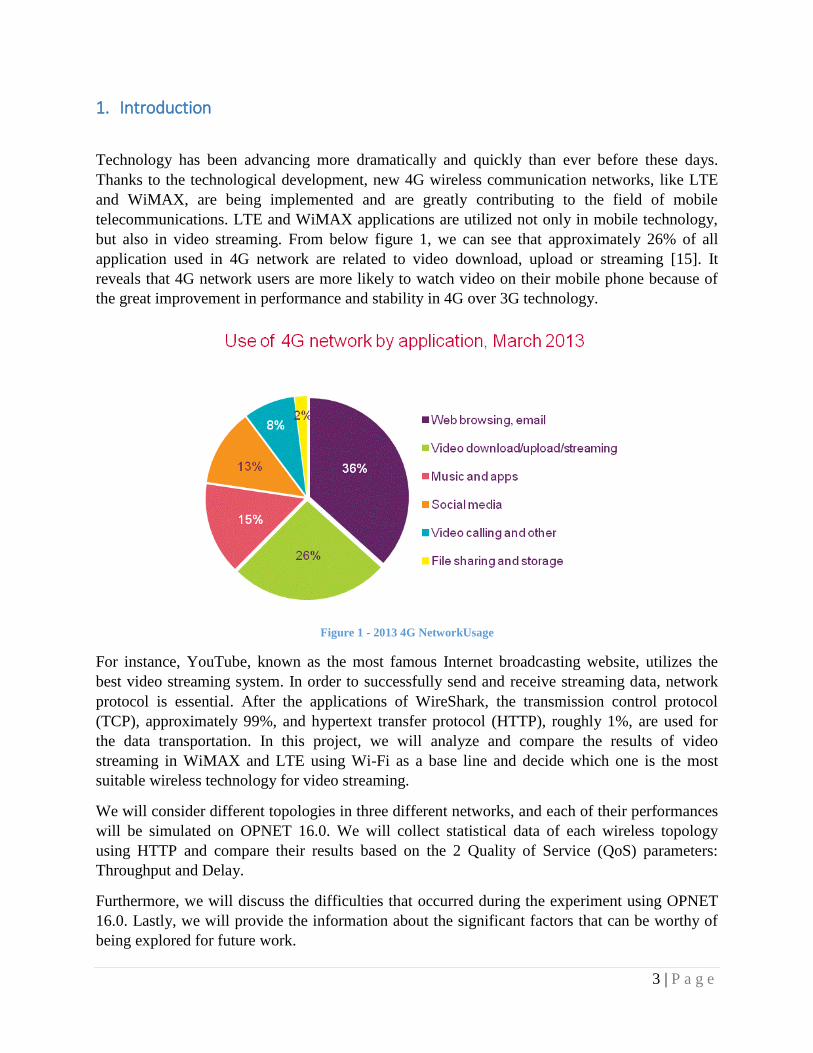
but also in video streaming. From below figure 1, we can see that approximately 26% of all
application used in 4G network are related to video download, upload or streaming [15]. It
reveals that 4G network users are more likely to watch video on their mobile phone because of
the great improvement in performance and stability in 4G over 3G technology.
Figure 1 - 2013 4G NetworkUsage
For instance, YouTube, known as the most famous Internet broadcasting website, utilizes the
best video streaming system. In order to successfully send and receive streaming data, network
protocol is essential. After the applications of WireShark, the transmission control protocol
(TCP), approximately 99%, and hypertext transfer protocol (HTTP), roughly 1%, are used for
the data transportation. In this project, we will analyze and compare the results of video
streaming in WiMAX and LTE using Wi-Fi as a base line and decide which one is the most
suitable wireless technology for video streaming.
We will consider different topologies in three different networks, and each of their performances
will be simulated on OPNET 16.0. We will collect statistical data of each wireless topology
using HTTP and compare their results based on the 2 Quality of Service (QoS) parameters:
Throughput and Delay.
Furthermore, we will discuss the difficulties that occurred during the experiment using OPNET
16.0. Lastly, we will provide the information about the significant factors that can be worthy of
being explored for future work.
4 | P a g e
2. Backgrounds
I. High Resolution Video Streaming As technologies have advanced rapidly, Ultra HD (known as 4K resolution) will soon become
the mainstream in display market. Currently, we see many 4K products are developed such as
Samsung's and Sony's TVs, monitors, and Panasonics' cameras. Since the resolution of Ultra HD
is about 4 times more than Full HD, 1080p, it requires more bandwidth in order to maintain the
transmission of video streaming.
II. WiMAX Worldwide Interoperability for Microwave Access (WiMAX) is a wireless communication
standard which can be designed with low cost (unlike LTE). WiMAX can become an alternative
of cable and digital subscriber line (DSL) and provides fast data transfer even in remote and
scarcely populated areas [7].WiMAX theoretical speed is 75 Mbps and the area cover up to
50Km [8].
III. LTE Long Term Evolution (LTE) is an innovation in a wireless communication technology, and
possesses broad range of channel bandwidth which can lead to very fast downloading rate [1]. It
was created to increase the speed of wireless data networks with the use of digital signal
processing. In spite of less coverage in distances for Internet access compare to WiMAX, LTE's
theoretical speed of download is up to 326.4Mbps, and uploading speeds are up to 86.4 Mbps [8].
3. Application Design
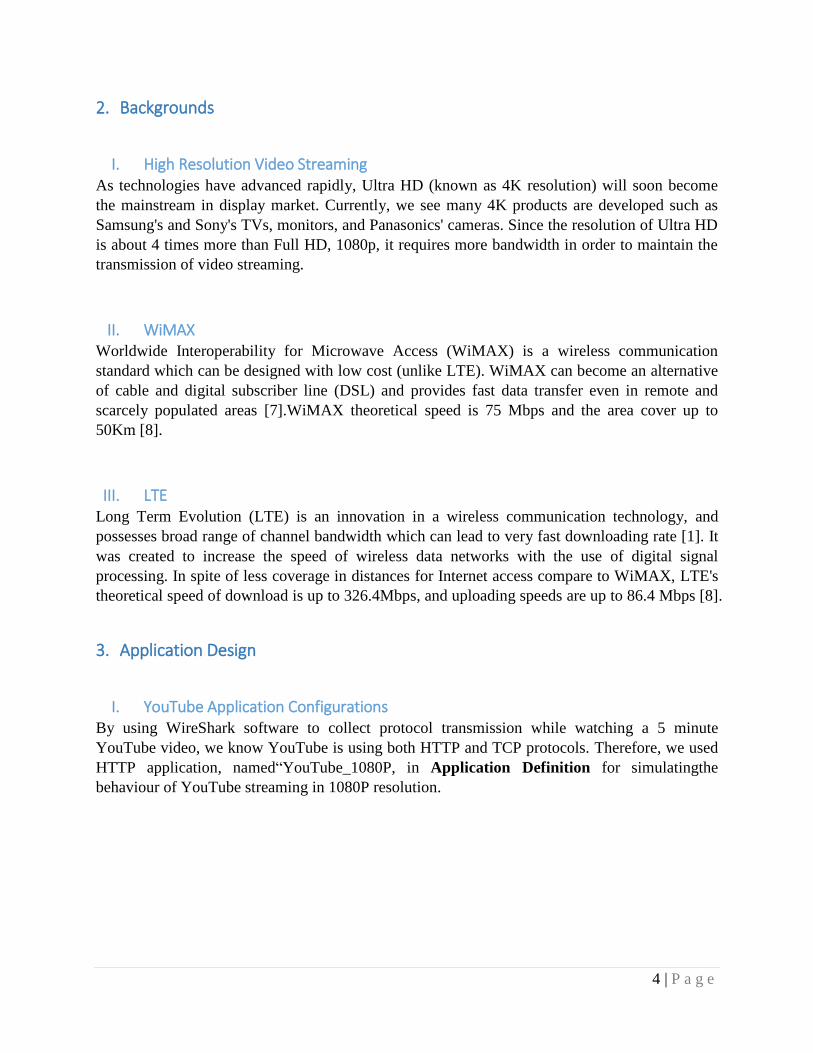
I. YouTube Application Configurations By using WireShark software to collect protocol transmission while watching a 5 minute
YouTube video, we know YouTube is using both HTTP and TCP protocols. Therefore, we used
HTTP application, named“YouTube_1080P, in Application Definition for simulatingthe
behaviour of YouTube streaming in 1080P resolution.
5 | P a g e
Figure 2 - Application Definition
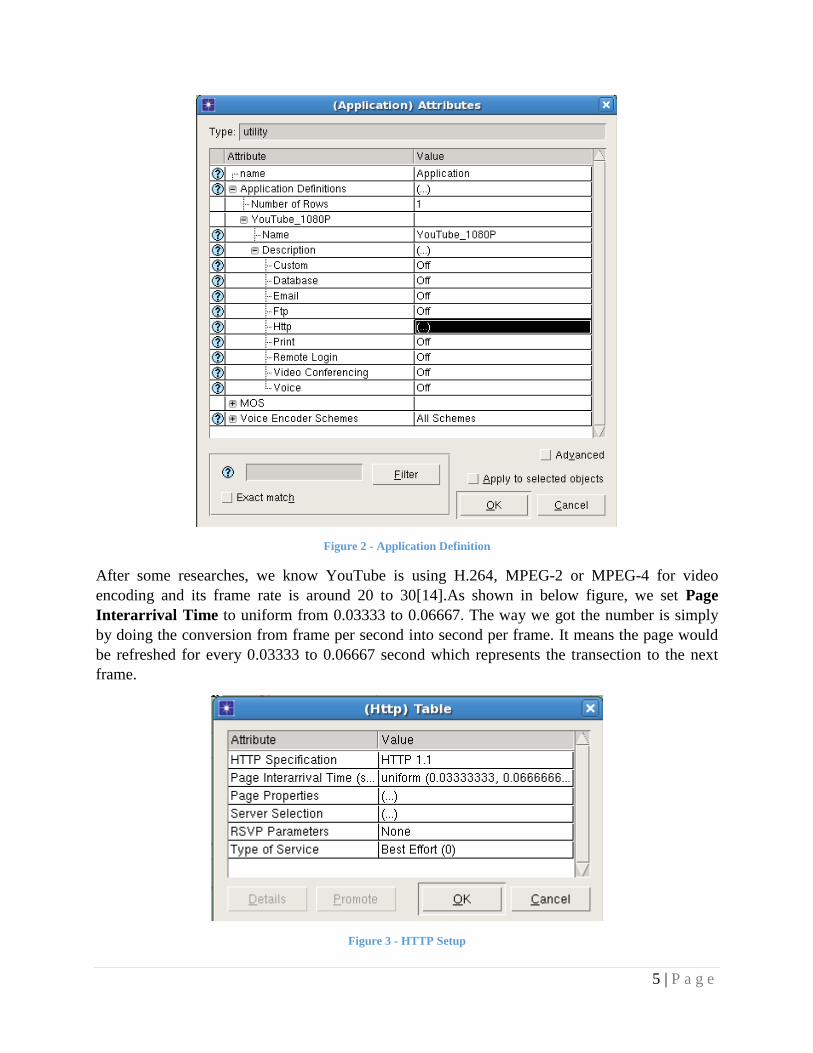
After some researches, we know YouTube is using H.264, MPEG-2 or MPEG-4 for video
encoding and its frame rate is around 20 to 30[14].As shown in below figure, we set Page
Interarrival Time to uniform from 0.03333 to 0.06667. The way we got the number is simply
by doing the conversion from frame per second into second per frame. It means the page would
be refreshed for every 0.03333 to 0.06667 second which represents the transection to the next
frame.
Figure 3 - HTTP Setup
6 | P a g e
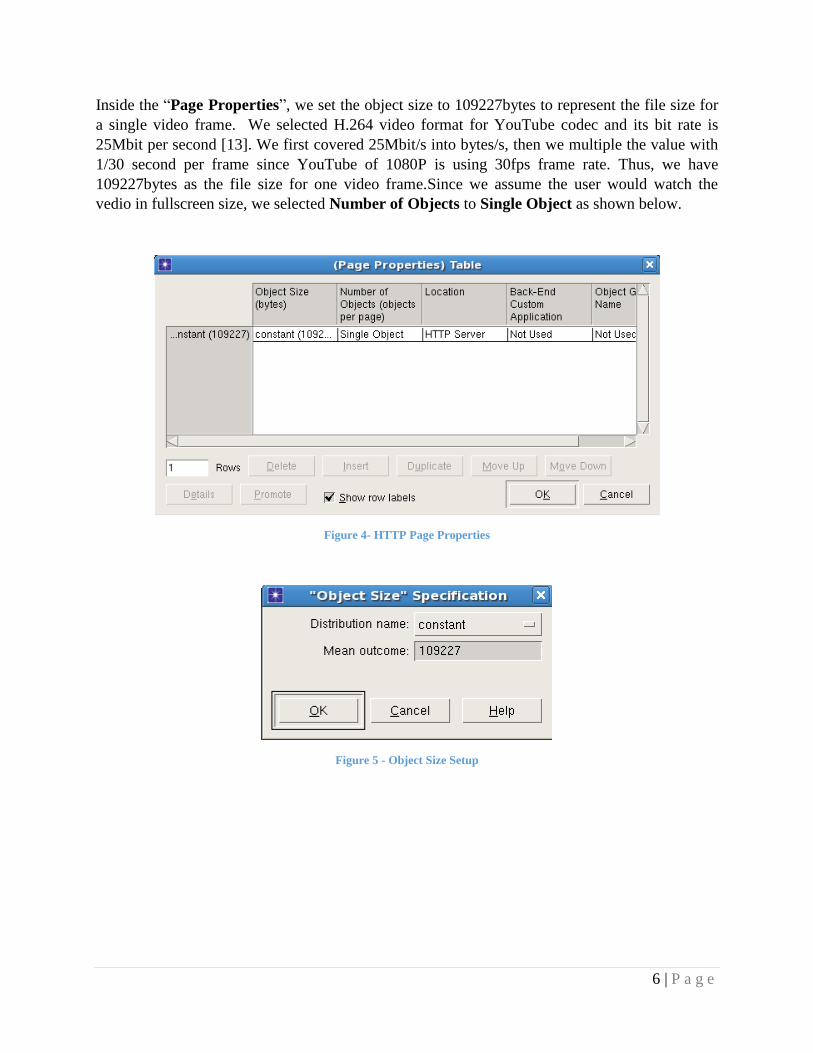
Inside the “Page Properties”, we set the object size to 109227bytes to represent the file size for
a single video frame. We selected H.264 video format for YouTube codec and its bit rate is
25Mbit per second [13]. We first covered 25Mbit/s into bytes/s, then we multiple the value with
1/30 second per frame since YouTube of 1080P is using 30fps frame rate. Thus, we have
109227bytes as the file size for one video frame.Since we assume the user would watch the
vedio in fullscreen size, we selected Number of Objects to Single Object as shown below.
Figure 4- HTTP Page Properties
Figure 5 - Object Size Setup
7 | P a g e
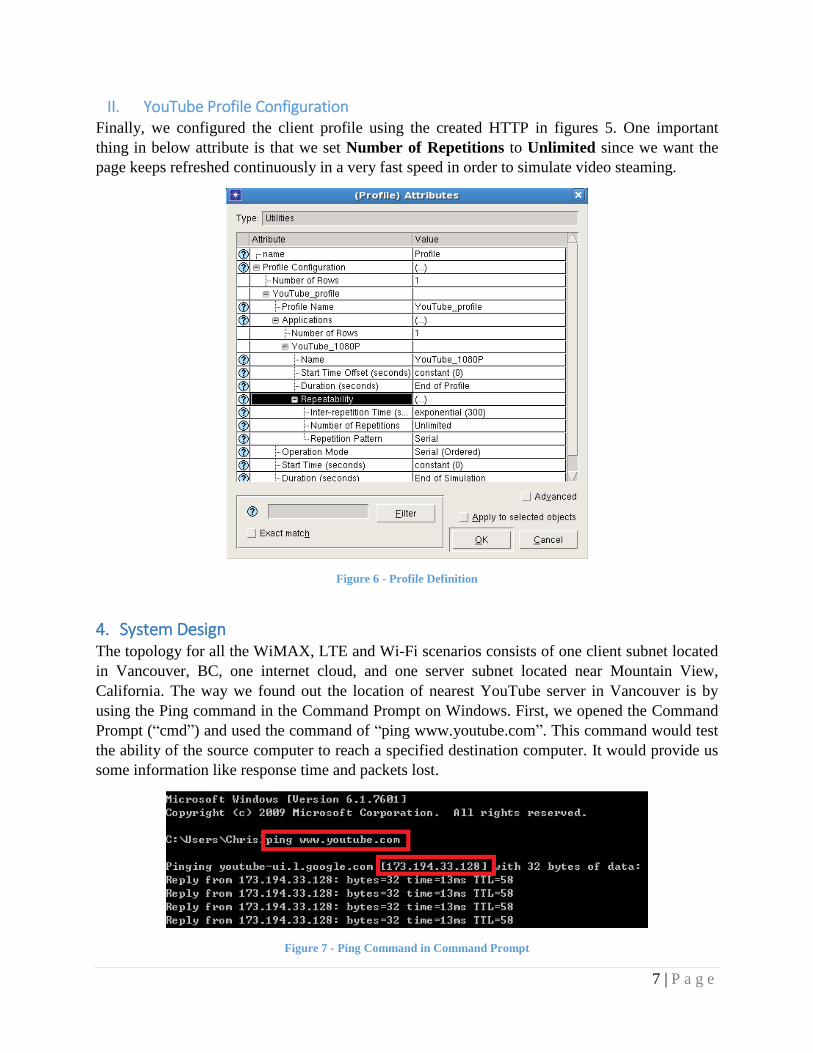
II. YouTube Profile Configuration Finally, we configured the client profile using the created HTTP in figures 5. One important
thing in below attribute is that we set Number of Repetitions to Unlimited since we want the
page keeps refreshed continuously in a very fast speed in order to simulate video steaming.
Figure 6 - Profile Definition
4. System Design The topology for all the WiMAX, LTE and Wi-Fi scenarios consists of one client subnet located
in Vancouver, BC, one internet cloud, and one server subnet located near Mountain View,
California. The way we found out the location of nearest YouTube server in Vancouver is by
using the Ping command in the Command Prompt on Windows. First, we opened the Command
Prompt (“cmd”) and used the command of “ping www.youtube.com”. This command would test
the ability of the source computer to reach a specified destination computer. It would provide us
some information like response time and packets lost.
Figure 7 - Ping Command in Command Prompt
8 | P a g e
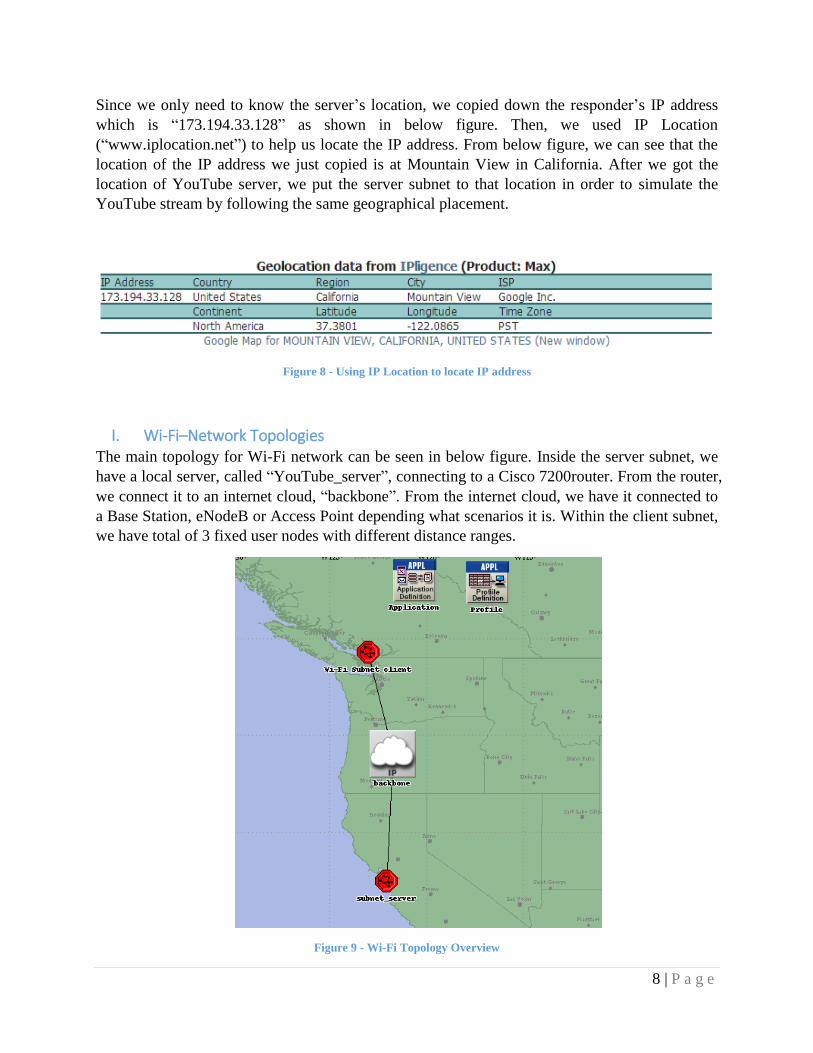
Since we only need to know the server’s location, we copied down the responder’s IP address
which is “173.194.33.128” as shown in below figure. Then, we used IP Location
(“www.iplocation.net”) to help us locate the IP address. From below figure, we can see that the
location of the IP address we just copied is at Mountain View in California. After we got the
location of YouTube server, we put the server subnet to that location in order to simulate the
YouTube stream by following the same geographical placement.
Figure 8 - Using IP Location to locate IP address
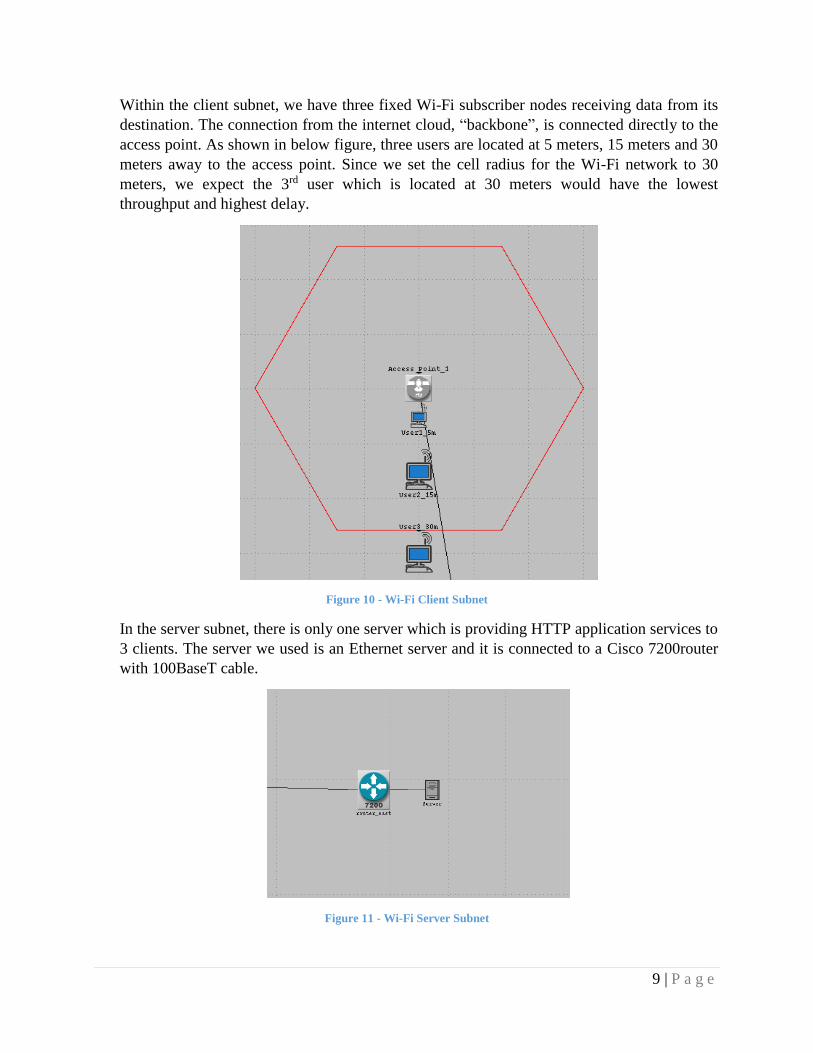
I. Wi-Fi–Network Topologies The main topology for Wi-Fi network can be seen in below figure. Inside the server subnet, we
have a local server, called “YouTube_server”, connecting to a Cisco 7200router. From the router,
we connect it to an internet cloud, “backbone”. From the internet cloud, we have it connected to
a Base Station, eNodeB or Access Point depending what scenarios it is. Within the client subnet,
we have total of 3 fixed user nodes with different distance ranges.
Figure 9 - Wi-Fi Topology Overview
9 | P a g e
Within the client subnet, we have three fixed Wi-Fi subscriber nodes receiving data from its
destination. The connection from the internet cloud, “backbone”, is connected directly to the
access point. As shown in below figure, three users are located at 5 meters, 15 meters and 30
meters away to the access point. Since we set the cell radius for the Wi-Fi network to 30
meters, we expect the 3rd user which is located at 30 meters would have the lowest
throughput and highest delay.
Figure 10 - Wi-Fi Client Subnet
In the server subnet, there is only one server which is providing HTTP application services to
3 clients. The server we used is an Ethernet server and it is connected to a Cisco 7200router
with 100BaseT cable.
Figure 11 - Wi-Fi Server Subnet
10 | P a g e
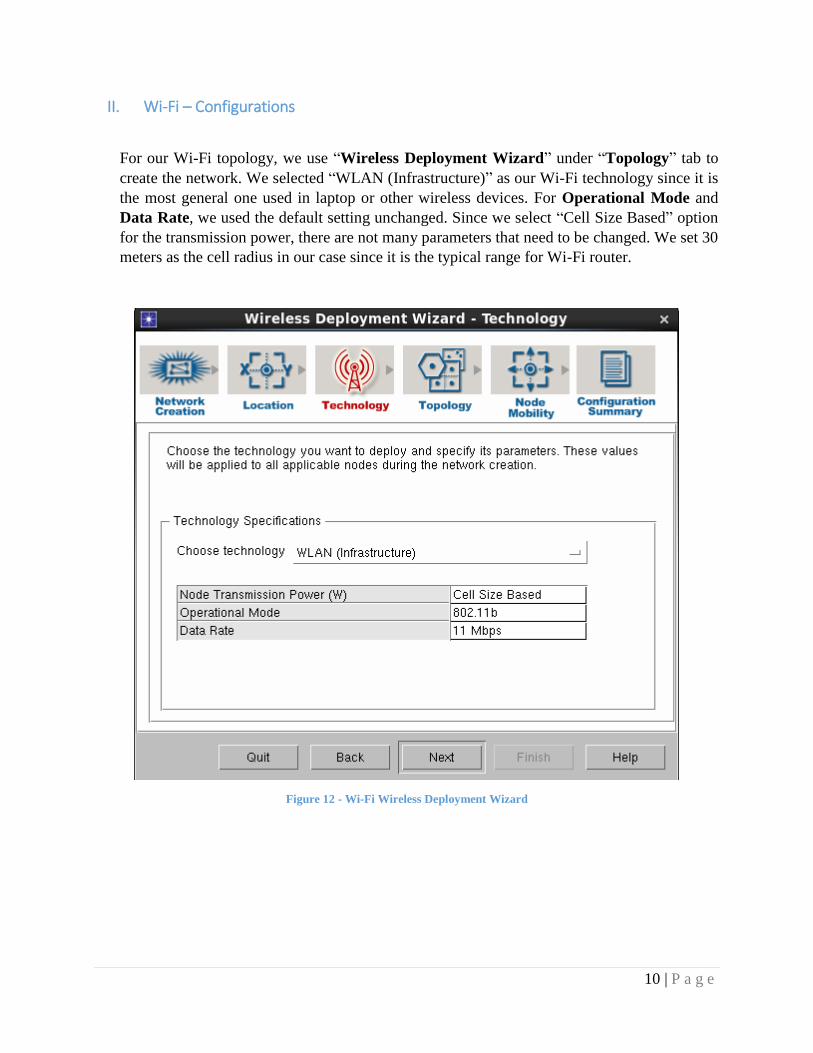
II. Wi-Fi – Configurations
For our Wi-Fi topology, we use “Wireless Deployment Wizard” under “Topology” tab to
create the network. We selected “WLAN (Infrastructure)” as our Wi-Fi technology since it is
the most general one used in laptop or other wireless devices. For Operational Mode and
Data Rate, we used the default setting unchanged. Since we select “Cell Size Based” option
for the transmission power, there are not many parameters that need to be changed. We set 30
meters as the cell radius in our case since it is the typical range for Wi-Fi router.
Figure 12 - Wi-Fi Wireless Deployment Wizard
11 | P a g e
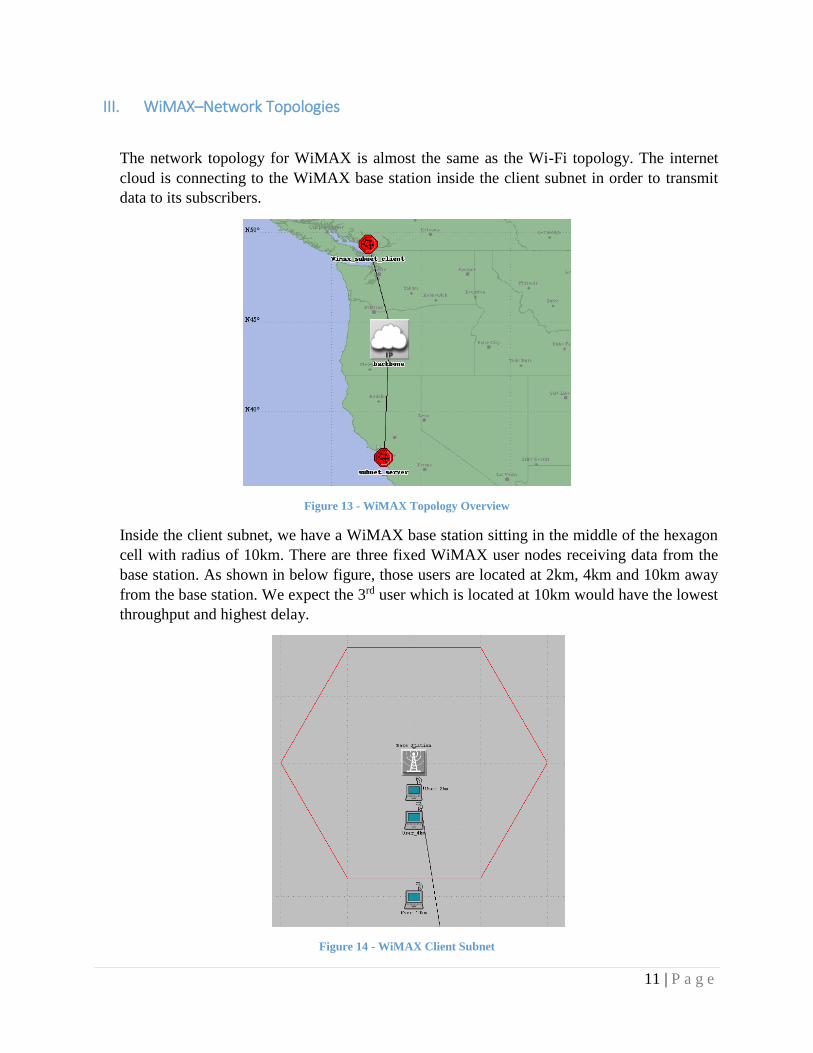
III. WiMAX–Network Topologies
The network topology for WiMAX is almost the same as the Wi-Fi topology. The internet
cloud is connecting to the WiMAX base station inside the client subnet in order to transmit
data to its subscribers.
Figure 13 - WiMAX Topology Overview
Inside the client subnet, we have a WiMAX base station sitting in the middle of the hexagon
cell with radius of 10km. There are three fixed WiMAX user nodes receiving data from the
base station. As shown in below figure, those users are located at 2km, 4km and 10km away
from the base station. We expect the 3rd user which is located at 10km would have the lowest
throughput and highest delay.
Figure 14 - WiMAX Client Subnet
12 | P a g e
For the server subnet, it is exactly the same as the server subnet in Wi-Fi topology. The local
server is also providing HTTP application service to three WiMAX clients.
Figure 15 - WiMAX Server Subnet
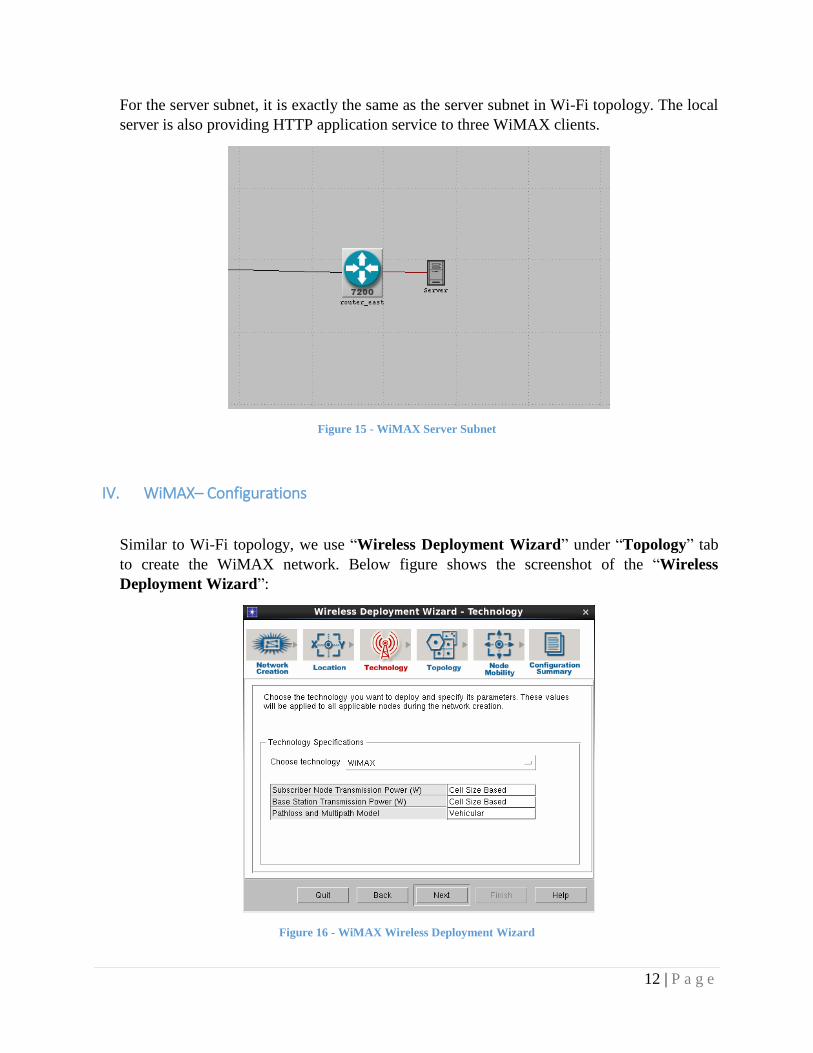
IV. WiMAX– Configurations
Similar to Wi-Fi topology, we use “Wireless Deployment Wizard” under “Topology” tab
to create the WiMAX network. Below figure shows the screenshot of the “Wireless
Deployment Wizard”:
Figure 16 - WiMAX Wireless Deployment Wizard
13 | P a g e
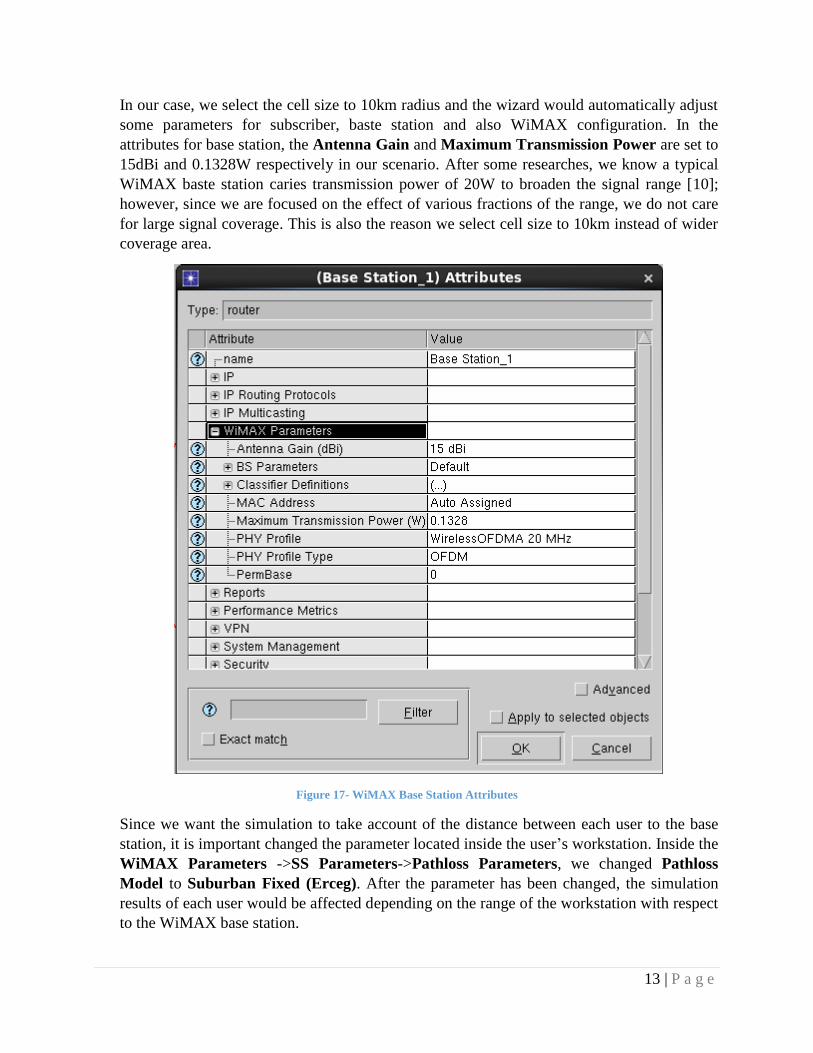
In our case, we select the cell size to 10km radius and the wizard would automatically adjust
some parameters for subscriber, baste station and also WiMAX configuration. In the
attributes for base station, the Antenna Gain and Maximum Transmission Power are set to
15dBi and 0.1328W respectively in our scenario. After some researches, we know a typical
WiMAX baste station caries transmission power of 20W to broaden the signal range [10];
however, since we are focused on the effect of various fractions of the range, we do not care
for large signal coverage. This is also the reason we select cell size to 10km instead of wider
coverage area.
Figure 17- WiMAX Base Station Attributes
Since we want the simulation to take account of the distance between each user to the base
station, it is important changed the parameter located inside the user’s workstation. Inside the
WiMAX Parameters ->SS Parameters->Pathloss Parameters, we changed Pathloss
Model to Suburban Fixed (Erceg). After the parameter has been changed, the simulation
results of each user would be affected depending on the range of the workstation with respect
to the WiMAX base station.
14 | P a g e
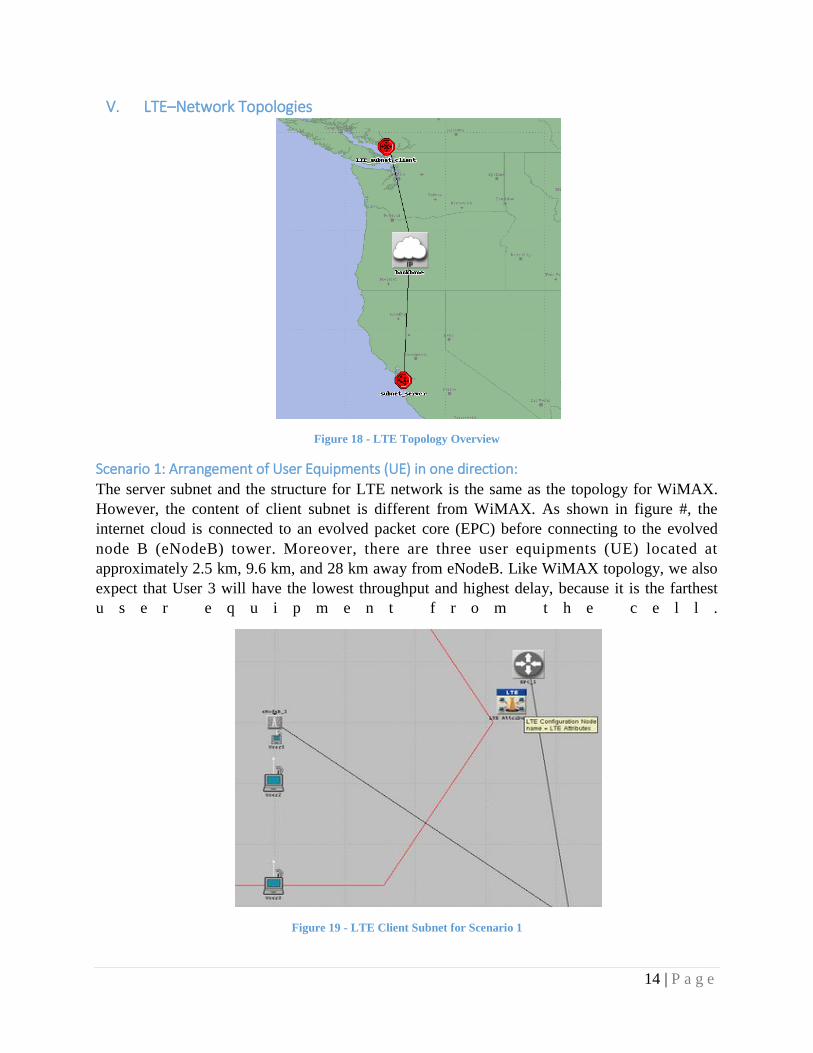
V. LTE–Network Topologies
Figure 18 - LTE Topology Overview
Scenario 1: Arrangement of User Equipments (UE) in one direction:
The server subnet and the structure for LTE network is the same as the topology for WiMAX.
However, the content of client subnet is different from WiMAX. As shown in figure #, the
internet cloud is connected to an evolved packet core (EPC) before connecting to the evolved
node B (eNodeB) tower. Moreover, there are three user equipments (UE) located at
approximately 2.5 km, 9.6 km, and 28 km away from eNodeB. Like WiMAX topology, we also
expect that User 3 will have the lowest throughput and highest delay, because it is the farthest
u s e r e q u i p m e n t f r o m t h e c e l l .
Figure 19 - LTE Client Subnet for Scenario 1
15 | P a g e
There are two important elements within the client subnet of LTE network. The first one is
the evolved packet core (EPC) which is connected to the internet cloud. EPC plays an
essential role in handling the data traffic efficiently, so that LTE network can have better
performance []. Furthermore, it splits the user data (user plane) and the signalling (Control
plane) which assist operators to adapt LTE network easily [11].
Second element is evolved node B (eNodeB) that is connected to the EPC. It is the base
station for LTE network system. Unlike normal Node B, it does not possess any separate
controller which allows better results by reducing the response times [11].
We have arranged all three UEs in one direction. As shown in figure #, all user equipments
are located below eNodeB.
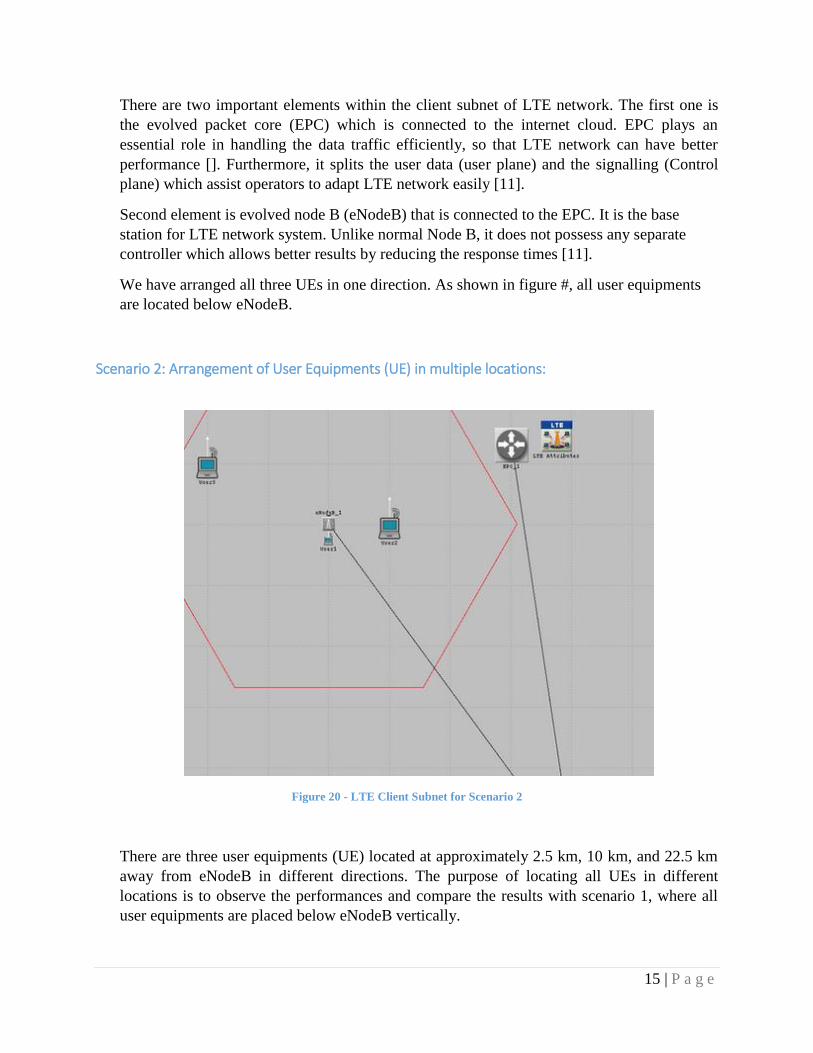
Scenario 2: Arrangement of User Equipments (UE) in multiple locations:
Figure 20 - LTE Client Subnet for Scenario 2
There are three user equipments (UE) located at approximately 2.5 km, 10 km, and 22.5 km
away from eNodeB in different directions. The purpose of locating all UEs in different
locations is to observe the performances and compare the results with scenario 1, where all
user equipments are placed below eNodeB vertically.
16 | P a g e
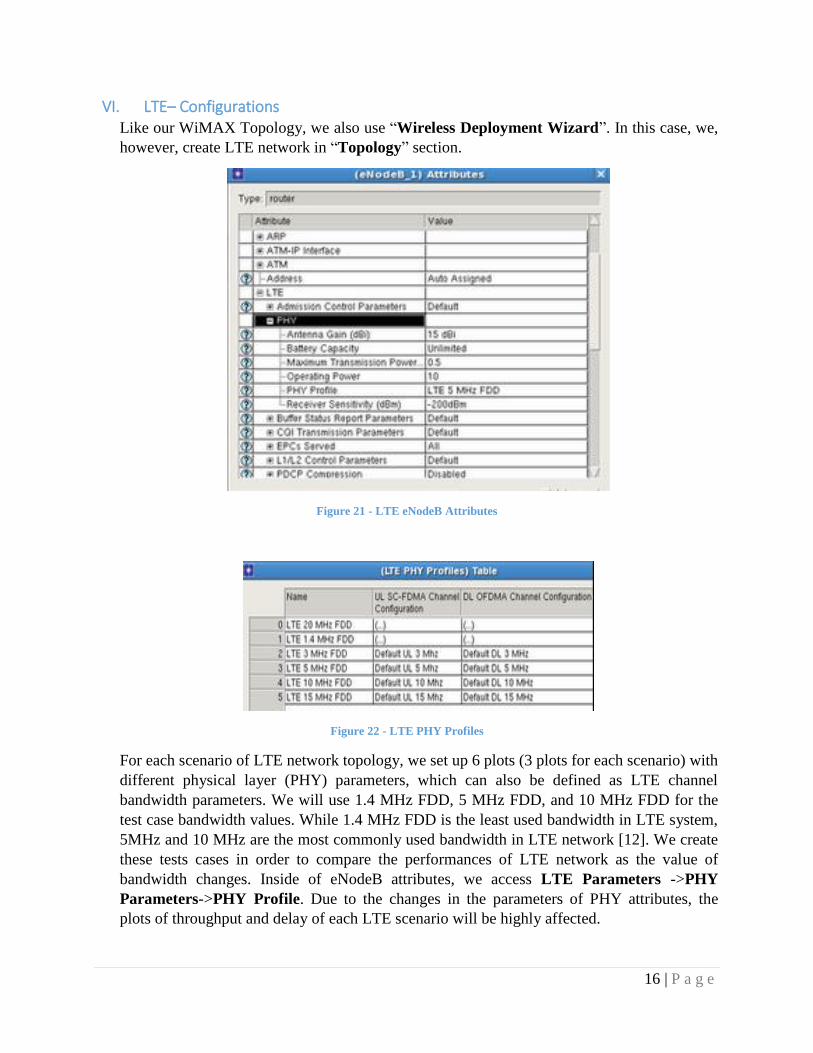
VI. LTE– Configurations Like our WiMAX Topology, we also use “Wireless Deployment Wizard”. In this case, we,
however, create LTE network in “Topology” section.
Figure 21 - LTE eNodeB Attributes
Figure 22 - LTE PHY Profiles
For each scenario of LTE network topology, we set up 6 plots (3 plots for each scenario) with
different physical layer (PHY) parameters, which can also be defined as LTE channel
bandwidth parameters. We will use 1.4 MHz FDD, 5 MHz FDD, and 10 MHz FDD for the
test case bandwidth values. While 1.4 MHz FDD is the least used bandwidth in LTE system,
5MHz and 10 MHz are the most commonly used bandwidth in LTE network [12]. We create
these tests cases in order to compare the performances of LTE network as the value of
bandwidth changes. Inside of eNodeB attributes, we access LTE Parameters ->PHY
Parameters->PHY Profile. Due to the changes in the parameters of PHY attributes, the
plots of throughput and delay of each LTE scenario will be highly affected.
17 | P a g e
5. Simulation Results
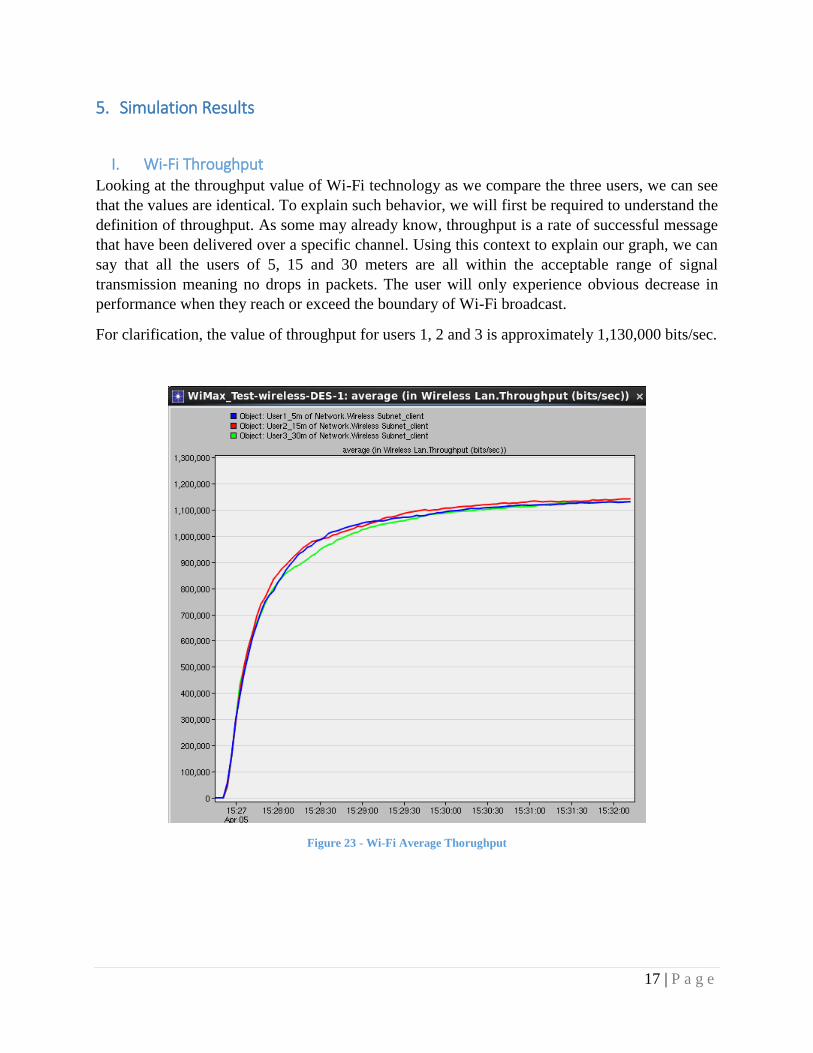
I. Wi-Fi Throughput Looking at the throughput value of Wi-Fi technology as we compare the three users, we can see
that the values are identical. To explain such behavior, we will first be required to understand the
definition of throughput. As some may already know, throughput is a rate of successful message
that have been delivered over a specific channel. Using this context to explain our graph, we can
say that all the users of 5, 15 and 30 meters are all within the acceptable range of signal
transmission meaning no drops in packets. The user will only experience obvious decrease in
performance when they reach or exceed the boundary of Wi-Fi broadcast.
For clarification, the value of throughput for users 1, 2 and 3 is approximately 1,130,000 bits/sec.
Figure 23 - Wi-Fi Average Thorughput
18 | P a g e
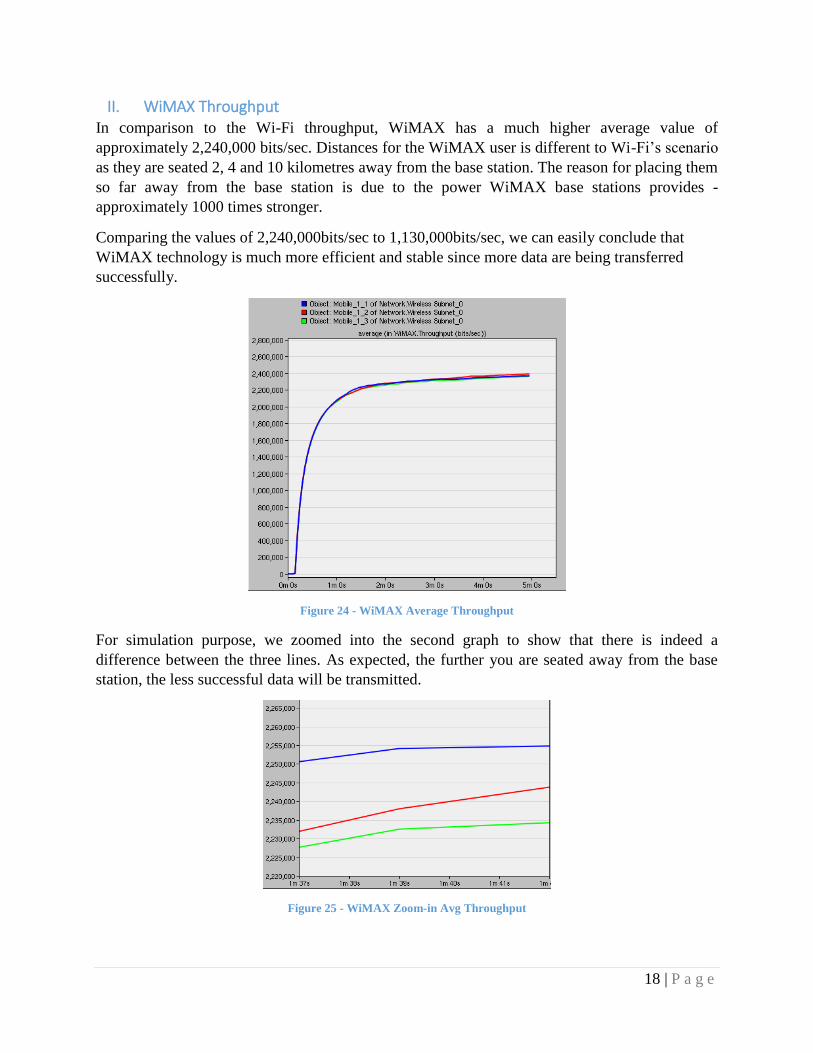
II. WiMAX Throughput In comparison to the Wi-Fi throughput, WiMAX has a much higher average value of
approximately 2,240,000 bits/sec. Distances for the WiMAX user is different to Wi-Fi’s scenario
as they are seated 2, 4 and 10 kilometres away from the base station. The reason for placing them
so far away from the base station is due to the power WiMAX base stations provides -
approximately 1000 times stronger.
Comparing the values of 2,240,000bits/sec to 1,130,000bits/sec, we can easily conclude that
WiMAX technology is much more efficient and stable since more data are being transferred
successfully.
Figure 24 - WiMAX Average Throughput
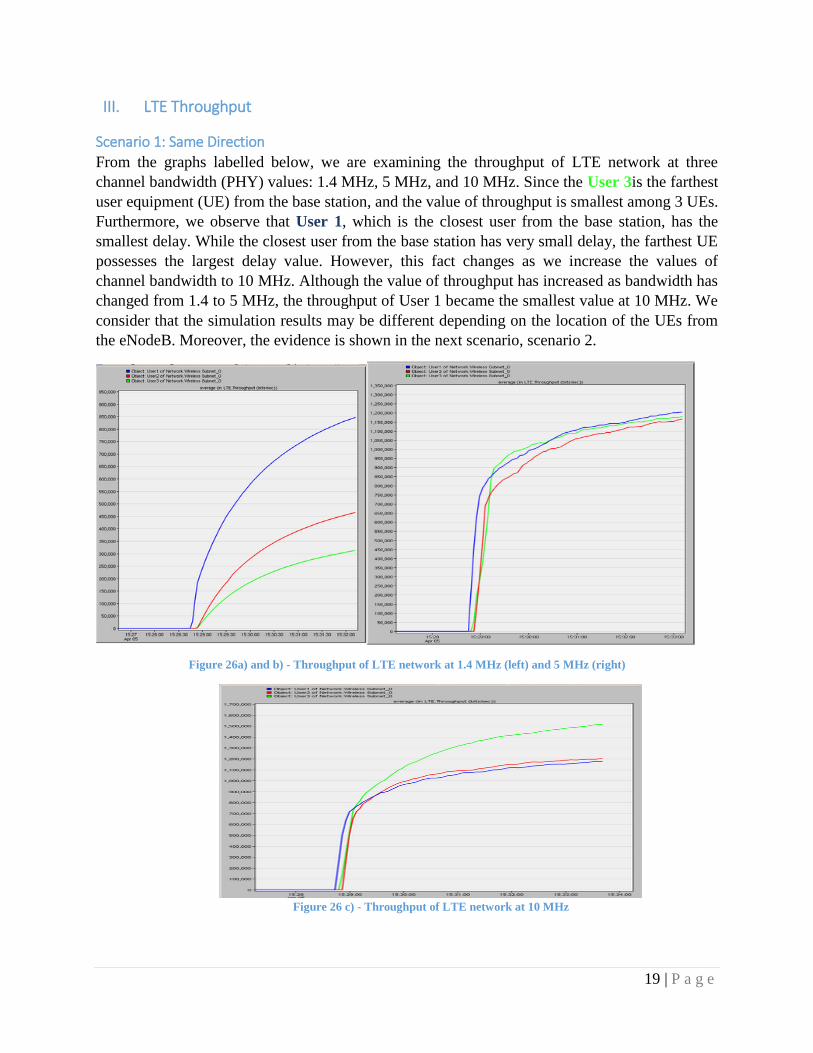
For simulation purpose, we zoomed into the second graph to show that there is indeed a
difference between the three lines. As expected, the further you are seated away from the base
station, the less successful data will be transmitted.
Figure 25 - WiMAX Zoom-in Avg Throughput
19 | P a g e
III. LTE Throughput
Scenario 1: Same Direction
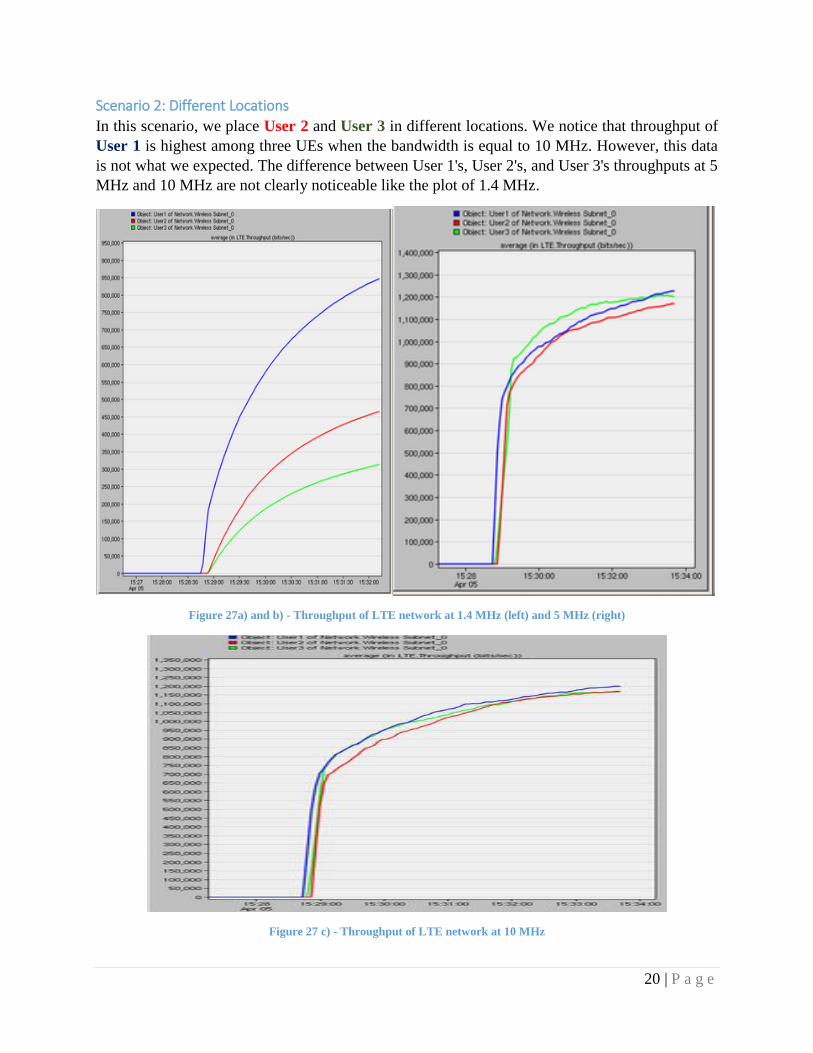
From the graphs labelled below, we are examining the throughput of LTE network at three
channel bandwidth (PHY) values: 1.4 MHz, 5 MHz, and 10 MHz. Since the User 3is the farthest
user equipment (UE) from the base station, and the value of throughput is smallest among 3 UEs.
Furthermore, we observe that User 1, which is the closest user from the base station, has the
smallest delay. While the closest user from the base station has very small delay, the farthest UE
possesses the largest delay value. However, this fact changes as we increase the values of
channel bandwidth to 10 MHz. Although the value of throughput has increased as bandwidth has
changed from 1.4 to 5 MHz, the throughput of User 1 became the smallest value at 10 MHz. We
consider that the simulation results may be different depending on the location of the UEs from
the eNodeB. Moreover, the evidence is shown in the next scenario, scenario 2.
Figure 26a) and b) - Throughput of LTE network at 1.4 MHz (left) and 5 MHz (right)
Figure 26 c) - Throughput of LTE network at 10 MHz
20 | P a g e
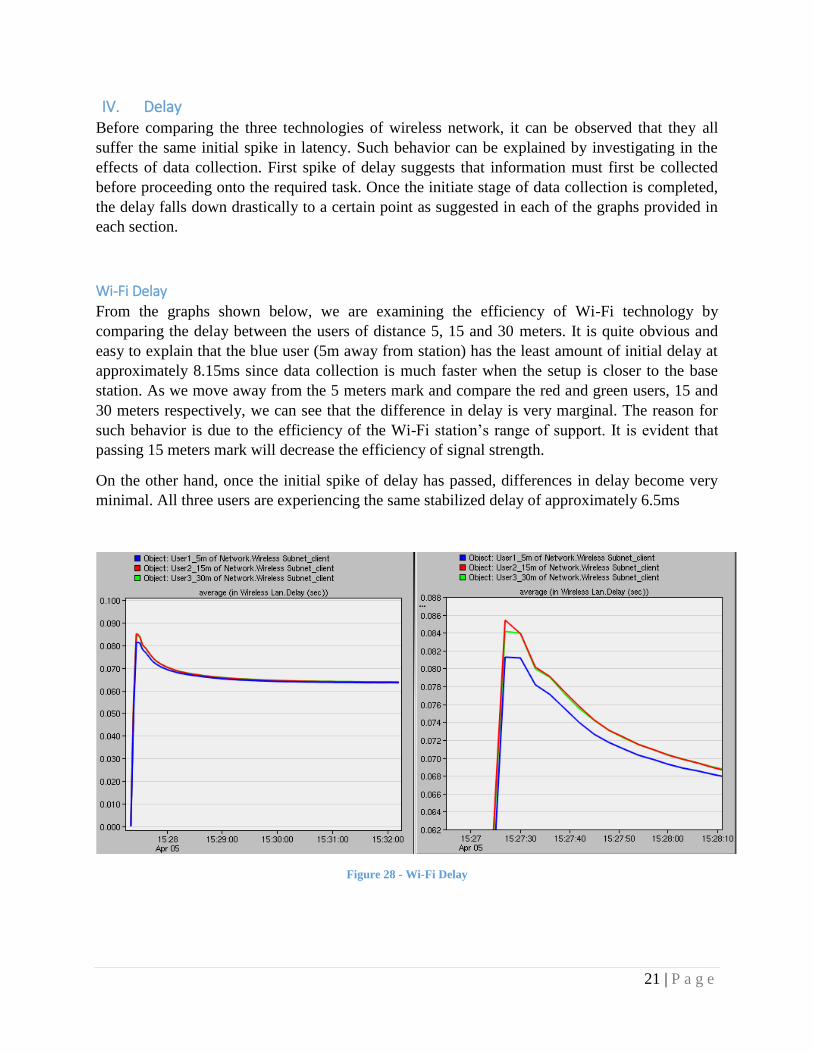
Scenario 2: Different Locations
In this scenario, we place User 2 and User 3 in different locations. We notice that throughput of
User 1 is highest among three UEs when the bandwidth is equal to 10 MHz. However, this data
is not what we expected. The difference between User 1's, User 2's, and User 3's throughputs at 5
MHz and 10 MHz are not clearly noticeable like the plot of 1.4 MHz.
Figure 27a) and b) - Throughput of LTE network at 1.4 MHz (left) and 5 MHz (right)
Figure 27 c) - Throughput of LTE network at 10 MHz
21 | P a g e
IV. Delay Before comparing the three technologies of wireless network, it can be observed that they all
suffer the same initial spike in latency. Such behavior can be explained by investigating in the
effects of data collection. First spike of delay suggests that information must first be collected
before proceeding onto the required task. Once the initiate stage of data collection is completed,
the delay falls down drastically to a certain point as suggested in each of the graphs provided in
each section.
Wi-Fi Delay
From the graphs shown below, we are examining the efficiency of Wi-Fi technology by
comparing the delay between the users of distance 5, 15 and 30 meters. It is quite obvious and
easy to explain that the blue user (5m away from station) has the least amount of initial delay at
approximately 8.15ms since data collection is much faster when the setup is closer to the base
station. As we move away from the 5 meters mark and compare the red and green users, 15 and
30 meters respectively, we can see that the difference in delay is very marginal. The reason for
such behavior is due to the efficiency of the Wi-Fi station’s range of support. It is evident that
passing 15 meters mark will decrease the efficiency of signal strength.
On the other hand, once the initial spike of delay has passed, differences in delay become very
minimal. All three users are experiencing the same stabilized delay of approximately 6.5ms
Figure 28 - Wi-Fi Delay
22 | P a g e
WiMAX Delay
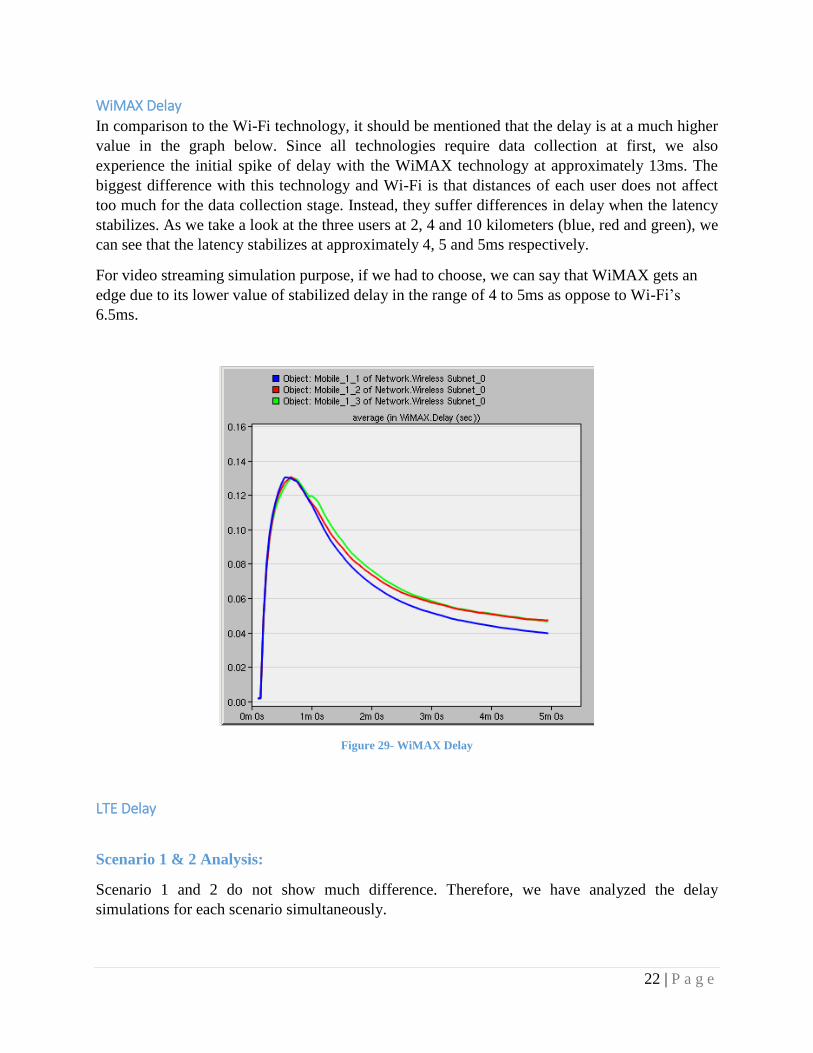
In comparison to the Wi-Fi technology, it should be mentioned that the delay is at a much higher
value in the graph below. Since all technologies require data collection at first, we also
experience the initial spike of delay with the WiMAX technology at approximately 13ms. The
biggest difference with this technology and Wi-Fi is that distances of each user does not affect
too much for the data collection stage. Instead, they suffer differences in delay when the latency
stabilizes. As we take a look at the three users at 2, 4 and 10 kilometers (blue, red and green), we
can see that the latency stabilizes at approximately 4, 5 and 5ms respectively.
For video streaming simulation purpose, if we had to choose, we can say that WiMAX gets an
edge due to its lower value of stabilized delay in the range of 4 to 5ms as oppose to Wi-Fi’s
6.5ms.
Figure 29- WiMAX Delay
LTE Delay
Scenario 1 & 2 Analysis:
Scenario 1 and 2 do not show much difference. Therefore, we have analyzed the delay
simulations for each scenario simultaneously.
23 | P a g e
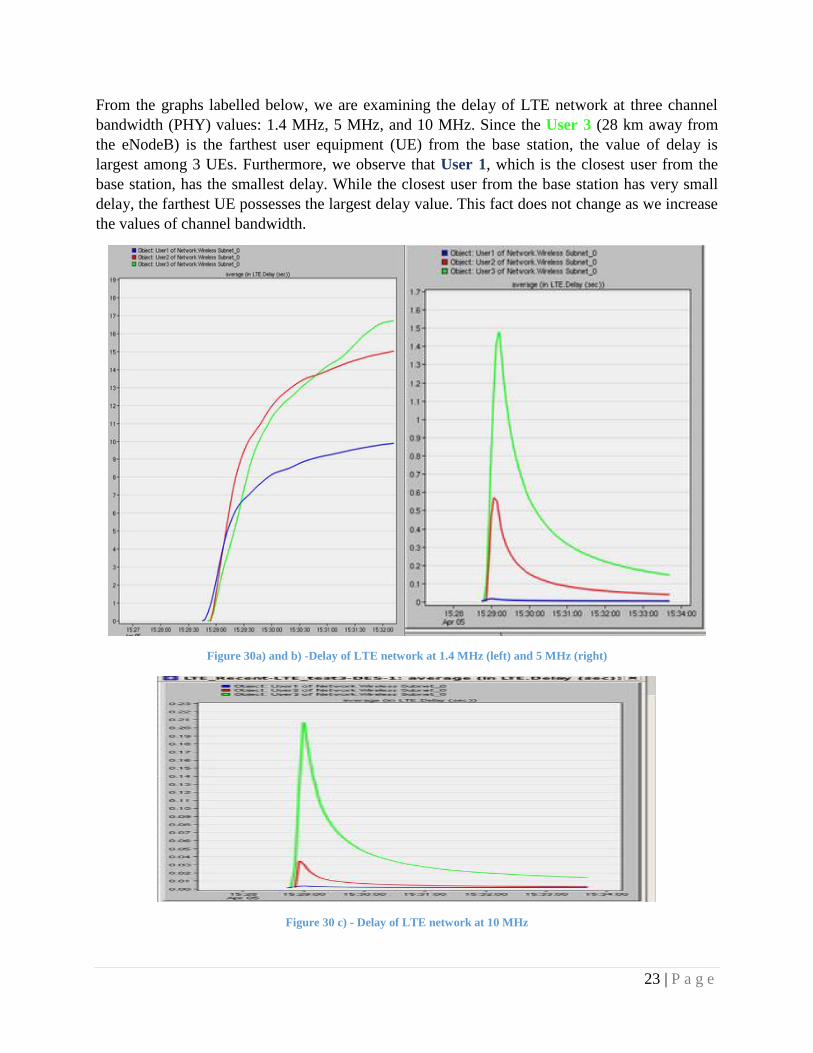
From the graphs labelled below, we are examining the delay of LTE network at three channel
bandwidth (PHY) values: 1.4 MHz, 5 MHz, and 10 MHz. Since the User 3 (28 km away from
the eNodeB) is the farthest user equipment (UE) from the base station, the value of delay is
largest among 3 UEs. Furthermore, we observe that User 1, which is the closest user from the
base station, has the smallest delay. While the closest user from the base station has very small
delay, the farthest UE possesses the largest delay value. This fact does not change as we increase
the values of channel bandwidth.
Figure 30a) and b) -Delay of LTE network at 1.4 MHz (left) and 5 MHz (right)
Figure 30 c) - Delay of LTE network at 10 MHz
24 | P a g e
Furthermore, we observe that the delay is inversely proportional to the value of bandwidth. As
we increase the bandwidth, we obtain decreasing delay value. For example, the peak delay
shown in both scenarios at 5 MHz is approximately 1.5 seconds, while the delay at 10 MHz is
approximately 0.25 seconds. We consider the reason that there is not much delay at high
bandwidth is because EPC and eNodeB are connected to each other. EPC helps network to
handle data traffic efficiently, while we can freely change the values of bandwidth using eNodeB.
From our view, this indicates that eNodeB's increased bandwidth helps EPC to manage data
traffic in broader range.
However, all Users, as we increase the bandwidth, have a significant drop in delay starting
around 2 minutes. Whether we change the locations of UEs or not, the results shown in the
figures are the same. Even though we have proved that the distant User has the highest delay,
and bandwidth is inversely proportional to delay, we are unsure why substantial drop in delay
occurs at 2 minutes.
6. Wrap Up
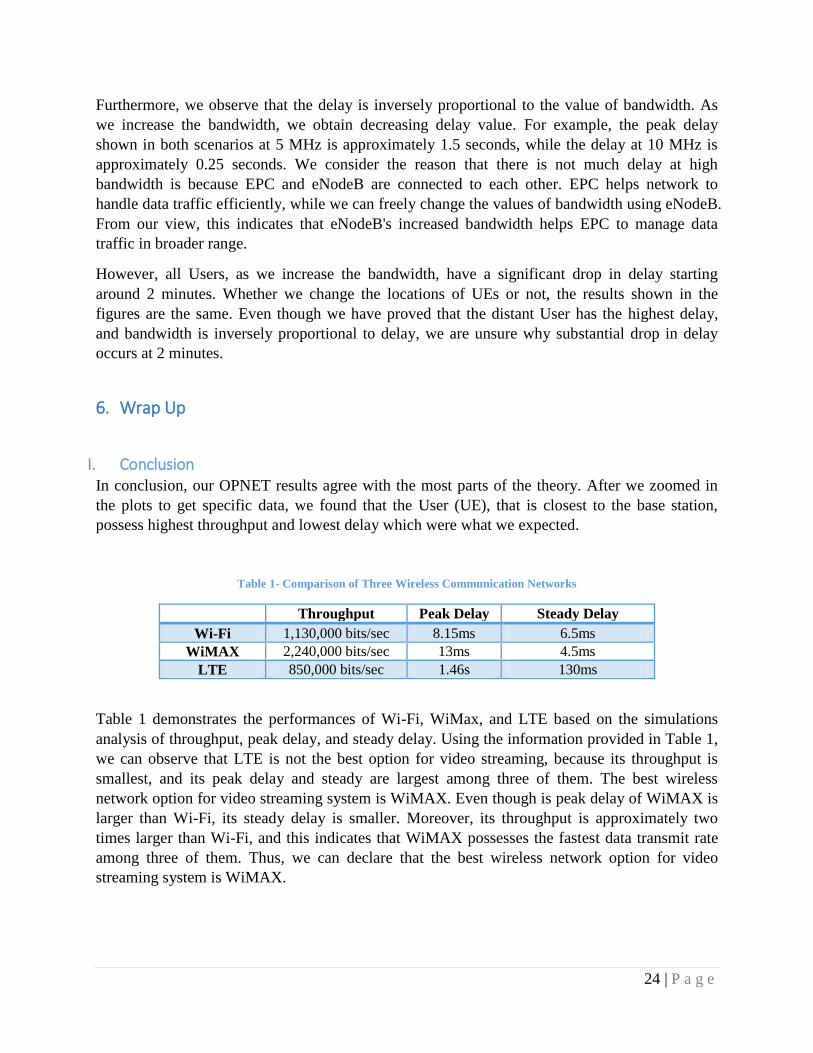
I. Conclusion In conclusion, our OPNET results agree with the most parts of the theory. After we zoomed in
the plots to get specific data, we found that the User (UE), that is closest to the base station,
possess highest throughput and lowest delay which were what we expected.
Table 1- Comparison of Three Wireless Communication Networks
Throughput Peak Delay Steady Delay
Wi-Fi 1,130,000 bits/sec 8.15ms 6.5ms
WiMAX 2,240,000 bits/sec 13ms 4.5ms
LTE 850,000 bits/sec 1.46s 130ms
Table 1 demonstrates the performances of Wi-Fi, WiMax, and LTE based on the simulations
analysis of throughput, peak delay, and steady delay. Using the information provided in Table 1,
we can observe that LTE is not the best option for video streaming, because its throughput is
smallest, and its peak delay and steady are largest among three of them. The best wireless
network option for video streaming system is WiMAX. Even though is peak delay of WiMAX is
larger than Wi-Fi, its steady delay is smaller. Moreover, its throughput is approximately two
times larger than Wi-Fi, and this indicates that WiMAX possesses the fastest data transmit rate
among three of them. Thus, we can declare that the best wireless network option for video
streaming system is WiMAX.
25 | P a g e
II. Future Work In this project, we successfully simulated Wi-Fi, WiMAX and LTE models that show the
capabilities of modern wireless devices by utilizing high resolution video streaming. Since Linux
computer did not have enough virtual memory for the simulation of video streaming with 4K
resolution, we had to use 1080P resolution to instead. Due to our lack of experience with OPNET
configurations, we had to substitute FTP, the true protocol of YouTube to load online video, by
HTTP as default setting in OPNET configurations. In addition, we wished to analyze and
compare the performances of Wi-Fi, WiMAX and LTE on high resolution video streaming, but
we had some issues in our simulation and statistical data that were not realistic enough.
Overall, we would like to continue our research in the future and obtain more realistic outcomes
from the real 4K resolution video streaming.
26 | P a g e
7. References
[1] 4G Wireless Technology and beyond. (2012, August 27).[Online].Available:
http://4g.netlawsrl.com/. [Accessed 15 02 2014]
[2] Mitchell. B. (n.d). WiMax vs. LTE, for Mobile Broadband.[Online].
Available:http://compnetworking.about.com/od/wirelessinternet/f/wimax-vs-lte-mobile-
broadband.htm. [Accessed 14 02 2014]
[3] Long Term Evolution Overview. (2010, October). [Online].Available:
http://www.freescale.com/files/wireless_comm/doc/white_paper/LTEPTCLOVWWP.pdf.
[Accessed 15 02 2014]
[4] LTE Protocol Stack Layers. (n.d.). [Online]. Available:
http://www.tutorialspoint.com/lte/lte_protocol_stack_layers.htm. [Accessed 15 02 2014]
[5] Long Term Evolution (LTE) Tutorials.(n.d.). [Online]. Available:
http://www.eventhelix.com/lte/lte-tutorials.htm#.Uv_vXVTyDy0. [Accessed 14 02 2014]
[6] WiMAX - What is WiMax? (n.d.). [Online]. Available:
http://www.tutorialspoint.com/wimax/what_is_wimax.htm. [Accessed 16 02 2014]
[7] What are the advantages of WiMax? (n.d). [Online]. Available:
http://www.wimaxforum.org/FAQRetrieve.aspx?ID=62687. [Accessed 16 02 2014]
[8] NG. Jackie, Zhu.Wangyi, Rajaratanam. Sutharsan, (Feb.2013). Performance Analysis of
LTE VS WiMAX. [Online]. Available: http://www.sfu.ca/~srajara1/Index.html. [Accessed 28 03
2014]
[9] Poulin. Darcy. (Oct. 2008). How much transmit power do WiMAX nets need?[Online].
Available: http://www.eetimes.com/document.asp?doc_id=1271732. [Accessed 30 03 2014]
[10] ip location (n.d). [Online]. Available: http://www.iplocation.net/index.php. [Accessed 30 03
2014]
27 | P a g e
[11] Firmin. Frederic, (n.d). The Evolved Packet Core. [Online]. Available:
http://www.3gpp.org/technologies/keywords-acronyms/100-the-evolved-packet-core. [Accessed
30 03 2014]
[12] QuAlcomm. (July 2012). Bandwidth Support in LTE Standards. [Online]. Available:
http://transition.fcc.gov/bureaus/oet/tac/tacdocs/meeting71612/PANEL2.3-Gaal-Qualcomm.pdf.
[Accessed 30 03 2014]
[13] H.264 Bit rate and frame rate.(n.d). [Online]. Available:
https://documentation.apple.com/en/dvdstudiopro/usermanual/index.html#chapter=4%26section
=10%26tasks=true. [Accessed 02 04 2014]
[14] Best Video Format for YouTube. (n.d). [Online]. Available:
http://www.macxdvd.com/mac-dvd-video-converter-how-to/best-video-format-for-youtube.htm.
[Accessed 02 04 2014]
Recommended