ESTIMATING 2003
BUILDING-RELATED
CONSTRUCTION AND DEMOLITION MATERIALS AMOUNTS

This page intentionally left blank.
Table of Contents Table of Contents............................................................................................................................. i List of Tables .................................................................................................................................. ii List of Tables .................................................................................................................................. ii List of Figures ................................................................................................................................. ii
1 Introduction......................................................................................................................... 1 1.1 The Construction Industry .......................................................................................... 2
1.1.1 Size of the Construction Industry ....................................................................... 2 1.1.2 Efforts by the Construction Industry to Increase C&D Materials Recovery...... 3
1.2 Estimating Building-Related C&D Materials Generation Amounts .......................... 5 1.3 Estimating The Recovered amount of Building-Related C&D Materials .................. 6
2 Amount of Building-Related C&D Materials Generated ................................................... 8 2.1 Methodology and Results ........................................................................................... 8
2.1.1 Residential Construction..................................................................................... 8 2.1.2 Nonresidential Construction ............................................................................. 10 2.1.3 Residential Demolition ..................................................................................... 10 2.1.4 Nonresidential Demolition................................................................................ 13 2.1.5 Residential Renovation ..................................................................................... 15 2.1.6 Nonresidential Renovation ............................................................................... 16
2.2 Amount of Building-Related C&D Materials Generated in 2003 ............................ 17 3 Building-Related C&D Materials Management ............................................................... 20
3.1 Source Reduction...................................................................................................... 20 3.2 Materials Recovery ................................................................................................... 20
3.2.1 Barriers to C&D Materials Recovery ............................................................... 20 3.2.2 Quantifying Recovery of C&D Materials......................................................... 21
3.3 Landfill Disposal....................................................................................................... 23 4 Conclusions....................................................................................................................... 25
References..................................................................................................................................... 26
APPENDICES A Building-Related C&D Materials Generation Amount Calculations B Sources of C&D Materials Recovery Data
i
List of Tables Table Title Page 1-1 Typical components of C&D Materials.............................................................................. 1 2-1 Summary of Residential Construction Job Site C&D Materials Surveys. ......................... 9 2-2 Summary of Nonresidential Construction Job Site Surveys of C&D Materials............... 10 2-3 Summary of Residential Demolition Job Site Waste Surveys.......................................... 12 2-4 Summary of Nonresidential Demolition Job Site Surveys of C&D Materials. ................ 14 2-5 Summary of Residential Renovation Job Site Surveys of C&D materials....................... 15 2-6 Summary of Nonresidential Renovation Job Site Surveys of C&D Materials................. 17 2-7 Estimated Amount of Building-Related C&D Materials Generated in the U.S. During
2003................................................................................................................................... 17 3-1 Amount of C&D materials disposed and recovered by reporting state. ........................... 23 A-1 Residential Construction Materials Worksheet .............................................................. A-2 A-2 Nonresidential Construction Materials Worksheet......................................................... A-2 A-3 Residential Demolition Materials Worksheet................................................................. A-3 A-4 Residential Renovation Materials Worksheet................................................................. A-4 A-5 Nonresidential Renovation Materials Worksheet ........................................................... A-5 A-5 Nonresidential Renovation Materials Worksheet ........................................................... A-5 A-6 Estimated Weight of Residential Concrete Driveways Replaced in the U.S., 2003...... A-5 A-7 Estimated Weight of Residential Asphalt Roofs Replaced in the U.S., 2003 ................ A-6 A-8 Estimated Weight of Residential Wood Roofs Replaced in the U.S., 2003 ................... A-6 A-9 Estimated Weight of Residential HVAC Equipment Replaced in the U.S., 2003.......... A-6
List of Figures Figure Title Page 1-1 U.S. construction spending. ................................................................................................ 3 1-2 Estimated consumption of portland cement in 2003........................................................... 5 1-3 C&D Materials Management Definitions........................................................................... 7 2-1 Average Unit Size of New Residential Construction ....................................................... 12 2-2 Contribution to the C&D Materials Stream by Each Building Sector.............................. 17
ii
Estimating 2003 Building-Related Construction and Demolition Materials Amounts
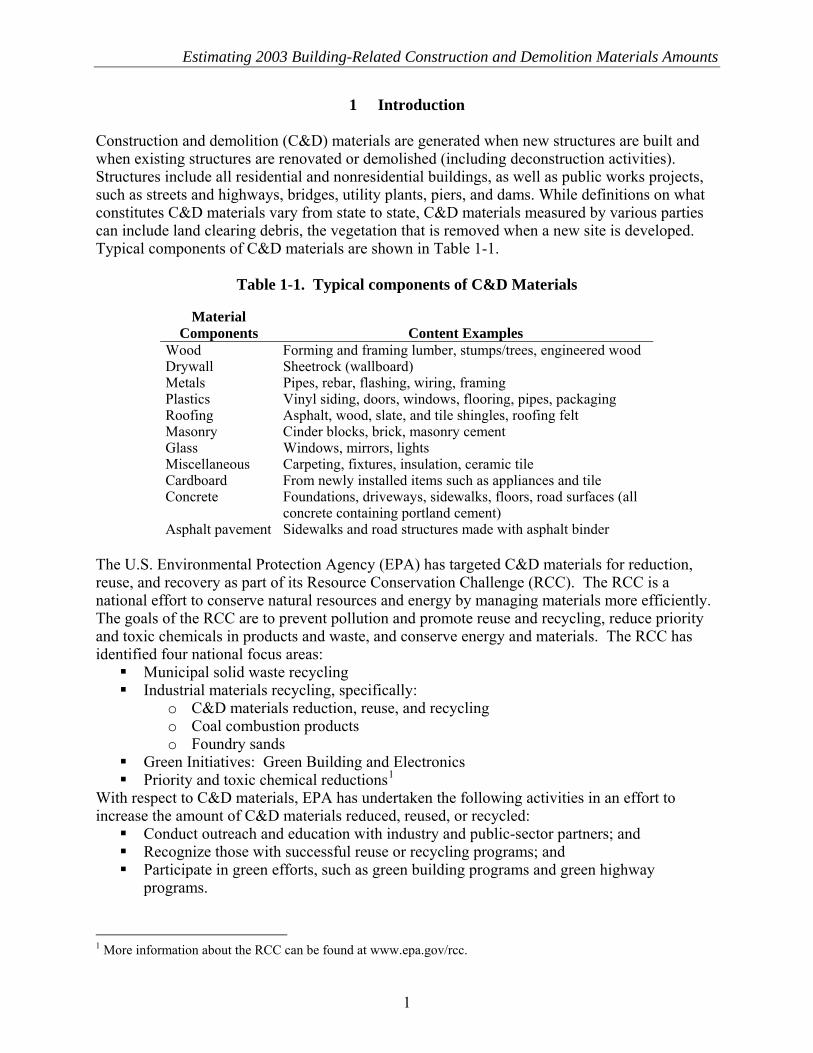
1 Introduction Construction and demolition (C&D) materials are generated when new structures are built and when existing structures are renovated or demolished (including deconstruction activities). Structures include all residential and nonresidential buildings, as well as public works projects, such as streets and highways, bridges, utility plants, piers, and dams. While definitions on what constitutes C&D materials vary from state to state, C&D materials measured by various parties can include land clearing debris, the vegetation that is removed when a new site is developed. Typical components of C&D materials are shown in Table 1-1.
Table 1-1. Typical components of C&D Materials
Material Components
Content Examples
Wood Forming and framing lumber, stumps/trees, engineered wood Drywall Sheetrock (wallboard) Metals Pipes, rebar, flashing, wiring, framing Plastics Vinyl siding, doors, windows, flooring, pipes, packaging Roofing Asphalt, wood, slate, and tile shingles, roofing felt Masonry Cinder blocks, brick, masonry cement Glass Windows, mirrors, lights Miscellaneous Carpeting, fixtures, insulation, ceramic tile Cardboard From newly installed items such as appliances and tile Concrete Foundations, driveways, sidewalks, floors, road surfaces (all
concrete containing portland cement) Asphalt pavement Sidewalks and road structures made with asphalt binder
The U.S. Environmental Protection Agency (EPA) has targeted C&D materials for reduction, reuse, and recovery as part of its Resource Conservation Challenge (RCC). The RCC is a national effort to conserve natural resources and energy by managing materials more efficiently. The goals of the RCC are to prevent pollution and promote reuse and recycling, reduce priority and toxic chemicals in products and waste, and conserve energy and materials. The RCC has identified four national focus areas:
Municipal solid waste recycling Industrial materials recycling, specifically:
o C&D materials reduction, reuse, and recycling o Coal combustion products o Foundry sands
Green Initiatives: Green Building and Electronics Priority and toxic chemical reductions1
With respect to C&D materials, EPA has undertaken the following activities in an effort to increase the amount of C&D materials reduced, reused, or recycled:
Conduct outreach and education with industry and public-sector partners; and Recognize those with successful reuse or recycling programs; and Participate in green efforts, such as green building programs and green highway
programs.
1 More information about the RCC can be found at www.epa.gov/rcc.
1
Furthermore, the recently-issued Executive Order 13423 requires all federal construction, renovation, and demolition projects to achieve a 50% recycling rate where markets or on-site recycling opportunities exist. EPA is committed to helping achieve that recycling rate. One of the important tasks for EPA under the RCC is to track the progress of C&D materials recovery by estimating the amount that is generated and recovered. The purpose of this study is to determine the amount of building-related C&D materials generated and recovered in the U.S. during 2003, updating the findings of the 1998 EPA report Characterization of Building-Related Construction and Demolition Debris in the United States (EPA 530-R-98-010). Limited information is available on the amount of C&D materials generated and managed in the U.S. The methodology used in this report to estimate the amount of building-related C&D materials generated and recovered in the U.S. during 2003 is based on national statistical data and typical waste generation during building construction, renovation, demolition, or maintenance activities. The recovery estimate relies on 2003 data reported by state environmental agencies. Finally, we would note that accurate measurements of C&D generation and recovery are critical in order to measure progress toward achieving increased C&D materials reuse and recycling. However, efforts to improve C&D measurement are currently hampered by a general lack of data. Thus, it should be recognized that the C&D materials estimates presented to date, including those in this report, have some level of uncertainty, and the results should be viewed in that light. Nevertheless, we believe that the estimates contained in this report reflect and are based on the best data that are currently available.
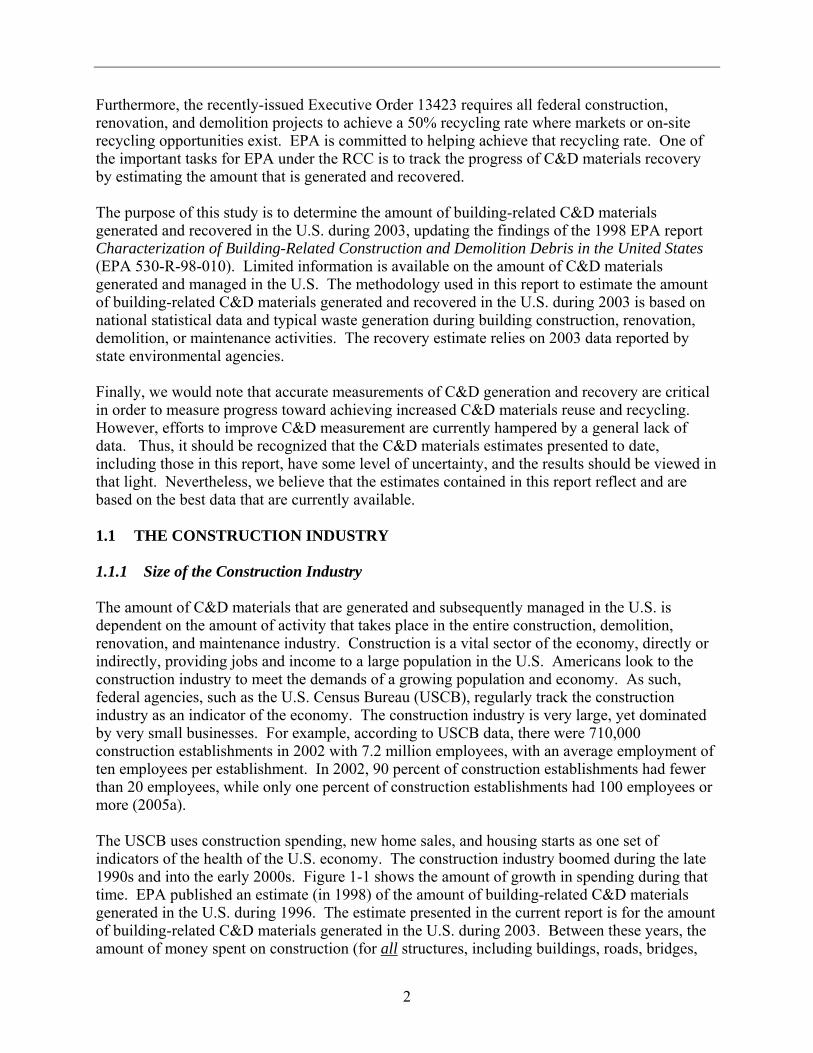
1.1 THE CONSTRUCTION INDUSTRY 1.1.1 Size of the Construction Industry The amount of C&D materials that are generated and subsequently managed in the U.S. is dependent on the amount of activity that takes place in the entire construction, demolition, renovation, and maintenance industry. Construction is a vital sector of the economy, directly or indirectly, providing jobs and income to a large population in the U.S. Americans look to the construction industry to meet the demands of a growing population and economy. As such, federal agencies, such as the U.S. Census Bureau (USCB), regularly track the construction industry as an indicator of the economy. The construction industry is very large, yet dominated by very small businesses. For example, according to USCB data, there were 710,000 construction establishments in 2002 with 7.2 million employees, with an average employment of ten employees per establishment. In 2002, 90 percent of construction establishments had fewer than 20 employees, while only one percent of construction establishments had 100 employees or more (2005a). The USCB uses construction spending, new home sales, and housing starts as one set of indicators of the health of the U.S. economy. The construction industry boomed during the late 1990s and into the early 2000s. Figure 1-1 shows the amount of growth in spending during that time. EPA published an estimate (in 1998) of the amount of building-related C&D materials generated in the U.S. during 1996. The estimate presented in the current report is for the amount of building-related C&D materials generated in the U.S. during 2003. Between these years, the amount of money spent on construction (for all structures, including buildings, roads, bridges,
2
Estimating 2003 Building-Related Construction and Demolition Materials Amounts
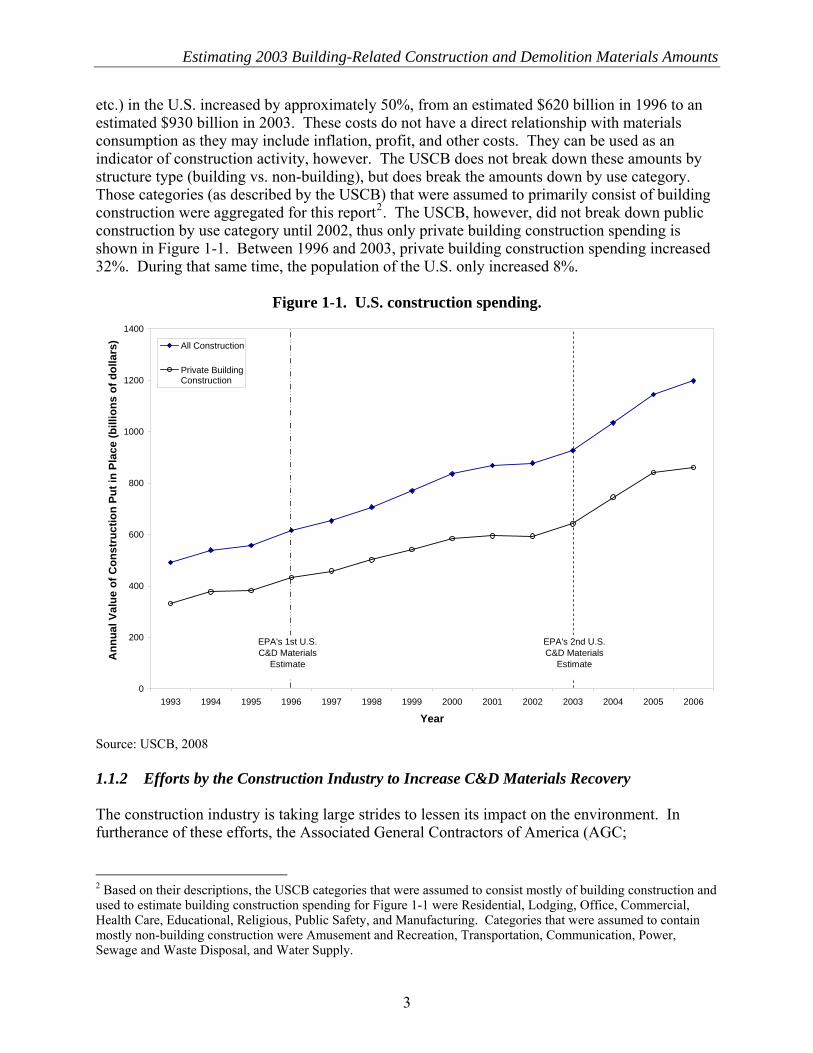
etc.) in the U.S. increased by approximately 50%, from an estimated $620 billion in 1996 to an estimated $930 billion in 2003. These costs do not have a direct relationship with materials consumption as they may include inflation, profit, and other costs. They can be used as an indicator of construction activity, however. The USCB does not break down these amounts by structure type (building vs. non-building), but does break the amounts down by use category. Those categories (as described by the USCB) that were assumed to primarily consist of building construction were aggregated for this report2. The USCB, however, did not break down public construction by use category until 2002, thus only private building construction spending is shown in Figure 1-1. Between 1996 and 2003, private building construction spending increased 32%. During that same time, the population of the U.S. only increased 8%.
Figure 1-1. U.S. construction spending.
0
200
400
600
800
1000
1200
1400
1993 1994 1995 1996 1997 1998 1999 2000 2001 2002 2003 2004 2005 2006
Year
Ann
ual V
alue
of C
onst
ruct
ion
Put i
n Pl
ace
(bill
ions
of d
olla
rs) All Construction
Private BuildingConstruction
EPA's 2nd U.S. C&D Materials
Estimate
EPA's 1st U.S. C&D Materials
Estimate
Source: USCB, 2008 1.1.2 Efforts by the Construction Industry to Increase C&D Materials Recovery The construction industry is taking large strides to lessen its impact on the environment. In furtherance of these efforts, the Associated General Contractors of America (AGC;
2 Based on their descriptions, the USCB categories that were assumed to consist mostly of building construction and used to estimate building construction spending for Figure 1-1 were Residential, Lodging, Office, Commercial, Health Care, Educational, Religious, Public Safety, and Manufacturing. Categories that were assumed to contain mostly non-building construction were Amusement and Recreation, Transportation, Communication, Power, Sewage and Waste Disposal, and Water Supply.
3
http://www.agc.org) created an Environmental Agenda in 2006, which lists seven goals. Four of these goals relate most to materials management, which are:
1. Encourage environmental stewardship through education, awareness and outreach. 2. Recognize environmentally responsible construction practices. 3. Identify opportunities to reduce the impact that construction practices have on the
environment, including o Facilitating members’ efforts to recycle or reduce construction and demolition
debris. o Identifying and maximizing the contractor’s role in “green” construction.
4. Identify ways to measure and report environmental trends and performance indicators of such trends.
Other efforts undertaken by the construction industry include the following:
• The Building Materials Reuse Association (BMRA; http://www.buildingreuse.org) facilitates building deconstruction and the reuse and recycling of recovered building materials. They produce information on deconstruction techniques and information on how to make a successful deconstruction or reuse business. They convene annually to transfer this knowledge among contractors, government representatives, and researchers.
• The Construction Materials Recycling Association (CMRA; http://www.cdrecycling.org)
aids their members in the appropriate methods for processing material to ensure environmental protectiveness, as well as producing a high-value product. They have developed websites to reach out to any recyclers, users of recycled materials, and regulators in order to provide a better understanding of C&D materials recycling. They have developed websites that contain research and practical information for the recycling of concrete (http://concreterecycling.org), drywall (http://drywallrecycling.org), and asphalt shingles (http://shinglerecycling.org).
• The National Association of Home Builders (NAHB; http://www.nahb.org) issued Green
Home Building Guidelines that contractors can follow to make their homes more “green,” including reducing, reusing, and recycling construction waste. They also put on an annual Green Building Conference that brings together contractors and researchers to discuss new “green” construction techniques. The NAHB Research Center also pursued research in the area of C&D materials recycling, such as using the material on-site.
• The National Demolition Association (NDA; http://www.demolitionassociation.com)
actively promotes recycling and reuse of the materials generated during a demolition. They released a report titled, “Demolition Industry Promotes C&D Recycling,” in which they describe ways that the industry and government can work together to overcome recycling barriers. The “members of the National Demolition Association are committed to increasing the recycling and reuse of the material generated” on their jobsites. They state that “recycling is good for the environment, good for the nation’s economy, a positive use of valuable commodity, and good for the country.”
4
Estimating 2003 Building-Related Construction and Demolition Materials Amounts
1.2 ESTIMATING BUILDING-RELATED C&D MATERIALS GENERATION AMOUNTS
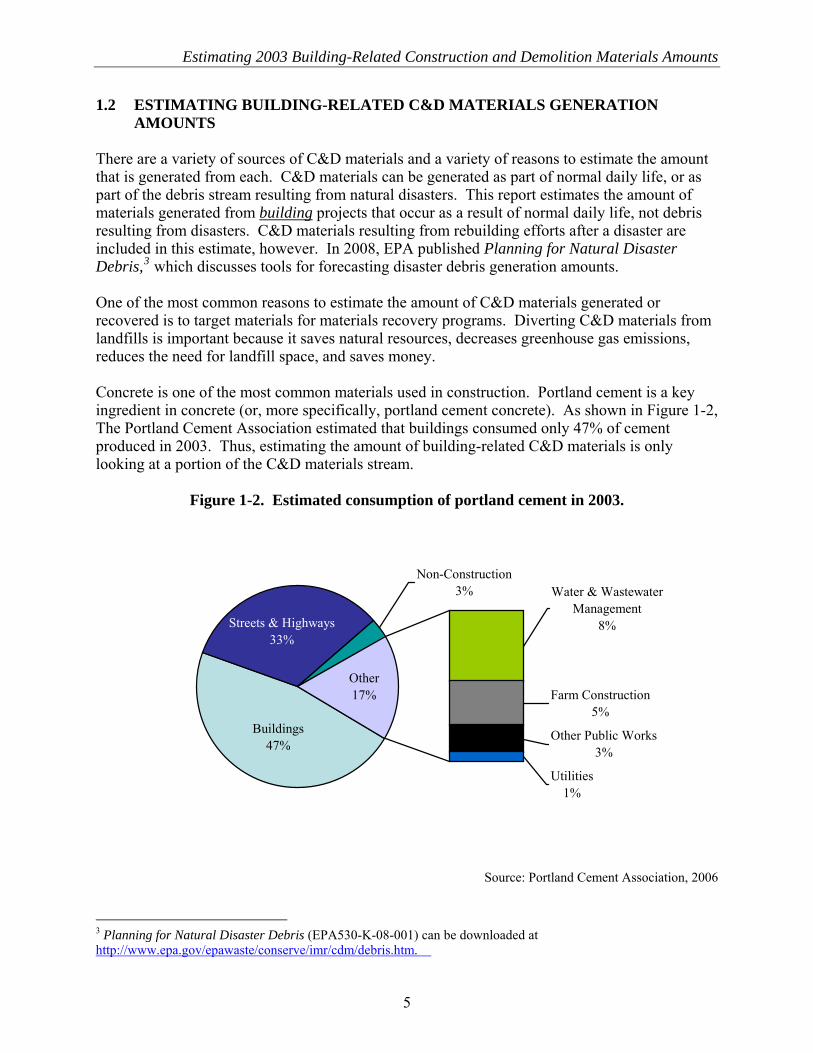
There are a variety of sources of C&D materials and a variety of reasons to estimate the amount that is generated from each. C&D materials can be generated as part of normal daily life, or as part of the debris stream resulting from natural disasters. This report estimates the amount of materials generated from building projects that occur as a result of normal daily life, not debris resulting from disasters. C&D materials resulting from rebuilding efforts after a disaster are included in this estimate, however. In 2008, EPA published Planning for Natural Disaster Debris,3 which discusses tools for forecasting disaster debris generation amounts. One of the most common reasons to estimate the amount of C&D materials generated or recovered is to target materials for materials recovery programs. Diverting C&D materials from landfills is important because it saves natural resources, decreases greenhouse gas emissions, reduces the need for landfill space, and saves money. Concrete is one of the most common materials used in construction. Portland cement is a key ingredient in concrete (or, more specifically, portland cement concrete). As shown in Figure 1-2, The Portland Cement Association estimated that buildings consumed only 47% of cement produced in 2003. Thus, estimating the amount of building-related C&D materials is only looking at a portion of the C&D materials stream.
Figure 1-2. Estimated consumption of portland cement in 2003.
Farm Construction5%
Other Public Works3%
Utilities1%
Water & Wastewater Management
8%
Non-Construction3%
Other17%
Buildings47%
Streets & Highways33%
Source: Portland Cement Association, 2006
3 Planning for Natural Disaster Debris (EPA530-K-08-001) can be downloaded at http://www.epa.gov/epawaste/conserve/imr/cdm/debris.htm.
5
There are three primary aspects of a building’s life cycle that impact the C&D materials stream: construction, renovation, and demolition/deconstruction. Initial construction requires the most materials to be purchased, but produces the smallest amount of waste. Per building, a demolition will generate the largest amount of waste of the three activities as all materials are typically removed and enter the waste stream. Renovations (including remodeling, replacements, and additions) are a combination of both construction and demolition, removing old materials and adding new materials. The methodology used in this report for estimating the amount of building-related C&D materials generated used national statistical data and typical waste generation data from construction, renovation, and demolition sites. National statistical data on the amount of building construction, renovation, and demolition activity were obtained from the USCB and other national sources. Some statistical data on construction are no longer collected; where this is the case, the data used in this report were projected from older data. Typical waste generation data from construction, renovation, and demolition sites was determined as an average of waste sampling studies performed at specific job sites as reported in the literature.4 Due to the variability of construction styles, materials, and sizes, it is unknown if the waste sampling data available are representative of the entire construction industry across the U.S. Additional waste characterization studies performed at individual job sites from around the U.S. would increase confidence in these estimates. 1.3 ESTIMATING THE RECOVERED AMOUNT OF BUILDING-RELATED C&D
MATERIALS There are four stages involved in the C&D materials management process: generating the material at a job site, transporting the material to the landfill/processor/user of recycled materials (if not used on site), processing/incinerating/disposing of the material at a recycling facility/incinerator/landfill, and, in the case of recycling, using the recycled materials. Definitions of these terms as used in this document are shown in Figure 1-3. Gauging the amount of materials that flow through any stage can be performed by surveying those that are involved in the process. Surveys can be complicated and burdensome to conduct, depending on the sample size and the response rate. As a result, few entities collect this kind of information. Recovery of building-related C&D materials for recycling, beneficial use, reuse, or waste-to-energy in 2003 was estimated using data reported by state environmental agencies. Few states report the amount of C&D materials recovered, disposed, and/or generated, however. EPA continues to investigate additional sources of C&D materials data. Additional data on construction materials recovery would increase the confidence in this estimate.
4 Land clearing materials were excluded from the C&D estimates in this report since the site materials composition studies used to estimate the amount of materials generated at a typical job site did not include land clearing materials.
6
Estimating 2003 Building-Related Construction and Demolition Materials Amounts
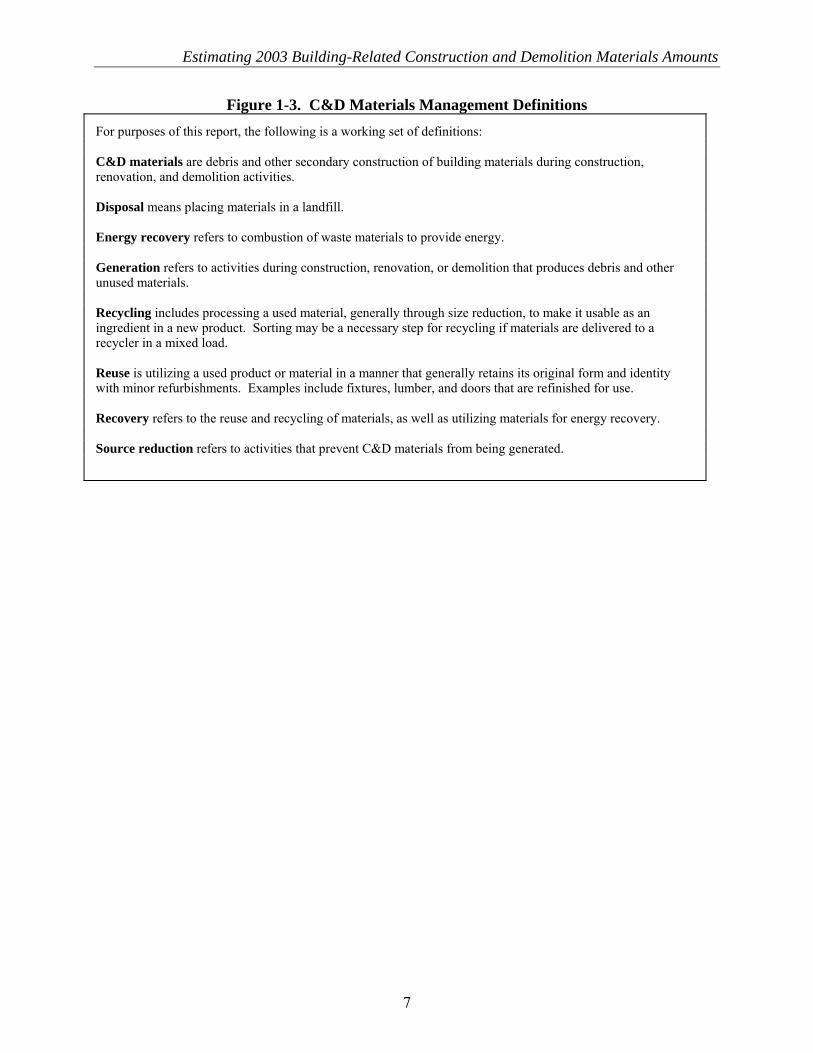
Figure 1-3. C&D Materials Management Definitions
For purposes of this report, the following is a working set of definitions: C&D materials are debris and other secondary construction of building materials during construction, renovation, and demolition activities. Disposal means placing materials in a landfill. Energy recovery refers to combustion of waste materials to provide energy. Generation refers to activities during construction, renovation, or demolition that produces debris and other unused materials. Recycling includes processing a used material, generally through size reduction, to make it usable as an ingredient in a new product. Sorting may be a necessary step for recycling if materials are delivered to a recycler in a mixed load. Reuse is utilizing a used product or material in a manner that generally retains its original form and identity with minor refurbishments. Examples include fixtures, lumber, and doors that are refinished for use. Recovery refers to the reuse and recycling of materials, as well as utilizing materials for energy recovery. Source reduction refers to activities that prevent C&D materials from being generated.
7
2 Amount of Building-Related C&D Materials Generated Building-related C&D materials can be divided into six categories: residential construction, residential demolition, residential renovation, nonresidential construction, nonresidential demolition, and nonresidential renovation. These categories were selected based on the relationship between available statistical data and waste sampling data. The following sections describe the data used and the methods for estimating the amount of building-related C&D materials generated, on a weight basis. Tables A-1 through A-5 in Appendix A are worksheets that provide details of the calculations used to arrive at generation for each component of the C&D materials stream. 2.1 METHODOLOGY AND RESULTS The methodology used for this study combines national statistical data on industry activity with point source waste assessment data (i.e., waste sampling at construction, renovation, and demolition sites) to estimate the amount of C&D materials produced nationally. In general, the amount of waste (tons5) generated is the product of the level of activity (usually area, square feet, ft2) and the typical amount of waste generated for that activity (usually weight per unit area, pounds per square feet, lb/ft2). Total waste amounts are generally described in terms of weight rather than volume. This is because the volume of waste materials can change through compaction or other processing. The weight, however, generally remains constant. 2.1.1 Residential Construction The amount of waste (tons) generated from the construction of new single and multi-family homes can be determined by multiplying the total area (ft2) of new residential construction by the typical amount of waste generated per unit area (lb/ft2), as shown in the equation below. The total area of new residential construction can be determined by dividing the total amount spent (U.S. dollars, $) on new residential construction by the average cost of new construction (as defined by the USCB) per unit area ($/ft2).
lbs/ton 2000)(lb/fton Constructi lResidentiafor AreaPer Generated WasteAverage
)($/fton Constructi lResidentia of AreaPer Cost Average
($/year) Value Place-in-Puton Constructi lResidentia Total
)(tons/year on WasteConstructi lResidentia U.S.Total 2
2
⎟⎟⎠
⎞⎜⎜⎝
⎛
×
⎟⎟⎠
⎞⎜⎜⎝
⎛
⎟⎟⎠
⎞⎜⎜⎝
⎛
=⎟⎟⎠
⎞⎜⎜⎝
⎛
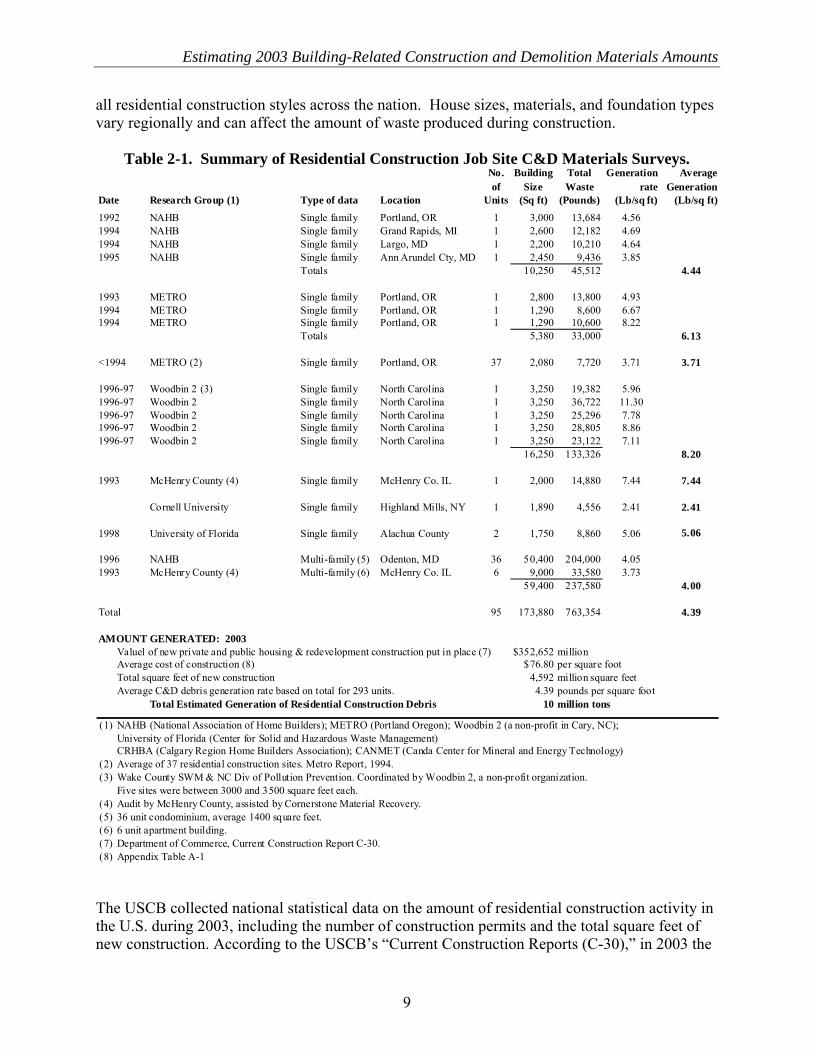
Waste sampling data for new residential construction were identified for 95 projects from eight sources. The results from these studies are presented in Table 2-1. Generation rates ranged from 2.41 to 11.3 lb/ft2. The variation in types of houses, the specific practices of the builders, and the lack of uniform standards for the collection and storage of the sampled materials may explain the differences in the estimates. In addition, these estimates, which are in some places based on 1990s data, may change with time, reflecting changes in material usage and practices. Results from each source were used to develop a weighted average estimate of the overall residential construction waste generation rate of 4.39 lb/ft2. While this category contains the largest number of job site C&D materials surveys, it is important to note that it may still not be representative of 5 The use of “tons” throughout this document refers to U.S. short tons.
8
Estimating 2003 Building-Related Construction and Demolition Materials Amounts
all residential construction styles across the nation. House sizes, materials, and foundation types vary regionally and can affect the amount of waste produced during construction.
Table 2-1. Summary of Residential Construction Job Site C&D Materials Surveys.
Date Research Group (1) Type of data Location
No. of
Units
Building Size
(Sq ft)
Total Waste
(Pounds)
Generation rate
(Lb/sq ft)
Average Generation
(Lb/sq ft)
1992 NAHB Single family Portland, OR 1 3,000 13,684 4.561994 NAHB Single family Grand Rapids, MI 1 2,600 12,182 4.691994 NAHB Single family Largo, MD 1 2,200 10,210 4.641995 NAHB Single family Ann Arundel Cty, MD 1 2,450 9,436 3.85
Totals 10,250 45,512 4.44
1993 METRO Single family Portland, OR 1 2,800 13,800 4.931994 METRO Single family Portland, OR 1 1,290 8,600 6.671994 METRO Single family Portland, OR 1 1,290 10,600 8.22
Totals 5,380 33,000 6.13
<1994 METRO (2) Single family Portland, OR 37 2,080 7,720 3.71 3.71
1996-97 Woodbin 2 (3) Single family North Carolina 1 3,250 19,382 5.961996-97 Woodbin 2 Single family North Carolina 1 3,250 36,722 11.301996-97 Woodbin 2 Single family North Carolina 1 3,250 25,296 7.781996-97 Woodbin 2 Single family North Carolina 1 3,250 28,805 8.861996-97 Woodbin 2 Single family North Carolina 1 3,250 23,122 7.11
16,250 133,326 8.20
1993 McHenry County (4) Single family McHenry Co. IL 1 2,000 14,880 7.44 7.44
Cornell University Single family Highland Mills, NY 1 1,890 4,556 2.41 2.41
1998 Single family Alachua County 2 1,750 8,860 5.06 5.06
1996 NAHB Multi-family (5) Odenton, MD 36 50,400 204,000 4.051993 McHenry County (4) Multi-family (6) McHenry Co. IL 6 9,000 33,580 3.73
59,400 237,580 4.00
Total 95 173,880 763,354 4.39
AMOUNT GENERATED: 2003Valuel of new private and public housing & redevelopment construction put in place (7) $352,652 millionAverage cost of construction (8) $76.80 per square footTotal square feet of new construction 4,592 million square feetAverage C&D debris generation rate based on total for 293 units. 4.39 pounds per square foot
Total Estimated Generation of Residential Construction Debris 10 million tons
(1) NAHB (National Association of Home Builders); METRO (Portland Oregon); Woodbin 2 (a non-profit in Cary, NC); University of Florida (Center for Solid and Hazardous Waste Management)CRHBA (Calgary Region Home Builders Association); CANMET (Canda Center for Mineral and Energy Technology)
(2) Average of 37 residential construction sites. Metro Report, 1994.(3) Wake County SWM & NC Div of Pollution Prevention. Coordinated by Woodbin 2, a non-profit organization.
Five sites were between 3000 and 3500 square feet each.(4) Audit by McHenry County, assisted by Cornerstone Material Recovery.(5) 36 unit condominium, average 1400 square feet.(6) 6 unit apartment building.(7) Department of Commerce, Current Construction Report C-30.(8) Appendix Table A-1
University of Florida
The USCB collected national statistical data on the amount of residential construction activity in the U.S. during 2003, including the number of construction permits and the total square feet of new construction. According to the USCB’s “Current Construction Reports (C-30),” in 2003 the
9
value of new residential construction put-in-place6 totaled $353 billion. Average construction cost per area ($76.80/ft2) was found by dividing the total value, in areas where permits are required, ($282 billion) by the total area of floor space (3,627 million ft2), both obtained from the U.S. 2004 Statistical Abstract, which reports 2003 data. The quotient of this factor and the total value of construction produce a total of 4,592 million ft2 of new residential construction in 2003. The product of the total area and the average waste generated per unit area, 4.39 lb/ft2, results in the total estimated C&D generation amount for residential construction of 10 million tons in 2003.
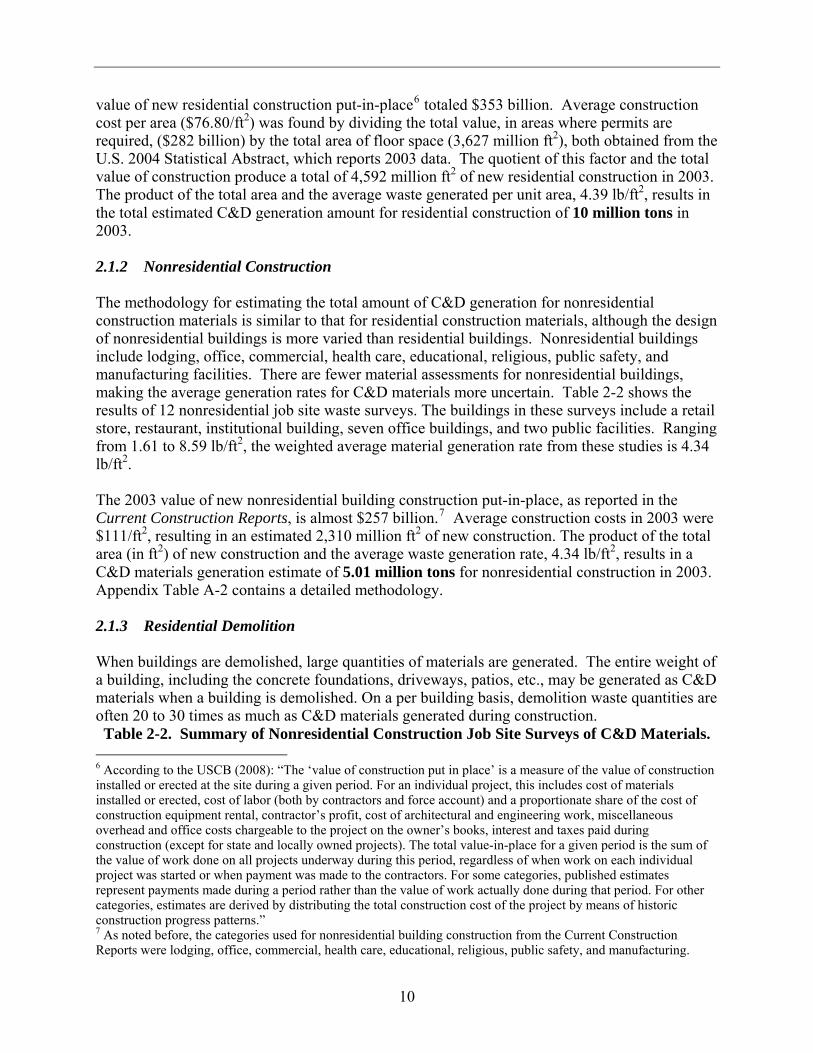
2.1.2 Nonresidential Construction The methodology for estimating the total amount of C&D generation for nonresidential construction materials is similar to that for residential construction materials, although the design of nonresidential buildings is more varied than residential buildings. Nonresidential buildings include lodging, office, commercial, health care, educational, religious, public safety, and manufacturing facilities. There are fewer material assessments for nonresidential buildings, making the average generation rates for C&D materials more uncertain. Table 2-2 shows the results of 12 nonresidential job site waste surveys. The buildings in these surveys include a retail store, restaurant, institutional building, seven office buildings, and two public facilities. Ranging from 1.61 to 8.59 lb/ft2, the weighted average material generation rate from these studies is 4.34 lb/ft2. The 2003 value of new nonresidential building construction put-in-place, as reported in the Current Construction Reports, is almost $257 billion.7 Average construction costs in 2003 were $111/ft2, resulting in an estimated 2,310 million ft2 of new construction. The product of the total area (in ft2) of new construction and the average waste generation rate, 4.34 lb/ft2, results in a C&D materials generation estimate of 5.01 million tons for nonresidential construction in 2003. Appendix Table A-2 contains a detailed methodology. 2.1.3 Residential Demolition When buildings are demolished, large quantities of materials are generated. The entire weight of a building, including the concrete foundations, driveways, patios, etc., may be generated as C&D materials when a building is demolished. On a per building basis, demolition waste quantities are often 20 to 30 times as much as C&D materials generated during construction. Table 2-2. Summary of Nonresidential Construction Job Site Surveys of C&D Materials.
6 According to the USCB (2008): “The ‘value of construction put in place’ is a measure of the value of construction installed or erected at the site during a given period. For an individual project, this includes cost of materials installed or erected, cost of labor (both by contractors and force account) and a proportionate share of the cost of construction equipment rental, contractor’s profit, cost of architectural and engineering work, miscellaneous overhead and office costs chargeable to the project on the owner’s books, interest and taxes paid during construction (except for state and locally owned projects). The total value-in-place for a given period is the sum of the value of work done on all projects underway during this period, regardless of when work on each individual project was started or when payment was made to the contractors. For some categories, published estimates represent payments made during a period rather than the value of work actually done during that period. For other categories, estimates are derived by distributing the total construction cost of the project by means of historic construction progress patterns.” 7 As noted before, the categories used for nonresidential building construction from the Current Construction Reports were lodging, office, commercial, health care, educational, religious, public safety, and manufacturing.
10
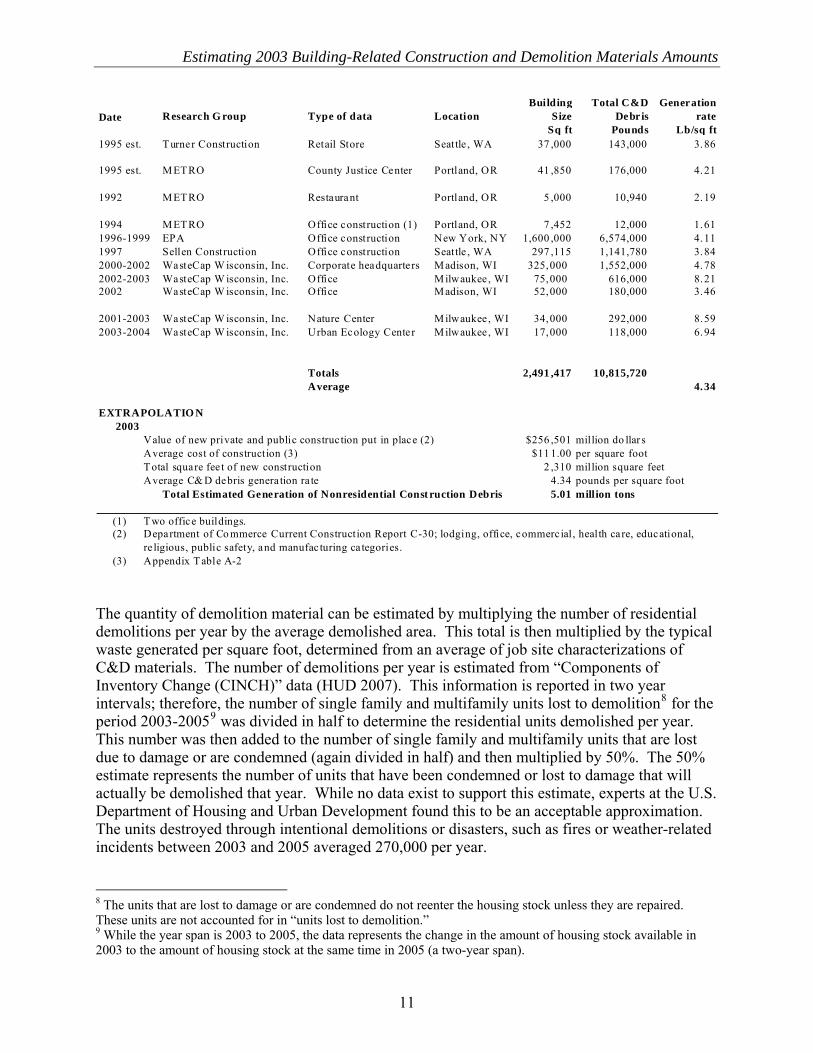
Estimating 2003 Building-Related Construction and Demolition Materials Amounts
Date Research G roup Type of data LocationBuilding
SizeTotal C&D
DebrisGeneration
rateSq ft Pounds Lb/sq ft
1995 est. Turner Construction Retail Store Seattle , WA 37 ,000 143,000 3.86
1995 est. METRO County Justice Center Portland, OR 41 ,850 176,000 4.21
1992 METRO Restaurant Portland, OR 5 ,000 10,940 2.19
1994 METRO Office construction (1) Portland, OR 7 ,452 12,000 1.611996-1999 EPA Office construction New York, NY 1,600 ,000 6,574,000 4.111997 Sellen Construction Office construction Seattle , WA 297 ,115 1,141,780 3.842000-2002 WasteCap W isconsin, Inc. Corporate headquarters Madison, WI 325,000 1,552,000 4.782002-2003 WasteCap W isconsin, Inc. Office Milwaukee , WI 75,000 616,000 8.212002 WasteCap W isconsin, Inc. Office Madison, WI 52,000 180,000 3.46
2001-2003 WasteCap W isconsin, Inc. Nature Center Milwaukee , WI 34,000 292,000 8.592003-2004 WasteCap W isconsin, Inc. Urban Ecology Center Milwaukee , WI 17,000 118,000 6.94
Totals 2,491 ,417 10,815,720Average 4.34
EXTRAPOLATIO N2003
Value of new private and public construc tion put in place (2) $256 ,501 million do llar sAverage cost of construction (3) $11 1.00 per square footTotal square fee t of new construction 2 ,310 million square feetAverage C& D debris genera tion ra te 4.34 pounds per square foot
Total Estimated Generation of Nonresidential Const ruction Debris 5.01 million tons
(1) Two office buildings.(2) Department of Co mmerce Current Construction Report C-30; lodging, office, commercial , health care, educational,
re ligious, public safety, and manufac turing ca tegories.(3) Appendix Table A-2
The quantity of demolition material can be estimated by multiplying the number of residential demolitions per year by the average demolished area. This total is then multiplied by the typical waste generated per square foot, determined from an average of job site characterizations of C&D materials. The number of demolitions per year is estimated from “Components of Inventory Change (CINCH)” data (HUD 2007). This information is reported in two year intervals; therefore, the number of single family and multifamily units lost to demolition8 for the period 2003-20059 was divided in half to determine the residential units demolished per year. This number was then added to the number of single family and multifamily units that are lost due to damage or are condemned (again divided in half) and then multiplied by 50%. The 50% estimate represents the number of units that have been condemned or lost to damage that will actually be demolished that year. While no data exist to support this estimate, experts at the U.S. Department of Housing and Urban Development found this to be an acceptable approximation. The units destroyed through intentional demolitions or disasters, such as fires or weather-related incidents between 2003 and 2005 averaged 270,000 per year. 8 The units that are lost to damage or are condemned do not reenter the housing stock unless they are repaired. These units are not accounted for in “units lost to demolition.” 9 While the year span is 2003 to 2005, the data represents the change in the amount of housing stock available in 2003 to the amount of housing stock at the same time in 2005 (a two-year span).
11
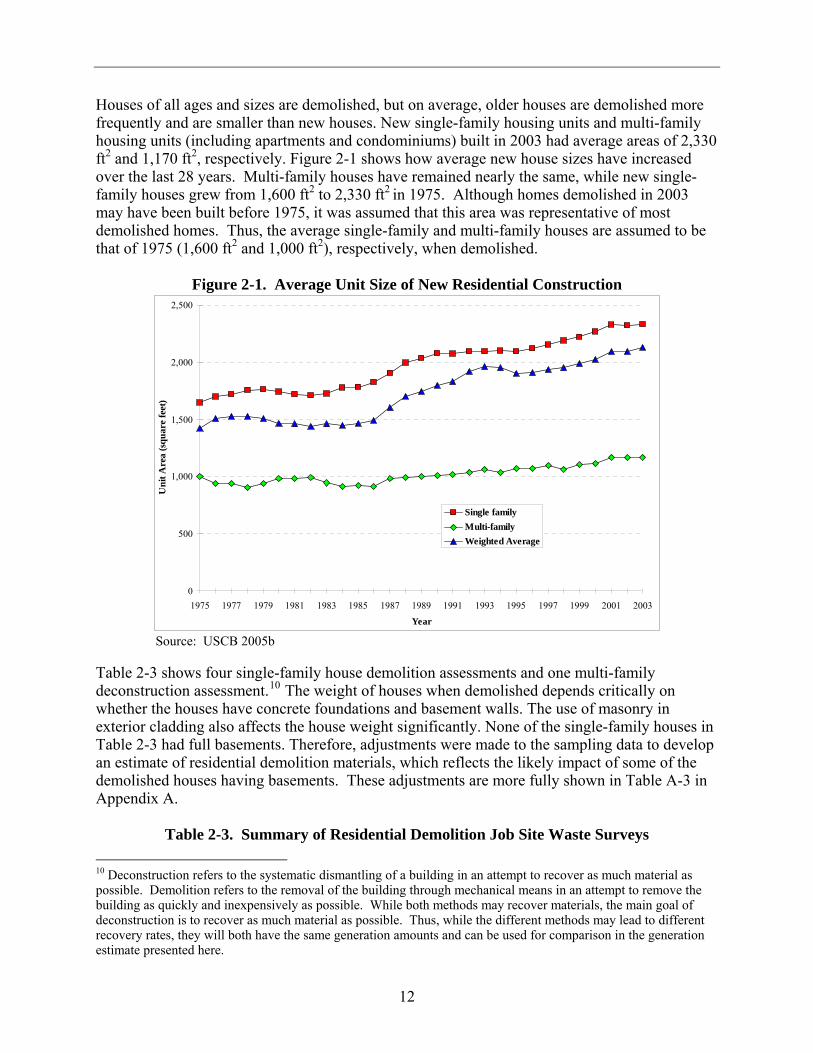
Houses of all ages and sizes are demolished, but on average, older houses are demolished more frequently and are smaller than new houses. New single-family housing units and multi-family housing units (including apartments and condominiums) built in 2003 had average areas of 2,330 ft2 and 1,170 ft2, respectively. Figure 2-1 shows how average new house sizes have increased over the last 28 years. Multi-family houses have remained nearly the same, while new single-family houses grew from 1,600 ft2 to 2,330 ft2 in 1975. Although homes demolished in 2003 may have been built before 1975, it was assumed that this area was representative of most demolished homes. Thus, the average single-family and multi-family houses are assumed to be that of 1975 (1,600 ft2 and 1,000 ft2), respectively, when demolished.
Figure 2-1. Average Unit Size of New Residential Construction
0
500
1,000
1,500
2,000
2,500
1975 1977 1979 1981 1983 1985 1987 1989 1991 1993 1995 1997 1999 2001 2003
Year
Uni
t Are
a (s
quar
e fe
et)
Single familyMulti-familyWeighted Average
Source: USCB 2005b
Table 2-3 shows four single-family house demolition assessments and one multi-family deconstruction assessment.10 The weight of houses when demolished depends critically on whether the houses have concrete foundations and basement walls. The use of masonry in exterior cladding also affects the house weight significantly. None of the single-family houses in Table 2-3 had full basements. Therefore, adjustments were made to the sampling data to develop an estimate of residential demolition materials, which reflects the likely impact of some of the demolished houses having basements. These adjustments are more fully shown in Table A-3 in Appendix A.
Table 2-3. Summary of Residential Demolition Job Site Waste Surveys 10 Deconstruction refers to the systematic dismantling of a building in an attempt to recover as much material as possible. Demolition refers to the removal of the building through mechanical means in an attempt to remove the building as quickly and inexpensively as possible. While both methods may recover materials, the main goal of deconstruction is to recover as much material as possible. Thus, while the different methods may lead to different recovery rates, they will both have the same generation amounts and can be used for comparison in the generation estimate presented here.
12
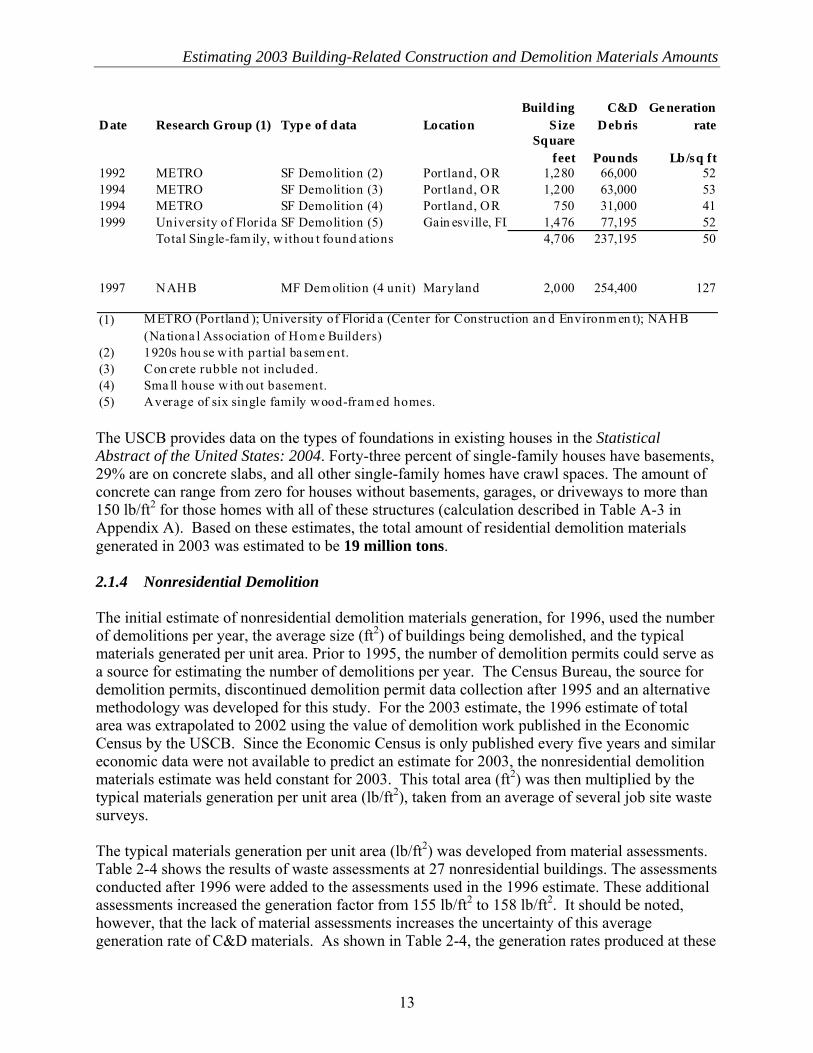
Estimating 2003 Building-Related Construction and Demolition Materials Amounts
Date Research Group (1) Type of data LocationBuilding
SizeC&D
DebrisGe neration
rateSquare
feet Pounds Lb/sq ft1992 METRO SF Demolition (2) Portland, OR 1,280 66,000 521994 METRO SF Demolition (3) Portland, OR 1,200 63,000 531994 METRO SF Demolition (4) Portland, OR 750 31,000 411999 University of Florida SF Demolition (5) Gain esville, FL 1,476 77,195 52
Total Single-fam ily, withou t found ations 4,706 237,195 50
1997 NAHB MF Dem olition (4 unit) Maryland 2,000 254,400 127
(1)
(2) 1920s hou se with partial ba sem ent.(3) Con crete rubble not included.(4) Sma ll house with out basement.(5) Average of six single family wood-fram ed homes.
METRO (Portland ); University of Florid a (Center for Construction an d Environm en t); NAHB (Na tiona l Association of Hom e Builders)
The USCB provides data on the types of foundations in existing houses in the Statistical Abstract of the United States: 2004. Forty-three percent of single-family houses have basements, 29% are on concrete slabs, and all other single-family homes have crawl spaces. The amount of concrete can range from zero for houses without basements, garages, or driveways to more than 150 lb/ft2 for those homes with all of these structures (calculation described in Table A-3 in Appendix A). Based on these estimates, the total amount of residential demolition materials generated in 2003 was estimated to be 19 million tons. 2.1.4 Nonresidential Demolition The initial estimate of nonresidential demolition materials generation, for 1996, used the number of demolitions per year, the average size (ft2) of buildings being demolished, and the typical materials generated per unit area. Prior to 1995, the number of demolition permits could serve as a source for estimating the number of demolitions per year. The Census Bureau, the source for demolition permits, discontinued demolition permit data collection after 1995 and an alternative methodology was developed for this study. For the 2003 estimate, the 1996 estimate of total area was extrapolated to 2002 using the value of demolition work published in the Economic Census by the USCB. Since the Economic Census is only published every five years and similar economic data were not available to predict an estimate for 2003, the nonresidential demolition materials estimate was held constant for 2003. This total area (ft2) was then multiplied by the typical materials generation per unit area (lb/ft2), taken from an average of several job site waste surveys. The typical materials generation per unit area (lb/ft2) was developed from material assessments. Table 2-4 shows the results of waste assessments at 27 nonresidential buildings. The assessments conducted after 1996 were added to the assessments used in the 1996 estimate. These additional assessments increased the generation factor from 155 lb/ft2 to 158 lb/ft2. It should be noted, however, that the lack of material assessments increases the uncertainty of this average generation rate of C&D materials. As shown in Table 2-4, the generation rates produced at these
13
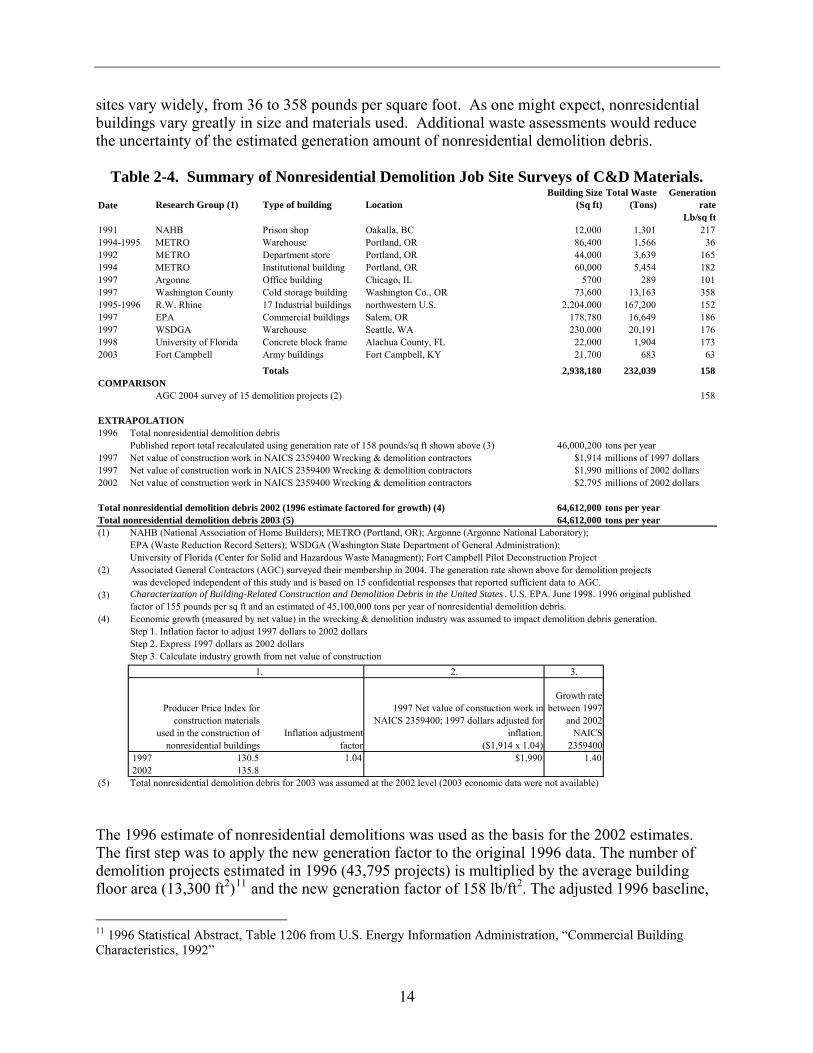
sites vary widely, from 36 to 358 pounds per square foot. As one might expect, nonresidential buildings vary greatly in size and materials used. Additional waste assessments would reduce the uncertainty of the estimated generation amount of nonresidential demolition debris.
Table 2-4. Summary of Nonresidential Demolition Job Site Surveys of C&D Materials.
Date Research Group (1) Type of building LocationBuilding Size
(Sq ft)Total Waste
(Tons)Generation
rateLb/sq ft
1991 NAHB Prison shop Oakalla, BC 12,000 1,301 2171994-1995 METRO Warehouse Portland, OR 86,400 1,566 361992 METRO Department store Portland, OR 44,000 3,639 1651994 METRO Institutional building Portland, OR 60,000 5,454 1821997 Argonne Office building Chicago, IL 5700 289 1011997 Washington County Cold storage building Washington Co., OR 73,600 13,163 3581995-1996 R.W. Rhine 17 Industrial buildings northwestern U.S. 2,204,000 167,200 1521997 EPA Commercial buildings Salem, OR 178,780 16,649 1861997 WSDGA Warehouse Seattle, WA 230,000 20,191 1761998 University of Florida Concrete block frame Alachua County, FL 22,000 1,904 1732003 Fort Campbell Army buildings Fort Campbell, KY 21,700 683 63
Totals 2,938,180 232,039 158COMPARISON
AGC 2004 survey of 15 demolition projects (2) 158
EXTRAPOLATION1996 Total nonresidential demolition debris
Published report total recalculated using generation rate of 158 pounds/sq ft shown above (3) 46,000,200 tons per year1997 Net value of construction work in NAICS 2359400 Wrecking & demolition contractors $1,914 millions of 1997 dollars1997 Net value of construction work in NAICS 2359400 Wrecking & demolition contractors $1,990 millions of 2002 dollars2002 Net value of construction work in NAICS 2359400 Wrecking & demolition contractors $2,795 millions of 2002 dollars
Total nonresidential demolition debris 2002 (1996 estimate factored for growth) (4) 64,612,000 tons per yearTotal nonresidential demolition debris 2003 (5) 64,612,000 tons per year(1) NAHB (National Association of Home Builders); METRO (Portland, OR); Argonne (Argonne National Laboratory);
EPA (Waste Reduction Record Setters); WSDGA (Washington State Department of General Administration); University of Florida (Center for Solid and Hazardous Waste Managment); Fort Campbell Pilot Deconstruction Project
(2) Associated General Contractors (AGC) surveyed their membership in 2004. The generation rate shown above for demolition projects was developed independent of this study and is based on 15 confidential responses that reported sufficient data to AGC.
(3)
(4) Economic growth (measured by net value) in the wrecking & demolition industry was assumed to impact demolition debris generation.Step 1. Inflation factor to adjust 1997 dollars to 2002 dollarsStep 2. Express 1997 dollars as 2002 dollarsStep 3. Calculate industry growth from net value of construction
2. 3.
Producer Price Index for construction materials
used in the construction of nonresidential buildings
Inflation adjustment factor
1997 Net value of constuction work in NAICS 2359400; 1997 dollars adjusted for
inflation.($1,914 x 1.04)
Growth rate between 1997
and 2002 NAICS
23594001997 130.5 1.04 $1,990 1.402002 135.8
(5) Total nonresidential demolition debris for 2003 was assumed at the 2002 level (2003 economic data were not available)
1.
Characterization of Building-Related Construction and Demolition Debris in the United States . U.S. EPA. June 1998. 1996 original published factor of 155 pounds per sq ft and an estimated of 45,100,000 tons per year of nonresidential demolition debris.
The 1996 estimate of nonresidential demolitions was used as the basis for the 2002 estimates. The first step was to apply the new generation factor to the original 1996 data. The number of demolition projects estimated in 1996 (43,795 projects) is multiplied by the average building floor area (13,300 ft2)11 and the new generation factor of 158 lb/ft2. The adjusted 1996 baseline,
11 1996 Statistical Abstract, Table 1206 from U.S. Energy Information Administration, “Commercial Building Characteristics, 1992”
14
Estimating 2003 Building-Related Construction and Demolition Materials Amounts
shown in Table 2-4, is 46 million tons (an increase of approximately one million tons over the original published estimate). The second step takes the net value of construction work in the category for wrecking and demolition contractors for 1997 and 2002 from the Economic Census. After adjusting for inflation, the growth rate was calculated from 1997 to 2002. This assumes that economic growth (measured by net value) in the wrecking & demolition industry is directly related to demolition materials generation. The growth rate of 1.4 in net value of construction work for wrecking and demolition contractors from 1997 to 2002 predicts nonresidential demolition materials to be 65 million tons in 2002 (Table 2-4). Since no data source exists for 2003, it is assumed that 65 million tons of nonresidential demolition materials were generated in 2003. 2.1.5 Residential Renovation Renovation includes improvements and repairs to existing buildings, including driveways. Renovation materials consist of both construction and demolition materials as old materials are removed and new materials are added. The renovation waste stream can be fairly homogenous, such as when driveways or asphalt roofs are replaced, or heterogeneous, such as when buildings are modified or enlarged. Because of the wide variation in renovation projects, waste assessments should be separated by renovation type to determine generation per square foot. Table 2-5 shows the results of five waste assessments that have been made at residential sites, illustrating a wide variation in generation rates on a square foot basis. Renovating kitchens, bathrooms, and entire houses typically generates more waste per square foot than new construction, largely because of the demolition that accompanies remodeling. However, some renovation activities, like roof replacement, produce relatively low amounts of material on a square foot basis.
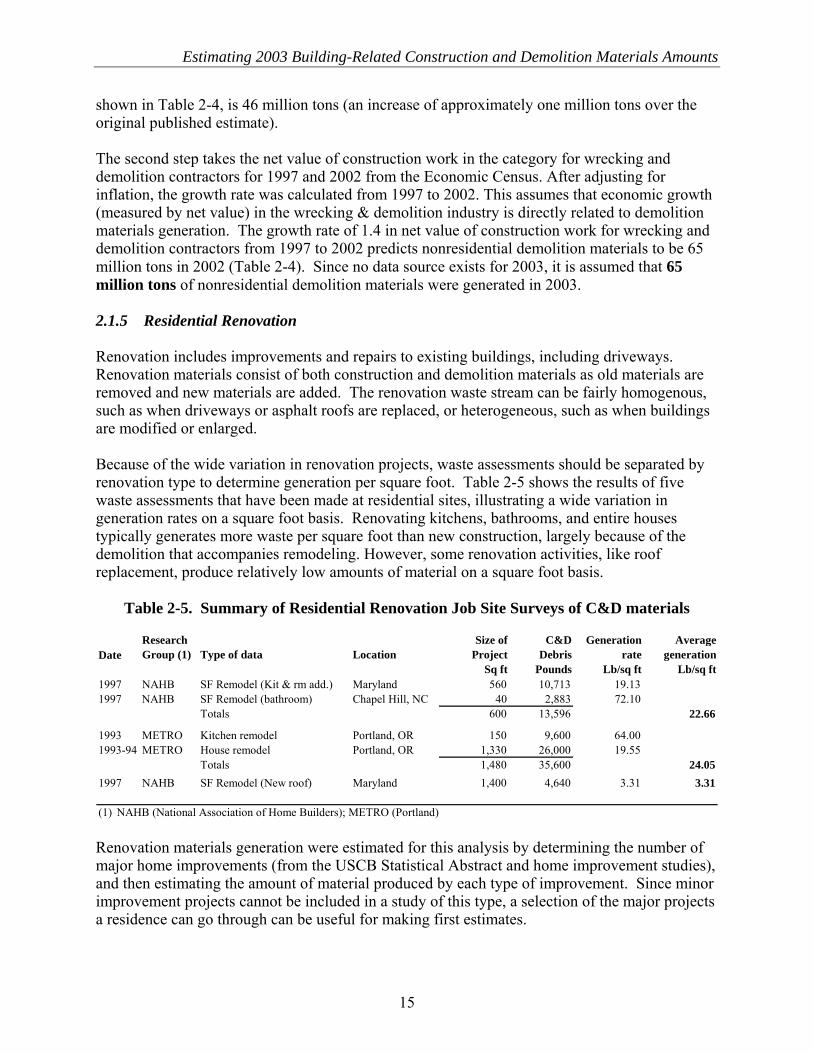
Table 2-5. Summary of Residential Renovation Job Site Surveys of C&D materials
DateResearch Group (1) Type of data Location
Size of Project
C&D Debris
Generation rate
Average generation
Sq ft Pounds Lb/sq ft Lb/sq ft1997 NAHB SF Remodel (Kit & rm add.) Maryland 560 10,713 19.131997 NAHB SF Remodel (bathroom) Chapel Hill, NC 40 2,883 72.10
Totals 600 13,596 22.66
1993 METRO Kitchen remodel Portland, OR 150 9,600 64.001993-94 METRO House remodel Portland, OR 1,330 26,000 19.55
Totals 1,480 35,600 24.051997 NAHB SF Remodel (New roof) Maryland 1,400 4,640 3.31 3.31
(1) NAHB (National Association of Home Builders); METRO (Portland) Renovation materials generation were estimated for this analysis by determining the number of major home improvements (from the USCB Statistical Abstract and home improvement studies), and then estimating the amount of material produced by each type of improvement. Since minor improvement projects cannot be included in a study of this type, a selection of the major projects a residence can go through can be useful for making first estimates.
15
Appendix A Tables A-6, A-7, A-8, and A-9 show some of the assumptions made and the results of estimating the amount of material produced when driveways are replaced, when asphalt and wood roofs from residences having one to four units per structure are replaced, and when residential heating and cooling equipment is replaced. Based on the assumptions, driveway replacement generated 20 million tons of concrete. Asphalt roof replacement produced 7 million tons of largely asphalt shingle waste and wood roof replacement produced 2 million tons of largely wood waste. The replacement of heating, ventilating, and air conditioning (HVAC) equipment produced 2.1 million tons of materials. Remodeling kitchens, bathrooms, and other home interiors generated approximately 6.7 million tons. On this basis, the total residential renovation generation, from the improvement or replacement projects itemized above, was estimated to be 37.8 million tons in 2003. 2.1.6 Nonresidential Renovation No information was found on the total amount of money spent on nonresidential renovation in 2003. The USCB last estimated that the total dollars spent for nonresidential renovation projects in 1992 was $155 billion. This report assumed the ratio of residential to nonresidential dollars is the same in 2003 as in 1992. Therefore, the total amount of money spent on nonresidential renovation was calculated using the amount spent on residential renovation and the ratio of residential to nonresidential renovation in 1992. Very few material assessments are available for nonresidential renovation. Additionally, the materials assessments available do not have any consistency. Therefore, a methodology similar to the one used for residential renovation cannot be used to estimate the materials generated during nonresidential renovations. In the absence of adequate materials assessment data, total dollars spent on nonresidential and residential renovation were compared. It was assumed that the amount of materials generated is proportional to the dollars spent in these two sectors. (See Table A-5 for more details of this analysis.) Based on the assumption that materials generation per dollar is equal to the residential rate, total nonresidential renovation materials generated was estimated to be 29 million tons in 2003. Table 2-6 shows nine assessments that have been made at nonresidential renovation sites; these data show a wide variation in generation rates on a square foot basis. Since this estimate is based on relatively old data and few material assessments, this estimate of nonresidential renovation generation amounts has a high level of uncertainty.
16
Estimating 2003 Building-Related Construction and Demolition Materials Amounts
Table 2-6. Summary of Nonresidential Renovation Job Site Surveys of C&D Materials.
Date Research Group (1) Type of data Location Building Size C&D DebrisGeneration
rate
Sq ft Pounds Pounds/sq ftNatural Resources Canada Office Renovation Ottawa, Ontario 9,000 48,069 5.34METRO, Portland Office Renovation Portland, OR 6,000 18,000 3.00
1997 Sellen Construction Office Renovation Seattle, WA 72,000 2,051,520 28.491997 Sellen Construction Office Renovation Seattle, WA 180,000 1,232,600 6.851994-96 EPA Office Renovation San Diego, CA 73,000 732,000 10.031998 EPA Office Renovation Austin, TX 15,500 110,000 7.10
Total Office Renovation 355,500 4,192,189 11.79
1997 Sellen Construction Hospital Renovation Seattle, WA 24,000 495,100 20.63METRO Hospital Renovation Portland, OR 10,560 50,400 4.77
1993 METRO Department Store Portland, OR 198,500 1,980,000 9.97Total Other Renovation 233,060 2,525,500 10.84
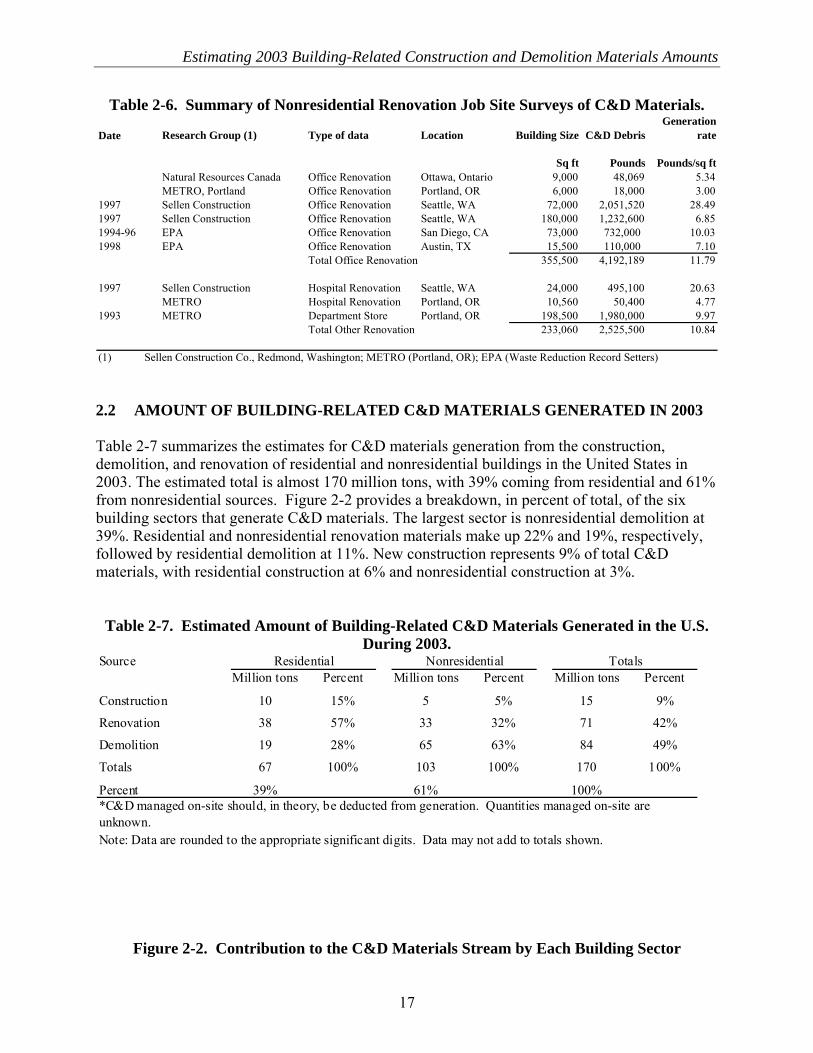
(1) Sellen Construction Co., Redmond, Washington; METRO (Portland, OR); EPA (Waste Reduction Record Setters) 2.2 AMOUNT OF BUILDING-RELATED C&D MATERIALS GENERATED IN 2003 Table 2-7 summarizes the estimates for C&D materials generation from the construction, demolition, and renovation of residential and nonresidential buildings in the United States in 2003. The estimated total is almost 170 million tons, with 39% coming from residential and 61% from nonresidential sources. Figure 2-2 provides a breakdown, in percent of total, of the six building sectors that generate C&D materials. The largest sector is nonresidential demolition at 39%. Residential and nonresidential renovation materials make up 22% and 19%, respectively, followed by residential demolition at 11%. New construction represents 9% of total C&D materials, with residential construction at 6% and nonresidential construction at 3%.
Table 2-7. Estimated Amount of Building-Related C&D Materials Generated in the U.S. During 2003.
SourceMillion tons Percent Million tons Percent Million tons Percent
Construction 10 15% 5 5% 15 9%
Renovation 38 57% 33 32% 71 42%
Demolition 19 28% 65 63% 84 49%
Totals 67 100% 103 100% 170 100%
Percent 39% 61% 100%
Note: Data are rounded to the appropriate significant digits. Data may not add to totals shown.
*C&D managed on-site should, in theory, be deducted from generation. Quantities managed on-site are unknown.
Residential Nonresidential Totals
Figure 2-2. Contribution to the C&D Materials Stream by Each Building Sector
17
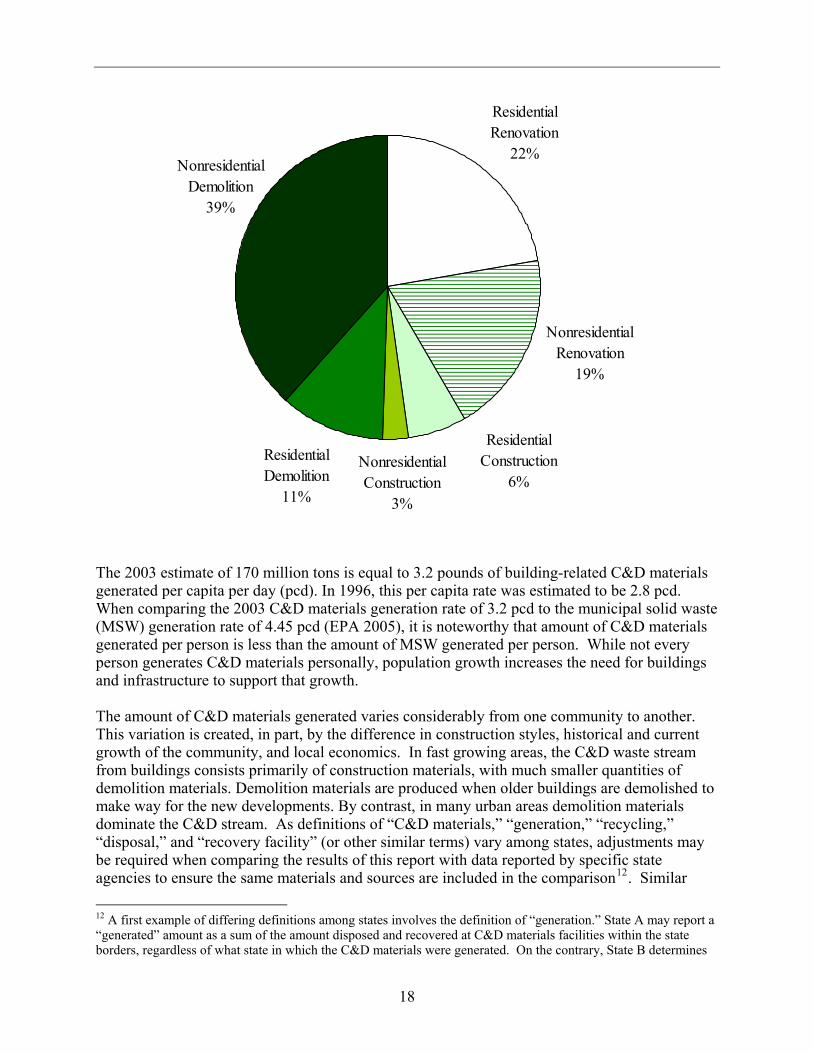
Residential Demolition
11%
Nonresidential Demolition
39%
Residential Renovation
22%
Nonresidential Renovation
19%
Nonresidential Construction
3%
Residential Construction
6%
The 2003 estimate of 170 million tons is equal to 3.2 pounds of building-related C&D materials generated per capita per day (pcd). In 1996, this per capita rate was estimated to be 2.8 pcd. When comparing the 2003 C&D materials generation rate of 3.2 pcd to the municipal solid waste (MSW) generation rate of 4.45 pcd (EPA 2005), it is noteworthy that amount of C&D materials generated per person is less than the amount of MSW generated per person. While not every person generates C&D materials personally, population growth increases the need for buildings and infrastructure to support that growth. The amount of C&D materials generated varies considerably from one community to another. This variation is created, in part, by the difference in construction styles, historical and current growth of the community, and local economics. In fast growing areas, the C&D waste stream from buildings consists primarily of construction materials, with much smaller quantities of demolition materials. Demolition materials are produced when older buildings are demolished to make way for the new developments. By contrast, in many urban areas demolition materials dominate the C&D stream. As definitions of “C&D materials,” “generation,” “recycling,” “disposal,” and “recovery facility” (or other similar terms) vary among states, adjustments may be required when comparing the results of this report with data reported by specific state agencies to ensure the same materials and sources are included in the comparison12. Similar 12 A first example of differing definitions among states involves the definition of “generation.” State A may report a “generated” amount as a sum of the amount disposed and recovered at C&D materials facilities within the state borders, regardless of what state in which the C&D materials were generated. On the contrary, State B determines
18
Estimating 2003 Building-Related Construction and Demolition Materials Amounts
adjustments may also be required when comparing data from any two states. The components that make up C&D materials also vary a great deal depending on the type of construction and the methods used by the construction industry.
the amounts of C&D materials imported to and exported from their state and accounts for addition/subtraction (as appropriate) in their amount “generated.” A second example involves the types of facilities that the state collects from. State C does not require facilities that process only concrete or asphalt pavement to report annual amounts that they recover. On the contrary, State D does require these facilities to report their amounts to the state and their amounts are included in the overall State D C&D materials recovery amounts. A third example involves incentives for using different definitions. State E levies a fee associated with various types of waste. If C&D materials have a lower fee than other materials, generators are incentivized to classify their waste as C&D materials rather than another waste, even though it might not fall within the classical definition that may be used outside of State E. These three examples are just some of the reasons why definitions play such an important role in measuring C&D materials amounts.
19
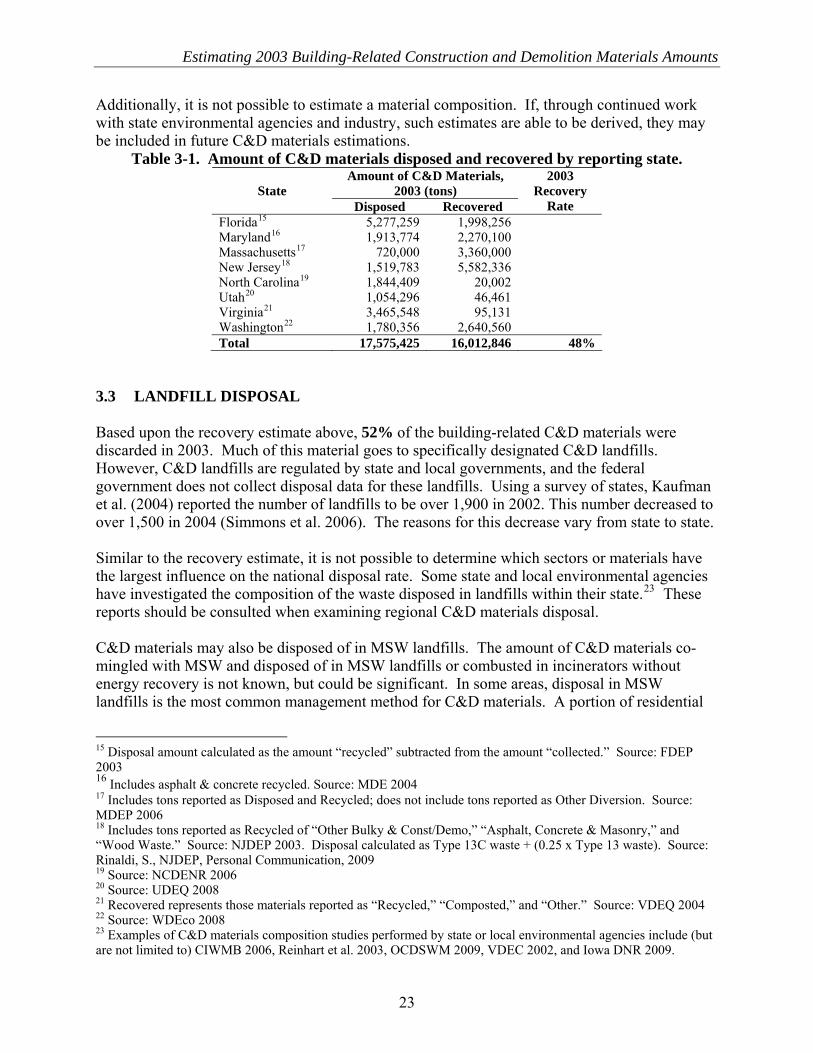
3 Building-Related C&D Materials Management EPA’s 1989 Agenda for Action endorsed an Integrated Waste Management Strategy to address the growing amount of municipal solid waste, including C&D materials generated. This strategy refers to “the complementary use of a variety of waste management practices to safely and effectively handle the municipal solid waste stream with the least adverse impact on human health and the environment.” The components of the Strategy are: source reduction (or waste prevention), recycling, including off-site (or community) composting, combustion with energy recovery, disposal through landfilling and combustion without energy recovery. Components of C&D materials can be and are managed in each of these ways. Different measurement methodologies were used for each type of management method. Because many C&D processing facilities send materials to be beneficially used in a variety of markets, the term “recovery” is used here to represent the reuse, recycling, and combustion with energy recovery of C&D materials. 3.1 SOURCE REDUCTION Currently, there are no known estimates of sources reduced on-site through improved methods and materials. Efforts including purchasing optimization during construction to avoid surplus materials and reusing existing shell and structure during renovation can reduce the amount of materials that need to be removed from the site and managed. The amount of used materials avoided through these efforts had not been documented, but any efforts to document these trends may be considered for use in future C&D materials estimations. 3.2 MATERIALS RECOVERY C&D materials recovery includes efforts to reuse, recycle, or otherwise beneficially use C&D materials in various applications, including use in energy recovery applications. There are many drivers for C&D materials recovery. Historically, economics has been the primary driver for recovery. In locations where disposal fees were high, recovery became an economically preferable option. Materials that have traditionally retained a high value when recovered, such as metals, were recovered even in areas that had low disposal fees. These economic drivers remain in place today, but an additional factor is affecting the economics of recycling today that did not exist in the past: green building programs. Specifically, green building rating systems typically give credits for the reuse or recycling of C&D materials. Since the creation of the U.S. Green Building Council in 1993 and the spike of green buildings in 2000, demand for reuse or recycling opportunities has increased in areas where such opportunities had not existed. More information on green building can be found at www.epa.gov/greenbuilding. 3.2.1 Barriers to C&D Materials Recovery Barriers to materials recovery still exist, however. Many buildings and building materials are not designed to be reused or recycled. EPA’s Lifecycle Building Challenge is a design competition that challenges professionals and students to design building materials and assemblies for reuse and recycling. More formation can be found at www.lifecyclebuilding.org. If C&D materials will be generated at construction sites, C&D materials management should be included in the construction plan. Successful planning teams include the owner of the building,
20
Estimating 2003 Building-Related Construction and Demolition Materials Amounts
the architect, and the contractor. Success stories of C&D recovery can be found at www.epa.gov/cdmaterials. There are other barriers that exist to C&D materials recovery. In some locations, recovery facilities do not exist. Even where facilities do exist, markets have not been found for some materials for a variety of reasons. There could be a lack of demand for a material, an unwillingness to use recycled materials in place of virgin resources, or a regulatory prevention of its use. Many markets view recycled materials as inferior simply because they are viewed as wastes, yet they often have the same chemical or physical properties as comparable virgin materials, and provide comparable performance; in some cases, they provide superior performance than do virgin materials at a lower cost. EPA aims to expand recognition of the value of C&D materials so that they are more widely viewed as locally available resources, rather than un-usable discards. Potentially harmful materials, such as asbestos, lead-based paint (LBP), and polychlorinated biphenyls (PCBs), have historically been used in the construction and maintenance of many buildings. These materials can greatly affect the recyclability of some materials, especially those derived from older buildings. In some instances, concerns about the possibility of these materials entering the recycling stream have prevented entire segments of the C&D materials stream from being recycled. The specific percentage of C&D materials that contain asbestos, lead, or PCBs is unknown. As a result, it is very difficult to determine the impact the presence of these compounds in C&D materials has on C&D materials recovery. Some data are available on the use and prevalence of these harmful materials in buildings. It was recently reported that, as of 2000, 38 million homes in the U.S. still contained LBP somewhere in the building, either on interior or exterior surfaces (Clickner et al. 2001). According to the United States Geological Survey (USGS), asbestos use in all applications (including construction) declined from approximately 7,600 tons in 2002 to approximately 5,100 tons in 2003. In fact, the consumption of asbestos in 2003 represented less than 0.6% than that of the consumption in 1973, the peak year for U.S. asbestos consumption. According to the USGS, the current primary use of asbestos in construction is in some roof coatings, not in asphalt shingles (2003). In fact, recent testing of old asphalt shingles from re-roofing activities collected at recycling centers indicates that the presence of asbestos is relatively rare and should continue to be come even more rare as these shingles are removed an replaced with non-asbestos-containing shingles (CMRA 2007). Unfortunately, asbestos testing costs and time delays can be a disincentive to recycling and, as a result, recycling rates for asphalt shingles continue to be low. LBP was banned in 1978, some uses of asbestos in buildings were banned by 1978, and PCBs were banned in 1979. 3.2.2 Quantifying Recovery of C&D Materials There are a number of organizations that are working to overcome the barriers to C&D materials recovery. EPA works with other governmental and industry partners in funding new research, promoting safe uses for C&D materials, and in conducting education and outreach. For example, through the WasteWise partnership program, the EPA rewards those who have created successful recycling programs. For more information about WasteWise, please see www.epa.gov/wastewise. To learn more about what the EPA is doing to increase C&D materials recovery, please see www.epa.gov/cdmaterials.
21
There are various sources of C&D materials recovery data that capture different parts of the recovery stream, including surveys of contractors, surveys of recyclers, and estimates made by state environmental agencies. These sources are discussed in detail in Appendix B. While the surveys of contractors could be used for this estimate, EPA was not able to find a recent survey of recycling in the residential building sector. Additionally, those surveys of demolition and nonresidential contractors may not represent actual recovery as the recycling facilities may actually dispose of a portion of the materials that they receive. While a survey of recyclers was performed, the surveyors were unable to distinguish the amount of materials derived from buildings from other materials that were present in the recycling stream. Thus, these estimates for C&D recovery cannot be compared with the amount of C&D materials generated, which only represents building materials. Data collected by state environmental agencies on the amount generated, disposed, and recovered, on the other hand, are viewed as the most accurate source of information. Unfortunately, only eight states collect recovery and disposal or generation amounts that could be used to estimate a recovery rate (see Table 3-1). These states represent approximately 21% of the U.S. population. Thus, the weighted recovery rate estimated using the eight states’ data may not be fully representative of the entire country. Additionally, state definitions of what constitutes C&D materials and recycling vary. For example, some states count C&D materials that are used as alternative daily cover in landfills and for energy recovery13 to be counted as recycling, while others do not. In the chart below, EPA has labeled the category measured as “recovery” instead of “recycling” in order to include materials that are recovered for other uses that do not fall under the definition of “recycling.” The weighted average recovery rate for the eight states for 2003 was 48%. While this number may not be fully representative of the entire country, it does provide an indicator of C&D materials recovery in the U.S. However, it is, at best, an approximation. For instance, it is known that the recovery numbers provided by some states likely include some concrete, asphalt pavement, and metals from non-building sources, while other states do not include those materials. Additionally, recovery efforts after disasters could be included in the reported numbers.14 Thus, the recovery estimate of 48% for buildings may be high. On the other hand, the reported numbers for other states may not capture the entire amount of building-related C&D materials that are recovered in that state, either because the C&D materials were exported or because only certain types of C&D materials recycling facilities are required to report. As with comparing generation estimates, definitions of “recycling” and “C&D materials” can vary widely from state to state (see footnote on page 19). The EPA intends to continue working with state environmental agencies and other partners to develop better national recovery estimates for the future. Unfortunately, looking overall at state data does not provide a breakdown of the recovery amounts for specific materials within the C&D recycling stream, so it is not possible to determine which sectors or which materials have the largest influence on the recovery rate.
13 On the question of energy recovery, a major market for C&D wood is its use as boiler fuel. Most recyclers include amounts of wood sold for boiler fuel in their reporting for recycling. 14 For example, over seven million cubic yards (approximately 1 million tons) of vegetative debris was generated in the three most affected counties of Mississippi after Hurricane Katrina during 2005 and 2006. Such amounts can have large impacts on data reported as “recycled” and “disposed.”
22
Estimating 2003 Building-Related Construction and Demolition Materials Amounts
Additionally, it is not possible to estimate a material composition. If, through continued work with state environmental agencies and industry, such estimates are able to be derived, they may be included in future C&D materials estimations.
Table 3-1. Amount of C&D materials disposed and recovered by reporting state. Amount of C&D Materials,
2003 (tons) State Disposed Recovered
2003 Recovery
Rate Florida15 5,277,259 1,998,256 Maryland16 1,913,774 2,270,100 Massachusetts17 720,000 3,360,000 New Jersey18 1,519,783 5,582,336 North Carolina19 1,844,409 20,002 Utah20 1,054,296 46,461 Virginia21 3,465,548 95,131 Washington22 1,780,356 2,640,560 Total 17,575,425 16,012,846 48%
3.3 LANDFILL DISPOSAL Based upon the recovery estimate above, 52% of the building-related C&D materials were discarded in 2003. Much of this material goes to specifically designated C&D landfills. However, C&D landfills are regulated by state and local governments, and the federal government does not collect disposal data for these landfills. Using a survey of states, Kaufman et al. (2004) reported the number of landfills to be over 1,900 in 2002. This number decreased to over 1,500 in 2004 (Simmons et al. 2006). The reasons for this decrease vary from state to state. Similar to the recovery estimate, it is not possible to determine which sectors or materials have the largest influence on the national disposal rate. Some state and local environmental agencies have investigated the composition of the waste disposed in landfills within their state.23 These reports should be consulted when examining regional C&D materials disposal. C&D materials may also be disposed of in MSW landfills. The amount of C&D materials co-mingled with MSW and disposed of in MSW landfills or combusted in incinerators without energy recovery is not known, but could be significant. In some areas, disposal in MSW landfills is the most common management method for C&D materials. A portion of residential
15 Disposal amount calculated as the amount “recycled” subtracted from the amount “collected.” Source: FDEP 2003 16 Includes asphalt & concrete recycled. Source: MDE 2004 17 Includes tons reported as Disposed and Recycled; does not include tons reported as Other Diversion. Source: MDEP 2006 18 Includes tons reported as Recycled of “Other Bulky & Const/Demo,” “Asphalt, Concrete & Masonry,” and “Wood Waste.” Source: NJDEP 2003. Disposal calculated as Type 13C waste + (0.25 x Type 13 waste). Source: Rinaldi, S., NJDEP, Personal Communication, 2009 19 Source: NCDENR 2006 20 Source: UDEQ 2008 21 Recovered represents those materials reported as “Recycled,” “Composted,” and “Other.” Source: VDEQ 2004 22 Source: WDEco 2008 23 Examples of C&D materials composition studies performed by state or local environmental agencies include (but are not limited to) CIWMB 2006, Reinhart et al. 2003, OCDSWM 2009, VDEC 2002, and Iowa DNR 2009.
23

renovation materials is also discarded by homeowners into the household trash and disposed of in MSW landfills or combusted in incinerators. Some C&D materials, typically those considered to be “inert,” are used as fill in old quarries and other pits. Some states do not require permits for this use of C&D materials and, therefore, little is known about the total amount of materials used in this manner.
24
Estimating 2003 Building-Related Construction and Demolition Materials Amounts
4 Conclusions A methodology utilizing national statistical data on the amount of construction, renovation, and demolition activity in the U.S. and average amounts of waste generated at job sites was used to estimate that approximately 170 million tons of building-related C&D materials were generated in the U.S. during 2003. This is a 25% increase in generation from the 1996 estimate of 136 million tons. During the same time period, total construction spending increased 50% (USCB, 2007), however it was estimated that building construction increased only 32%. Construction spending increases can also reflect inflation, profit, and other factors that do not necessarily correlate to increased materials use. Of the amount generated, approximately 48% was estimated to be recovered, based on state-reported disposal and recovery data. This recovery rate may be an overestimate due to the inclusion of materials that are from non-building sources. This recovery estimate is a 23% increase from the 1996 estimate. Comparison of these estimates should be viewed with caution because data limitations created the need for different methodologies in 1996 and 2003. The amount of available information varies from year to year as few entities collect consistent national data regarding C&D materials. Thus, various sources of data must be relied on to make national estimates of C&D generation and recovery. Decreasing available landfill space and interest in green building will all have a positive impact on the rates of recovery of C&D materials; until recently, the rise in commodity prices had a similar impact. EPA will continue to work in partnership with state environmental agencies, AGC, BMRA, CMRA, NAHB, and NDA to actively promote recovery and recycling of C&D materials.
25
References California Integrated Waste Management Board (CIWMB). Targeted Statewide Waste Characterization Study: Detailed Characterization of Construction and Demolition Waste. Publication #341-06-007, Sacramento, California. Clickner, R., D. Marker, S. Viet, J. Rogers, and P. Broene. National Survey of Lead and Allergens in Housing Volume I: Analysis of Lead Hazards. Westat, Inc., Rockville, Maryland. 2001. Construction Materials Recycling Association (CMRA). Environmental Issues Associated with Asphalt Shingle Recycling. Eola, Illinois. 2007. Florida Department of Environmental Protection (FDEP). Recycling—2003 Solid Waste Annual Report Data. Tallahassee, Florida. 2003. Gershman, Brickner & Bratton Inc. Construction and Demolition (C&D) Debris Generation and Disposal in Anne Arundel County, Maryland. Prepared for Anne Arundel County Department of Public Works, Annapolis, Maryland. March 1995. Heenan, W., Steel Recycling Institute. Personal communication. December 2005. Iowa Department of Natural Resources (DNR). Iowa DNR: Iowa Construction and Demolition Debris Recycling. http://www.iowadnr.gov/waste/recycling/cndiowa.html (Last accessed February 3, 2009. Joint Center for Housing Studies of Harvard University. The Changing Structure of the Home Remodeling Industry. 2005. Kaufman, S., N. Goldstein, K. Millrath, and N. Themelis. “The State of Garbage in America”. BioCycle. January 2004. Maryland Department of the Environment (MDE). Solid Waste Managed in Maryland, Calendar Year 2003. Baltimore, Maryland. September 2004. Massachusetts Department of Environmental Protection (MDEP). Solid Waste Master Plan: 2006 Revision. Boston, Massachusetts. June 2006. McKeever, D.B. “Inventories of Woody Residues and Solid Waste Wood in the United States, 2002,” Ninth International Conference on Inorganic-Bonded Composite Materials Conference, Vancouver, British Columbia, Canada, October 10-13, 2004. McKeever, D.B. and R.H. Falk. “Woody Residues and Solid Waste Wood Available for Recovery in the United States, 2002.” Management of Recovered Wood Recycling, Bioenergy and Other Options, Christos Gallis, (editor) - Thessaloniki, April 22-24 2004. National Association of Home Builders Research Center (NAHBRC) survey results for 1995.
26
Estimating 2003 Building-Related Construction and Demolition Materials Amounts
NAHB Research Center, Inc. Deconstruction - Building Disassembly and Material Salvage: The Riverdale Case Study. Prepared for the US Environmental Protection Agency. June 1997. NAHB Research Center. Deconstruction - Building Disassembly and Material Salvage: The Riverdale Case Study. June 1997. NAHB Research Center. Waste Management Update 2: Asphalt Roofing Shingles. October 1996. New Jersey Department of Environmental Protection (NJDEP). 2003 Material Specific Recycling Rates in New Jersey. Trenton, New Jersey. 2003. North Carolina Department of Environment and Natural Resources (NCDENR). North Carolina Solid Waste Management Annual Report July 1, 2005 – June 30, 2006. Raleigh, North Carolina. 2006. Orange County Department of Solid Waste Management (OCDSWM). Construction and Demolition Composition. http://www.co.orange.nc.us/recycling/cdcomposition.asp (Last accessed February 3, 2009). Reinhart, D., T. Townsend, H. Heck, K. Cochran, S. Chakrabarti, and S. Medeiros. Generation and Composition of Construction and Demolition Debris in Florida. Florida Center For Solid and Hazardous Waste Management. February 27, 2003. R.W. Beck and Chartwell Information Publishers. Size of the United States Solid Waste Industry. 2001. Sponsored by Environmental Research and Education Foundation, Alexandria, Virginia. Portland Cement Association. Market Research. http://www.cement.org/market (Last accessed May 11, 2007). Public Health Service, Bureau of Solid Waste Management. Technical and Economic Study of Solid Waste Disposal Needs and Practices. 1969. (Referenced in Handbook of Solid Waste Management). Sandler, K. “Analyzing What’s Recyclable in C&D Debris.” Biocycle. November (2003) 51-54. Schneider, A., University of California, Santa Cruz. “The Fort Ord Deconstruction Pilot Project.” 5th Annual Construction Materials Recycling Seminar. October 1997. Simmons, P., N. Goldstein, S. Kaufman, N. Themelis, and J. Thomspon, Jr. “The State of Garbage in America.” Biocycle. April 2006. Taylor, M. “Moving and Shaking”. Waste Age Online. October 2005. http://www.wasteage.com/mag/waste_moving_shaking/ Taylor, M., National Association of Demolition Contractors. Personal communication December 2005.
27
Townsend, T., et al. The Management and Environmental Impacts of Construction and Demolition Waste in Florida. June 1998. U.S. Census Bureau, “Industry General Summary: 2002 Construction,” 2002 Economic Census, Washington, DC, October 2005a. U.S. Census Bureau. Table Q-6. New Privately Owned Housing Units Completed in the United States, by Intent and Design. 2005b. U.S. Department of Commerce, Census Bureau. C-Series (Construction) Reports. U.S. Census Bureau, Construction Spending, http://www.census.gov/const/www/c30index.html (last accessed October 2008). U.S. Department of Agriculture (USDA) Forest Service. Directory of Wood-Framed Building Deconstruction and Reused Building Materials Companies, 2004. General Technical Report FPL-GTR-150. July 2004. U.S. Department of Housing and Urban Development. American Housing Survey. Components of Inventory Change: 2003-2005, 2007. U.S. Energy Information Administration. Commercial Building Characteristics, 1992. U.S. Environmental Protection Agency. Office of Solid Waste. Characterization of Building-Related Construction and Demolition Debris in the United States. EPA530-R-98-010. U.S. Environmental Protection Agency, Washington, DC. June 1998. U.S. Environmental Protection Agency. Municipal Solid Waste in the United States: 2003 Facts and Figures. U.S. Environmental Protection Agency, Washington, DC. 2005. U.S. Geological Survey. Minerals Yearbook 2003. U.S. Geological Survey, Reston, Virginia. 2003 Utah Department of Environmental Quality (UDEQ). Solid Waste Section Webpage. http://www.hazardouswaste.utah.gov/SWBranch/SWSection/SolidWasteSection.htm#SolidWasteAnnualReportForms. Last accessed September 18, 2008. Vermont Department of Environmental Conservation (VDEC). Vermont Waste Composition Study. Waterbury, Connecticut. 2002. Virginia Department of Environmental Quality (VDEQ). Solid Waste Managed in Virginia During Calendar Year 2003. Richmond, Virginia. 2004. Walker, B. City of Portland Solid Waste and Recycling Division Office of Sustainable Development. Personal communication. December 2005. Washington Department of Ecology (WDEco). Construction and Demolition (C&D) Related Materials Recycled, Diverted and Disposed in Washington: 1992-2005 (tons).
28
Estimating 2003 Building-Related Construction and Demolition Materials Amounts
http://www.ecy.wa.gov/beyondwaste/data_tables/c_and_d_%20final.xls. Last accessed June 27, 2008. Washington State Dept. of General Administration, Division of Engineering and Architectural Services. Sustainable Design and Construction: Demolition Waste Recycling. www.ga.wa.gov/EAS/green/WLCBWarehouse.doc. Wilson, D.G., ed. Massachusetts Institute of Technology. Handbook of Solid Waste Management. Von Nostrand Reinhold Company. 1977. Yost, P., NAHB Research Center. Personal communication. July 1998.
29

This page left intentionally blank.
30
APPENDIX A
BUILDING-RELATED C&D MATERIALS GENERATION AMOUNT CALCULATIONS
A-1
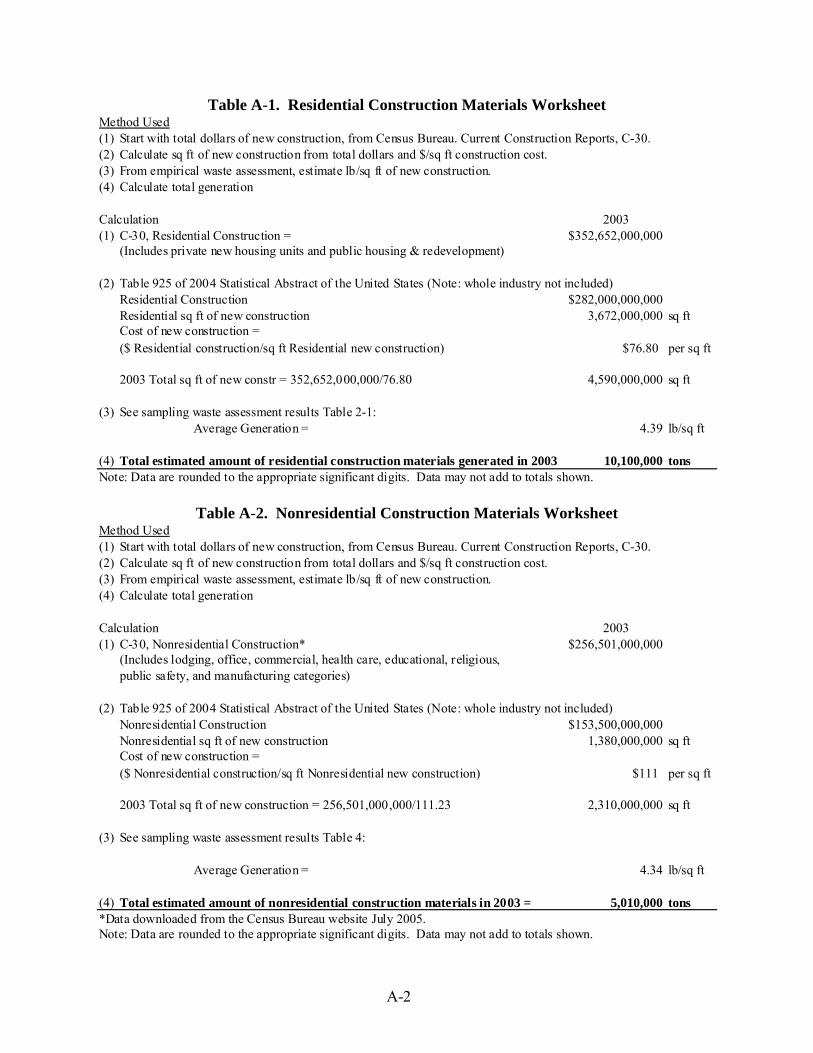
Table A-1. Residential Construction Materials Worksheet Method Used(1) Start with total dollars of new construction, from Census Bureau. Current Construction Reports, C-30.(2) Calculate sq ft of new construction from total dollars and $/sq ft construction cost.(3) From empirical waste assessment, estimate lb/sq ft of new construction.(4) Calculate total generation
Calculation 2003(1) C-30, Residential Construction = $352,652,000,000
(Includes private new housing units and public housing & redevelopment)
(2) Table 925 of 2004 Statistical Abstract of the United States (Note: whole industry not included)Residential Construction $282,000,000,000Residential sq ft of new construction 3,672,000,000 sq ft
$76.80 per sq ft
2003 Total sq ft of new constr = 352,652,000,000/76.80 4,590,000,000 sq ft
(3) See sampling waste assessment results Table 2-1:Average Generation = 4.39 lb/sq ft
(4) Total estimated amount of residential construction materials generated in 2003 10,100,000 tons
Cost of new construction = ($ Residential construction/sq ft Residential new construction)
Note: Data are rounded to the appropriate significant digits. Data may not add to totals shown.
Table A-2. Nonresidential Construction Materials Worksheet Method Used(1) Start with total dollars of new construction, from Census Bureau. Current Construction Reports, C-30.(2) Calculate sq ft of new construction from total dollars and $/sq ft construction cost.(3) From empirical waste assessment, estimate lb/sq ft of new construction.(4) Calculate total generation
Calculation 2003(1) C-30, Nonresidential Construction* $256,501,000,000
(Includes lodging, office, commercial, health care, educational, religious, public safety, and manufacturing categories)
(2) Table 925 of 2004 Statistical Abstract of the United States (Note: whole industry not included)Nonresidential Construction $153,500,000,000Nonresidential sq ft of new construction 1,380,000,000 sq ft
$111 per sq ft
2003 Total sq ft of new construction = 256,501,000,000/111.23 2,310,000,000 sq ft
(3) See sampling waste assessment results Table 4:
Average Generation = 4.34 lb/sq ft
(4) Total estimated amount of nonresidential construction materials in 2003 = 5,010,000 tons*Data downloaded from the Census Bureau website July 2005.Note: Data are rounded to the appropriate significant digits. Data may not add to totals shown.
Cost of new construction = ($ Nonresidential construction/sq ft Nonresidential new construction)
A- 2
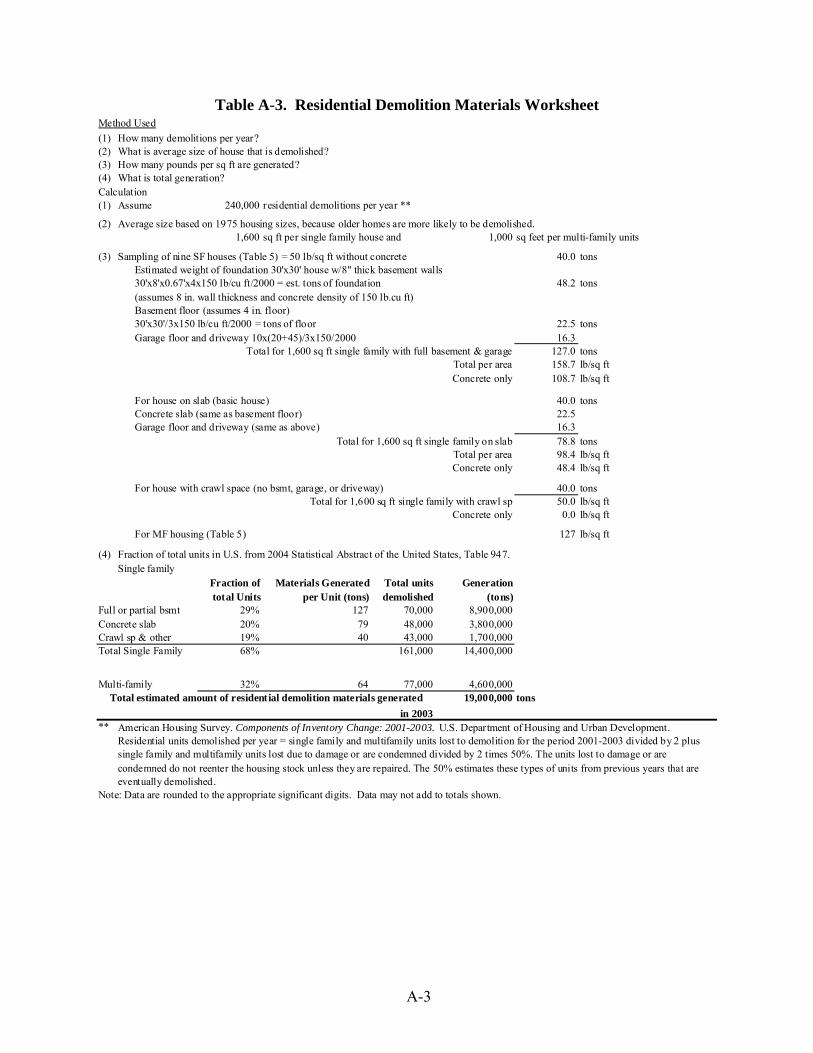
Table A-3. Residential Demolition Materials Worksheet Method Used(1) How many demolitions per year?(2) What is average size of house that is demolished?(3) How many pounds per sq ft are generated?(4) What is total generation?Calculation(1) Assume 240,000 residential demolitions per year **
(2) Average size based on 1975 housing sizes, because older homes are more likely to be demolished.1,600 sq ft per single family house and 1,000 sq feet per multi-family units
(3) Sampling of nine SF houses (Table 5) = 50 lb/sq ft without concrete 40.0 tonsEstimated weight of foundation 30'x30' house w/8" thick basement walls30'x8'x0.67'x4x150 lb/cu ft/2000 = est. tons of foundation 48.2 tons(assumes 8 in. wall thickness and concrete density of 150 lb.cu ft)Basement floor (assumes 4 in. floor)30'x30'/3x150 lb/cu ft/2000 = tons of floor 22.5 tonsGarage floor and driveway 10x(20+45)/3x150/2000 16.3
Total for 1,600 sq ft single family with full basement & garage 127.0 tonsTotal per area 158.7 lb/sq ftConcrete only 108.7 lb/sq ft
For house on slab (basic house) 40.0 tonsConcrete slab (same as basement floor) 22.5Garage floor and driveway (same as above) 16.3
Total for 1,600 sq ft single family on slab 78.8 tonsTotal per area 98.4 lb/sq ftConcrete only 48.4 lb/sq ft
For house with crawl space (no bsmt, garage, or driveway) 40.0 tonsTotal for 1,600 sq ft single family with crawl sp 50.0 lb/sq ft
Concrete only 0.0 lb/sq ft
For MF housing (Table 5) 127 lb/sq ft
(4) Fraction of total units in U.S. from 2004 Statistical Abstract of the United States, Table 947.Single family
Fraction of total Units
Materials Generated per Unit (tons)
Total units demolished
Generation (tons)
Full or partial bsmt 29% 127 70,000 8,900,000Concrete slab 20% 79 48,000 3,800,000Crawl sp & other 19% 40 43,000 1,700,000Total Single Family 68% 161,000 14,400,000
Multi-family 32% 64 77,000 4,600,00019,000,000 tons
in 2003** American Housing Survey. Components of Inventory Change: 2001-2003. U.S. Department of Housing and Urban Development.
Residential units demolished per year = single family and multifamily units lost to demolition for the period 2001-2003 divided by 2 plus single family and multifamily units lost due to damage or are condemned divided by 2 times 50%. The units lost to damage or are condemned do not reenter the housing stock unless they are repaired. The 50% estimates these types of units from previous years that are eventually demolished.
Note: Data are rounded to the appropriate significant digits. Data may not add to totals shown.
Total estimated amount of residential demolition materials generated
A-3
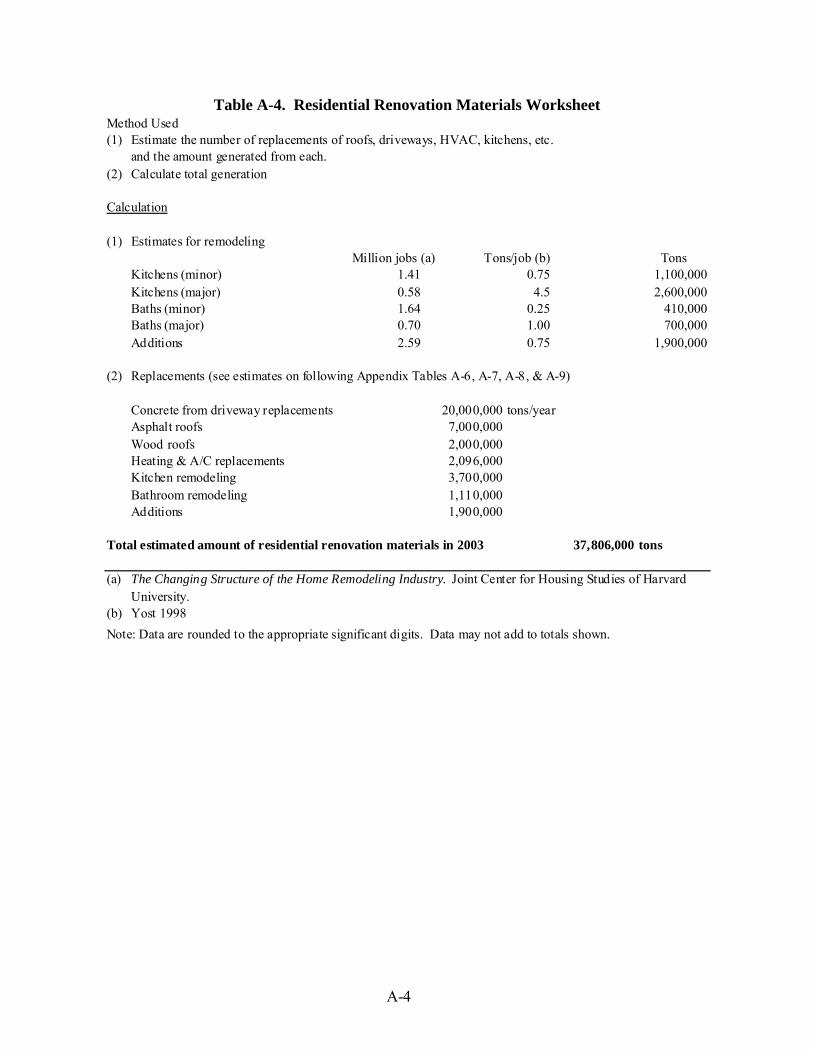
Table A-4. Residential Renovation Materials Worksheet Method Used(1) Estimate the number of replacements of roofs, driveways, HVAC, kitchens, etc.
and the amount generated from each. (2) Calculate total generation
Calculation
(1) Estimates for remodelingMillion jobs (a) Tons/job (b) Tons
Kitchens (minor) 1.41 0.75 1,100,000Kitchens (major) 0.58 4.5 2,600,000Baths (minor) 1.64 0.25 410,000Baths (major) 0.70 1.00 700,000Additions 2.59 0.75 1,900,000
(2) Replacements (see estimates on following Appendix Tables A-6, A-7, A-8, & A-9)
Concrete from driveway replacements 20,000,000 tons/yearAsphalt roofs 7,000,000Wood roofs 2,000,000Heating & A/C replacements 2,096,000Kitchen remodeling 3,700,000Bathroom remodeling 1,110,000Additions 1,900,000
Total estimated amount of residential renovation materials in 2003 37,806,000 tons
(a)
(b)
The Changing Structure of the Home Remodeling Industry. Joint Center for Housing Studies of Harvard University.Yost 1998
Note: Data are rounded to the appropriate significant digits. Data may not add to totals shown.
A- 4
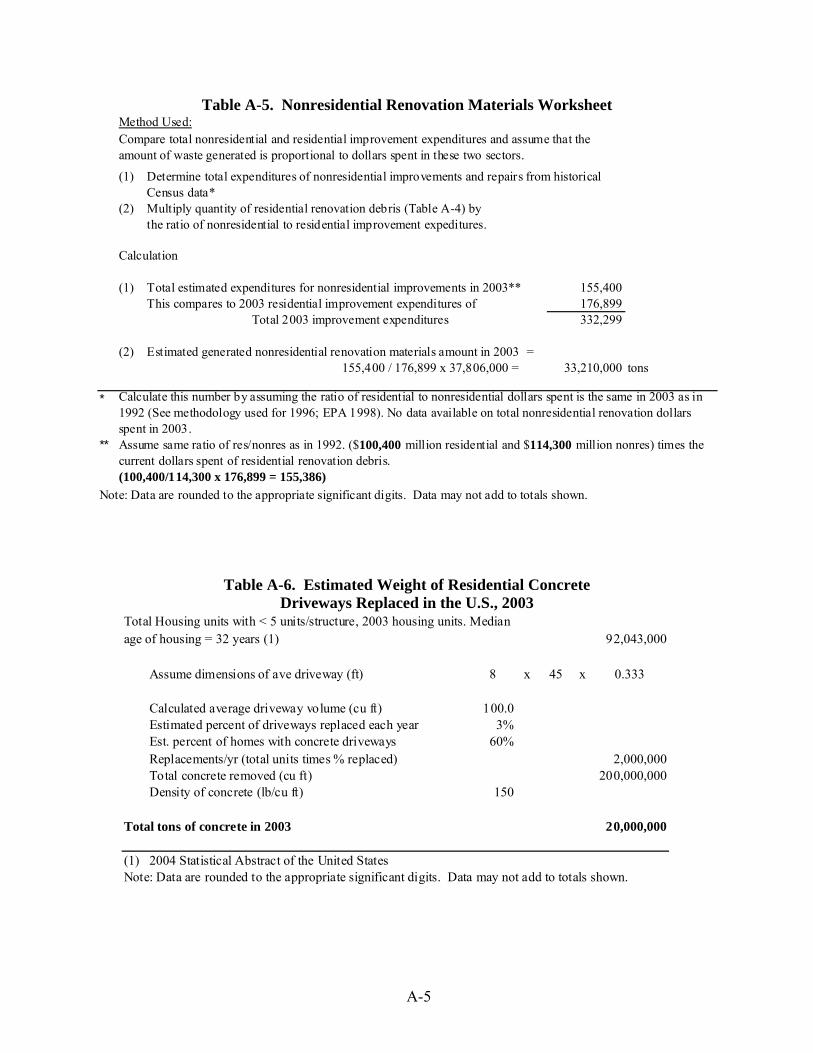
Table A-5. Nonresidential Renovation Materials Worksheet Method Used:
(1)
(2) Multiply quantity of residential renovation debris (Table A-4) by the ratio of nonresidential to residential improvement expeditures.
Calculation
(1) Total estimated expenditures for nonresidential improvements in 2003** 155,400This compares to 2003 residential improvement expenditures of 176,899
Total 2003 improvement expenditures 332,299
(2) Estimated generated nonresidential renovation materials amount in 2003 = 155,400 / 176,899 x 37,806,000 = 33,210,000 tons
*
**
(100,400/114,300 x 176,899 = 155,386)Note: Data are rounded to the appropriate significant digits. Data may not add to totals shown.
Calculate this number by assuming the ratio of residential to nonresidential dollars spent is the same in 2003 as in 1992 (See methodology used for 1996; EPA 1998). No data available on total nonresidential renovation dollars spent in 2003.Assume same ratio of res/nonres as in 1992. ($100,400 million residential and $114,300 million nonres) times the current dollars spent of residential renovation debris.
Determine total expenditures of nonresidential improvements and repairs from historical Census data*
Compare total nonresidential and residential improvement expenditures and assume that the amount of waste generated is proportional to dollars spent in these two sectors.
Table A-6. Estimated Weight of Residential Concrete Driveways Replaced in the U.S., 2003
92,043,000
Assume dimensions of ave driveway (ft) 8 x 45 x 0.333
Calculated average driveway volume (cu ft) 100.0Estimated percent of driveways replaced each year 3%Est. percent of homes with concrete driveways 60%Replacements/yr (total units times % replaced) 2,000,000Total concrete removed (cu ft) 200,000,000Density of concrete (lb/cu ft) 150
Total tons of concrete in 2003 20,000,000
(1) 2004 Statistical Abstract of the United StatesNote: Data are rounded to the appropriate significant digits. Data may not add to totals shown.
Total Housing units with < 5 units/structure, 2003 housing units. Median age of housing = 32 years (1)
A-5
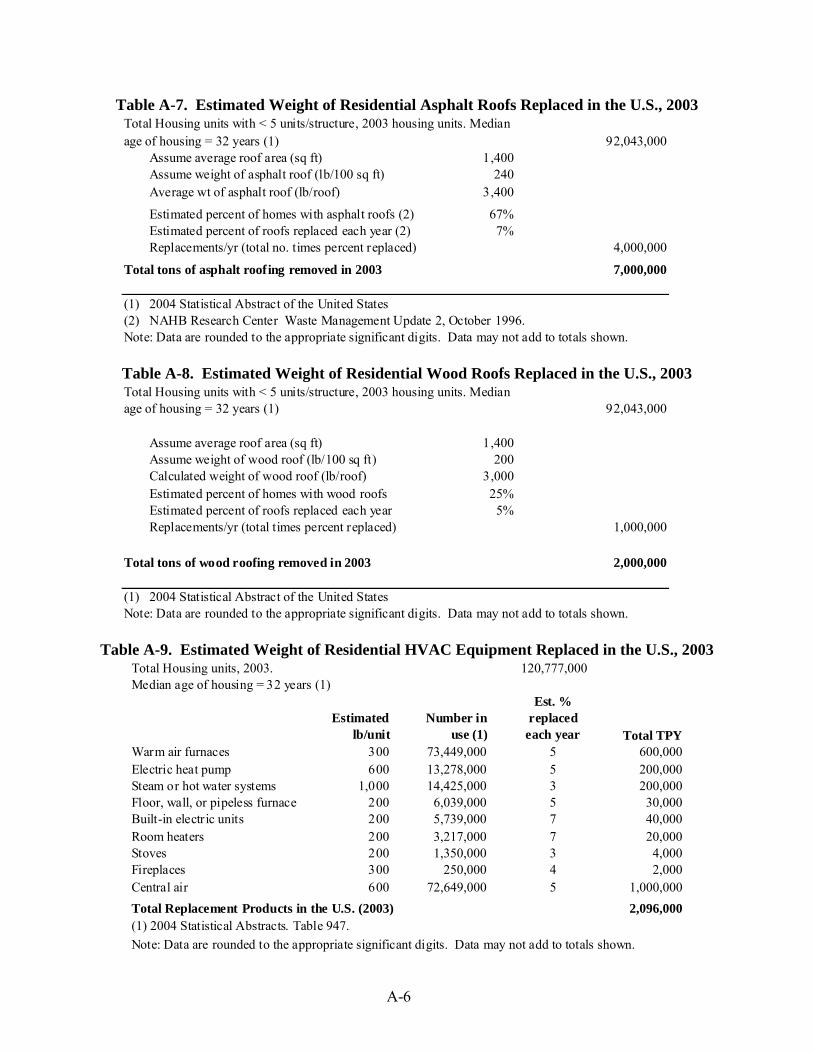
Table A-7. Estimated Weight of Residential Asphalt Roofs Replaced in the U.S., 2003
92,043,000Assume average roof area (sq ft) 1,400Assume weight of asphalt roof (lb/100 sq ft) 240Average wt of asphalt roof (lb/roof) 3,400
Estimated percent of homes with asphalt roofs (2) 67%Estimated percent of roofs replaced each year (2) 7%Replacements/yr (total no. times percent replaced) 4,000,000
Total tons of asphalt roofing removed in 2003 7,000,000
(1) 2004 Statistical Abstract of the United States(2) NAHB Research Center Waste Management Update 2, October 1996.Note: Data are rounded to the appropriate significant digits. Data may not add to totals shown.
Total Housing units with < 5 units/structure, 2003 housing units. Median age of housing = 32 years (1)
Table A-8. Estimated Weight of Residential Wood Roofs Replaced in the U.S., 2003
92,043,000
Assume average roof area (sq ft) 1,400Assume weight of wood roof (lb/100 sq ft) 200Calculated weight of wood roof (lb/roof) 3,000Estimated percent of homes with wood roofs 25%Estimated percent of roofs replaced each year 5%Replacements/yr (total times percent replaced) 1,000,000
Total tons of wood roofing removed in 2003 2,000,000
(1) 2004 Statistical Abstract of the United StatesNote: Data are rounded to the appropriate significant digits. Data may not add to totals shown.
Total Housing units with < 5 units/structure, 2003 housing units. Median age of housing = 32 years (1)
Table A-9. Estimated Weight of Residential HVAC Equipment Replaced in the U.S., 2003 120,777,000
Est. %Estimated Number in replaced
lb/unit use (1) each year Total TPYWarm air furnaces 300 73,449,000 5 600,000Electric heat pump 600 13,278,000 5 200,000Steam or hot water systems 1,000 14,425,000 3 200,000Floor, wall, or pipeless furnace 200 6,039,000 5 30,000Built-in electric units 200 5,739,000 7 40,000Room heaters 200 3,217,000 7 20,000Stoves 200 1,350,000 3 4,000Fireplaces 300 250,000 4 2,000Central air 600 72,649,000 5 1,000,000Total Replacement Products in the U.S. (2003) 2,096,000(1) 2004 Statistical Abstracts. Table 947.Note: Data are rounded to the appropriate significant digits. Data may not add to totals shown.
Total Housing units, 2003.Median age of housing = 32 years (1)
A- 6
APPENDIX B
SOURCES OF C&D MATERIALS RECOVERY DATA
B-1
Sources of C&D Materials Recovery Data Many sources compile information on C&D materials recovery, either for reuse, recycling, beneficial use, or energy. Industry associations are interested in the amount of materials that their members recover. Some federal agencies collect data on C&D materials recovery in studies that they perform. Since C&D materials are regulated at the state and local level, some state agencies track the amount that is disposed and/or the amount that is recycled in their state. Surveys of C&D Materials Processors/Recyclers and Reuse Stores Construction Materials Recycling Association (CMRA). The CMRA represents companies that process materials for recycling, beneficial use, or energy recovery markets. They surveyed their members in 2004 to determine the number of operating facilities and the amount of material that they are processing. Since not all C&D materials recyclers are members of the CMRA, they projected the member survey results onto the non-members. Sources of materials include all C&D generators, including building, road, and other structure sites. The number of recycling facilities for C&D materials has been growing rapidly in the last few years. The CMRA estimated there were at least 2,800 operating C&D recycling facilities in 2004. That estimate included approximately 2,400 concrete and asphalt pavement crushing facilities, 250 mechanized mixed-waste C&D facilities, and 150 wood waste processors. CMRA estimated that approximately 197 million tons of C&D materials were recovered in 2004, including 28 million tons at mixed24 C&D materials processing facilities, 155 million tons at concrete and asphalt crushing facilities, and 14 million tons at wood waste processing facilities. These amounts do not include asphalt pavement recycled in-place or at hot-mix asphalt plants. These amounts, however, include materials from many sources beyond typical building construction, renovation, or demolition sites, such as concrete from transportation and utility projects, wood waste from land clearing, and wood waste in the form of pallets and wood spools. It also does not include any materials that were reused or recycled at the job site, without first processing the material at a recycling facility. It can be assumed that most of the materials that mixed C&D materials processing facilities receive are from buildings. Some of the materials from buildings, however, go to concrete/asphalt pavement facilities and wood waste processing facilities, but the majority does not. Thus, if this amount (28 million tons) is compared to the amount of C&D materials estimated as generated (164 million tons), the recycling rate would be 16%. This is much lower than the estimated 48% calculated using reported state data. This quick calculation demonstrates the uncertainty inherit in the estimates generated for this report. Building Materials Reuse Association (BMRA). The BMRA is a non-profit educational organization whose mission is to facilitate building deconstruction and the reuse/recycling of recovered building materials. Members include owners of C&D materials reuse stores, deconstruction contractors, and manufacturers of reclaimed wood products. In 2006, the BMRA surveyed their members to determine the amount of C&D materials reused in the U.S. and 24 Mixed C&D processing facilities are those that accept heterogeneous loads of C&D materials and do not require C&D materials loads to be segregated by material.
B- 2
received a 17% response rate to the survey. If the results of this survey were projected to their entire membership, it can be estimated that approximately 200,000 tons of C&D materials are reused in the U.S. every year. Surveys of Contractors National Demolition Association (NDA). The NDA is a non-profit trade organization representing more than 1,000 U.S. and Canadian companies which offer standard demolition services, as well as a full range of demolition-related services and products. Its educational efforts help members stay abreast of regulatory and safety matters. The NDA also keeps regulators informed about issues facing their industry. In addition, the NDA is dedicated to increasing public awareness of the industry, as well as providing members with information on the latest technical advances in equipment and services. In 2005, the NDA surveyed their membership to gather data on the quantity of demolition materials recovered for recycling. They learned that demolition contractors recycle concrete, masonry, wood metals, and asphalt pavement.
Associated General Contractors (AGC) of America. The AGC is a national construction trade association representing all facets of commercial construction for both public and private entities. The AGC has approximately 32,000 member companies representing general contractors, specialty contractors, service providers, and suppliers. In 2004, the AGC sent an email survey to their members regarding C&D materials and received 328 responses. Of these responses, 58% reported that they recycle C&D materials, mostly asphalt pavement, concrete, steel, and wood. Data Collected by State Agencies A search of reuse, recycling, or diversion data collected by states was performed. Eight states collected data on C&D materials recycling for 2003. Although this information is labeled as tons “recycled,” these numbers could also include C&D wood used as boiler fuel or other C&D materials that were not, by some definitions, “recycled.” These data show that there is significant recovery of C&D materials for recycling in some locations. However, it is not known if these areas are fully representative of the United States as a whole. Data Collected by Federal Agencies U.S. Department of Agriculture (USDA). Deconstruction is the process of selective dismantling or removal of materials from buildings before or instead of demolition. A common practice in the United States is to remove materials of value from buildings prior to and during demolition for recycling or reuse. Reuse examples include electrical and plumbing fixtures that are reused, steel, copper, and lumber that are reused or recycled, wood flooring that is remilled, and doors and windows that are refinished for use in new construction. The USDA Forest Service has compiled a directory of companies that are involved in the deconstruction and reuse of materials from wood-framed buildings (USDA 2004). According to this directory, there are 420 companies involved in deconstructing buildings or selling reusable materials. The USDA has also collected information on the amount of wood waste that is generated and recovered (McKeever 2004; McKeever and Falk 2004). They have estimated that approximately
B-3
39 million tons of C&D wood waste was generated in 2002. This represents approximately 24% of the total C&D estimate of 164 million tons reported in this study, which is consistent with past estimates that show that wood represents approximately 20-30% of building-related C&D materials (Sandler, 2003). U.S. Geologic Survey (USGS). The USGS has been keeping track of the amount of minerals that the U.S. extracts, imports, and exports since the late 19th century. They publish the Minerals Yearbook annually, which reports the results of minerals and metals producer surveys. When surveying crushed stone, sand, and gravel producers, they have discovered that some of these producers have started recycling concrete to supplement their business. While it is assumed that these producers recycle a small portion of the total amount of concrete recycled in the U.S., these data demonstrate the increasing acceptance of and demand for recycled concrete aggregate. U.S. Department of Energy (USDOE). The USDOE reports the amount of energy that is produced from various sources, including wood waste. It is unknown, however, the proportion of the wood waste used for energy that originated from C&D sources. Other sources of wood waste include paper production plants, saw mill plants, retail stores, and other sources.
B- 4
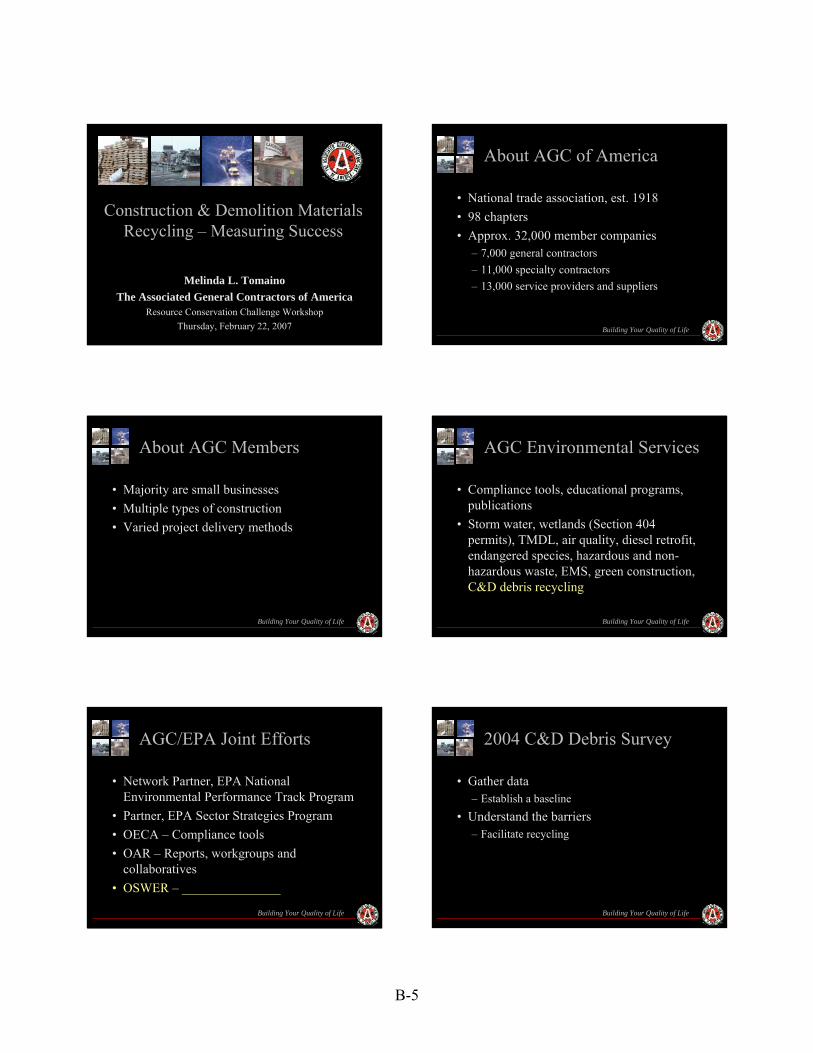
Construction & Demolition Materials Recycling – Measuring Success
Melinda L. TomainoThe Associated General Contractors of America
Resource Conservation Challenge WorkshopThursday, February 22, 2007 Building Your Quality of Life
About AGC of America
• National trade association, est. 1918• 98 chapters• Approx. 32,000 member companies
– 7,000 general contractors– 11,000 specialty contractors– 13,000 service providers and suppliers
Building Your Quality of Life
About AGC Members
• Majority are small businesses• Multiple types of construction• Varied project delivery methods
Building Your Quality of Life
AGC Environmental Services
• Compliance tools, educational programs, publications
• Storm water, wetlands (Section 404 permits), TMDL, air quality, diesel retrofit, endangered species, hazardous and non-hazardous waste, EMS, green construction, C&D debris recycling
Building Your Quality of Life
AGC/EPA Joint Efforts
• Network Partner, EPA National Environmental Performance Track Program
• Partner, EPA Sector Strategies Program• OECA – Compliance tools• OAR – Reports, workgroups and
collaboratives• OSWER – _______________
Building Your Quality of Life
2004 C&D Debris Survey
• Gather data– Establish a baseline
• Understand the barriers– Facilitate recycling
B-5
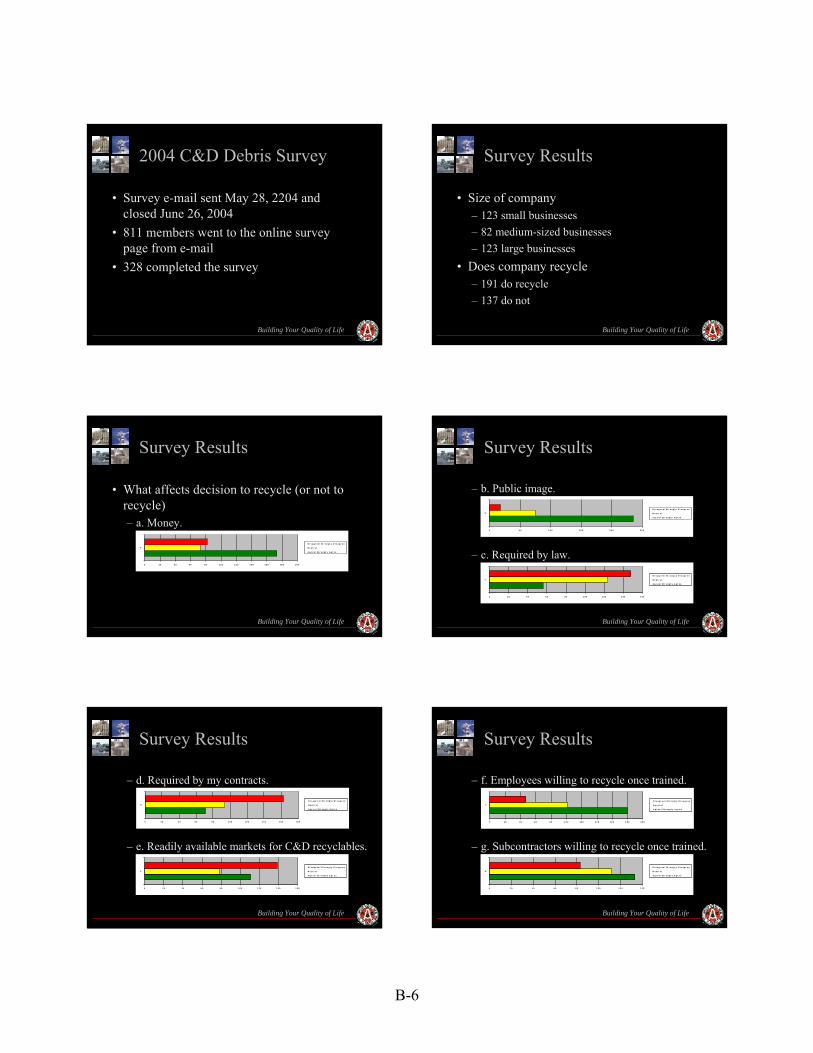
Building Your Quality of Life
2004 C&D Debris Survey
• Survey e-mail sent May 28, 2204 and closed June 26, 2004
• 811 members went to the online survey page from e-mail
• 328 completed the survey
Building Your Quality of Life
Survey Results
• Size of company– 123 small businesses– 82 medium-sized businesses– 123 large businesses
• Does company recycle– 191 do recycle– 137 do not
Building Your Quality of Life
Survey Results
• What affects decision to recycle (or not to recycle)– a. Money.
0 2 0 4 0 6 0 8 0 1 0 0 1 2 0 1 4 0 1 6 0 1 8 0 2 0 0
a .
D i s a g r e e / St r o n g l y D i s a g r e e
N e u t r a l
A g r e e / St r o n g l y A g r e e
Building Your Quality of Life
Survey Results
– b. Public image.
– c. Required by law.
0 5 0 1 0 0 1 5 0 2 0 0 2 5 0
b .
D i s a g r e e / St r o n g l y D i s a g r e e
N e u t r a l
A g r e e / St r o n g l y A g r e e
0 2 0 4 0 6 0 8 0 1 0 0 1 2 0 1 4 0 1 6 0
c .
D i s a g r e e / St r o n g l y D i s a g r e e
N e u t r a l
A g r e e / S t r o n g l y A g r e e
Building Your Quality of Life
Survey Results
– d. Required by my contracts.
– e. Readily available markets for C&D recyclables.
0 2 0 4 0 6 0 8 0 1 0 0 1 2 0 1 4 0 1 6 0 1 8 0
d .
D i s a gr e e / St r o n g l y D i s a g r e e
N e u t r a l
A g r e e / St r o n g l y A g r e e
0 2 0 4 0 6 0 8 0 1 0 0 1 2 0 1 4 0 1 6 0
e .
D i s a g r e e / St r o n g l y D i s a g r e e
N e u t r a l
A g r e e / S t r o n g l y A g r e e
Building Your Quality of Life
Survey Results
– f. Employees willing to recycle once trained.
– g. Subcontractors willing to recycle once trained.
0 2 0 4 0 6 0 8 0 1 0 0 1 2 0 1 4 0 1 6 0 1 8 0 2 0 0
f .
D i s a g r e e / St r o n g l y D i s a g r e e
N e u t r a l
A g r e e / S t r o n g l y A g r e e
0 2 0 4 0 6 0 8 0 1 0 0 1 2 0 1 4 0
g .
D i s a g r e e / St r o n g l y D i s a g r e e
N e u t r a l
A g r e e / S t r o n g l y A g r e e
B-6
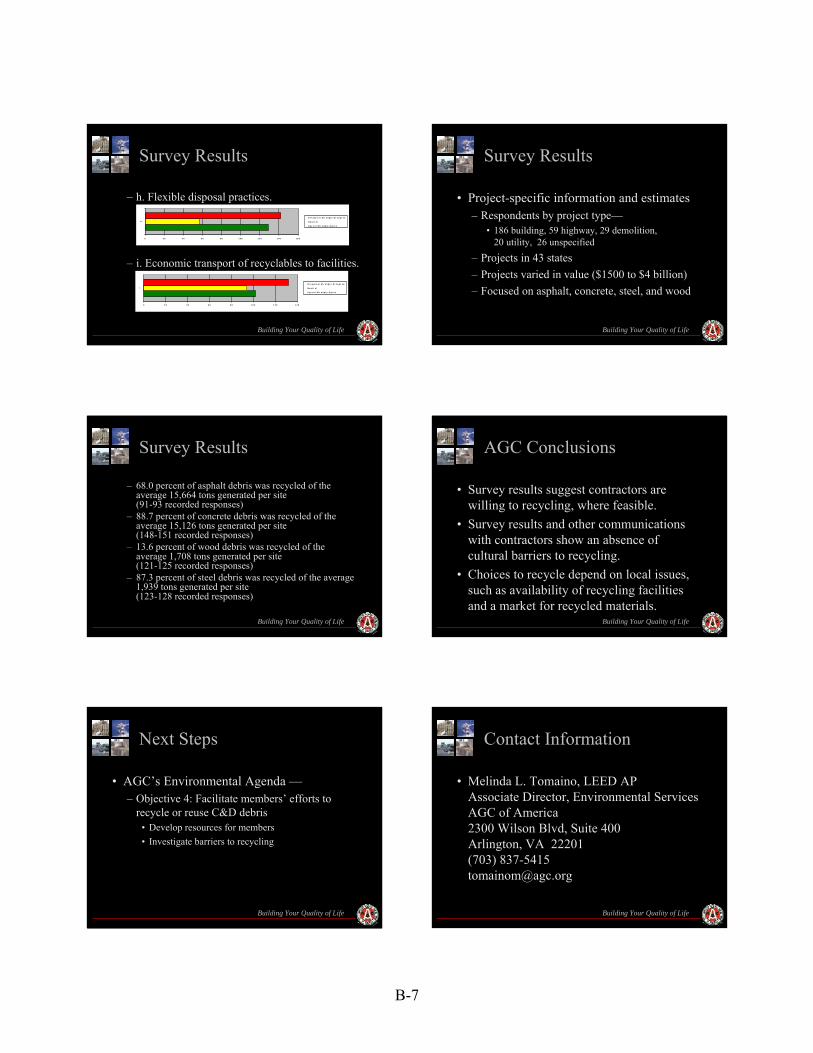
Building Your Quality of Life
Survey Results
– h. Flexible disposal practices.
– i. Economic transport of recyclables to facilities.
0 2 0 4 0 6 0 8 0 1 0 0 1 2 0 1 4 0 1 6 0
h .
D i s a gr e e / St r o n g l y D i s a g r e e
N e u t r a l
A g r e e / St r o n g l y A g r e e
0 2 0 4 0 6 0 8 0 1 0 0 1 2 0 1 4 0
i .
D i s a g r e e / St r o n g l y D i s a g r e e
N e u t r a l
A g r e e / S t r o n g l y A g r e e
Building Your Quality of Life
Survey Results
• Project-specific information and estimates– Respondents by project type—
• 186 building, 59 highway, 29 demolition, 20 utility, 26 unspecified
– Projects in 43 states– Projects varied in value ($1500 to $4 billion)– Focused on asphalt, concrete, steel, and wood
Building Your Quality of Life
Survey Results
– 68.0 percent of asphalt debris was recycled of the average 15,664 tons generated per site (91-93 recorded responses)
– 88.7 percent of concrete debris was recycled of the average 15,126 tons generated per site (148-151 recorded responses)
– 13.6 percent of wood debris was recycled of the average 1,708 tons generated per site (121-125 recorded responses)
– 87.3 percent of steel debris was recycled of the average 1,939 tons generated per site (123-128 recorded responses)
Building Your Quality of Life
AGC Conclusions
• Survey results suggest contractors are willing to recycling, where feasible.
• Survey results and other communications with contractors show an absence of cultural barriers to recycling.
• Choices to recycle depend on local issues, such as availability of recycling facilities and a market for recycled materials.
Building Your Quality of Life
Next Steps
• AGC’s Environmental Agenda —– Objective 4: Facilitate members’ efforts to
recycle or reuse C&D debris• Develop resources for members• Investigate barriers to recycling
Building Your Quality of Life
Contact Information
• Melinda L. Tomaino, LEED APAssociate Director, Environmental ServicesAGC of America2300 Wilson Blvd, Suite 400Arlington, VA 22201(703) [email protected]
B-7
Trends in Building Deconstruction and Materials Reuse Brad Guy 11/06/06 Introduction This article is intended to provide an update on some of the trends in the deconstruction and reuse industry. One major aspect of the building materials reuse industry in North America is the HfH ReStore network. ReStores are retail outlets for donated and reclaimed building materials facilities operated by HfH affiliates as a fundraising mechanism for their home-building programs. The Habitat for Humanity (HfH) ReStore network is growing by leaps and bounds. As an example, in Canada, in 2000 there were 16 ReStores with gross sales of $3.1 million. In 2005, there were 41 Canadian ReStores with gross sales of $14.5 million. This is a growth of 156% in the number of stores, and a growth of 368% in revenues in just 5 years (HfH Partnernet, 2006). The numbers for the US are similar. According to a study by Penn State University, the average ReStore age is 5 years, with the oldest is 18 years old. More than half of the ReStores have operated for less than 5 years (57.6%), while 28.8% have operated for more than 5 but less than 10 years, and 13.6% have operated for more than 10 years (Judd and Echols, 2005). Survey In a recent survey of deconstruction and reuse organizations, an attempt was made to ascertain the materials flows and economics of deconstruction and reuse in the US. An email survey was sent to 450 organizations identified in three categories, deconstruction services, reused materials retail sales and value-added products manufacturing with reclaimed wood. A total of 76 responses was received or about a 17 % response rate. Of these 76 respondents, 41 were reuse stores only, and 28 combined both deconstruction services with retail reuse sales. Of the firms that were reuse stores only, 59% reported conducting some form of active salvage operations, with the remaining 41% relying solely on donations. The remaining 7 respondents focused on wood reuse only, through remanufacturing. Employment Firms combining deconstruction with a reuse store employ on average more full-time employees (FTE) per organization than those with a reuse store only, 5.8 to 4.6 FTE per firm, respectively. It should be noted that many non-profit reuse stores especially the HfH ReStores may also have labor provided by volunteers that is not accounted for by a measure of FTE, while comprising a significant component of the total labor utilized by the organization. The large majority of organizations employed a small number of persons, with 12% of combined deconstruction and reuse firms reporting 16 or more employees. Firms that conduct reclaimed wood value-adding products manufacturing reported an average of 15 employees per firm. Clearly, the value-added aspect of the both front-end deconstruction and back-end remanufacturing provides much greater potential for employment than direct retail resale by itself.
B-8
Table 1. Firms with Deconstruction and Reused Materials Sales 1-5 employees - 69% of firms 6-10 employees - 14% of firms 11-15 employees - 5% of firms 16-20 employees - 10% of firms More than 20 employees - 2% of firms Revenues Firms combining deconstruction and a reuse store reported greater average annual revenues per organization than organizations with a reuse store only, $430,796 to $383,849 per firm, respectively. The difference is about 12% average higher annual revenues per firm. Anecdotally, while there is some investment required for deconstruction and salvage services, a much greater investment is required for the facilities and equipment of a reuse store, such as the warehouse space, racking for materials, fork-lift, a truck for pick-ups, etc. Adding deconstruction to a reuse facility operation can add net revenue potential evidenced by higher average revenues for the combined firms. The investment is minimal in terms of equipment compared to demolition, but similar to demolition in terms of potential increased insurance requirements. Adding a reuse facility to an existing demolition or deconstruction firm is a greater investment than the deconstruction operational requirements alone. There is more capital investment in land, building(s), and equipment. Not surprisingly, the firms engaged in reclaimed lumber value-adding reported average annual revenues of $2,089,286 per firm. With an average 3 times more employees, these firms also have 3-4 times greater annual revenues than the organizations engaged in the recovery of the materials and direct reused materials sales. Anecdotally there is trend towards reuse firms adding a value-added component to their operations. Also anecdotally there are considerable difficulties to the endeavor especially when the value-added product sales are located at the reuse facility. In many cases the markets are very different for a value-added higher cost remanufactured product and the reused building materials store’s established clientele which are used to purchasing low-cost products. Materials Flow The average amount of materials reported handled annually by firms engaged in both deconstruction and retail reuse sales was 1,011,286 LBS per firm compared to 583,376 LBS per firms only engaged in reuse retail sales. The firms engaged in wood value-adding reported about 1,132,500 LBS of wood materials handled on average per firm per year. Most reuse retail sales firms that responded did not know the amount of materials they handled per year in mass. About 69% of the firms conducting only reuse sales reported not knowing the materials they handled other than by revenues. About 61% of the firms conducting both deconstruction and reuse sales reported not knowing the total amount of materials they handled by mass. Firms that remanufacture wood products all reported a board feet metric of the wood materials they processed. There seems to be a small correlation between the amount of materials handled and number of employees, and the attention paid to tracking the materials handled.
B-9
While many non-profit reuse firms may rely more on volunteer labor and function with lower revenues, making it difficult to justify and implement quantity-based inventory systems, they might also be motivated to track materials flow in regards to environmental metrics for the purposes of donor reporting and demonstrating goals such as waste diversion. Revenues per Employee and Mass of Materials The average revenues per employee reported by firms engaged in combined deconstruction and reuse retail sales was $73,900 compared to $96,516 per firm for organizations engaged in reuse retail sales only. It is not clear if this relates to wage differences between deconstruction employees and retail store employees in general or other factors. An anecdotal factor, as mentioned above, is that there is less capital overhead involved in just a reuse retail operation by itself compared to a combined deconstruction and reuse retail sales operation. Keeping this capital investment lower for reuse firms would certainly increase revenues per employee, but it can be noted that the combined deconstruction and reuse retails sales firms employ on average more persons per firm, move more materials by mass per firm (of which more will be commodity materials such as lumber and brick which are lower value per pound than many other building components such as doors, windows, cabinets and fixtures that are the predominant products in building materials reuse retail stores). Perhaps a trend towards larger facilities and more combined deconstruction and reuse firms will follow in the next few years. At this time we do not have sufficient information over time to make this claim. The revenue per mass of material handled was also calculated from the firms that reported quantities handled per year. For firms engaged in both deconstruction and reuse retail sales the average revenue per mass of materials was $1.39 / LB of materials handled. For firms engaged in reuse retail sales only it was $0.91 / LB and for firms engaged in reclaimed wood value-adding it was $3.10 / LB of wood materials. Clearly there is a correlation between the amount of materials handled and the revenues generated on average and a 3-times greater economic return per LB by the firms engaged in reclaimed wood value-adding. The last significant factor gleaned from this survey is the growth in sales by the three types of firms that were categorized. As noted in Table 2, annual sales revenue growth by firms with combined deconstruction and reuse sales on average was 56%. As noted in Tables 4, annual sales revenue growth by firms with reuse retail sales only on average was 32%. As noted in Tables 5, annual sales revenue growth by firms with reclaimed wood remanufacturing on average was 28%. Table 2. Combined Deconstruction and Reuse Sales Firms FTE Revenues annual Revenues/FTE #s annually Revenues/LB % growth Average 5.8 $430,796 $73,900 1,011,286 $1.39 56 Table 3. Deconstruction Component of Deconstruction and Reuse Sales Organizations Annual projects Contract / project Average 28 $12,655
B-10
Table 4. Retail Sales Reuse-Only Firms FTE Revenues annual Revenues/FTE #s annually Revenues/LB % growth Average 4.6 $383,849 $96,516 583,376 $0.91 32 Table 5. Reclaimed Wood Remanufacturing Firms FTE Revenues annual Revenues/FTE #s annually Revenues/LB % growth Average 15 $2,089,286 $132,604 1,132,500 $3.10 28 Reclaimed Materials Being Recovered and Sold The last aspect of this review of the deconstruction and reuse industry was a focus group review of the most “popular” reclaimed materials. The focus group participants all engaged in recovery and reuse operations. An extensive list of 39 the most common reused materials categories was provided to each participant. They were asked to rank each product based on three criteria. The criteria were: highest resale value; ease of removal from an existing building; and ease of inventory. These rankings were combined, scored and averaged to produce an overall score for the materials deemed most easily recoverable, inventoried and sold. According to this focus group of six successful deconstruction and reuse store operations, the reclaimed products with highest value for resale were grouped into four tiers. The top tier of reclaimed products based on value includes:
Architectural elements Windows - decorative Cabinets - complete sets Lumber - wood finish flooring
The second tier of products based on value includes:
Doors – interior and exterior Hardware – including door and plumbing fixtures Windows – double-glazed
The third tier of products based on value includes:
Light fixtures Appliances – no more than 5 years old Lumber – 1 x sheathing materials
The fourth tier of products based on value includes:
Brick and stone Lumber – floor joists and sub-flooring Electrical – hardware and fixtures
From the perspective of the ease of removal only, the products deemed easiest to remove by this group of experts include: Easiest to remove for salvage:
Doors – exterior and interior with associated hardware Fixtures – ceiling fans, lights, faucets, sinks, mirrors
B-11
The second tier of easy-to-remove components includes:
Cabinets – tops and complete sets Electrical – hardware and fixtures Exterior – pavers Windows – decorative
The third tier of easiest-to-remove components includes:
Architectural elements Windows – double-glazed
Most Desirable Overall (value, removal, inventory) Best to Less Desirable
1. Doors 2. Mantels 3. Architectural elements 4. Faucet - complete set 5. Cabinets - with doors and drawers 6. Windows - double-glazed
Least Desirable Overall (value, removal, inventory) Worst to More Desirable
1. Brick - three-hole 2. Lumber - porch roof framing 3. Lumber - exterior wall framing 4. Slate roofing 5. Lumber - non-load-bearing wall framing 6. Stone - building
Caveats: Given that a non-profit reuse sales facility is much more amenable to volunteer labor than deconstruction activities, the reuse sales only organizations potentially make greater use of volunteer labor which is not accounted for in the FTE accounting. Adding in the volunteer labor used by non-profit organizations would produce a lower revenues / employee + volunteer number for both types but potentially more so for the organizations that conduct reuse sales only, widening this disparity. Of important note is that the pre-ponderance of the deconstruction / salvage and reuse retail sales organizations that reported were non-profits versus for-profits, 87% to 13%, respectively. It should be noted that as non-profit organizations their IRS reporting is legally required to be made available to the public, whereas this is not so for for-profit organizations. All of the wood remanufacturing firms that reported were for-profits. The proportion of non-profit to for-profit firms reporting is much greater than past surveys suggest is the proportion of non-profit to for-profit in the industry as whole, so this would clearly distort this information towards the non-profit firm model.
B-12
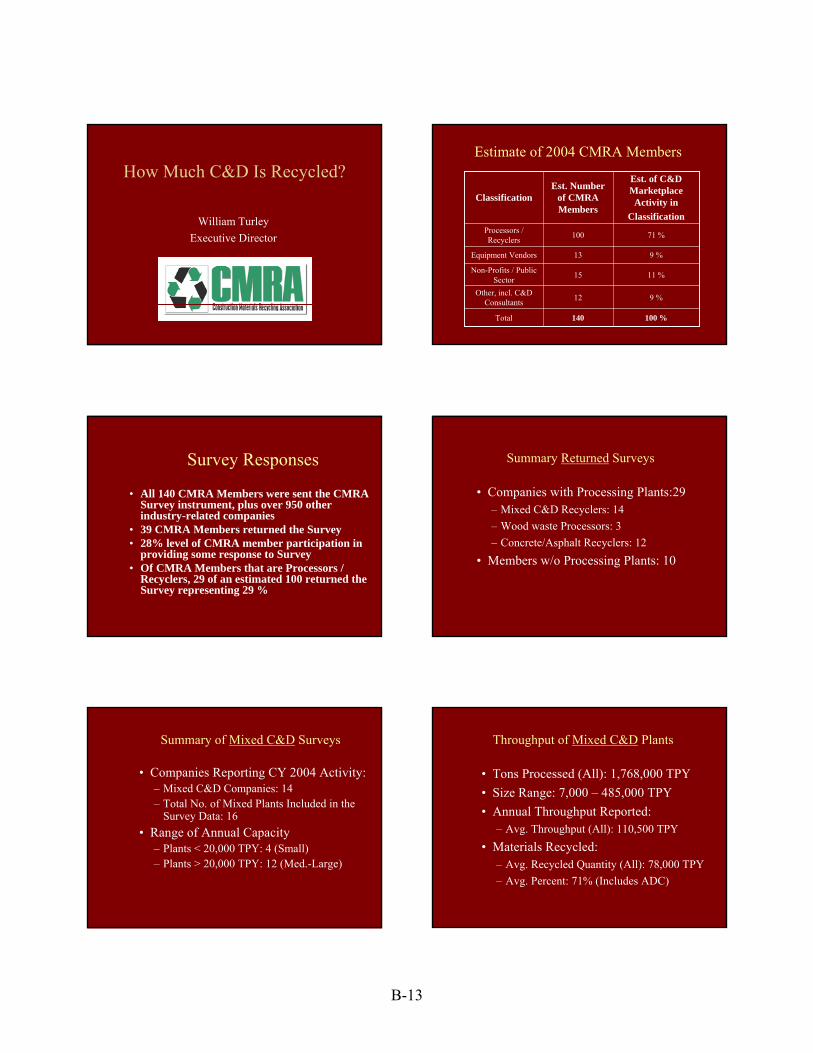
How Much C&D Is Recycled?
William TurleyExecutive Director
100 %140Total
9 %12Other, incl. C&D Consultants
11 %15Non-Profits / Public Sector
9 %13Equipment Vendors
71 %100Processors / Recyclers
Est. of C&D Marketplace Activity in
Classification
Est. Number of CMRA Members
Classification
Estimate of 2004 CMRA Members
Survey Responses
• All 140 CMRA Members were sent the CMRA Survey instrument, plus over 950 other industry-related companies
• 39 CMRA Members returned the Survey• 28% level of CMRA member participation in
providing some response to Survey• Of CMRA Members that are Processors /
Recyclers, 29 of an estimated 100 returned the Survey representing 29 %
Summary Returned Surveys
• Companies with Processing Plants:29– Mixed C&D Recyclers: 14– Wood waste Processors: 3– Concrete/Asphalt Recyclers: 12
• Members w/o Processing Plants: 10
Summary of Mixed C&D Surveys
• Companies Reporting CY 2004 Activity:– Mixed C&D Companies: 14– Total No. of Mixed Plants Included in the
Survey Data: 16• Range of Annual Capacity
– Plants < 20,000 TPY: 4 (Small)– Plants > 20,000 TPY: 12 (Med.-Large)
Throughput of Mixed C&D Plants
• Tons Processed (All): 1,768,000 TPY• Size Range: 7,000 – 485,000 TPY • Annual Throughput Reported:
– Avg. Throughput (All): 110,500 TPY• Materials Recycled:
– Avg. Recycled Quantity (All): 78,000 TPY– Avg. Percent: 71% (Includes ADC)
B-13
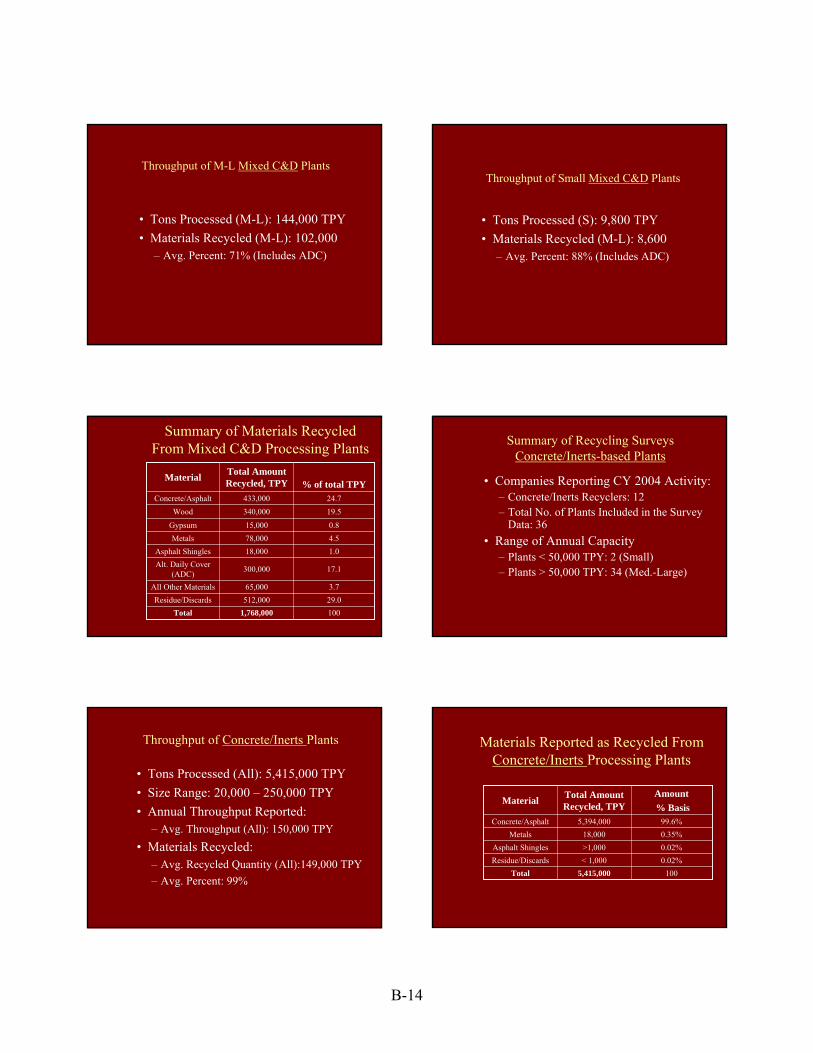
Throughput of M-L Mixed C&D Plants
• Tons Processed (M-L): 144,000 TPY• Materials Recycled (M-L): 102,000
– Avg. Percent: 71% (Includes ADC)
Throughput of Small Mixed C&D Plants
• Tons Processed (S): 9,800 TPY• Materials Recycled (M-L): 8,600
– Avg. Percent: 88% (Includes ADC)
Summary of Materials RecycledFrom Mixed C&D Processing Plants
29.0512,000Residue/Discards3.765,000All Other Materials
17.1300,000Alt. Daily Cover (ADC)
1.018,000Asphalt Shingles4.578,000Metals0.815,000Gypsum
1001,768,000Total
19.5340,000Wood24.7433,000Concrete/Asphalt
% of total TPYTotal Amount Recycled, TPYMaterial
Summary of Recycling Surveys Concrete/Inerts-based Plants
• Companies Reporting CY 2004 Activity:– Concrete/Inerts Recyclers: 12– Total No. of Plants Included in the Survey
Data: 36• Range of Annual Capacity
– Plants < 50,000 TPY: 2 (Small)– Plants > 50,000 TPY: 34 (Med.-Large)
Throughput of Concrete/Inerts Plants
• Tons Processed (All): 5,415,000 TPY• Size Range: 20,000 – 250,000 TPY • Annual Throughput Reported:
– Avg. Throughput (All): 150,000 TPY• Materials Recycled:
– Avg. Recycled Quantity (All):149,000 TPY– Avg. Percent: 99%
Materials Reported as Recycled From Concrete/Inerts Processing Plants
0.02%< 1,000Residue/Discards0.02%>1,000Asphalt Shingles0.35%18,000Metals
1005,415,000Total
99.6%5,394,000Concrete/Asphalt
Amount% Basis
Total Amount Recycled, TPYMaterial
B-14
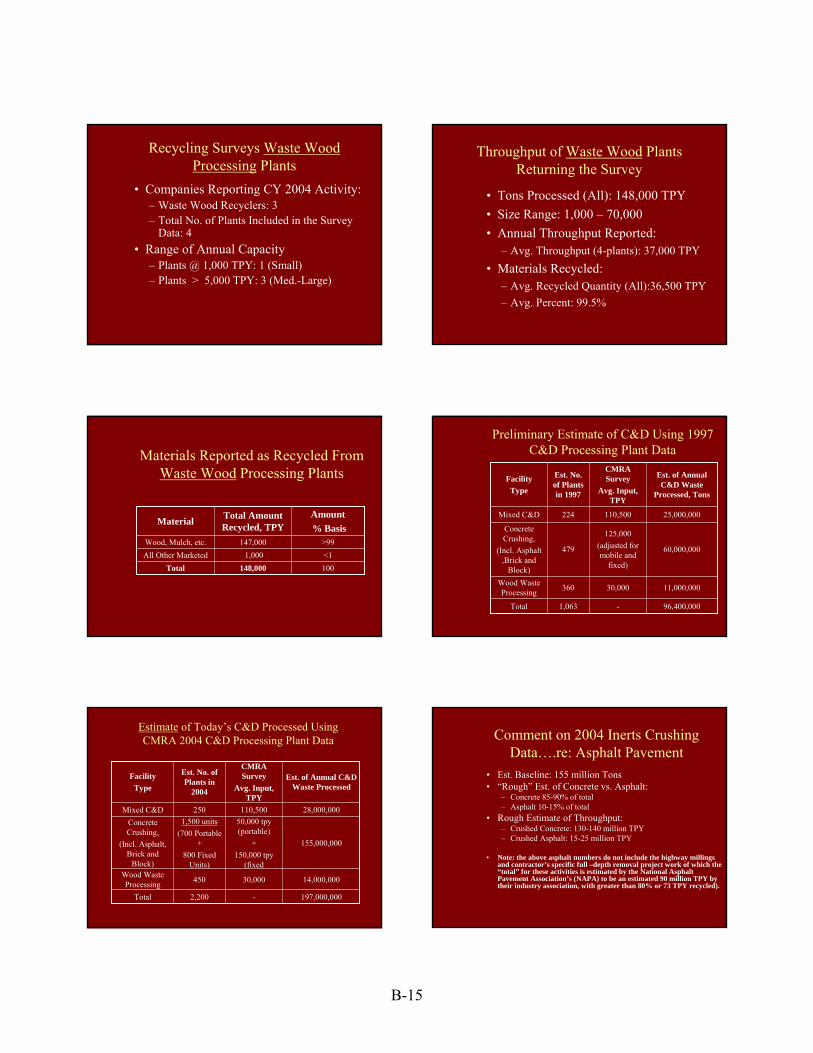
Recycling Surveys Waste Wood Processing Plants
• Companies Reporting CY 2004 Activity:– Waste Wood Recyclers: 3– Total No. of Plants Included in the Survey
Data: 4• Range of Annual Capacity
– Plants @ 1,000 TPY: 1 (Small)– Plants > 5,000 TPY: 3 (Med.-Large)
Throughput of Waste Wood Plants Returning the Survey
• Tons Processed (All): 148,000 TPY• Size Range: 1,000 – 70,000• Annual Throughput Reported:
– Avg. Throughput (4-plants): 37,000 TPY• Materials Recycled:
– Avg. Recycled Quantity (All):36,500 TPY– Avg. Percent: 99.5%
Materials Reported as Recycled From Waste Wood Processing Plants
<11,000All Other Marketed100148,000Total
>99147,000Wood, Mulch, etc.
Amount% Basis
Total Amount Recycled, TPYMaterial
-
30,000
125,000(adjusted for mobile and
fixed)
110,500
CMRA Survey
Avg. Input, TPY
96,400,0001,063Total
11,000,000360Wood Waste Processing
60,000,000479
Concrete Crushing,
(Incl. Asphalt ,Brick and
Block)
25,000,000224Mixed C&D
Est. of Annual C&D Waste
Processed, Tons
Est. No. of Plants in 1997
FacilityType
Preliminary Estimate of C&D Using 1997 C&D Processing Plant Data
-
30,000
50,000 tpy (portable)
+ 150,000 tpy
(fixed
110,500
CMRA Survey
Avg. Input, TPY
197,000,0002,200Total
14,000,000450Wood Waste Processing
155,000,000
1,500 units(700 Portable
+800 Fixed
Units)
Concrete Crushing,
(Incl. Asphalt, Brick and
Block)
28,000,000250Mixed C&D
Est. of Annual C&D Waste Processed
Est. No. of Plants in
2004
FacilityType
Estimate of Today’s C&D Processed Using CMRA 2004 C&D Processing Plant Data Comment on 2004 Inerts Crushing
Data….re: Asphalt Pavement• Est. Baseline: 155 million Tons• “Rough” Est. of Concrete vs. Asphalt:
– Concrete 85-90% of total– Asphalt 10-15% of total
• Rough Estimate of Throughput:– Crushed Concrete: 130-140 million TPY– Crushed Asphalt: 15-25 million TPY
• Note: the above asphalt numbers do not include the highway millings and contractor’s specific full –depth removal project work of which the “total” for these activities is estimated by the National Asphalt Pavement Association’s (NAPA) to be an estimated 90 million TPY by their industry association, with greater than 80% or 73 TPY recycled).
B-15

But Is There Even More?
• 2500 Crushers x 70%= 1750• 100 tons per hour• 1600 hours per year• Grand Total: 280,000,000 tons per year• And that is only recycled, not generated
Thank You
William Turley630/585-7530
B-16
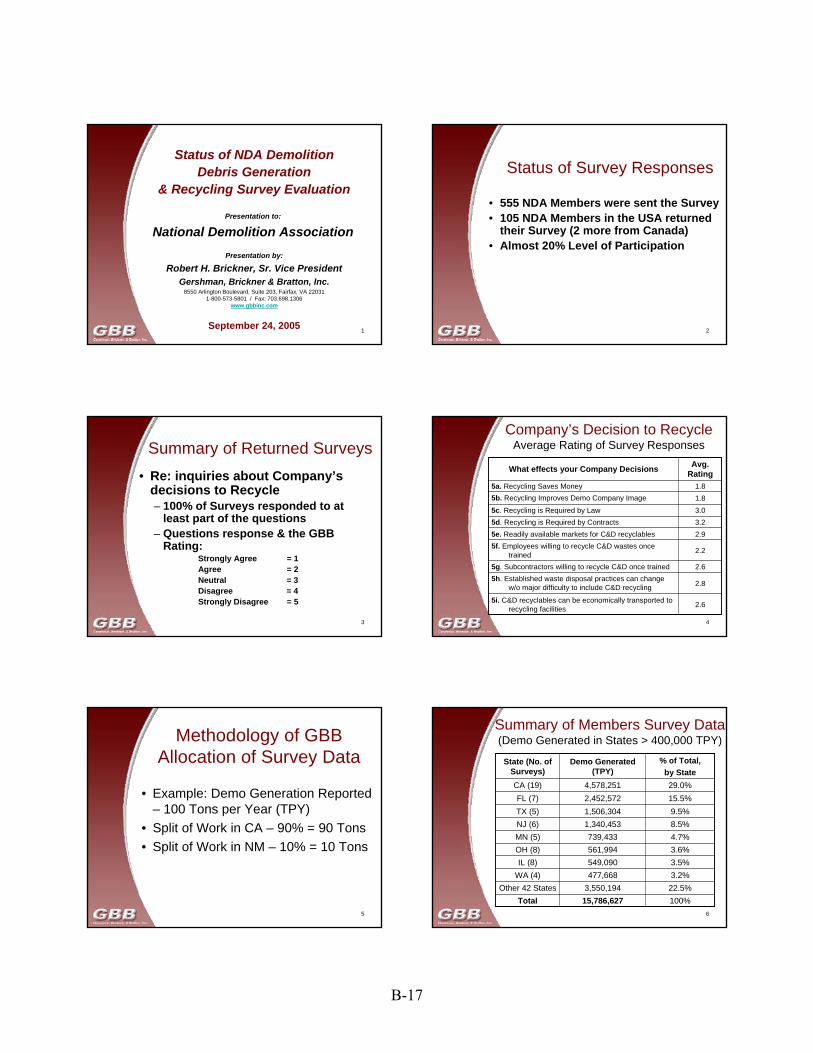
1
Status of NDA Demolition Debris Generation
& Recycling Survey Evaluation
Presentation by:
Robert H. Brickner, Sr. Vice PresidentGershman, Brickner & Bratton, Inc.
8550 Arlington Boulevard, Suite 203, Fairfax, VA 220311-800-573-5801 / Fax: 703.698.1306
www.gbbinc.com
September 24, 2005
Presentation to:
National Demolition Association
2
Status of Survey Responses
• 555 NDA Members were sent the Survey• 105 NDA Members in the USA returned
their Survey (2 more from Canada)• Almost 20% Level of Participation
3
Summary of Returned Surveys• Re: inquiries about Company’s
decisions to Recycle– 100% of Surveys responded to at
least part of the questions– Questions response & the GBB
Rating: Strongly Agree = 1Agree = 2Neutral = 3Disagree = 4Strongly Disagree = 5
4
2.65i. C&D recyclables can be economically transported to recycling facilities
3.05c. Recycling is Required by Law
2.85h. Established waste disposal practices can change w/o major difficulty to include C&D recycling
2.65g. Subcontractors willing to recycle C&D once trained
2.25f. Employees willing to recycle C&D wastes once trained
2.95e. Readily available markets for C&D recyclables 3.25d. Recycling is Required by Contracts
1.85b. Recycling Improves Demo Company Image1.85a. Recycling Saves Money
Avg. RatingWhat effects your Company Decisions
Company’s Decision to RecycleAverage Rating of Survey Responses
5
Methodology of GBB Allocation of Survey Data
• Example: Demo Generation Reported – 100 Tons per Year (TPY)
• Split of Work in CA – 90% = 90 Tons• Split of Work in NM – 10% = 10 Tons
6
Summary of Members Survey Data(Demo Generated in States > 400,000 TPY)
22.5%3,550,194Other 42 States100%15,786,627Total
3.2%477,668WA (4)3.5%549,090IL (8)3.6%561,994OH (8)4.7%739,433MN (5)8.5%1,340,453NJ (6)9.5%1,506,304TX (5)
15.5%2,452,572FL (7)29.0%4,578,251CA (19)
% of Total, by State
Demo Generated (TPY)
State (No. of Surveys)
B-17
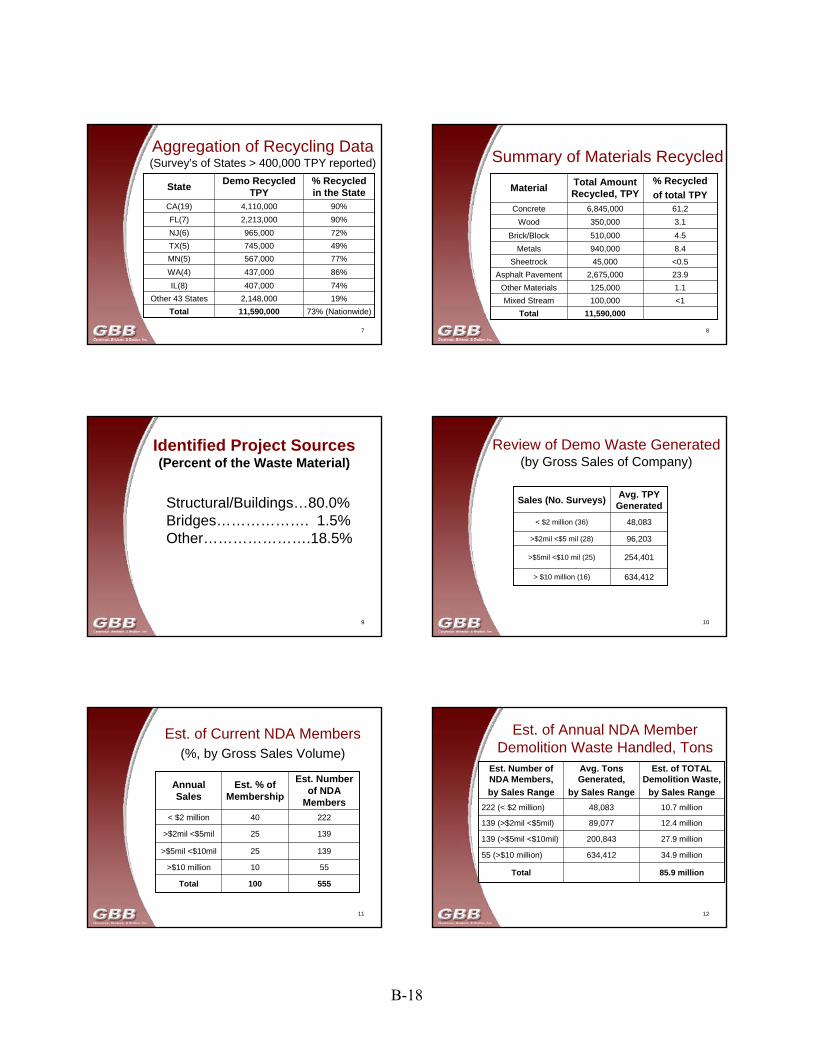
7
Aggregation of Recycling Data(Survey’s of States > 400,000 TPY reported)
19%2,148,000Other 43 States74%407,000IL(8)86%437,000WA(4)77%567,000MN(5)49%745,000TX(5)72%965,000NJ(6)
73% (Nationwide)11,590,000Total
90%2,213,000FL(7)90%4,110,000CA(19)
% Recycled in the State
Demo Recycled TPYState
8
Summary of Materials Recycled
<1100,000Mixed Stream1.1125,000Other Materials23.92,675,000Asphalt Pavement<0.545,000Sheetrock8.4940,000Metals4.5510,000Brick/Block
11,590,000Total
3.1350,000Wood61.26,845,000Concrete
% Recycledof total TPY
Total Amount Recycled, TPYMaterial
9
Identified Project Sources(Percent of the Waste Material)
Structural/Buildings…80.0%Bridges………………. 1.5%Other………………….18.5%
10
Review of Demo Waste Generated(by Gross Sales of Company)
96,203>$2mil <$5 mil (28)
634,412> $10 million (16)
254,401>$5mil <$10 mil (25)
48,083< $2 million (36)
Avg. TPY GeneratedSales (No. Surveys)
11
555100Total
5510>$10 million
13925>$5mil <$10mil
13925>$2mil <$5mil
22240< $2 million
Est. Number of NDA
Members
Est. % of Membership
Annual Sales
Est. of Current NDA Members (%, by Gross Sales Volume)
12
85.9 millionTotal
34.9 million634,41255 (>$10 million)
27.9 million200,843139 (>$5mil <$10mil)
12.4 million89,077139 (>$2mil <$5mil)
10.7 million48,083222 (< $2 million)
Est. of TOTAL Demolition Waste,
by Sales Range
Avg. Tons Generated,
by Sales Range
Est. Number of NDA Members, by Sales Range
Est. of Annual NDA Member Demolition Waste Handled, Tons
B-18
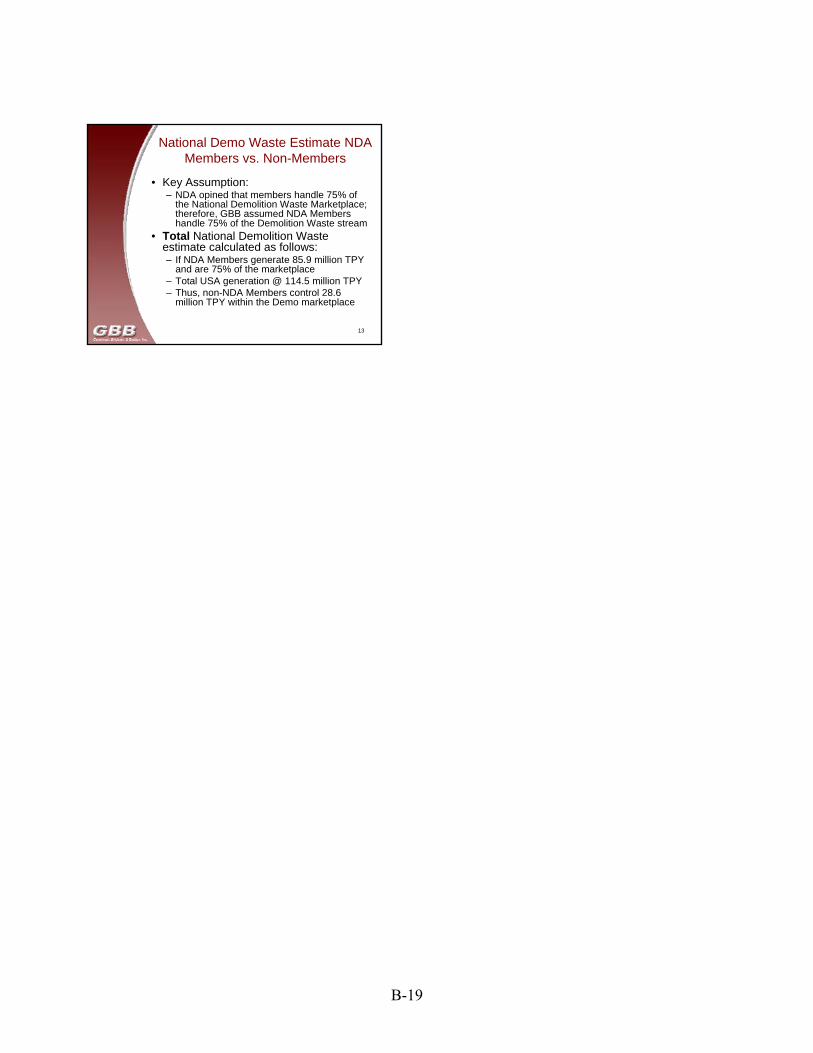
13
National Demo Waste Estimate NDA Members vs. Non-Members
• Key Assumption:– NDA opined that members handle 75% of
the National Demolition Waste Marketplace; therefore, GBB assumed NDA Members handle 75% of the Demolition Waste stream
• Total National Demolition Waste estimate calculated as follows:– If NDA Members generate 85.9 million TPY
and are 75% of the marketplace– Total USA generation @ 114.5 million TPY– Thus, non-NDA Members control 28.6
million TPY within the Demo marketplace
B-19

Office of Resource Conservation and Recovery EPA530-R-09-002 www.epa.gov/epawaste March 2009
Recommended