Estimation of Capital and Levelized Cost for Redox Flow Batteries V. Viswanathan, A. Crawford, L. Thaller1, D. Stephenson,
S. Kim, W. Wang, G. Coffey, P. Balducci, Z. Gary Yang2, Liyu Li2 , M. Kintner-Meyer, V. Sprenkle
1 Consultant 2 UniEnergy Technology
September 28, 2012 USDOE-OE ESS Peer Review Washington, DC
Dr. Imre Gyuk - Energy Storage Program Manager,
Office of Electricity Delivery and Energy Reliability
1
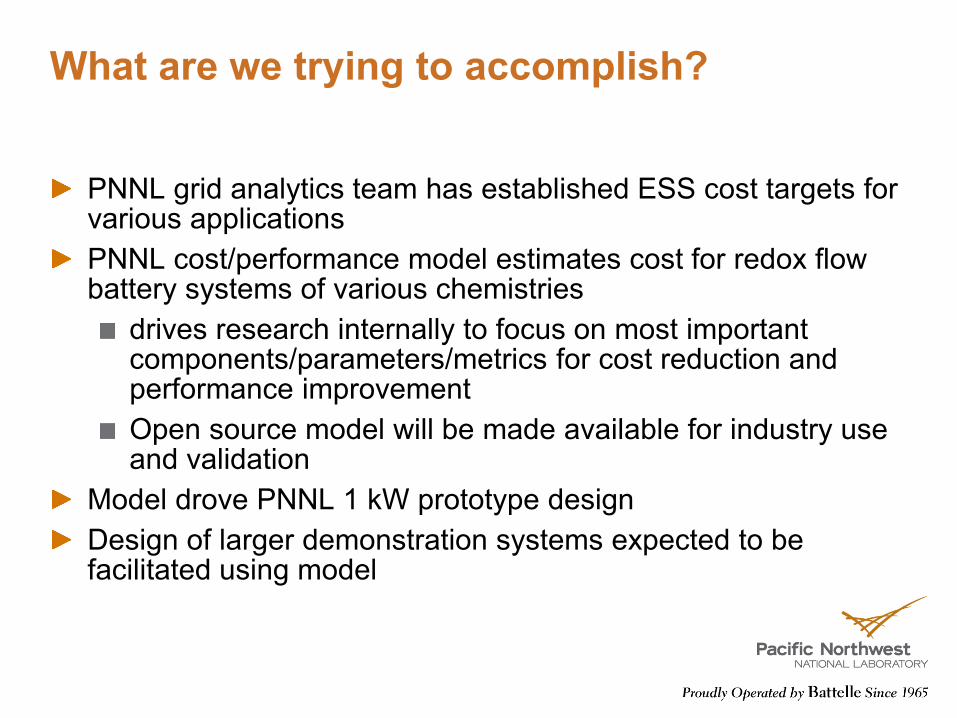
What are we trying to accomplish?
PNNL grid analytics team has established ESS cost targets for various applications PNNL cost/performance model estimates cost for redox flow battery systems of various chemistries
drives research internally to focus on most important components/parameters/metrics for cost reduction and performance improvement Open source model will be made available for industry use and validation
Model drove PNNL 1 kW prototype design Design of larger demonstration systems expected to be facilitated using model
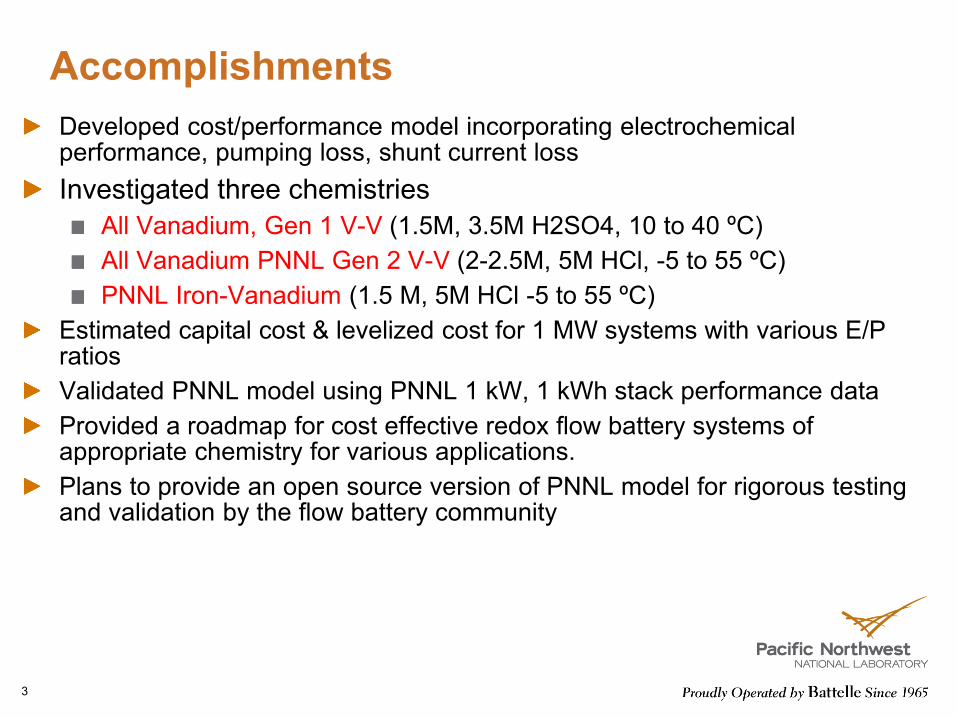
Accomplishments Developed cost/performance model incorporating electrochemical performance, pumping loss, shunt current loss Investigated three chemistries
All Vanadium, Gen 1 V-V (1.5M, 3.5M H2SO4, 10 to 40 ºC) All Vanadium PNNL Gen 2 V-V (2-2.5M, 5M HCl, -5 to 55 ºC) PNNL Iron-Vanadium (1.5 M, 5M HCl -5 to 55 ºC)
Estimated capital cost & levelized cost for 1 MW systems with various E/P ratios Validated PNNL model using PNNL 1 kW, 1 kWh stack performance data Provided a roadmap for cost effective redox flow battery systems of appropriate chemistry for various applications. Plans to provide an open source version of PNNL model for rigorous testing and validation by the flow battery community
3
Approach Estimated capital cost (power and energy components) for 1MW system with various energy content Contacted vendors for each component to obtain budget estimates
Cost estimation done for Present, Near-term and Optimistic scenarios
Present : 50 MW, 100 MWh annual demand Near-term: 300 MW, 600 MWh annual demand Optimistic: 1 GW, 2 GWh annual demand
Developed integrated battery model to determine losses shunt current, pumping and electrochemical
Incorporated losses to size the system for desired power and energy Determined stack size, design and operating parameters that yield lowest total system cost Established where advances in technology can reduce cost and guide internal research and redox flow community
4
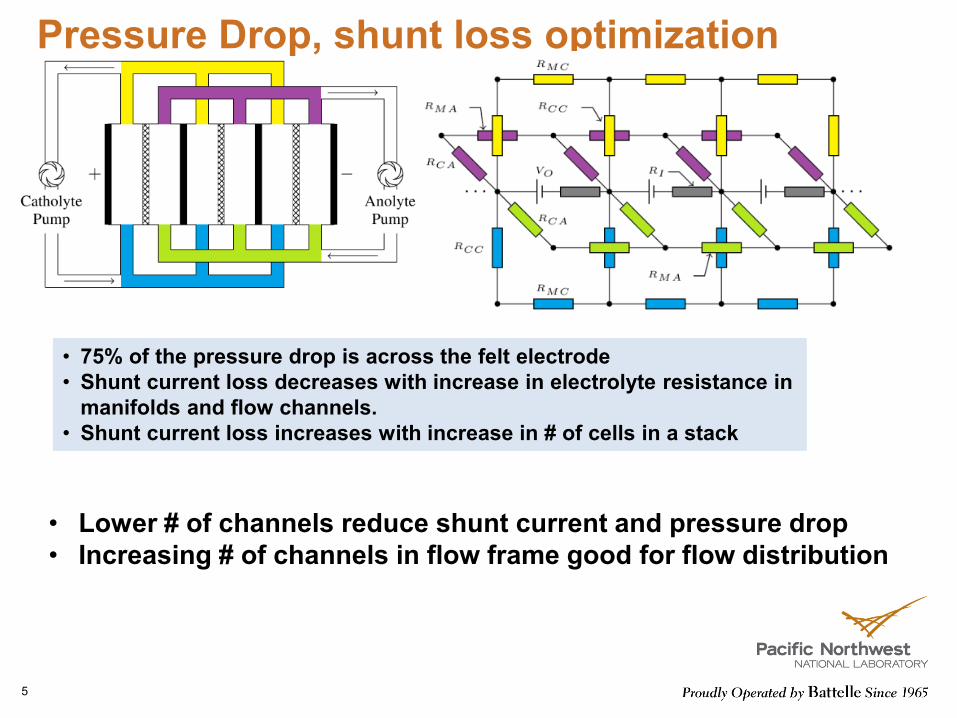
Pressure Drop, shunt loss optimization
5
• 75% of the pressure drop is across the felt electrode • Shunt current loss decreases with increase in electrolyte resistance in
manifolds and flow channels. • Shunt current loss increases with increase in # of cells in a stack
• Lower # of channels reduce shunt current and pressure drop • Increasing # of channels in flow frame good for flow distribution
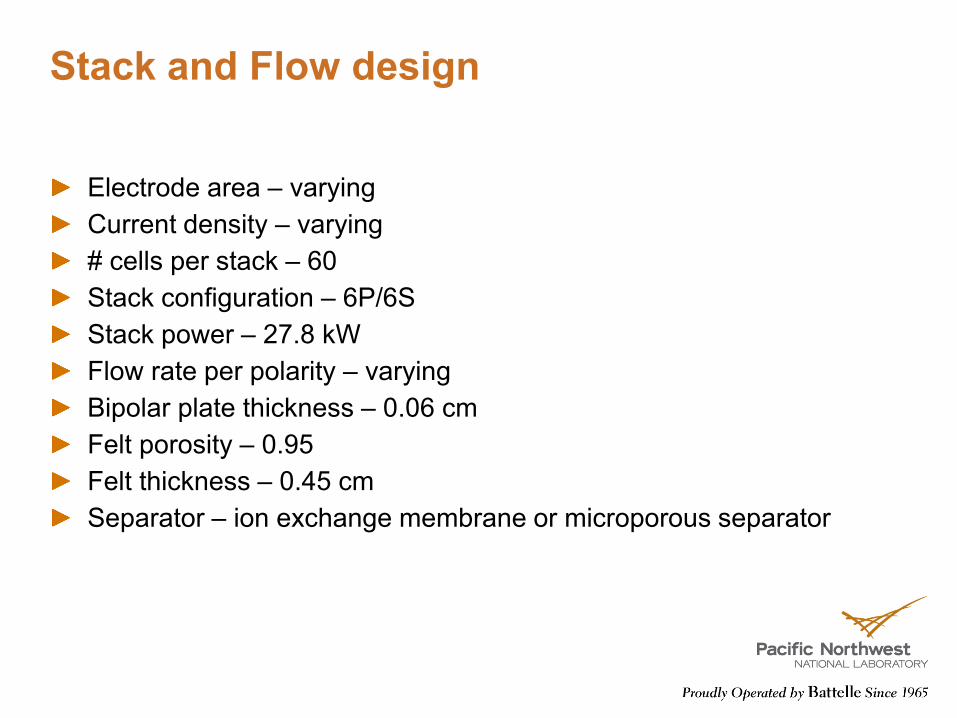
Stack and Flow design
Electrode area – varying Current density – varying # cells per stack – 60 Stack configuration – 6P/6S Stack power – 27.8 kW Flow rate per polarity – varying Bipolar plate thickness – 0.06 cm Felt porosity – 0.95 Felt thickness – 0.45 cm Separator – ion exchange membrane or microporous separator
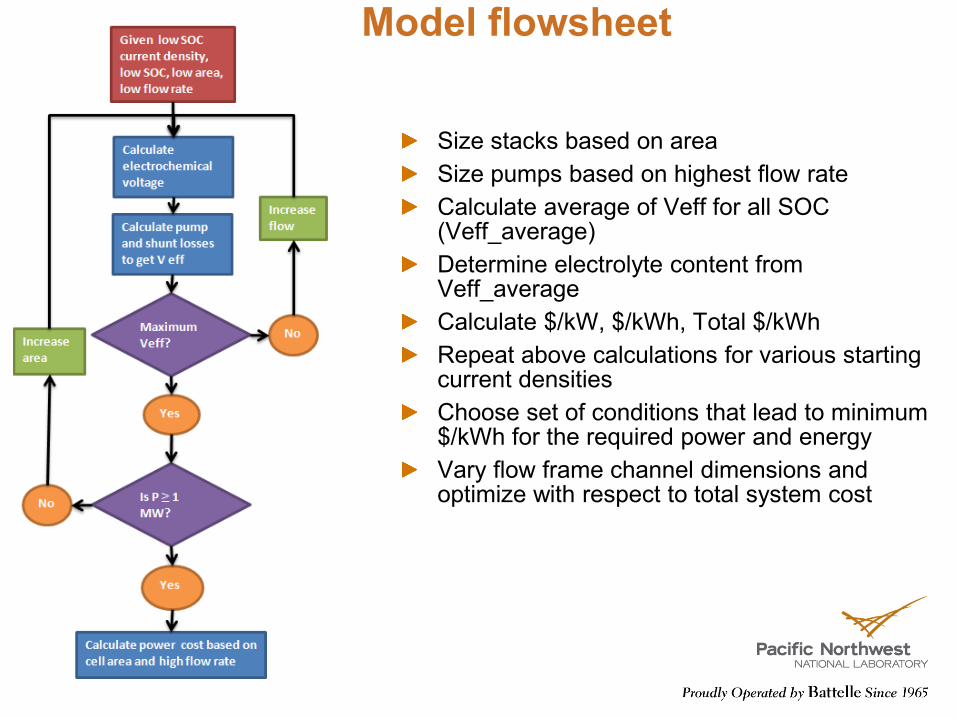
Model flowsheet
7
Size stacks based on area Size pumps based on highest flow rate Calculate average of Veff for all SOC (Veff_average) Determine electrolyte content from Veff_average Calculate $/kW, $/kWh, Total $/kWh Repeat above calculations for various starting current densities Choose set of conditions that lead to minimum $/kWh for the required power and energy Vary flow frame channel dimensions and optimize with respect to total system cost
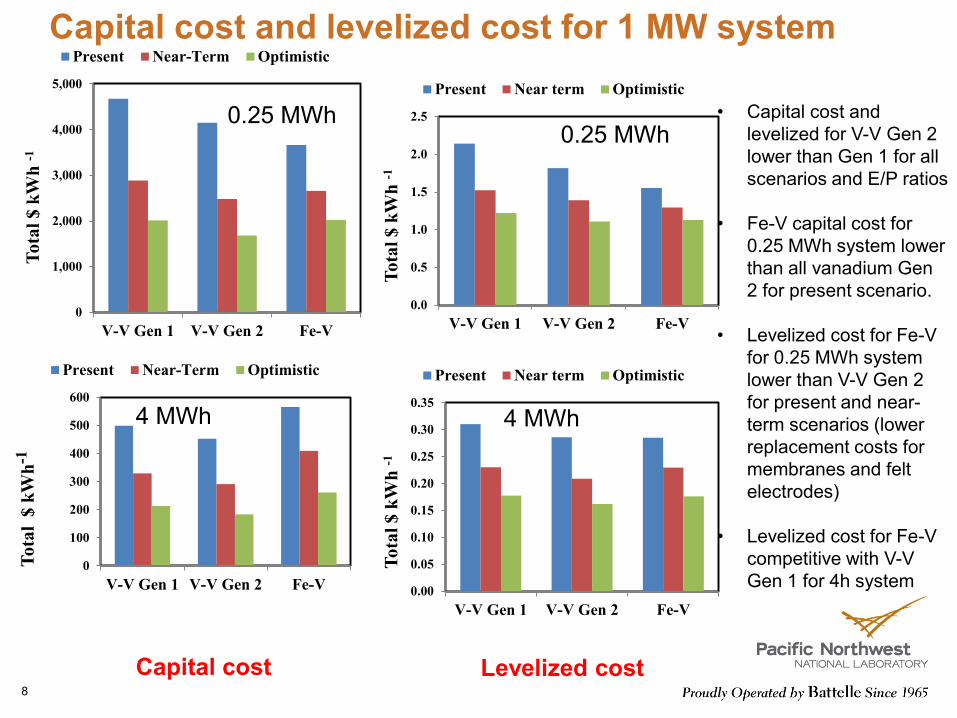
Capital cost and levelized cost for 1 MW system
8
0.25 MWh
4 MWh 4 MWh
0.25 MWh • Capital cost and
levelized for V-V Gen 2 lower than Gen 1 for all scenarios and E/P ratios
• Fe-V capital cost for 0.25 MWh system lower than all vanadium Gen 2 for present scenario.
• Levelized cost for Fe-V for 0.25 MWh system lower than V-V Gen 2 for present and near-term scenarios (lower replacement costs for membranes and felt electrodes)
• Levelized cost for Fe-V competitive with V-V Gen 1 for 4h system
Capital cost Levelized cost
0
100
200
300
400
500
600
V-V Gen 1 V-V Gen 2 Fe-V
Tota
l $
kWh-1
Present Near-Term Optimistic
0
1,000
2,000
3,000
4,000
5,000
V-V Gen 1 V-V Gen 2 Fe-V
Tota
l $ k
Wh
-1
Present Near-Term Optimistic
0.0
0.5
1.0
1.5
2.0
2.5
V-V Gen 1 V-V Gen 2 Fe-V
Tota
l $ k
Wh
-1
Present Near term Optimistic
0.00
0.05
0.10
0.15
0.20
0.25
0.30
0.35
V-V Gen 1 V-V Gen 2 Fe-V
Tota
l $ k
Wh
-1
Present Near term Optimistic
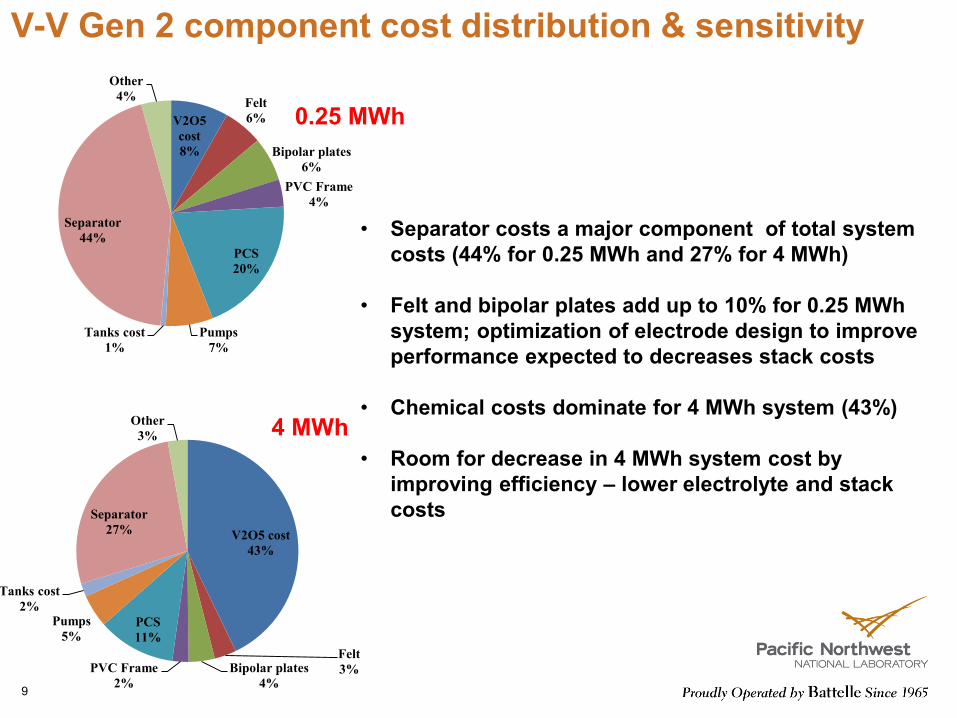
V-V Gen 2 component cost distribution & sensitivity
9
V2O5 cost 8%
Felt 6%
Bipolar plates 6%
PVC Frame 4%
PCS 20%
Pumps 7%
Tanks cost 1%
Separator 44%
Other 4%
V2O5 cost 43%
Felt 3% Bipolar plates
4% PVC Frame
2%
PCS 11%
Pumps 5%
Tanks cost 2%
Separator 27%
Other 3%
0.25 MWh
4 MWh
• Separator costs a major component of total system costs (44% for 0.25 MWh and 27% for 4 MWh)
• Felt and bipolar plates add up to 10% for 0.25 MWh system; optimization of electrode design to improve performance expected to decreases stack costs
• Chemical costs dominate for 4 MWh system (43%)
• Room for decrease in 4 MWh system cost by improving efficiency – lower electrolyte and stack costs
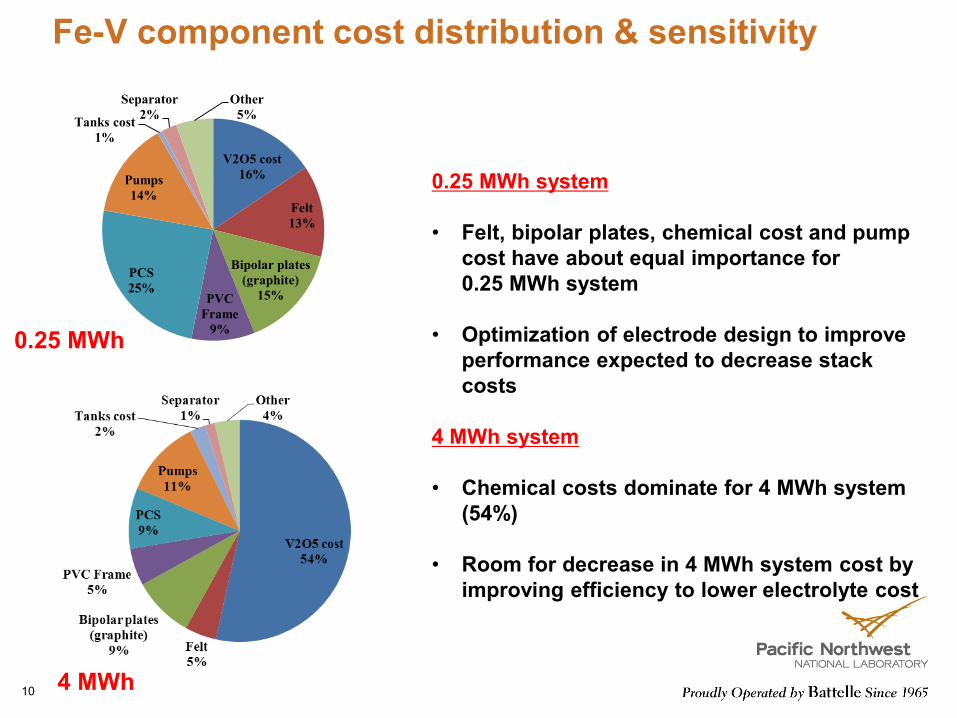
Fe-V component cost distribution & sensitivity
10
V2O5 cost 16%
Felt 13%
Bipolar plates (graphite)
15% PVC Frame
9%
PCS 25%
Pumps 14%
Tanks cost 1%
Separator 2%
Other 5%
0.25 MWh
4 MWh
0.25 MWh system
• Felt, bipolar plates, chemical cost and pump cost have about equal importance for 0.25 MWh system
• Optimization of electrode design to improve performance expected to decrease stack costs
4 MWh system
• Chemical costs dominate for 4 MWh system (54%)
• Room for decrease in 4 MWh system cost by improving efficiency to lower electrolyte cost
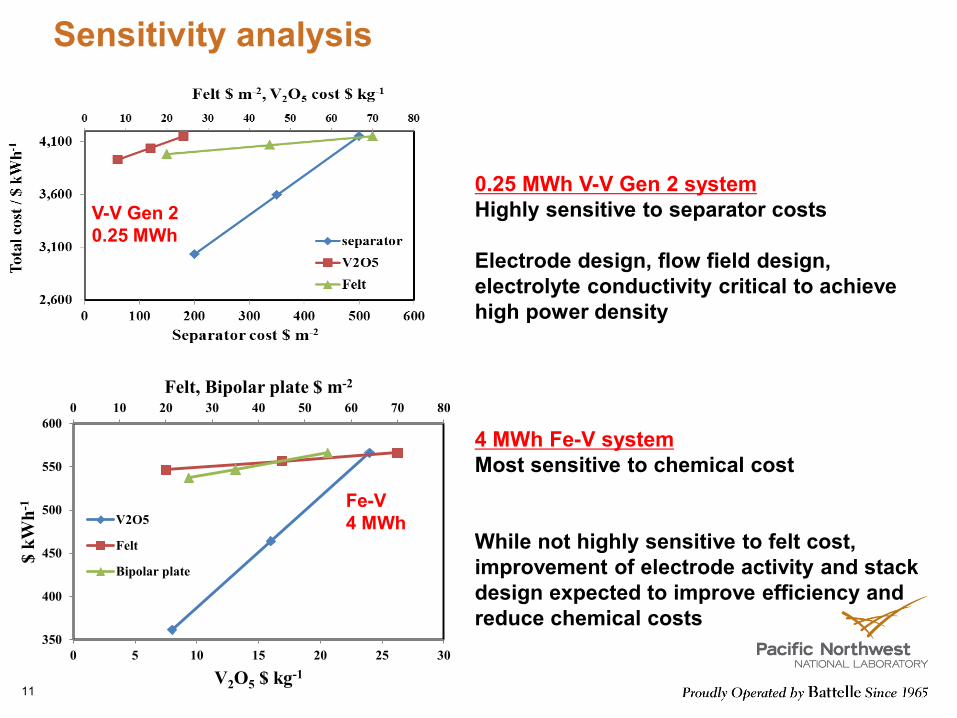
Sensitivity analysis
11
0.25 MWh V-V Gen 2 system Highly sensitive to separator costs Electrode design, flow field design, electrolyte conductivity critical to achieve high power density 4 MWh Fe-V system Most sensitive to chemical cost While not highly sensitive to felt cost, improvement of electrode activity and stack design expected to improve efficiency and reduce chemical costs
V-V Gen 2 0.25 MWh
Fe-V 4 MWh
0 10 20 30 40 50 60 70 80
350
400
450
500
550
600
0 5 10 15 20 25 30
Felt, Bipolar plate $ m-2
$ kW
h-1
V2O5 $ kg-1
V2O5
Felt
Bipolar plate
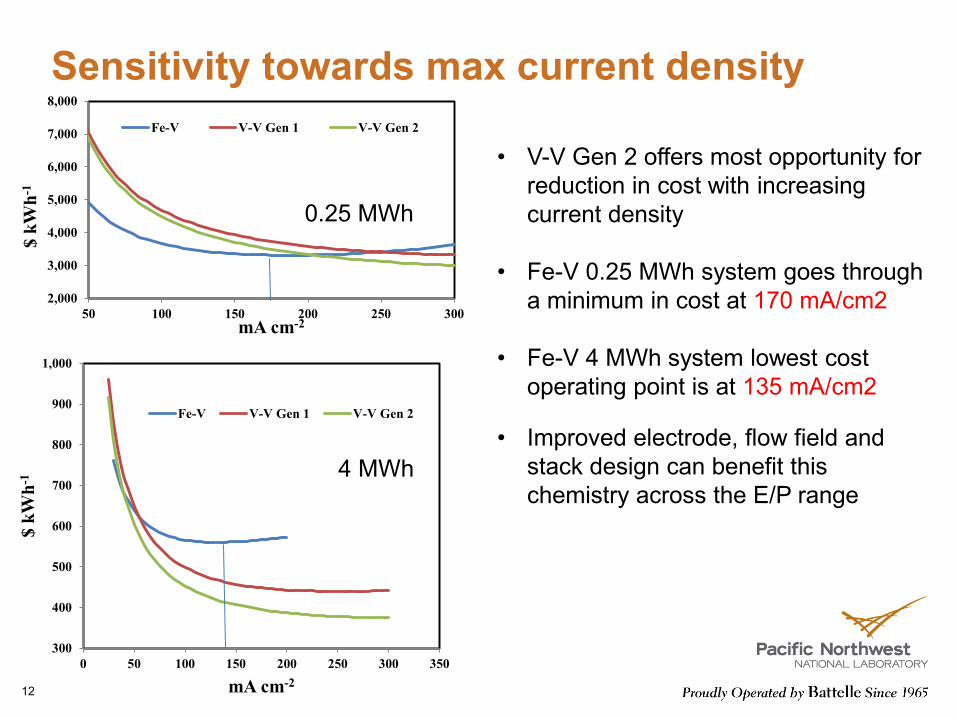
Sensitivity towards max current density
12
0.25 MWh
4 MWh
• V-V Gen 2 offers most opportunity for reduction in cost with increasing current density
• Fe-V 0.25 MWh system goes through
a minimum in cost at 170 mA/cm2 • Fe-V 4 MWh system lowest cost
operating point is at 135 mA/cm2
• Improved electrode, flow field and stack design can benefit this chemistry across the E/P range
2,000
3,000
4,000
5,000
6,000
7,000
8,000
50 100 150 200 250 300
$ kW
h-1
mA cm-2
Fe-V V-V Gen 1 V-V Gen 2
300
400
500
600
700
800
900
1,000
0 50 100 150 200 250 300 350
$ kW
h-1
mA cm-2
Fe-V V-V Gen 1 V-V Gen 2
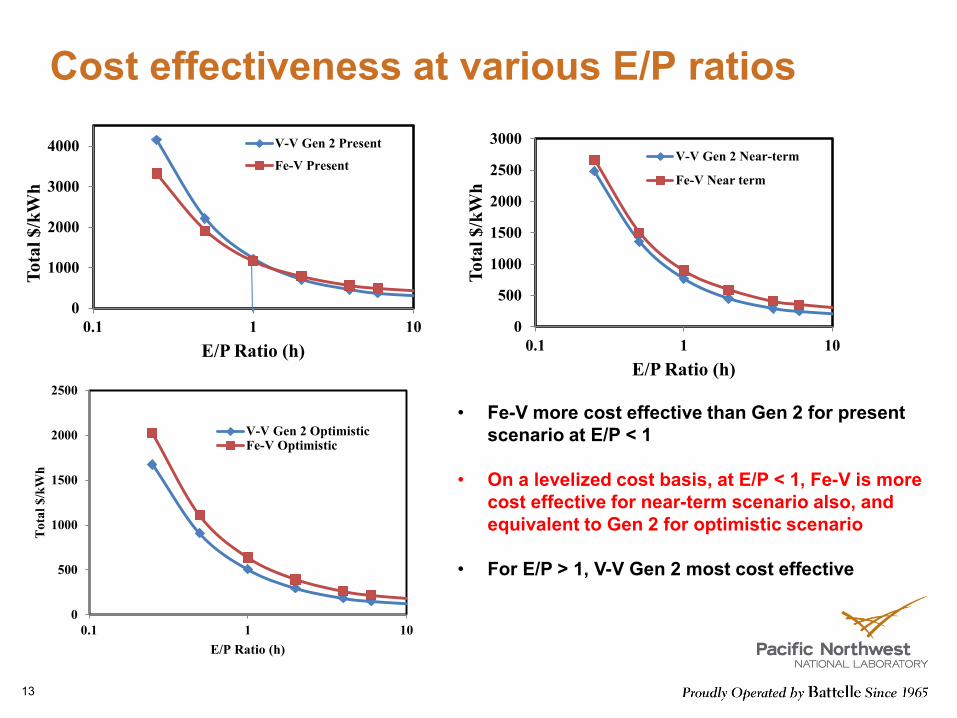
Cost effectiveness at various E/P ratios
13
• Fe-V more cost effective than Gen 2 for present scenario at E/P < 1
• On a levelized cost basis, at E/P < 1, Fe-V is more
cost effective for near-term scenario also, and equivalent to Gen 2 for optimistic scenario
• For E/P > 1, V-V Gen 2 most cost effective
0
1000
2000
3000
4000
0.1 1 10
Tota
l $/k
Wh
E/P Ratio (h)
V-V Gen 2 Present
Fe-V Present
0
500
1000
1500
2000
2500
3000
0.1 1 10
Tota
l $/k
Wh
E/P Ratio (h)
V-V Gen 2 Near-term
Fe-V Near term
0
500
1000
1500
2000
2500
0.1 1 10
Tota
l $/k
Wh
E/P Ratio (h)
V-V Gen 2 OptimisticFe-V Optimistic
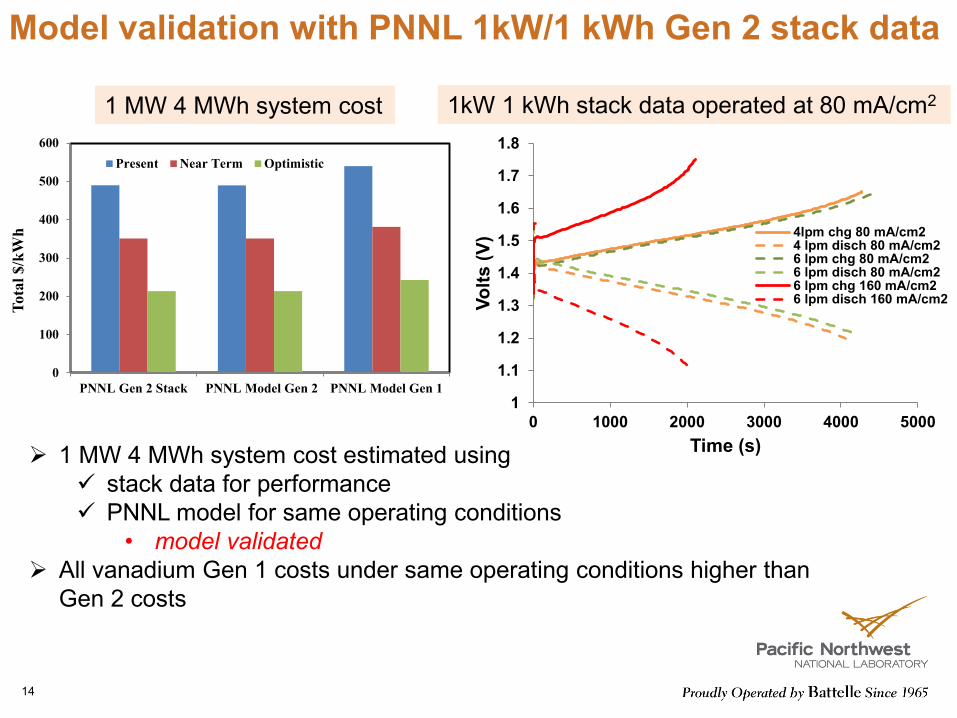
Model validation with PNNL 1kW/1 kWh Gen 2 stack data
14
1
1.1
1.2
1.3
1.4
1.5
1.6
1.7
1.8
0 1000 2000 3000 4000 5000
Volts
(V)
Time (s)
4lpm chg 80 mA/cm24 lpm disch 80 mA/cm26 lpm chg 80 mA/cm26 lpm disch 80 mA/cm26 lpm chg 160 mA/cm26 lpm disch 160 mA/cm2
1 MW 4 MWh system cost estimated using stack data for performance PNNL model for same operating conditions
• model validated All vanadium Gen 1 costs under same operating conditions higher than
Gen 2 costs
0
100
200
300
400
500
600
PNNL Gen 2 Stack PNNL Model Gen 2 PNNL Model Gen 1
Tota
l $/k
Wh
Present Near Term Optimistic
1 MW 4 MWh system cost 1kW 1 kWh stack data operated at 80 mA/cm2
Summary and future work Cost-performance model developed that takes into account electrochemical performance, pumping and shunt current loss Cost effectiveness of various chemistries for different applications determined Pathway established to further drive costs down by improved electrode & flow frame design and optimization of operating parameters Open source version of this model will be made available shortly
Interactive Allows running various scenarios Expected to benefit redox flow battery community
Future work Further optimization will be done for battery operation in various applications
Use bottoms-up approach for estimation of component cost Perform detailed analysis with respect to payback period for various applications using for V-V Gen2 and Fe-V
Publication – paper has been prepared – to be submitted
15
Acknowledgement
16
We gratefully acknowledge support from the U. S. Department of
Energy, Office of Electricity Delivery and Energy Reliability
(Dr. Imre Gyuk, DOE-OE Energy Storage Program)
Recommended