DEPARTMENT OF FISH AND GAMEENVIRONMENTAL SERVICES DIVISION
Stream Flow and Habitat Evaluation Program
FALL-RUN CHINOOK SALMON SPAWNER ESCAPEMENTSURVEY
MAINSTEM SACRAMENTO RIVEROctober - December 1995
Prepared by
Bill SniderBob Reavis
andLarry Hanson
Stream Evaluation ProgramTechnical Report No. 96-6
October 1996
DEPARTMENT OF FISH AND GAMEENVIRONMENTAL SERVICES DIVISION
Stream Flow and Habitat Evaluation Program
FALL-RUN CHINOOK SALMON SPAWNER ESCAPEMENT SURVEY
MAINSTEM SACRAMENTO RIVEROctober - December 19951/,2/
Prepared by
Bill SniderBob Reavis
andLarry Hanson
October 1996
1/ This work was supported by funds provided by the U.S. Fish and Wildlife Service, CentralValley Anadromous Fish Restoration Program, as part of a cooperative agreement with theCalifornia Department of Fish and Game pursuant to the Central Valley Project Improvement Act(PL. 102-575).
2/ Stream Evaluation Program Technical Report 96-6.
1
INTRODUCTION
The California Department of Fish and Game’s (DFG) Stream Flow and Habitat EvaluationProgram (SF&HEP) conducted an intensive fall-run chinook salmon escapement survey on themainstem Sacramento River during the fall-winter of 1995 to estimate fall-run chinook salmonspawner abundance and distribution. This survey was carried out to accommodate the mandatesof Section 3406(b)(1)(B) of the Central Valley Project Improvement Act (CVPIA), P.L. 102-575,that requires the Secretary of the Interior to determine instream flow needs for all Central ValleyProject controlled streams and rivers. Flow-need recommendations are to be provided to theSecretary by the U. S. Fish and Wildlife Service (FWS) after consultation with DFG. In responseto this Act, the FWS and the DFG entered a “Cooperative Agreement” to determine flow needsof anadromous salmonids in the mainstem Sacramento River.
The primary mission of the SF&HEP - to improve understanding of the relationships betweensalmon and habitat in the mainstem Sacramento River - requires reliable estimates of the spawnerpopulation to help distinguish habitat versus population influences on temporal and spatialspawning distribution (Snider and McEwan 1992, Snider et al. 1993, and Snider and Vyverberg1995). Changes in spawning activity related to changes in flow and temperature need to bedistinguished from changes due to population size. Spawning density, redd superimposition,habitat use, and other parameters can be affected by both changes in habitat conditions (flowdependent) and spawner population size. A reliable population estimate developed concurrentlywith redd surveys should allow this distinction. An intensive spawner escapement survey alsoprovides additional baseline information on egg retention (pre-spawning mortality), age and sexcomposition, and behavior relative to habitat conditions and population size.
HISTORICAL BACKGROUND
Salmon spawner surveys were first conducted in the mainstem Sacramento River in 1937 toevaluate the potential effect of Shasta Dam on chinook salmon. From 1937 through 1942, salmonwere counted as they passed through a fish ladder at Anderson-Cottonwood Irrigation District’s(ACID) dam (river mile ), near Redding (Fry 1961) (Needham et. al.1943). The counts weremade to determine the number of fish that would be blocked by Shasta Dam. The counts weremade by the Division of Fish and Game (became the Department of Fish and Game in 1952) in1937, the U. S. Bureau of Reclamation from 1938 through 1941, and the FWS in 1942. ACIDDam is a low, flash board dam that is typically installed in April and is maintained until October orearly November. During both installation and dismantling, fish could jump over the flash boardsand avoid being counted. Excessively high spring flows sometimes delayed installation of theflash boards and prevented counts.
From 1943 through 1945, salmon spawner counts on the mainstem were made at Balls Ferry(river mile 276). A rack was built for counting and trapping salmon. It was also intended to forcepart of the population to spawn downstream to reduce spawning density between Balls Ferry and
2
the recently constructed Keswick Dam (river mile 302). Many fish passed this rack uncountedduring periods of high flows and by moving through holes underneath the rack.
Fry (1961) concluded that the 1940's spawner escapement estimates for the mainstem wereprobably much lower than the actual population. This was due to both the tendency to overratethe ability to observe, thus count fish moving through the weir, even when visibility seemedexcellent, and to underestimate how many salmon went through small holes in the counting weir. From 1946 through 1952 a variety of methods were used by both the DFG and FWS to estimatesalmon spawning escapement to the mainstem. Both ground and aerial surveys were made tocount carcasses and redds. The estimates were substantially based upon these data and“professional judgement” using the experience of individuals associated with the program. Theseestimates were never tested against other methods or counts.
DFG also used a tag-and-recovery method from the 1950 through 1955 to estimate populations inthe mainstem Sacramento River (Fry 1961). Live fish were captured in fyke traps locateddownstream of the spawning grounds, at Fremont Weir (river mile 84), then tagged and released. The tags were later recovered from the carcasses during spawning area surveys, upstream of rivermile 200. This method was satisfactory on the American and Stanislaus rivers, but proved muchless satisfactory on the mainstem Sacramento River (Fry 1961). He gave the following reasonsfor this method being unsatisfactory: (I) the difficulty of recovering adequate numbers ofspawned-out carcasses; (ii) the trapping site was too far below the spawning area; and (iii) thetrap selected for smaller fish.
From 1956 through 1968, spawner estimates were made by experienced DFG biologists usingcarcass counts(no tag-recapture estimates were made), aerial redd counts, and comparisons withprevious years’ observations (Dick Hallock, pers. comm). Turbidity, flow, and number of surveytrips were integrated into the estimate. Using the estimate and the carcass counts, carcass“recovery” was estimated to range from 0.7 to 4.0%.
Beginning in 1969, estimates were based on fish counts made at the fish ladders on Red BluffDiversion Dam (RBDD) at river mile 243 (Menchen 1970). The counts were adjusted for periodswhen no counts were made, including when the dam was open due to normal operation or duringfloods, and during night hours when no counts were made. The estimated number of fish caughtby anglers was subtracted from the number passing over RBDD to calculate spawner escapement. Aerial redd counts were used to determine the distribution of spawning upstream and downstreamof RBDD. These results were used to expand RBDD counts and calculate a total estimate for theentire mainstem.
Since 1986, the gates at RBDD have been raised in the fall and lowered during the followingspring to improve fish passage. Since 1994, the gates are normally open between September 15thand May 15th. Direct (fishway) counts cannot be made when the gates are raised. Salmonspawner estimates are now computed by dividing the number of fish counted in the fishway by theestimated portion of the total run represented in the counting period. The estimated portion wasbased on historical data when counts were made year around.
3
The 1995 escapement survey represents the first attempt since 1968 to estimate salmon spawnerescapement in the mainstem Sacramento River based on the ground surveys. It also representsthe first attempt ever in the mainstem to use carcasses and a tag-recapture model to estimatespawner escapement.
When monitoring stocks over a long period, such as the Central Valley salmon escapementsurveys, the sampling design should assure the data be collected in a consistent manner andrepresent the population as a whole (Ney 1993). Inconsistencies in methods before 1968 wereprimarily due to changes in funding that often reduced or eliminated sampling effort, thus the dataused to make estimates. Also, population estimates were often based on counts made upstream ofwhere varying portions of the salmon population would spawn - ACID Dam, Balls Ferry Racks,and RBDD. This limited the ability to consistently estimate the entire spawning population unlessspawning distribution was also measured. Another limitation was the unknown number of fishthat could migrate uncounted above the counting sites. This prompted Fry and Petrovich (1970)to conclude: “Until we can determine the magnitude of salmon movement through the gates at theRed Bluff Dam the counts there cannot be regarded as more than an index.”
OBJECTIVES
# To estimate the 1995, in-river, fall-run chinook salmon spawning population for themainstem Sacramento River.
# To augment redd surveys to provide baseline information on spawning distribution,spawning habitat availability, instream flow requirements, and the status of chinooksalmon in the mainstem Sacramento River.
METHODS
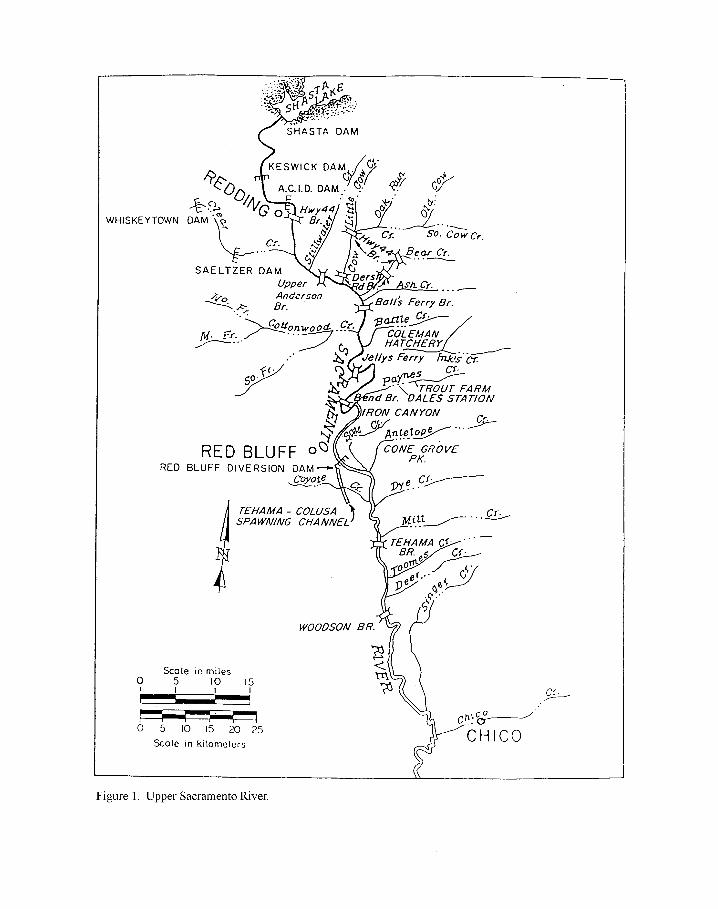
A carcass tag-and-recapture study was conducted in the mainstem Sacramento River during fall-winter 1995 to estimate fall-run chinook salmon spawner escapement. The study sectionextended 25.5 miles from ACID Dam downstream (river mile 298.5) to Cottonwood Creek (rivermile 273) (Figure 1). Carcasses were tagged and released into running water for later recapture,unlike the earlier tag-and-recovery study when live fish were tagged and released at Fremont weir. Carcass tag-and-recapture studies along with use of the Schaefer or Jolly-Seber models have beenregularly used to estimate escapements in other Central Valley tributary streams (e.g., American,Yuba, and Feather rivers). This protocol was initially used in the Central Valley to estimate the1973 Yuba River escapement (Taylor 1974).
Three models have been used by the DFG to estimate escapement from carcass tag-and-recoverydata: Petersen (Ricker 1975), Schaefer (1951) and the Jolly-Seber (Seber 1982). The Petersenmodel is the simplest but least accurate (Law 1992). It has been used primarily when data are
4
insufficient to allow calculation with other models. It is occasionally used to estimate escapementto smaller tributary streams (e.g. Cosumnes, Merced, Stanislaus, and Tuolumne rivers). Amodification of the Schaefer model has been used in “larger” Central Valley tributary streamssince 1973 when it was first used to estimate the Yuba River escapement. This model was firstused to estimate escapement in the Central Valley in 1988. The Jolly-Seber model is moreaccurate when model assumptions are met and recovery rates are > 10% (Boydstun 1992 andLaw 1992). Still, there is considerable disagreement among fisheries managers responsible forestimating spawner escapement for California streams. They believe that population estimatesobtained by the Jolly-Seber model are too low (Fisher and Meyer, pers. comm.). Law (1992)states that both models could produce low estimates if the basic assumption of equal mixing oftagged carcasses with all carcasses is violated, resulting in the recaptured carcasses constituting adifferent subpopulation.
The escapement survey began on October 1, immediately following initiation of spawning activity,and continued through December 23, 1995. The study reach from Acid Dam to CottonwoodCreek was surveyed weekly (Figure 1). This reach was further divided into four reaches and eachreach was surveyed one day per week (Table 1).
The carcass tag-recapture study was conducted to provide estimates using both the Schaefer andJolly-Seber models. Complete carcasses (i.e., with the head in tact) were normally tagged. Carcasses that were chopped (not tagged) included: I) those on shore in a “leathery condition”; ii)those in Reach 4 (the most downstream reach) that would likely wash out of the survey area andnever be recovered; and iii) carcasses in excess of the number crews could tag during a day. “Fresh” and “decayed” carcasses were combined to calculate estimates for both the Schaefer andJolly-Seber models. Data acquired weekly for estimating population size included number tagged,number chopped, and number recovered (by week of tagging). Unfortunately, only the numberrecovered data were collected during the last two survey weeks. This error resulted in a slightunderestimate of the population for those two weeks. Since the error occurred during the end ofspawning, when the population was relatively very low, it only slightly affected the overallspawner population estimate.
Data collected from a subsample of the fresh carcasses included sex, fork length (FL) incentimeters, reach of the stream that each carcass was observed, and egg retention for females. Females were classified as spent if few eggs were remaining, partially spent if more than 50% ofthe eggs remained, and unspent if the ovaries were nearly full of eggs.
5
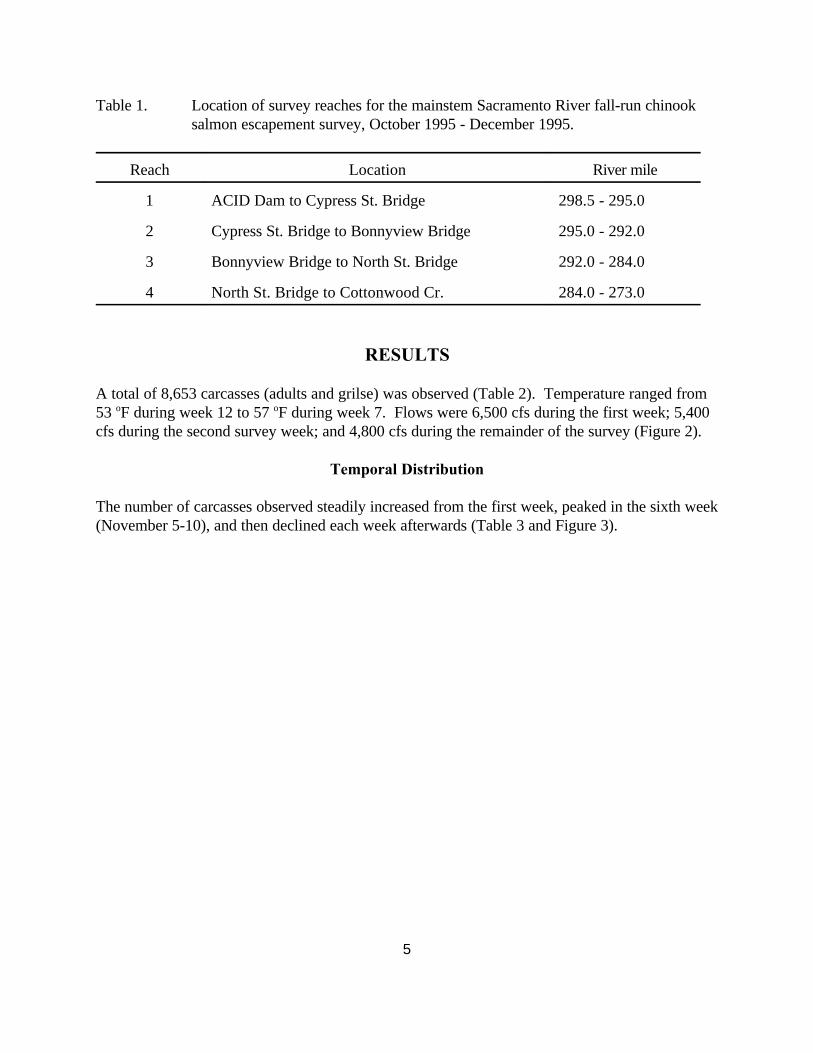
Table 1. Location of survey reaches for the mainstem Sacramento River fall-run chinooksalmon escapement survey, October 1995 - December 1995.
Reach Location River mile
1 ACID Dam to Cypress St. Bridge 298.5 - 295.0
2 Cypress St. Bridge to Bonnyview Bridge 295.0 - 292.0
3 Bonnyview Bridge to North St. Bridge 292.0 - 284.0
4 North St. Bridge to Cottonwood Cr. 284.0 - 273.0
RESULTS
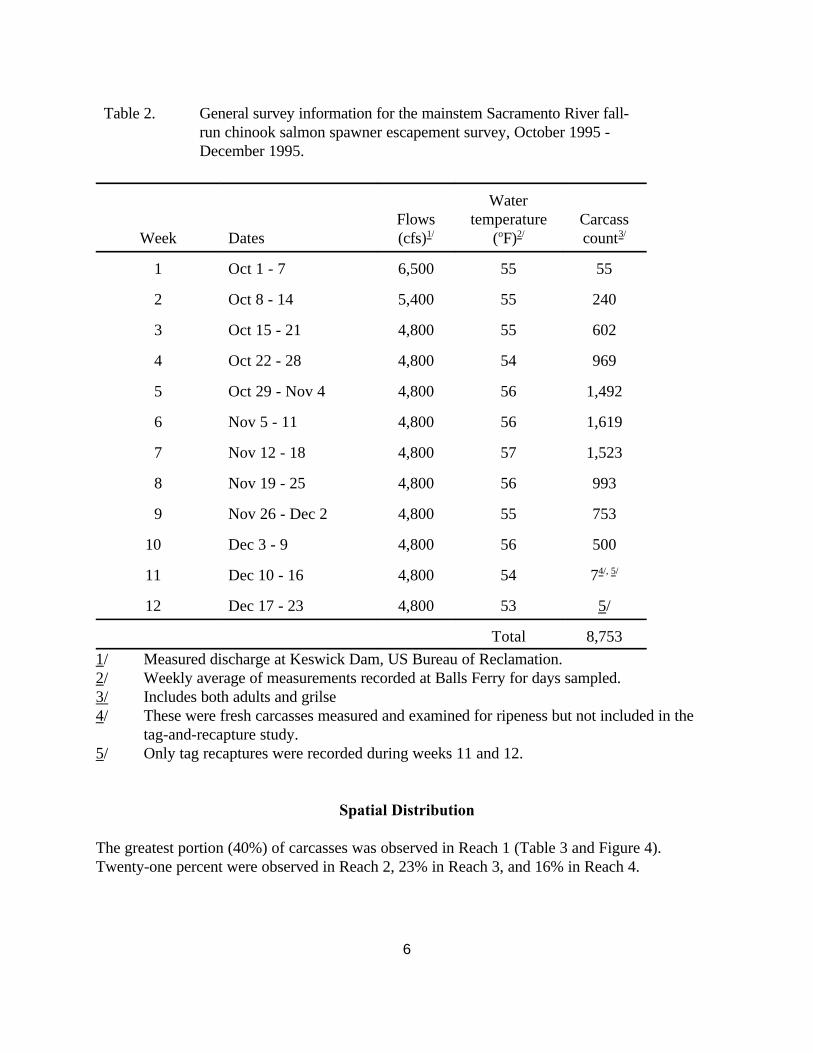
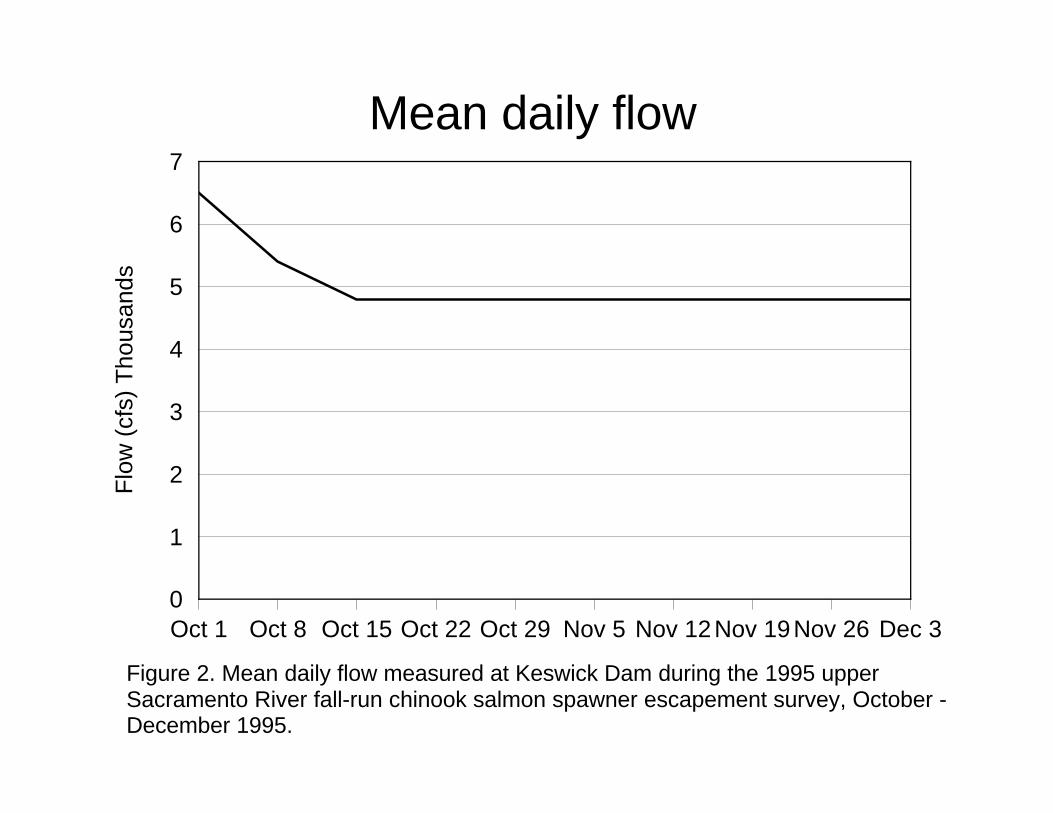
A total of 8,653 carcasses (adults and grilse) was observed (Table 2). Temperature ranged from53 oF during week 12 to 57 oF during week 7. Flows were 6,500 cfs during the first week; 5,400cfs during the second survey week; and 4,800 cfs during the remainder of the survey (Figure 2).
Temporal Distribution
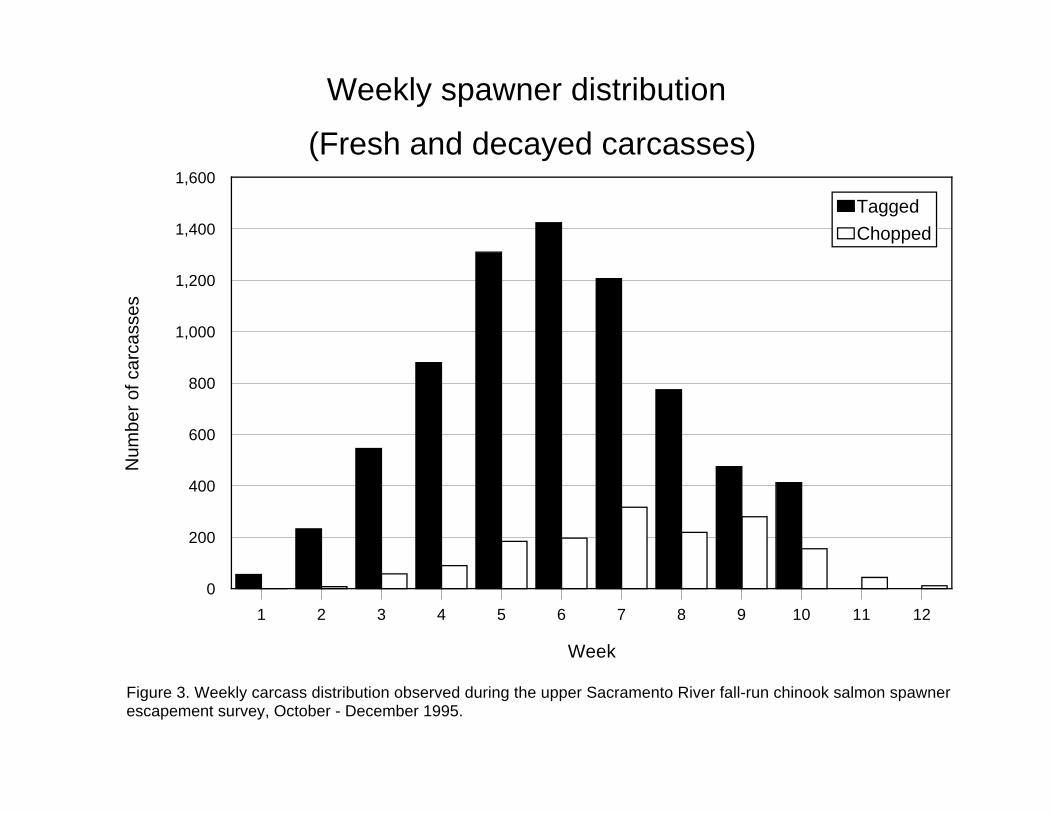
The number of carcasses observed steadily increased from the first week, peaked in the sixth week(November 5-10), and then declined each week afterwards (Table 3 and Figure 3).
6
Table 2. General survey information for the mainstem Sacramento River fall-run chinook salmon spawner escapement survey, October 1995 -December 1995.
Week DatesFlows(cfs)1/
Watertemperature
(oF)2/Carcasscount3/
1 Oct 1 - 7 6,500 55 55
2 Oct 8 - 14 5,400 55 240
3 Oct 15 - 21 4,800 55 602
4 Oct 22 - 28 4,800 54 969
5 Oct 29 - Nov 4 4,800 56 1,492
6 Nov 5 - 11 4,800 56 1,619
7 Nov 12 - 18 4,800 57 1,523
8 Nov 19 - 25 4,800 56 993
9 Nov 26 - Dec 2 4,800 55 753
10 Dec 3 - 9 4,800 56 500
11 Dec 10 - 16 4,800 54 74/, 5/
12 Dec 17 - 23 4,800 53 5/
Total 8,7531/ Measured discharge at Keswick Dam, US Bureau of Reclamation.2/ Weekly average of measurements recorded at Balls Ferry for days sampled.3/ Includes both adults and grilse4/ These were fresh carcasses measured and examined for ripeness but not included in the
tag-and-recapture study.5/ Only tag recaptures were recorded during weeks 11 and 12.
Spatial Distribution
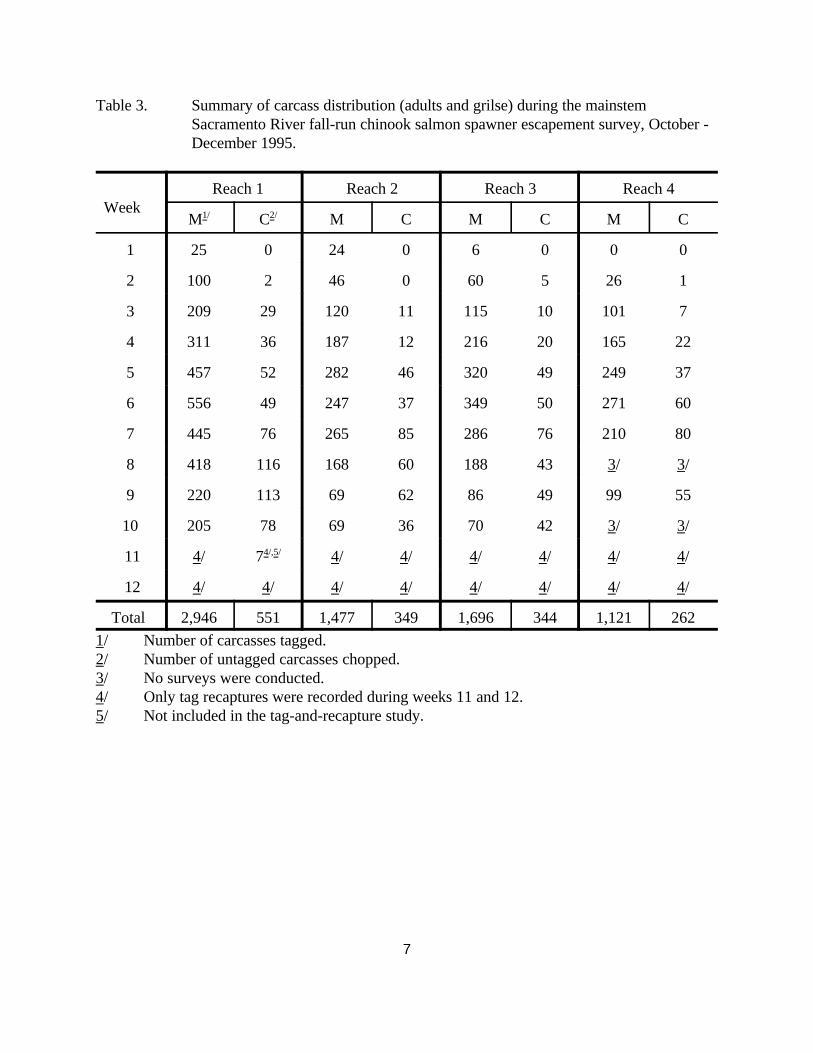
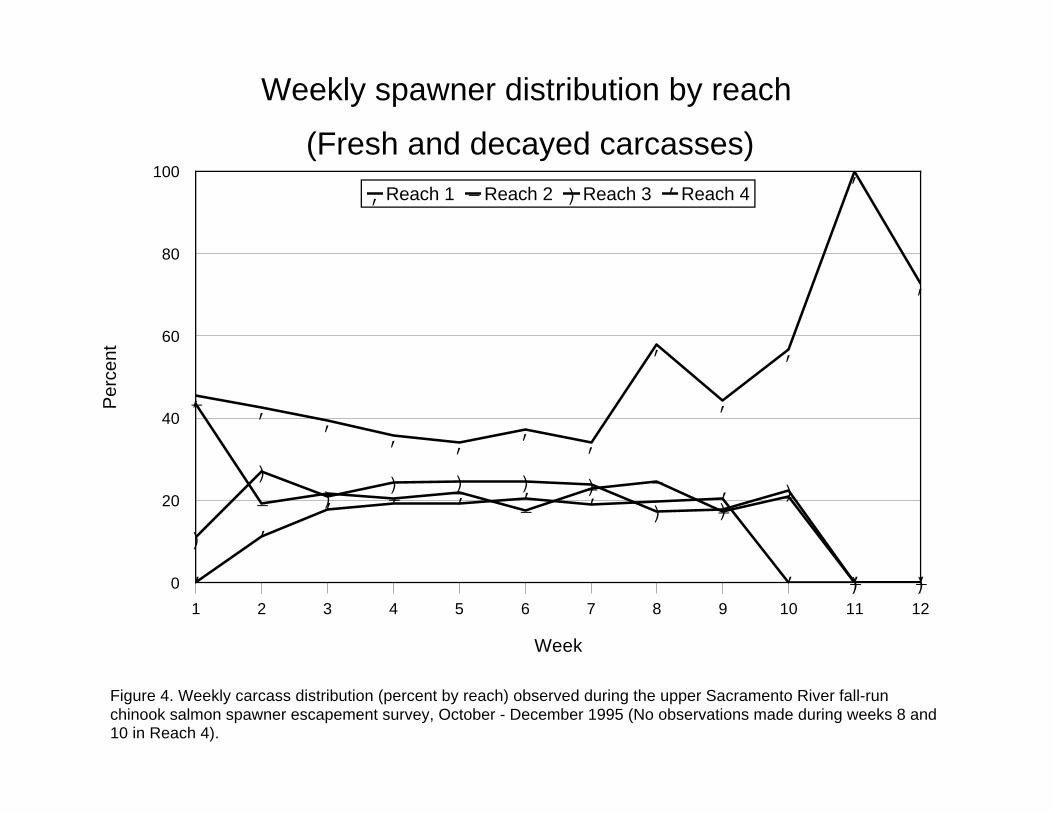
The greatest portion (40%) of carcasses was observed in Reach 1 (Table 3 and Figure 4). Twenty-one percent were observed in Reach 2, 23% in Reach 3, and 16% in Reach 4.
7
Table 3. Summary of carcass distribution (adults and grilse) during the mainstemSacramento River fall-run chinook salmon spawner escapement survey, October -December 1995.
Week
Reach 1 Reach 2 Reach 3 Reach 4
M1/ C2/ M C M C M C
1 25 0 24 0 6 0 0 0
2 100 2 46 0 60 5 26 1
3 209 29 120 11 115 10 101 7
4 311 36 187 12 216 20 165 22
5 457 52 282 46 320 49 249 37
6 556 49 247 37 349 50 271 60
7 445 76 265 85 286 76 210 80
8 418 116 168 60 188 43 3/ 3/
9 220 113 69 62 86 49 99 55
10 205 78 69 36 70 42 3/ 3/
11 4/ 74/,5/ 4/ 4/ 4/ 4/ 4/ 4/
12 4/ 4/ 4/ 4/ 4/ 4/ 4/ 4/
Total 2,946 551 1,477 349 1,696 344 1,121 2621/ Number of carcasses tagged.2/ Number of untagged carcasses chopped.3/ No surveys were conducted.4/ Only tag recaptures were recorded during weeks 11 and 12.5/ Not included in the tag-and-recapture study.
8
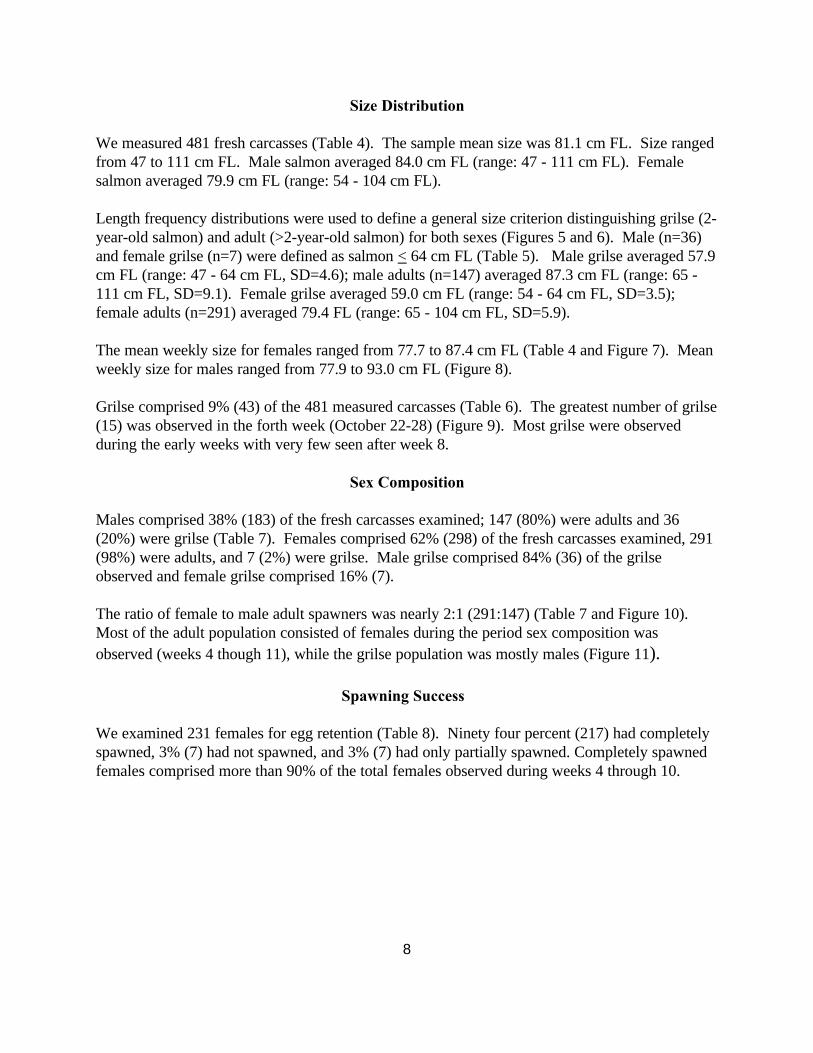
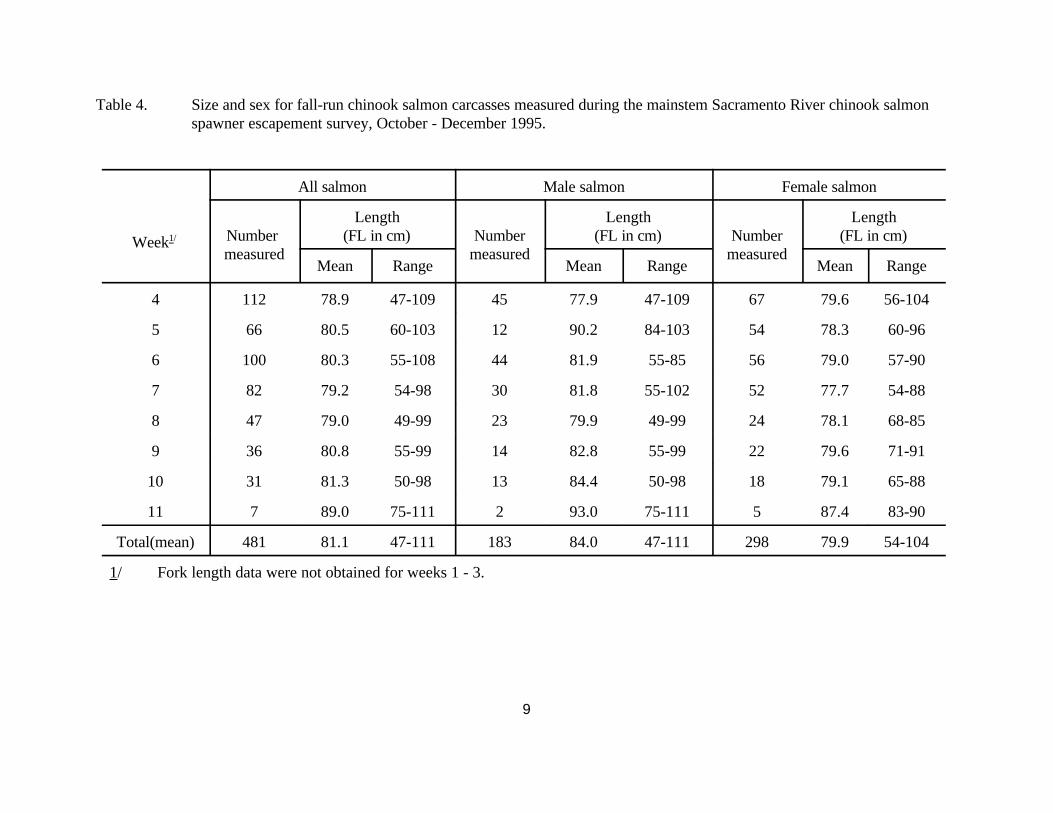
Size Distribution
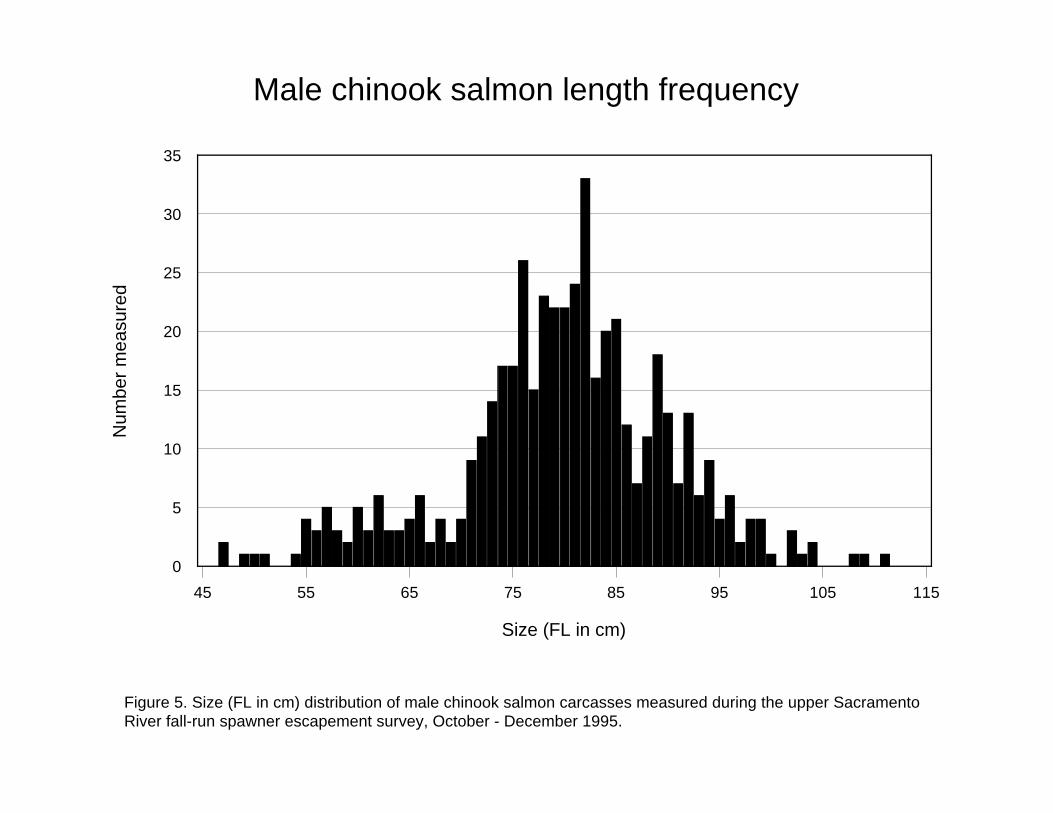
We measured 481 fresh carcasses (Table 4). The sample mean size was 81.1 cm FL. Size rangedfrom 47 to 111 cm FL. Male salmon averaged 84.0 cm FL (range: 47 - 111 cm FL). Femalesalmon averaged 79.9 cm FL (range: 54 - 104 cm FL).
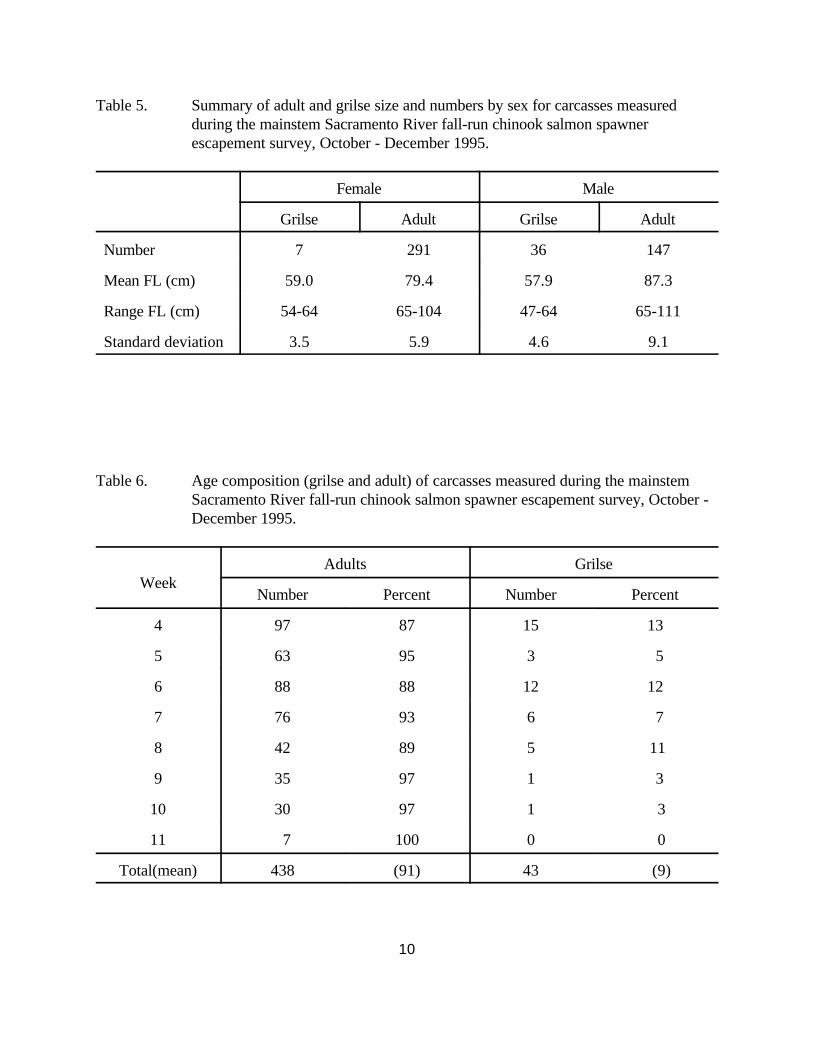
Length frequency distributions were used to define a general size criterion distinguishing grilse (2-year-old salmon) and adult (>2-year-old salmon) for both sexes (Figures 5 and 6). Male (n=36)and female grilse (n=7) were defined as salmon < 64 cm FL (Table 5). Male grilse averaged 57.9cm FL (range: 47 - 64 cm FL, SD=4.6); male adults (n=147) averaged 87.3 cm FL (range: 65 -111 cm FL, SD=9.1). Female grilse averaged 59.0 cm FL (range: 54 - 64 cm FL, SD=3.5);female adults (n=291) averaged 79.4 FL (range: 65 - 104 cm FL, SD=5.9).
The mean weekly size for females ranged from 77.7 to 87.4 cm FL (Table 4 and Figure 7). Meanweekly size for males ranged from 77.9 to 93.0 cm FL (Figure 8).
Grilse comprised 9% (43) of the 481 measured carcasses (Table 6). The greatest number of grilse(15) was observed in the forth week (October 22-28) (Figure 9). Most grilse were observedduring the early weeks with very few seen after week 8.
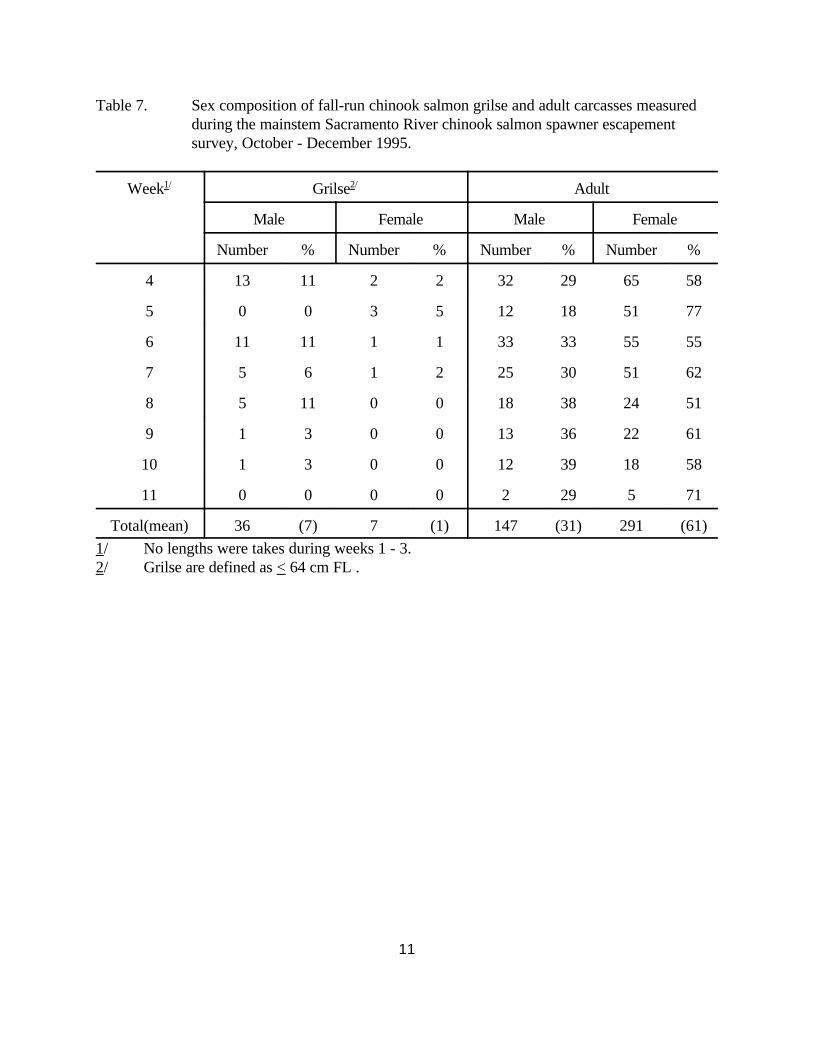
Sex Composition
Males comprised 38% (183) of the fresh carcasses examined; 147 (80%) were adults and 36(20%) were grilse (Table 7). Females comprised 62% (298) of the fresh carcasses examined, 291(98%) were adults, and 7 (2%) were grilse. Male grilse comprised 84% (36) of the grilseobserved and female grilse comprised 16% (7).
The ratio of female to male adult spawners was nearly 2:1 (291:147) (Table 7 and Figure 10). Most of the adult population consisted of females during the period sex composition wasobserved (weeks 4 though 11), while the grilse population was mostly males (Figure 11).
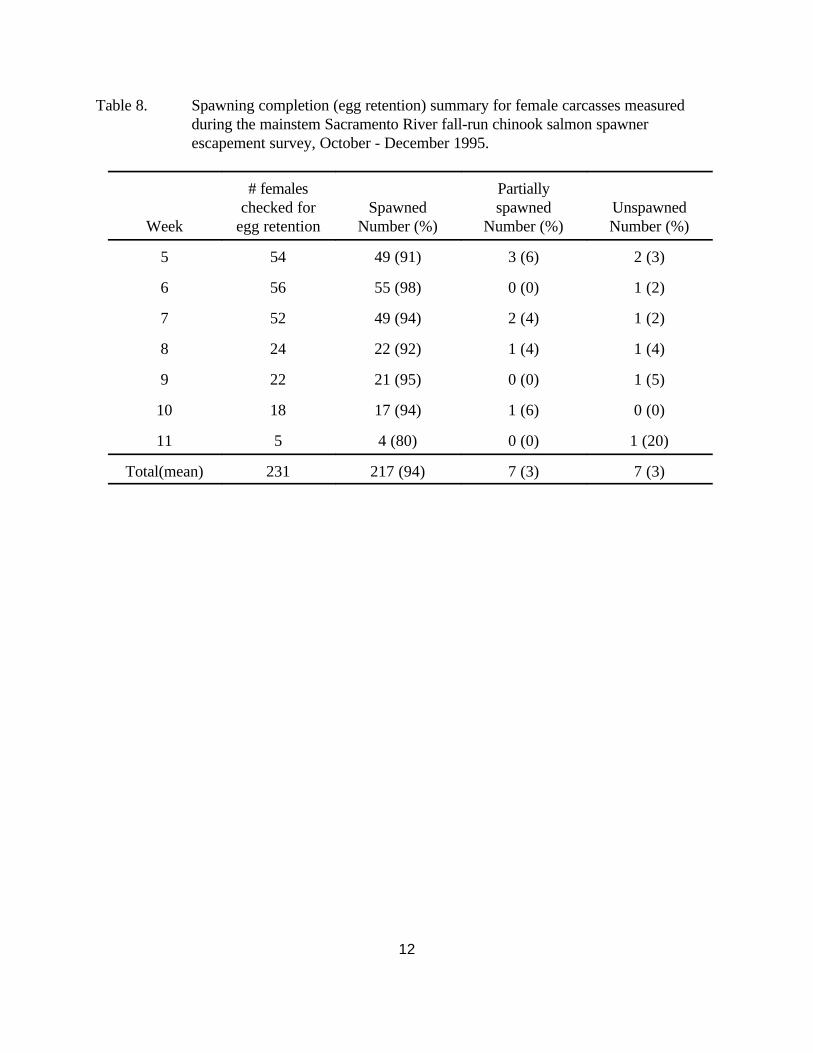
Spawning Success
We examined 231 females for egg retention (Table 8). Ninety four percent (217) had completelyspawned, 3% (7) had not spawned, and 3% (7) had only partially spawned. Completely spawnedfemales comprised more than 90% of the total females observed during weeks 4 through 10.
9
Table 4. Size and sex for fall-run chinook salmon carcasses measured during the mainstem Sacramento River chinook salmonspawner escapement survey, October - December 1995.
Week1/
All salmon Male salmon Female salmon
Number measured
Length(FL in cm) Number
measured
Length(FL in cm) Number
measured
Length(FL in cm)
Mean Range Mean Range Mean Range
4 112 78.9 47-109 45 77.9 47-109 67 79.6 56-104
5 66 80.5 60-103 12 90.2 84-103 54 78.3 60-96
6 100 80.3 55-108 44 81.9 55-85 56 79.0 57-90
7 82 79.2 54-98 30 81.8 55-102 52 77.7 54-88
8 47 79.0 49-99 23 79.9 49-99 24 78.1 68-85
9 36 80.8 55-99 14 82.8 55-99 22 79.6 71-91
10 31 81.3 50-98 13 84.4 50-98 18 79.1 65-88
11 7 89.0 75-111 2 93.0 75-111 5 87.4 83-90
Total(mean) 481 81.1 47-111 183 84.0 47-111 298 79.9 54-104
1/ Fork length data were not obtained for weeks 1 - 3.
10
Table 5. Summary of adult and grilse size and numbers by sex for carcasses measuredduring the mainstem Sacramento River fall-run chinook salmon spawnerescapement survey, October - December 1995.
Female Male
Grilse Adult Grilse Adult
Number 7 291 36 147
Mean FL (cm) 59.0 79.4 57.9 87.3
Range FL (cm) 54-64 65-104 47-64 65-111
Standard deviation 3.5 5.9 4.6 9.1
Table 6. Age composition (grilse and adult) of carcasses measured during the mainstemSacramento River fall-run chinook salmon spawner escapement survey, October -December 1995.
WeekAdults Grilse
Number Percent Number Percent
4 97 87 15 13
5 63 95 3 5
6 88 88 12 12
7 76 93 6 7
8 42 89 5 11
9 35 97 1 3
10 30 97 1 3
11 7 100 0 0
Total(mean) 438 (91) 43 (9)
11
Table 7. Sex composition of fall-run chinook salmon grilse and adult carcasses measuredduring the mainstem Sacramento River chinook salmon spawner escapementsurvey, October - December 1995.
Week1/ Grilse2/ Adult
Male Female Male Female
Number % Number % Number % Number %
4 13 11 2 2 32 29 65 58
5 0 0 3 5 12 18 51 77
6 11 11 1 1 33 33 55 55
7 5 6 1 2 25 30 51 62
8 5 11 0 0 18 38 24 51
9 1 3 0 0 13 36 22 61
10 1 3 0 0 12 39 18 58
11 0 0 0 0 2 29 5 71
Total(mean) 36 (7) 7 (1) 147 (31) 291 (61)1/ No lengths were takes during weeks 1 - 3.2/ Grilse are defined as < 64 cm FL .
12
Table 8. Spawning completion (egg retention) summary for female carcasses measuredduring the mainstem Sacramento River fall-run chinook salmon spawnerescapement survey, October - December 1995.
Week
# femaleschecked for
egg retentionSpawned
Number (%)
Partiallyspawned
Number (%)UnspawnedNumber (%)
5 54 49 (91) 3 (6) 2 (3)
6 56 55 (98) 0 (0) 1 (2)
7 52 49 (94) 2 (4) 1 (2)
8 24 22 (92) 1 (4) 1 (4)
9 22 21 (95) 0 (0) 1 (5)
10 18 17 (94) 1 (6) 0 (0)
11 5 4 (80) 0 (0) 1 (20)
Total(mean) 231 217 (94) 7 (3) 7 (3)
13
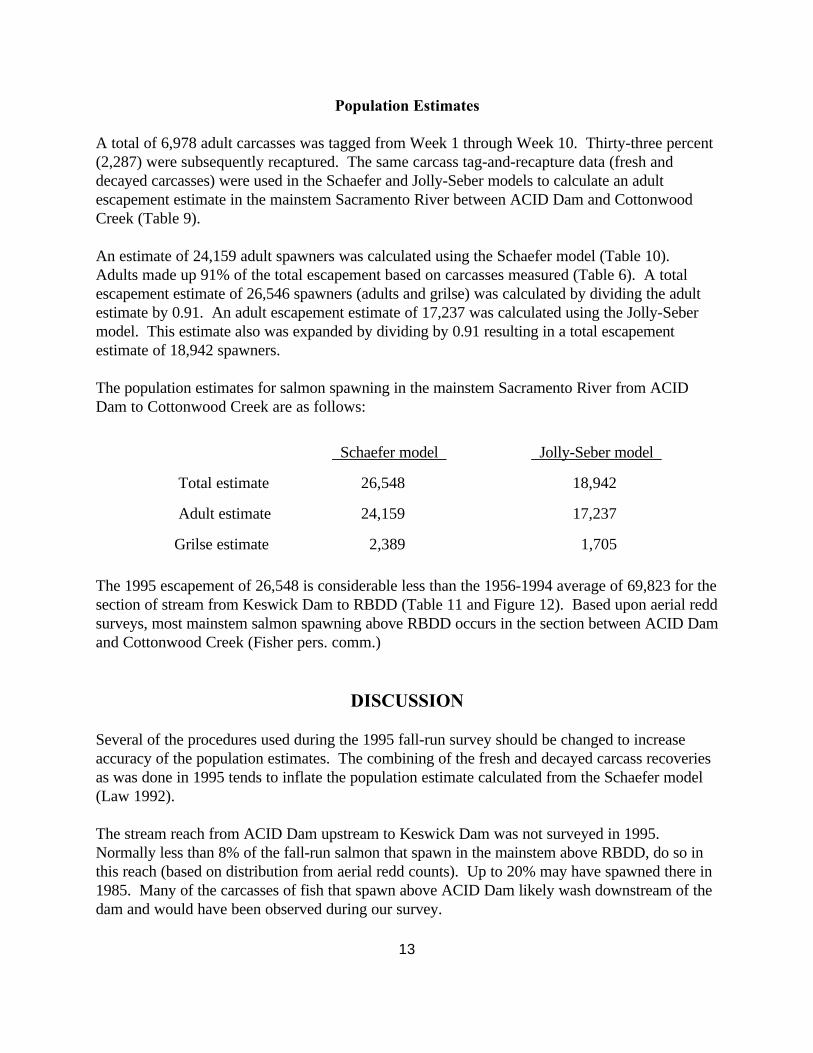
Population Estimates
A total of 6,978 adult carcasses was tagged from Week 1 through Week 10. Thirty-three percent(2,287) were subsequently recaptured. The same carcass tag-and-recapture data (fresh anddecayed carcasses) were used in the Schaefer and Jolly-Seber models to calculate an adultescapement estimate in the mainstem Sacramento River between ACID Dam and CottonwoodCreek (Table 9).
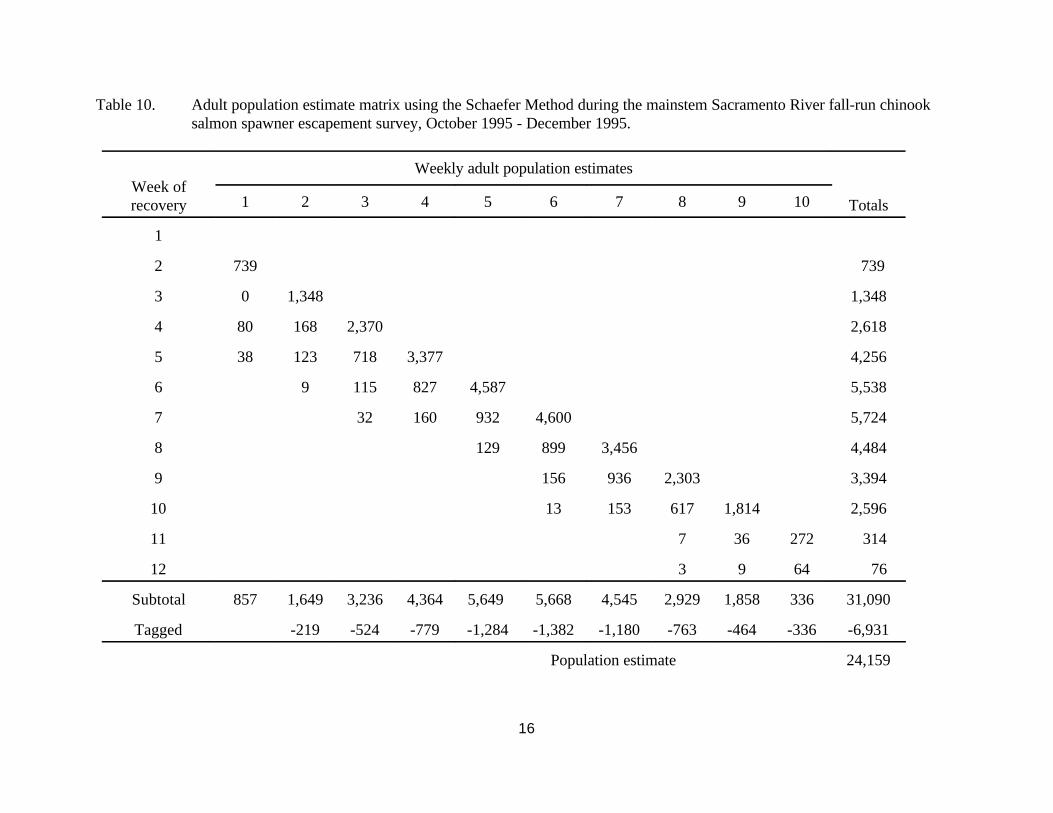
An estimate of 24,159 adult spawners was calculated using the Schaefer model (Table 10). Adults made up 91% of the total escapement based on carcasses measured (Table 6). A totalescapement estimate of 26,546 spawners (adults and grilse) was calculated by dividing the adultestimate by 0.91. An adult escapement estimate of 17,237 was calculated using the Jolly-Sebermodel. This estimate also was expanded by dividing by 0.91 resulting in a total escapementestimate of 18,942 spawners.
The population estimates for salmon spawning in the mainstem Sacramento River from ACIDDam to Cottonwood Creek are as follows:
Schaefer model Jolly-Seber model
Total estimate 26,548 18,942
Adult estimate 24,159 17,237
Grilse estimate 2,389 1,705
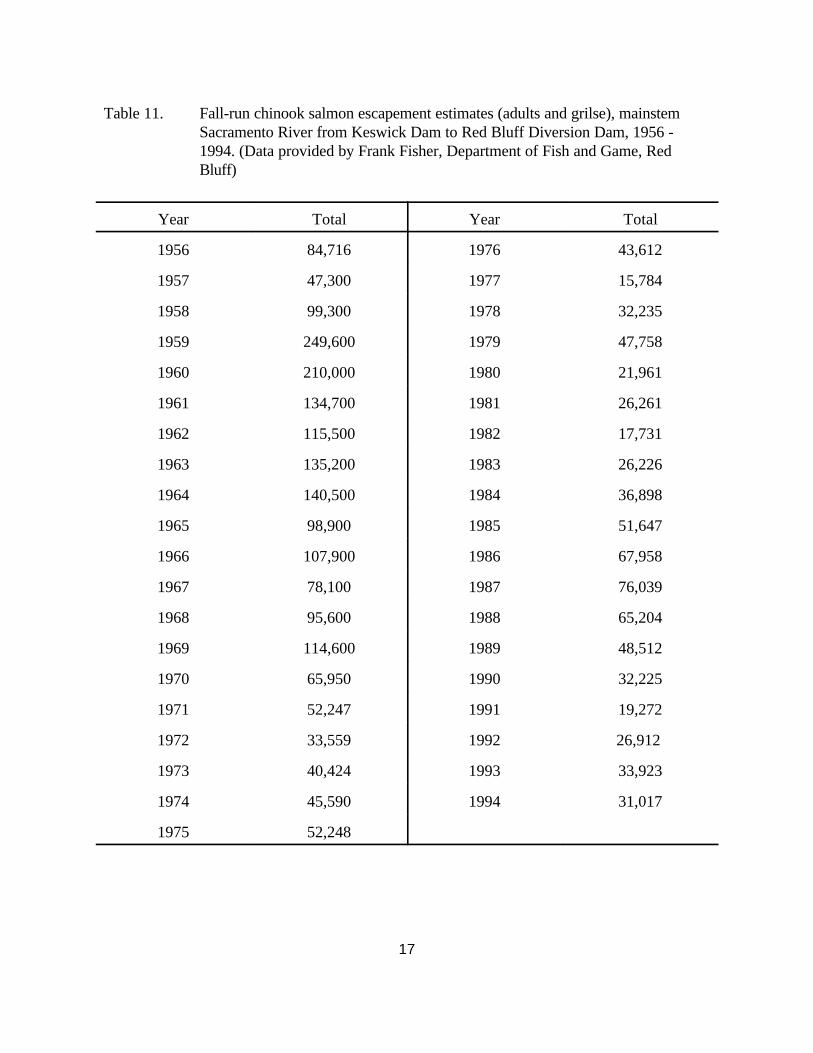
The 1995 escapement of 26,548 is considerable less than the 1956-1994 average of 69,823 for thesection of stream from Keswick Dam to RBDD (Table 11 and Figure 12). Based upon aerial reddsurveys, most mainstem salmon spawning above RBDD occurs in the section between ACID Damand Cottonwood Creek (Fisher pers. comm.)
DISCUSSION
Several of the procedures used during the 1995 fall-run survey should be changed to increaseaccuracy of the population estimates. The combining of the fresh and decayed carcass recoveriesas was done in 1995 tends to inflate the population estimate calculated from the Schaefer model(Law 1992).
The stream reach from ACID Dam upstream to Keswick Dam was not surveyed in 1995. Normally less than 8% of the fall-run salmon that spawn in the mainstem above RBDD, do so inthis reach (based on distribution from aerial redd counts). Up to 20% may have spawned there in1985. Many of the carcasses of fish that spawn above ACID Dam likely wash downstream of thedam and would have been observed during our survey.
14
Based on Law’s analysis (Law 1992), the Schaefer model will over estimate escapement whencarcass “survival” (carry-over from week-to-week) and recovery rates are equivalent to thoseobserved on the mainstem Sacramento River during 1995. Similarly, based on Law’s (1992)analysis, the Jolly-Seber model will slightly under estimate the mainstem Sacramento Riverescapement.
We recommend that the following changes be included in future survey efforts to improvepopulation estimates:
1. Categorize all tagged carcasses as fresh or decayed. When the tagged carcasses arelater recovered, note how they were originally categorized.
2. Note all carcasses (tagged and untagged) observed during last 2 weeks of thesurvey.
3. Survey reach of stream from Keswick Dam downstream to ACID Dam.
ACKNOWLEDGMENTS
The California Department of Fish and Game recognizes the efforts of Jon Ferguson, Vance law,Jeff Sheele, Sean Stash, and Lisa Portune. Their efforts in collection of field data and maintenanceof data bases are greatly appreciated. The data collection was funded by the FWS as a part of acooperative agreement between the Service and DFG as authorized by the CVPIA (P.L. 102-575).
15
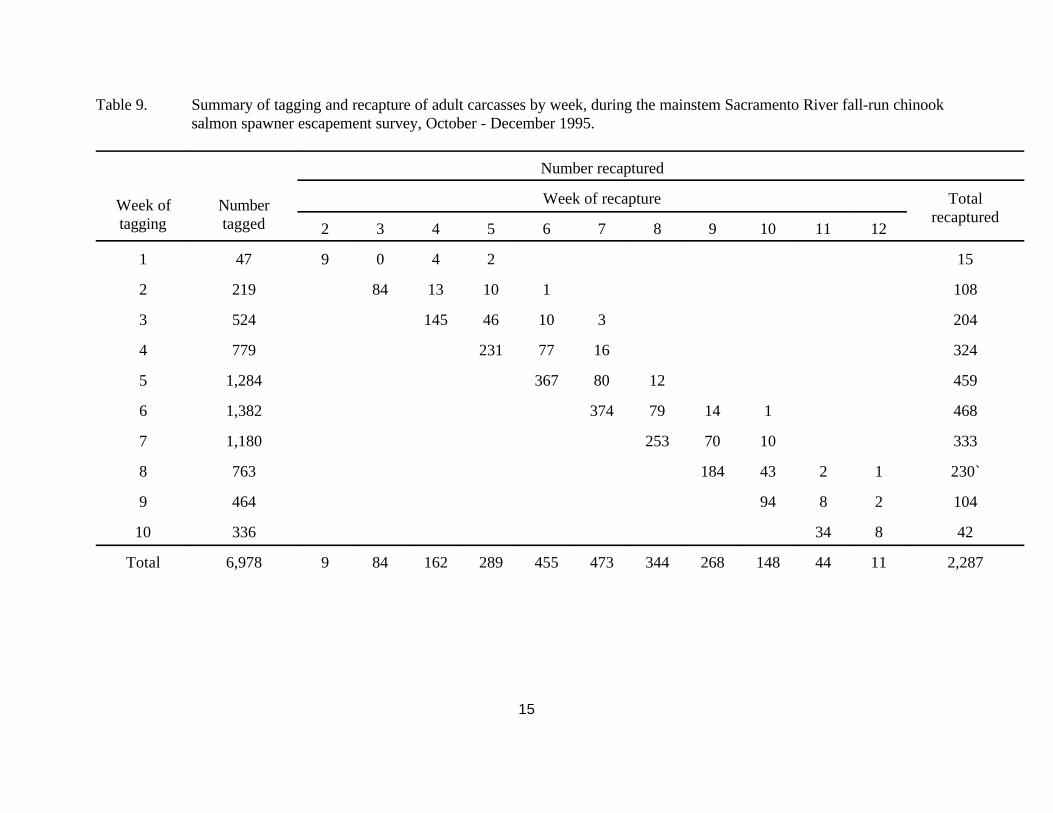
Table 9. Summary of tagging and recapture of adult carcasses by week, during the mainstem Sacramento River fall-run chinooksalmon spawner escapement survey, October - December 1995.
Week oftagging
Numbertagged
Number recaptured
Week of recapture Totalrecaptured
2 3 4 5 6 7 8 9 10 11 12
1 47 9 0 4 2 15
2 219 84 13 10 1 108
3 524 145 46 10 3 204
4 779 231 77 16 324
5 1,284 367 80 12 459
6 1,382 374 79 14 1 468
7 1,180 253 70 10 333
8 763 184 43 2 1 230`
9 464 94 8 2 104
10 336 34 8 42
Total 6,978 9 84 162 289 455 473 344 268 148 44 11 2,287
16
Table 10. Adult population estimate matrix using the Schaefer Method during the mainstem Sacramento River fall-run chinooksalmon spawner escapement survey, October 1995 - December 1995.
Week ofrecovery
Weekly adult population estimates
Totals1 2 3 4 5 6 7 8 9 10
1
2 739 739
3 0 1,348 1,348
4 80 168 2,370 2,618
5 38 123 718 3,377 4,256
6 9 115 827 4,587 5,538
7 32 160 932 4,600 5,724
8 129 899 3,456 4,484
9 156 936 2,303 3,394
10 13 153 617 1,814 2,596
11 7 36 272 314
12 3 9 64 76
Subtotal 857 1,649 3,236 4,364 5,649 5,668 4,545 2,929 1,858 336 31,090
Tagged -219 -524 -779 -1,284 -1,382 -1,180 -763 -464 -336 -6,931
Population estimate 24,159
17
Table 11. Fall-run chinook salmon escapement estimates (adults and grilse), mainstemSacramento River from Keswick Dam to Red Bluff Diversion Dam, 1956 -1994. (Data provided by Frank Fisher, Department of Fish and Game, RedBluff)
Year Total Year Total
1956 84,716 1976 43,612
1957 47,300 1977 15,784
1958 99,300 1978 32,235
1959 249,600 1979 47,758
1960 210,000 1980 21,961
1961 134,700 1981 26,261
1962 115,500 1982 17,731
1963 135,200 1983 26,226
1964 140,500 1984 36,898
1965 98,900 1985 51,647
1966 107,900 1986 67,958
1967 78,100 1987 76,039
1968 95,600 1988 65,204
1969 114,600 1989 48,512
1970 65,950 1990 32,225
1971 52,247 1991 19,272
1972 33,559 1992 26,912
1973 40,424 1993 33,923
1974 45,590 1994 31,017
1975 52,248
18
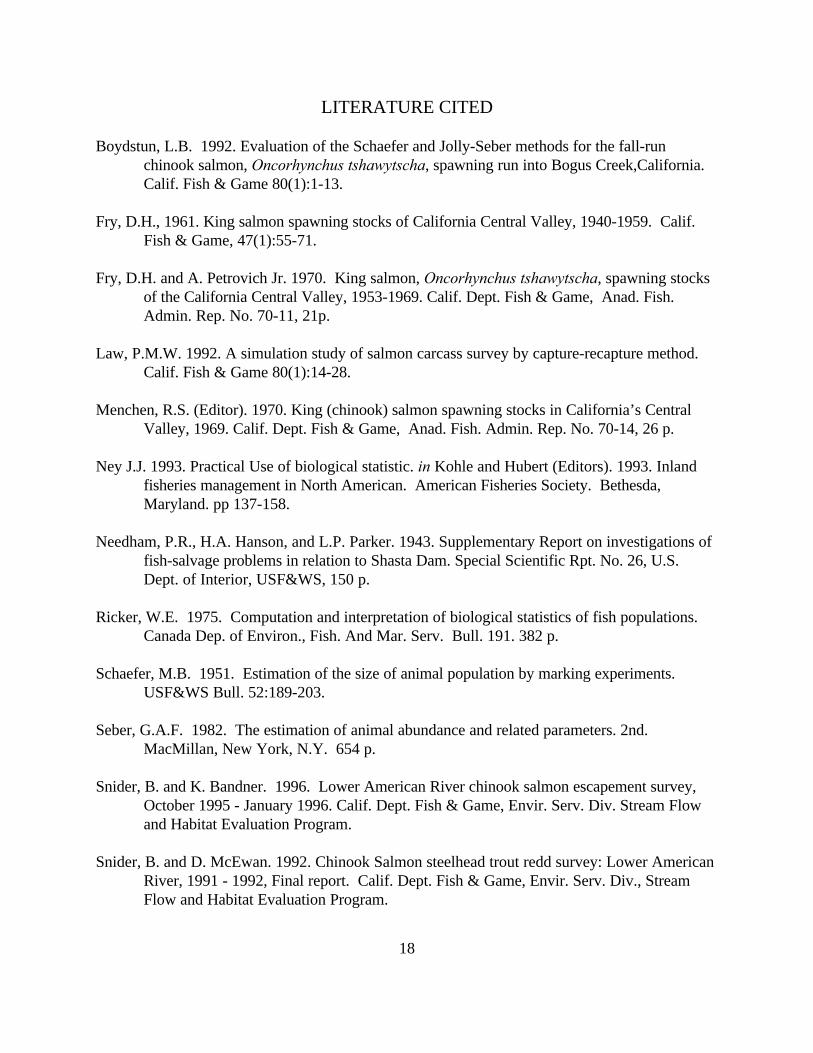
LITERATURE CITED
Boydstun, L.B. 1992. Evaluation of the Schaefer and Jolly-Seber methods for the fall-runchinook salmon, Oncorhynchus tshawytscha, spawning run into Bogus Creek,California.Calif. Fish & Game 80(1):1-13.
Fry, D.H., 1961. King salmon spawning stocks of California Central Valley, 1940-1959. Calif.Fish & Game, 47(1):55-71.
Fry, D.H. and A. Petrovich Jr. 1970. King salmon, Oncorhynchus tshawytscha, spawning stocksof the California Central Valley, 1953-1969. Calif. Dept. Fish & Game, Anad. Fish.Admin. Rep. No. 70-11, 21p.
Law, P.M.W. 1992. A simulation study of salmon carcass survey by capture-recapture method.Calif. Fish & Game 80(1):14-28.
Menchen, R.S. (Editor). 1970. King (chinook) salmon spawning stocks in California’s Central
Valley, 1969. Calif. Dept. Fish & Game, Anad. Fish. Admin. Rep. No. 70-14, 26 p.
Ney J.J. 1993. Practical Use of biological statistic. in Kohle and Hubert (Editors). 1993. Inlandfisheries management in North American. American Fisheries Society. Bethesda,Maryland. pp 137-158.
Needham, P.R., H.A. Hanson, and L.P. Parker. 1943. Supplementary Report on investigations offish-salvage problems in relation to Shasta Dam. Special Scientific Rpt. No. 26, U.S.Dept. of Interior, USF&WS, 150 p.
Ricker, W.E. 1975. Computation and interpretation of biological statistics of fish populations.Canada Dep. of Environ., Fish. And Mar. Serv. Bull. 191. 382 p.
Schaefer, M.B. 1951. Estimation of the size of animal population by marking experiments.USF&WS Bull. 52:189-203.
Seber, G.A.F. 1982. The estimation of animal abundance and related parameters. 2nd.MacMillan, New York, N.Y. 654 p.
Snider, B. and K. Bandner. 1996. Lower American River chinook salmon escapement survey,October 1995 - January 1996. Calif. Dept. Fish & Game, Envir. Serv. Div. Stream Flowand Habitat Evaluation Program.
Snider, B. and D. McEwan. 1992. Chinook Salmon steelhead trout redd survey: Lower AmericanRiver, 1991 - 1992, Final report. Calif. Dept. Fish & Game, Envir. Serv. Div., StreamFlow and Habitat Evaluation Program.
19
Snider, B., A.J. Chappelle, and N. Villa. 1995. Lower American River chinook salmonescapement survey, October 1993 - January 1994. Calif. Dept. Fish & Game, Envir. Serv.Div. Stream Flow & Habitat Evaluation Program.
Snider, B., K. Urquhart, D. McEwan, and M. Munos. 1993. Chinook salmon redd survey, lowerAmerican River, Fall 1992. Calif. Dept. Fish & Game, Envir. Serv. Div., Stream Flow &Habitat Evaluation Program.
Snider, B. And K. Vyverberg. 1995. Chinook salmon redd survey lower American River Fall,1993. Calif. Dept. Fish & Game, Envir. Serv. Div., Stream Flow & Habitat EvaluationProgram.
Taylor, S.N. (Editor). 1974. King Chinook) salmon spawning stocks in California’s CentralValley, 1973. Calif. Dept. Fish & Game, Anad. Fish. Admin. Rep. No. 74-12. 32 p.

FIGURES
Mean daily flow
Figure 2. Mean daily flow measured at Keswick Dam during the 1995 upper Sacramento River fall-run chinook salmon spawner escapement survey, October - December 1995.
Oct 1 Oct 8 Oct 15 Oct 22 Oct 29 Nov 5 Nov 12Nov 19Nov 26 Dec 30
1
2
3
4
5
6
7
Flo
w (
cfs)
Tho
usan
ds
Weekly spawner distribution
(Fresh and decayed carcasses)
Figure 3. Weekly carcass distribution observed during the upper Sacramento River fall-run chinook salmon spawner escapement survey, October - December 1995.
1 2 3 4 5 6 7 8 9 10 11 12
Week
0
200
400
600
800
1,000
1,200
1,400
1,600
Num
ber
of c
arca
sses
Tagged
Chopped
Weekly spawner distribution by reach
(Fresh and decayed carcasses)
Figure 4. Weekly carcass distribution (percent by reach) observed during the upper Sacramento River fall-run chinook salmon spawner escapement survey, October - December 1995 (No observations made during weeks 8 and 10 in Reach 4).
' '
'
' ' ' ' ' '
' '
)
)
)
)) ) ) )
) ))
)
-
-
-- - -
-- -
--
-
,
,
,,
, ,,
,
,
,
,
,
1 2 3 4 5 6 7 8 9 10 11 12
Week
0
20
40
60
80
100
Per
cent
Reach 1 Reach 2 Reach 3 Reach 4, - ) '
Male chinook salmon length frequency
Figure 5. Size (FL in cm) distribution of male chinook salmon carcasses measured during the upper Sacramento River fall-run spawner escapement survey, October - December 1995.
45 55 65 75 85 95 105 115
Size (FL in cm)
0
5
10
15
20
25
30
35
Num
ber
mea
sure
d
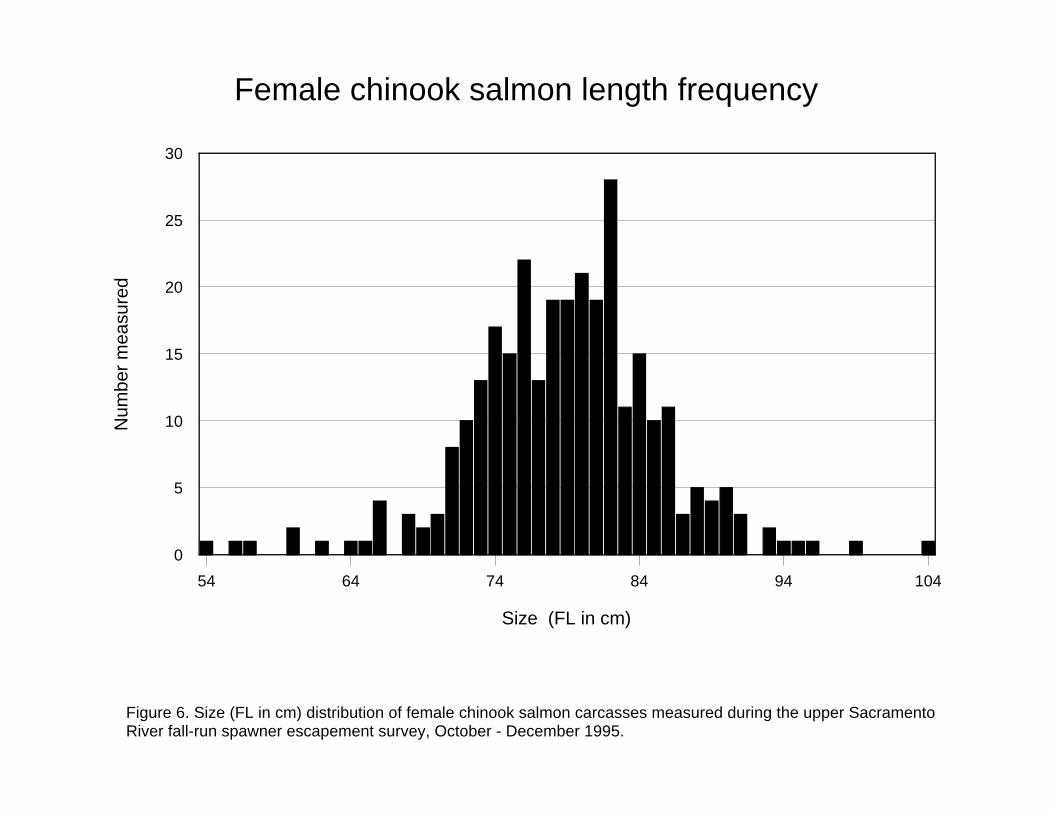
Female chinook salmon length frequency
Figure 6. Size (FL in cm) distribution of female chinook salmon carcasses measured during the upper Sacramento River fall-run spawner escapement survey, October - December 1995.
54 64 74 84 94 104
Size (FL in cm)
0
5
10
15
20
25
30
Num
ber
mea
sure
d
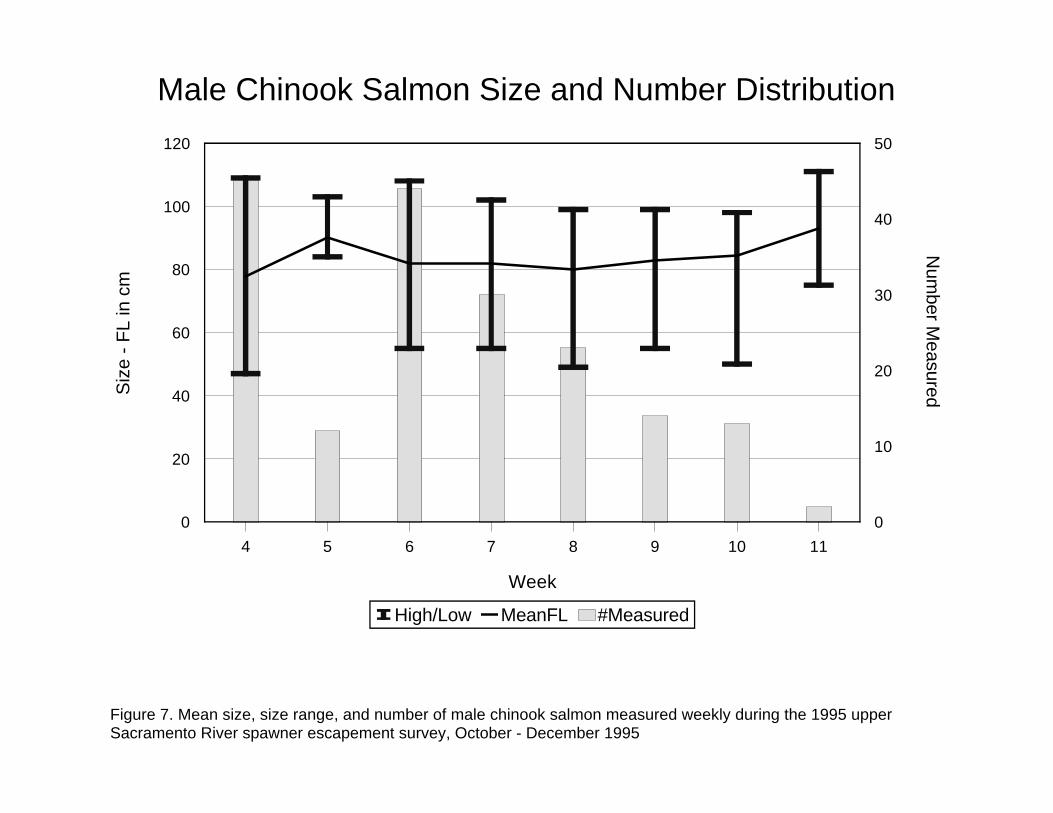
Male Chinook Salmon Size and Number Distribution
Figure 7. Mean size, size range, and number of male chinook salmon measured weekly during the 1995 upper Sacramento River spawner escapement survey, October - December 1995
4 5 6 7 8 9 10 11
Week
0
20
40
60
80
100
120S
ize
- F
L in
cm
0
10
20
30
40
50
Num
ber Measured
High/Low MeanFL #Measured
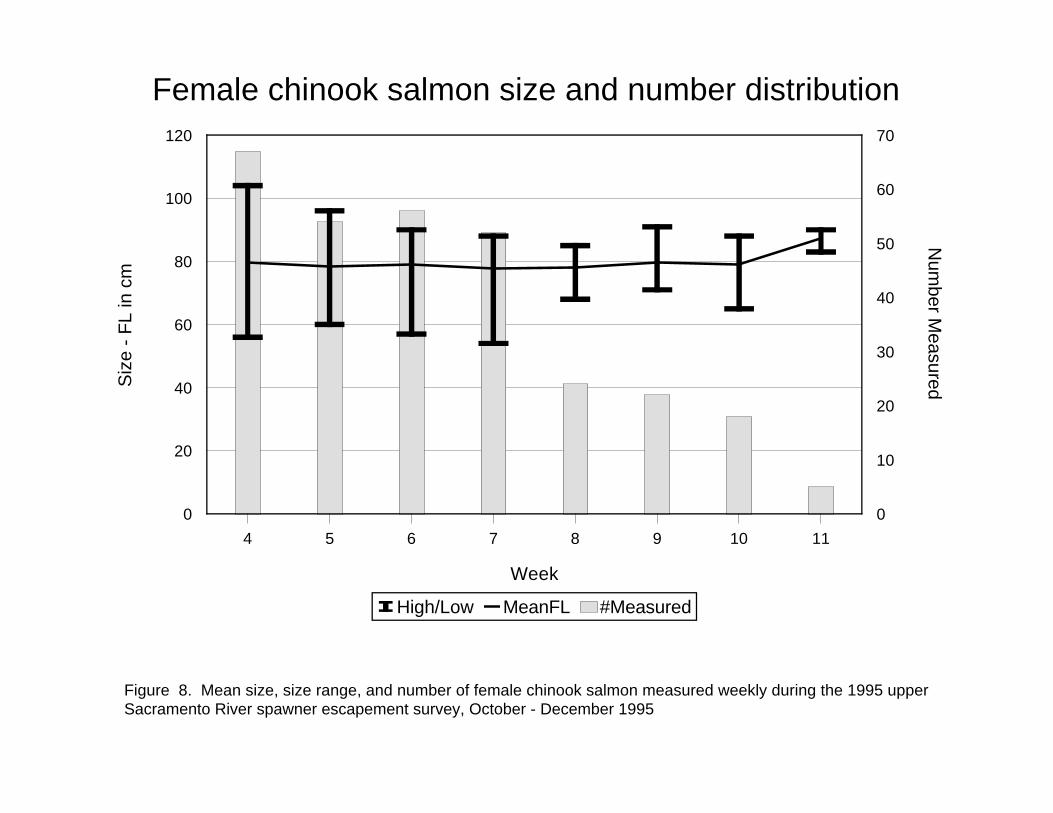
Female chinook salmon size and number distribution
Figure 8. Mean size, size range, and number of female chinook salmon measured weekly during the 1995 upper Sacramento River spawner escapement survey, October - December 1995
4 5 6 7 8 9 10 11
Week
0
20
40
60
80
100
120S
ize
- F
L in
cm
0
10
20
30
40
50
60
70N
umber M
easured
High/Low MeanFL #Measured
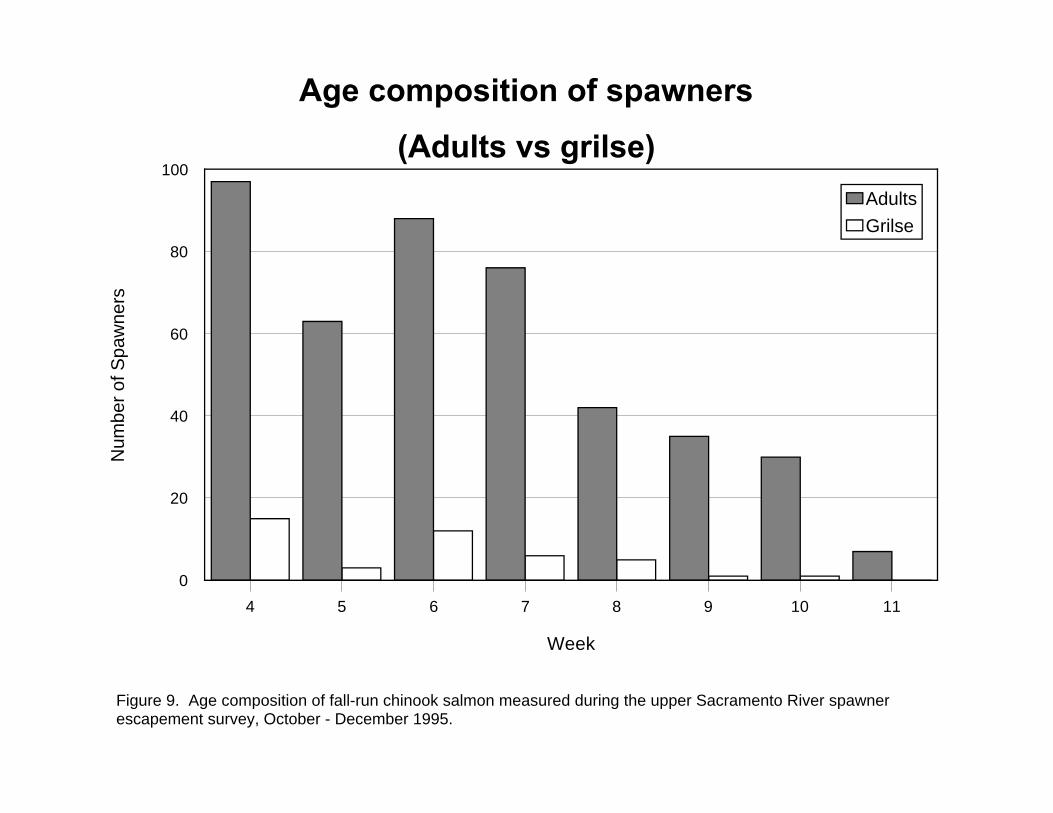
Age composition of spawners
(Adults vs grilse)
Figure 9. Age composition of fall-run chinook salmon measured during the upper Sacramento River spawner escapement survey, October - December 1995.
4 5 6 7 8 9 10 11
Week
0
20
40
60
80
100
Num
ber
of S
paw
ners
Adults
Grilse
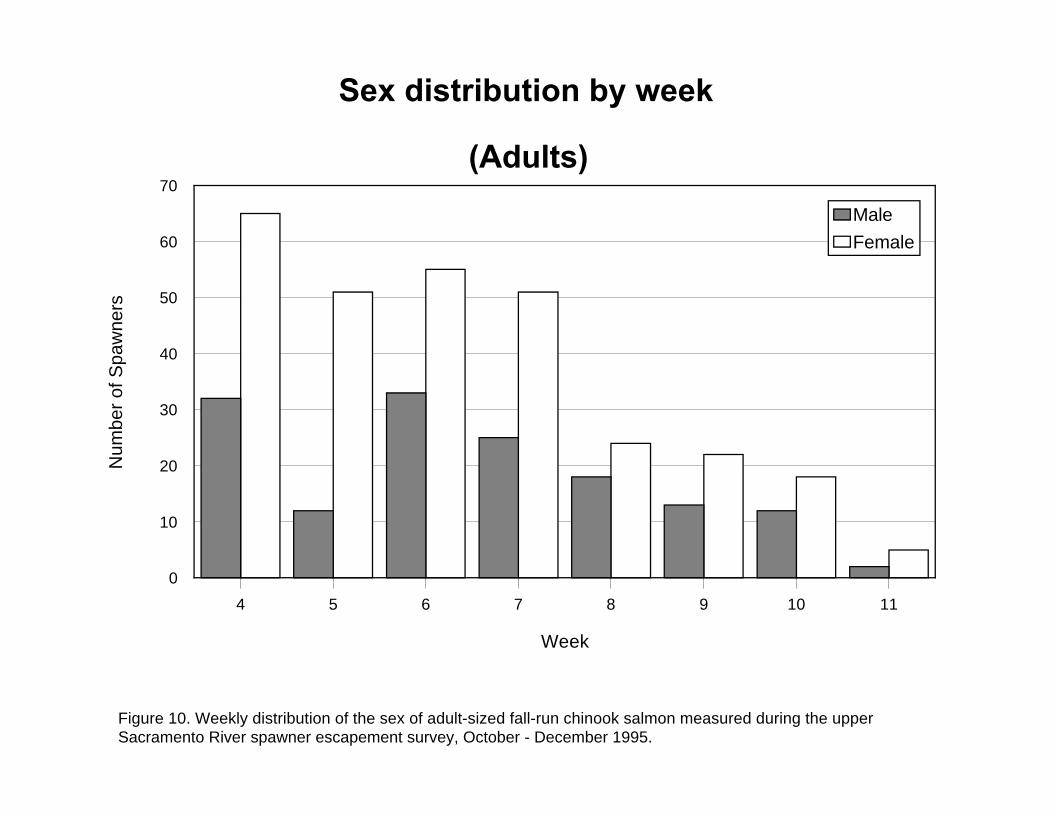
Sex distribution by week
(Adults)
Figure 10. Weekly distribution of the sex of adult-sized fall-run chinook salmon measured during the upper Sacramento River spawner escapement survey, October - December 1995.
4 5 6 7 8 9 10 11
Week
0
10
20
30
40
50
60
70
Num
ber
of S
paw
ners
Male
Female
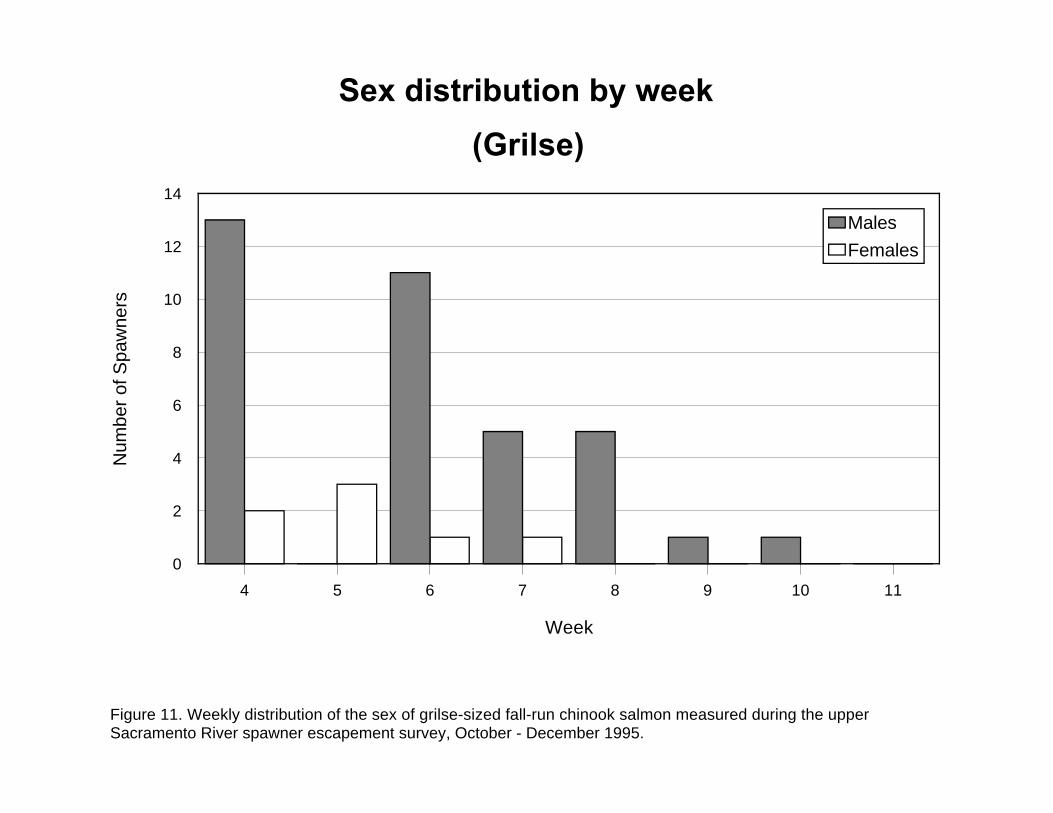
Sex distribution by week
(Grilse)
Figure 11. Weekly distribution of the sex of grilse-sized fall-run chinook salmon measured during the upper Sacramento River spawner escapement survey, October - December 1995.
4 5 6 7 8 9 10 11
Week
0
2
4
6
8
10
12
14
Num
ber
of S
paw
ners
Males
Females
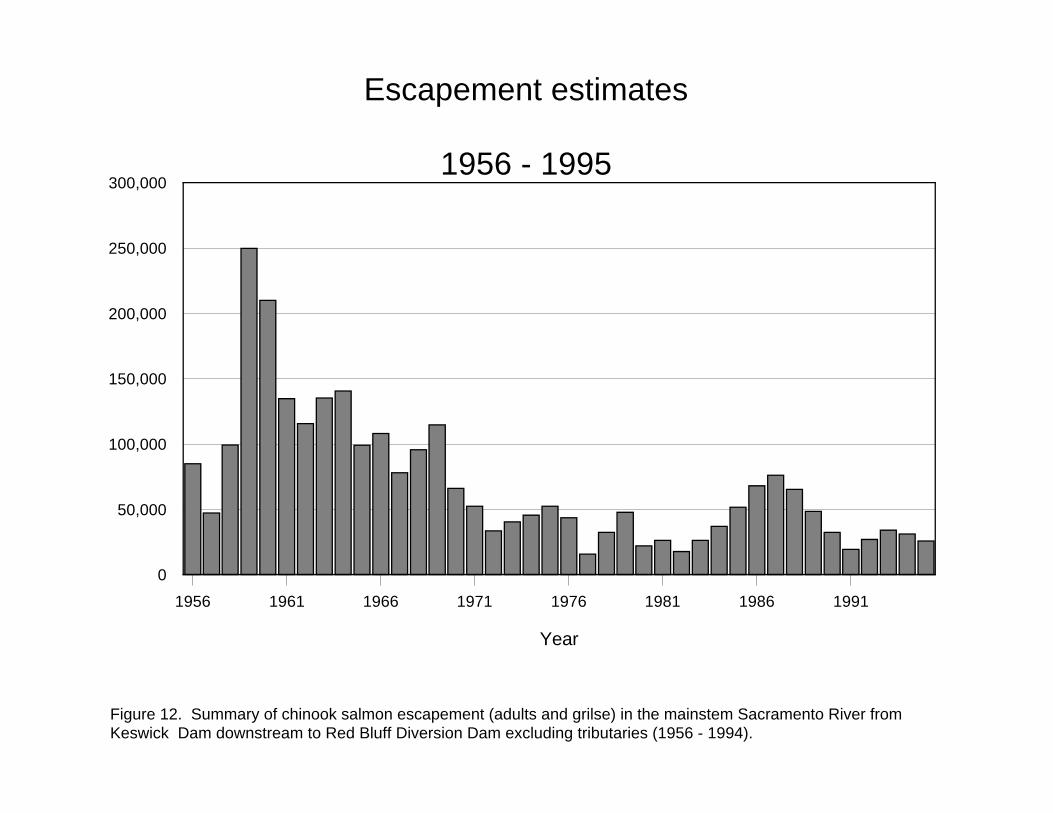
Escapement estimates
1956 - 1995
Figure 12. Summary of chinook salmon escapement (adults and grilse) in the mainstem Sacramento River from Keswick Dam downstream to Red Bluff Diversion Dam excluding tributaries (1956 - 1994).
1956 1961 1966 1971 1976 1981 1986 1991
Year
0
50,000
100,000
150,000
200,000
250,000
300,000
Recommended