ZONE SYSTEMPHOTOGRAPHY
FILM & DIGITALTECHNIQUES FOR
Amherst Media®PUBLISHER OF PHOTOGRAPHY BOOKS
DR. GLENN RAND
Copyright © 2008 by Glenn Rand.
All photographs by the author unless otherwise noted.
Front cover photograph by Glenn Rand.Back cover photograph by Christopher Broughton.
All rights reserved.
Published by:Amherst Media, Inc.P.O. Box 586Buffalo, N.Y. 14226Fax: 716-874-4508www.AmherstMedia.com
Publisher: Craig AlesseSenior Editor/Production Manager: Michelle PerkinsAssistant Editor: Barbara A. Lynch-Johnt
ISBN-13: 978-1-58428-227-3Library of Congress Control Number: 2007942654
Printed in Korea.10 9 8 7 6 5 4 3 2 1
No part of this publication may be reproduced, stored, or transmitted in any form or by any means, electronic, me-chanical, photocopied, recorded or otherwise, without prior written consent from the publisher.
Notice of Disclaimer: The information contained in this book is based on the author’s experience and opinions. Theauthor and publisher will not be held liable for the use or misuse of the information in this book.
About the Author . . . . . . . . . . . . . . . . . . . . . . . . .5About the Contributors . . . . . . . . . . . . . . . . . . . . .5
INTRODUCTION . . . . . . . . . . . . . . . . . . . . . . . . . . .7The Concept . . . . . . . . . . . . . . . . . . . . . . . . . . . .8
1. GETTING STARTED . . . . . . . . . . . . . . . . . . . . . .9Variables and Constants . . . . . . . . . . . . . . . . . . . .9Controlling Variables . . . . . . . . . . . . . . . . . . . . .10Aperture and Shutter Speed Calibration . . . . .10Film Speed Test . . . . . . . . . . . . . . . . . . . . . . .10
2. UNDERSTANDING LIGHT . . . . . . . . . . . . . . . .19Color and Tonality . . . . . . . . . . . . . . . . . . . . . . .21“Seeing” the Scene:Human Vision vs. Photography . . . . . . . . . . .23
Qualities of Light . . . . . . . . . . . . . . . . . . . . . . . .25Reflected Light . . . . . . . . . . . . . . . . . . . . . . .25Specular vs. Diffuse Light . . . . . . . . . . . . . . . .27Sweet Light . . . . . . . . . . . . . . . . . . . . . . . . . .28
3. THE ZONE SCALE . . . . . . . . . . . . . . . . . . . . . .29Dark Zones (0, I, II) . . . . . . . . . . . . . . . . . . . . .30Zone 0 (Black) . . . . . . . . . . . . . . . . . . . . . . . .30Zone I (Near Black) . . . . . . . . . . . . . . . . . . . .31Zone II (Patterned Darkness) . . . . . . . . . . . . .31
Detail Zones (Zones III, IV, V, VI, and VII) . . .32Zone III (Shadow Detail) . . . . . . . . . . . . . . . .32Zone IV (Dark Middle Gray) . . . . . . . . . . . . .32Zone V (Middle Gray) . . . . . . . . . . . . . . . . . .32Zone VI (Light Middle Gray) . . . . . . . . . . . . .34
Zone VII (Highlight Detail) . . . . . . . . . . . . . .34Highlight Zones (Zones VIII, IX, and X) . . . . . .35Zone VIII (Patterned Highlight) . . . . . . . . . .35Zone IX (Near White) . . . . . . . . . . . . . . . . . .36Zone X (White) . . . . . . . . . . . . . . . . . . . . . . .36
4. ZONE PLACEMENT . . . . . . . . . . . . . . . . . . . . .39The Law of Reciprocity . . . . . . . . . . . . . . . . . . .39The Characteristic Curve . . . . . . . . . . . . . . . . . .40The Paper Curve . . . . . . . . . . . . . . . . . . . . . .40The Film Curve . . . . . . . . . . . . . . . . . . . . . . .40
Placing the Zones . . . . . . . . . . . . . . . . . . . . . . . .41Alternative Metering Methods . . . . . . . . . . . . . .42Dark-Tone Metering . . . . . . . . . . . . . . . . . . .43Highlight Detail Metering . . . . . . . . . . . . . . .43Average Value Metering . . . . . . . . . . . . . . . . .44
5. VISUALIZING THE SYSTEM . . . . . . . . . . . . . .45Flare . . . . . . . . . . . . . . . . . . . . . . . . . . . . . . . . .45Camera System Flare . . . . . . . . . . . . . . . . . . .45Scenic Flare . . . . . . . . . . . . . . . . . . . . . . . . . .46
Tonal Relationships . . . . . . . . . . . . . . . . . . . . . .48Expansion/Compaction . . . . . . . . . . . . . . . . . . .49
6. DEVELOPMENT . . . . . . . . . . . . . . . . . . . . . . . .53The Paper . . . . . . . . . . . . . . . . . . . . . . . . . . . . .53The Film . . . . . . . . . . . . . . . . . . . . . . . . . . . . . .56Plotting Film Curves . . . . . . . . . . . . . . . . . . . . .56Exactness of Development . . . . . . . . . . . . . . . . .64
CONTENTS 3
CONTENTS
7. MAKING PHOTOGRAPHS . . . . . . . . . . . . . . . .65Zone Control as an Overall Concept . . . . . . . . .69Zone Control as a Tonal Separation Concept . . .72Incident Metering . . . . . . . . . . . . . . . . . . . . . . .76Field Charts . . . . . . . . . . . . . . . . . . . . . . . . . . . .76
8. IN-CAMERA CONTRAST CORRECTION . . . . .79Filters . . . . . . . . . . . . . . . . . . . . . . . . . . . . . . . . .79Dodging Exposure . . . . . . . . . . . . . . . . . . . . . . .83Preexposure . . . . . . . . . . . . . . . . . . . . . . . . . . . .85Reciprocity Failure Compensation . . . . . . . . . . .87Using Reciprocity Failure for Expansion . . . . . . .89
9. ADVANCED PRINTING TECHNIQUES . . . . . . .93Global Controls . . . . . . . . . . . . . . . . . . . . . . . . .93Development Control . . . . . . . . . . . . . . . . . . . .93Multi-Contrast Printing . . . . . . . . . . . . . . . . . . .97Local Control . . . . . . . . . . . . . . . . . . . . . . . . . .97Filter Dodging and Burning . . . . . . . . . . . . . . .100Flashing . . . . . . . . . . . . . . . . . . . . . . . . . . . . . .101Bleaching . . . . . . . . . . . . . . . . . . . . . . . . . . . . .102Intensifying/Toning Negatives . . . . . . . . . . . . .104
10. THE ZONE SYSTEM FORDIGITAL PHOTOGRAPHY . . . . . . . . . . . . . . . .105
Issues for Digital Photography in aZone System Approach . . . . . . . . . . . . . . . .107
Defining the Parts of a Digital Zone System . . .112Testing . . . . . . . . . . . . . . . . . . . . . . . . . . . . . . .112Digital Zone Exposure . . . . . . . . . . . . . . . . . . .115Using the Digital System . . . . . . . . . . . . . . . . .118Post-Capture Processing . . . . . . . . . . . . . . . . . .119Output . . . . . . . . . . . . . . . . . . . . . . . . . . . . . . .122High Dynamic Range Imaging . . . . . . . . . . . . .124
CONCLUSIONA Personal Approach to the Visual Language . .125
Index . . . . . . . . . . . . . . . . . . . . . . . . . . . . . . . .126
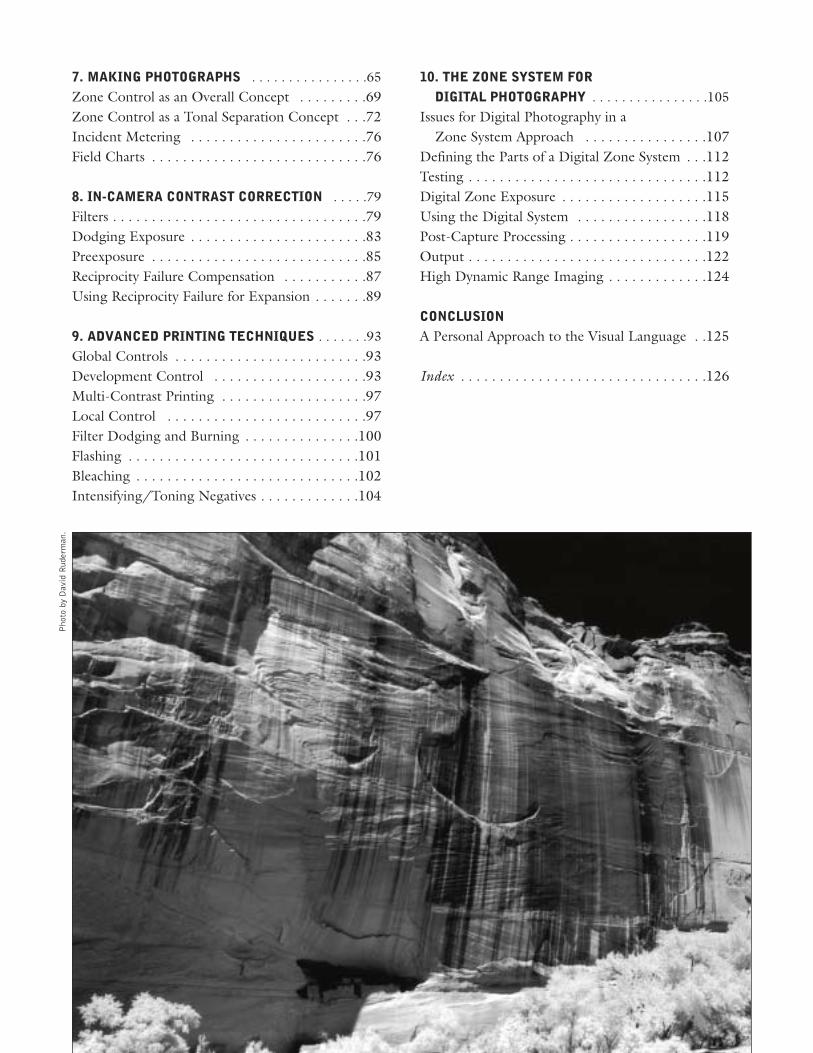
PhotobyDavidRuderman.
Dr. Glenn Rand has taught and administered in publiceducation, community colleges, and universities since1996. Since 2001 he has taught in the graduate programat Brooks Institute in Santa Barbara, CA, where he servesas acting graduate program chairman. In conjunctionwith these academic roles and consulting he has devel-oped and reorganized several curricula for fine art pho-tography, commercial photography, digital imaging, andallied curricula. His teaching has included courses inlighting, as well as commercial and fine art photography.He received his bachelors degree and master of arts
from Purdue University. He earned a doctorate from theUniversity of Cincinnati, centering on the psychology ofeducational spaces, and did post-doctoral research as avisiting scholar at the University of Michigan. Since theearly 1980s, his extra-academic research has includedcomputer-based imaging.As a consultant, Rand’s clients have included the Ford
Motor Company, Photo Marketing Association Inter-
national, the Ministry of Education of Finland, and manyother businesses and several colleges. As part of his con-sulting for the Eastman Kodak Company, he traveled andlectured on how to maximize Tmax films when they werefirst released.Black & white photographs by Glenn Rand are held
in the collections of thirty public museums in the UnitedStates, Europe, and Japan and are widely exhibited. Hisphotographs have also been published in editorial, illus-trative, and advertising functions.He has published and lectured extensively about pho-
tography and digital imaging, covering topics rangingfrom commercial aesthetics to the technical fine pointsof lighting. He is the author of numerous books and con-tributes regularly to various periodicals, such as Range-finder magazine, of which he is a contributing editor.
ABOUT THE AUTHOR 5
CHRISTOPHER BROUGHTON—Christopher Broughtonearned his BS and MS in professional photography fromBrooks Institute in Santa Barbara, CA, where he servedas Director of Laboratory Operations while completinghis Masters of Science degree. Prior to becoming a full-time faculty member at the Brooks Institute in 1996,Broughton also served as faculty for University of Pitts-burgh’s “Semester at Sea” program. He has authored ar-ticles in Petersen’s Photographic, Outdoor Photographer,PC Photo, and Studio Photography & Design Magazines,and has been a featured lecturer for Hasselblad USA, andEastman Kodak. Broughton’s black & white photogra-phy is exhibited and represented by Art Matters in LongBeach, CA; Robin Fold of The Golden Orb, CA; TheGriffin Gallery in Venice Beach, CA; and the Silver LightGallery in Carmel, CA.
DAVID RUDERMAN—David Ruderman has been makingphotographs for many years and has studied with well-
known photographers, such as John Sexton, throughshort courses and workshops. David works in Sacra-mento, CA, where he exhibits and has his work pub-lished. While transitioning to digital photography,David’s photographic experiences are heavily weightedwith his black & white photography.
ROBERT SMITH—Robert Smith (BA, MS) is a long-timefaculty member at Brooks Institute in Santa Barbara, CA,who taught full time for more than twenty years and re-mains a part-time faculty member. Before coming toBrooks, Smith’s career included celebrity portraiture andadvertising photography. His personal work seeks to cap-ture the play of light and design on the natural landscape,and in the unexpected abstraction found in abandoned,man-made objects. His photographs are included in pri-vate, corporate, and museum collections, and exhibited inmany one-man and group exhibitions.
ABOUT THE AUTHOR
ABOUT THE CONTRIBUTORS
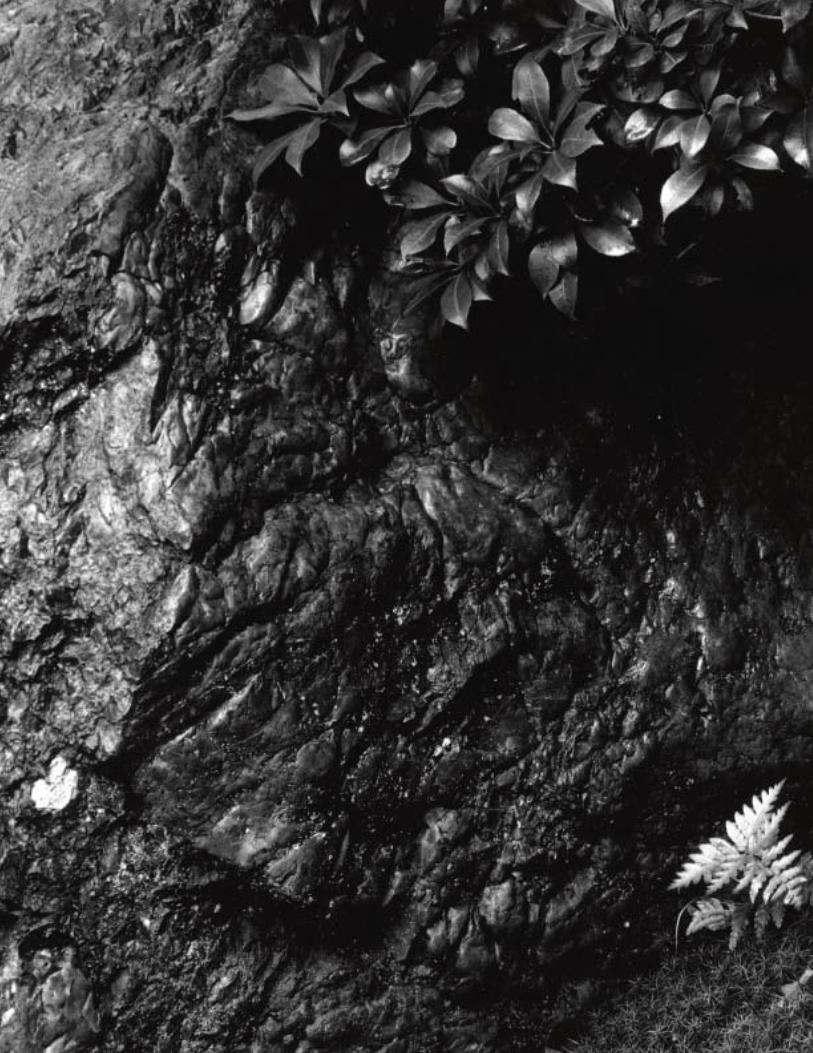
As photographers, we see the effects of light falling on our subjects and aredrawn to create images so we can share the visual excitement. However, inorder to best communicate our vision to viewers of our photographs, wemust rely on some tools and processes that allow us to effectively convey ourimpressions. The Zone System is one of these tools. It allows us to preciselyrecord our visual impression of the world and tell someone else what we sawin the most beautiful of visual languages: the language of black & whitephotography.
INTRODUCTION
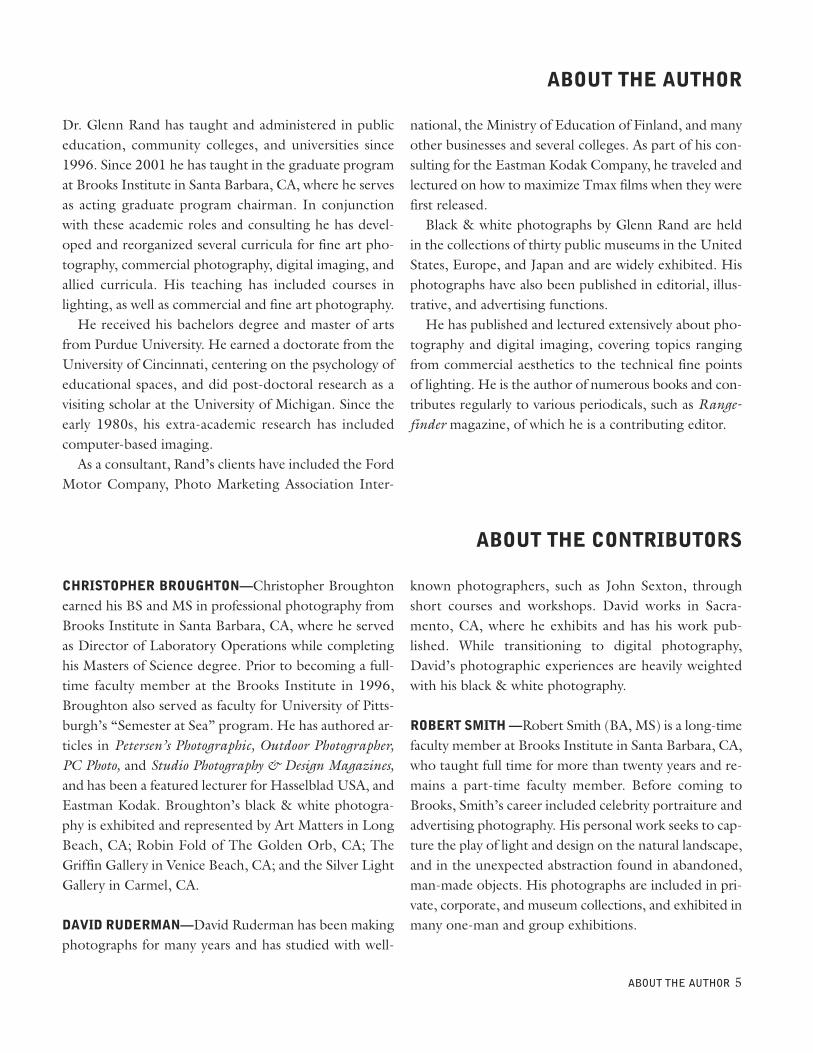
Facing page—Photo by Glenn Rand.Below—Photo by Christopher Broughton.
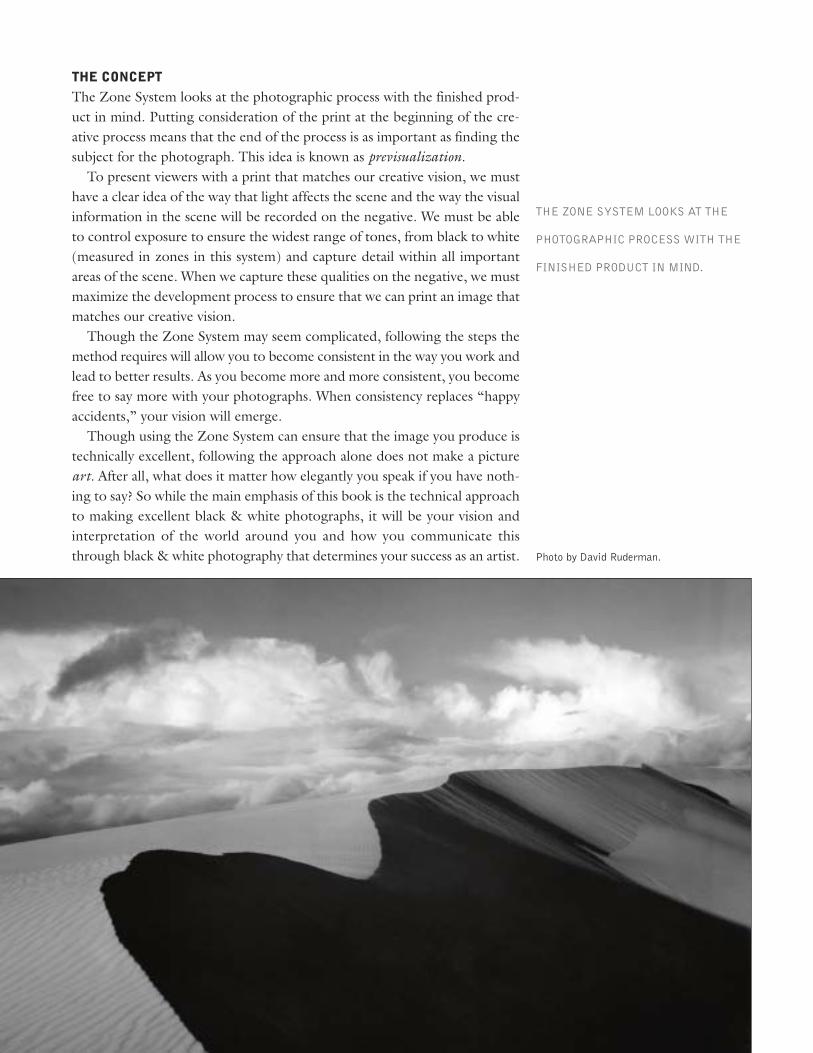
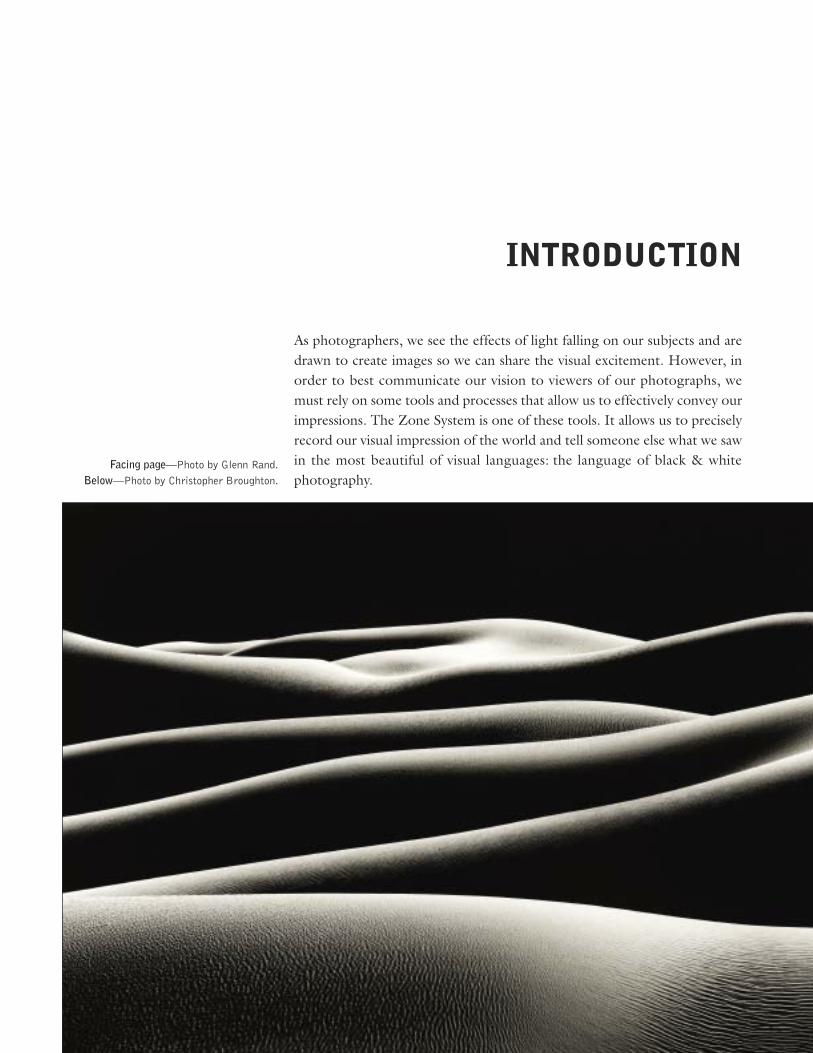
THE CONCEPTThe Zone System looks at the photographic process with the finished prod-uct in mind. Putting consideration of the print at the beginning of the cre-ative process means that the end of the process is as important as finding thesubject for the photograph. This idea is known as previsualization.To present viewers with a print that matches our creative vision, we must
have a clear idea of the way that light affects the scene and the way the visualinformation in the scene will be recorded on the negative. We must be ableto control exposure to ensure the widest range of tones, from black to white(measured in zones in this system) and capture detail within all importantareas of the scene. When we capture these qualities on the negative, we mustmaximize the development process to ensure that we can print an image thatmatches our creative vision.Though the Zone System may seem complicated, following the steps the
method requires will allow you to become consistent in the way you work andlead to better results. As you become more and more consistent, you becomefree to say more with your photographs. When consistency replaces “happyaccidents,” your vision will emerge.Though using the Zone System can ensure that the image you produce is
technically excellent, following the approach alone does not make a pictureart. After all, what does it matter how elegantly you speak if you have noth-ing to say? So while the main emphasis of this book is the technical approachto making excellent black & white photographs, it will be your vision andinterpretation of the world around you and how you communicate thisthrough black & white photography that determines your success as an artist. Photo by David Ruderman.
THE ZONE SYSTEM LOOKS AT THE
PHOTOGRAPHIC PROCESS WITH THE
FINISHED PRODUCT IN MIND.
Using the Zone System requires a scientific approach to creating art. To pro-duce images that match our creative vision, we must fully understand andanticipate the way the existing light affects the scene, how to best capturedetail, and how to refine the development process so that the final print sings.When photographers master the steps outlined in the Zone System, they caneasily predict (previsualize) the outcome of their prints. With the technicalsuccess of the image assured, we have more mental energy that can be put to-ward seeing and composing our photographs.
VARIABLES AND CONSTANTSOver five-thousand variables (or, more specifically, combinations of factors)are at play when creating images—not including the effects of filtration andadvanced printing techniques. The light in the scene, the exposure, the filmtype and ISO, the shutter speeds and aperture, the variables at play in devel-oping the film, and the options we are faced with in printing our images allaffect the outcome of our images.With so much variability, the odds that we will not achieve our goal in con-
veying our artistic vision are high. For this reason, one of the most importanttasks we must undertake when beginning to use the Zone System is to con-trol and eliminate some of the variables and their overall effect on our work.This process of standardization is the key to achieving good results. Withoutit, you cannot predict the outcome of your efforts.Of the many variables, the only factor that lies outside our control (unless
we’re working in the studio) is the light. For this reason, it is considered anindependent variable—meaning we can’t control how it changes. The otheraspects of the photographic process (development and printing), however,are either dependent variables (we can control how they change) or constants(they don’t change).By controlling the dependent variables in the photographic system, we can
compensate for the effect of the constants and the independent variables.
GETTING STARTED 9
CHAPTER ONE
GETTING STARTED
USING THE ZONE SYSTEM
REQUIRES A SCIENTIFIC APPROACH
TO CREATING ART.
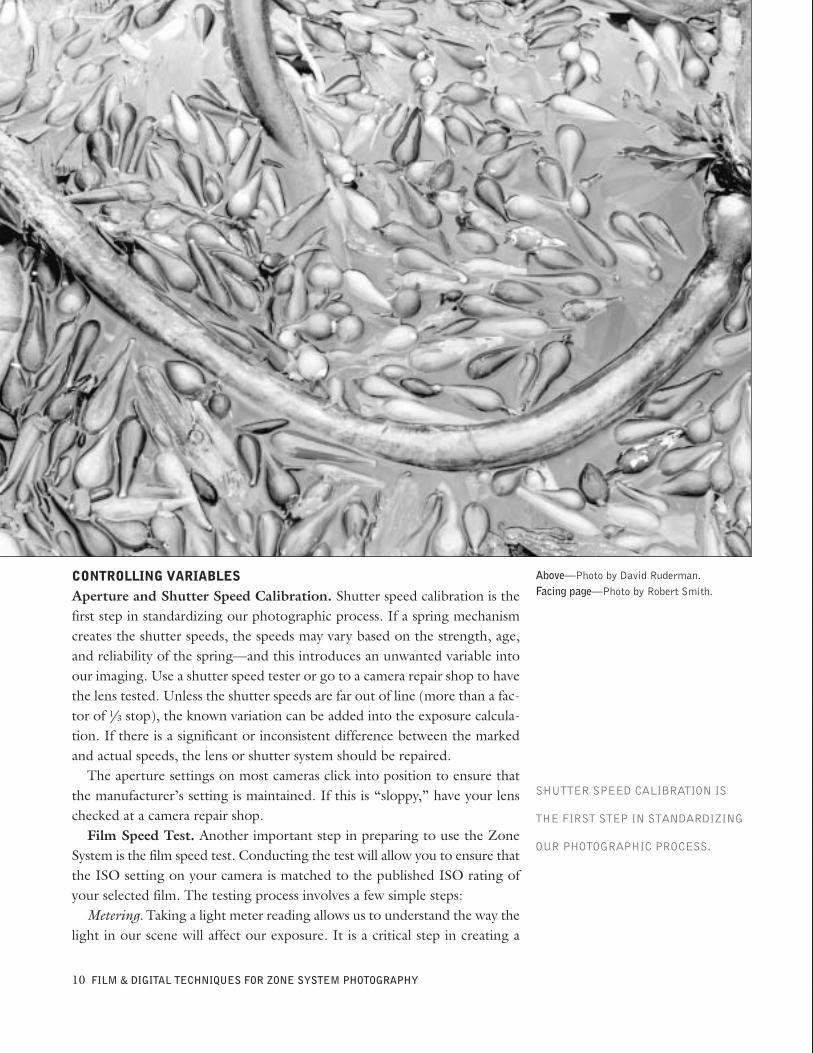
CONTROLLING VARIABLESAperture and Shutter Speed Calibration. Shutter speed calibration is thefirst step in standardizing our photographic process. If a spring mechanismcreates the shutter speeds, the speeds may vary based on the strength, age,and reliability of the spring—and this introduces an unwanted variable intoour imaging. Use a shutter speed tester or go to a camera repair shop to havethe lens tested. Unless the shutter speeds are far out of line (more than a fac-tor of 1/3 stop), the known variation can be added into the exposure calcula-tion. If there is a significant or inconsistent difference between the markedand actual speeds, the lens or shutter system should be repaired.The aperture settings on most cameras click into position to ensure that
the manufacturer’s setting is maintained. If this is “sloppy,” have your lenschecked at a camera repair shop.Film Speed Test. Another important step in preparing to use the Zone
System is the film speed test. Conducting the test will allow you to ensure thatthe ISO setting on your camera is matched to the published ISO rating ofyour selected film. The testing process involves a few simple steps:
Metering. Taking a light meter reading allows us to understand the way thelight in our scene will affect our exposure. It is a critical step in creating a
10 FILM & DIGITAL TECHNIQUES FOR ZONE SYSTEM PHOTOGRAPHY
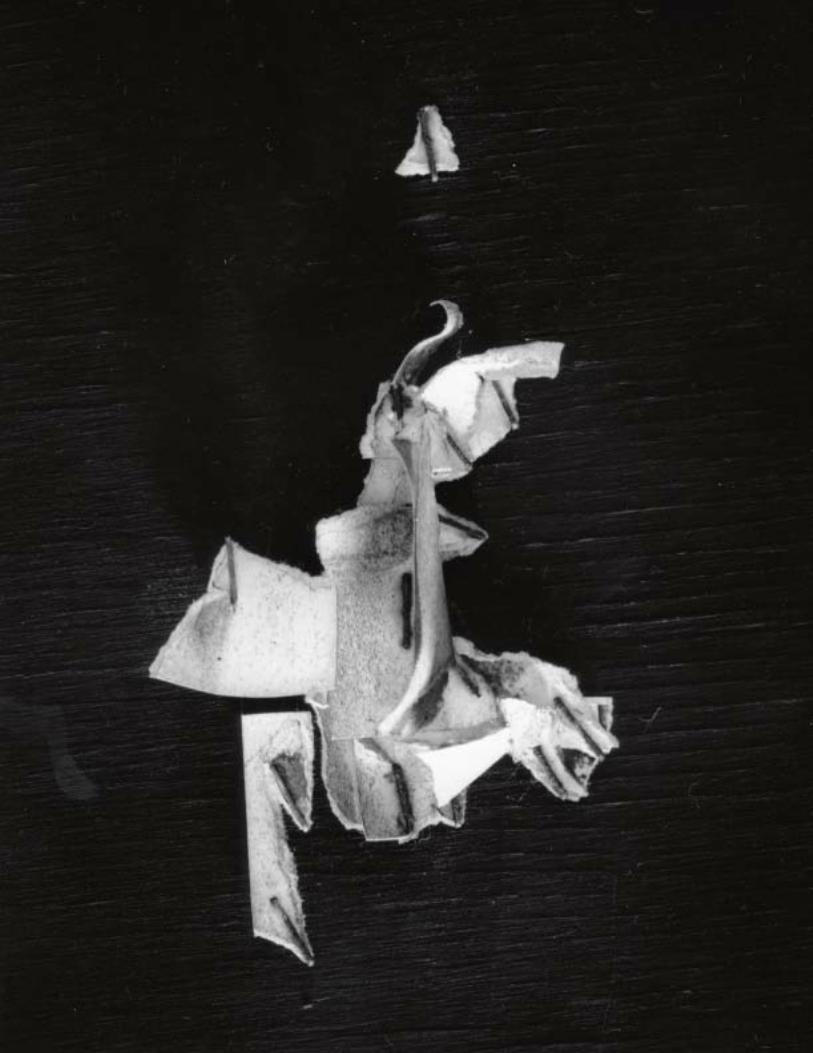
Above—Photo by David Ruderman.Facing page—Photo by Robert Smith.
SHUTTER SPEED CALIBRATION IS
THE FIRST STEP IN STANDARDIZING
OUR PHOTOGRAPHIC PROCESS.
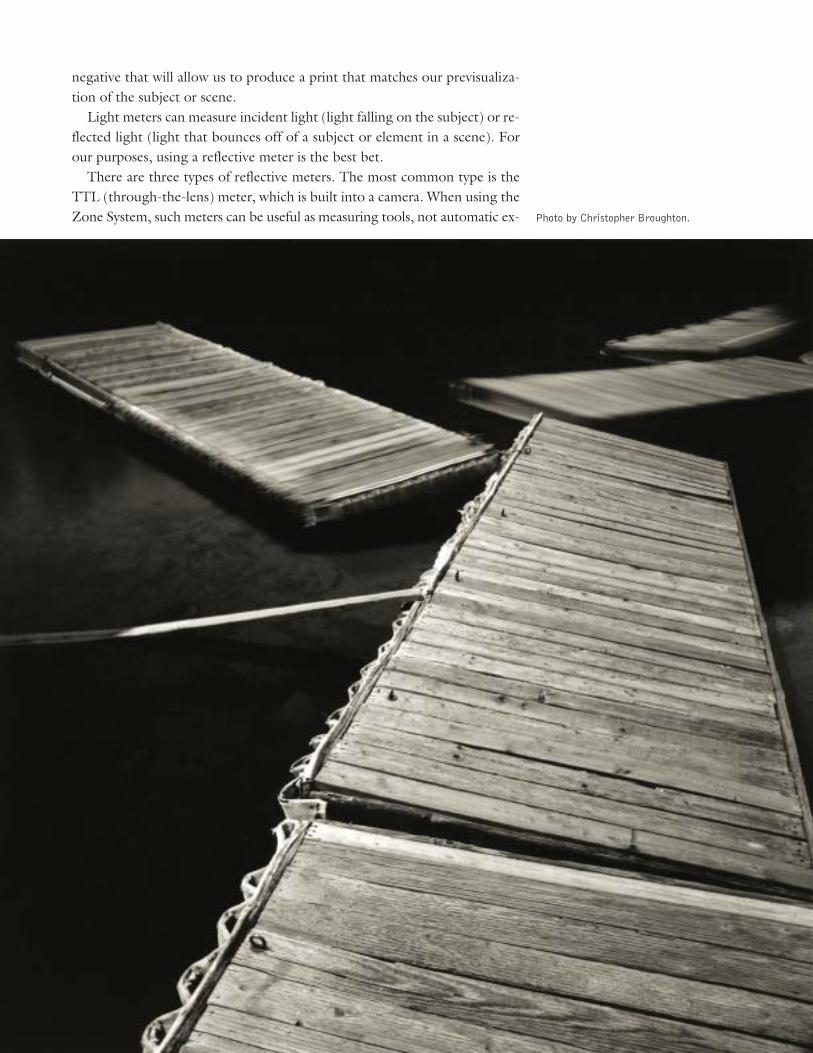
negative that will allow us to produce a print that matches our previsualiza-tion of the subject or scene.Light meters can measure incident light (light falling on the subject) or re-
flected light (light that bounces off of a subject or element in a scene). Forour purposes, using a reflective meter is the best bet.There are three types of reflective meters. The most common type is the
TTL (through-the-lens) meter, which is built into a camera. When using theZone System, such meters can be useful as measuring tools, not automatic ex- Photo by Christopher Broughton.
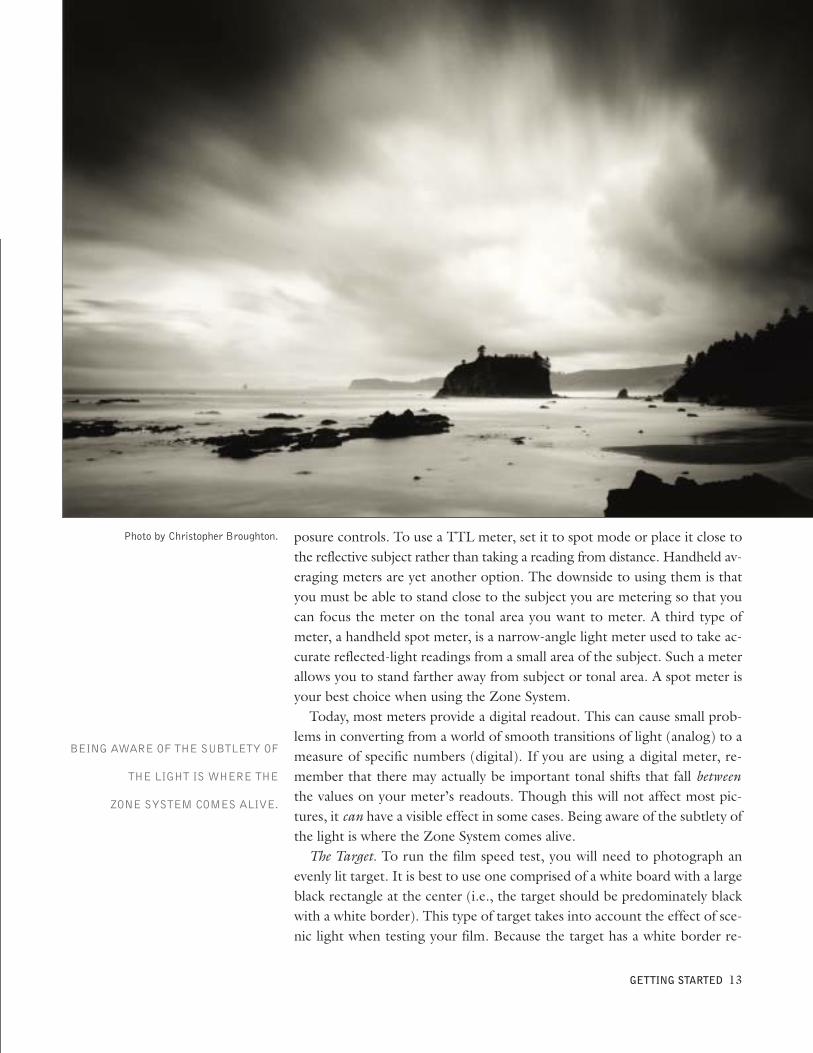
posure controls. To use a TTL meter, set it to spot mode or place it close tothe reflective subject rather than taking a reading from distance. Handheld av-eraging meters are yet another option. The downside to using them is thatyou must be able to stand close to the subject you are metering so that youcan focus the meter on the tonal area you want to meter. A third type ofmeter, a handheld spot meter, is a narrow-angle light meter used to take ac-curate reflected-light readings from a small area of the subject. Such a meterallows you to stand farther away from subject or tonal area. A spot meter isyour best choice when using the Zone System.Today, most meters provide a digital readout. This can cause small prob-
lems in converting from a world of smooth transitions of light (analog) to ameasure of specific numbers (digital). If you are using a digital meter, re-member that there may actually be important tonal shifts that fall betweenthe values on your meter’s readouts. Though this will not affect most pic-tures, it can have a visible effect in some cases. Being aware of the subtlety ofthe light is where the Zone System comes alive.
The Target. To run the film speed test, you will need to photograph anevenly lit target. It is best to use one comprised of a white board with a largeblack rectangle at the center (i.e., the target should be predominately blackwith a white border). This type of target takes into account the effect of sce-nic light when testing your film. Because the target has a white border re-
GETTING STARTED 13
Photo by Christopher Broughton.
BEING AWARE OF THE SUBTLETY OF
THE LIGHT IS WHERE THE
ZONE SYSTEM COMES ALIVE.
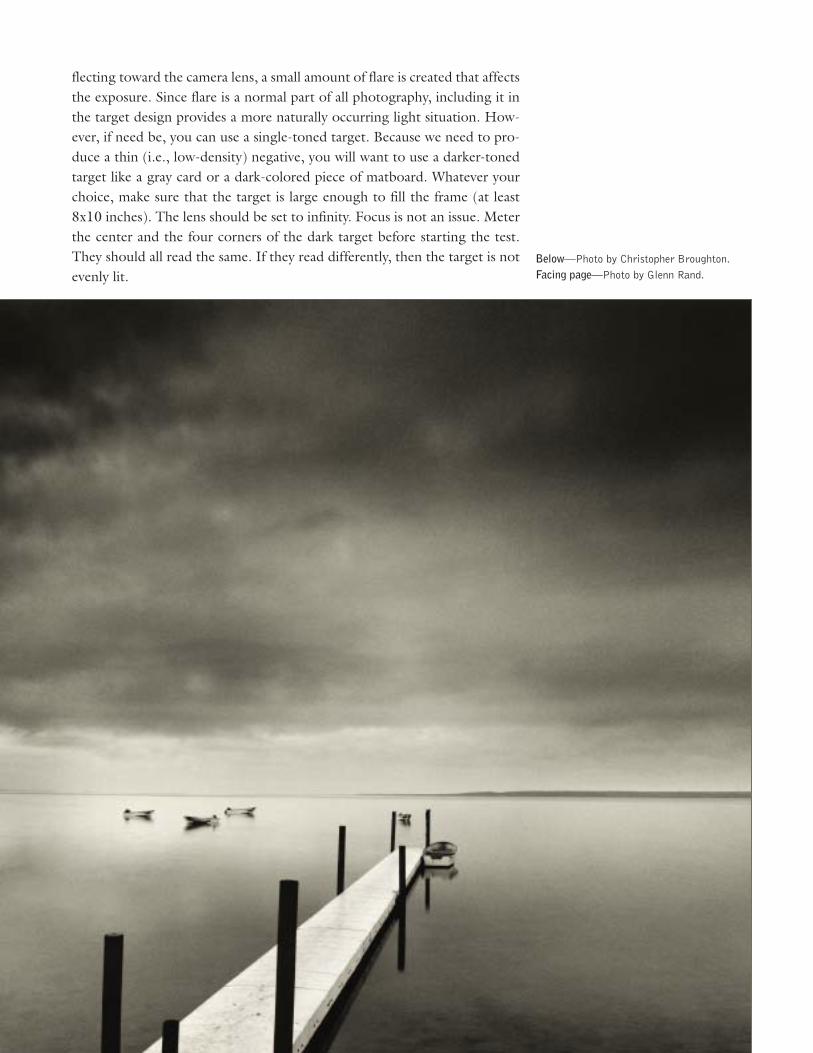
flecting toward the camera lens, a small amount of flare is created that affectsthe exposure. Since flare is a normal part of all photography, including it inthe target design provides a more naturally occurring light situation. How-ever, if need be, you can use a single-toned target. Because we need to pro-duce a thin (i.e., low-density) negative, you will want to use a darker-tonedtarget like a gray card or a dark-colored piece of matboard. Whatever yourchoice, make sure that the target is large enough to fill the frame (at least8x10 inches). The lens should be set to infinity. Focus is not an issue. Meterthe center and the four corners of the dark target before starting the test.They should all read the same. If they read differently, then the target is notevenly lit.
Below—Photo by Christopher Broughton.Facing page—Photo by Glenn Rand.
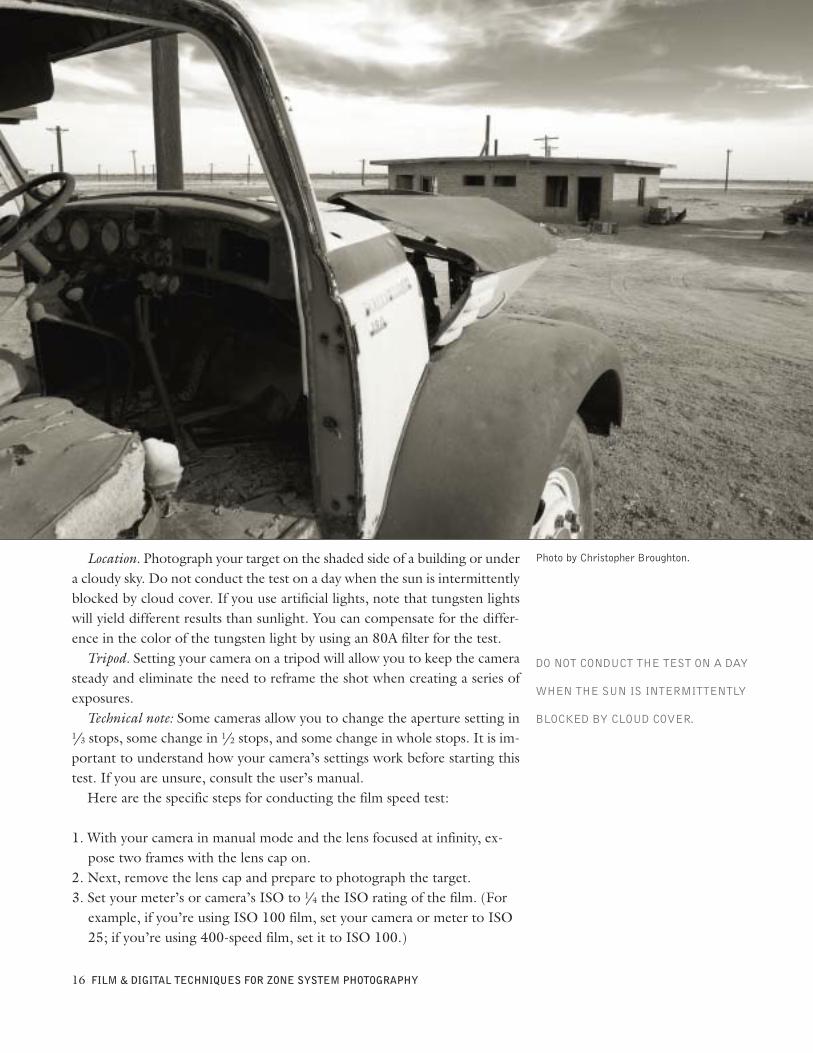
Location. Photograph your target on the shaded side of a building or undera cloudy sky. Do not conduct the test on a day when the sun is intermittentlyblocked by cloud cover. If you use artificial lights, note that tungsten lightswill yield different results than sunlight. You can compensate for the differ-ence in the color of the tungsten light by using an 80A filter for the test.
Tripod. Setting your camera on a tripod will allow you to keep the camerasteady and eliminate the need to reframe the shot when creating a series ofexposures.
Technical note: Some cameras allow you to change the aperture setting in1/3 stops, some change in 1/2 stops, and some change in whole stops. It is im-portant to understand how your camera’s settings work before starting thistest. If you are unsure, consult the user’s manual.Here are the specific steps for conducting the film speed test:
1. With your camera in manual mode and the lens focused at infinity, ex-pose two frames with the lens cap on.
2. Next, remove the lens cap and prepare to photograph the target.3. Set your meter’s or camera’s ISO to 1/4 the ISO rating of the film. (For
example, if you’re using ISO 100 film, set your camera or meter to ISO25; if you’re using 400-speed film, set it to ISO 100.)
16 FILM & DIGITAL TECHNIQUES FOR ZONE SYSTEM PHOTOGRAPHY
Photo by Christopher Broughton.
DO NOT CONDUCT THE TEST ON A DAY
WHEN THE SUN IS INTERMITTENTLY
BLOCKED BY CLOUD COVER.
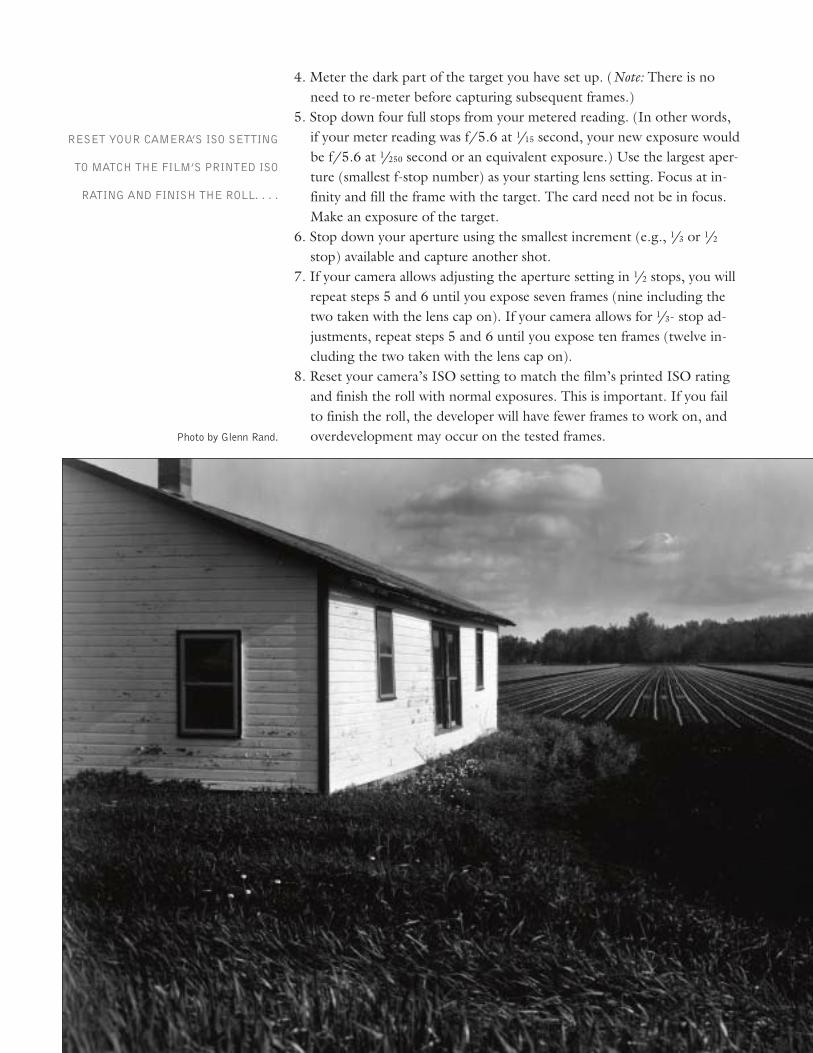
4. Meter the dark part of the target you have set up. (Note: There is noneed to re-meter before capturing subsequent frames.)
5. Stop down four full stops from your metered reading. (In other words,if your meter reading was f/5.6 at 1/15 second, your new exposure wouldbe f/5.6 at 1/250 second or an equivalent exposure.) Use the largest aper-ture (smallest f-stop number) as your starting lens setting. Focus at in-finity and fill the frame with the target. The card need not be in focus.Make an exposure of the target.
6. Stop down your aperture using the smallest increment (e.g., 1/3 or 1/2stop) available and capture another shot.
7. If your camera allows adjusting the aperture setting in 1/2 stops, you willrepeat steps 5 and 6 until you expose seven frames (nine including thetwo taken with the lens cap on). If your camera allows for 1/3- stop ad-justments, repeat steps 5 and 6 until you expose ten frames (twelve in-cluding the two taken with the lens cap on).
8. Reset your camera’s ISO setting to match the film’s printed ISO ratingand finish the roll with normal exposures. This is important. If you failto finish the roll, the developer will have fewer frames to work on, andoverdevelopment may occur on the tested frames.Photo by Glenn Rand.
RESET YOUR CAMERA’S ISO SETTING
TO MATCH THE FILM’S PRINTED ISO
RATING AND FINISH THE ROLL. . . .
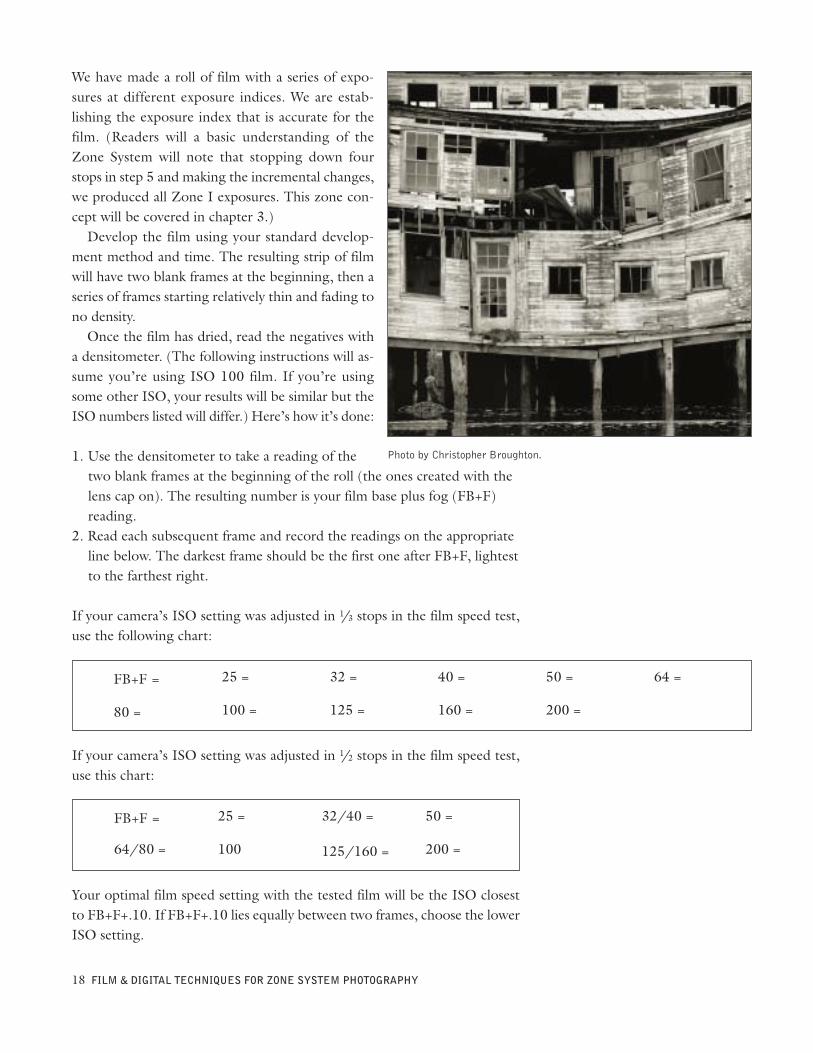
We have made a roll of film with a series of expo-sures at different exposure indices. We are estab-lishing the exposure index that is accurate for thefilm. (Readers will a basic understanding of theZone System will note that stopping down fourstops in step 5 and making the incremental changes,we produced all Zone I exposures. This zone con-cept will be covered in chapter 3.)Develop the film using your standard develop-
ment method and time. The resulting strip of filmwill have two blank frames at the beginning, then aseries of frames starting relatively thin and fading tono density.Once the film has dried, read the negatives with
a densitometer. (The following instructions will as-sume you’re using ISO 100 film. If you’re usingsome other ISO, your results will be similar but theISO numbers listed will differ.) Here’s how it’s done:
1. Use the densitometer to take a reading of thetwo blank frames at the beginning of the roll (the ones created with thelens cap on). The resulting number is your film base plus fog (FB+F)reading.
2. Read each subsequent frame and record the readings on the appropriateline below. The darkest frame should be the first one after FB+F, lightestto the farthest right.
If your camera’s ISO setting was adjusted in 1/3 stops in the film speed test,use the following chart:
If your camera’s ISO setting was adjusted in 1/2 stops in the film speed test,use this chart:
Your optimal film speed setting with the tested film will be the ISO closestto FB+F+.10. If FB+F+.10 lies equally between two frames, choose the lowerISO setting.
18 FILM & DIGITAL TECHNIQUES FOR ZONE SYSTEM PHOTOGRAPHY
FB+F = 25 = 32 = 40 = 50 = 64 =
80 = 100 = 125 = 160 = 200 =
FB+F = 25 = 32/40 = 50 =
64/80 = 100 125/160 = 200 =
Photo by Christopher Broughton.
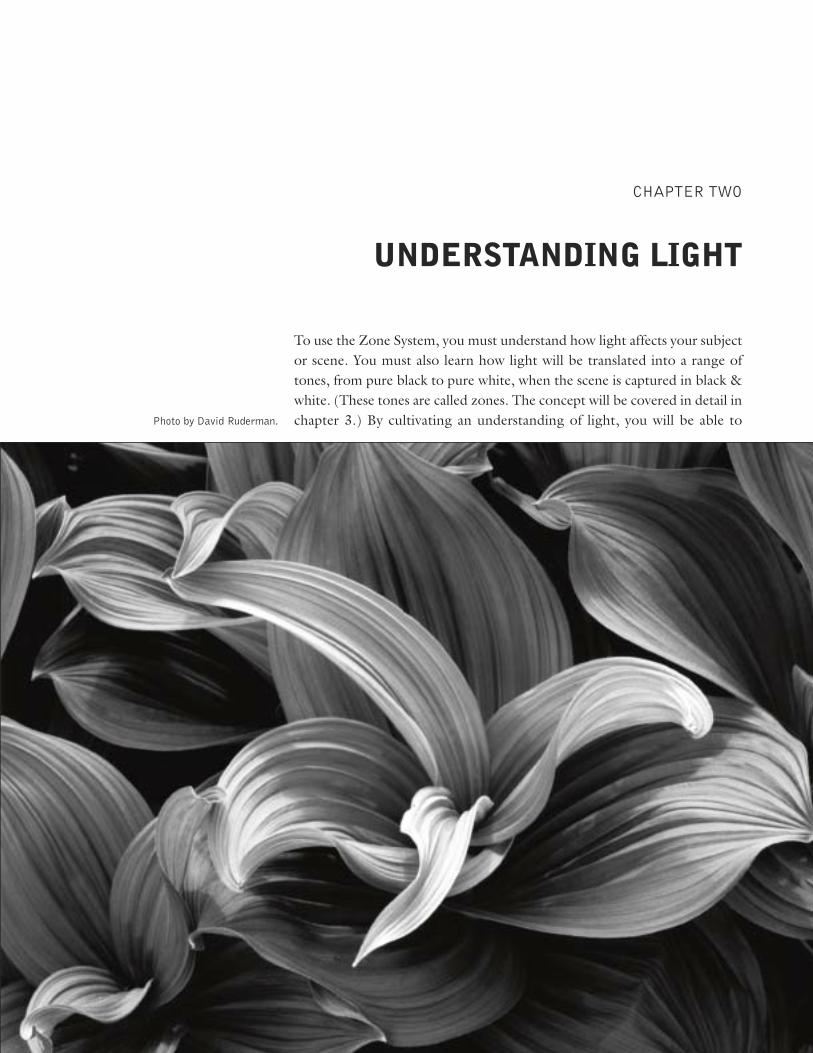
To use the Zone System, you must understand how light affects your subjector scene. You must also learn how light will be translated into a range oftones, from pure black to pure white, when the scene is captured in black &white. (These tones are called zones. The concept will be covered in detail inchapter 3.) By cultivating an understanding of light, you will be able to
CHAPTER TWO
UNDERSTANDING LIGHT
Photo by David Ruderman.
“read” your photographic subject and make creative exposure and develop-ment decisions that will allow you to create a print that expresses your cre-ative interpretation.
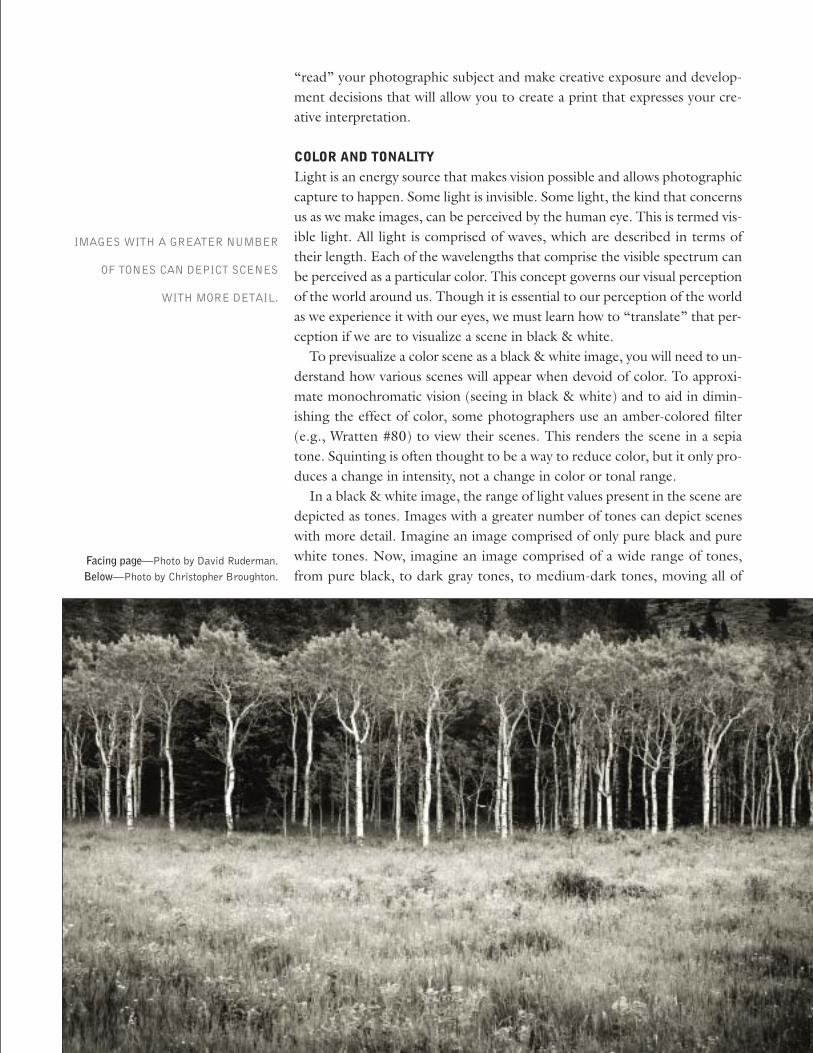
COLOR AND TONALITYLight is an energy source that makes vision possible and allows photographiccapture to happen. Some light is invisible. Some light, the kind that concernsus as we make images, can be perceived by the human eye. This is termed vis-ible light. All light is comprised of waves, which are described in terms oftheir length. Each of the wavelengths that comprise the visible spectrum canbe perceived as a particular color. This concept governs our visual perceptionof the world around us. Though it is essential to our perception of the worldas we experience it with our eyes, we must learn how to “translate” that per-ception if we are to visualize a scene in black & white.To previsualize a color scene as a black & white image, you will need to un-
derstand how various scenes will appear when devoid of color. To approxi-mate monochromatic vision (seeing in black & white) and to aid in dimin-ishing the effect of color, some photographers use an amber-colored filter(e.g., Wratten #80) to view their scenes. This renders the scene in a sepiatone. Squinting is often thought to be a way to reduce color, but it only pro-duces a change in intensity, not a change in color or tonal range.In a black & white image, the range of light values present in the scene are
depicted as tones. Images with a greater number of tones can depict sceneswith more detail. Imagine an image comprised of only pure black and purewhite tones. Now, imagine an image comprised of a wide range of tones,from pure black, to dark gray tones, to medium-dark tones, moving all of
Facing page—Photo by David Ruderman.Below—Photo by Christopher Broughton.
IMAGES WITH A GREATER NUMBER
OF TONES CAN DEPICT SCENES
WITH MORE DETAIL.
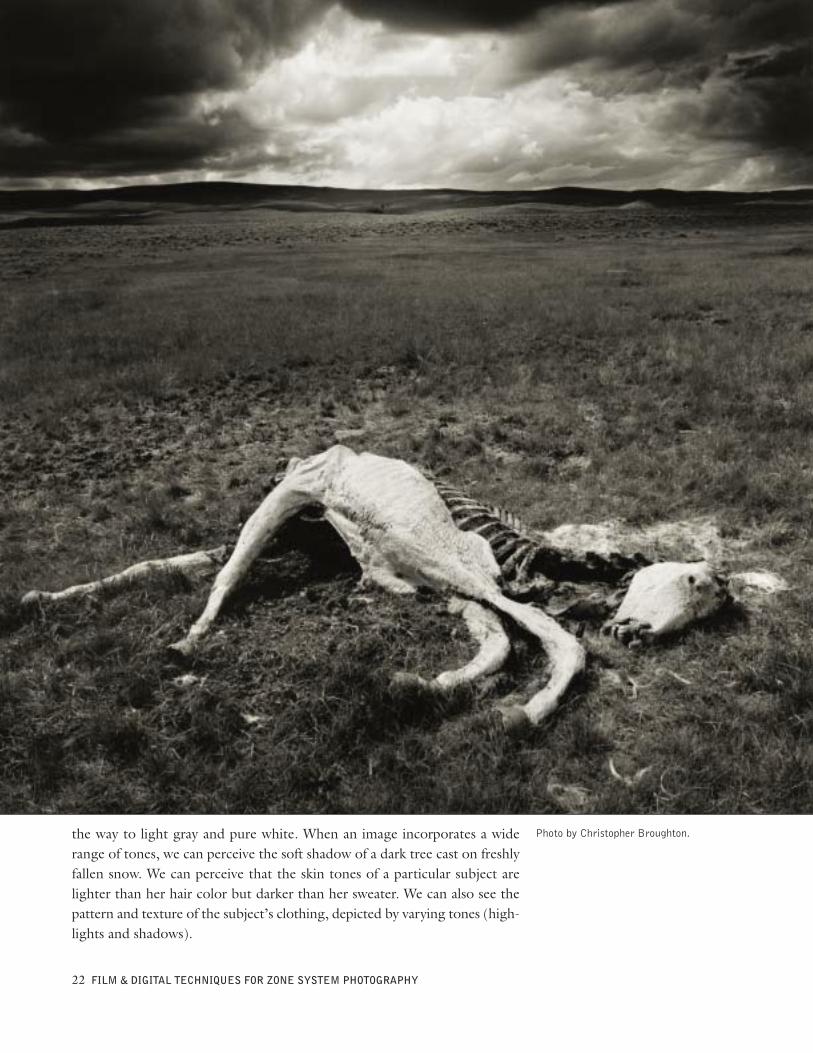
the way to light gray and pure white. When an image incorporates a widerange of tones, we can perceive the soft shadow of a dark tree cast on freshlyfallen snow. We can perceive that the skin tones of a particular subject arelighter than her hair color but darker than her sweater. We can also see thepattern and texture of the subject’s clothing, depicted by varying tones (high-lights and shadows).
22 FILM & DIGITAL TECHNIQUES FOR ZONE SYSTEM PHOTOGRAPHY
Photo by Christopher Broughton.
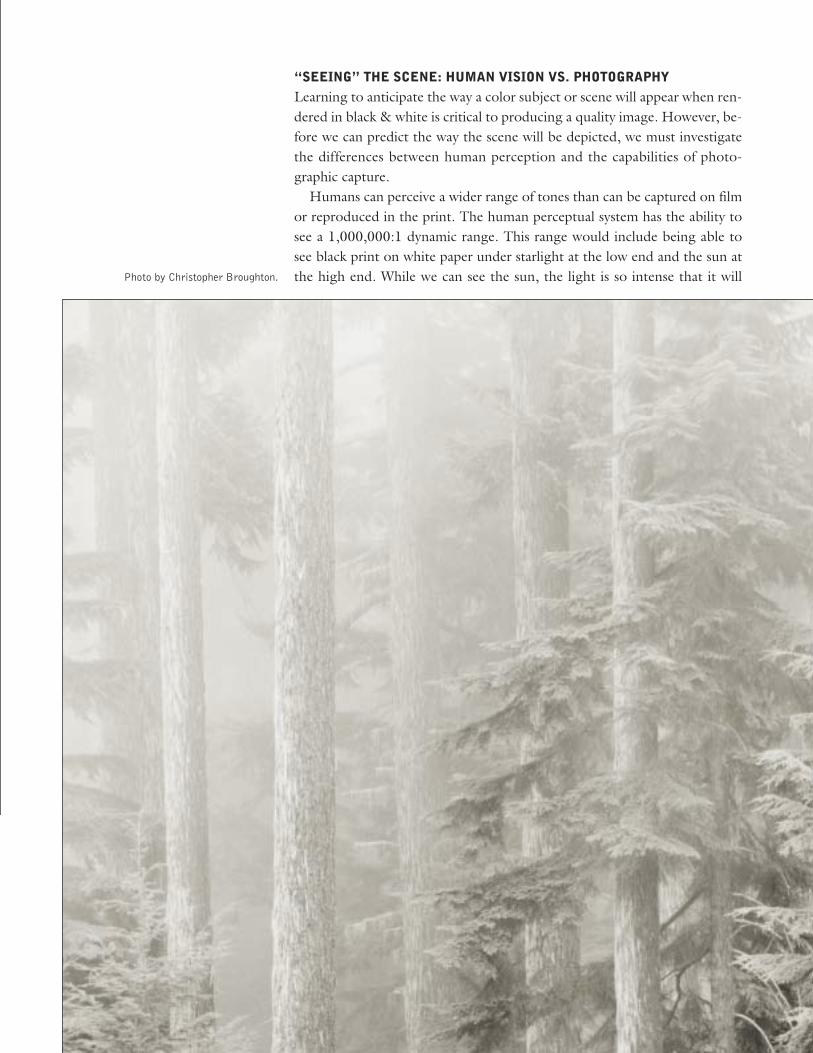
“SEEING” THE SCENE: HUMAN VISION VS. PHOTOGRAPHYLearning to anticipate the way a color subject or scene will appear when ren-dered in black & white is critical to producing a quality image. However, be-fore we can predict the way the scene will be depicted, we must investigatethe differences between human perception and the capabilities of photo-graphic capture.Humans can perceive a wider range of tones than can be captured on film
or reproduced in the print. The human perceptual system has the ability tosee a 1,000,000:1 dynamic range. This range would include being able tosee black print on white paper under starlight at the low end and the sun atthe high end. While we can see the sun, the light is so intense that it willPhoto by Christopher Broughton.
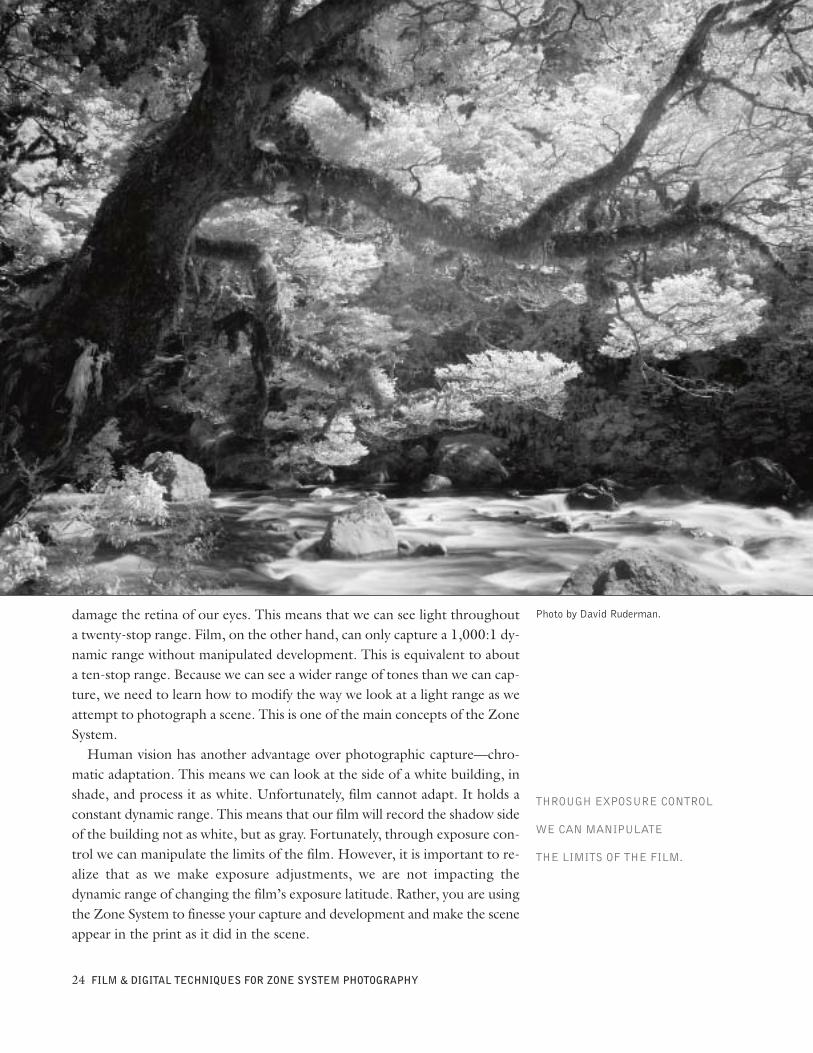
damage the retina of our eyes. This means that we can see light throughouta twenty-stop range. Film, on the other hand, can only capture a 1,000:1 dy-namic range without manipulated development. This is equivalent to abouta ten-stop range. Because we can see a wider range of tones than we can cap-ture, we need to learn how to modify the way we look at a light range as weattempt to photograph a scene. This is one of the main concepts of the ZoneSystem.Human vision has another advantage over photographic capture—chro-
matic adaptation. This means we can look at the side of a white building, inshade, and process it as white. Unfortunately, film cannot adapt. It holds aconstant dynamic range. This means that our film will record the shadow sideof the building not as white, but as gray. Fortunately, through exposure con-trol we can manipulate the limits of the film. However, it is important to re-alize that as we make exposure adjustments, we are not impacting thedynamic range of changing the film’s exposure latitude. Rather, you are usingthe Zone System to finesse your capture and development and make the sceneappear in the print as it did in the scene.
24 FILM & DIGITAL TECHNIQUES FOR ZONE SYSTEM PHOTOGRAPHY
Photo by David Ruderman.
THROUGH EXPOSURE CONTROL
WE CAN MANIPULATE
THE LIMITS OF THE FILM.
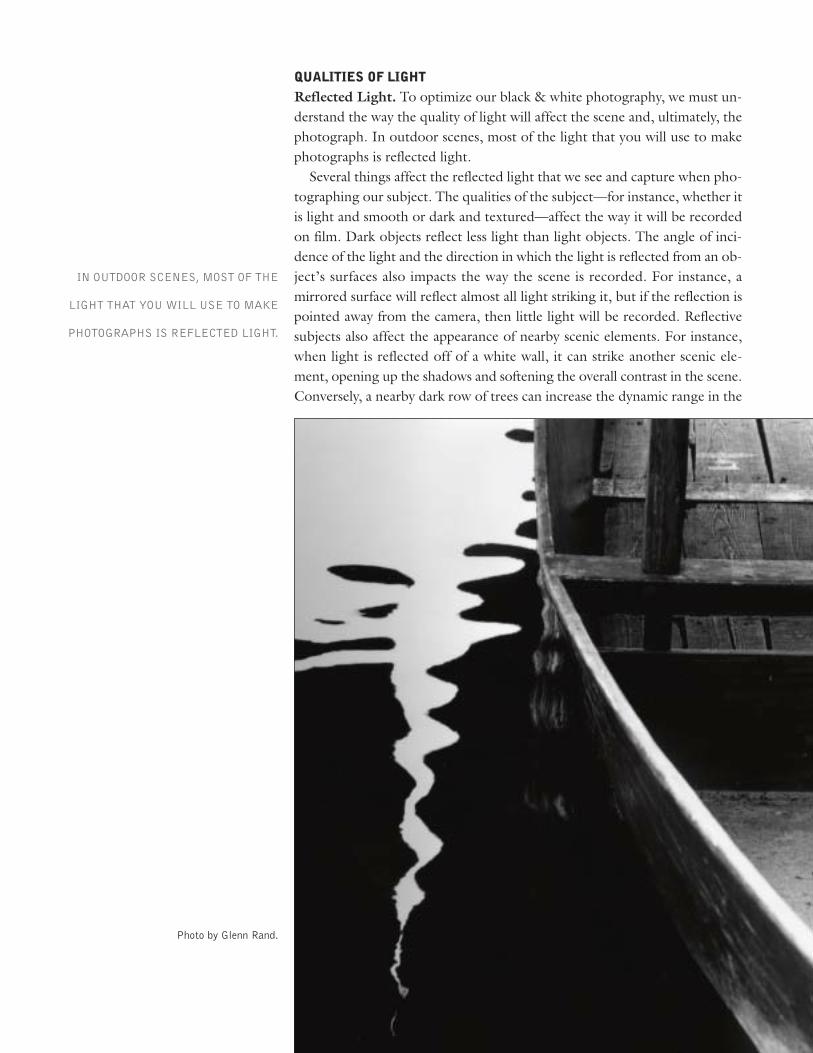
QUALITIES OF LIGHTReflected Light. To optimize our black & white photography, we must un-derstand the way the quality of light will affect the scene and, ultimately, thephotograph. In outdoor scenes, most of the light that you will use to makephotographs is reflected light.Several things affect the reflected light that we see and capture when pho-
tographing our subject. The qualities of the subject—for instance, whether itis light and smooth or dark and textured—affect the way it will be recordedon film. Dark objects reflect less light than light objects. The angle of inci-dence of the light and the direction in which the light is reflected from an ob-ject’s surfaces also impacts the way the scene is recorded. For instance, amirrored surface will reflect almost all light striking it, but if the reflection ispointed away from the camera, then little light will be recorded. Reflectivesubjects also affect the appearance of nearby scenic elements. For instance,when light is reflected off of a white wall, it can strike another scenic ele-ment, opening up the shadows and softening the overall contrast in the scene.Conversely, a nearby dark row of trees can increase the dynamic range in the
Photo by Glenn Rand.
IN OUTDOOR SCENES, MOST OF THE
LIGHT THAT YOU WILL USE TO MAKE
PHOTOGRAPHS IS REFLECTED LIGHT.
scene by absorbing more of the ambient light and keeping it from lighteningup the shadows.Even though we are capturing black & white images, the color of light in
our scene can affect the final print. Light normally has a color bias that canaffect the intensity of reflected light. At sunrise or sunset, for instance, lighttakes on a reddish cast that will not reflect as well from green objects as it willfrom neutral tones. Similarly, open shade, without direct sunlight, is very blueand reduces the reflectivity from yellow or reddish subjects. (Remember, oureyes can adapt to changes in light, allowing us to perceive colors as we expectthem to be rendered. Film cannot process this information in this way. It sim-ply records what is there.)Specular vs. Diffuse Light. Light is often described as being specular
(hard) or diffuse (soft). Specular light is produced when a light source is po-sitioned far from a subject or is small in relation to the subject. This type oflight is characterized by a high contrast range. In other words, direct lightproduces bright highlights and sharp, dark shadows. In the studio, specularlight may result, for example, when lighting your subject with a single light;with little ambient light filling in the shadow areas, there is a high dynamicrange. In outdoor work, specular light results on a clear day when the sun’slight hits the earth in parallel rays. To envision specular light, think of thetiny hot spots you might see on a car’s chrome bumper on a sunny day.
UNDERSTANDING LIGHT 27
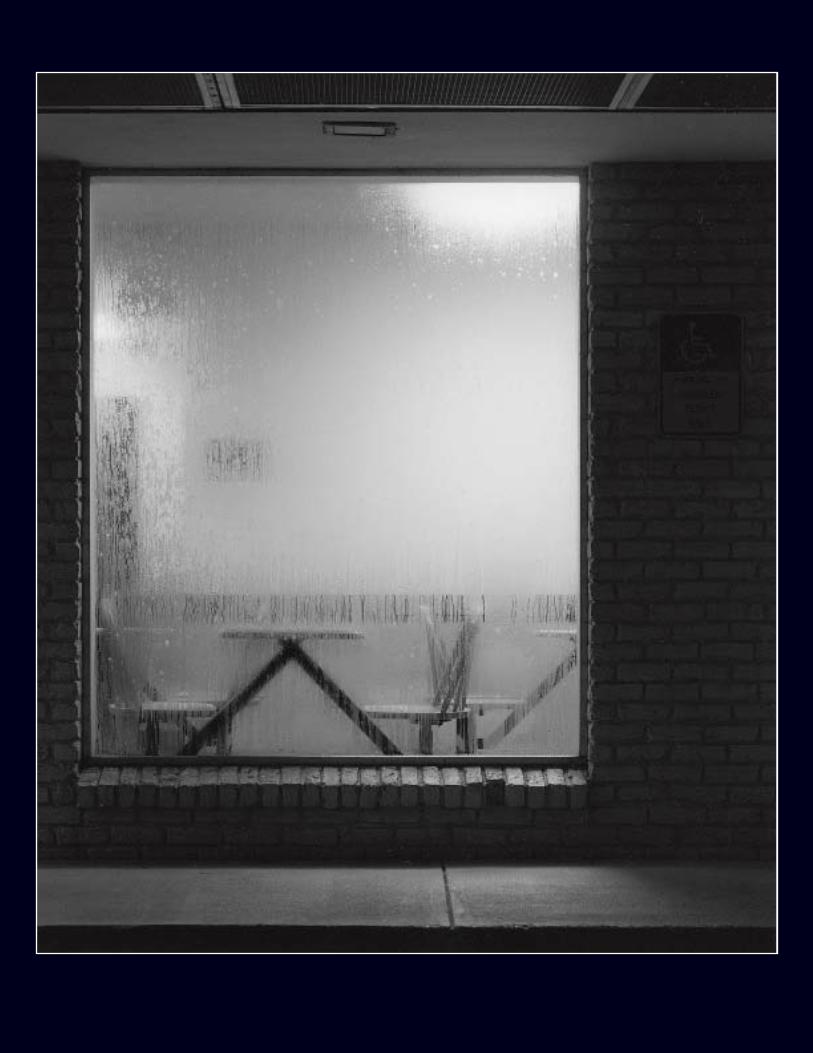
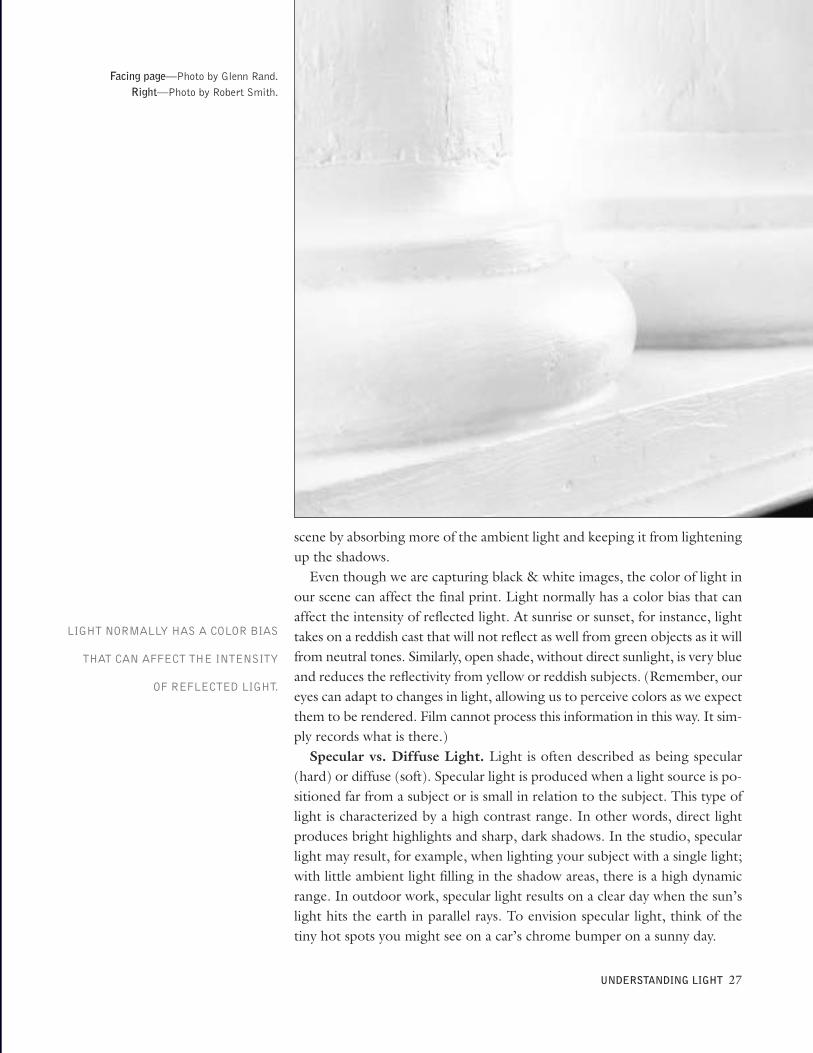
Facing page—Photo by Glenn Rand.Right—Photo by Robert Smith.
LIGHT NORMALLY HAS A COLOR BIAS
THAT CAN AFFECT THE INTENSITY
OF REFLECTED LIGHT.
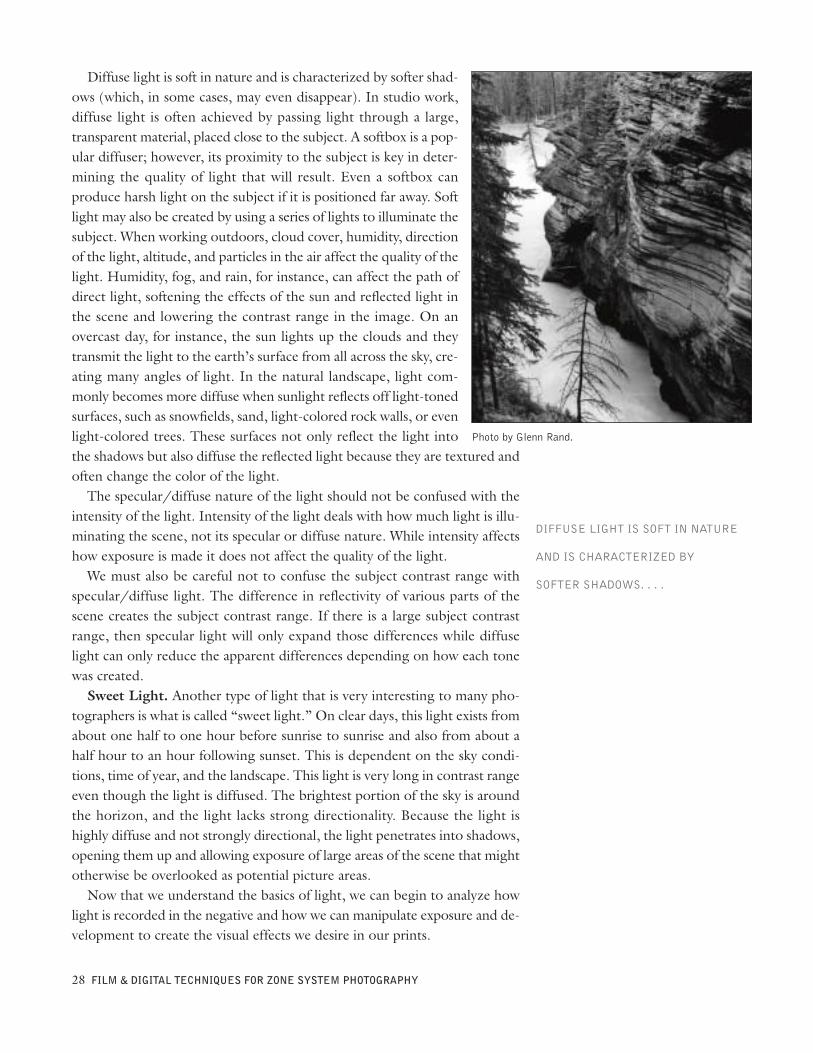
Diffuse light is soft in nature and is characterized by softer shad-ows (which, in some cases, may even disappear). In studio work,diffuse light is often achieved by passing light through a large,transparent material, placed close to the subject. A softbox is a pop-ular diffuser; however, its proximity to the subject is key in deter-mining the quality of light that will result. Even a softbox canproduce harsh light on the subject if it is positioned far away. Softlight may also be created by using a series of lights to illuminate thesubject. When working outdoors, cloud cover, humidity, directionof the light, altitude, and particles in the air affect the quality of thelight. Humidity, fog, and rain, for instance, can affect the path ofdirect light, softening the effects of the sun and reflected light inthe scene and lowering the contrast range in the image. On anovercast day, for instance, the sun lights up the clouds and theytransmit the light to the earth’s surface from all across the sky, cre-ating many angles of light. In the natural landscape, light com-monly becomes more diffuse when sunlight reflects off light-tonedsurfaces, such as snowfields, sand, light-colored rock walls, or evenlight-colored trees. These surfaces not only reflect the light intothe shadows but also diffuse the reflected light because they are textured andoften change the color of the light.The specular/diffuse nature of the light should not be confused with the
intensity of the light. Intensity of the light deals with how much light is illu-minating the scene, not its specular or diffuse nature. While intensity affectshow exposure is made it does not affect the quality of the light.We must also be careful not to confuse the subject contrast range with
specular/diffuse light. The difference in reflectivity of various parts of thescene creates the subject contrast range. If there is a large subject contrastrange, then specular light will only expand those differences while diffuselight can only reduce the apparent differences depending on how each tonewas created.Sweet Light. Another type of light that is very interesting to many pho-
tographers is what is called “sweet light.” On clear days, this light exists fromabout one half to one hour before sunrise to sunrise and also from about ahalf hour to an hour following sunset. This is dependent on the sky condi-tions, time of year, and the landscape. This light is very long in contrast rangeeven though the light is diffused. The brightest portion of the sky is aroundthe horizon, and the light lacks strong directionality. Because the light ishighly diffuse and not strongly directional, the light penetrates into shadows,opening them up and allowing exposure of large areas of the scene that mightotherwise be overlooked as potential picture areas.Now that we understand the basics of light, we can begin to analyze how
light is recorded in the negative and how we can manipulate exposure and de-velopment to create the visual effects we desire in our prints.
28 FILM & DIGITAL TECHNIQUES FOR ZONE SYSTEM PHOTOGRAPHY
Photo by Glenn Rand.
DIFFUSE LIGHT IS SOFT IN NATURE
AND IS CHARACTERIZED BY
SOFTER SHADOWS. . . .
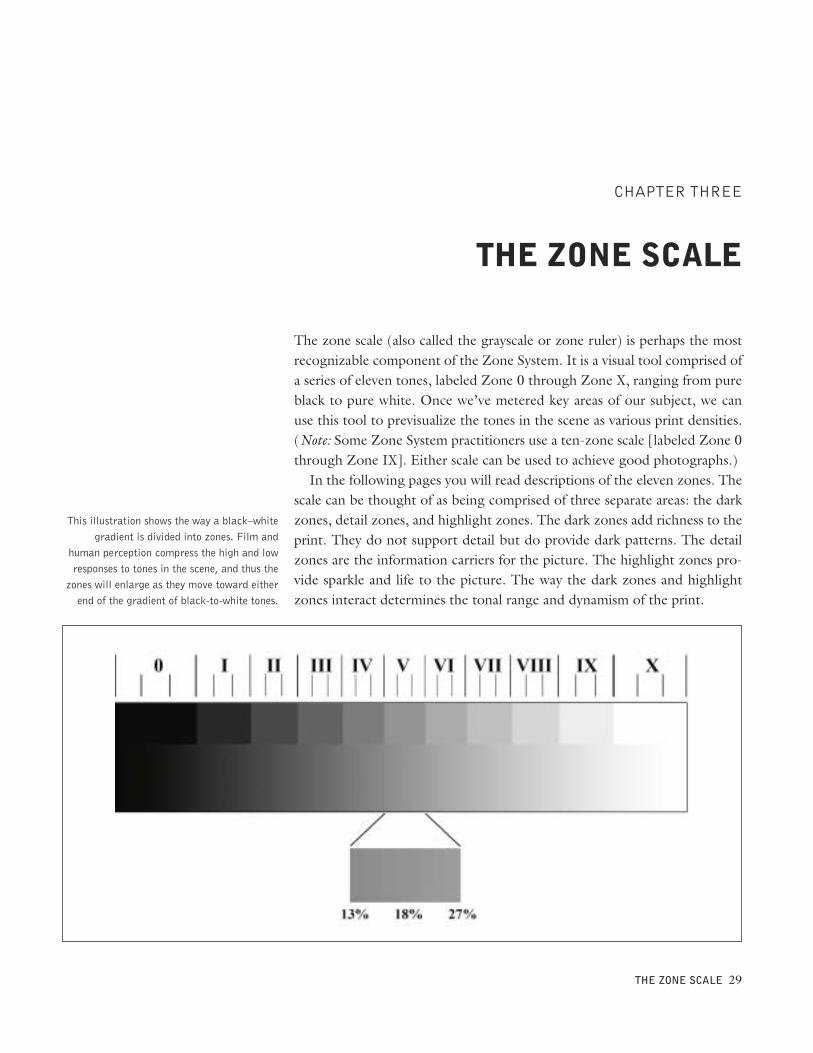
The zone scale (also called the grayscale or zone ruler) is perhaps the mostrecognizable component of the Zone System. It is a visual tool comprised ofa series of eleven tones, labeled Zone 0 through Zone X, ranging from pureblack to pure white. Once we’ve metered key areas of our subject, we canuse this tool to previsualize the tones in the scene as various print densities.(Note: Some Zone System practitioners use a ten-zone scale [labeled Zone 0through Zone IX]. Either scale can be used to achieve good photographs.)In the following pages you will read descriptions of the eleven zones. The
scale can be thought of as being comprised of three separate areas: the darkzones, detail zones, and highlight zones. The dark zones add richness to theprint. They do not support detail but do provide dark patterns. The detailzones are the information carriers for the picture. The highlight zones pro-vide sparkle and life to the picture. The way the dark zones and highlightzones interact determines the tonal range and dynamism of the print.
THE ZONE SCALE 29
CHAPTER THREE
THE ZONE SCALE
This illustration shows the way a black–whitegradient is divided into zones. Film and
human perception compress the high and lowresponses to tones in the scene, and thus thezones will enlarge as they move toward eitherend of the gradient of black-to-white tones.
You will also find a discussion ofthe qualities the various tones add tothe image. These are: (1) pattern—observable tonal shifts without imageinformation; (2) soft detail—imageinformation at a low level of commu-nication; (3) texture—a repetitivechange in image tone with reasonablesharpness; and (4) sharp detail—aquality that provides strong image in-formation allowing easier reading ofthe subject.While we talk about the way the
zones look or are previsualized wewill also discuss how they relate to themeasurement of density in the printor negative where appropriate.
DARK ZONES (ZONES 0, I, AND II)Zone 0 (Black). Zone 0 is black.Think of this as the richest black toneyou can achieve on a piece of photo-graphic paper. True black is the ab-sence of reflection, but this is veryhard to accomplish. In terms of thenegative there is no usable density.The black in a photograph can give
richness or can absorb all the energyin the image. There are no hard andfast rules about the amount of Zone 0that will work in a photograph. Theblack establishes the bottom of theprint’s dynamic range and creates pat-tern, texture, and detail in dark-tonedareas of the image. Too much blackcan be detrimental to the quality ofthe photograph because no detail willbe visible in such areas, and detail iscritical to communicate your vision tothe viewer. Lacking detail, large areasof Zone 0 density can be thought ofas black holes that absorb energyfrom the photo as the eye movesacross the area.
30 FILM & DIGITAL TECHNIQUES FOR ZONE SYSTEM PHOTOGRAPHY
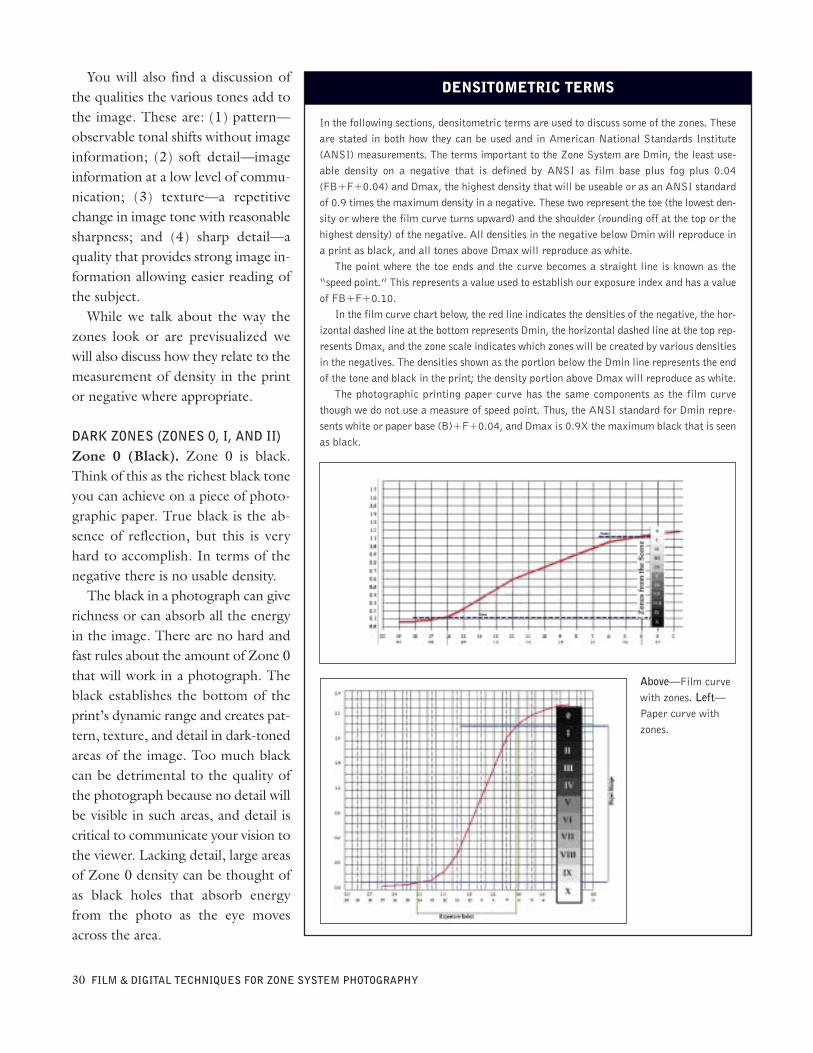
In the following sections, densitometric terms are used to discuss some of the zones. Theseare stated in both how they can be used and in American National Standards Institute(ANSI) measurements. The terms important to the Zone System are Dmin, the least use-able density on a negative that is defined by ANSI as film base plus fog plus 0.04(FB+F+0.04) and Dmax, the highest density that will be useable or as an ANSI standardof 0.9 times the maximum density in a negative. These two represent the toe (the lowest den-sity or where the film curve turns upward) and the shoulder (rounding off at the top or thehighest density) of the negative. All densities in the negative below Dmin will reproduce ina print as black, and all tones above Dmax will reproduce as white.
The point where the toe ends and the curve becomes a straight line is known as the“speed point.” This represents a value used to establish our exposure index and has a valueof FB+F+0.10.
In the film curve chart below, the red line indicates the densities of the negative, the hor-izontal dashed line at the bottom represents Dmin, the horizontal dashed line at the top rep-resents Dmax, and the zone scale indicates which zones will be created by various densitiesin the negatives. The densities shown as the portion below the Dmin line represents the endof the tone and black in the print; the density portion above Dmax will reproduce as white.
The photographic printing paper curve has the same components as the film curvethough we do not use a measure of speed point. Thus, the ANSI standard for Dmin repre-sents white or paper base (B)+F+0.04, and Dmax is 0.9X the maximum black that is seenas black.
DENSITOMETRIC TERMS
Above—Film curvewith zones. Left—Paper curve withzones.
Zone I (Near Black). This tone is visually discernable from Zone 0, butwithout black to compare it with, it might be wrongly assumed to be Zone0. In the previous chapter’s film speed test section, you learned about thesignificance of a densitometer reading of FB+F+0.10. Here, it is useful tonote that this value is equivalent to Zone I.As discussed on page 30, the densitometric value of FB+F+0.10 establishes
the starting point of the straight-line portion of the film’s curve. This is thepoint where we see the predictable change in density with increased units ofexposure. On a perceptual basis, this means that above this point, each one-stop increase in exposure will increase the density one zone. Thus, Zone I be-comes the point where the Zone System becomes most predictable. Thisconcept of predictability is what the Law of Reciprocity is all about. (Note:the Law of Reciprocity and characteristic curves are discussed in greater de-tail in the next chapter.)Finally, since Zone I is close to black, it has similar qualities to Zone 0; it
too creates pattern, texture, and detail in dark areas of the image. It also cre-ates subtleties in an image. Beginning photographers often eliminate Zone Iby using higher printing filters or higher grades of paper. This will flatten thepicture and can enlarge black holes. When we look at a scene this is the zonethat is normally seen as the darkest area.Zone II (Patterned Darkness). Zone II is the darkest tone that supports
any picture information beyond tone. In the print it will be about 5 percentreflective, which is just above the upper limit of what we normally call black.Soft detail and pattern can be perceived within these dark areas because ZoneII is not the darkest possible tone. However, it cannot display as much tex-ture or pattern as Zone III.
THE ZONE SCALE 31
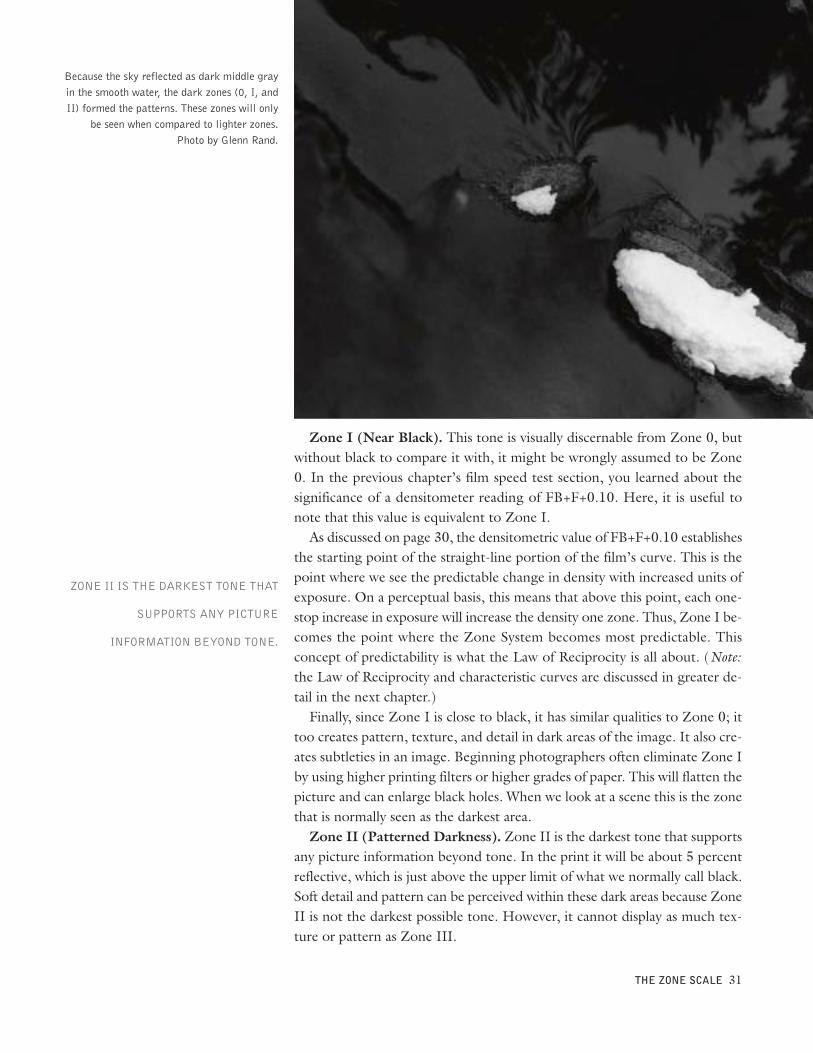
Because the sky reflected as dark middle grayin the smooth water, the dark zones (0, I, andII) formed the patterns. These zones will only
be seen when compared to lighter zones.Photo by Glenn Rand.
ZONE II IS THE DARKEST TONE THAT
SUPPORTS ANY PICTURE
INFORMATION BEYOND TONE.
Because Zone II is located directly on the straight-line portion of the film’scharacteristic curve it is the first zone that can be consistently placed. This isdone by taking a reflected light meter reading and underexposing by threestops. The concept of “placing” zones will be covered in detail in the nextchapter.
DETAIL ZONES (ZONES III, IV, V, VI, AND VII)Zone III (Shadow Detail). In many ways Zone III is the most importantzone. It is the darkest area of the scene where we can see sharp detail with fulltexture. Zone III sets the information flow in the image in much the sameway as the underlying melody sets the structure of a song.If you choose to have the majority of the information in Zone III, then the
photograph can easily take on a mysterious feel. In low key images Zone IIIwill carry the majority of the information since the higher zones in the detailarea will function more as highlight or accent areas than detail carriers.Regardless of the use you select for Zone III, it is a conscious zone. In
good photography it seldom just happens. You determine what scenic ele-ments must contain detail in the shadows and place that area in Zone III.Zone III is used as the base level for considering proper exposure. This is
because, no matter how you finesse the development, if you have not ex-posed to record the shadow detail it will not appear in the negative. For thisreason we commonly use Zone III as the metering zone for dark-tone me-tering and as one of the end points of average value metering (see page 43).This is difficult for beginning photographers, who often meter the darkestarea in a scene rather than a dark area with sharp detail.Zone IV (Dark Middle Gray). Zone IV is a transitional zone that is full
of detail. The tonal change from shadow to lightness starts at Zone IV. Theprogression through the two transitional zones, IV and VI, are very impor-tant in determining the contrast feeling of the photograph. If the transitionalzones are minimized, the image will look contrasty. Though we must attendto how Zone IV functions, it is not an issue of the amount of Zone IV in thepicture but how the zone helps transition from the shadows to lighter tones.Some photographers use this zone for dark-tone metering. By choosing
a tone only one stop below middle gray, the photographer shifts the detailconsideration to highlight separation as opposed to concern for shadowdetail.Zone V (Middle Gray). Zone V is often referred to as middle gray. It is
in the center of the tonal range and is within the reciprocity range (ZoneII–Zone VIII). Zone V reflects about 18 percent of the light falling on it. Be-cause meters are calibrated to this value, we can make both technical and aes-thetic judgments in relation to positioning against Zone V. (Note: Theconcepts of reciprocity range and zone placement will be covered in the fol-lowing chapter. Reread this section once you’ve worked through chapter 4 ifthese concepts are not yet clear to you.)
32 FILM & DIGITAL TECHNIQUES FOR ZONE SYSTEM PHOTOGRAPHY
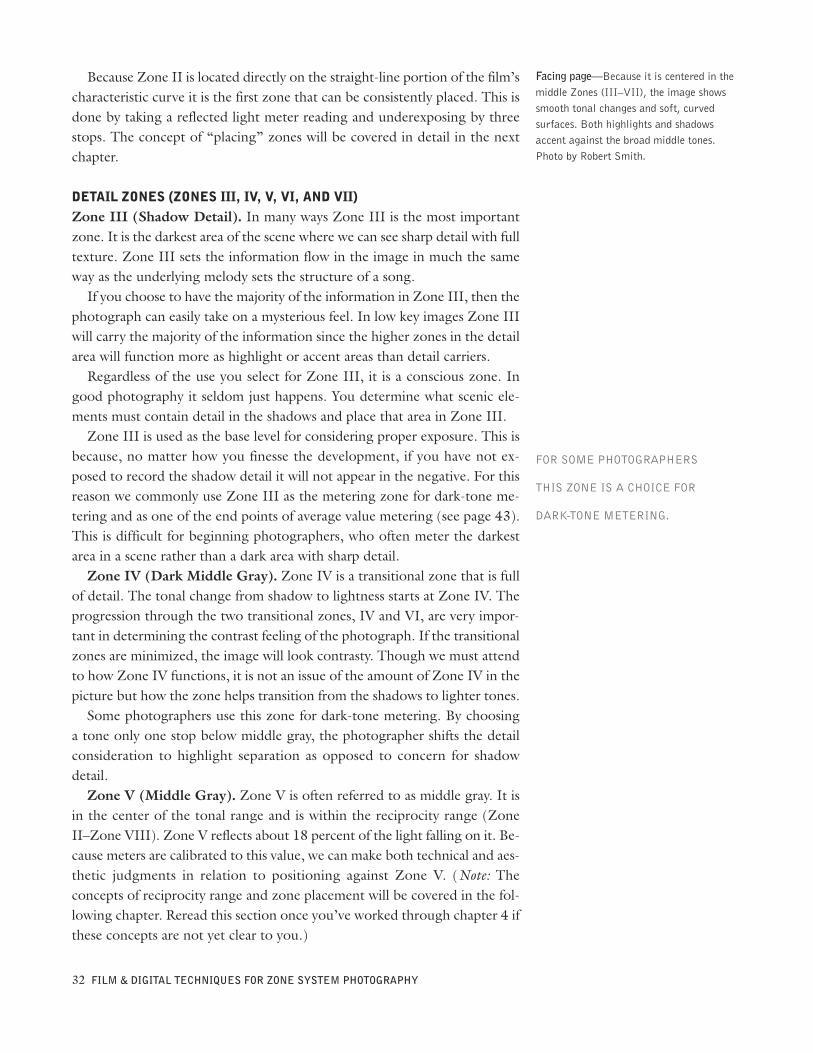
Facing page—Because it is centered in themiddle Zones (III–VII), the image showssmooth tonal changes and soft, curvedsurfaces. Both highlights and shadowsaccent against the broad middle tones.Photo by Robert Smith.
FOR SOME PHOTOGRAPHERS
THIS ZONE IS A CHOICE FOR
DARK-TONE METERING.
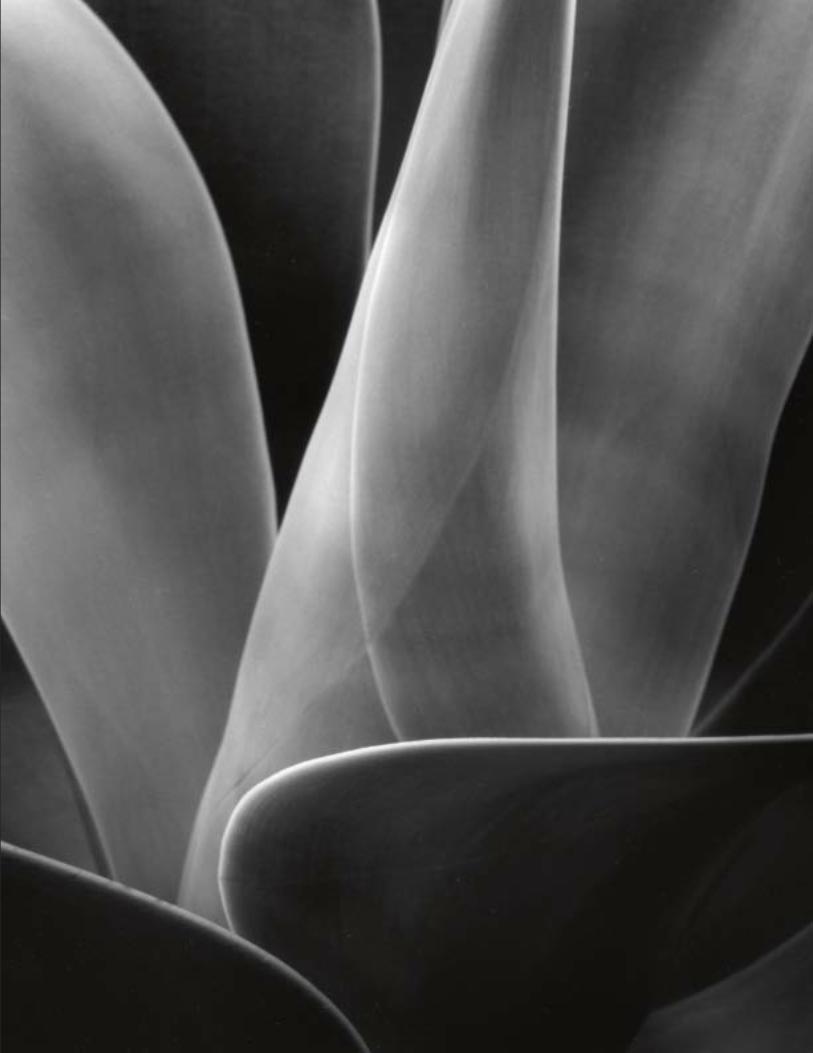
While many people interpret Zone V as darker than middle gray, it is bothin the center of the system and perceptually the midpoint of the grayscale.When seen in comparison to the lower zones its centrality becomes clear. Atthe center of the zones, Zone V acts a visual pivotal point for the system.Zone VI (Light Middle Gray). Zone VI is full of detail. The tonal change
from middle tones to highlights begins at this zone. Once again in this tran-sitional zone we need to attend to how this zone functions within the imagemore than the amount of the zone in the picture.Since bright areas appear to advance in a print, the highlight and accent
areas in this zone are very attractive to the eye. Note that Zone VI serves asthe base of high key imagery.This zone is also used in substitution metering. When photographing Cau-
casian portrait subjects, you can meter the palm of the hand instead of a graycard and open up one stop to create an effective image.Zone VII (Highlight Detail). At the light end of the detail area is Zone
VII. With a reflectivity of approximately 72 percent, this is the last zone inwhich sharp detail will be visible. Just as in Zone III, for the image to func-tion, the detail in Zone VII is critical. If the majority of detail falls in thiszone, the image will take on a soft, light, and airy feel. This is why we oftenuse higher key images to convey a romantic feel.
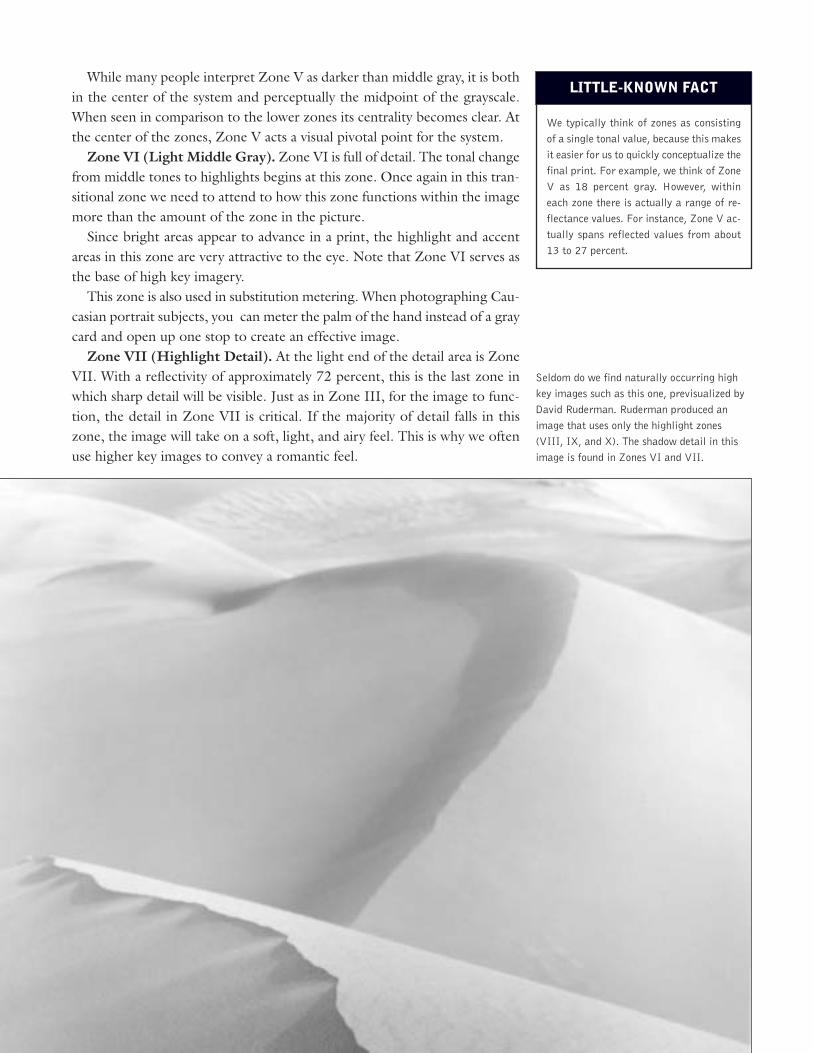
We typically think of zones as consistingof a single tonal value, because this makesit easier for us to quickly conceptualize thefinal print. For example, we think of ZoneV as 18 percent gray. However, withineach zone there is actually a range of re-flectance values. For instance, Zone V ac-tually spans reflected values from about13 to 27 percent.
LITTLE-KNOWN FACT
Seldom do we find naturally occurring highkey images such as this one, previsualized byDavid Ruderman. Ruderman produced animage that uses only the highlight zones(VIII, IX, and X). The shadow detail in thisimage is found in Zones VI and VII.
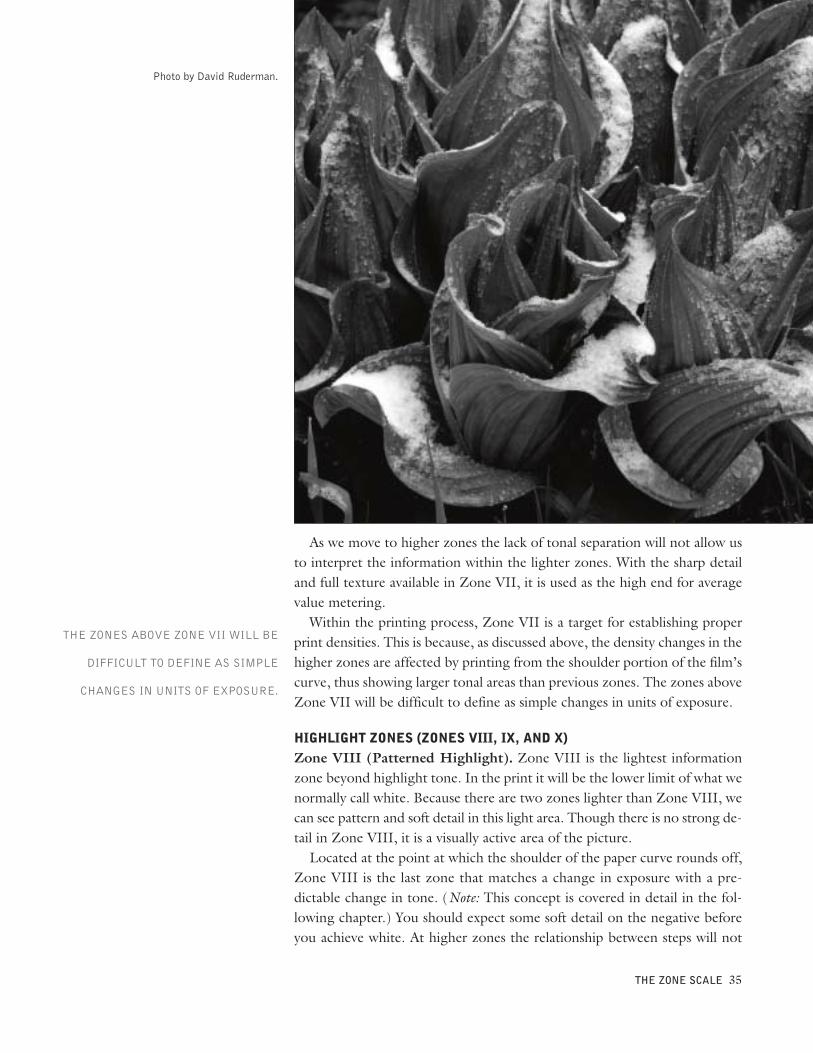
As we move to higher zones the lack of tonal separation will not allow usto interpret the information within the lighter zones. With the sharp detailand full texture available in Zone VII, it is used as the high end for averagevalue metering.Within the printing process, Zone VII is a target for establishing proper
print densities. This is because, as discussed above, the density changes in thehigher zones are affected by printing from the shoulder portion of the film’scurve, thus showing larger tonal areas than previous zones. The zones aboveZone VII will be difficult to define as simple changes in units of exposure.
HIGHLIGHT ZONES (ZONES VIII, IX, AND X)Zone VIII (Patterned Highlight). Zone VIII is the lightest informationzone beyond highlight tone. In the print it will be the lower limit of what wenormally call white. Because there are two zones lighter than Zone VIII, wecan see pattern and soft detail in this light area. Though there is no strong de-tail in Zone VIII, it is a visually active area of the picture.Located at the point at which the shoulder of the paper curve rounds off,
Zone VIII is the last zone that matches a change in exposure with a pre-dictable change in tone. (Note: This concept is covered in detail in the fol-lowing chapter.) You should expect some soft detail on the negative beforeyou achieve white. At higher zones the relationship between steps will not
THE ZONE SCALE 35
Photo by David Ruderman.
THE ZONES ABOVE ZONE VII WILL BE
DIFFICULT TO DEFINE AS SIMPLE
CHANGES IN UNITS OF EXPOSURE.
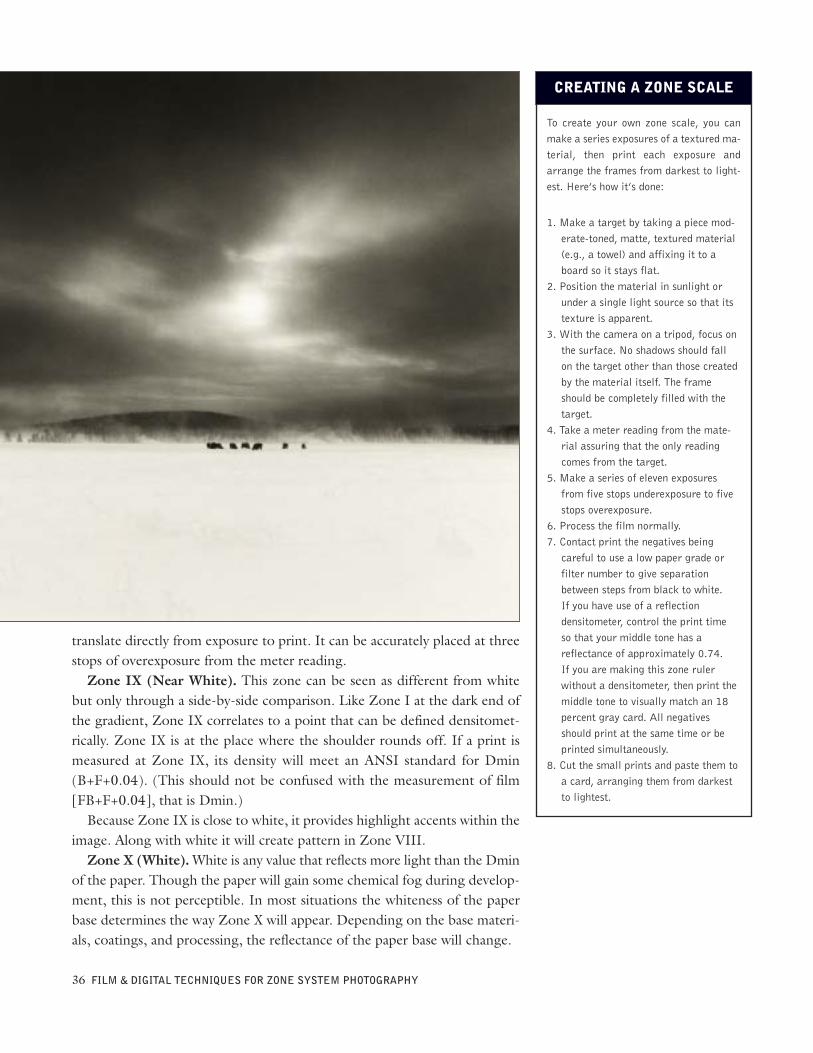
translate directly from exposure to print. It can be accurately placed at threestops of overexposure from the meter reading.Zone IX (Near White). This zone can be seen as different from white
but only through a side-by-side comparison. Like Zone I at the dark end ofthe gradient, Zone IX correlates to a point that can be defined densitomet-rically. Zone IX is at the place where the shoulder rounds off. If a print ismeasured at Zone IX, its density will meet an ANSI standard for Dmin(B+F+0.04). (This should not be confused with the measurement of film[FB+F+0.04], that is Dmin.)Because Zone IX is close to white, it provides highlight accents within the
image. Along with white it will create pattern in Zone VIII.Zone X (White).White is any value that reflects more light than the Dmin
of the paper. Though the paper will gain some chemical fog during develop-ment, this is not perceptible. In most situations the whiteness of the paperbase determines the way Zone X will appear. Depending on the base materi-als, coatings, and processing, the reflectance of the paper base will change.
36 FILM & DIGITAL TECHNIQUES FOR ZONE SYSTEM PHOTOGRAPHY
To create your own zone scale, you canmake a series exposures of a textured ma-terial, then print each exposure andarrange the frames from darkest to light-est. Here’s how it’s done:
1. Make a target by taking a piece mod-erate-toned, matte, textured material(e.g., a towel) and affixing it to aboard so it stays flat.
2. Position the material in sunlight orunder a single light source so that itstexture is apparent.
3. With the camera on a tripod, focus onthe surface. No shadows should fallon the target other than those createdby the material itself. The frameshould be completely filled with thetarget.
4. Take a meter reading from the mate-rial assuring that the only readingcomes from the target.
5. Make a series of eleven exposuresfrom five stops underexposure to fivestops overexposure.
6. Process the film normally.7. Contact print the negatives beingcareful to use a low paper grade orfilter number to give separationbetween steps from black to white.If you have use of a reflectiondensitometer, control the print timeso that your middle tone has areflectance of approximately 0.74.If you are making this zone rulerwithout a densitometer, then print themiddle tone to visually match an 18percent gray card. All negativesshould print at the same time or beprinted simultaneously.
8. Cut the small prints and paste them toa card, arranging them from darkestto lightest.
CREATING A ZONE SCALE
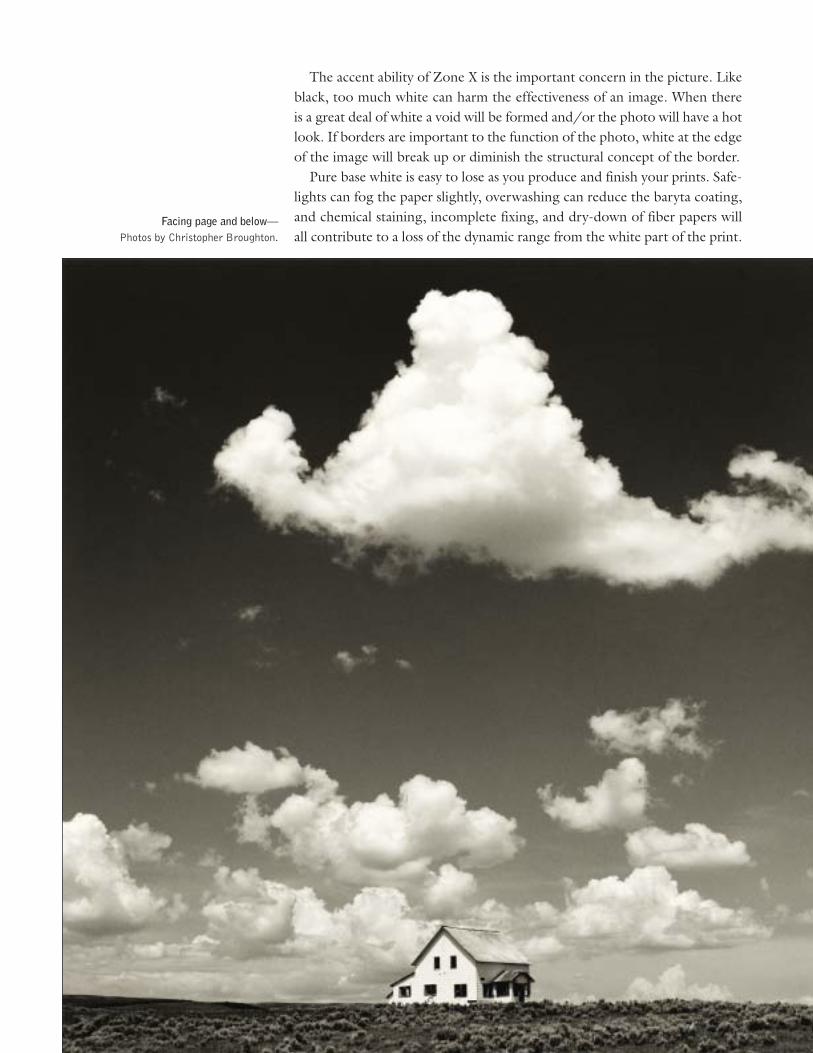
The accent ability of Zone X is the important concern in the picture. Likeblack, too much white can harm the effectiveness of an image. When thereis a great deal of white a void will be formed and/or the photo will have a hotlook. If borders are important to the function of the photo, white at the edgeof the image will break up or diminish the structural concept of the border.Pure base white is easy to lose as you produce and finish your prints. Safe-
lights can fog the paper slightly, overwashing can reduce the baryta coating,and chemical staining, incomplete fixing, and dry-down of fiber papers willall contribute to a loss of the dynamic range from the white part of the print.
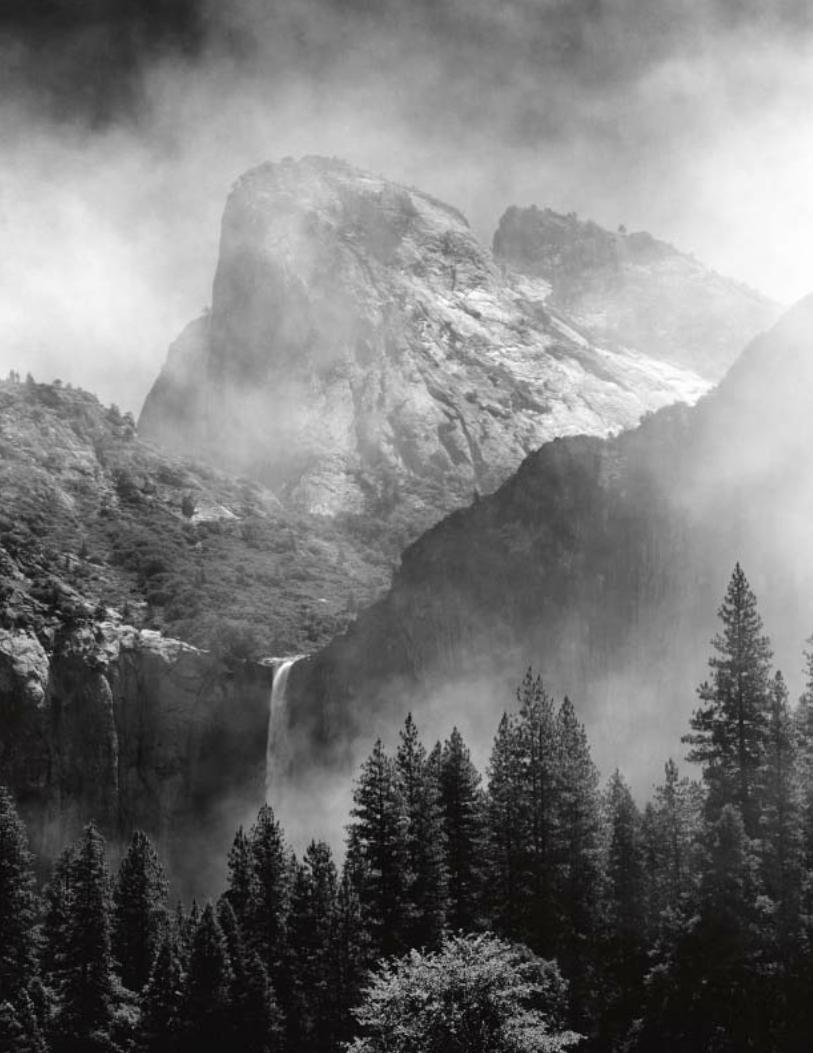
Facing page and below—Photos by Christopher Broughton.
Imagine for a moment that you wish to photograph a light-skinned woman.You meter her skin and get a recommended exposure of f/8 at 1/30 second.However, this exposure will render your subject’s skin tones as Zone V—middle gray. Obviously, this would be too dark for your fair-skinned subject.Fortunately, there is a remedy for this situation. For now, simply note that in-creasing the exposure will get you closer to your goal of creating a more re-alistic rendering of your subject. Note, too, that in order to do this you’llneed to practice a technique referred to as zone placement. This concept de-pends on some other important concepts though, so before we turn our at-tention to zone placement, we’ll need to understand a few other fundamentalconcepts.
THE LAW OF RECIPROCITYThe law of reciprocity is a key consideration when using the Zone System. Ina nutshell, the law states that as one part of the system is increased anotherpart of the system is decreased to keep the system in balance. At the centerof the photographic system is a 2:1 ratio. For instance, the amount of lightstriking the film is either doubled or halved when a one-stop exposure changeis made. Changing the aperture setting from f/8 to f/5.6 doubles the expo-sure and stopping down from f/8 to f/11 halves the exposure. A shutterspeed of one second gives two times the exposure as 1/2 second. The filmspeeds are also based on a 2:1 ratio. An ISO rating of 200 is twice as fast asISO 100.The law of reciprocity allows us to produce a series of equivalent expo-
sures by opening up or stopping down and changing the shutter speed set-ting accordingly. For example, an exposure setting of f/8 at 1/125 second isequivalent to a setting of f/11 at 1/60. The idea of equivalent exposures onlyworks because of reciprocity.Many photographers think of reciprocity as the change in exposure effec-
tiveness because of long exposure. That is actually reciprocity failure. We willdeal with reciprocity failure later in the book.
ZONE PLACEMENT 39
CHAPTER FOUR
ZONE PLACEMENT
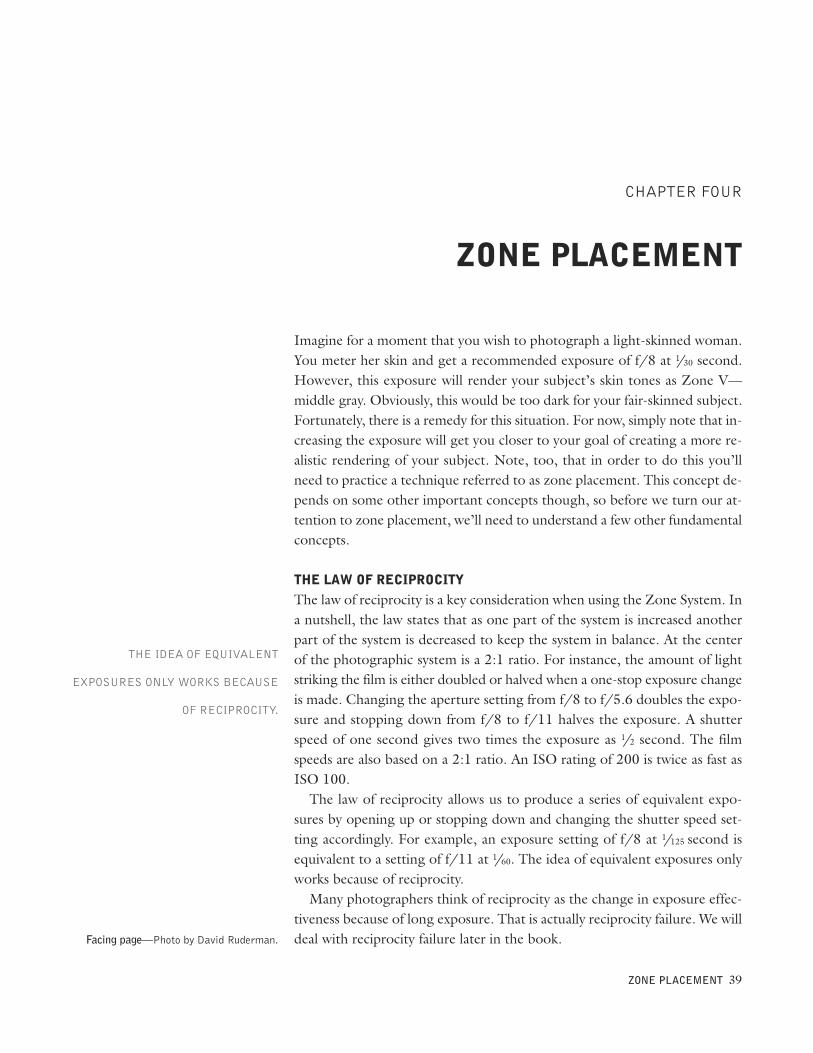
Facing page—Photo by David Ruderman.
THE IDEA OF EQUIVALENT
EXPOSURES ONLY WORKS BECAUSE
OF RECIPROCITY.
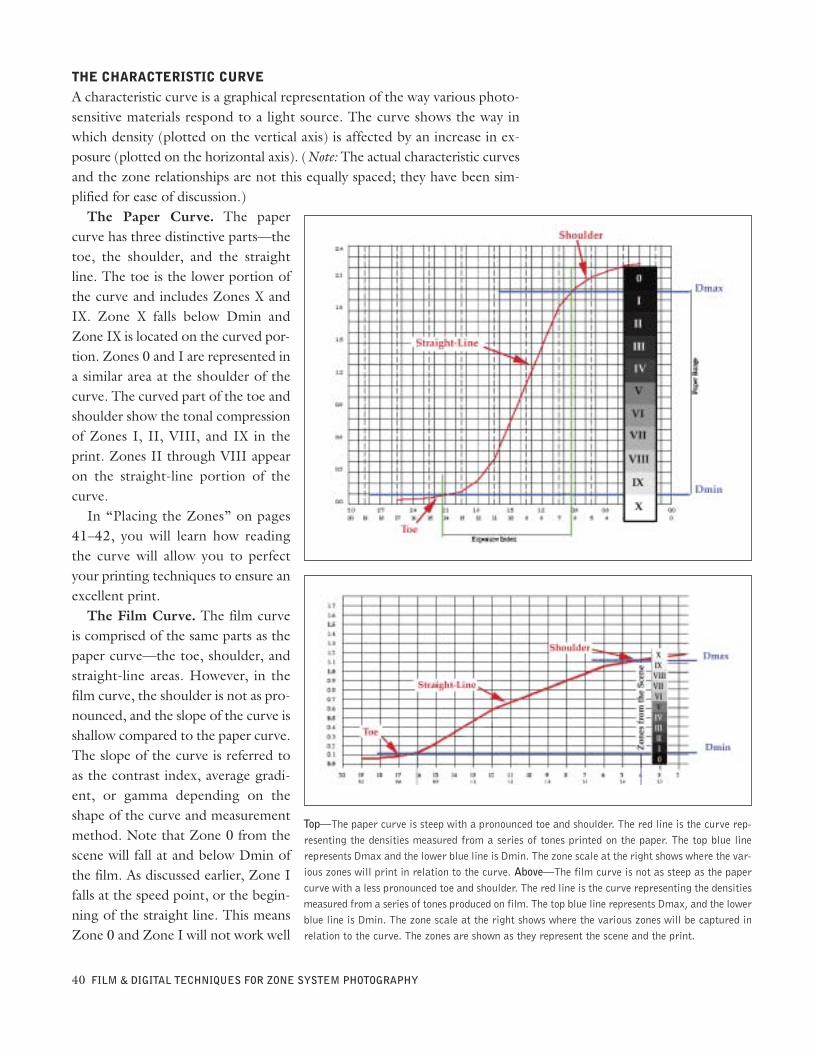
THE CHARACTERISTIC CURVEA characteristic curve is a graphical representation of the way various photo-sensitive materials respond to a light source. The curve shows the way inwhich density (plotted on the vertical axis) is affected by an increase in ex-posure (plotted on the horizontal axis). (Note: The actual characteristic curvesand the zone relationships are not this equally spaced; they have been sim-plified for ease of discussion.)The Paper Curve. The paper
curve has three distinctive parts—thetoe, the shoulder, and the straightline. The toe is the lower portion ofthe curve and includes Zones X andIX. Zone X falls below Dmin andZone IX is located on the curved por-tion. Zones 0 and I are represented ina similar area at the shoulder of thecurve. The curved part of the toe andshoulder show the tonal compressionof Zones I, II, VIII, and IX in theprint. Zones II through VIII appearon the straight-line portion of thecurve.In “Placing the Zones” on pages
41–42, you will learn how readingthe curve will allow you to perfectyour printing techniques to ensure anexcellent print.The Film Curve. The film curve
is comprised of the same parts as thepaper curve—the toe, shoulder, andstraight-line areas. However, in thefilm curve, the shoulder is not as pro-nounced, and the slope of the curve isshallow compared to the paper curve.The slope of the curve is referred toas the contrast index, average gradi-ent, or gamma depending on theshape of the curve and measurementmethod. Note that Zone 0 from thescene will fall at and below Dmin ofthe film. As discussed earlier, Zone Ifalls at the speed point, or the begin-ning of the straight line. This meansZone 0 and Zone I will not work well
40 FILM & DIGITAL TECHNIQUES FOR ZONE SYSTEM PHOTOGRAPHY
Top—The paper curve is steep with a pronounced toe and shoulder. The red line is the curve rep-resenting the densities measured from a series of tones printed on the paper. The top blue linerepresents Dmax and the lower blue line is Dmin. The zone scale at the right shows where the var-ious zones will print in relation to the curve. Above—The film curve is not as steep as the papercurve with a less pronounced toe and shoulder. The red line is the curve representing the densitiesmeasured from a series of tones produced on film. The top blue line represents Dmax, and the lowerblue line is Dmin. The zone scale at the right shows where the various zones will be captured inrelation to the curve. The zones are shown as they represent the scene and the print.
within a predictable linear relationship. While the areas are not as predictablewith a relationship between exposure and tonal change, we use the toe areafor Zones 0 and I to produce a negative with predictable and thus control-lable zones (II through VIII) on the straight-line portion of the curve. Sincethe film’s shoulder is not as pronounced as a paper curve, the function of ourzones extends to include Zone IX. Zone X from the scene will be above ourDmax and is beyond the linear relationship we are creating.
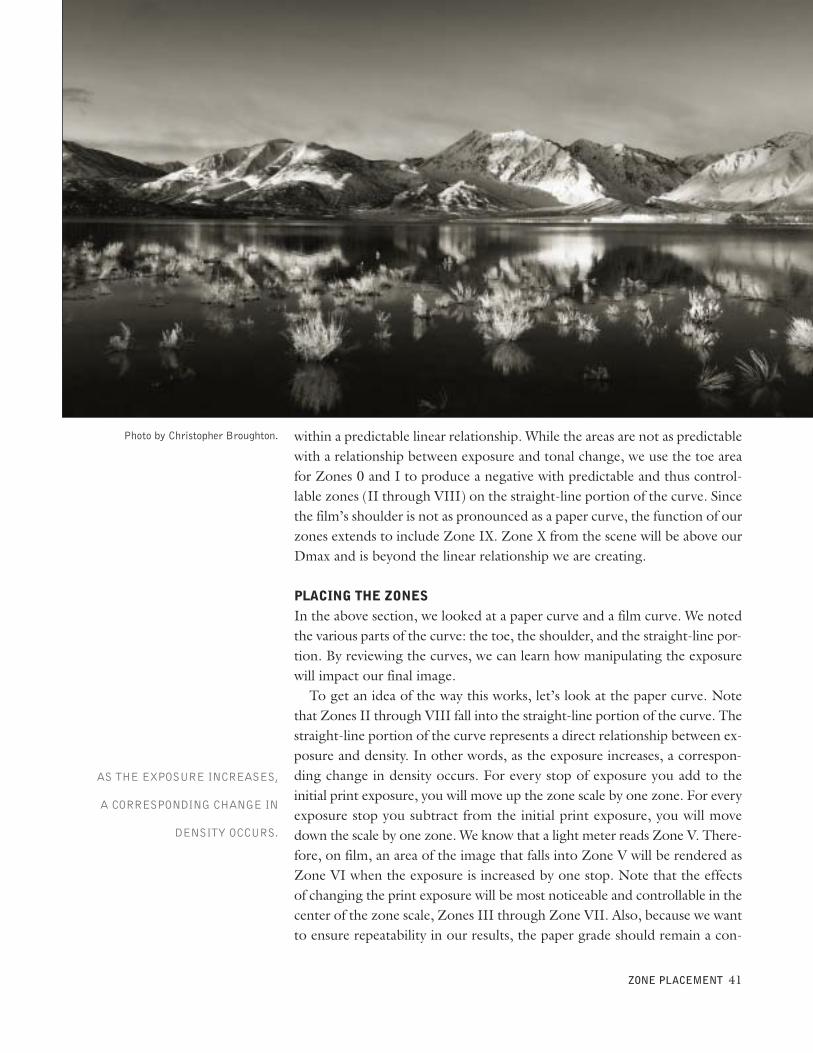
PLACING THE ZONESIn the above section, we looked at a paper curve and a film curve. We notedthe various parts of the curve: the toe, the shoulder, and the straight-line por-tion. By reviewing the curves, we can learn how manipulating the exposurewill impact our final image.To get an idea of the way this works, let’s look at the paper curve. Note
that Zones II through VIII fall into the straight-line portion of the curve. Thestraight-line portion of the curve represents a direct relationship between ex-posure and density. In other words, as the exposure increases, a correspon-ding change in density occurs. For every stop of exposure you add to theinitial print exposure, you will move up the zone scale by one zone. For everyexposure stop you subtract from the initial print exposure, you will movedown the scale by one zone. We know that a light meter reads Zone V. There-fore, on film, an area of the image that falls into Zone V will be rendered asZone VI when the exposure is increased by one stop. Note that the effectsof changing the print exposure will be most noticeable and controllable in thecenter of the zone scale, Zones III through Zone VII. Also, because we wantto ensure repeatability in our results, the paper grade should remain a con-
ZONE PLACEMENT 41
Photo by Christopher Broughton.
AS THE EXPOSURE INCREASES,
A CORRESPONDING CHANGE IN
DENSITY OCCURS.
stant. In this case, we used a grade 2 paper. We could also use a #2 filter withmulti-contrast paper.To summarize, then, you can use the following steps to ensure that the
tones in your image will match the previsualized photograph:
1. Previsualize the zone you wish to have appear in the final print.2. Meter the area of the scene that you wish to have in the final print. (The
reflective light meter reading will give an exposure to make Zone V.)3. Count the number of zones between the previsualized zone and Zone V.4. If the zone previsualized is lower than Zone V (e.g., Zone II, III, or
IV), then stop down the aperture or increase the shutter speed one stopfor each zone you wish to change. If the zone previsualized is higher(e.g., Zone VI, VII, VIII, or IX), then open up the aperture or decreasethe shutter speed one stop for each zone you wish to change.
5. Develop the film normally.
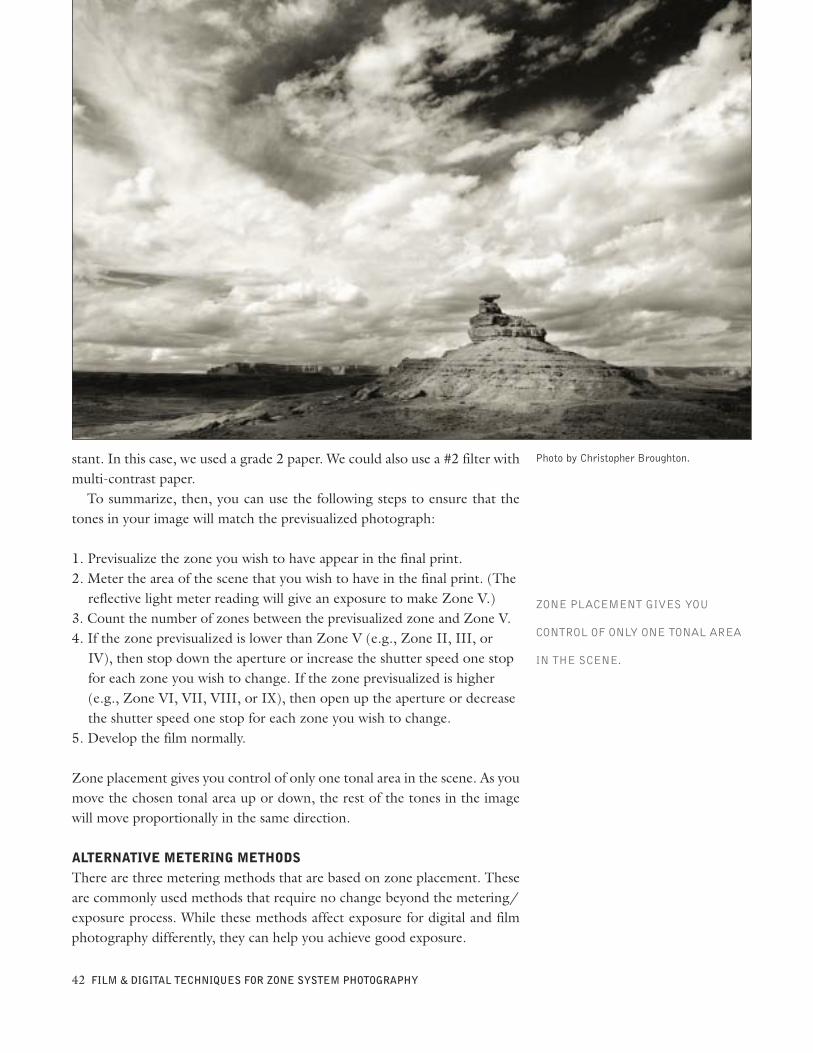
Zone placement gives you control of only one tonal area in the scene. As youmove the chosen tonal area up or down, the rest of the tones in the imagewill move proportionally in the same direction.
ALTERNATIVE METERING METHODSThere are three metering methods that are based on zone placement. Theseare commonly used methods that require no change beyond the metering/exposure process. While these methods affect exposure for digital and filmphotography differently, they can help you achieve good exposure.
42 FILM & DIGITAL TECHNIQUES FOR ZONE SYSTEM PHOTOGRAPHY
Photo by Christopher Broughton.
ZONE PLACEMENT GIVES YOU
CONTROL OF ONLY ONE TONAL AREA
IN THE SCENE.
Dark-Tone Metering. Perhaps the most useful and nontechnical approachto film exposure based on the Zone System is dark-tone metering. This ex-posure method commonly uses Zone III as the metering point for properexposure. It is a specific application of zone placement. Because image sen-sors do not tolerate overexposure, dark-tone metering is a very poor methodfor digital photography.Many photographers have heard the phrase, “Expose for the shadows and
develop for the highlights.” Shadow detail is less affected by developmentthan highlights, which are very susceptible to and controlled by changes indevelopment. Therefore, you need to expose for the shadow detail or it willnot be in the negative.You determine what part of the scene you want to be Zone III, shadow de-
tail, and take a reflective light meter reading in that tonal area. Then stopdown two stops from the meter reading for a correct exposure. When usingthis method, be sure to choose the area of the scene containing detail (ZoneIII) that is important to your photograph. Some photographers choose thedarkest area in the scene as their dark tone. When they do this, they over-expose by two or three stops. This is a very common mistake.Highlight Detail Metering.While not as common as dark-tone metering,
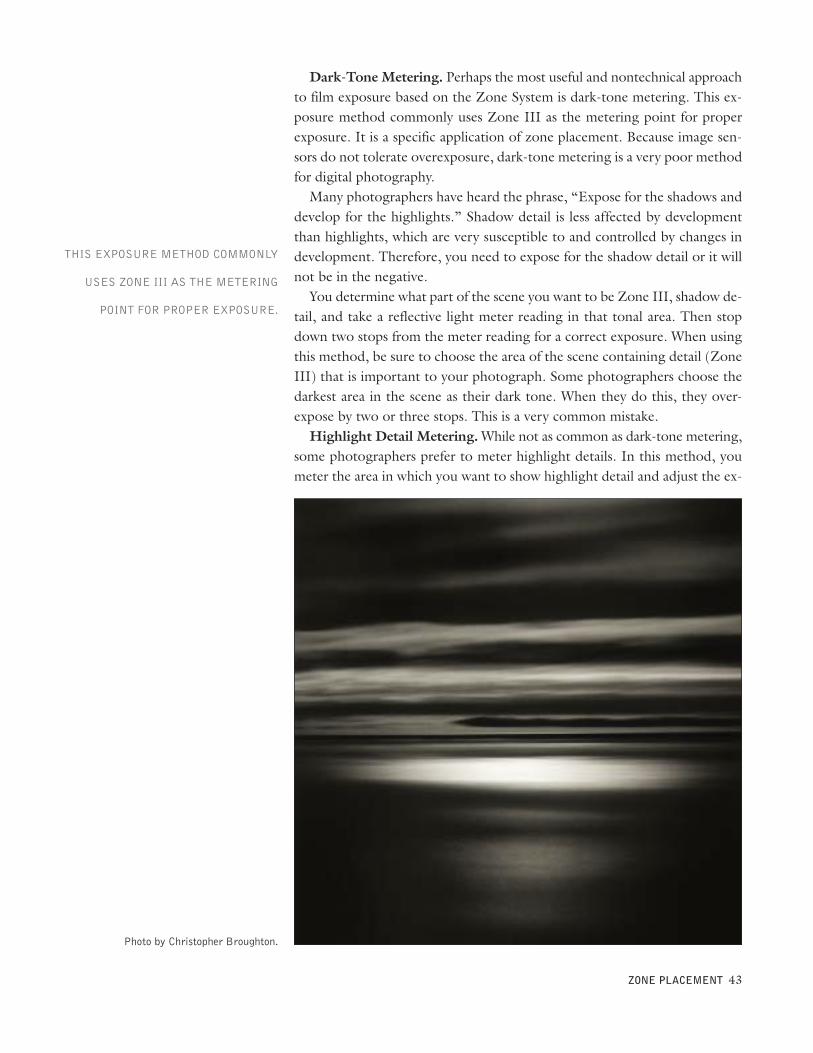
some photographers prefer to meter highlight details. In this method, youmeter the area in which you want to show highlight detail and adjust the ex-
ZONE PLACEMENT 43
Photo by Christopher Broughton.
THIS EXPOSURE METHOD COMMONLY
USES ZONE III AS THE METERING
POINT FOR PROPER EXPOSURE.
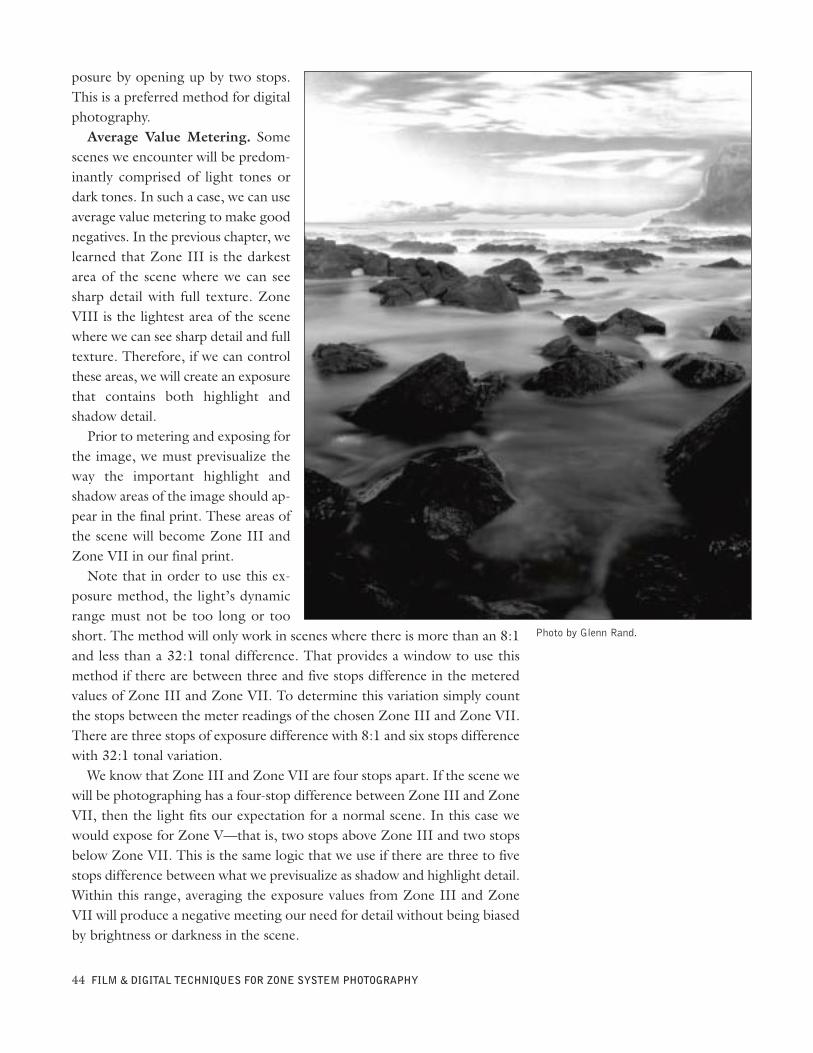
posure by opening up by two stops.This is a preferred method for digitalphotography.Average Value Metering. Some
scenes we encounter will be predom-inantly comprised of light tones ordark tones. In such a case, we can useaverage value metering to make goodnegatives. In the previous chapter, welearned that Zone III is the darkestarea of the scene where we can seesharp detail with full texture. ZoneVIII is the lightest area of the scenewhere we can see sharp detail and fulltexture. Therefore, if we can controlthese areas, we will create an exposurethat contains both highlight andshadow detail.Prior to metering and exposing for
the image, we must previsualize theway the important highlight andshadow areas of the image should ap-pear in the final print. These areas ofthe scene will become Zone III andZone VII in our final print.Note that in order to use this ex-
posure method, the light’s dynamicrange must not be too long or tooshort. The method will only work in scenes where there is more than an 8:1and less than a 32:1 tonal difference. That provides a window to use thismethod if there are between three and five stops difference in the meteredvalues of Zone III and Zone VII. To determine this variation simply countthe stops between the meter readings of the chosen Zone III and Zone VII.There are three stops of exposure difference with 8:1 and six stops differencewith 32:1 tonal variation.We know that Zone III and Zone VII are four stops apart. If the scene we
will be photographing has a four-stop difference between Zone III and ZoneVII, then the light fits our expectation for a normal scene. In this case wewould expose for Zone V—that is, two stops above Zone III and two stopsbelow Zone VII. This is the same logic that we use if there are three to fivestops difference between what we previsualize as shadow and highlight detail.Within this range, averaging the exposure values from Zone III and ZoneVII will produce a negative meeting our need for detail without being biasedby brightness or darkness in the scene.
44 FILM & DIGITAL TECHNIQUES FOR ZONE SYSTEM PHOTOGRAPHY
Photo by Glenn Rand.
As mentioned in chapter 2, light makes photography and vision possible. Be-yond understanding how light affects the scene we need to be concernedwith how light is related to the film’s sensitivity, exposure, and processing.
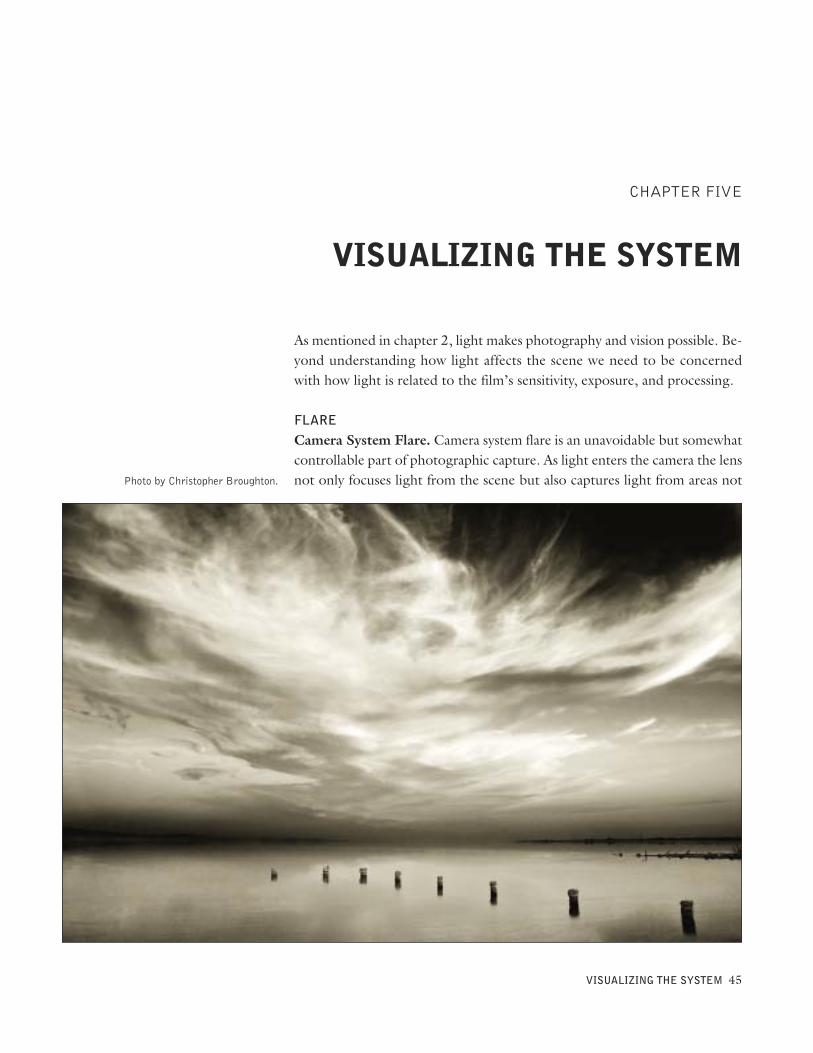
FLARECamera System Flare. Camera system flare is an unavoidable but somewhatcontrollable part of photographic capture. As light enters the camera the lensnot only focuses light from the scene but also captures light from areas not
VISUALIZING THE SYSTEM 45
CHAPTER FIVE
VISUALIZING THE SYSTEM
Photo by Christopher Broughton.
included in our viewfinder. This might be the sun shining on the lens fromjust outside the captured image, an overcast sky, or other environmental el-ements with high luminance or reflectance.Some of the light that enters the lens reflects off of the lens elements, fil-
ters, or interior surfaces of the camera and, finally, exposes the film. When thislight comes from a strong point source, polygons of light in the shape of theiris opening appear in the print. This can even occur when the sun is not di-rectly in the image, if its light strikes the lens.Scenic Flare.Glare, scenic brightness, overcast conditions, and bright skies
can create a less noticeable type of flare. When the light is diffuse or broad,flare creates a broad pattern of light that spreads over a larger part of the neg-ative or image sensor. Since it is diffuse, we do not recognize it in our nega-tives or digital files. It is not as blatant as those polygons of light—however,it is there.With film, the effect of this added light to the negative is not just additional
density that we will need to print through, it also alters the contrast range ofthe negative. Because we are adding light to areas of the negative that wouldbe unexposed or lightly exposed we raise the Dmin or the speed point of thefilm. It takes only a little increase in density to change the dark areas of a pic-ture. When we looked at the density of the negative we found that we wereadding only 0.10 to black to achieve Zone I. Moving up the straight-lineportion of the curve we needed additional density to move each successivezone. Therefore, adding an overall fogging created by flare to the film willhave a greater effect in the areas with the least density. These are the darkareas of the picture.Adding density to the shadow detail and toe areas of the negative and dig-
ital capture flattens the contrast. It also affects the highlight areas of the neg-ative, filling in detail or eliminating detail in the highlights. This makes itdifficult to obtain a discernable difference between Zones VIII and IX. Thisoften compounds the problem you have in making your photographs in over-cast or diffuse light situations. Because this light is diffuse to start with it willgive you a flatter image.Good technique, processing controls, and use of multicoated lenses and fil-
ters can reduce some ambient light flare, but nothing can totally remove theeffect. Your best defense in reducing the flare is to use a lens hood or shade.The black interior surfaces of the shade or hood will absorb some of the dif-fuse light and stop it from reaching the lens surface, thereby reducing flare.This is as important in diffuse lighting conditions as in direct sunlight.While not part of the picture taking process, you can produce flare when
printing in the darkroom. It can be generated from fingerprints, old enlarg-ing lenses, the use of white burning boards, or a white wall directly behindthe enlarger and will reduce contrast in the final print.If we think of the relationship between the parts of the capture-to-print
process we can think of the continuum of light as “scenic flare.” The light in
46 FILM & DIGITAL TECHNIQUES FOR ZONE SYSTEM PHOTOGRAPHY
The negative effect of flare is exception-ally pronounced in digital images, becausedigital capture is highly intolerant of over-exposure. Film, in contrast, is more for-giving of overexposure.
EXPOSURE LATITUDE
IT TAKES ONLY A LITTLE INCREASE
IN DENSITY TO CHANGE
THE DARK AREAS OF A PICTURE.
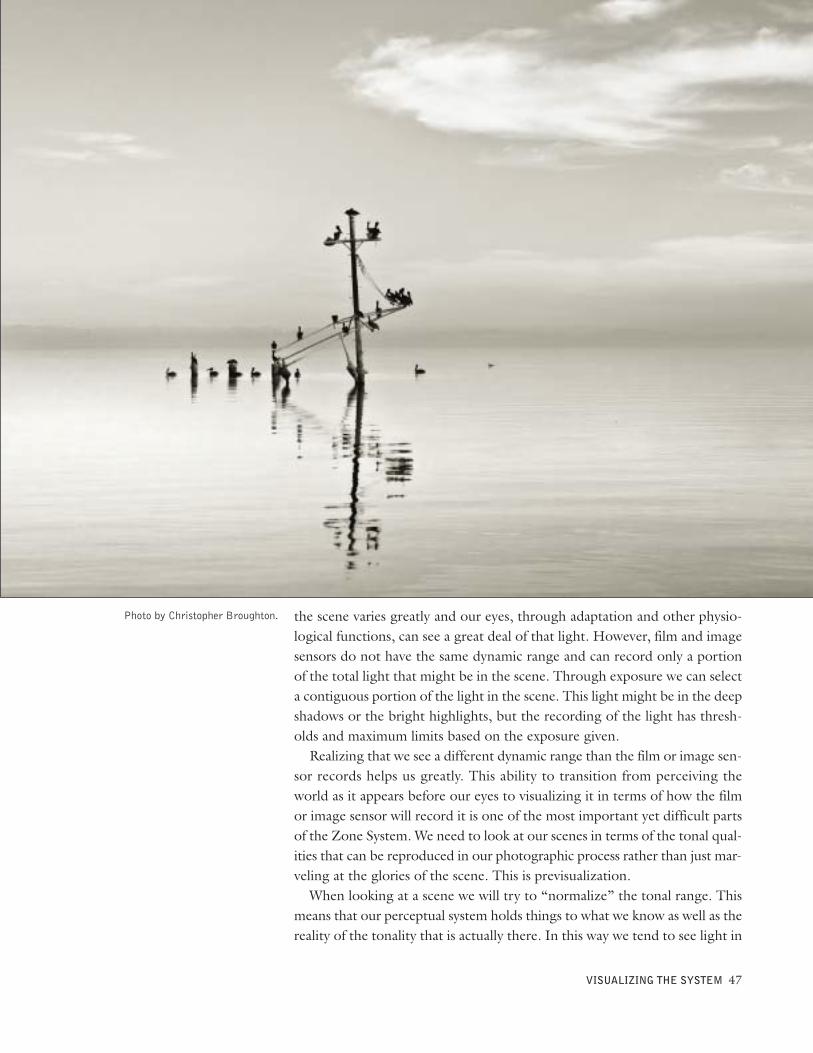
the scene varies greatly and our eyes, through adaptation and other physio-logical functions, can see a great deal of that light. However, film and imagesensors do not have the same dynamic range and can record only a portionof the total light that might be in the scene. Through exposure we can selecta contiguous portion of the light in the scene. This light might be in the deepshadows or the bright highlights, but the recording of the light has thresh-olds and maximum limits based on the exposure given.Realizing that we see a different dynamic range than the film or image sen-
sor records helps us greatly. This ability to transition from perceiving theworld as it appears before our eyes to visualizing it in terms of how the filmor image sensor will record it is one of the most important yet difficult partsof the Zone System. We need to look at our scenes in terms of the tonal qual-ities that can be reproduced in our photographic process rather than just mar-veling at the glories of the scene. This is previsualization.When looking at a scene we will try to “normalize” the tonal range. This
means that our perceptual system holds things to what we know as well as thereality of the tonality that is actually there. In this way we tend to see light in
VISUALIZING THE SYSTEM 47
Photo by Christopher Broughton.
most scenes as normal. But in the photographic process there are severalother concepts that can be seen as normal: There are the standards set by theISO (International Standards Organization) and the manufacturers. Thesedefine the slope of the straight-line portion of the film, establishing sensor orfilm speeds and establishing specific values for the outcome of the process.The process of exposing and processing the film is controlled, and this is theconcept that is used to establish the film speed. We will use this later to es-tablish working speeds for the Zone System.There is a limit to the range of tones the film can record and reproduce
within the exposure and processing system. While we may like the light on asunny day, this light may be beyond the “normal” expectations of the film.Depending on the humidity of the atmosphere, the light will exceed the dy-namic range of the film by as many as three stops. In this case, with normaldevelopment, we could not reproduce either the highlight or shadows orparts of both.For film, normal light is flatter,
slightly diffuse light that will closelymatch the film’s ability to render thescene, giving you a negative that willprint well. If the light is not normalfor the dynamic range, developmentcan be manipulated to allow the neg-ative to print acceptably.
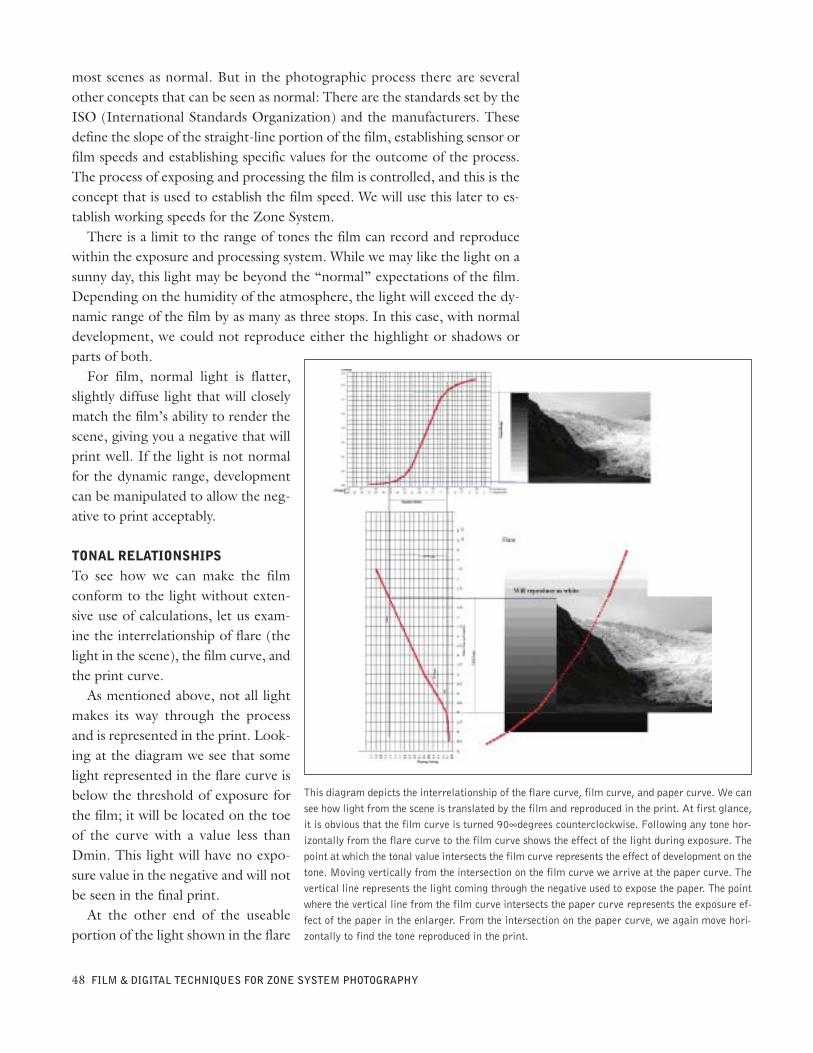
TONAL RELATIONSHIPSTo see how we can make the filmconform to the light without exten-sive use of calculations, let us exam-ine the interrelationship of flare (thelight in the scene), the film curve, andthe print curve.As mentioned above, not all light
makes its way through the processand is represented in the print. Look-ing at the diagram we see that somelight represented in the flare curve isbelow the threshold of exposure forthe film; it will be located on the toeof the curve with a value less thanDmin. This light will have no expo-sure value in the negative and will notbe seen in the final print.At the other end of the useable
portion of the light shown in the flare
48 FILM & DIGITAL TECHNIQUES FOR ZONE SYSTEM PHOTOGRAPHY
This diagram depicts the interrelationship of the flare curve, film curve, and paper curve. We cansee how light from the scene is translated by the film and reproduced in the print. At first glance,it is obvious that the film curve is turned 90∞degrees counterclockwise. Following any tone hor-izontally from the flare curve to the film curve shows the effect of the light during exposure. Thepoint at which the tonal value intersects the film curve represents the effect of development on thetone. Moving vertically from the intersection on the film curve we arrive at the paper curve. Thevertical line represents the light coming through the negative used to expose the paper. The pointwhere the vertical line from the film curve intersects the paper curve represents the exposure ef-fect of the paper in the enlarger. From the intersection on the paper curve, we again move hori-zontally to find the tone reproduced in the print.
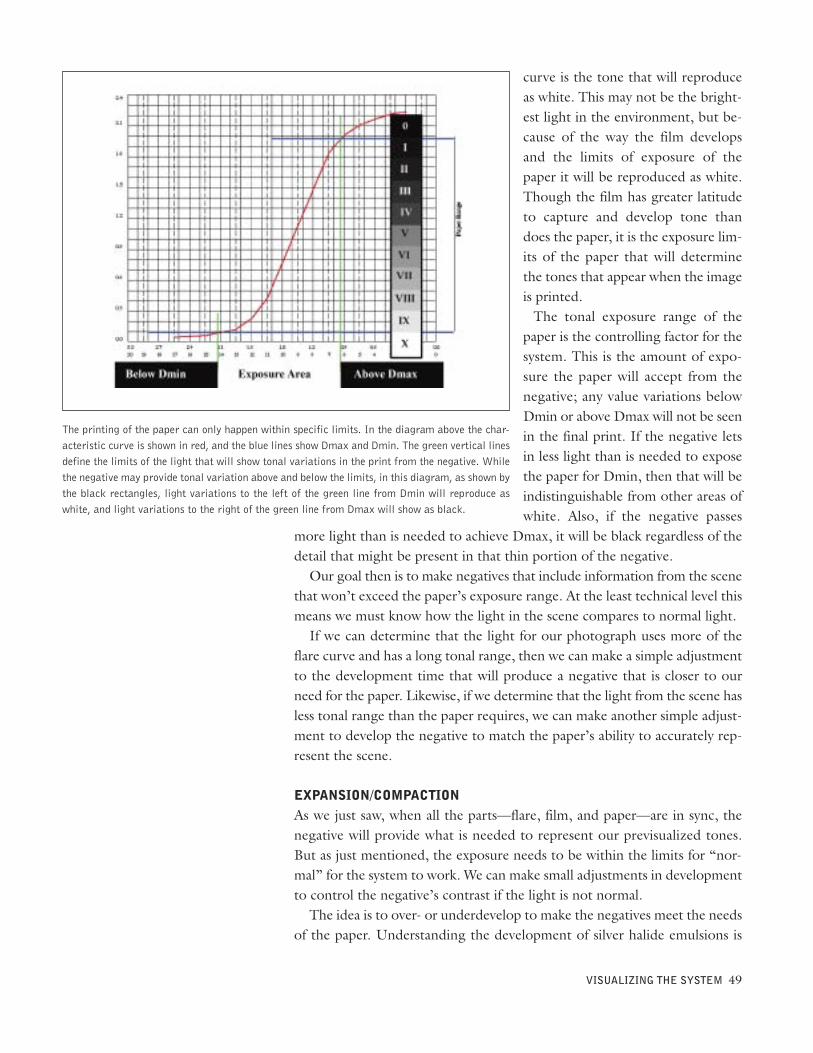
curve is the tone that will reproduceas white. This may not be the bright-est light in the environment, but be-cause of the way the film developsand the limits of exposure of thepaper it will be reproduced as white.Though the film has greater latitudeto capture and develop tone thandoes the paper, it is the exposure lim-its of the paper that will determinethe tones that appear when the imageis printed.The tonal exposure range of the
paper is the controlling factor for thesystem. This is the amount of expo-sure the paper will accept from thenegative; any value variations belowDmin or above Dmax will not be seenin the final print. If the negative letsin less light than is needed to exposethe paper for Dmin, then that will beindistinguishable from other areas ofwhite. Also, if the negative passes
more light than is needed to achieve Dmax, it will be black regardless of thedetail that might be present in that thin portion of the negative.Our goal then is to make negatives that include information from the scene
that won’t exceed the paper’s exposure range. At the least technical level thismeans we must know how the light in the scene compares to normal light.If we can determine that the light for our photograph uses more of the
flare curve and has a long tonal range, then we can make a simple adjustmentto the development time that will produce a negative that is closer to ourneed for the paper. Likewise, if we determine that the light from the scene hasless tonal range than the paper requires, we can make another simple adjust-ment to develop the negative to match the paper’s ability to accurately rep-resent the scene.
EXPANSION/COMPACTIONAs we just saw, when all the parts—flare, film, and paper—are in sync, thenegative will provide what is needed to represent our previsualized tones.But as just mentioned, the exposure needs to be within the limits for “nor-mal” for the system to work. We can make small adjustments in developmentto control the negative’s contrast if the light is not normal.The idea is to over- or underdevelop to make the negatives meet the needs
of the paper. Understanding the development of silver halide emulsions is
VISUALIZING THE SYSTEM 49
The printing of the paper can only happen within specific limits. In the diagram above the char-acteristic curve is shown in red, and the blue lines show Dmax and Dmin. The green vertical linesdefine the limits of the light that will show tonal variations in the print from the negative. Whilethe negative may provide tonal variation above and below the limits, in this diagram, as shown bythe black rectangles, light variations to the left of the green line from Dmin will reproduce aswhite, and light variations to the right of the green line from Dmax will show as black.
key to being able to change the development to create negatives that “fit” thepaper’s exposure range.Development has a greater effect on highlights than on shadows. As we in-
crease development there is a buildup in density, with more density in areasof greater exposure. As the film curve shows, as you give more developmentthere is an increasing spread of the two curves as you get farther from the toe.The opposite is also true; with controlled underdevelopment the negativeloses density more toward the shoulder.When the development changes beyond the increase or decrease in den-
sity compared to exposure, there is also a change in the amount of useablelight from the scene. Changes in development make the film function betterif there is a “non-normal” light situation.To see this in the interrelated graphs we start at the paper curve and fol-
low down vertically from both Dmin and Dmax. These are the limits for theamount of light from the film that will fit within the range of the paper. If wethen change the angle (slope) of the film curve, we can see that less or moreof the scenic flare curve is useable as we move horizontally from the inter-section points of the vertical lines from the paper and the new film curve.
50 FILM & DIGITAL TECHNIQUES FOR ZONE SYSTEM PHOTOGRAPHY
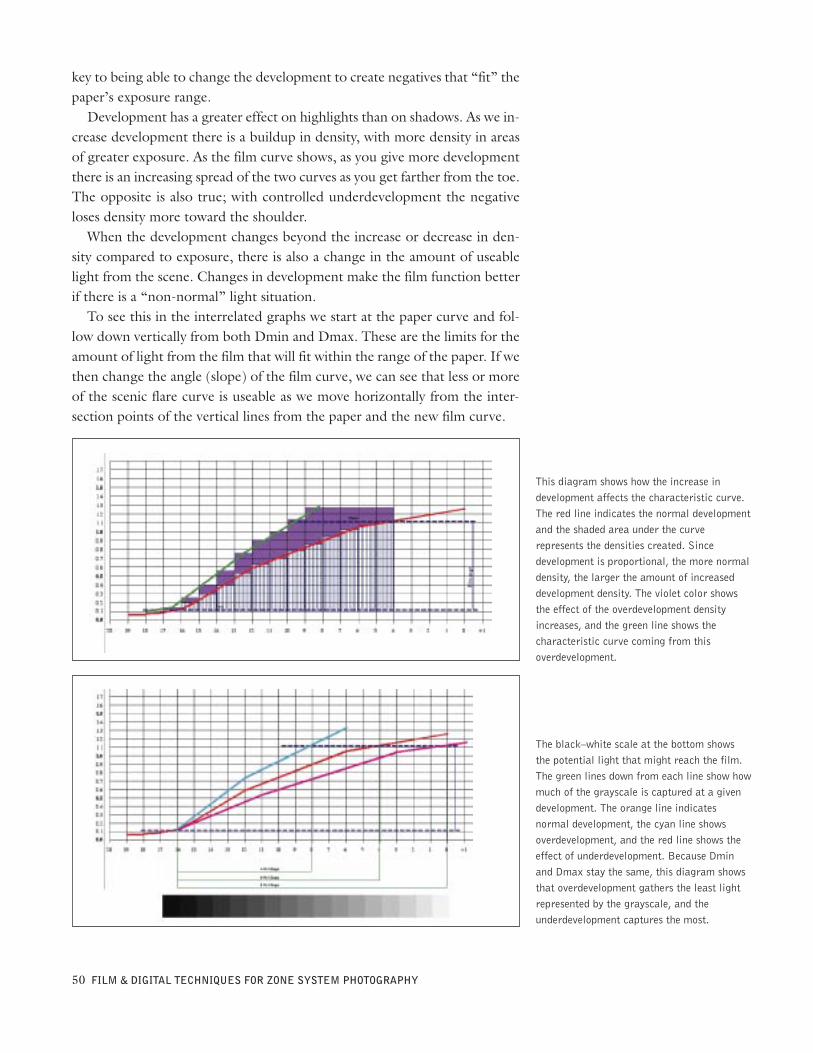
This diagram shows how the increase indevelopment affects the characteristic curve.The red line indicates the normal developmentand the shaded area under the curverepresents the densities created. Sincedevelopment is proportional, the more normaldensity, the larger the amount of increaseddevelopment density. The violet color showsthe effect of the overdevelopment densityincreases, and the green line shows thecharacteristic curve coming from thisoverdevelopment.
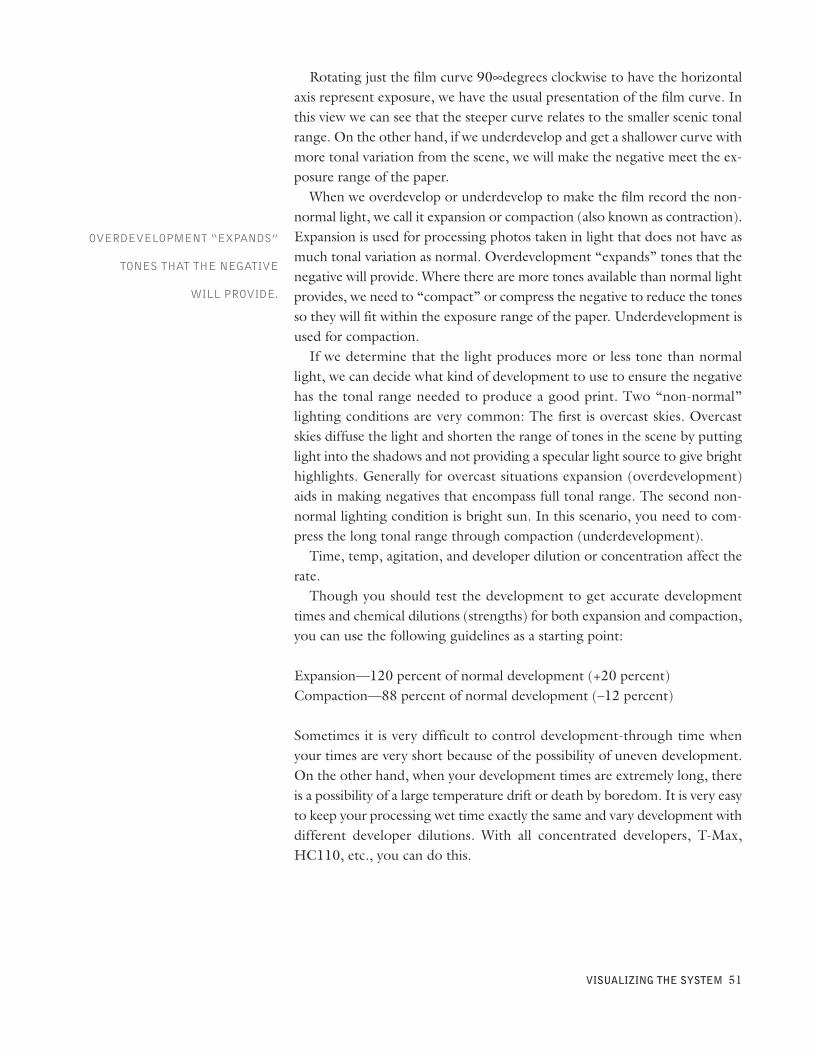
The black–white scale at the bottom showsthe potential light that might reach the film.The green lines down from each line show howmuch of the grayscale is captured at a givendevelopment. The orange line indicatesnormal development, the cyan line showsoverdevelopment, and the red line shows theeffect of underdevelopment. Because Dminand Dmax stay the same, this diagram showsthat overdevelopment gathers the least lightrepresented by the grayscale, and theunderdevelopment captures the most.
Rotating just the film curve 90∞degrees clockwise to have the horizontalaxis represent exposure, we have the usual presentation of the film curve. Inthis view we can see that the steeper curve relates to the smaller scenic tonalrange. On the other hand, if we underdevelop and get a shallower curve withmore tonal variation from the scene, we will make the negative meet the ex-posure range of the paper.When we overdevelop or underdevelop to make the film record the non-
normal light, we call it expansion or compaction (also known as contraction).Expansion is used for processing photos taken in light that does not have asmuch tonal variation as normal. Overdevelopment “expands” tones that thenegative will provide. Where there are more tones available than normal lightprovides, we need to “compact” or compress the negative to reduce the tonesso they will fit within the exposure range of the paper. Underdevelopment isused for compaction.If we determine that the light produces more or less tone than normal
light, we can decide what kind of development to use to ensure the negativehas the tonal range needed to produce a good print. Two “non-normal”lighting conditions are very common: The first is overcast skies. Overcastskies diffuse the light and shorten the range of tones in the scene by puttinglight into the shadows and not providing a specular light source to give brighthighlights. Generally for overcast situations expansion (overdevelopment)aids in making negatives that encompass full tonal range. The second non-normal lighting condition is bright sun. In this scenario, you need to com-press the long tonal range through compaction (underdevelopment).Time, temp, agitation, and developer dilution or concentration affect the
rate.Though you should test the development to get accurate development
times and chemical dilutions (strengths) for both expansion and compaction,you can use the following guidelines as a starting point:
Expansion—120 percent of normal development (+20 percent)Compaction—88 percent of normal development (–12 percent)
Sometimes it is very difficult to control development-through time whenyour times are very short because of the possibility of uneven development.On the other hand, when your development times are extremely long, thereis a possibility of a large temperature drift or death by boredom. It is very easyto keep your processing wet time exactly the same and vary development withdifferent developer dilutions. With all concentrated developers, T-Max,HC110, etc., you can do this.
VISUALIZING THE SYSTEM 51
OVERDEVELOPMENT “EXPANDS”
TONES THAT THE NEGATIVE
WILL PROVIDE.
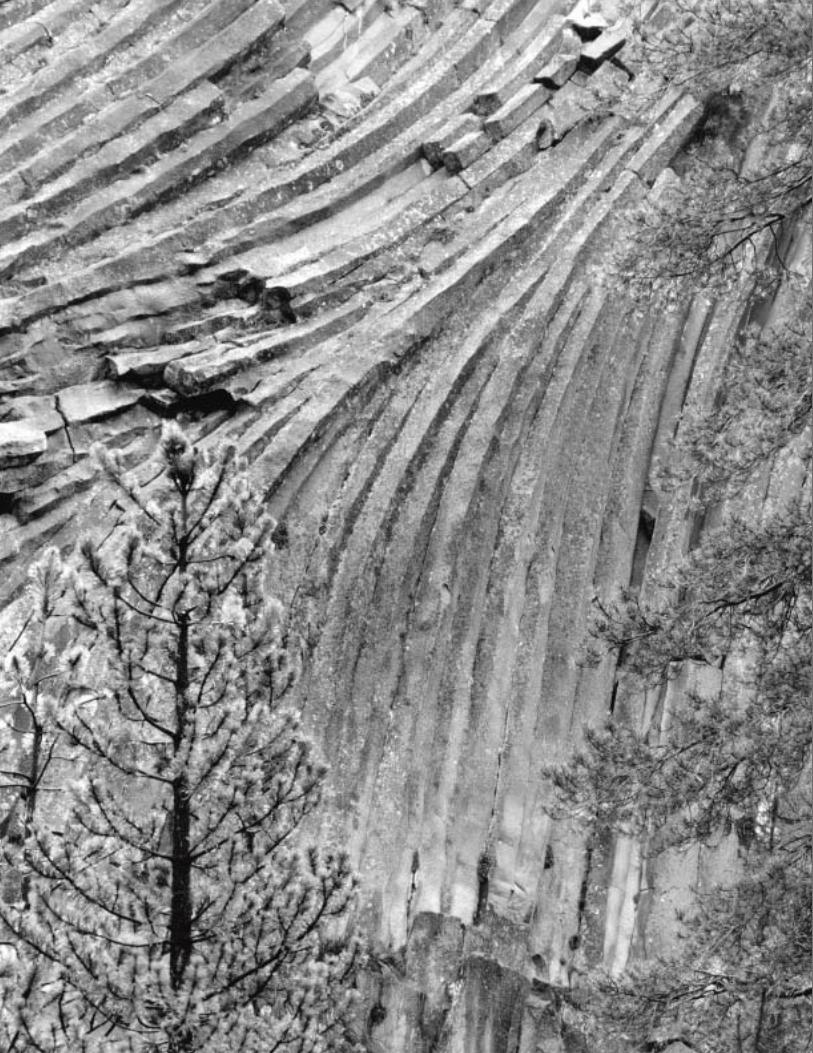
In looking at the technical side of the Zone System, we see three distinctparts of the process of moving from the scene to the print that we previsual-ized. These are the print, the light in the scene, and the negative’s develop-ment. If the process were an algebraic formula, one part would be a constant,one part would be an independent variable, and one part would be a de-pendent variable.Let us define how these might function in an abstract mathematical struc-
ture to simplify and show how the Zone System works. In our algebraic for-mula, the constant is the goal, and the dependent variable controls the effectsof the independent variable. If we have the equation:
Print = Light x Development
we can see how simple the Zone System is at its base.In this equation the print is the constant. The paper has a limited exposure
range. Though the paper functions as a constant, in nature the light is beyondour control (i.e., it is an independent variable). Since the film’s developmentchanges its slope and thus its ability to capture varying dynamic ranges, thiscontrols the amount of light that can be passed to paper. The film’s devel-opment functions as a dependent variable. In the Zone System we are striv-ing for the great print by adapting to the changing light of the scene.To make the system work we need information about what the paper’s
range requires and how to make the film produce that range. This means wemust test the paper and film beyond the levels we have discussed to this point.We will use densitometric information to define our paper’s constant valueand the effects of the film’s development to adapt to changes in the lightenvironment.
THE PAPERBecause the Zone System is based on a group of interrelated standards, weneed to stick with our chosen or tested standard. To find the paper’s standard
DEVELOPMENT 53
CHAPTER SIX
DEVELOPMENT
Facing page—Photo by Glenn Rand.
THOUGH THE PAPER FUNCTIONS AS
A CONSTANT, IN NATURE THE LIGHT
IS BEYOND OUR CONTROL.
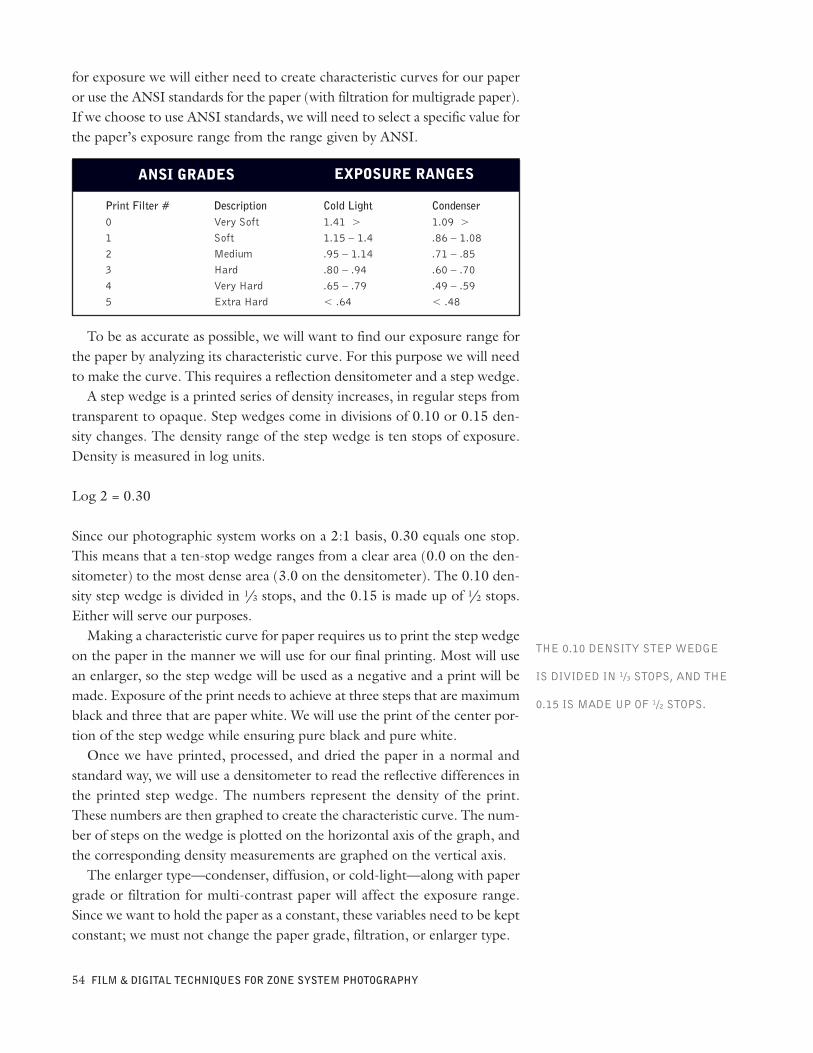
for exposure we will either need to create characteristic curves for our paperor use the ANSI standards for the paper (with filtration for multigrade paper).If we choose to use ANSI standards, we will need to select a specific value forthe paper’s exposure range from the range given by ANSI.
To be as accurate as possible, we will want to find our exposure range forthe paper by analyzing its characteristic curve. For this purpose we will needto make the curve. This requires a reflection densitometer and a step wedge.A step wedge is a printed series of density increases, in regular steps from
transparent to opaque. Step wedges come in divisions of 0.10 or 0.15 den-sity changes. The density range of the step wedge is ten stops of exposure.Density is measured in log units.
Log 2 = 0.30
Since our photographic system works on a 2:1 basis, 0.30 equals one stop.This means that a ten-stop wedge ranges from a clear area (0.0 on the den-sitometer) to the most dense area (3.0 on the densitometer). The 0.10 den-sity step wedge is divided in 1/3 stops, and the 0.15 is made up of 1/2 stops.Either will serve our purposes.Making a characteristic curve for paper requires us to print the step wedge
on the paper in the manner we will use for our final printing. Most will usean enlarger, so the step wedge will be used as a negative and a print will bemade. Exposure of the print needs to achieve at three steps that are maximumblack and three that are paper white. We will use the print of the center por-tion of the step wedge while ensuring pure black and pure white.Once we have printed, processed, and dried the paper in a normal and
standard way, we will use a densitometer to read the reflective differences inthe printed step wedge. The numbers represent the density of the print.These numbers are then graphed to create the characteristic curve. The num-ber of steps on the wedge is plotted on the horizontal axis of the graph, andthe corresponding density measurements are graphed on the vertical axis.The enlarger type—condenser, diffusion, or cold-light—along with paper
grade or filtration for multi-contrast paper will affect the exposure range.Since we want to hold the paper as a constant, these variables need to be keptconstant; we must not change the paper grade, filtration, or enlarger type.
54 FILM & DIGITAL TECHNIQUES FOR ZONE SYSTEM PHOTOGRAPHY
ANSI GRADES EXPOSURE RANGES
Print Filter #012345
DescriptionVery SoftSoftMediumHardVery HardExtra Hard
Cold Light1.41 >1.15 – 1.4.95 – 1.14.80 – .94.65 – .79< .64
Condenser1.09 >.86 – 1.08.71 – .85.60 – .70.49 – .59< .48
THE 0.10 DENSITY STEP WEDGE
IS DIVIDED IN 1/3 STOPS, AND THE
0.15 IS MADE UP OF 1/2 STOPS.
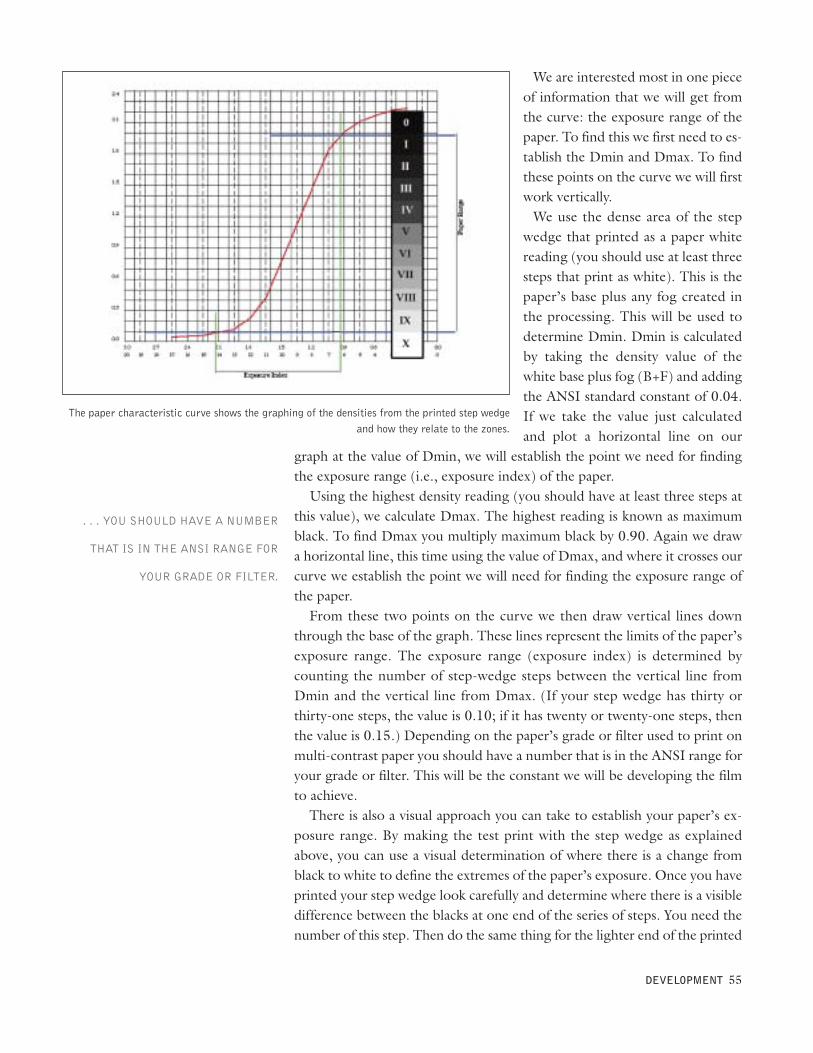
We are interested most in one pieceof information that we will get fromthe curve: the exposure range of thepaper. To find this we first need to es-tablish the Dmin and Dmax. To findthese points on the curve we will firstwork vertically.We use the dense area of the step
wedge that printed as a paper whitereading (you should use at least threesteps that print as white). This is thepaper’s base plus any fog created inthe processing. This will be used todetermine Dmin. Dmin is calculatedby taking the density value of thewhite base plus fog (B+F) and addingthe ANSI standard constant of 0.04.If we take the value just calculatedand plot a horizontal line on our
graph at the value of Dmin, we will establish the point we need for findingthe exposure range (i.e., exposure index) of the paper.Using the highest density reading (you should have at least three steps at
this value), we calculate Dmax. The highest reading is known as maximumblack. To find Dmax you multiply maximum black by 0.90. Again we drawa horizontal line, this time using the value of Dmax, and where it crosses ourcurve we establish the point we will need for finding the exposure range ofthe paper.From these two points on the curve we then draw vertical lines down
through the base of the graph. These lines represent the limits of the paper’sexposure range. The exposure range (exposure index) is determined bycounting the number of step-wedge steps between the vertical line fromDmin and the vertical line from Dmax. (If your step wedge has thirty orthirty-one steps, the value is 0.10; if it has twenty or twenty-one steps, thenthe value is 0.15.) Depending on the paper’s grade or filter used to print onmulti-contrast paper you should have a number that is in the ANSI range foryour grade or filter. This will be the constant we will be developing the filmto achieve.There is also a visual approach you can take to establish your paper’s ex-
posure range. By making the test print with the step wedge as explainedabove, you can use a visual determination of where there is a change fromblack to white to define the extremes of the paper’s exposure. Once you haveprinted your step wedge look carefully and determine where there is a visibledifference between the blacks at one end of the series of steps. You need thenumber of this step. Then do the same thing for the lighter end of the printed
DEVELOPMENT 55
The paper characteristic curve shows the graphing of the densities from the printed step wedgeand how they relate to the zones.
. . . YOU SHOULD HAVE A NUMBER
THAT IS IN THE ANSI RANGE FOR
YOUR GRADE OR FILTER.
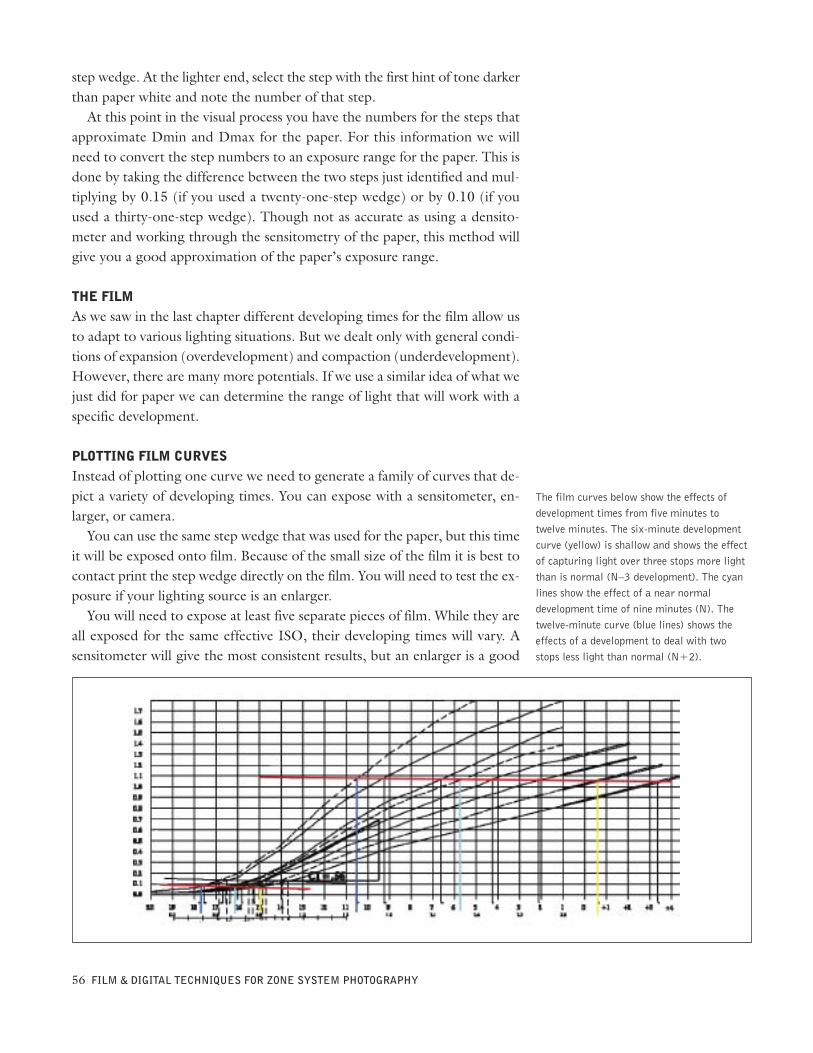
step wedge. At the lighter end, select the step with the first hint of tone darkerthan paper white and note the number of that step.At this point in the visual process you have the numbers for the steps that
approximate Dmin and Dmax for the paper. For this information we willneed to convert the step numbers to an exposure range for the paper. This isdone by taking the difference between the two steps just identified and mul-tiplying by 0.15 (if you used a twenty-one-step wedge) or by 0.10 (if youused a thirty-one-step wedge). Though not as accurate as using a densito-meter and working through the sensitometry of the paper, this method willgive you a good approximation of the paper’s exposure range.
THE FILMAs we saw in the last chapter different developing times for the film allow usto adapt to various lighting situations. But we dealt only with general condi-tions of expansion (overdevelopment) and compaction (underdevelopment).However, there are many more potentials. If we use a similar idea of what wejust did for paper we can determine the range of light that will work with aspecific development.
PLOTTING FILM CURVESInstead of plotting one curve we need to generate a family of curves that de-pict a variety of developing times. You can expose with a sensitometer, en-larger, or camera.You can use the same step wedge that was used for the paper, but this time
it will be exposed onto film. Because of the small size of the film it is best tocontact print the step wedge directly on the film. You will need to test the ex-posure if your lighting source is an enlarger.You will need to expose at least five separate pieces of film. While they are
all exposed for the same effective ISO, their developing times will vary. Asensitometer will give the most consistent results, but an enlarger is a good
56 FILM & DIGITAL TECHNIQUES FOR ZONE SYSTEM PHOTOGRAPHY
The film curves below show the effects ofdevelopment times from five minutes totwelve minutes. The six-minute developmentcurve (yellow) is shallow and shows the effectof capturing light over three stops more lightthan is normal (N–3 development). The cyanlines show the effect of a near normaldevelopment time of nine minutes (N). Thetwelve-minute curve (blue lines) shows theeffects of a development to deal with twostops less light than normal (N+2).
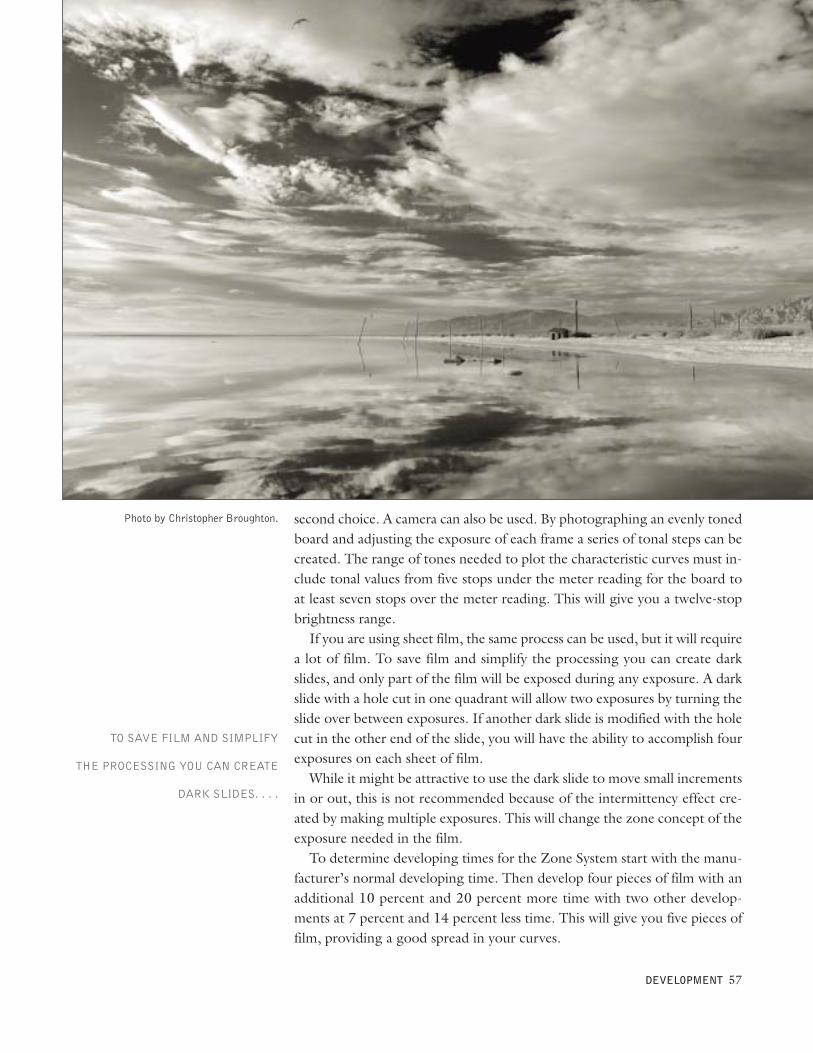
second choice. A camera can also be used. By photographing an evenly tonedboard and adjusting the exposure of each frame a series of tonal steps can becreated. The range of tones needed to plot the characteristic curves must in-clude tonal values from five stops under the meter reading for the board toat least seven stops over the meter reading. This will give you a twelve-stopbrightness range.If you are using sheet film, the same process can be used, but it will require
a lot of film. To save film and simplify the processing you can create darkslides, and only part of the film will be exposed during any exposure. A darkslide with a hole cut in one quadrant will allow two exposures by turning theslide over between exposures. If another dark slide is modified with the holecut in the other end of the slide, you will have the ability to accomplish fourexposures on each sheet of film.While it might be attractive to use the dark slide to move small increments
in or out, this is not recommended because of the intermittency effect cre-ated by making multiple exposures. This will change the zone concept of theexposure needed in the film.To determine developing times for the Zone System start with the manu-
facturer’s normal developing time. Then develop four pieces of film with anadditional 10 percent and 20 percent more time with two other develop-ments at 7 percent and 14 percent less time. This will give you five pieces offilm, providing a good spread in your curves.
DEVELOPMENT 57
Photo by Christopher Broughton.
TO SAVE FILM AND SIMPLIFY
THE PROCESSING YOU CAN CREATE
DARK SLIDES. . . .
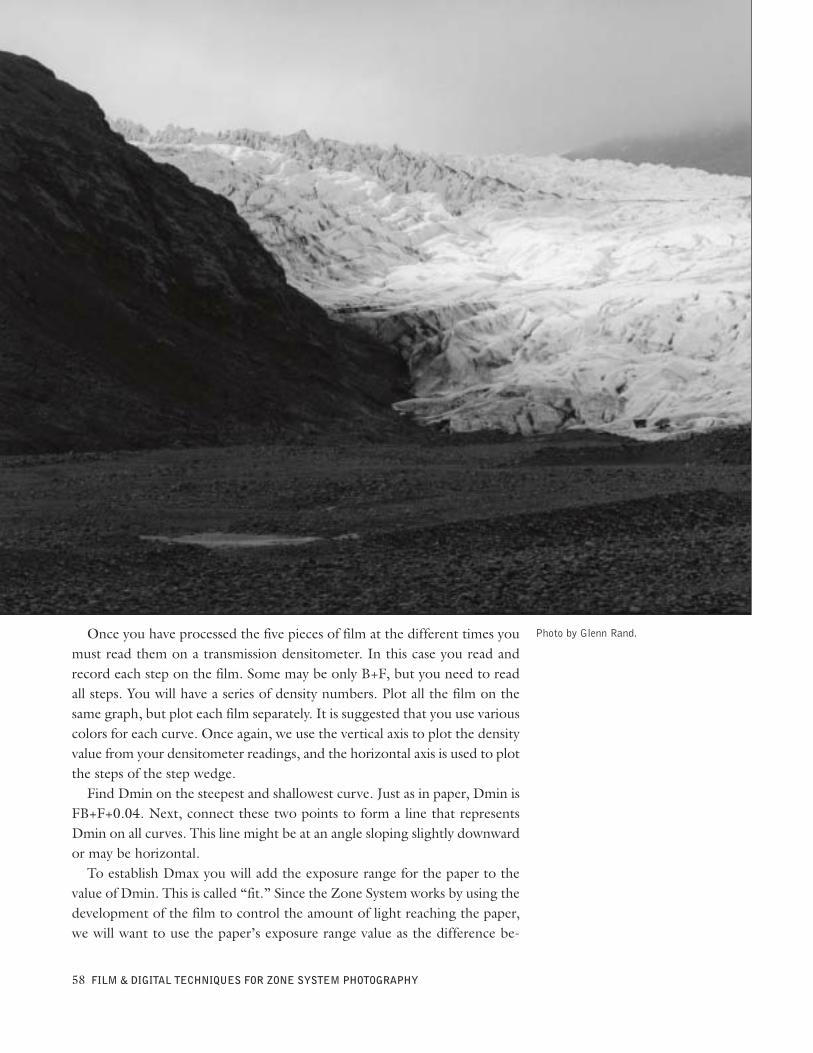
Once you have processed the five pieces of film at the different times youmust read them on a transmission densitometer. In this case you read andrecord each step on the film. Some may be only B+F, but you need to readall steps. You will have a series of density numbers. Plot all the film on thesame graph, but plot each film separately. It is suggested that you use variouscolors for each curve. Once again, we use the vertical axis to plot the densityvalue from your densitometer readings, and the horizontal axis is used to plotthe steps of the step wedge.Find Dmin on the steepest and shallowest curve. Just as in paper, Dmin is
FB+F+0.04. Next, connect these two points to form a line that representsDmin on all curves. This line might be at an angle sloping slightly downwardor may be horizontal.To establish Dmax you will add the exposure range for the paper to the
value of Dmin. This is called “fit.” Since the Zone System works by using thedevelopment of the film to control the amount of light reaching the paper,we will want to use the paper’s exposure range value as the difference be-
58 FILM & DIGITAL TECHNIQUES FOR ZONE SYSTEM PHOTOGRAPHY
Photo by Glenn Rand.
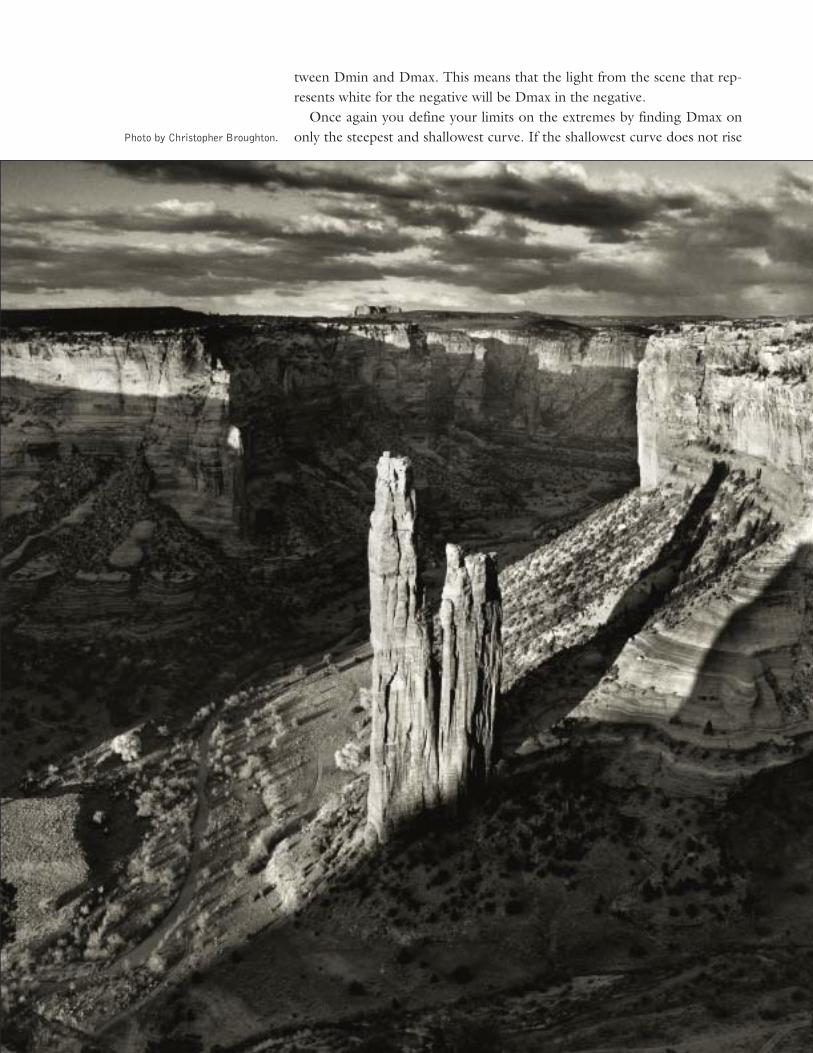
Photo by Christopher Broughton.
tween Dmin and Dmax. This means that the light from the scene that rep-resents white for the negative will be Dmax in the negative.Once again you define your limits on the extremes by finding Dmax on
only the steepest and shallowest curve. If the shallowest curve does not rise
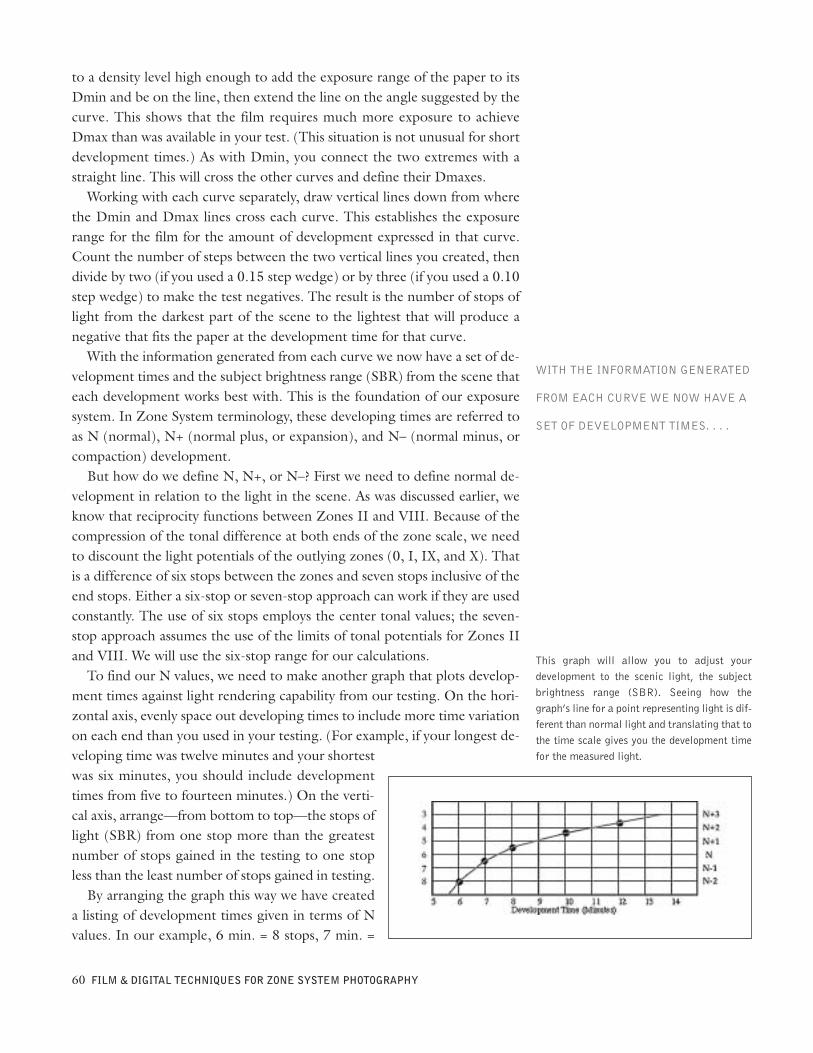
to a density level high enough to add the exposure range of the paper to itsDmin and be on the line, then extend the line on the angle suggested by thecurve. This shows that the film requires much more exposure to achieveDmax than was available in your test. (This situation is not unusual for shortdevelopment times.) As with Dmin, you connect the two extremes with astraight line. This will cross the other curves and define their Dmaxes.Working with each curve separately, draw vertical lines down from where
the Dmin and Dmax lines cross each curve. This establishes the exposurerange for the film for the amount of development expressed in that curve.Count the number of steps between the two vertical lines you created, thendivide by two (if you used a 0.15 step wedge) or by three (if you used a 0.10step wedge) to make the test negatives. The result is the number of stops oflight from the darkest part of the scene to the lightest that will produce anegative that fits the paper at the development time for that curve.With the information generated from each curve we now have a set of de-
velopment times and the subject brightness range (SBR) from the scene thateach development works best with. This is the foundation of our exposuresystem. In Zone System terminology, these developing times are referred toas N (normal), N+ (normal plus, or expansion), and N– (normal minus, orcompaction) development.But how do we define N, N+, or N–? First we need to define normal de-
velopment in relation to the light in the scene. As was discussed earlier, weknow that reciprocity functions between Zones II and VIII. Because of thecompression of the tonal difference at both ends of the zone scale, we needto discount the light potentials of the outlying zones (0, I, IX, and X). Thatis a difference of six stops between the zones and seven stops inclusive of theend stops. Either a six-stop or seven-stop approach can work if they are usedconstantly. The use of six stops employs the center tonal values; the seven-stop approach assumes the use of the limits of tonal potentials for Zones IIand VIII. We will use the six-stop range for our calculations.To find our N values, we need to make another graph that plots develop-
ment times against light rendering capability from our testing. On the hori-zontal axis, evenly space out developing times to include more time variationon each end than you used in your testing. (For example, if your longest de-veloping time was twelve minutes and your shortestwas six minutes, you should include developmenttimes from five to fourteen minutes.) On the verti-cal axis, arrange—from bottom to top—the stops oflight (SBR) from one stop more than the greatestnumber of stops gained in the testing to one stopless than the least number of stops gained in testing.By arranging the graph this way we have created
a listing of development times given in terms of Nvalues. In our example, 6 min. = 8 stops, 7 min. =
60 FILM & DIGITAL TECHNIQUES FOR ZONE SYSTEM PHOTOGRAPHY
This graph will allow you to adjust yourdevelopment to the scenic light, the subjectbrightness range (SBR). Seeing how thegraph’s line for a point representing light is dif-ferent than normal light and translating that tothe time scale gives you the development timefor the measured light.
WITH THE INFORMATION GENERATED
FROM EACH CURVE WE NOW HAVE A
SET OF DEVELOPMENT TIMES. . . .
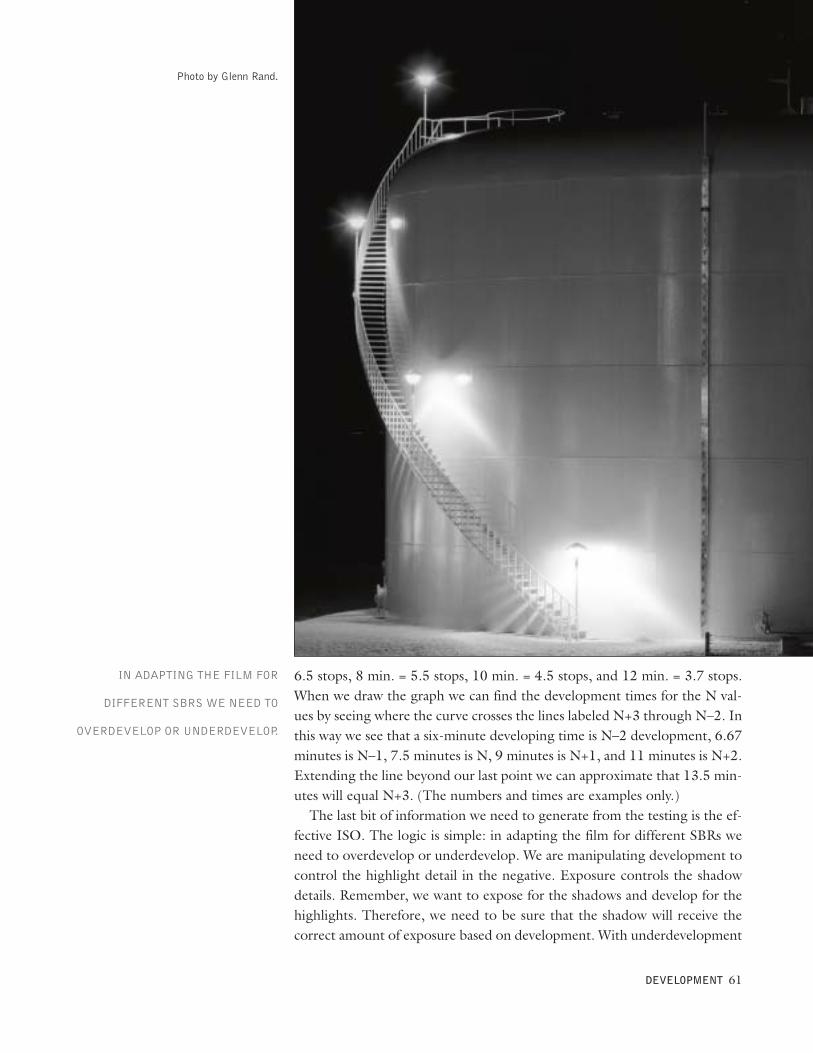
6.5 stops, 8 min. = 5.5 stops, 10 min. = 4.5 stops, and 12 min. = 3.7 stops.When we draw the graph we can find the development times for the N val-ues by seeing where the curve crosses the lines labeled N+3 through N–2. Inthis way we see that a six-minute developing time is N–2 development, 6.67minutes is N–1, 7.5 minutes is N, 9 minutes is N+1, and 11 minutes is N+2.Extending the line beyond our last point we can approximate that 13.5 min-utes will equal N+3. (The numbers and times are examples only.)The last bit of information we need to generate from the testing is the ef-
fective ISO. The logic is simple: in adapting the film for different SBRs weneed to overdevelop or underdevelop. We are manipulating development tocontrol the highlight detail in the negative. Exposure controls the shadowdetails. Remember, we want to expose for the shadows and develop for thehighlights. Therefore, we need to be sure that the shadow will receive thecorrect amount of exposure based on development. With underdevelopment
DEVELOPMENT 61
Photo by Glenn Rand.
IN ADAPTING THE FILM FOR
DIFFERENT SBRS WE NEED TO
OVERDEVELOP OR UNDERDEVELOP.
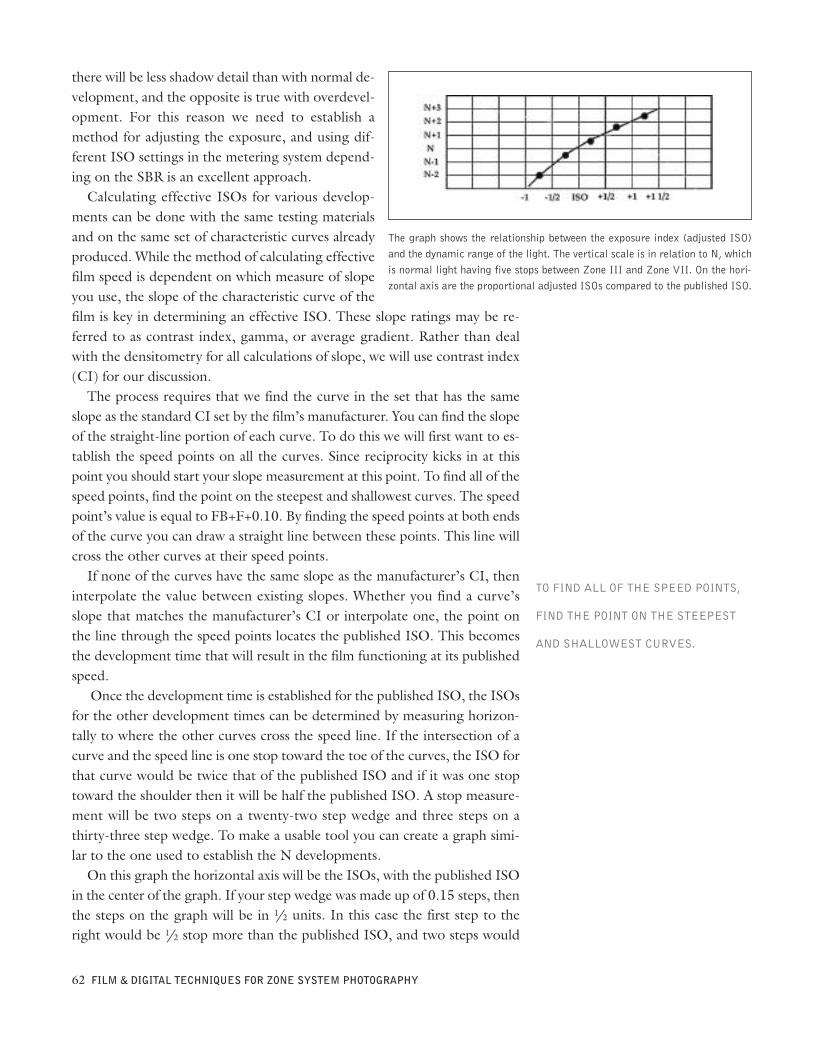
there will be less shadow detail than with normal de-velopment, and the opposite is true with overdevel-opment. For this reason we need to establish amethod for adjusting the exposure, and using dif-ferent ISO settings in the metering system depend-ing on the SBR is an excellent approach.Calculating effective ISOs for various develop-
ments can be done with the same testing materialsand on the same set of characteristic curves alreadyproduced. While the method of calculating effectivefilm speed is dependent on which measure of slopeyou use, the slope of the characteristic curve of thefilm is key in determining an effective ISO. These slope ratings may be re-ferred to as contrast index, gamma, or average gradient. Rather than dealwith the densitometry for all calculations of slope, we will use contrast index(CI) for our discussion.The process requires that we find the curve in the set that has the same
slope as the standard CI set by the film’s manufacturer. You can find the slopeof the straight-line portion of each curve. To do this we will first want to es-tablish the speed points on all the curves. Since reciprocity kicks in at thispoint you should start your slope measurement at this point. To find all of thespeed points, find the point on the steepest and shallowest curves. The speedpoint’s value is equal to FB+F+0.10. By finding the speed points at both endsof the curve you can draw a straight line between these points. This line willcross the other curves at their speed points.If none of the curves have the same slope as the manufacturer’s CI, then
interpolate the value between existing slopes. Whether you find a curve’sslope that matches the manufacturer’s CI or interpolate one, the point onthe line through the speed points locates the published ISO. This becomesthe development time that will result in the film functioning at its publishedspeed.
Once the development time is established for the published ISO, the ISOsfor the other development times can be determined by measuring horizon-tally to where the other curves cross the speed line. If the intersection of acurve and the speed line is one stop toward the toe of the curves, the ISO forthat curve would be twice that of the published ISO and if it was one stoptoward the shoulder then it will be half the published ISO. A stop measure-ment will be two steps on a twenty-two step wedge and three steps on athirty-three step wedge. To make a usable tool you can create a graph simi-lar to the one used to establish the N developments.On this graph the horizontal axis will be the ISOs, with the published ISO
in the center of the graph. If your step wedge was made up of 0.15 steps, thenthe steps on the graph will be in 1/2 units. In this case the first step to theright would be 1/2 stop more than the published ISO, and two steps would
62 FILM & DIGITAL TECHNIQUES FOR ZONE SYSTEM PHOTOGRAPHY
The graph shows the relationship between the exposure index (adjusted ISO)and the dynamic range of the light. The vertical scale is in relation to N, whichis normal light having five stops between Zone III and Zone VII. On the hori-zontal axis are the proportional adjusted ISOs compared to the published ISO.
TO FIND ALL OF THE SPEED POINTS,
FIND THE POINT ON THE STEEPEST
AND SHALLOWEST CURVES.
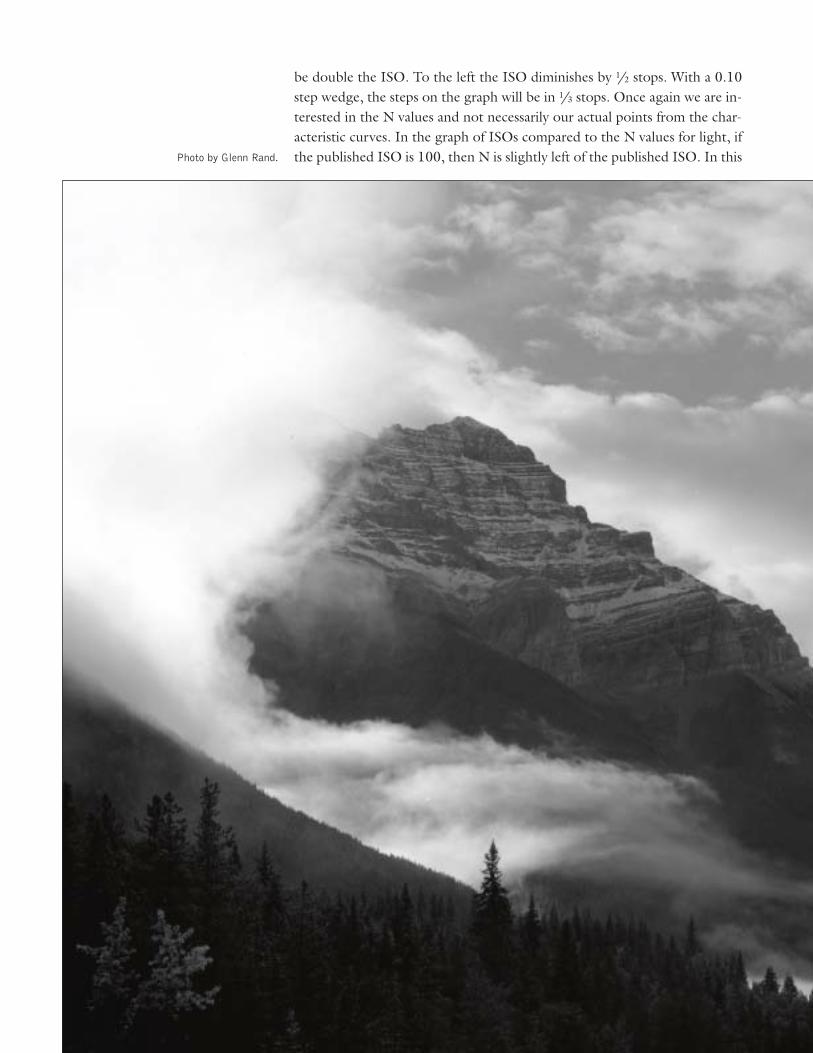
be double the ISO. To the left the ISO diminishes by 1/2 stops. With a 0.10step wedge, the steps on the graph will be in 1/3 stops. Once again we are in-terested in the N values and not necessarily our actual points from the char-acteristic curves. In the graph of ISOs compared to the N values for light, ifthe published ISO is 100, then N is slightly left of the published ISO. In thisPhoto by Glenn Rand.
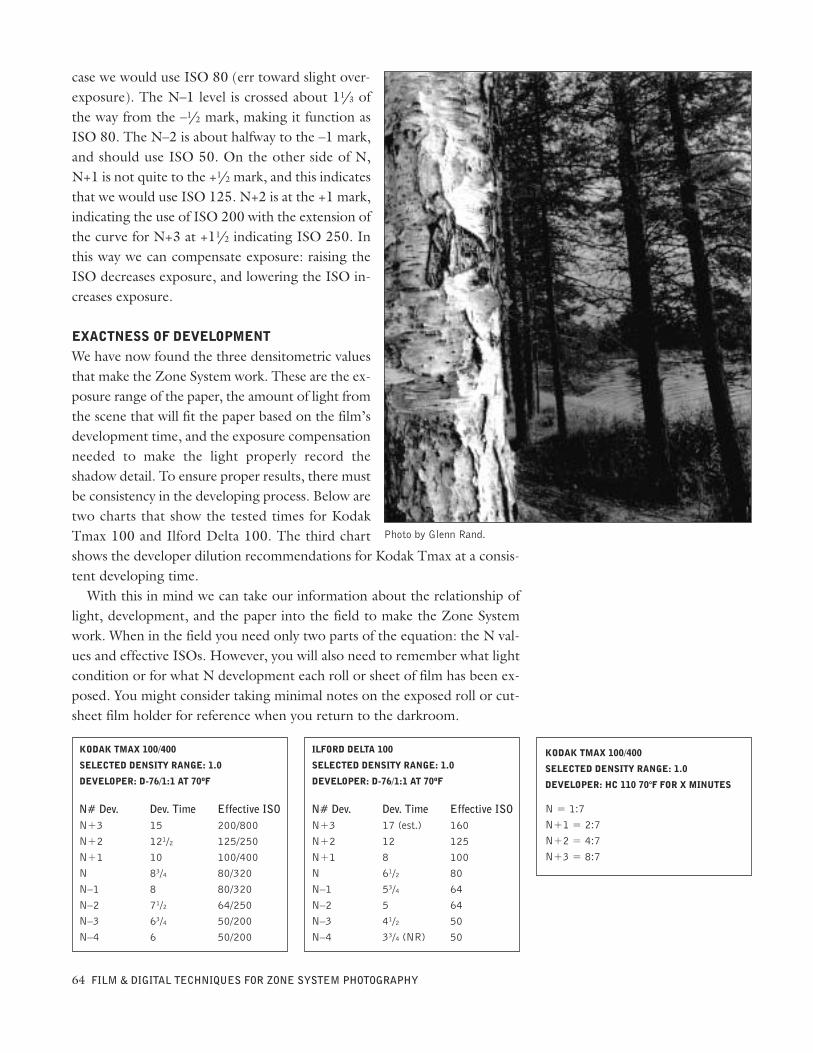
case we would use ISO 80 (err toward slight over-exposure). The N–1 level is crossed about 11/3 ofthe way from the –1/2 mark, making it function asISO 80. The N–2 is about halfway to the –1 mark,and should use ISO 50. On the other side of N,N+1 is not quite to the +1/2 mark, and this indicatesthat we would use ISO 125. N+2 is at the +1 mark,indicating the use of ISO 200 with the extension ofthe curve for N+3 at +11/2 indicating ISO 250. Inthis way we can compensate exposure: raising theISO decreases exposure, and lowering the ISO in-creases exposure.
EXACTNESS OF DEVELOPMENTWe have now found the three densitometric valuesthat make the Zone System work. These are the ex-posure range of the paper, the amount of light fromthe scene that will fit the paper based on the film’sdevelopment time, and the exposure compensationneeded to make the light properly record theshadow detail. To ensure proper results, there mustbe consistency in the developing process. Below aretwo charts that show the tested times for KodakTmax 100 and Ilford Delta 100. The third chartshows the developer dilution recommendations for Kodak Tmax at a consis-tent developing time.With this in mind we can take our information about the relationship of
light, development, and the paper into the field to make the Zone Systemwork. When in the field you need only two parts of the equation: the N val-ues and effective ISOs. However, you will also need to remember what lightcondition or for what N development each roll or sheet of film has been ex-posed. You might consider taking minimal notes on the exposed roll or cut-sheet film holder for reference when you return to the darkroom.
64 FILM & DIGITAL TECHNIQUES FOR ZONE SYSTEM PHOTOGRAPHY
KODAK TMAX 100/400
SELECTED DENSITY RANGE: 1.0
DEVELOPER: D-76/1:1 AT 70ºF
KODAK TMAX 100/400
SELECTED DENSITY RANGE: 1.0
DEVELOPER: HC 110 70°F FOR X MINUTES
N# Dev.N+3N+2N+1NN–1N–2N–3N–4
Dev. Time15121/21083/4871/263/46
Effective ISO200/800125/250100/40080/32080/32064/25050/20050/200
ILFORD DELTA 100
SELECTED DENSITY RANGE: 1.0
DEVELOPER: D-76/1:1 AT 70ºF
N# Dev.N+3N+2N+1NN–1N–2N–3N–4
Dev. Time17 (est.)12861/253/4541/233/4 (NR)
Effective ISO1601251008064645050
N = 1:7N+1 = 2:7N+2 = 4:7N+3 = 8:7
Photo by Glenn Rand.
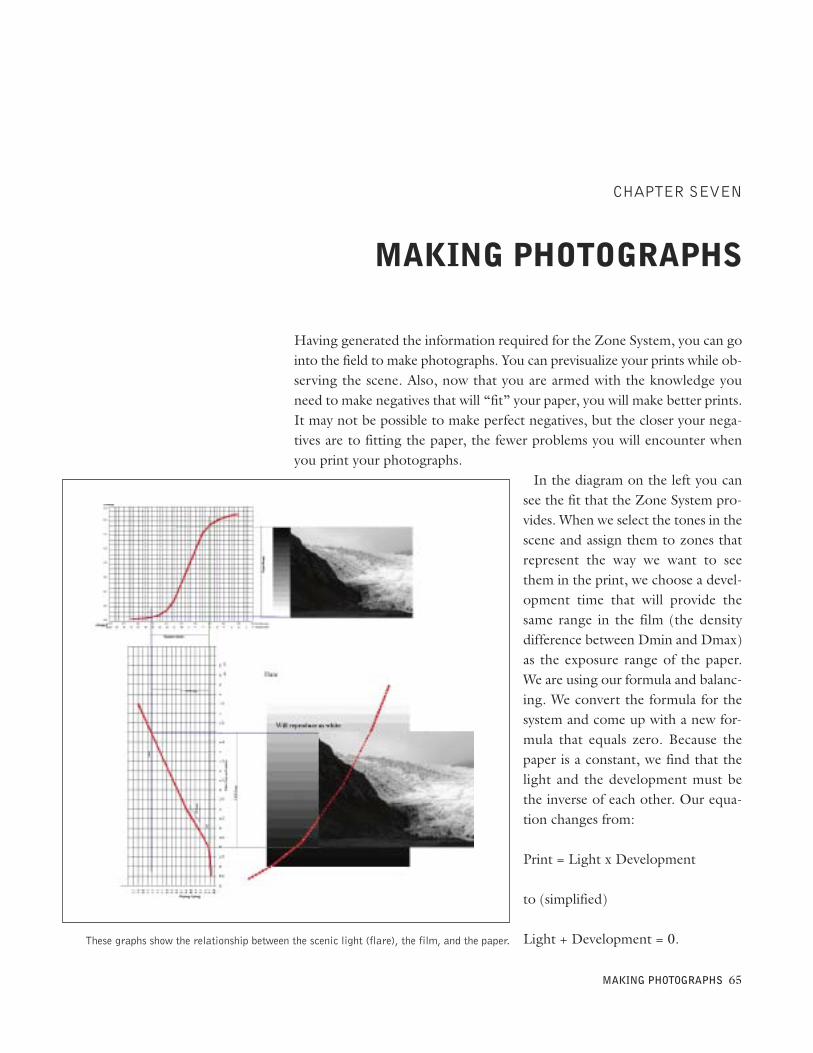
Having generated the information required for the Zone System, you can gointo the field to make photographs. You can previsualize your prints while ob-serving the scene. Also, now that you are armed with the knowledge youneed to make negatives that will “fit” your paper, you will make better prints.It may not be possible to make perfect negatives, but the closer your nega-tives are to fitting the paper, the fewer problems you will encounter whenyou print your photographs.
In the diagram on the left you cansee the fit that the Zone System pro-vides. When we select the tones in thescene and assign them to zones thatrepresent the way we want to seethem in the print, we choose a devel-opment time that will provide thesame range in the film (the densitydifference between Dmin and Dmax)as the exposure range of the paper.We are using our formula and balanc-ing. We convert the formula for thesystem and come up with a new for-mula that equals zero. Because thepaper is a constant, we find that thelight and the development must bethe inverse of each other. Our equa-tion changes from:
Print = Light x Development
to (simplified)
Light + Development = 0.
MAKING PHOTOGRAPHS 65
CHAPTER SEVEN
MAKING PHOTOGRAPHS
These graphs show the relationship between the scenic light (flare), the film, and the paper.
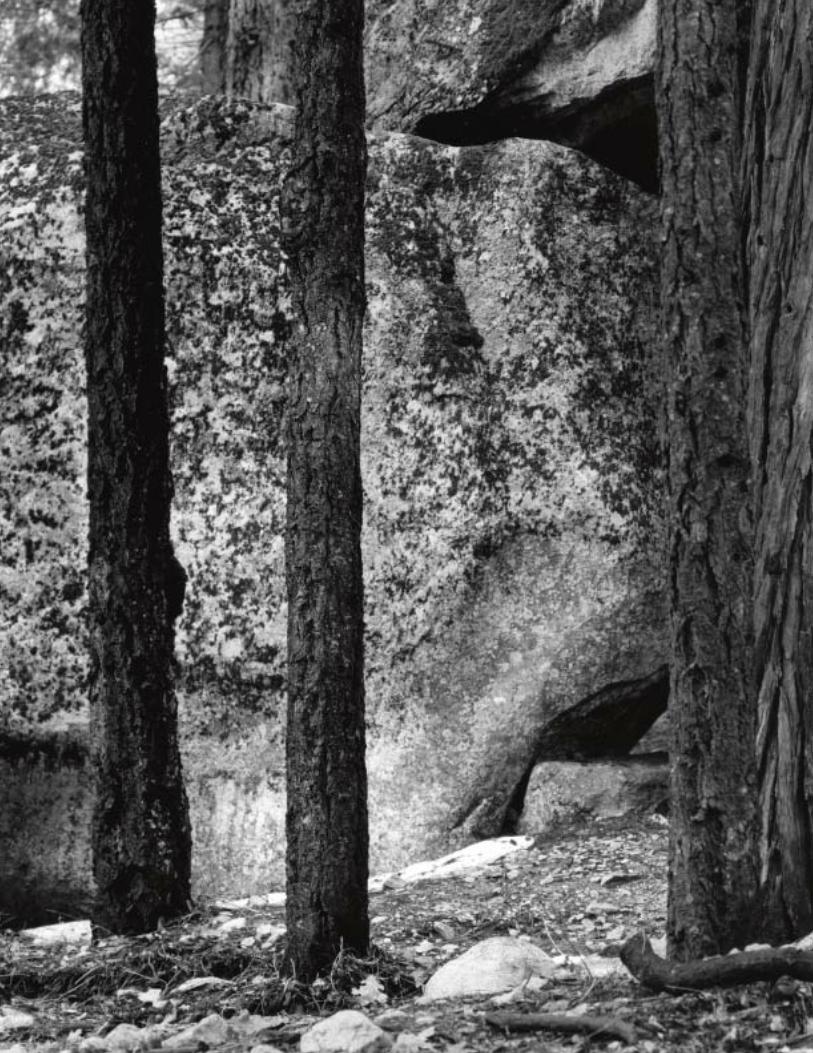
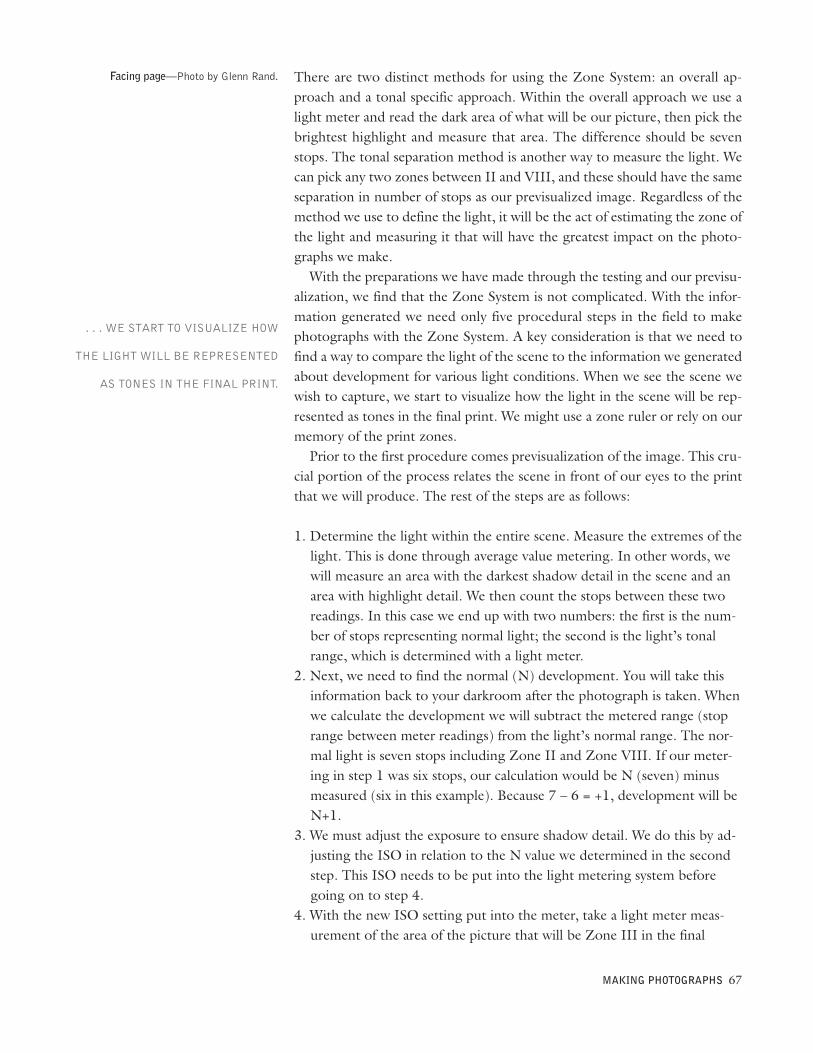
There are two distinct methods for using the Zone System: an overall ap-proach and a tonal specific approach. Within the overall approach we use alight meter and read the dark area of what will be our picture, then pick thebrightest highlight and measure that area. The difference should be sevenstops. The tonal separation method is another way to measure the light. Wecan pick any two zones between II and VIII, and these should have the sameseparation in number of stops as our previsualized image. Regardless of themethod we use to define the light, it will be the act of estimating the zone ofthe light and measuring it that will have the greatest impact on the photo-graphs we make.With the preparations we have made through the testing and our previsu-
alization, we find that the Zone System is not complicated. With the infor-mation generated we need only five procedural steps in the field to makephotographs with the Zone System. A key consideration is that we need tofind a way to compare the light of the scene to the information we generatedabout development for various light conditions. When we see the scene wewish to capture, we start to visualize how the light in the scene will be rep-resented as tones in the final print. We might use a zone ruler or rely on ourmemory of the print zones.Prior to the first procedure comes previsualization of the image. This cru-
cial portion of the process relates the scene in front of our eyes to the printthat we will produce. The rest of the steps are as follows:
1. Determine the light within the entire scene. Measure the extremes of thelight. This is done through average value metering. In other words, wewill measure an area with the darkest shadow detail in the scene and anarea with highlight detail. We then count the stops between these tworeadings. In this case we end up with two numbers: the first is the num-ber of stops representing normal light; the second is the light’s tonalrange, which is determined with a light meter.
2. Next, we need to find the normal (N) development. You will take thisinformation back to your darkroom after the photograph is taken. Whenwe calculate the development we will subtract the metered range (stoprange between meter readings) from the light’s normal range. The nor-mal light is seven stops including Zone II and Zone VIII. If our meter-ing in step 1 was six stops, our calculation would be N (seven) minusmeasured (six in this example). Because 7 – 6 = +1, development will beN+1.
3. We must adjust the exposure to ensure shadow detail. We do this by ad-justing the ISO in relation to the N value we determined in the secondstep. This ISO needs to be put into the light metering system beforegoing on to step 4.
4. With the new ISO setting put into the meter, take a light meter meas-urement of the area of the picture that will be Zone III in the final
MAKING PHOTOGRAPHS 67
Facing page—Photo by Glenn Rand.
. . . WE START TO VISUALIZE HOW
THE LIGHT WILL BE REPRESENTED
AS TONES IN THE FINAL PRINT.
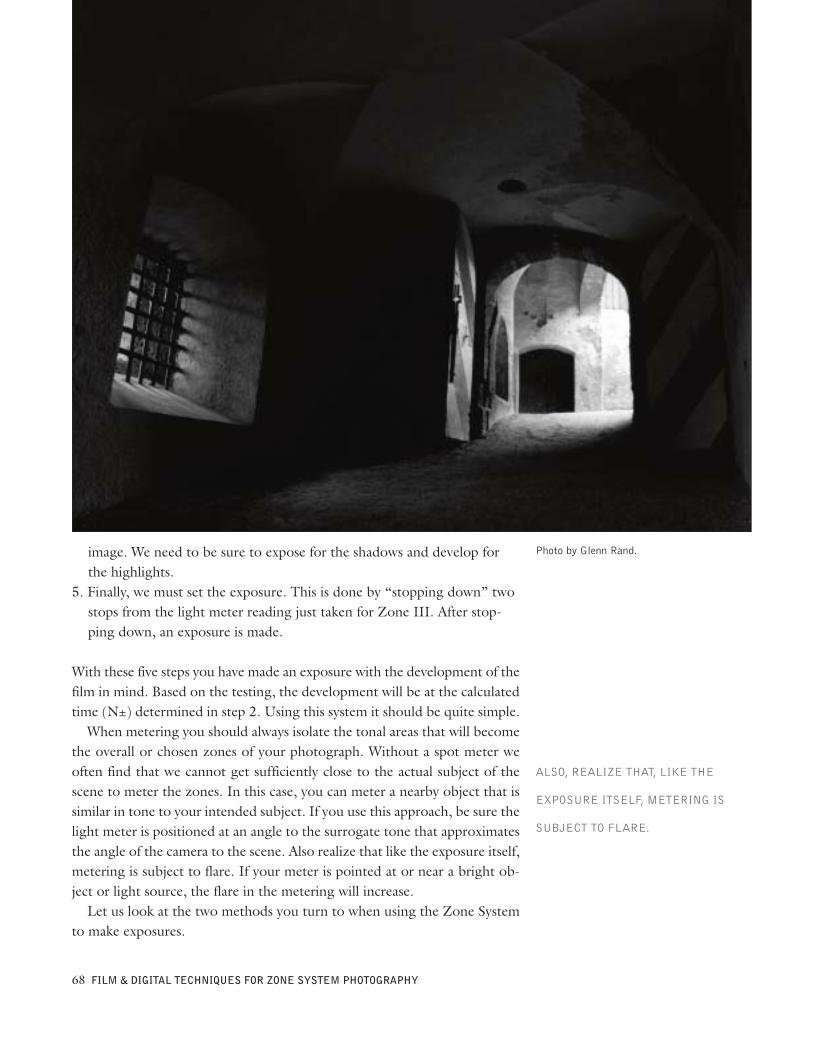
image. We need to be sure to expose for the shadows and develop forthe highlights.
5. Finally, we must set the exposure. This is done by “stopping down” twostops from the light meter reading just taken for Zone III. After stop-ping down, an exposure is made.
With these five steps you have made an exposure with the development of thefilm in mind. Based on the testing, the development will be at the calculatedtime (N±) determined in step 2. Using this system it should be quite simple.When metering you should always isolate the tonal areas that will become
the overall or chosen zones of your photograph. Without a spot meter weoften find that we cannot get sufficiently close to the actual subject of thescene to meter the zones. In this case, you can meter a nearby object that issimilar in tone to your intended subject. If you use this approach, be sure thelight meter is positioned at an angle to the surrogate tone that approximatesthe angle of the camera to the scene. Also realize that like the exposure itself,metering is subject to flare. If your meter is pointed at or near a bright ob-ject or light source, the flare in the metering will increase.Let us look at the two methods you turn to when using the Zone System
to make exposures.
68 FILM & DIGITAL TECHNIQUES FOR ZONE SYSTEM PHOTOGRAPHY
Photo by Glenn Rand.
ALSO, REALIZE THAT, LIKE THE
EXPOSURE ITSELF, METERING IS
SUBJECT TO FLARE.
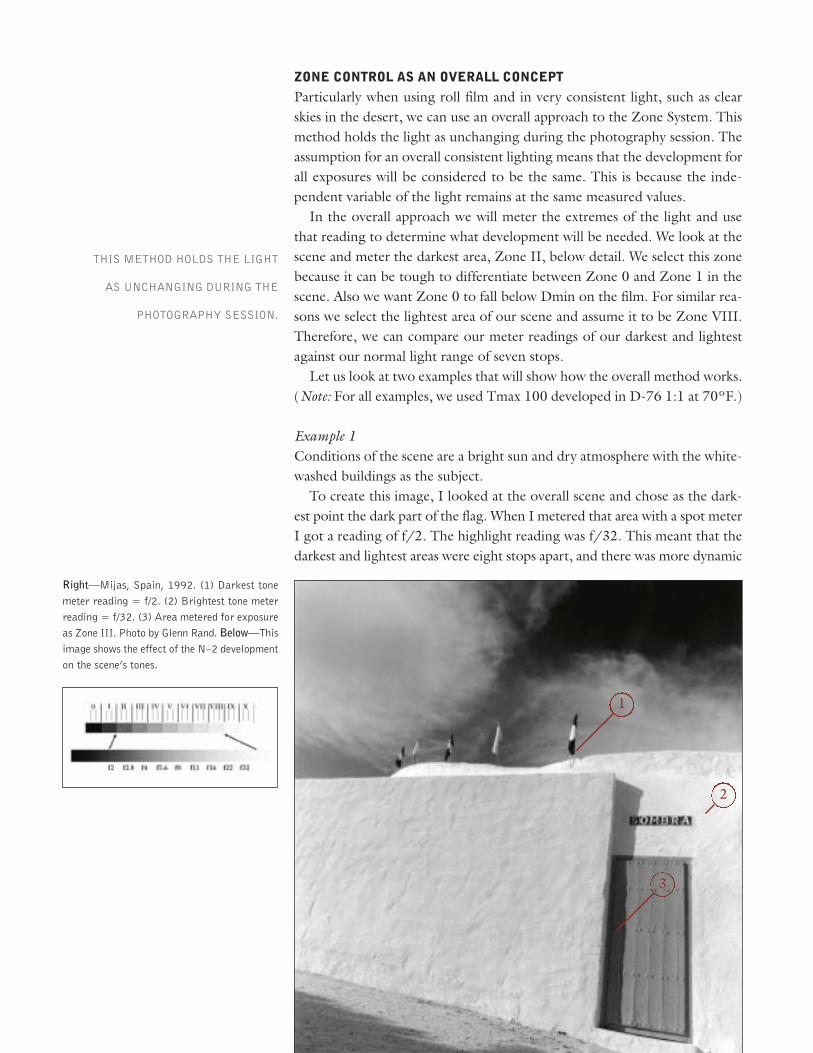
ZONE CONTROL AS AN OVERALL CONCEPTParticularly when using roll film and in very consistent light, such as clearskies in the desert, we can use an overall approach to the Zone System. Thismethod holds the light as unchanging during the photography session. Theassumption for an overall consistent lighting means that the development forall exposures will be considered to be the same. This is because the inde-pendent variable of the light remains at the same measured values.In the overall approach we will meter the extremes of the light and use
that reading to determine what development will be needed. We look at thescene and meter the darkest area, Zone II, below detail. We select this zonebecause it can be tough to differentiate between Zone 0 and Zone 1 in thescene. Also we want Zone 0 to fall below Dmin on the film. For similar rea-sons we select the lightest area of our scene and assume it to be Zone VIII.Therefore, we can compare our meter readings of our darkest and lightestagainst our normal light range of seven stops.Let us look at two examples that will show how the overall method works.
(Note: For all examples, we used Tmax 100 developed in D-76 1:1 at 70ºF.)
Example 1Conditions of the scene are a bright sun and dry atmosphere with the white-washed buildings as the subject.To create this image, I looked at the overall scene and chose as the dark-
est point the dark part of the flag. When I metered that area with a spot meterI got a reading of f/2. The highlight reading was f/32. This meant that thedarkest and lightest areas were eight stops apart, and there was more dynamic
Right—Mijas, Spain, 1992. (1) Darkest tonemeter reading = f/2. (2) Brightest tone meterreading = f/32. (3) Area metered for exposureas Zone III. Photo by Glenn Rand. Below—Thisimage shows the effect of the N–2 developmenton the scene’s tones.
1
3
2
THIS METHOD HOLDS THE LIGHT
AS UNCHANGING DURING THE
PHOTOGRAPHY SESSION.
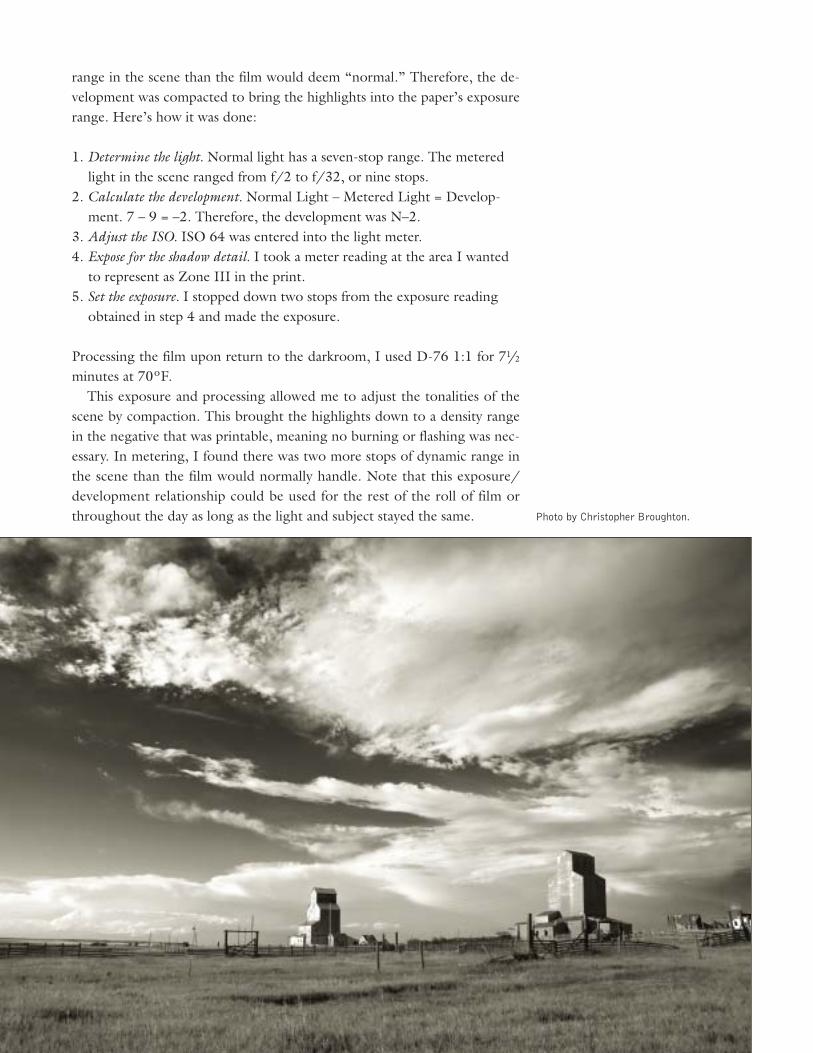
range in the scene than the film would deem “normal.” Therefore, the de-velopment was compacted to bring the highlights into the paper’s exposurerange. Here’s how it was done:
1. Determine the light. Normal light has a seven-stop range. The meteredlight in the scene ranged from f/2 to f/32, or nine stops.
2. Calculate the development. Normal Light – Metered Light = Develop-ment. 7 – 9 = –2. Therefore, the development was N–2.
3. Adjust the ISO. ISO 64 was entered into the light meter.4. Expose for the shadow detail. I took a meter reading at the area I wanted
to represent as Zone III in the print.5. Set the exposure. I stopped down two stops from the exposure reading
obtained in step 4 and made the exposure.
Processing the film upon return to the darkroom, I used D-76 1:1 for 71/2minutes at 70ºF.This exposure and processing allowed me to adjust the tonalities of the
scene by compaction. This brought the highlights down to a density rangein the negative that was printable, meaning no burning or flashing was nec-essary. In metering, I found there was two more stops of dynamic range inthe scene than the film would normally handle. Note that this exposure/development relationship could be used for the rest of the roll of film orthroughout the day as long as the light and subject stayed the same. Photo by Christopher Broughton.
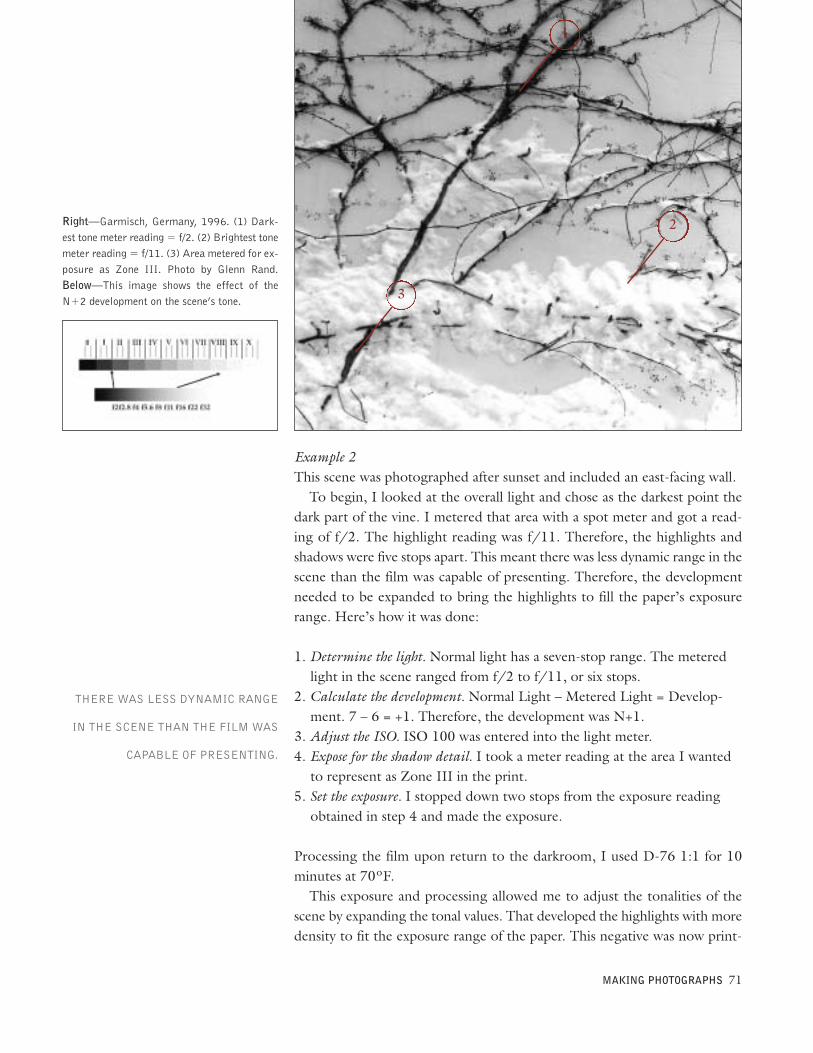
Example 2This scene was photographed after sunset and included an east-facing wall.To begin, I looked at the overall light and chose as the darkest point the
dark part of the vine. I metered that area with a spot meter and got a read-ing of f/2. The highlight reading was f/11. Therefore, the highlights andshadows were five stops apart. This meant there was less dynamic range in thescene than the film was capable of presenting. Therefore, the developmentneeded to be expanded to bring the highlights to fill the paper’s exposurerange. Here’s how it was done:
1. Determine the light. Normal light has a seven-stop range. The meteredlight in the scene ranged from f/2 to f/11, or six stops.
2. Calculate the development. Normal Light – Metered Light = Develop-ment. 7 – 6 = +1. Therefore, the development was N+1.
3. Adjust the ISO. ISO 100 was entered into the light meter.4. Expose for the shadow detail. I took a meter reading at the area I wanted
to represent as Zone III in the print.5. Set the exposure. I stopped down two stops from the exposure reading
obtained in step 4 and made the exposure.
Processing the film upon return to the darkroom, I used D-76 1:1 for 10minutes at 70ºF.This exposure and processing allowed me to adjust the tonalities of the
scene by expanding the tonal values. That developed the highlights with moredensity to fit the exposure range of the paper. This negative was now print-
MAKING PHOTOGRAPHS 71
Right—Garmisch, Germany, 1996. (1) Dark-est tone meter reading = f/2. (2) Brightest tonemeter reading = f/11. (3) Area metered for ex-posure as Zone III. Photo by Glenn Rand.Below—This image shows the effect of theN+2 development on the scene’s tone.
1
2
3
THERE WAS LESS DYNAMIC RANGE
IN THE SCENE THAN THE FILM WAS
CAPABLE OF PRESENTING.
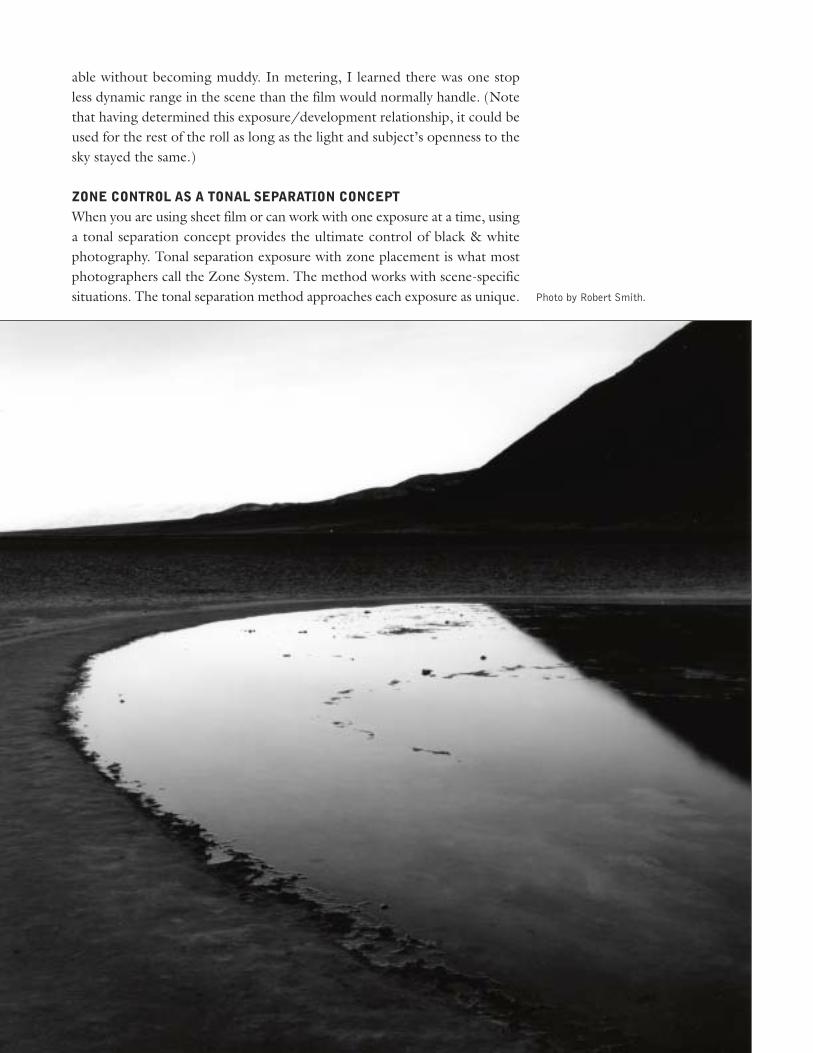
able without becoming muddy. In metering, I learned there was one stopless dynamic range in the scene than the film would normally handle. (Notethat having determined this exposure/development relationship, it could beused for the rest of the roll as long as the light and subject’s openness to thesky stayed the same.)
ZONE CONTROL AS A TONAL SEPARATION CONCEPTWhen you are using sheet film or can work with one exposure at a time, usinga tonal separation concept provides the ultimate control of black & whitephotography. Tonal separation exposure with zone placement is what mostphotographers call the Zone System. The method works with scene-specificsituations. The tonal separation method approaches each exposure as unique. Photo by Robert Smith.
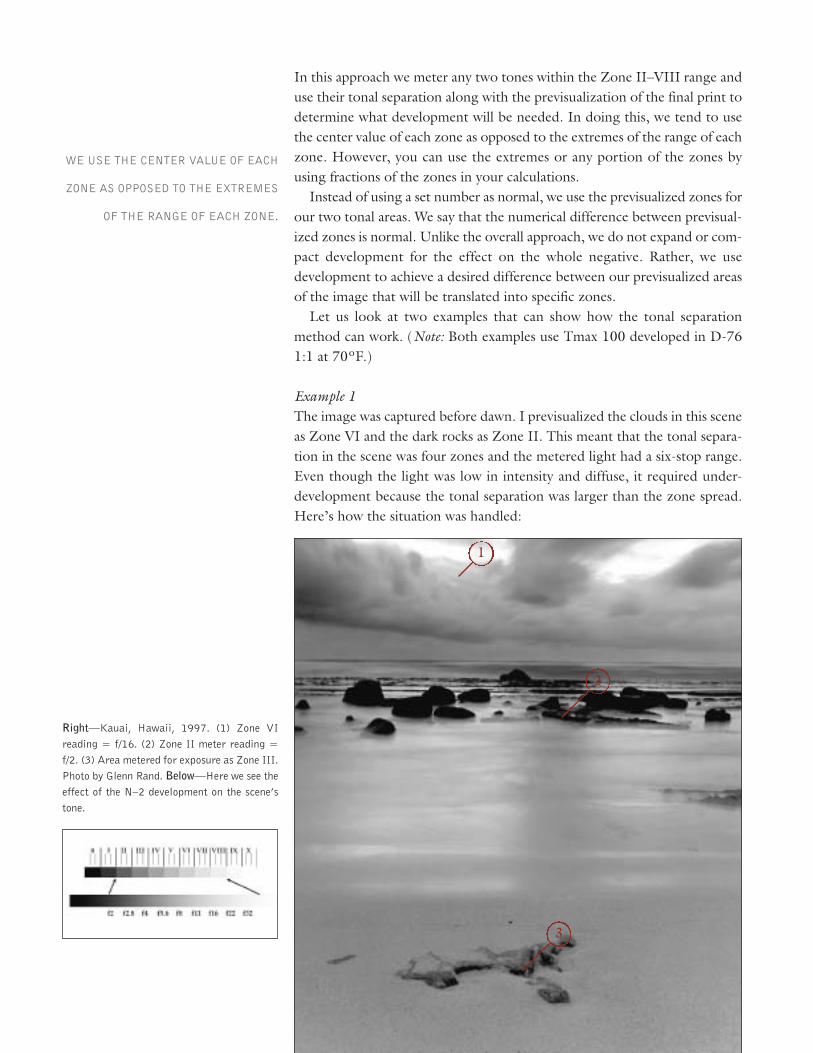
In this approach we meter any two tones within the Zone II–VIII range anduse their tonal separation along with the previsualization of the final print todetermine what development will be needed. In doing this, we tend to usethe center value of each zone as opposed to the extremes of the range of eachzone. However, you can use the extremes or any portion of the zones byusing fractions of the zones in your calculations.Instead of using a set number as normal, we use the previsualized zones for
our two tonal areas. We say that the numerical difference between previsual-ized zones is normal. Unlike the overall approach, we do not expand or com-pact development for the effect on the whole negative. Rather, we usedevelopment to achieve a desired difference between our previsualized areasof the image that will be translated into specific zones.Let us look at two examples that can show how the tonal separation
method can work. (Note: Both examples use Tmax 100 developed in D-761:1 at 70ºF.)
Example 1The image was captured before dawn. I previsualized the clouds in this sceneas Zone VI and the dark rocks as Zone II. This meant that the tonal separa-tion in the scene was four zones and the metered light had a six-stop range.Even though the light was low in intensity and diffuse, it required under-development because the tonal separation was larger than the zone spread.Here’s how the situation was handled:
Right—Kauai, Hawaii, 1997. (1) Zone VIreading = f/16. (2) Zone II meter reading =f/2. (3) Area metered for exposure as Zone III.Photo by Glenn Rand. Below—Here we see theeffect of the N–2 development on the scene’stone.
1
2
3
WE USE THE CENTER VALUE OF EACH
ZONE AS OPPOSED TO THE EXTREMES
OF THE RANGE OF EACH ZONE.
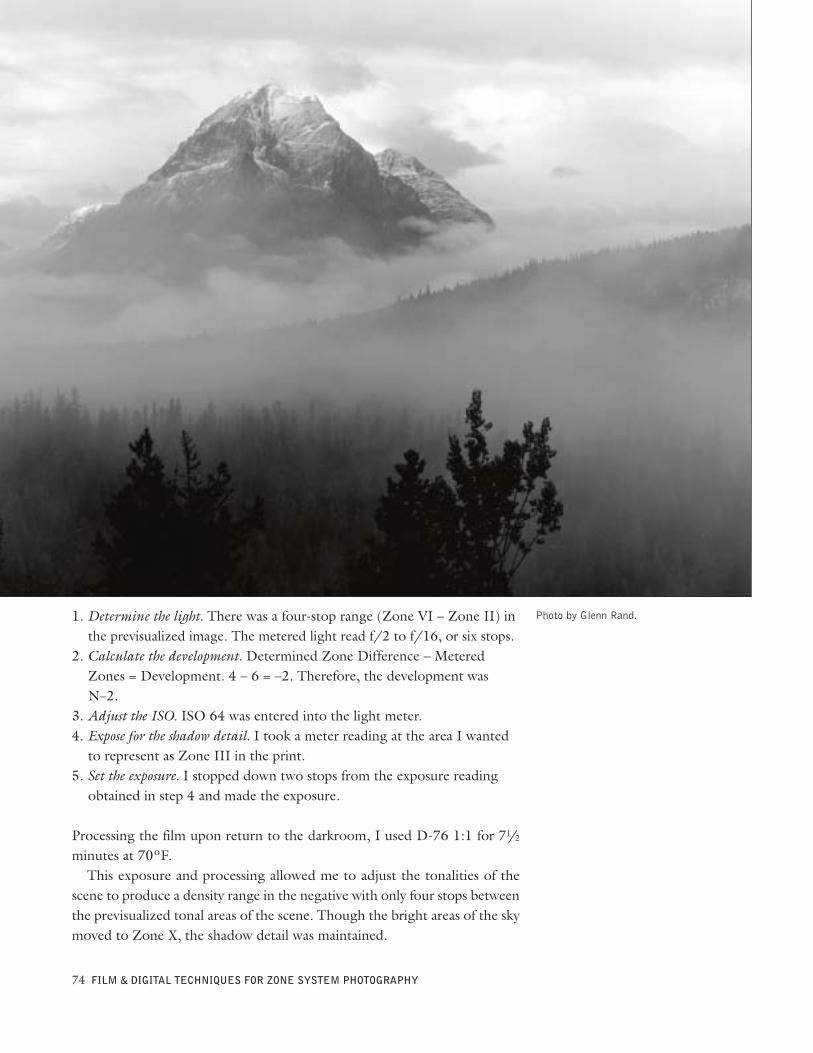
1. Determine the light. There was a four-stop range (Zone VI – Zone II) inthe previsualized image. The metered light read f/2 to f/16, or six stops.
2. Calculate the development. Determined Zone Difference – MeteredZones = Development. 4 – 6 = –2. Therefore, the development wasN–2.
3. Adjust the ISO. ISO 64 was entered into the light meter.4. Expose for the shadow detail. I took a meter reading at the area I wanted
to represent as Zone III in the print.5. Set the exposure. I stopped down two stops from the exposure reading
obtained in step 4 and made the exposure.
Processing the film upon return to the darkroom, I used D-76 1:1 for 71/2minutes at 70ºF.This exposure and processing allowed me to adjust the tonalities of the
scene to produce a density range in the negative with only four stops betweenthe previsualized tonal areas of the scene. Though the bright areas of the skymoved to Zone X, the shadow detail was maintained.
74 FILM & DIGITAL TECHNIQUES FOR ZONE SYSTEM PHOTOGRAPHY
Photo by Glenn Rand.
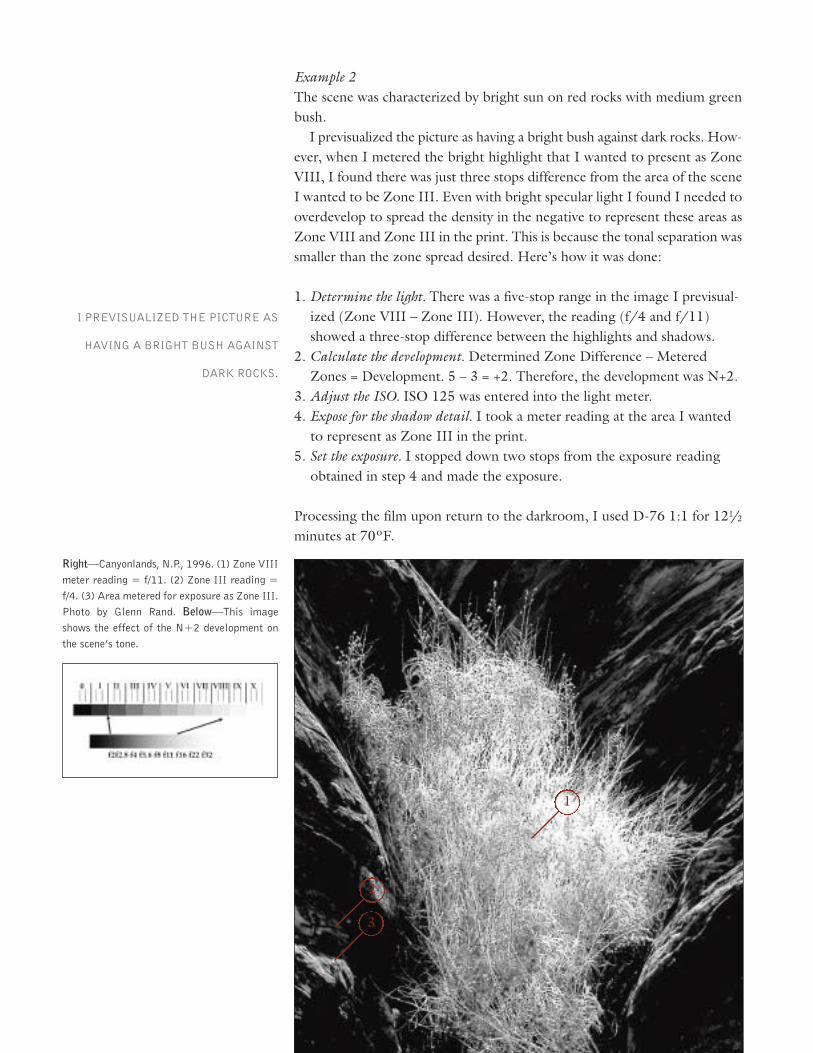
Example 2The scene was characterized by bright sun on red rocks with medium greenbush.I previsualized the picture as having a bright bush against dark rocks. How-
ever, when I metered the bright highlight that I wanted to present as ZoneVIII, I found there was just three stops difference from the area of the sceneI wanted to be Zone III. Even with bright specular light I found I needed tooverdevelop to spread the density in the negative to represent these areas asZone VIII and Zone III in the print. This is because the tonal separation wassmaller than the zone spread desired. Here’s how it was done:
1. Determine the light. There was a five-stop range in the image I previsual-ized (Zone VIII – Zone III). However, the reading (f/4 and f/11)showed a three-stop difference between the highlights and shadows.
2. Calculate the development. Determined Zone Difference – MeteredZones = Development. 5 – 3 = +2. Therefore, the development was N+2.
3. Adjust the ISO. ISO 125 was entered into the light meter.4. Expose for the shadow detail. I took a meter reading at the area I wanted
to represent as Zone III in the print.5. Set the exposure. I stopped down two stops from the exposure reading
obtained in step 4 and made the exposure.
Processing the film upon return to the darkroom, I used D-76 1:1 for 121/2minutes at 70ºF.
Right—Canyonlands, N.P., 1996. (1) Zone VIIImeter reading = f/11. (2) Zone III reading =f/4. (3) Area metered for exposure as Zone III.Photo by Glenn Rand. Below—This imageshows the effect of the N+2 development onthe scene’s tone.
1
3
2
I PREVISUALIZED THE PICTURE AS
HAVING A BRIGHT BUSH AGAINST
DARK ROCKS.
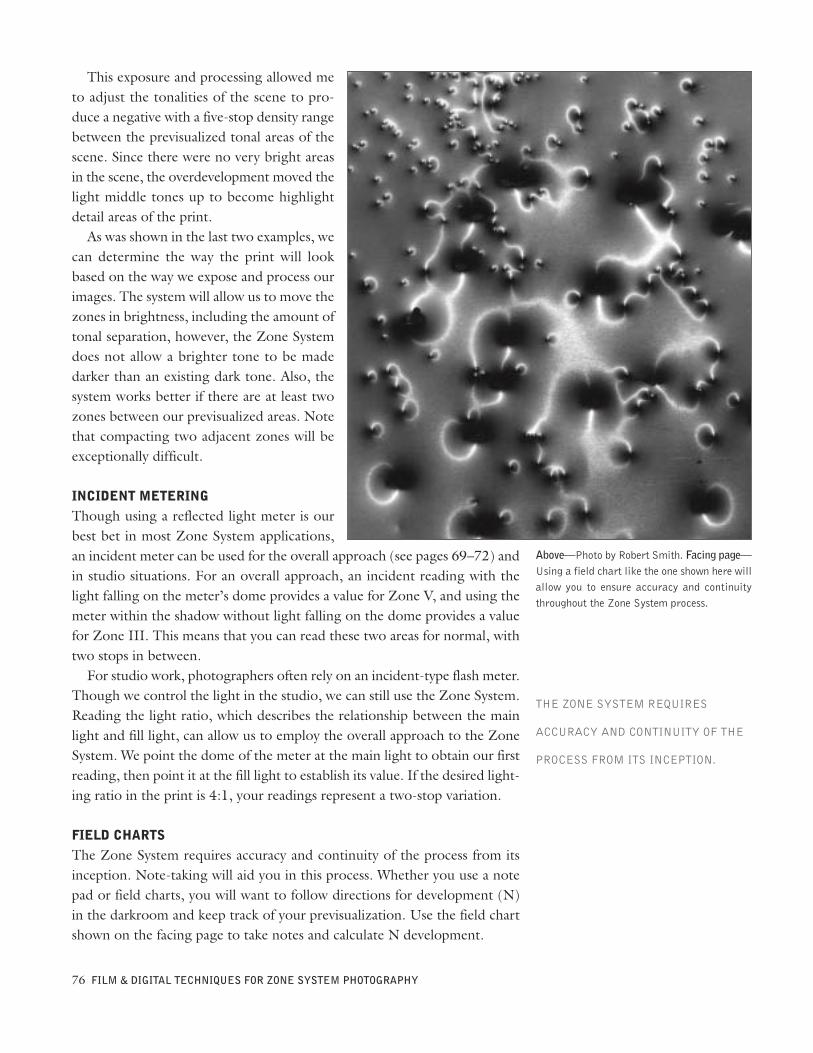
This exposure and processing allowed meto adjust the tonalities of the scene to pro-duce a negative with a five-stop density rangebetween the previsualized tonal areas of thescene. Since there were no very bright areasin the scene, the overdevelopment moved thelight middle tones up to become highlightdetail areas of the print.As was shown in the last two examples, we
can determine the way the print will lookbased on the way we expose and process ourimages. The system will allow us to move thezones in brightness, including the amount oftonal separation, however, the Zone Systemdoes not allow a brighter tone to be madedarker than an existing dark tone. Also, thesystem works better if there are at least twozones between our previsualized areas. Notethat compacting two adjacent zones will beexceptionally difficult.
INCIDENT METERINGThough using a reflected light meter is ourbest bet in most Zone System applications,an incident meter can be used for the overall approach (see pages 69–72) andin studio situations. For an overall approach, an incident reading with thelight falling on the meter’s dome provides a value for Zone V, and using themeter within the shadow without light falling on the dome provides a valuefor Zone III. This means that you can read these two areas for normal, withtwo stops in between.For studio work, photographers often rely on an incident-type flash meter.
Though we control the light in the studio, we can still use the Zone System.Reading the light ratio, which describes the relationship between the mainlight and fill light, can allow us to employ the overall approach to the ZoneSystem. We point the dome of the meter at the main light to obtain our firstreading, then point it at the fill light to establish its value. If the desired light-ing ratio in the print is 4:1, your readings represent a two-stop variation.
FIELD CHARTSThe Zone System requires accuracy and continuity of the process from itsinception. Note-taking will aid you in this process. Whether you use a notepad or field charts, you will want to follow directions for development (N)in the darkroom and keep track of your previsualization. Use the field chartshown on the facing page to take notes and calculate N development.
76 FILM & DIGITAL TECHNIQUES FOR ZONE SYSTEM PHOTOGRAPHY
Above—Photo by Robert Smith. Facing page—Using a field chart like the one shown here willallow you to ensure accuracy and continuitythroughout the Zone System process.
THE ZONE SYSTEM REQUIRES
ACCURACY AND CONTINUITY OF THE
PROCESS FROM ITS INCEPTION.

ZONE SYSTEM FIELD CHART© GLENN RAND
FILM: FILM TYPE:
DATE: LOCATION:
PREVISUALIZED: METER READING: DESIRED ZONE:
VIII
VII
VI
V
IV
III
II
I
LIGHTCONDITION:
DEVELOPMENT TIME (MINUTES OR N):
EFFECTIVE BASE EXPOSUREMETER AT ZONE III STOPPED DOWN 2OR CRITICAL ZONE _____________/_____________ ± __________
LENS FOCAL LENGTH: ________________________BELLOWS DRAW FACTOR: ______________ + _______________ STOPS
FILTER COLOR (TYPE) __________________________________________
RECIPROCITY CALCULATION: + __________________________ STOPS
F-STOP TIME
FINAL EXPOSURE:
COMMENTS:
FINAL DEVELOPMENT TIME BASED ON RECIPROCITY:
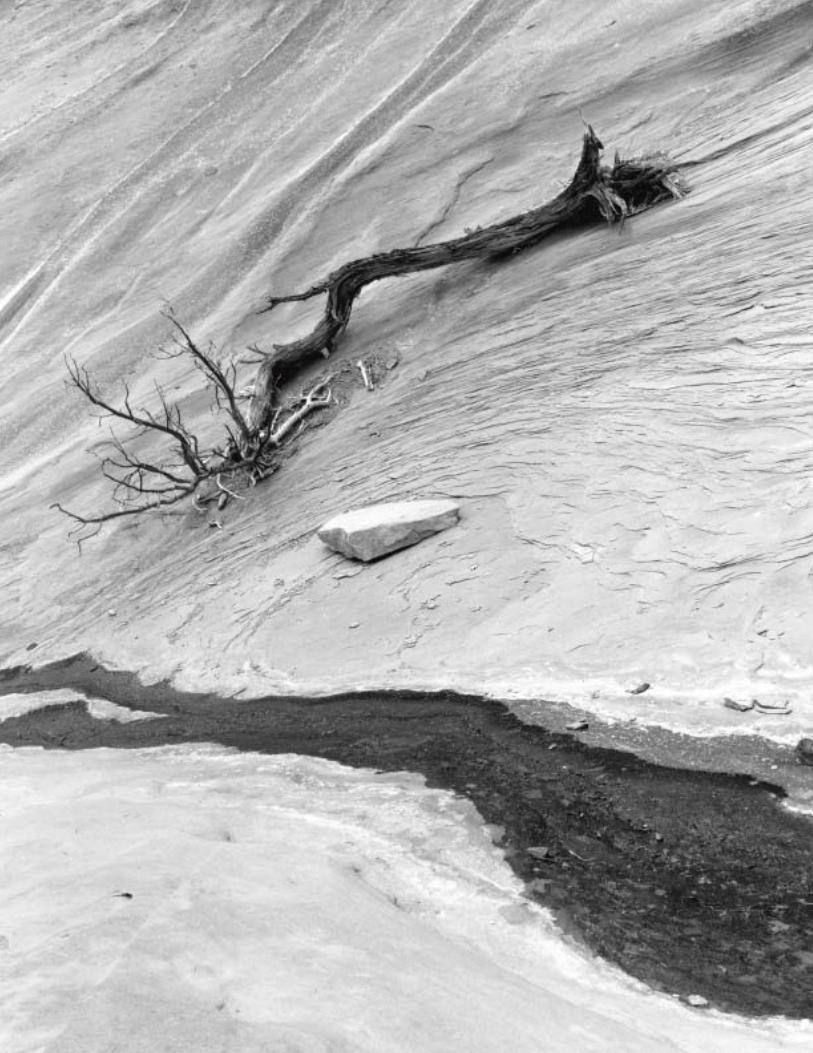
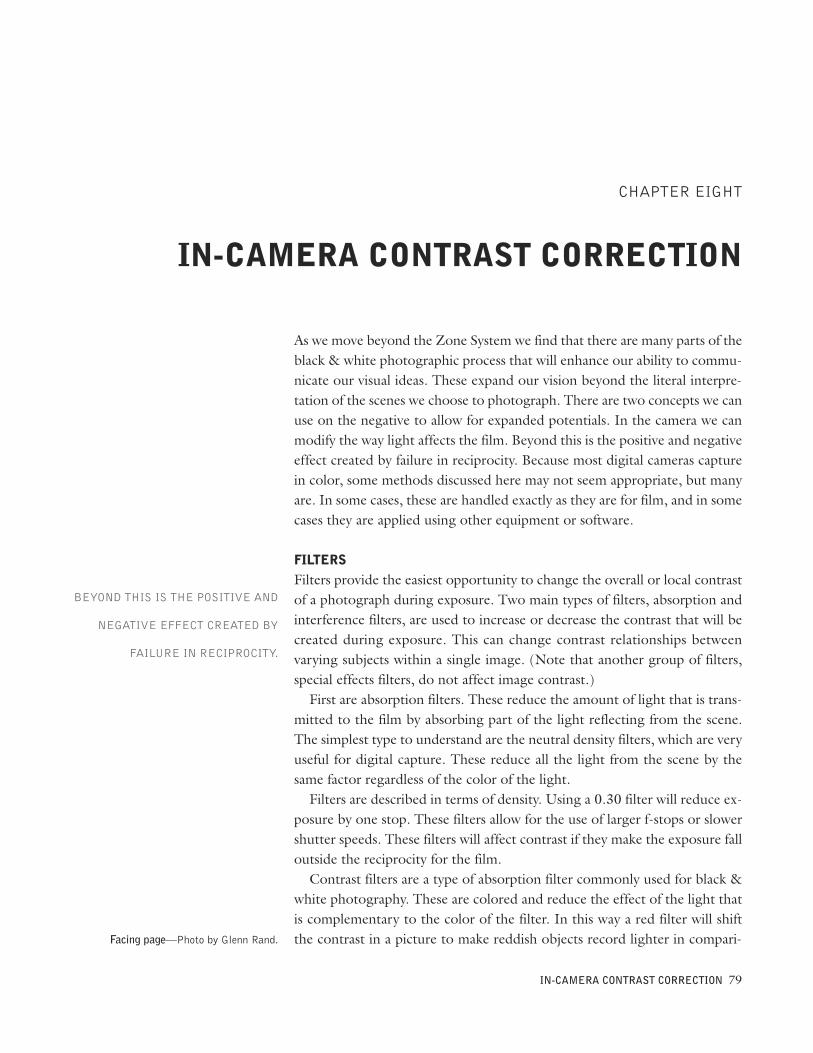
As we move beyond the Zone System we find that there are many parts of theblack & white photographic process that will enhance our ability to commu-nicate our visual ideas. These expand our vision beyond the literal interpre-tation of the scenes we choose to photograph. There are two concepts we canuse on the negative to allow for expanded potentials. In the camera we canmodify the way light affects the film. Beyond this is the positive and negativeeffect created by failure in reciprocity. Because most digital cameras capturein color, some methods discussed here may not seem appropriate, but manyare. In some cases, these are handled exactly as they are for film, and in somecases they are applied using other equipment or software.
FILTERSFilters provide the easiest opportunity to change the overall or local contrastof a photograph during exposure. Two main types of filters, absorption andinterference filters, are used to increase or decrease the contrast that will becreated during exposure. This can change contrast relationships betweenvarying subjects within a single image. (Note that another group of filters,special effects filters, do not affect image contrast.)First are absorption filters. These reduce the amount of light that is trans-
mitted to the film by absorbing part of the light reflecting from the scene.The simplest type to understand are the neutral density filters, which are veryuseful for digital capture. These reduce all the light from the scene by thesame factor regardless of the color of the light.Filters are described in terms of density. Using a 0.30 filter will reduce ex-
posure by one stop. These filters allow for the use of larger f-stops or slowershutter speeds. These filters will affect contrast if they make the exposure falloutside the reciprocity for the film.Contrast filters are a type of absorption filter commonly used for black &
white photography. These are colored and reduce the effect of the light thatis complementary to the color of the filter. In this way a red filter will shiftthe contrast in a picture to make reddish objects record lighter in compari-
IN-CAMERA CONTRAST CORRECTION 79
CHAPTER EIGHT
IN-CAMERA CONTRAST CORRECTION
Facing page—Photo by Glenn Rand.
BEYOND THIS IS THE POSITIVE AND
NEGATIVE EFFECT CREATED BY
FAILURE IN RECIPROCITY.
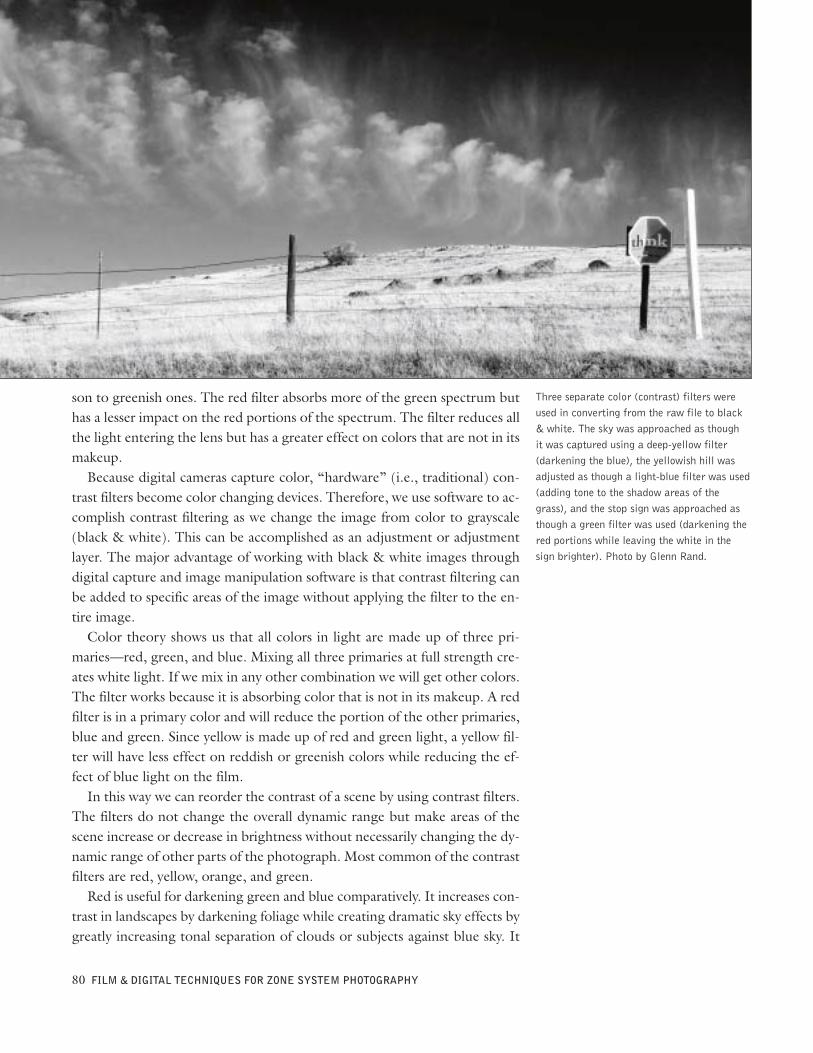
son to greenish ones. The red filter absorbs more of the green spectrum buthas a lesser impact on the red portions of the spectrum. The filter reduces allthe light entering the lens but has a greater effect on colors that are not in itsmakeup.Because digital cameras capture color, “hardware” (i.e., traditional) con-
trast filters become color changing devices. Therefore, we use software to ac-complish contrast filtering as we change the image from color to grayscale(black & white). This can be accomplished as an adjustment or adjustmentlayer. The major advantage of working with black & white images throughdigital capture and image manipulation software is that contrast filtering canbe added to specific areas of the image without applying the filter to the en-tire image.Color theory shows us that all colors in light are made up of three pri-
maries—red, green, and blue. Mixing all three primaries at full strength cre-ates white light. If we mix in any other combination we will get other colors.The filter works because it is absorbing color that is not in its makeup. A redfilter is in a primary color and will reduce the portion of the other primaries,blue and green. Since yellow is made up of red and green light, a yellow fil-ter will have less effect on reddish or greenish colors while reducing the ef-fect of blue light on the film.In this way we can reorder the contrast of a scene by using contrast filters.
The filters do not change the overall dynamic range but make areas of thescene increase or decrease in brightness without necessarily changing the dy-namic range of other parts of the photograph. Most common of the contrastfilters are red, yellow, orange, and green.Red is useful for darkening green and blue comparatively. It increases con-
trast in landscapes by darkening foliage while creating dramatic sky effects bygreatly increasing tonal separation of clouds or subjects against blue sky. It
80 FILM & DIGITAL TECHNIQUES FOR ZONE SYSTEM PHOTOGRAPHY
Three separate color (contrast) filters wereused in converting from the raw file to black& white. The sky was approached as thoughit was captured using a deep-yellow filter(darkening the blue), the yellowish hill wasadjusted as though a light-blue filter was used(adding tone to the shadow areas of thegrass), and the stop sign was approached asthough a green filter was used (darkening thered portions while leaving the white in thesign brighter). Photo by Glenn Rand.
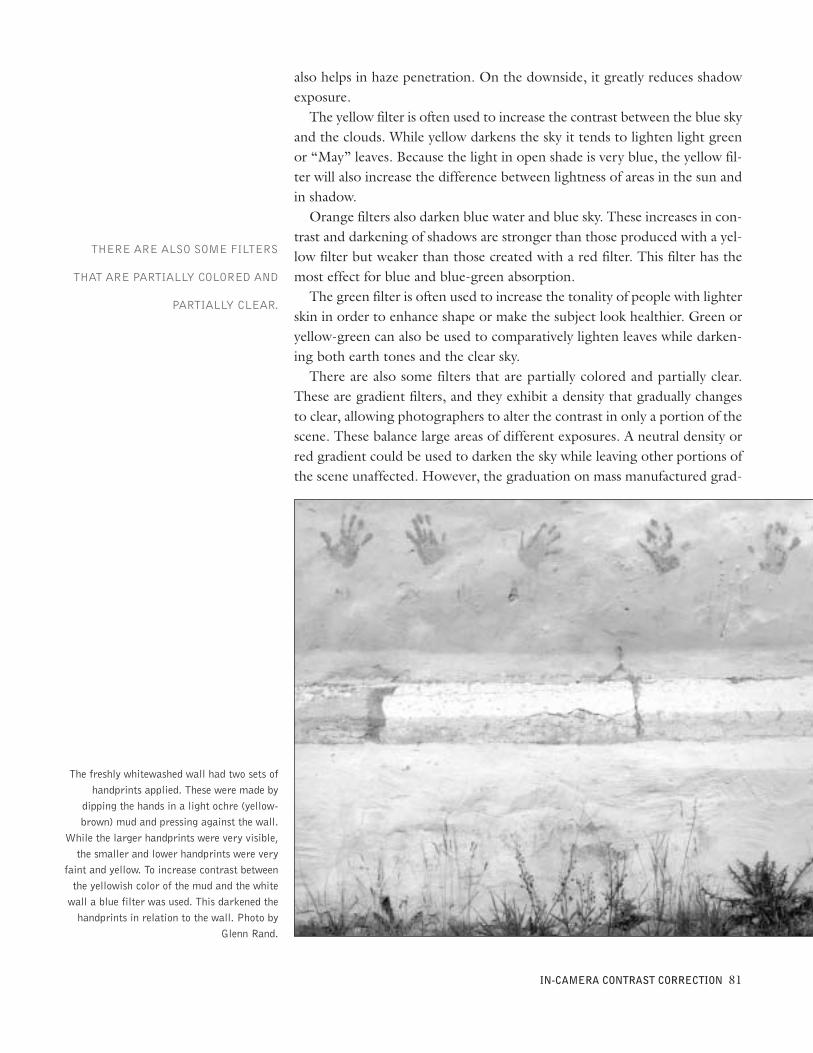
also helps in haze penetration. On the downside, it greatly reduces shadowexposure.The yellow filter is often used to increase the contrast between the blue sky
and the clouds. While yellow darkens the sky it tends to lighten light greenor “May” leaves. Because the light in open shade is very blue, the yellow fil-ter will also increase the difference between lightness of areas in the sun andin shadow.Orange filters also darken blue water and blue sky. These increases in con-
trast and darkening of shadows are stronger than those produced with a yel-low filter but weaker than those created with a red filter. This filter has themost effect for blue and blue-green absorption.The green filter is often used to increase the tonality of people with lighter
skin in order to enhance shape or make the subject look healthier. Green oryellow-green can also be used to comparatively lighten leaves while darken-ing both earth tones and the clear sky.There are also some filters that are partially colored and partially clear.
These are gradient filters, and they exhibit a density that gradually changesto clear, allowing photographers to alter the contrast in only a portion of thescene. These balance large areas of different exposures. A neutral density orred gradient could be used to darken the sky while leaving other portions ofthe scene unaffected. However, the graduation on mass manufactured grad-
IN-CAMERA CONTRAST CORRECTION 81
The freshly whitewashed wall had two sets ofhandprints applied. These were made by
dipping the hands in a light ochre (yellow-brown) mud and pressing against the wall.
While the larger handprints were very visible,the smaller and lower handprints were very
faint and yellow. To increase contrast betweenthe yellowish color of the mud and the whitewall a blue filter was used. This darkened thehandprints in relation to the wall. Photo by
Glenn Rand.
THERE ARE ALSO SOME FILTERS
THAT ARE PARTIALLY COLORED AND
PARTIALLY CLEAR.
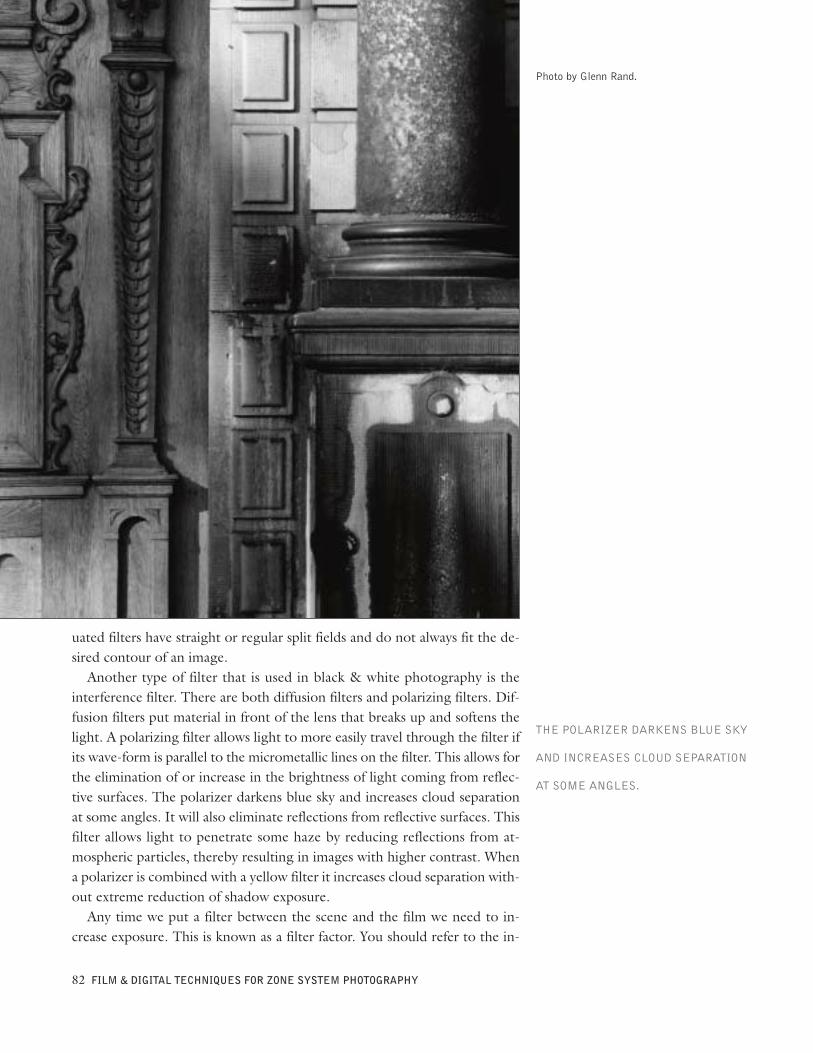
uated filters have straight or regular split fields and do not always fit the de-sired contour of an image.Another type of filter that is used in black & white photography is the
interference filter. There are both diffusion filters and polarizing filters. Dif-fusion filters put material in front of the lens that breaks up and softens thelight. A polarizing filter allows light to more easily travel through the filter ifits wave-form is parallel to the micrometallic lines on the filter. This allows forthe elimination of or increase in the brightness of light coming from reflec-tive surfaces. The polarizer darkens blue sky and increases cloud separationat some angles. It will also eliminate reflections from reflective surfaces. Thisfilter allows light to penetrate some haze by reducing reflections from at-mospheric particles, thereby resulting in images with higher contrast. Whena polarizer is combined with a yellow filter it increases cloud separation with-out extreme reduction of shadow exposure.Any time we put a filter between the scene and the film we need to in-
crease exposure. This is known as a filter factor. You should refer to the in-
82 FILM & DIGITAL TECHNIQUES FOR ZONE SYSTEM PHOTOGRAPHY
Photo by Glenn Rand.
THE POLARIZER DARKENS BLUE SKY
AND INCREASES CLOUD SEPARATION
AT SOME ANGLES.
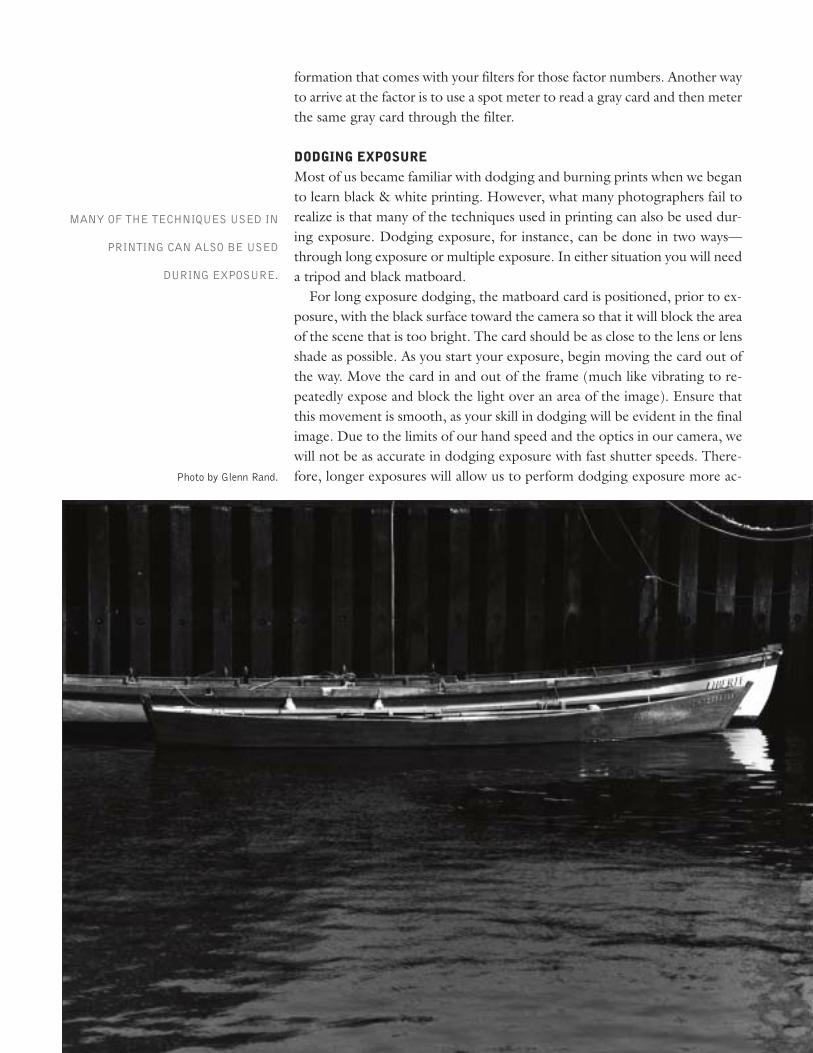
formation that comes with your filters for those factor numbers. Another wayto arrive at the factor is to use a spot meter to read a gray card and then meterthe same gray card through the filter.
DODGING EXPOSUREMost of us became familiar with dodging and burning prints when we beganto learn black & white printing. However, what many photographers fail torealize is that many of the techniques used in printing can also be used dur-ing exposure. Dodging exposure, for instance, can be done in two ways—through long exposure or multiple exposure. In either situation you will needa tripod and black matboard.For long exposure dodging, the matboard card is positioned, prior to ex-
posure, with the black surface toward the camera so that it will block the areaof the scene that is too bright. The card should be as close to the lens or lensshade as possible. As you start your exposure, begin moving the card out ofthe way. Move the card in and out of the frame (much like vibrating to re-peatedly expose and block the light over an area of the image). Ensure thatthis movement is smooth, as your skill in dodging will be evident in the finalimage. Due to the limits of our hand speed and the optics in our camera, wewill not be as accurate in dodging exposure with fast shutter speeds. There-fore, longer exposures will allow us to perform dodging exposure more ac-Photo by Glenn Rand.
MANY OF THE TECHNIQUES USED IN
PRINTING CAN ALSO BE USED
DURING EXPOSURE.
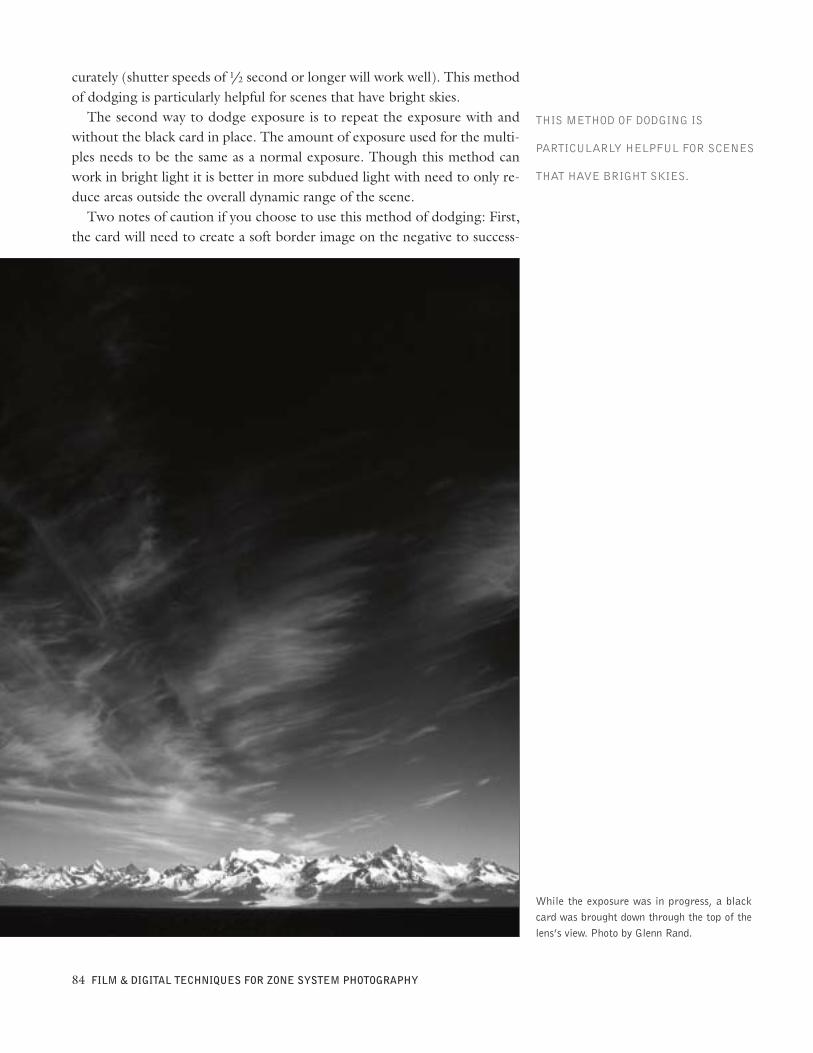
curately (shutter speeds of 1/2 second or longer will work well). This methodof dodging is particularly helpful for scenes that have bright skies.The second way to dodge exposure is to repeat the exposure with and
without the black card in place. The amount of exposure used for the multi-ples needs to be the same as a normal exposure. Though this method canwork in bright light it is better in more subdued light with need to only re-duce areas outside the overall dynamic range of the scene.Two notes of caution if you choose to use this method of dodging: First,
the card will need to create a soft border image on the negative to success-
84 FILM & DIGITAL TECHNIQUES FOR ZONE SYSTEM PHOTOGRAPHY
While the exposure was in progress, a blackcard was brought down through the top of thelens’s view. Photo by Glenn Rand.
THIS METHOD OF DODGING IS
PARTICULARLY HELPFUL FOR SCENES
THAT HAVE BRIGHT SKIES.
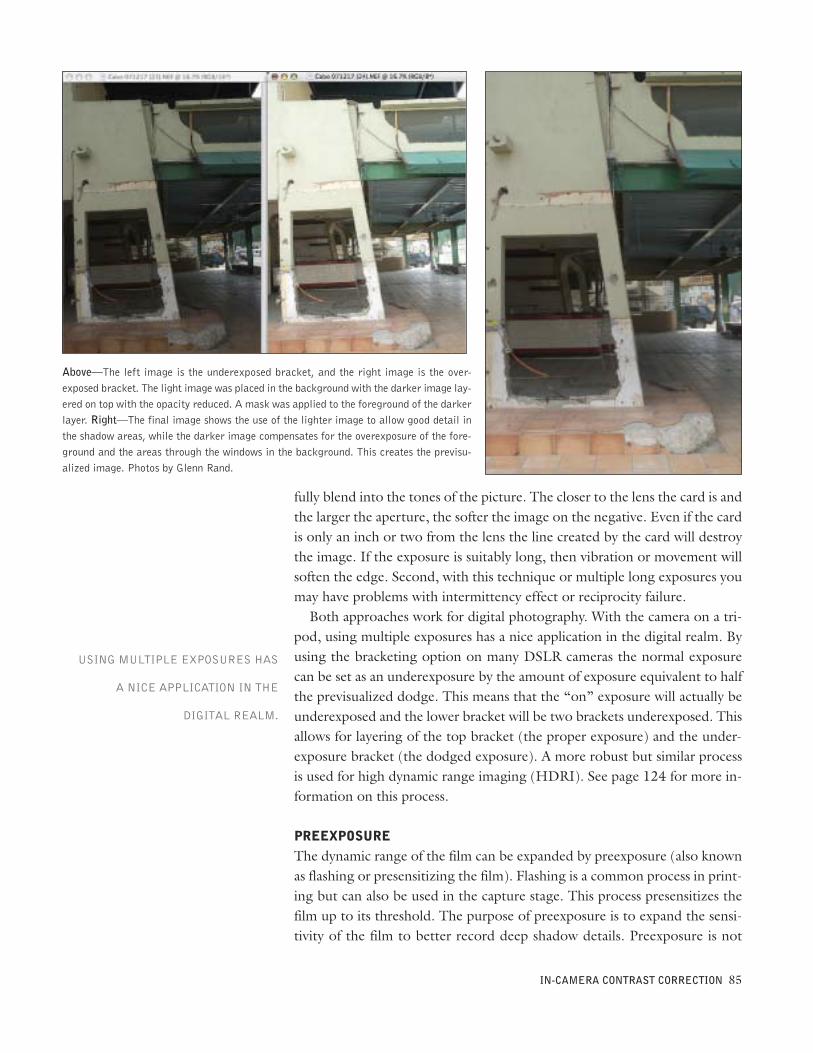
fully blend into the tones of the picture. The closer to the lens the card is andthe larger the aperture, the softer the image on the negative. Even if the cardis only an inch or two from the lens the line created by the card will destroythe image. If the exposure is suitably long, then vibration or movement willsoften the edge. Second, with this technique or multiple long exposures youmay have problems with intermittency effect or reciprocity failure.Both approaches work for digital photography. With the camera on a tri-
pod, using multiple exposures has a nice application in the digital realm. Byusing the bracketing option on many DSLR cameras the normal exposurecan be set as an underexposure by the amount of exposure equivalent to halfthe previsualized dodge. This means that the “on” exposure will actually beunderexposed and the lower bracket will be two brackets underexposed. Thisallows for layering of the top bracket (the proper exposure) and the under-exposure bracket (the dodged exposure). A more robust but similar processis used for high dynamic range imaging (HDRI). See page 124 for more in-formation on this process.
PREEXPOSUREThe dynamic range of the film can be expanded by preexposure (also knownas flashing or presensitizing the film). Flashing is a common process in print-ing but can also be used in the capture stage. This process presensitizes thefilm up to its threshold. The purpose of preexposure is to expand the sensi-tivity of the film to better record deep shadow details. Preexposure is not
IN-CAMERA CONTRAST CORRECTION 85
USING MULTIPLE EXPOSURES HAS
A NICE APPLICATION IN THE
DIGITAL REALM.
Above—The left image is the underexposed bracket, and the right image is the over-exposed bracket. The light image was placed in the background with the darker image lay-ered on top with the opacity reduced. A mask was applied to the foreground of the darkerlayer. Right—The final image shows the use of the lighter image to allow good detail inthe shadow areas, while the darker image compensates for the overexposure of the fore-ground and the areas through the windows in the background. This creates the previsu-alized image. Photos by Glenn Rand.
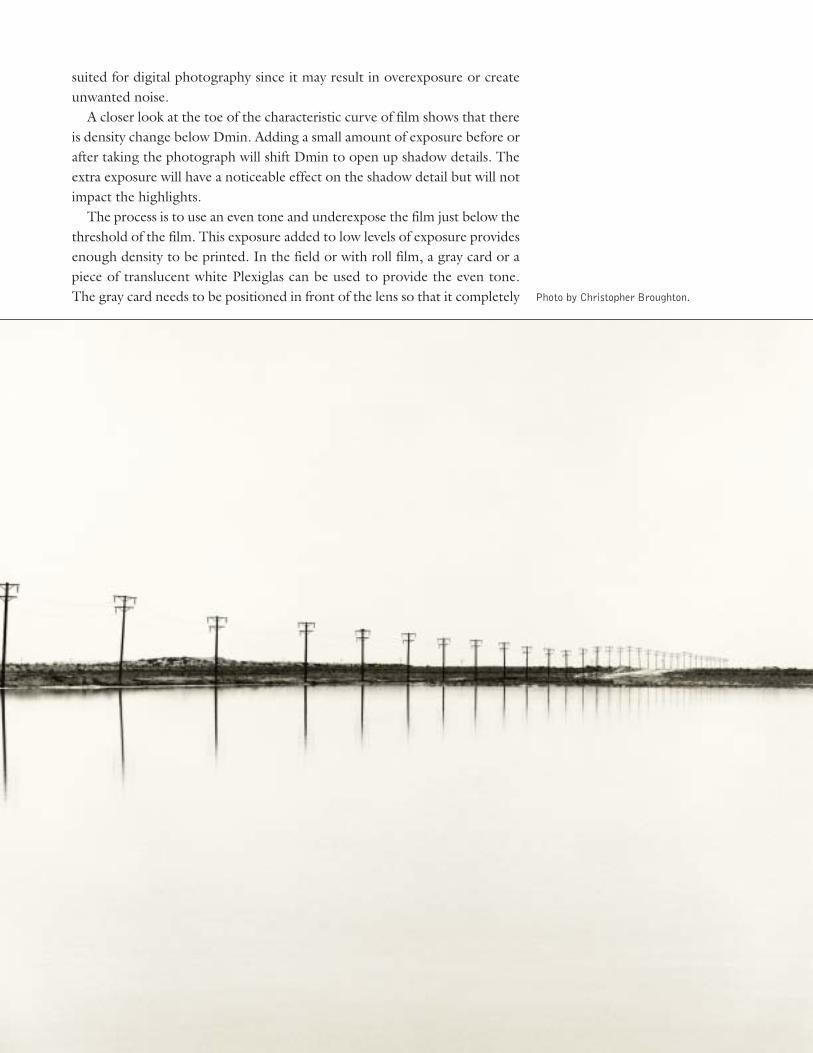
suited for digital photography since it may result in overexposure or createunwanted noise.A closer look at the toe of the characteristic curve of film shows that there
is density change below Dmin. Adding a small amount of exposure before orafter taking the photograph will shift Dmin to open up shadow details. Theextra exposure will have a noticeable effect on the shadow detail but will notimpact the highlights.The process is to use an even tone and underexpose the film just below the
threshold of the film. This exposure added to low levels of exposure providesenough density to be printed. In the field or with roll film, a gray card or apiece of translucent white Plexiglas can be used to provide the even tone.The gray card needs to be positioned in front of the lens so that it completely Photo by Christopher Broughton.
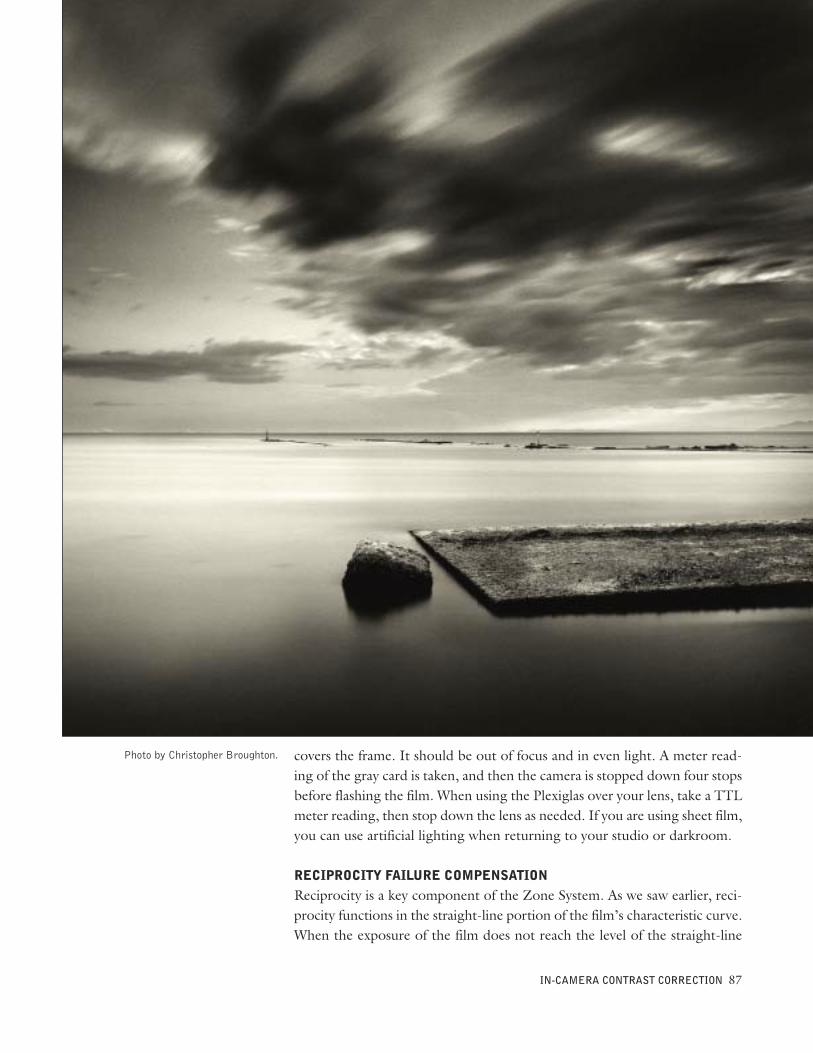
covers the frame. It should be out of focus and in even light. A meter read-ing of the gray card is taken, and then the camera is stopped down four stopsbefore flashing the film. When using the Plexiglas over your lens, take a TTLmeter reading, then stop down the lens as needed. If you are using sheet film,you can use artificial lighting when returning to your studio or darkroom.
RECIPROCITY FAILURE COMPENSATIONReciprocity is a key component of the Zone System. As we saw earlier, reci-procity functions in the straight-line portion of the film’s characteristic curve.When the exposure of the film does not reach the level of the straight-line
IN-CAMERA CONTRAST CORRECTION 87
Photo by Christopher Broughton.
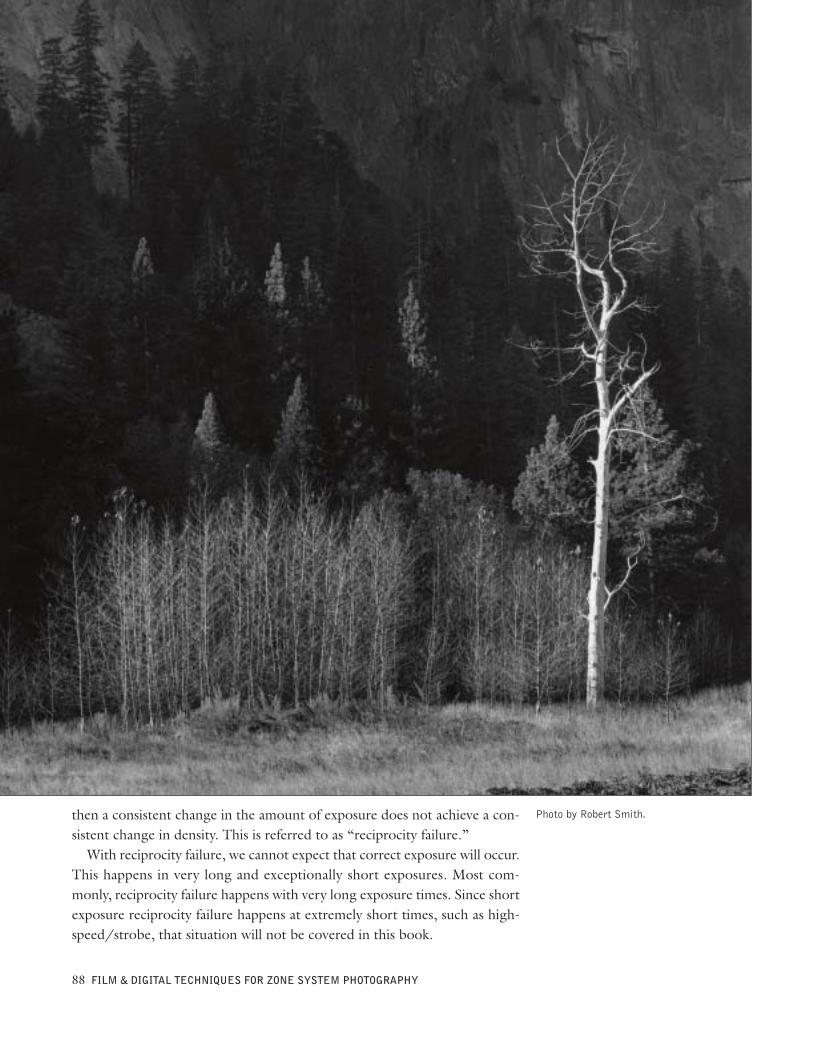
then a consistent change in the amount of exposure does not achieve a con-sistent change in density. This is referred to as “reciprocity failure.”With reciprocity failure, we cannot expect that correct exposure will occur.
This happens in very long and exceptionally short exposures. Most com-monly, reciprocity failure happens with very long exposure times. Since shortexposure reciprocity failure happens at extremely short times, such as high-speed/strobe, that situation will not be covered in this book.
88 FILM & DIGITAL TECHNIQUES FOR ZONE SYSTEM PHOTOGRAPHY
Photo by Robert Smith.
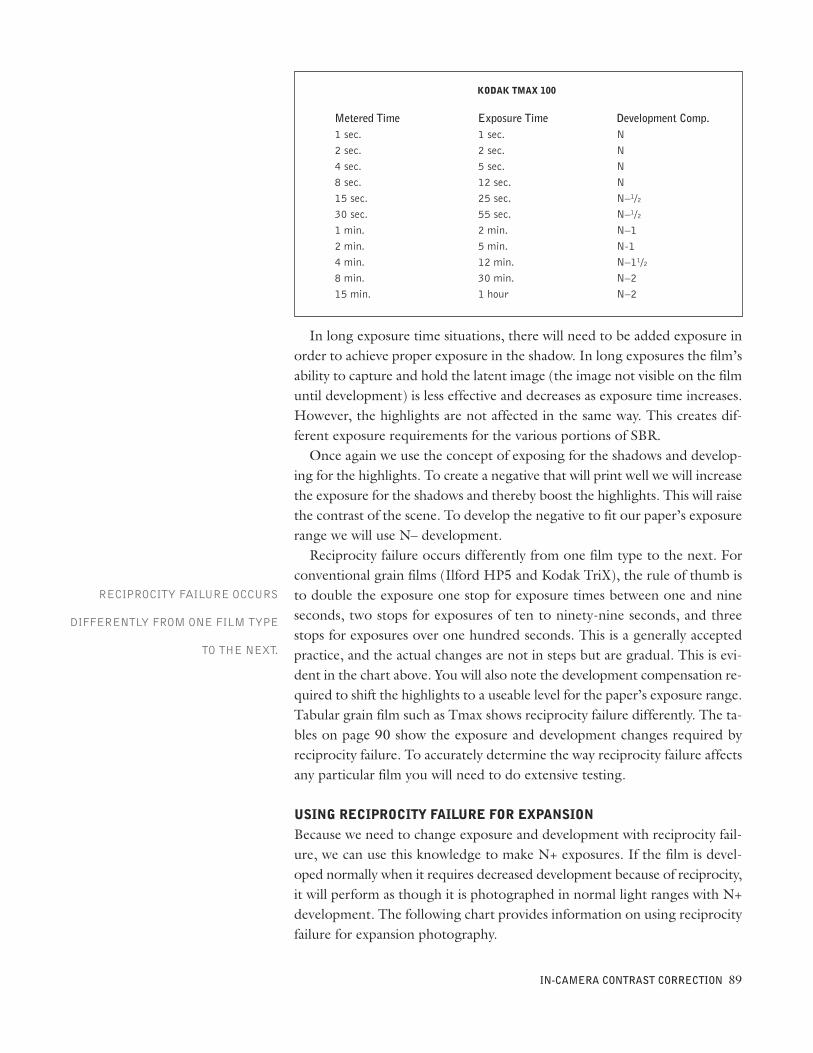
In long exposure time situations, there will need to be added exposure inorder to achieve proper exposure in the shadow. In long exposures the film’sability to capture and hold the latent image (the image not visible on the filmuntil development) is less effective and decreases as exposure time increases.However, the highlights are not affected in the same way. This creates dif-ferent exposure requirements for the various portions of SBR.Once again we use the concept of exposing for the shadows and develop-
ing for the highlights. To create a negative that will print well we will increasethe exposure for the shadows and thereby boost the highlights. This will raisethe contrast of the scene. To develop the negative to fit our paper’s exposurerange we will use N– development.Reciprocity failure occurs differently from one film type to the next. For
conventional grain films (Ilford HP5 and Kodak TriX), the rule of thumb isto double the exposure one stop for exposure times between one and nineseconds, two stops for exposures of ten to ninety-nine seconds, and threestops for exposures over one hundred seconds. This is a generally acceptedpractice, and the actual changes are not in steps but are gradual. This is evi-dent in the chart above. You will also note the development compensation re-quired to shift the highlights to a useable level for the paper’s exposure range.Tabular grain film such as Tmax shows reciprocity failure differently. The ta-bles on page 90 show the exposure and development changes required byreciprocity failure. To accurately determine the way reciprocity failure affectsany particular film you will need to do extensive testing.
USING RECIPROCITY FAILURE FOR EXPANSIONBecause we need to change exposure and development with reciprocity fail-ure, we can use this knowledge to make N+ exposures. If the film is devel-oped normally when it requires decreased development because of reciprocity,it will perform as though it is photographed in normal light ranges with N+development. The following chart provides information on using reciprocityfailure for expansion photography.
IN-CAMERA CONTRAST CORRECTION 89
KODAK TMAX 100
Metered Time1 sec.2 sec.4 sec.8 sec.15 sec.30 sec.1 min.2 min.4 min.8 min.15 min.
Exposure Time1 sec.2 sec.5 sec.12 sec.25 sec.55 sec.2 min.5 min.12 min.30 min.1 hour
Development Comp.NNNNN–1/2N–1/2N–1N-1N–11/2N–2N–2
RECIPROCITY FAILURE OCCURS
DIFFERENTLY FROM ONE FILM TYPE
TO THE NEXT.
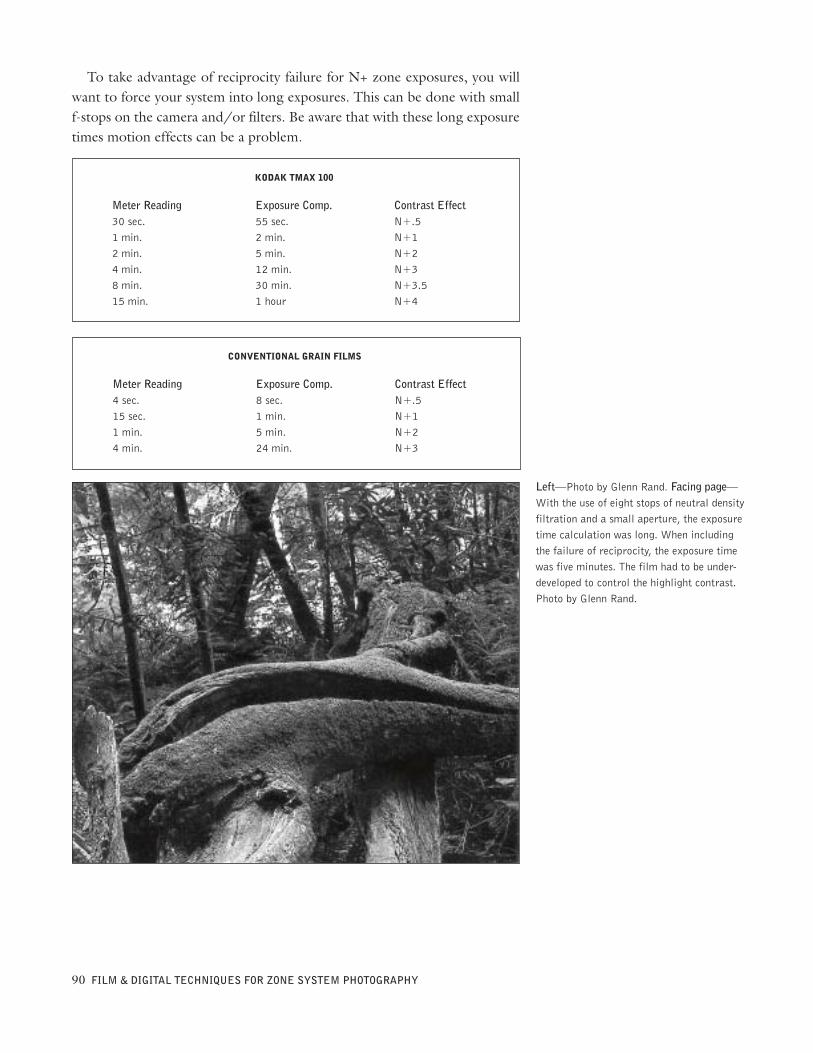
To take advantage of reciprocity failure for N+ zone exposures, you willwant to force your system into long exposures. This can be done with smallf-stops on the camera and/or filters. Be aware that with these long exposuretimes motion effects can be a problem.
90 FILM & DIGITAL TECHNIQUES FOR ZONE SYSTEM PHOTOGRAPHY
KODAK TMAX 100
Meter Reading30 sec.1 min.2 min.4 min.8 min.15 min.
Exposure Comp.55 sec.2 min.5 min.12 min.30 min.1 hour
Contrast EffectN+.5N+1N+2N+3N+3.5N+4
CONVENTIONAL GRAIN FILMS
Meter Reading4 sec.15 sec.1 min.4 min.
Exposure Comp.8 sec.1 min.5 min.24 min.
Contrast EffectN+.5N+1N+2N+3
Left—Photo by Glenn Rand. Facing page—With the use of eight stops of neutral densityfiltration and a small aperture, the exposuretime calculation was long. When includingthe failure of reciprocity, the exposure timewas five minutes. The film had to be under-developed to control the highlight contrast.Photo by Glenn Rand.
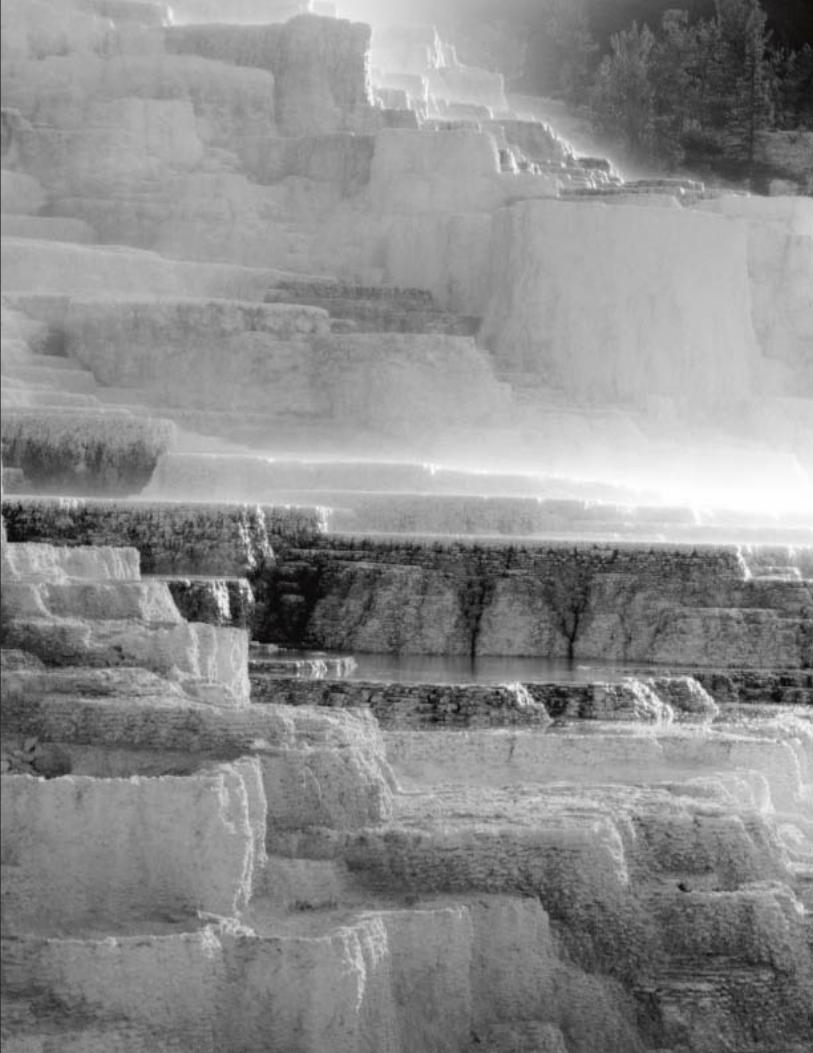
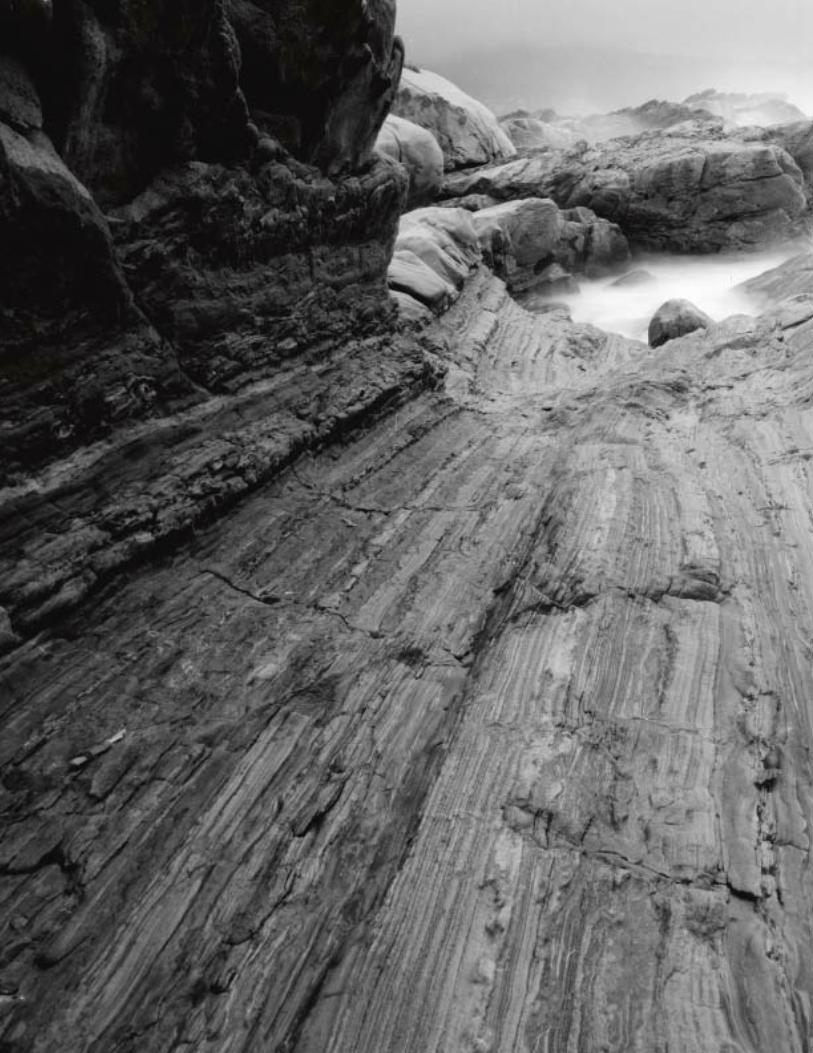
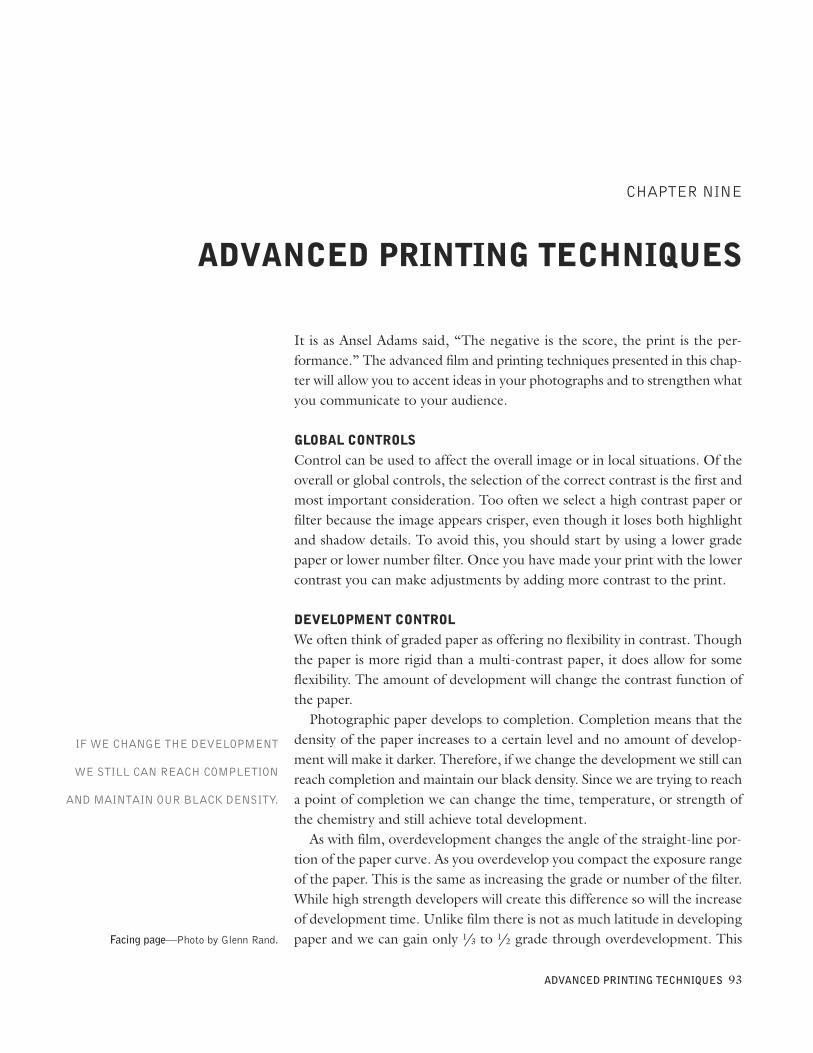
It is as Ansel Adams said, “The negative is the score, the print is the per-formance.” The advanced film and printing techniques presented in this chap-ter will allow you to accent ideas in your photographs and to strengthen whatyou communicate to your audience.
GLOBAL CONTROLSControl can be used to affect the overall image or in local situations. Of theoverall or global controls, the selection of the correct contrast is the first andmost important consideration. Too often we select a high contrast paper orfilter because the image appears crisper, even though it loses both highlightand shadow details. To avoid this, you should start by using a lower gradepaper or lower number filter. Once you have made your print with the lowercontrast you can make adjustments by adding more contrast to the print.
DEVELOPMENT CONTROLWe often think of graded paper as offering no flexibility in contrast. Thoughthe paper is more rigid than a multi-contrast paper, it does allow for someflexibility. The amount of development will change the contrast function ofthe paper.Photographic paper develops to completion. Completion means that the
density of the paper increases to a certain level and no amount of develop-ment will make it darker. Therefore, if we change the development we still canreach completion and maintain our black density. Since we are trying to reacha point of completion we can change the time, temperature, or strength ofthe chemistry and still achieve total development.As with film, overdevelopment changes the angle of the straight-line por-
tion of the paper curve. As you overdevelop you compact the exposure rangeof the paper. This is the same as increasing the grade or number of the filter.While high strength developers will create this difference so will the increaseof development time. Unlike film there is not as much latitude in developingpaper and we can gain only 1/3 to 1/2 grade through overdevelopment. This
ADVANCED PRINTING TECHNIQUES 93
CHAPTER NINE
ADVANCED PRINTING TECHNIQUES
Facing page—Photo by Glenn Rand.
IF WE CHANGE THE DEVELOPMENT
WE STILL CAN REACH COMPLETION
AND MAINTAIN OUR BLACK DENSITY.
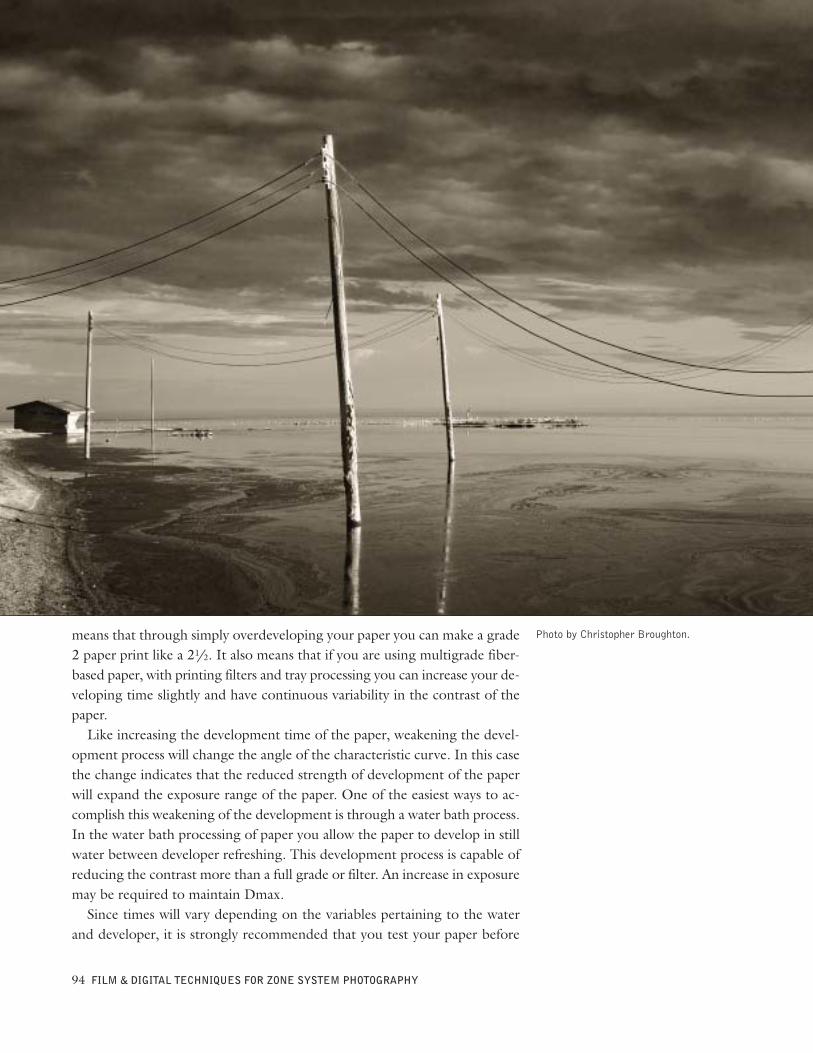
means that through simply overdeveloping your paper you can make a grade2 paper print like a 21/2. It also means that if you are using multigrade fiber-based paper, with printing filters and tray processing you can increase your de-veloping time slightly and have continuous variability in the contrast of thepaper.Like increasing the development time of the paper, weakening the devel-
opment process will change the angle of the characteristic curve. In this casethe change indicates that the reduced strength of development of the paperwill expand the exposure range of the paper. One of the easiest ways to ac-complish this weakening of the development is through a water bath process.In the water bath processing of paper you allow the paper to develop in stillwater between developer refreshing. This development process is capable ofreducing the contrast more than a full grade or filter. An increase in exposuremay be required to maintain Dmax.Since times will vary depending on the variables pertaining to the water
and developer, it is strongly recommended that you test your paper before
94 FILM & DIGITAL TECHNIQUES FOR ZONE SYSTEM PHOTOGRAPHY
Photo by Christopher Broughton.
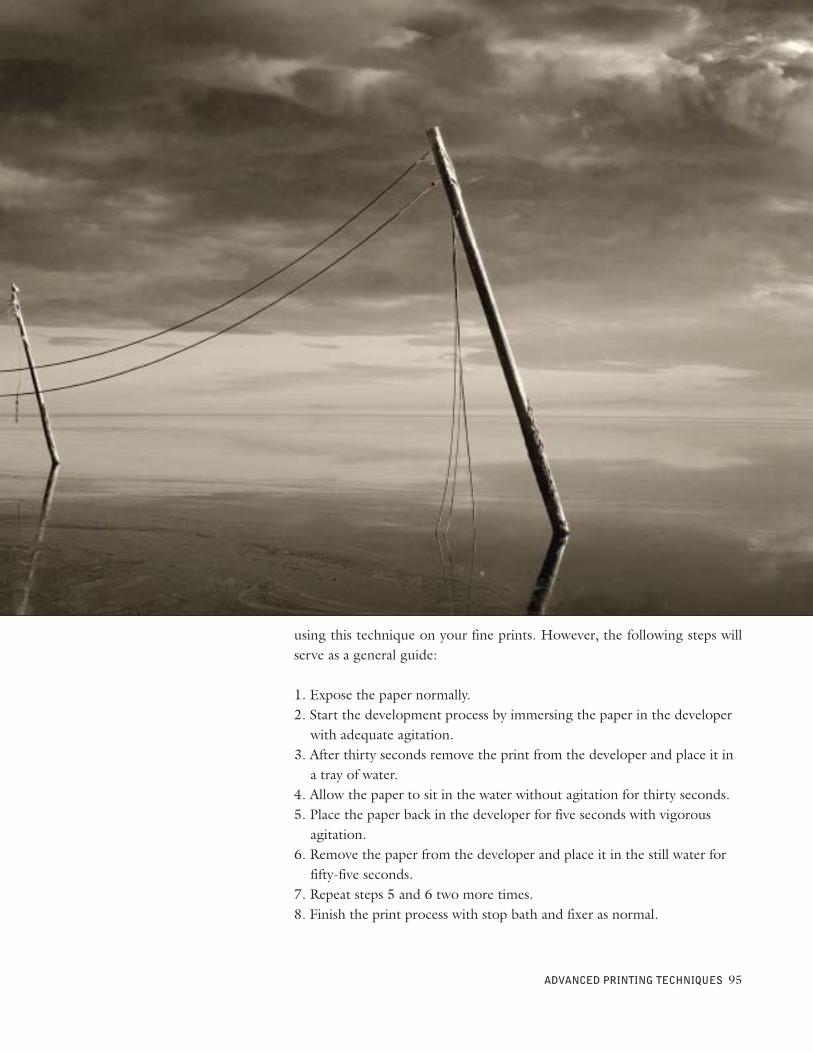
using this technique on your fine prints. However, the following steps willserve as a general guide:
1. Expose the paper normally.2. Start the development process by immersing the paper in the developer
with adequate agitation.3. After thirty seconds remove the print from the developer and place it in
a tray of water.4. Allow the paper to sit in the water without agitation for thirty seconds.5. Place the paper back in the developer for five seconds with vigorous
agitation.6. Remove the paper from the developer and place it in the still water for
fifty-five seconds.7. Repeat steps 5 and 6 two more times.8. Finish the print process with stop bath and fixer as normal.
ADVANCED PRINTING TECHNIQUES 95
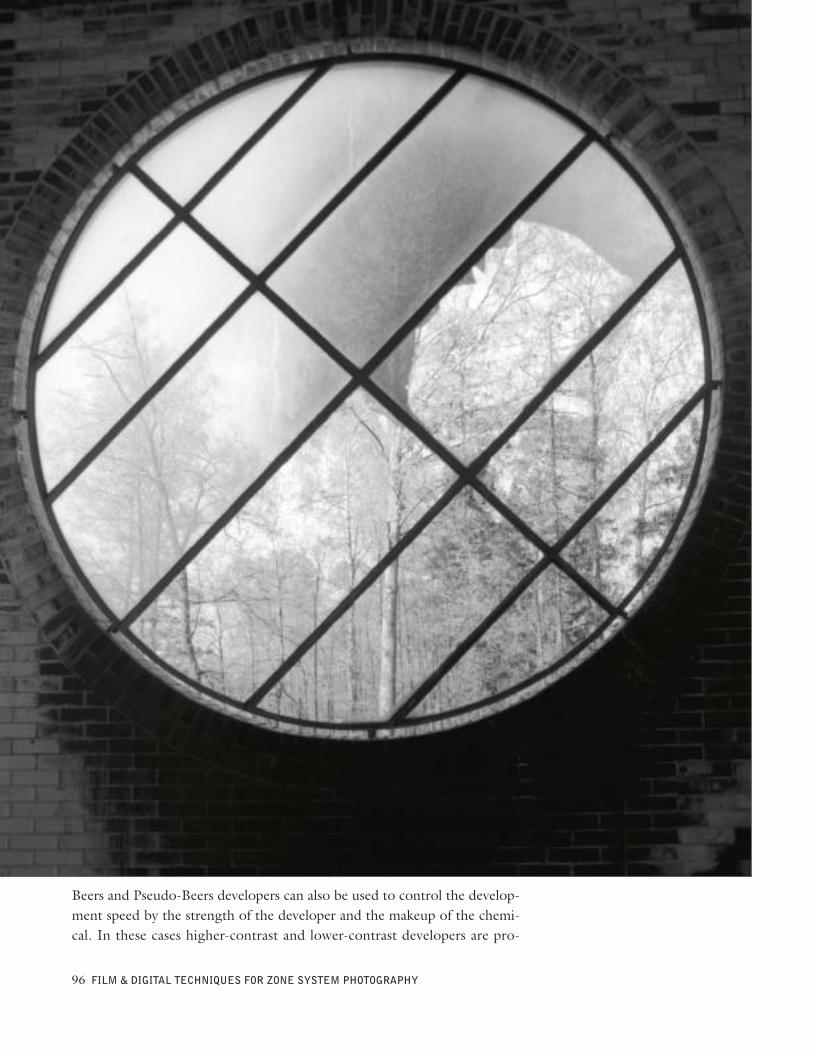
Beers and Pseudo-Beers developers can also be used to control the develop-ment speed by the strength of the developer and the makeup of the chemi-cal. In these cases higher-contrast and lower-contrast developers are pro-
96 FILM & DIGITAL TECHNIQUES FOR ZONE SYSTEM PHOTOGRAPHY
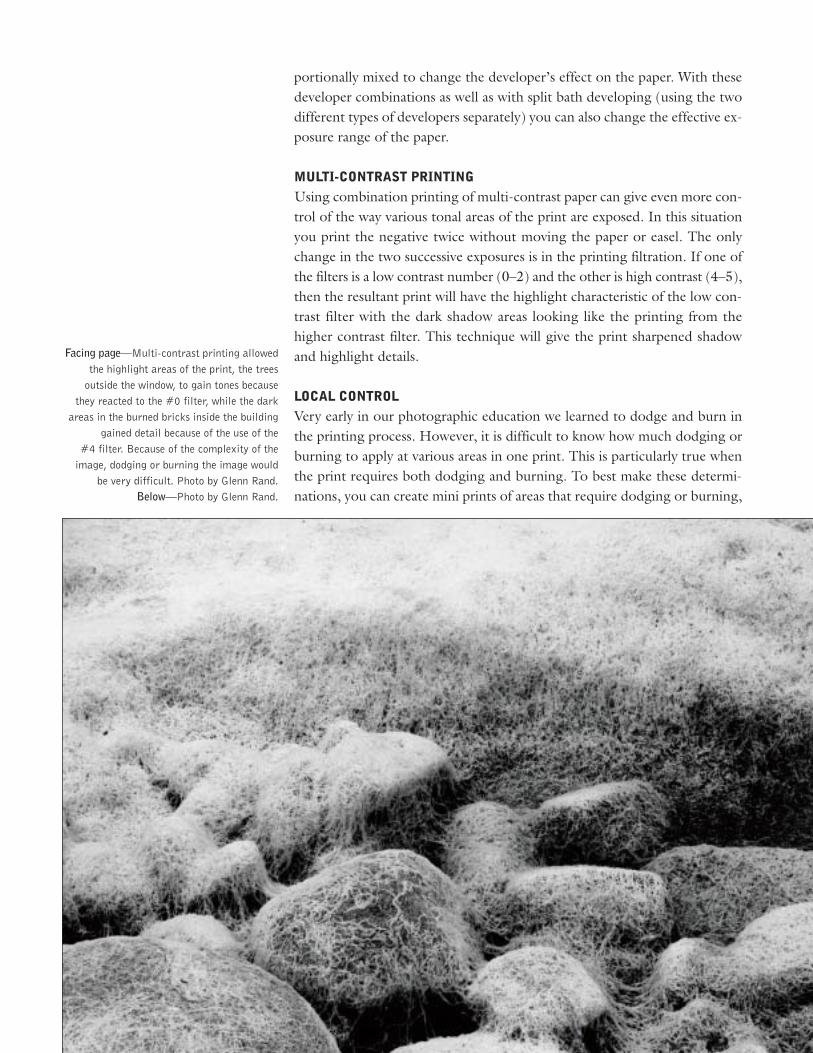
portionally mixed to change the developer’s effect on the paper. With thesedeveloper combinations as well as with split bath developing (using the twodifferent types of developers separately) you can also change the effective ex-posure range of the paper.
MULTI-CONTRAST PRINTINGUsing combination printing of multi-contrast paper can give even more con-trol of the way various tonal areas of the print are exposed. In this situationyou print the negative twice without moving the paper or easel. The onlychange in the two successive exposures is in the printing filtration. If one ofthe filters is a low contrast number (0–2) and the other is high contrast (4–5),then the resultant print will have the highlight characteristic of the low con-trast filter with the dark shadow areas looking like the printing from thehigher contrast filter. This technique will give the print sharpened shadowand highlight details.
LOCAL CONTROLVery early in our photographic education we learned to dodge and burn inthe printing process. However, it is difficult to know how much dodging orburning to apply at various areas in one print. This is particularly true whenthe print requires both dodging and burning. To best make these determi-nations, you can create mini prints of areas that require dodging or burning,
Facing page—Multi-contrast printing allowedthe highlight areas of the print, the treesoutside the window, to gain tones because
they reacted to the #0 filter, while the darkareas in the burned bricks inside the building
gained detail because of the use of the#4 filter. Because of the complexity of theimage, dodging or burning the image would
be very difficult. Photo by Glenn Rand.Below—Photo by Glenn Rand.
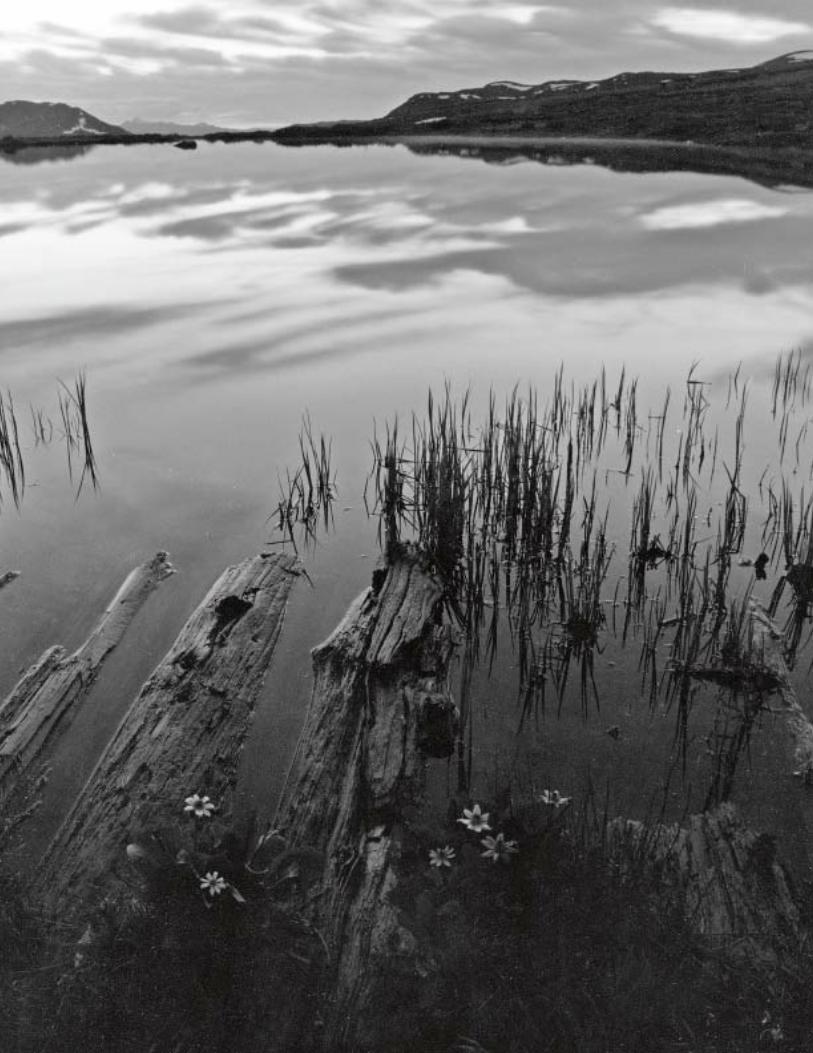
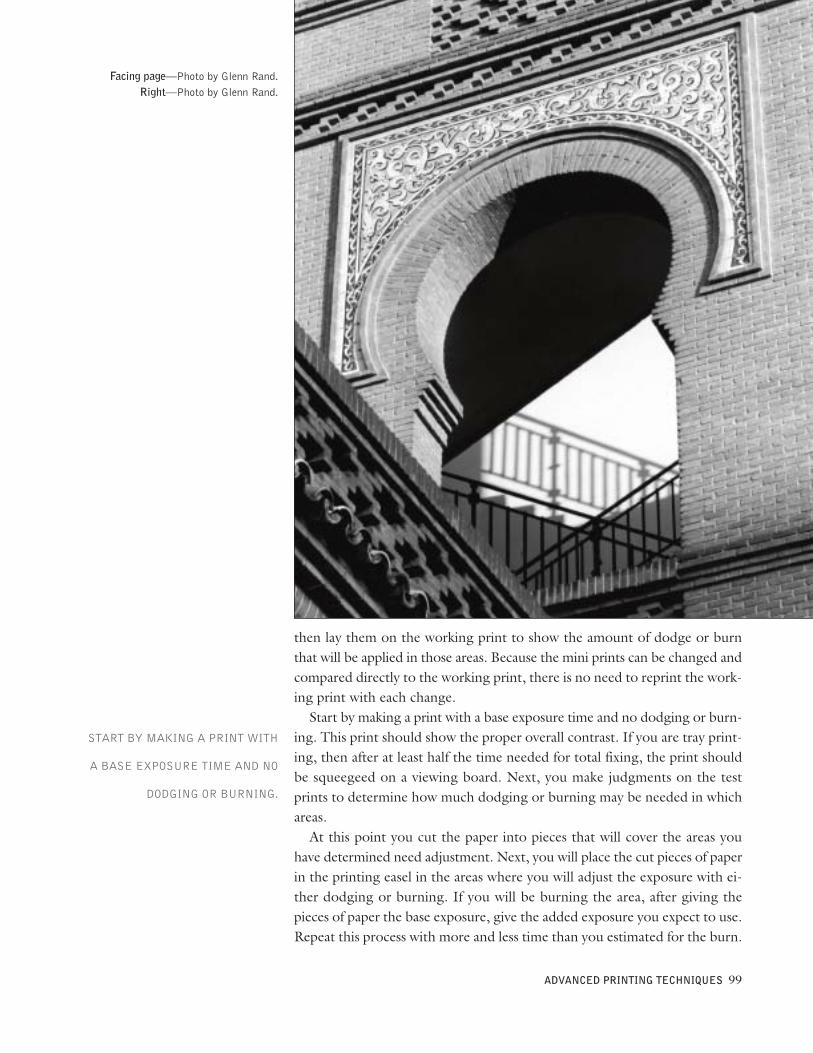
then lay them on the working print to show the amount of dodge or burnthat will be applied in those areas. Because the mini prints can be changed andcompared directly to the working print, there is no need to reprint the work-ing print with each change.Start by making a print with a base exposure time and no dodging or burn-
ing. This print should show the proper overall contrast. If you are tray print-ing, then after at least half the time needed for total fixing, the print shouldbe squeegeed on a viewing board. Next, you make judgments on the testprints to determine how much dodging or burning may be needed in whichareas.At this point you cut the paper into pieces that will cover the areas you
have determined need adjustment. Next, you will place the cut pieces of paperin the printing easel in the areas where you will adjust the exposure with ei-ther dodging or burning. If you will be burning the area, after giving thepieces of paper the base exposure, give the added exposure you expect to use.Repeat this process with more and less time than you estimated for the burn.
ADVANCED PRINTING TECHNIQUES 99
Facing page—Photo by Glenn Rand.Right—Photo by Glenn Rand.
START BY MAKING A PRINT WITH
A BASE EXPOSURE TIME AND NO
DODGING OR BURNING.
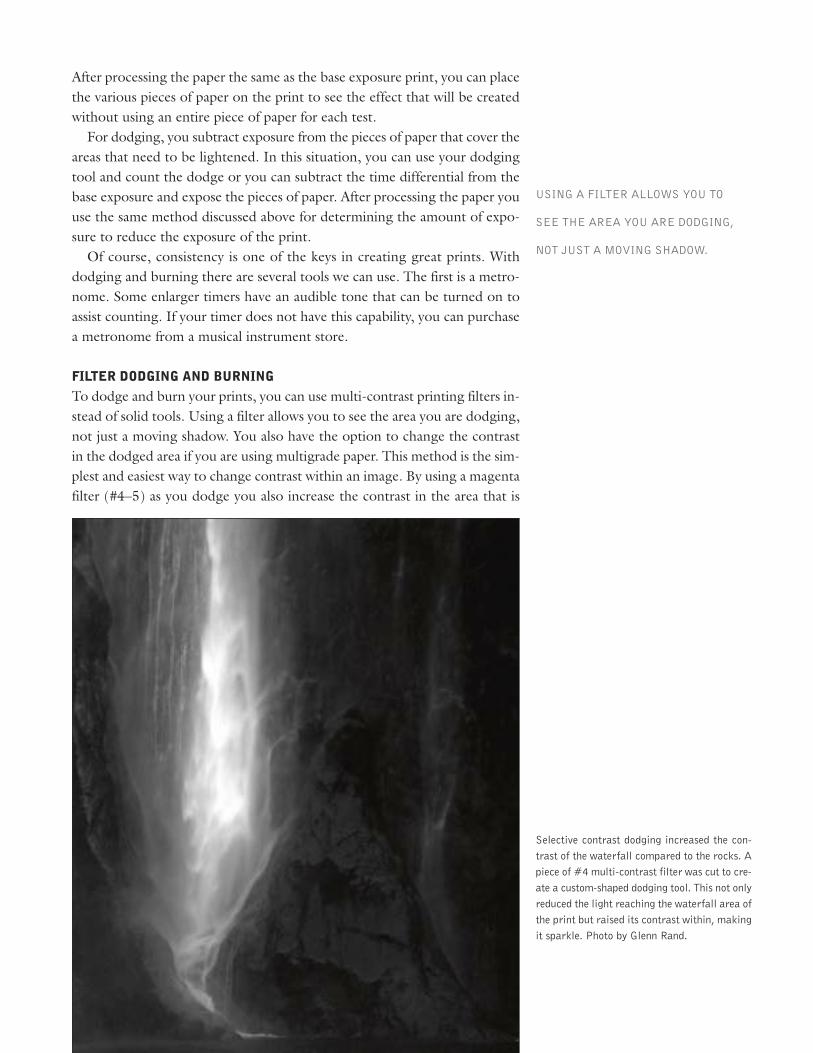
After processing the paper the same as the base exposure print, you can placethe various pieces of paper on the print to see the effect that will be createdwithout using an entire piece of paper for each test.For dodging, you subtract exposure from the pieces of paper that cover the
areas that need to be lightened. In this situation, you can use your dodgingtool and count the dodge or you can subtract the time differential from thebase exposure and expose the pieces of paper. After processing the paper youuse the same method discussed above for determining the amount of expo-sure to reduce the exposure of the print.Of course, consistency is one of the keys in creating great prints. With
dodging and burning there are several tools we can use. The first is a metro-nome. Some enlarger timers have an audible tone that can be turned on toassist counting. If your timer does not have this capability, you can purchasea metronome from a musical instrument store.
FILTER DODGING AND BURNINGTo dodge and burn your prints, you can use multi-contrast printing filters in-stead of solid tools. Using a filter allows you to see the area you are dodging,not just a moving shadow. You also have the option to change the contrastin the dodged area if you are using multigrade paper. This method is the sim-plest and easiest way to change contrast within an image. By using a magentafilter (#4–5) as you dodge you also increase the contrast in the area that is
Selective contrast dodging increased the con-trast of the waterfall compared to the rocks. Apiece of #4 multi-contrast filter was cut to cre-ate a custom-shaped dodging tool. This not onlyreduced the light reaching the waterfall area ofthe print but raised its contrast within, makingit sparkle. Photo by Glenn Rand.
USING A FILTER ALLOWS YOU TO
SEE THE AREA YOU ARE DODGING,
NOT JUST A MOVING SHADOW.
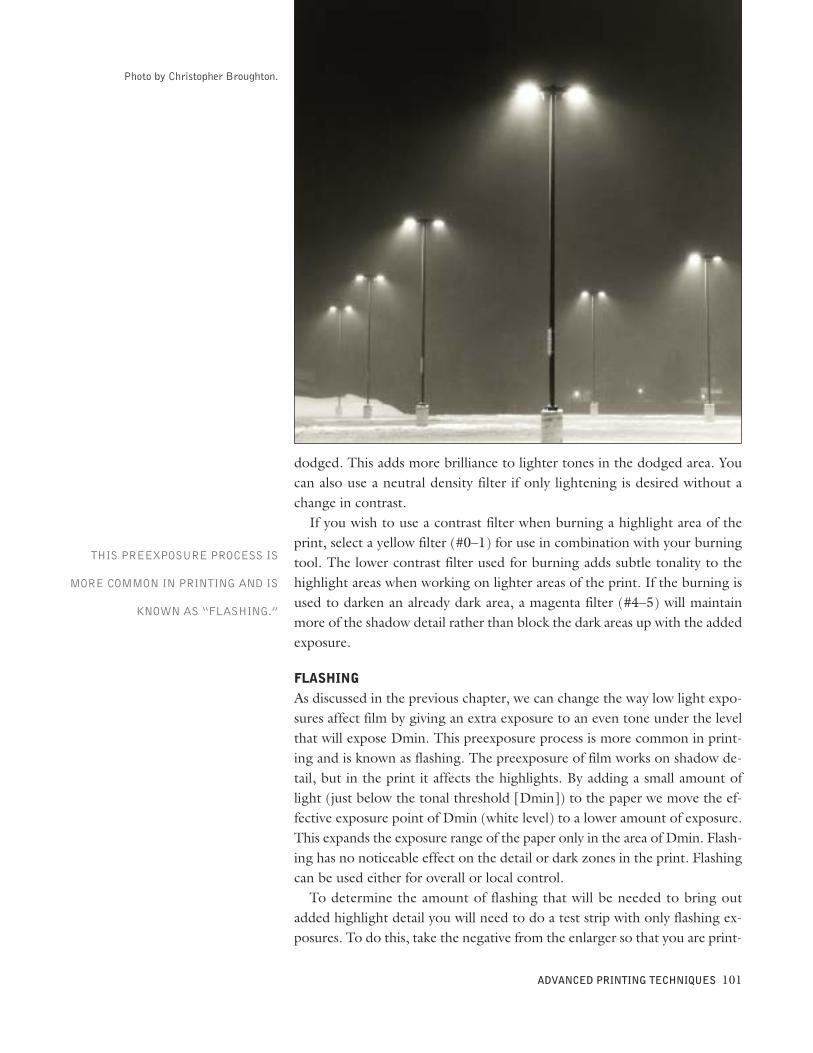
dodged. This adds more brilliance to lighter tones in the dodged area. Youcan also use a neutral density filter if only lightening is desired without achange in contrast.If you wish to use a contrast filter when burning a highlight area of the
print, select a yellow filter (#0–1) for use in combination with your burningtool. The lower contrast filter used for burning adds subtle tonality to thehighlight areas when working on lighter areas of the print. If the burning isused to darken an already dark area, a magenta filter (#4–5) will maintainmore of the shadow detail rather than block the dark areas up with the addedexposure.
FLASHINGAs discussed in the previous chapter, we can change the way low light expo-sures affect film by giving an extra exposure to an even tone under the levelthat will expose Dmin. This preexposure process is more common in print-ing and is known as flashing. The preexposure of film works on shadow de-tail, but in the print it affects the highlights. By adding a small amount oflight (just below the tonal threshold [Dmin]) to the paper we move the ef-fective exposure point of Dmin (white level) to a lower amount of exposure.This expands the exposure range of the paper only in the area of Dmin. Flash-ing has no noticeable effect on the detail or dark zones in the print. Flashingcan be used either for overall or local control.To determine the amount of flashing that will be needed to bring out
added highlight detail you will need to do a test strip with only flashing ex-posures. To do this, take the negative from the enlarger so that you are print-
ADVANCED PRINTING TECHNIQUES 101
Photo by Christopher Broughton.
THIS PREEXPOSURE PROCESS IS
MORE COMMON IN PRINTING AND IS
KNOWN AS “FLASHING.”
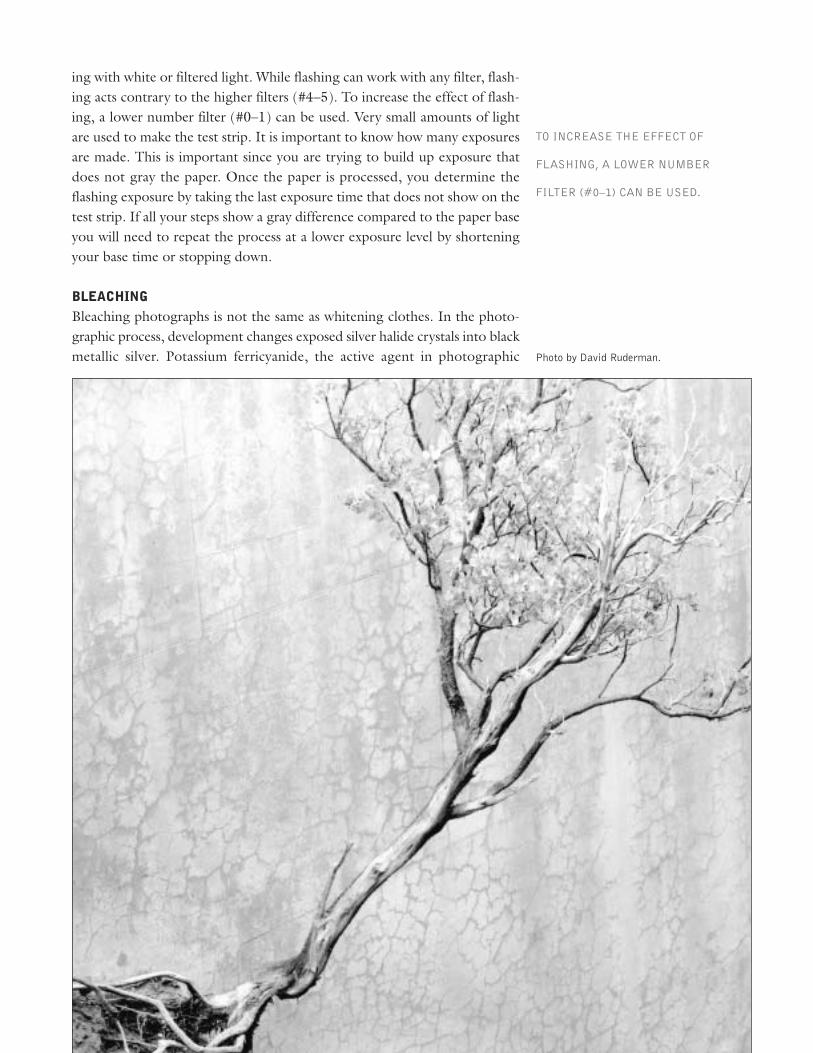
ing with white or filtered light. While flashing can work with any filter, flash-ing acts contrary to the higher filters (#4–5). To increase the effect of flash-ing, a lower number filter (#0–1) can be used. Very small amounts of lightare used to make the test strip. It is important to know how many exposuresare made. This is important since you are trying to build up exposure thatdoes not gray the paper. Once the paper is processed, you determine theflashing exposure by taking the last exposure time that does not show on thetest strip. If all your steps show a gray difference compared to the paper baseyou will need to repeat the process at a lower exposure level by shorteningyour base time or stopping down.
BLEACHINGBleaching photographs is not the same as whitening clothes. In the photo-graphic process, development changes exposed silver halide crystals into blackmetallic silver. Potassium ferricyanide, the active agent in photographic Photo by David Ruderman.
TO INCREASE THE EFFECT OF
FLASHING, A LOWER NUMBER
FILTER (#0–1) CAN BE USED.
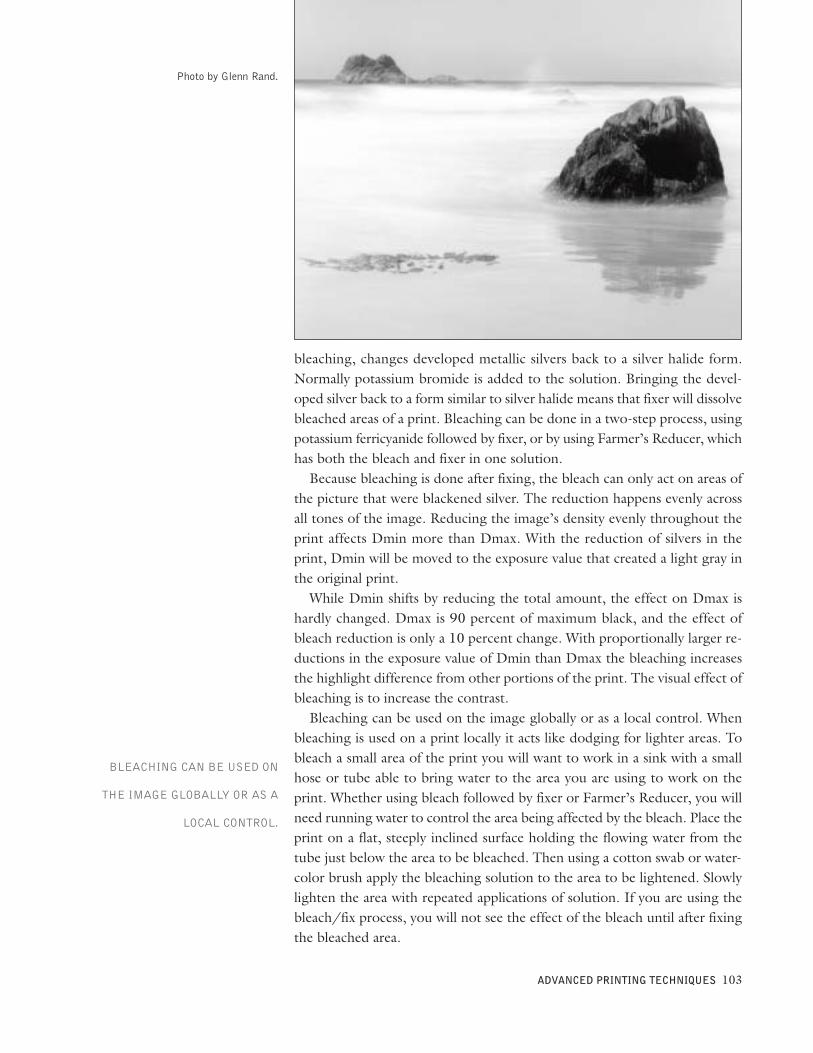
bleaching, changes developed metallic silvers back to a silver halide form.Normally potassium bromide is added to the solution. Bringing the devel-oped silver back to a form similar to silver halide means that fixer will dissolvebleached areas of a print. Bleaching can be done in a two-step process, usingpotassium ferricyanide followed by fixer, or by using Farmer’s Reducer, whichhas both the bleach and fixer in one solution.Because bleaching is done after fixing, the bleach can only act on areas of
the picture that were blackened silver. The reduction happens evenly acrossall tones of the image. Reducing the image’s density evenly throughout theprint affects Dmin more than Dmax. With the reduction of silvers in theprint, Dmin will be moved to the exposure value that created a light gray inthe original print.While Dmin shifts by reducing the total amount, the effect on Dmax is
hardly changed. Dmax is 90 percent of maximum black, and the effect ofbleach reduction is only a 10 percent change. With proportionally larger re-ductions in the exposure value of Dmin than Dmax the bleaching increasesthe highlight difference from other portions of the print. The visual effect ofbleaching is to increase the contrast.Bleaching can be used on the image globally or as a local control. When
bleaching is used on a print locally it acts like dodging for lighter areas. Tobleach a small area of the print you will want to work in a sink with a smallhose or tube able to bring water to the area you are using to work on theprint. Whether using bleach followed by fixer or Farmer’s Reducer, you willneed running water to control the area being affected by the bleach. Place theprint on a flat, steeply inclined surface holding the flowing water from thetube just below the area to be bleached. Then using a cotton swab or water-color brush apply the bleaching solution to the area to be lightened. Slowlylighten the area with repeated applications of solution. If you are using thebleach/fix process, you will not see the effect of the bleach until after fixingthe bleached area.
ADVANCED PRINTING TECHNIQUES 103
Photo by Glenn Rand.
BLEACHING CAN BE USED ON
THE IMAGE GLOBALLY OR AS A
LOCAL CONTROL.
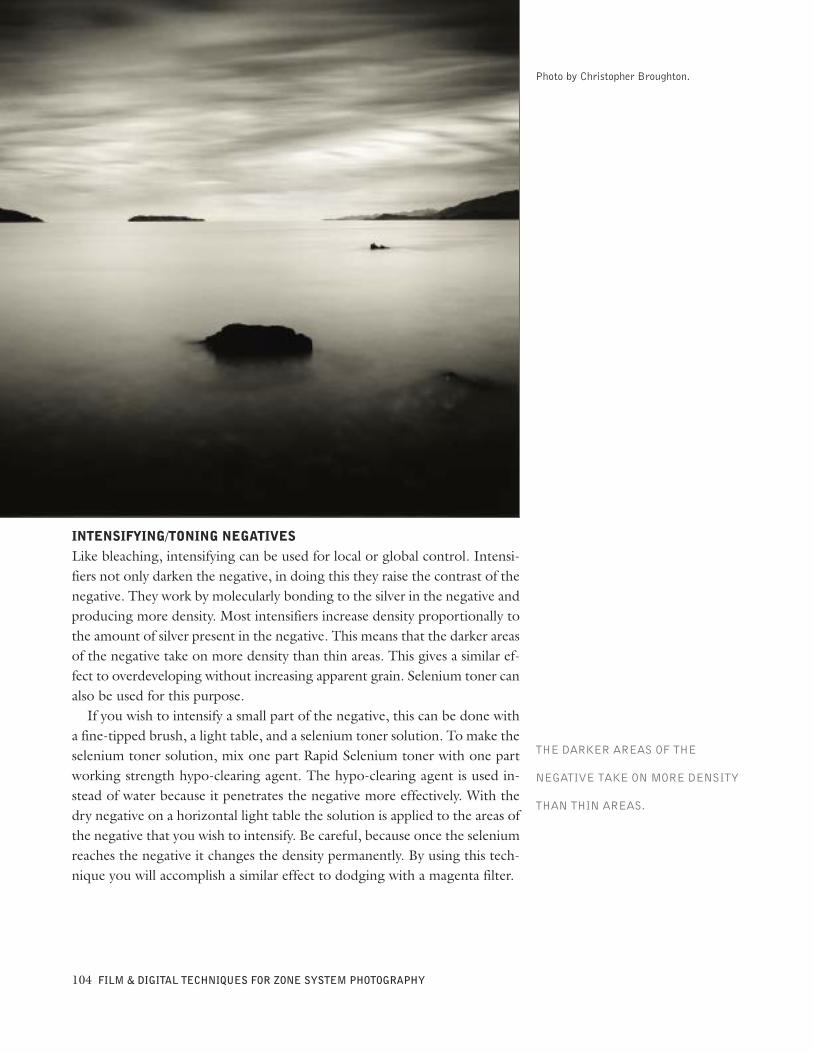
INTENSIFYING/TONING NEGATIVESLike bleaching, intensifying can be used for local or global control. Intensi-fiers not only darken the negative, in doing this they raise the contrast of thenegative. They work by molecularly bonding to the silver in the negative andproducing more density. Most intensifiers increase density proportionally tothe amount of silver present in the negative. This means that the darker areasof the negative take on more density than thin areas. This gives a similar ef-fect to overdeveloping without increasing apparent grain. Selenium toner canalso be used for this purpose.If you wish to intensify a small part of the negative, this can be done with
a fine-tipped brush, a light table, and a selenium toner solution. To make theselenium toner solution, mix one part Rapid Selenium toner with one partworking strength hypo-clearing agent. The hypo-clearing agent is used in-stead of water because it penetrates the negative more effectively. With thedry negative on a horizontal light table the solution is applied to the areas ofthe negative that you wish to intensify. Be careful, because once the seleniumreaches the negative it changes the density permanently. By using this tech-nique you will accomplish a similar effect to dodging with a magenta filter.
104 FILM & DIGITAL TECHNIQUES FOR ZONE SYSTEM PHOTOGRAPHY
Photo by Christopher Broughton.
THE DARKER AREAS OF THE
NEGATIVE TAKE ON MORE DENSITY
THAN THIN AREAS.
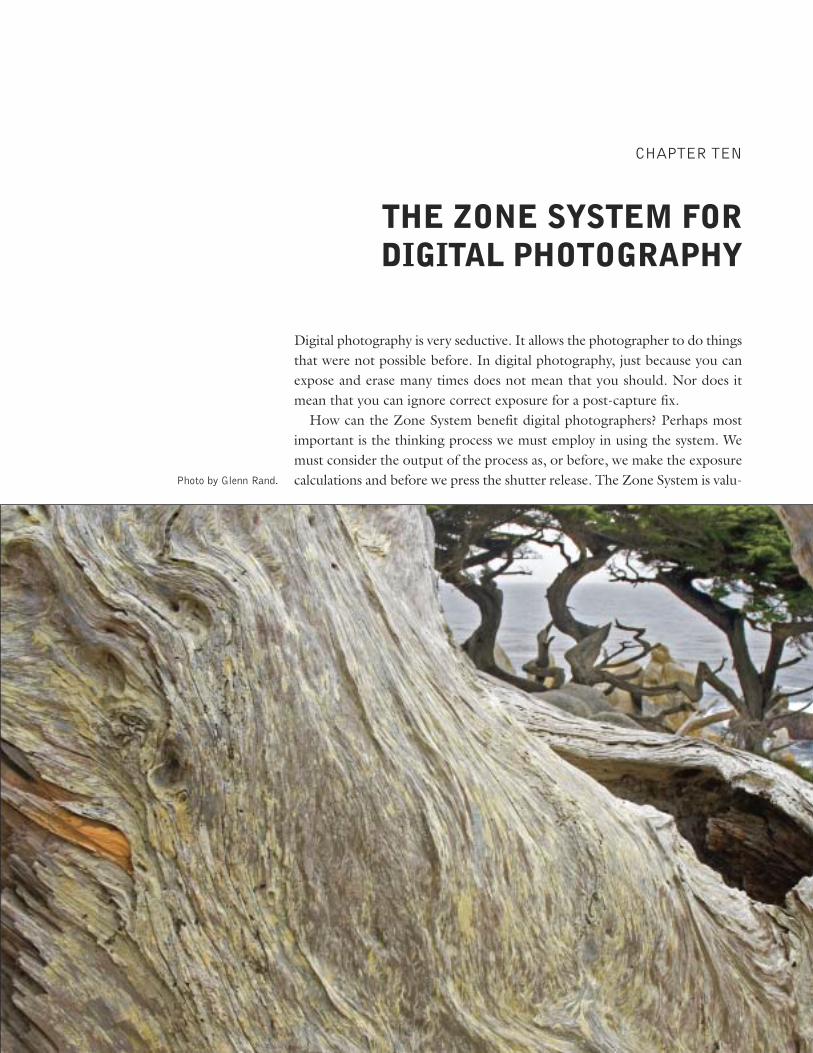
Digital photography is very seductive. It allows the photographer to do thingsthat were not possible before. In digital photography, just because you canexpose and erase many times does not mean that you should. Nor does itmean that you can ignore correct exposure for a post-capture fix.How can the Zone System benefit digital photographers? Perhaps most
important is the thinking process we must employ in using the system. Wemust consider the output of the process as, or before, we make the exposurecalculations and before we press the shutter release. The Zone System is valu-
CHAPTER TEN
THE ZONE SYSTEM FORDIGITAL PHOTOGRAPHY
Photo by Glenn Rand.
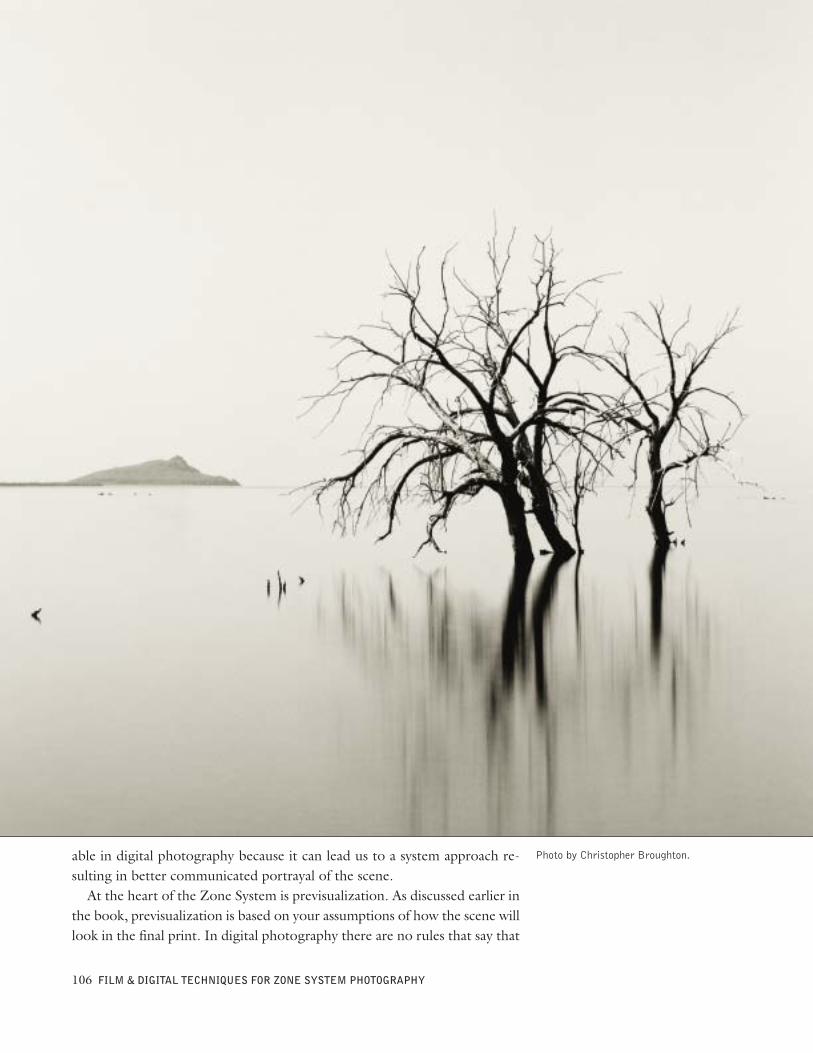
able in digital photography because it can lead us to a system approach re-sulting in better communicated portrayal of the scene.At the heart of the Zone System is previsualization. As discussed earlier in
the book, previsualization is based on your assumptions of how the scene willlook in the final print. In digital photography there are no rules that say that
106 FILM & DIGITAL TECHNIQUES FOR ZONE SYSTEM PHOTOGRAPHY
Photo by Christopher Broughton.
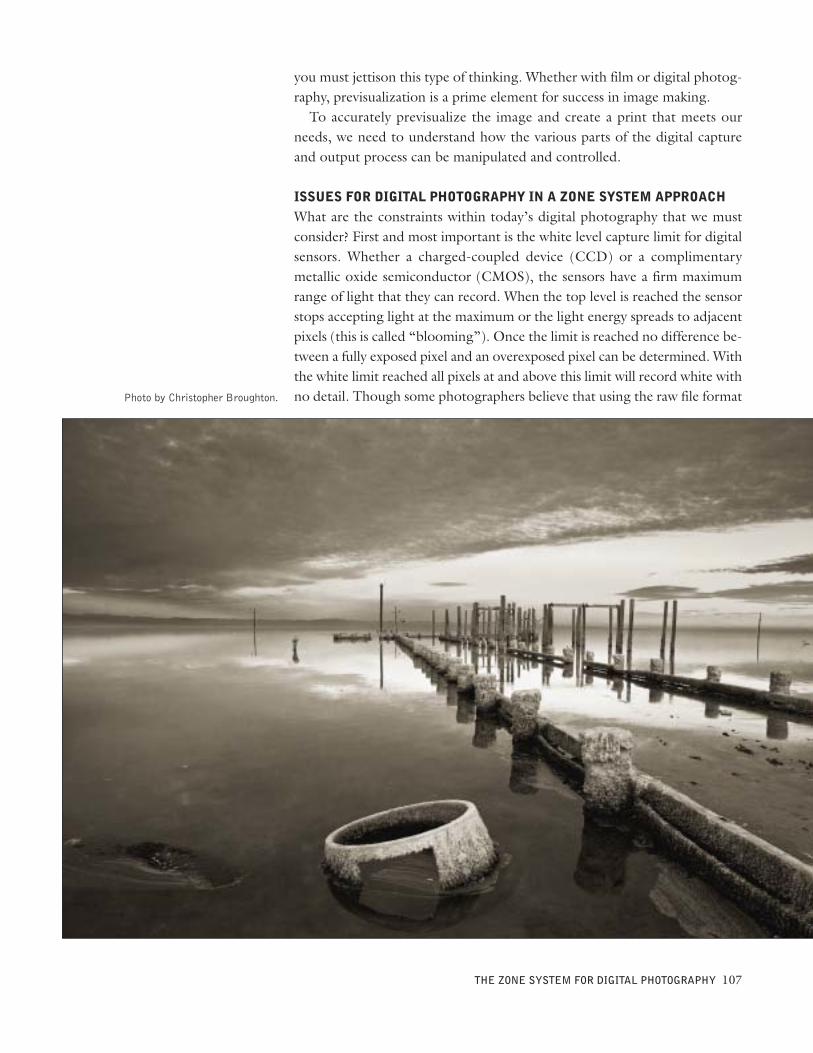
you must jettison this type of thinking. Whether with film or digital photog-raphy, previsualization is a prime element for success in image making.To accurately previsualize the image and create a print that meets our
needs, we need to understand how the various parts of the digital captureand output process can be manipulated and controlled.
ISSUES FOR DIGITAL PHOTOGRAPHY IN A ZONE SYSTEM APPROACHWhat are the constraints within today’s digital photography that we mustconsider? First and most important is the white level capture limit for digitalsensors. Whether a charged-coupled device (CCD) or a complimentarymetallic oxide semiconductor (CMOS), the sensors have a firm maximumrange of light that they can record. When the top level is reached the sensorstops accepting light at the maximum or the light energy spreads to adjacentpixels (this is called “blooming”). Once the limit is reached no difference be-tween a fully exposed pixel and an overexposed pixel can be determined. Withthe white limit reached all pixels at and above this limit will record white withno detail. Though some photographers believe that using the raw file format
THE ZONE SYSTEM FOR DIGITAL PHOTOGRAPHY 107
Photo by Christopher Broughton.
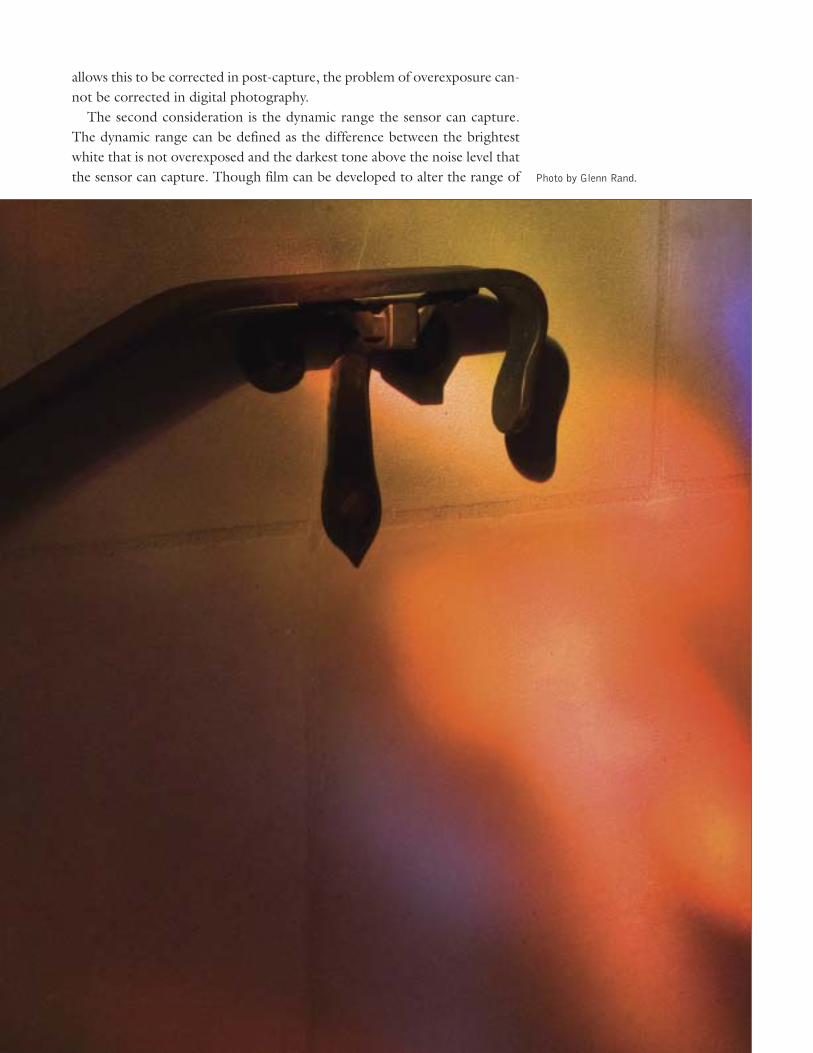
allows this to be corrected in post-capture, the problem of overexposure can-not be corrected in digital photography.The second consideration is the dynamic range the sensor can capture.
The dynamic range can be defined as the difference between the brightestwhite that is not overexposed and the darkest tone above the noise level thatthe sensor can capture. Though film can be developed to alter the range of Photo by Glenn Rand.
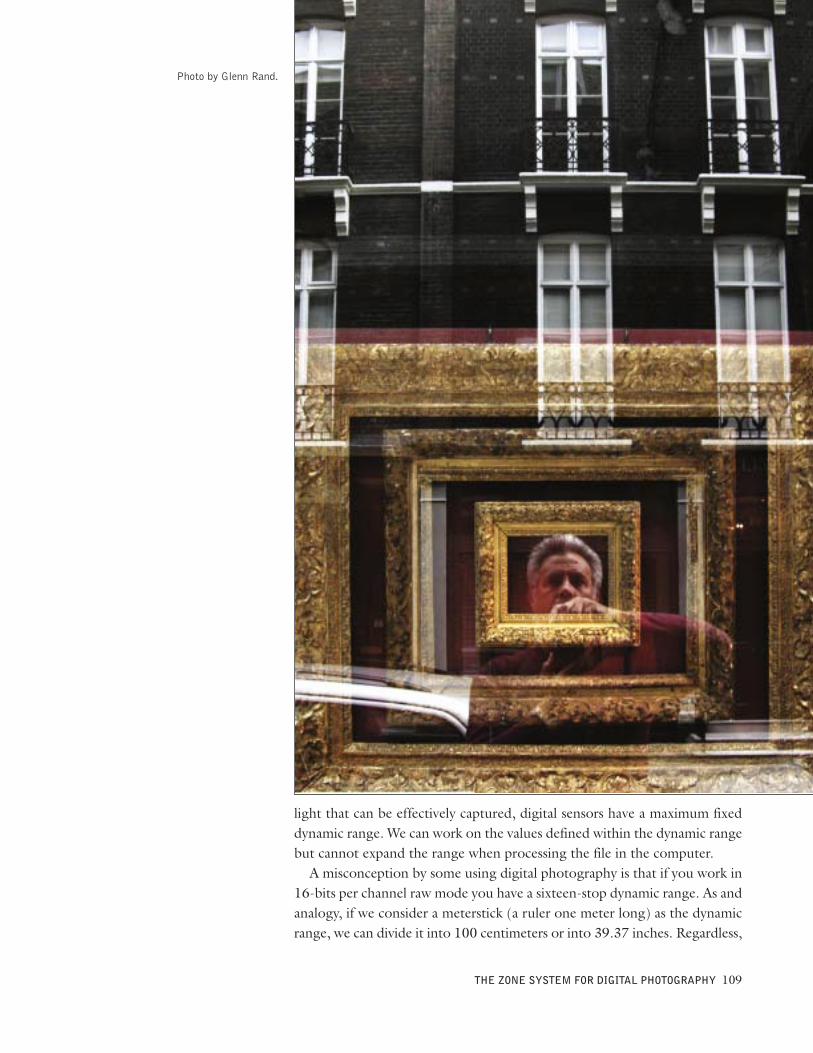
light that can be effectively captured, digital sensors have a maximum fixeddynamic range. We can work on the values defined within the dynamic rangebut cannot expand the range when processing the file in the computer.A misconception by some using digital photography is that if you work in
16-bits per channel raw mode you have a sixteen-stop dynamic range. As andanalogy, if we consider a meterstick (a ruler one meter long) as the dynamicrange, we can divide it into 100 centimeters or into 39.37 inches. Regardless,
THE ZONE SYSTEM FOR DIGITAL PHOTOGRAPHY 109
Photo by Glenn Rand.
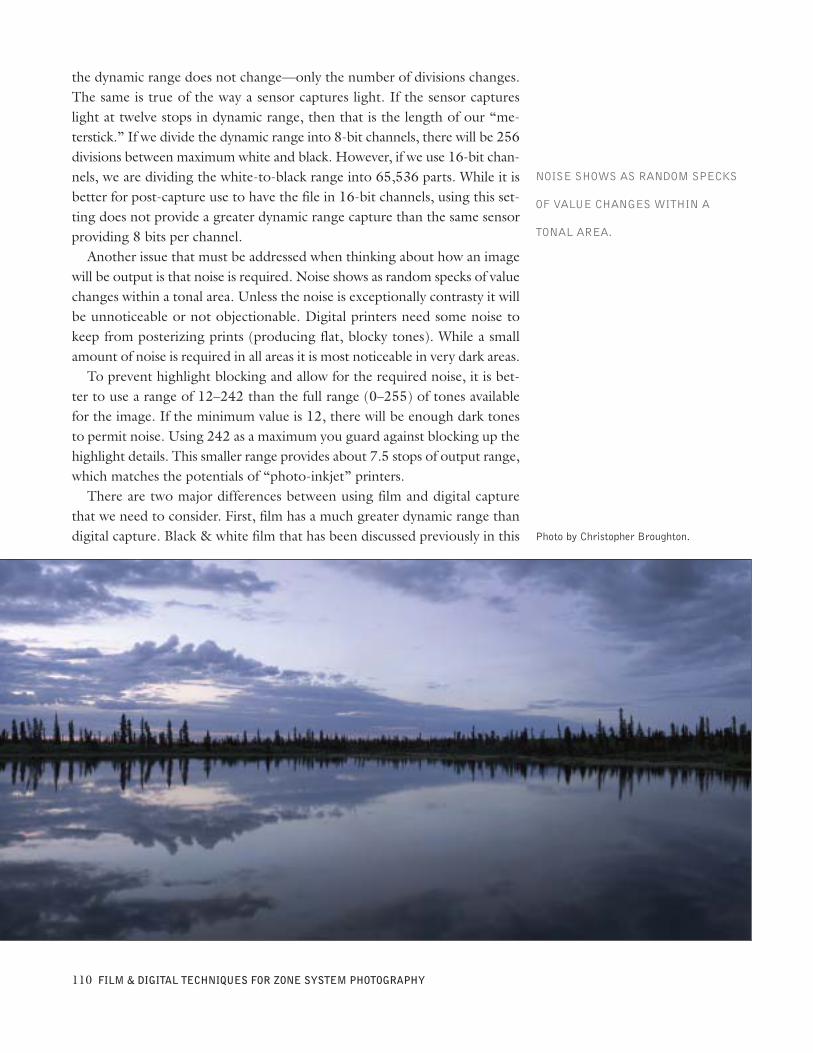
the dynamic range does not change—only the number of divisions changes.The same is true of the way a sensor captures light. If the sensor captureslight at twelve stops in dynamic range, then that is the length of our “me-terstick.” If we divide the dynamic range into 8-bit channels, there will be 256divisions between maximum white and black. However, if we use 16-bit chan-nels, we are dividing the white-to-black range into 65,536 parts. While it isbetter for post-capture use to have the file in 16-bit channels, using this set-ting does not provide a greater dynamic range capture than the same sensorproviding 8 bits per channel.Another issue that must be addressed when thinking about how an image
will be output is that noise is required. Noise shows as random specks of valuechanges within a tonal area. Unless the noise is exceptionally contrasty it willbe unnoticeable or not objectionable. Digital printers need some noise tokeep from posterizing prints (producing flat, blocky tones). While a smallamount of noise is required in all areas it is most noticeable in very dark areas.To prevent highlight blocking and allow for the required noise, it is bet-
ter to use a range of 12–242 than the full range (0–255) of tones availablefor the image. If the minimum value is 12, there will be enough dark tonesto permit noise. Using 242 as a maximum you guard against blocking up thehighlight details. This smaller range provides about 7.5 stops of output range,which matches the potentials of “photo-inkjet” printers.There are two major differences between using film and digital capture
that we need to consider. First, film has a much greater dynamic range thandigital capture. Black & white film that has been discussed previously in this
110 FILM & DIGITAL TECHNIQUES FOR ZONE SYSTEM PHOTOGRAPHY
Photo by Christopher Broughton.
NOISE SHOWS AS RANDOM SPECKS
OF VALUE CHANGES WITHIN A
TONAL AREA.
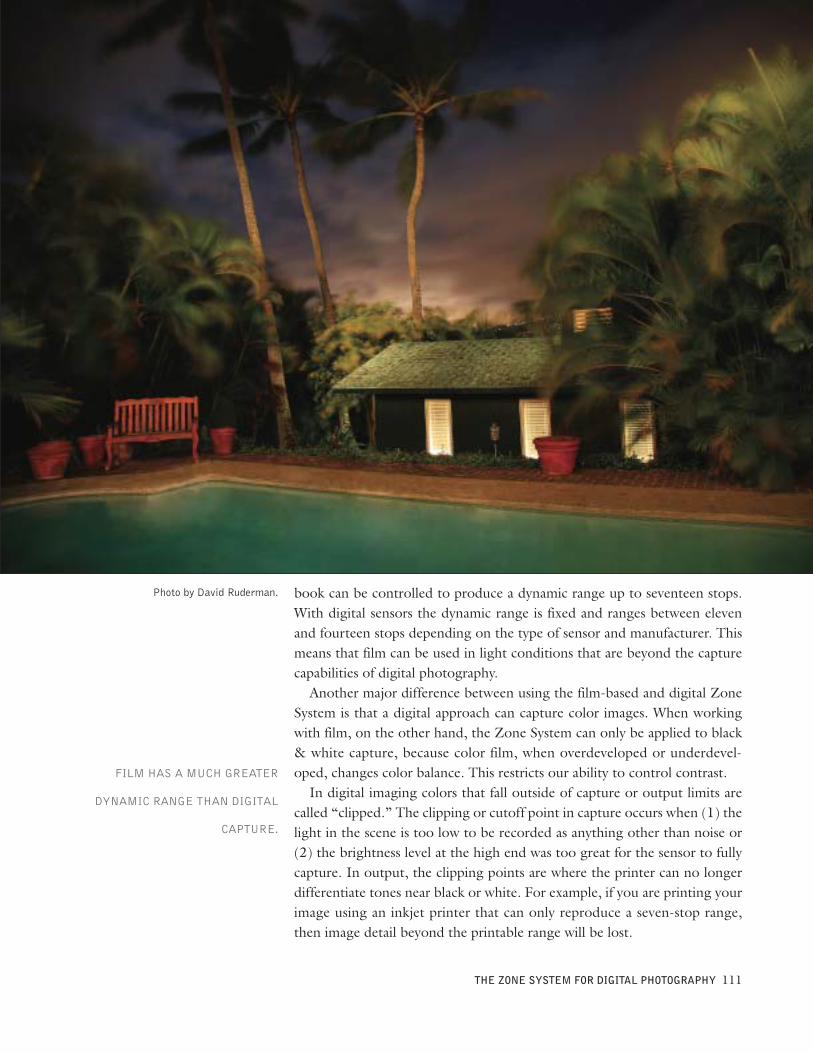
book can be controlled to produce a dynamic range up to seventeen stops.With digital sensors the dynamic range is fixed and ranges between elevenand fourteen stops depending on the type of sensor and manufacturer. Thismeans that film can be used in light conditions that are beyond the capturecapabilities of digital photography.Another major difference between using the film-based and digital Zone
System is that a digital approach can capture color images. When workingwith film, on the other hand, the Zone System can only be applied to black& white capture, because color film, when overdeveloped or underdevel-oped, changes color balance. This restricts our ability to control contrast.In digital imaging colors that fall outside of capture or output limits are
called “clipped.” The clipping or cutoff point in capture occurs when (1) thelight in the scene is too low to be recorded as anything other than noise or(2) the brightness level at the high end was too great for the sensor to fullycapture. In output, the clipping points are where the printer can no longerdifferentiate tones near black or white. For example, if you are printing yourimage using an inkjet printer that can only reproduce a seven-stop range,then image detail beyond the printable range will be lost.
THE ZONE SYSTEM FOR DIGITAL PHOTOGRAPHY 111
Photo by David Ruderman.
FILM HAS A MUCH GREATER
DYNAMIC RANGE THAN DIGITAL
CAPTURE.
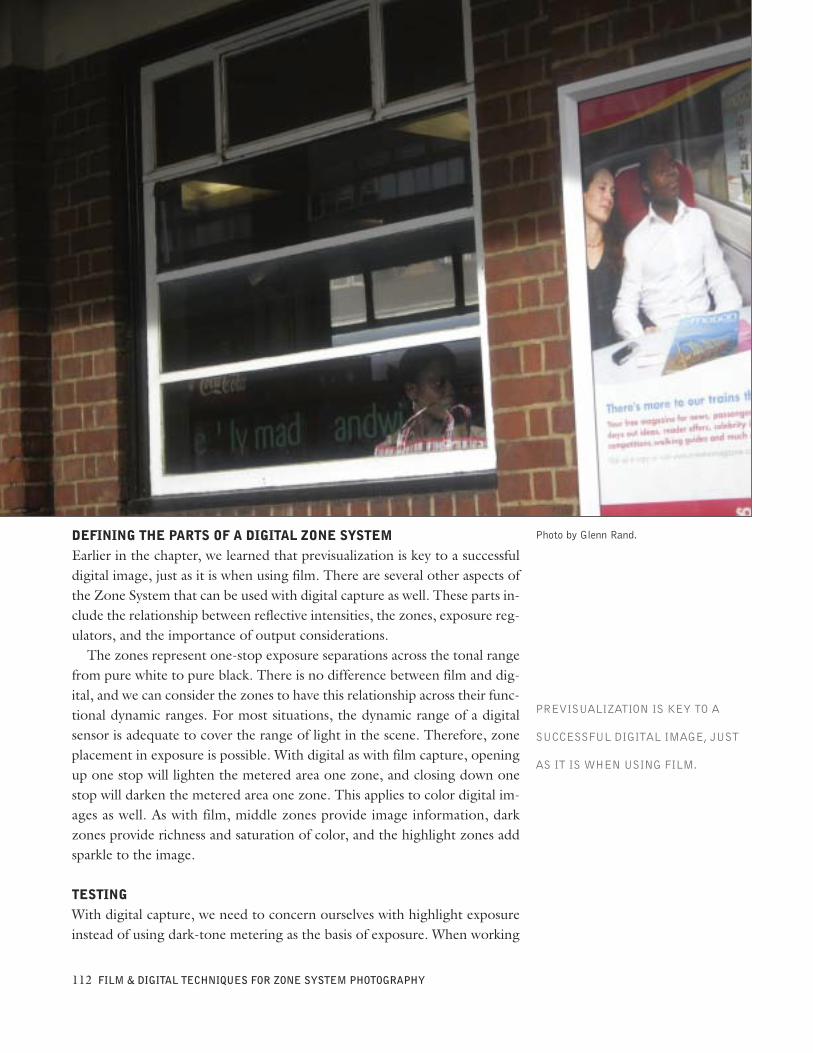
DEFINING THE PARTS OF A DIGITAL ZONE SYSTEMEarlier in the chapter, we learned that previsualization is key to a successfuldigital image, just as it is when using film. There are several other aspects ofthe Zone System that can be used with digital capture as well. These parts in-clude the relationship between reflective intensities, the zones, exposure reg-ulators, and the importance of output considerations.The zones represent one-stop exposure separations across the tonal range
from pure white to pure black. There is no difference between film and dig-ital, and we can consider the zones to have this relationship across their func-tional dynamic ranges. For most situations, the dynamic range of a digitalsensor is adequate to cover the range of light in the scene. Therefore, zoneplacement in exposure is possible. With digital as with film capture, openingup one stop will lighten the metered area one zone, and closing down onestop will darken the metered area one zone. This applies to color digital im-ages as well. As with film, middle zones provide image information, darkzones provide richness and saturation of color, and the highlight zones addsparkle to the image.
TESTINGWith digital capture, we need to concern ourselves with highlight exposureinstead of using dark-tone metering as the basis of exposure. When working
112 FILM & DIGITAL TECHNIQUES FOR ZONE SYSTEM PHOTOGRAPHY
Photo by Glenn Rand.
PREVISUALIZATION IS KEY TO A
SUCCESSFUL DIGITAL IMAGE, JUST
AS IT IS WHEN USING FILM.
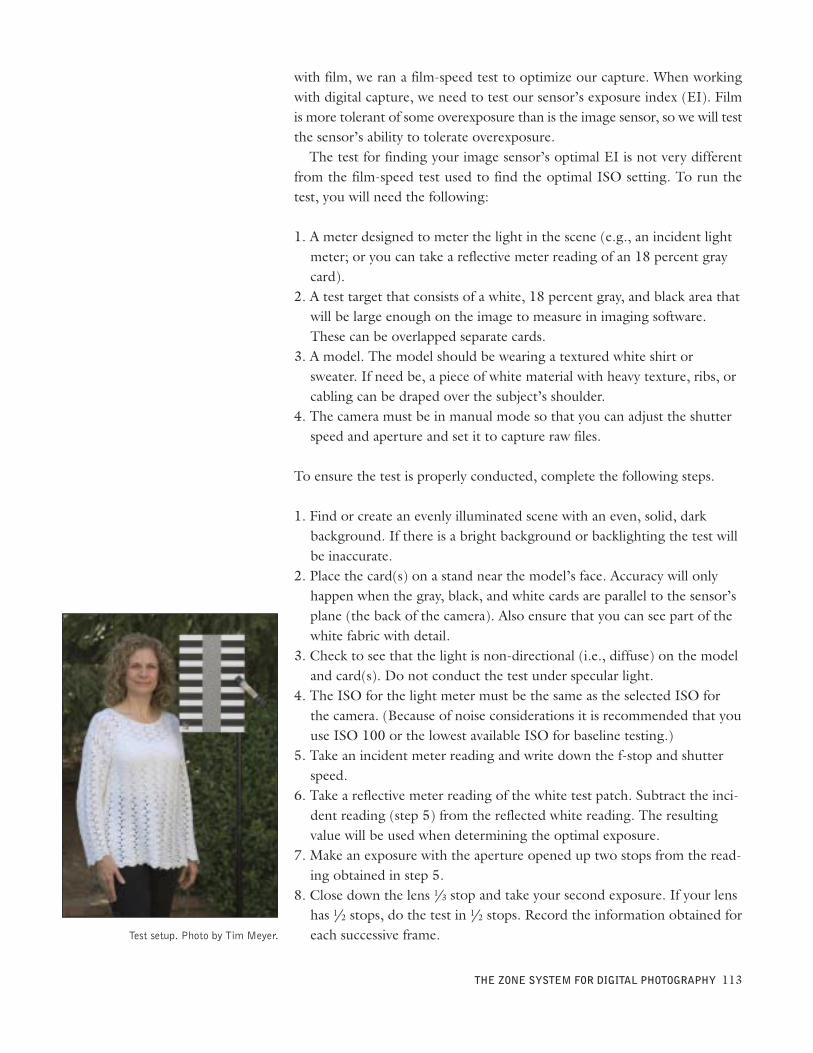
with film, we ran a film-speed test to optimize our capture. When workingwith digital capture, we need to test our sensor’s exposure index (EI). Filmis more tolerant of some overexposure than is the image sensor, so we will testthe sensor’s ability to tolerate overexposure.The test for finding your image sensor’s optimal EI is not very different
from the film-speed test used to find the optimal ISO setting. To run thetest, you will need the following:
1. A meter designed to meter the light in the scene (e.g., an incident lightmeter; or you can take a reflective meter reading of an 18 percent graycard).
2. A test target that consists of a white, 18 percent gray, and black area thatwill be large enough on the image to measure in imaging software.These can be overlapped separate cards.
3. A model. The model should be wearing a textured white shirt orsweater. If need be, a piece of white material with heavy texture, ribs, orcabling can be draped over the subject’s shoulder.
4. The camera must be in manual mode so that you can adjust the shutterspeed and aperture and set it to capture raw files.
To ensure the test is properly conducted, complete the following steps.
1. Find or create an evenly illuminated scene with an even, solid, darkbackground. If there is a bright background or backlighting the test willbe inaccurate.
2. Place the card(s) on a stand near the model’s face. Accuracy will onlyhappen when the gray, black, and white cards are parallel to the sensor’splane (the back of the camera). Also ensure that you can see part of thewhite fabric with detail.
3. Check to see that the light is non-directional (i.e., diffuse) on the modeland card(s). Do not conduct the test under specular light.
4. The ISO for the light meter must be the same as the selected ISO forthe camera. (Because of noise considerations it is recommended that youuse ISO 100 or the lowest available ISO for baseline testing.)
5. Take an incident meter reading and write down the f-stop and shutterspeed.
6. Take a reflective meter reading of the white test patch. Subtract the inci-dent reading (step 5) from the reflected white reading. The resultingvalue will be used when determining the optimal exposure.
7. Make an exposure with the aperture opened up two stops from the read-ing obtained in step 5.
8. Close down the lens 1/3 stop and take your second exposure. If your lenshas 1/2 stops, do the test in 1/2 stops. Record the information obtained foreach successive frame.
THE ZONE SYSTEM FOR DIGITAL PHOTOGRAPHY 113
Test setup. Photo by Tim Meyer.
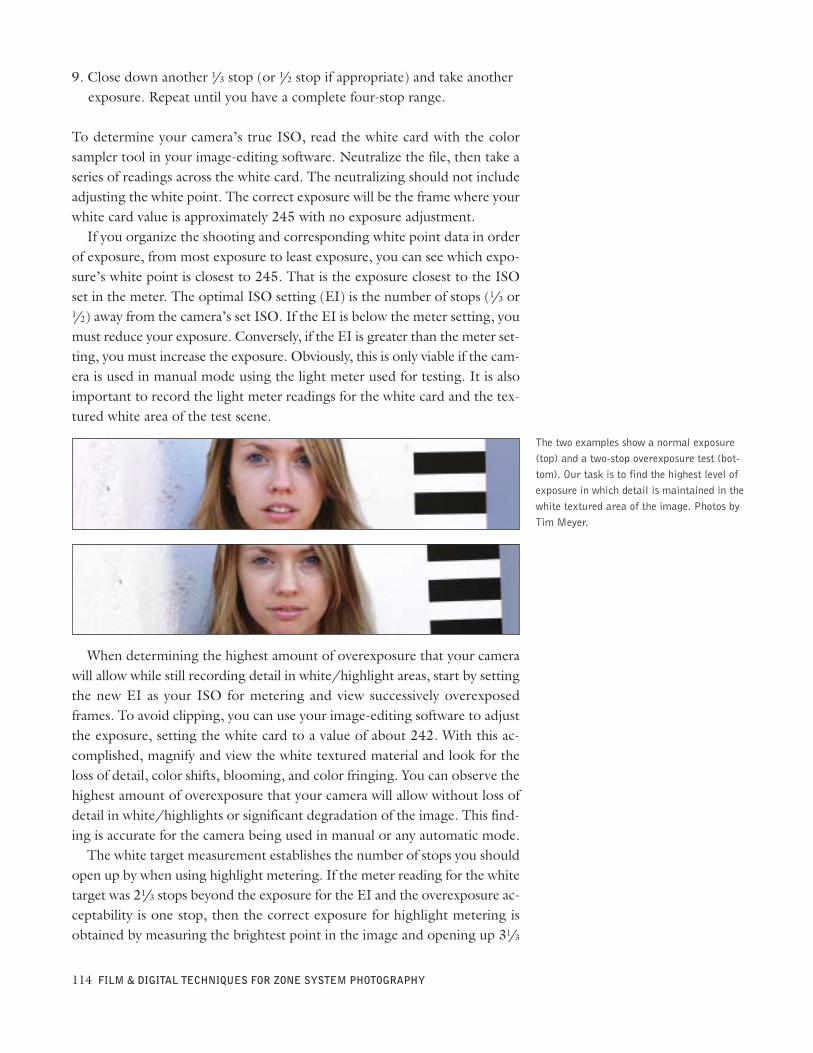
9. Close down another 1/3 stop (or 1/2 stop if appropriate) and take anotherexposure. Repeat until you have a complete four-stop range.
To determine your camera’s true ISO, read the white card with the colorsampler tool in your image-editing software. Neutralize the file, then take aseries of readings across the white card. The neutralizing should not includeadjusting the white point. The correct exposure will be the frame where yourwhite card value is approximately 245 with no exposure adjustment.If you organize the shooting and corresponding white point data in order
of exposure, from most exposure to least exposure, you can see which expo-sure’s white point is closest to 245. That is the exposure closest to the ISOset in the meter. The optimal ISO setting (EI) is the number of stops (1/3 or1/2) away from the camera’s set ISO. If the EI is below the meter setting, youmust reduce your exposure. Conversely, if the EI is greater than the meter set-ting, you must increase the exposure. Obviously, this is only viable if the cam-era is used in manual mode using the light meter used for testing. It is alsoimportant to record the light meter readings for the white card and the tex-tured white area of the test scene.
When determining the highest amount of overexposure that your camerawill allow while still recording detail in white/highlight areas, start by settingthe new EI as your ISO for metering and view successively overexposedframes. To avoid clipping, you can use your image-editing software to adjustthe exposure, setting the white card to a value of about 242. With this ac-complished, magnify and view the white textured material and look for theloss of detail, color shifts, blooming, and color fringing. You can observe thehighest amount of overexposure that your camera will allow without loss ofdetail in white/highlights or significant degradation of the image. This find-ing is accurate for the camera being used in manual or any automatic mode.The white target measurement establishes the number of stops you should
open up by when using highlight metering. If the meter reading for the whitetarget was 21/3 stops beyond the exposure for the EI and the overexposure ac-ceptability is one stop, then the correct exposure for highlight metering isobtained by measuring the brightest point in the image and opening up 31/3
114 FILM & DIGITAL TECHNIQUES FOR ZONE SYSTEM PHOTOGRAPHY
The two examples show a normal exposure(top) and a two-stop overexposure test (bot-tom). Our task is to find the highest level ofexposure in which detail is maintained in thewhite textured area of the image. Photos byTim Meyer.
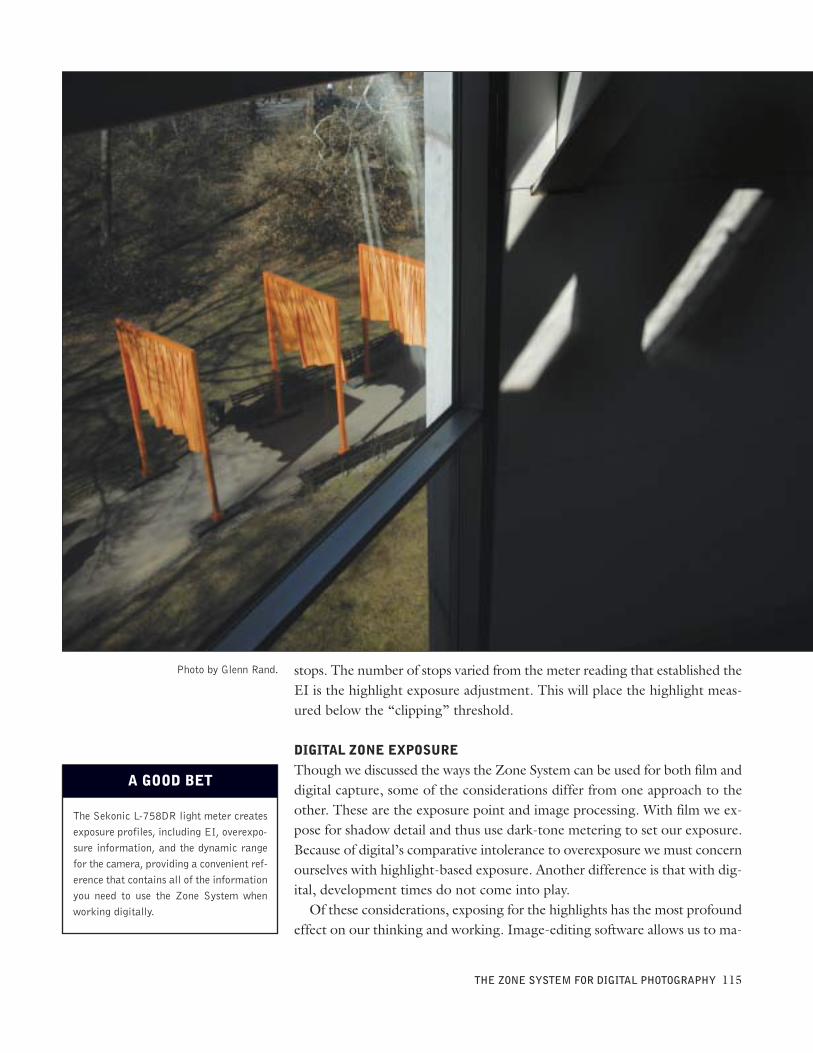
stops. The number of stops varied from the meter reading that established theEI is the highlight exposure adjustment. This will place the highlight meas-ured below the “clipping” threshold.
DIGITAL ZONE EXPOSUREThough we discussed the ways the Zone System can be used for both film anddigital capture, some of the considerations differ from one approach to theother. These are the exposure point and image processing. With film we ex-pose for shadow detail and thus use dark-tone metering to set our exposure.Because of digital’s comparative intolerance to overexposure we must concernourselves with highlight-based exposure. Another difference is that with dig-ital, development times do not come into play.Of these considerations, exposing for the highlights has the most profound
effect on our thinking and working. Image-editing software allows us to ma-
THE ZONE SYSTEM FOR DIGITAL PHOTOGRAPHY 115
The Sekonic L-758DR light meter createsexposure profiles, including EI, overexpo-sure information, and the dynamic rangefor the camera, providing a convenient ref-erence that contains all of the informationyou need to use the Zone System whenworking digitally.
A GOOD BET
Photo by Glenn Rand.
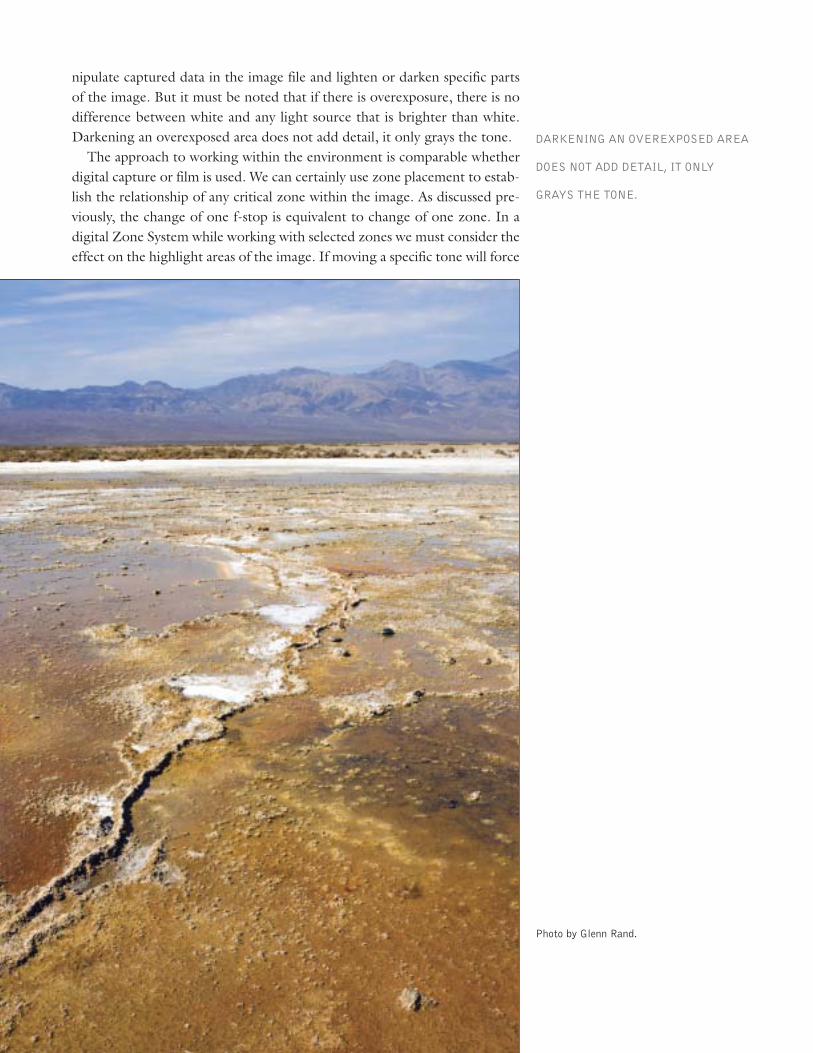
nipulate captured data in the image file and lighten or darken specific partsof the image. But it must be noted that if there is overexposure, there is nodifference between white and any light source that is brighter than white.Darkening an overexposed area does not add detail, it only grays the tone.The approach to working within the environment is comparable whether
digital capture or film is used. We can certainly use zone placement to estab-lish the relationship of any critical zone within the image. As discussed pre-viously, the change of one f-stop is equivalent to change of one zone. In adigital Zone System while working with selected zones we must consider theeffect on the highlight areas of the image. If moving a specific tone will force
Photo by Glenn Rand.
DARKENING AN OVEREXPOSED AREA
DOES NOT ADD DETAIL, IT ONLY
GRAYS THE TONE.
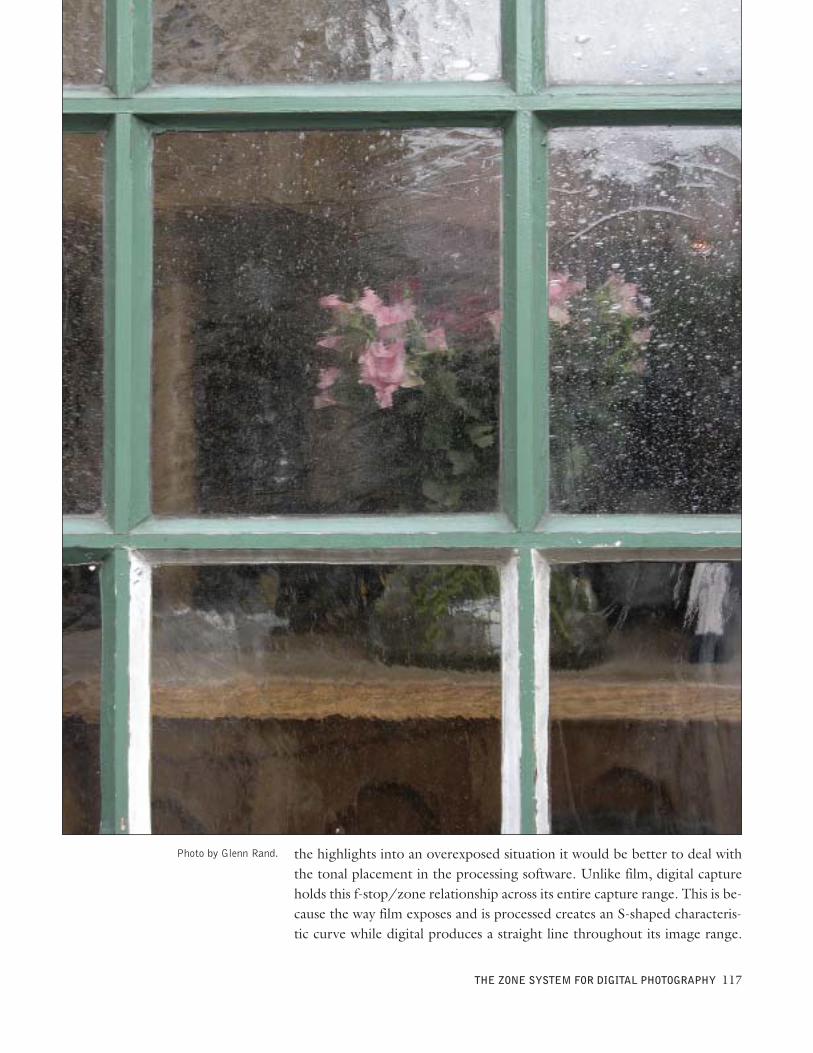
the highlights into an overexposed situation it would be better to deal withthe tonal placement in the processing software. Unlike film, digital captureholds this f-stop/zone relationship across its entire capture range. This is be-cause the way film exposes and is processed creates an S-shaped characteris-tic curve while digital produces a straight line throughout its image range.
THE ZONE SYSTEM FOR DIGITAL PHOTOGRAPHY 117
Photo by Glenn Rand.
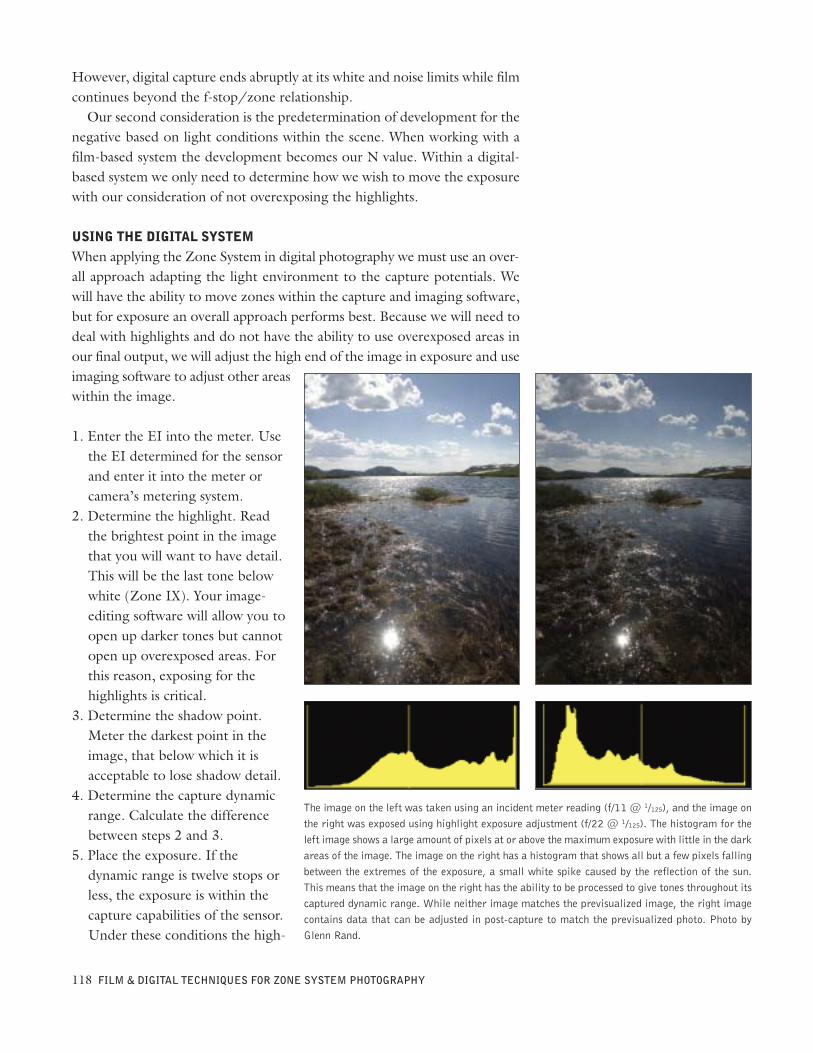
However, digital capture ends abruptly at its white and noise limits while filmcontinues beyond the f-stop/zone relationship.Our second consideration is the predetermination of development for the
negative based on light conditions within the scene. When working with afilm-based system the development becomes our N value. Within a digital-based system we only need to determine how we wish to move the exposurewith our consideration of not overexposing the highlights.
USING THE DIGITAL SYSTEMWhen applying the Zone System in digital photography we must use an over-all approach adapting the light environment to the capture potentials. Wewill have the ability to move zones within the capture and imaging software,but for exposure an overall approach performs best. Because we will need todeal with highlights and do not have the ability to use overexposed areas inour final output, we will adjust the high end of the image in exposure and useimaging software to adjust other areaswithin the image.
1. Enter the EI into the meter. Usethe EI determined for the sensorand enter it into the meter orcamera’s metering system.
2. Determine the highlight. Readthe brightest point in the imagethat you will want to have detail.This will be the last tone belowwhite (Zone IX). Your image-editing software will allow you toopen up darker tones but cannotopen up overexposed areas. Forthis reason, exposing for thehighlights is critical.
3. Determine the shadow point.Meter the darkest point in theimage, that below which it isacceptable to lose shadow detail.
4. Determine the capture dynamicrange. Calculate the differencebetween steps 2 and 3.
5. Place the exposure. If thedynamic range is twelve stops orless, the exposure is within thecapture capabilities of the sensor.Under these conditions the high-
118 FILM & DIGITAL TECHNIQUES FOR ZONE SYSTEM PHOTOGRAPHY
The image on the left was taken using an incident meter reading (f/11 @ 1/125), and the image onthe right was exposed using highlight exposure adjustment (f/22 @ 1/125). The histogram for theleft image shows a large amount of pixels at or above the maximum exposure with little in the darkareas of the image. The image on the right has a histogram that shows all but a few pixels fallingbetween the extremes of the exposure, a small white spike caused by the reflection of the sun.This means that the image on the right has the ability to be processed to give tones throughout itscaptured dynamic range. While neither image matches the previsualized image, the right imagecontains data that can be adjusted in post-capture to match the previsualized photo. Photo byGlenn Rand.
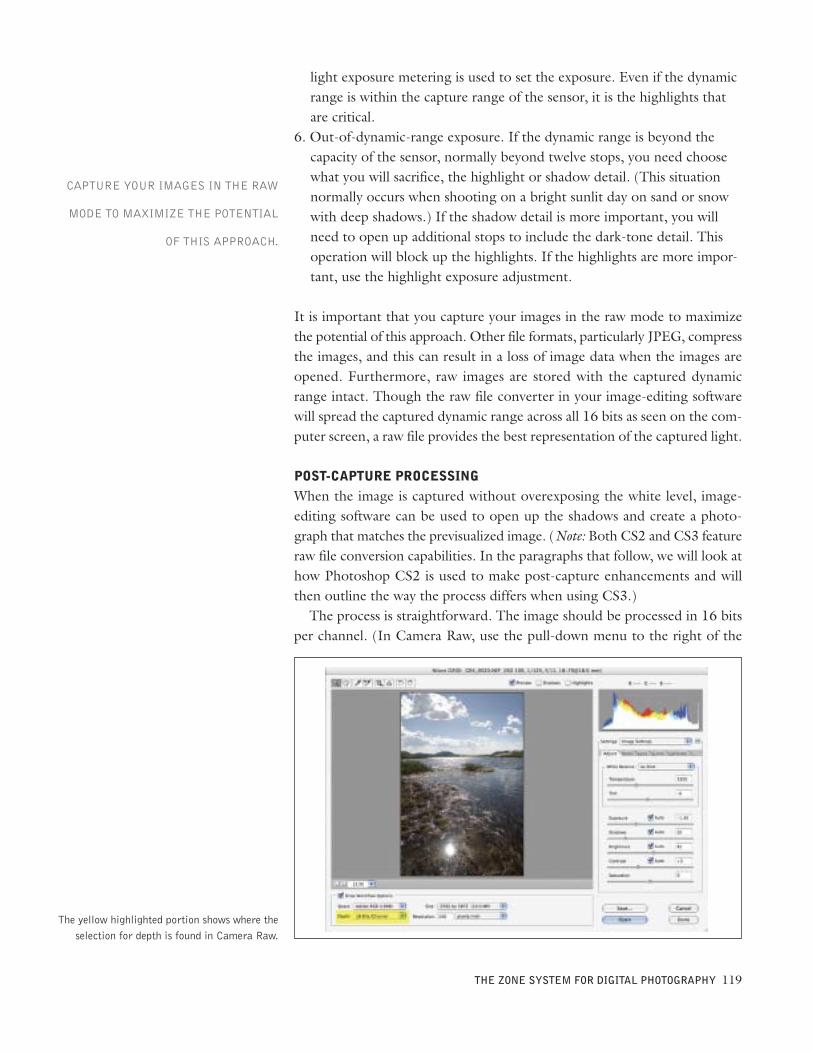
light exposure metering is used to set the exposure. Even if the dynamicrange is within the capture range of the sensor, it is the highlights thatare critical.
6. Out-of-dynamic-range exposure. If the dynamic range is beyond thecapacity of the sensor, normally beyond twelve stops, you need choosewhat you will sacrifice, the highlight or shadow detail. (This situationnormally occurs when shooting on a bright sunlit day on sand or snowwith deep shadows.) If the shadow detail is more important, you willneed to open up additional stops to include the dark-tone detail. Thisoperation will block up the highlights. If the highlights are more impor-tant, use the highlight exposure adjustment.
It is important that you capture your images in the raw mode to maximizethe potential of this approach. Other file formats, particularly JPEG, compressthe images, and this can result in a loss of image data when the images areopened. Furthermore, raw images are stored with the captured dynamicrange intact. Though the raw file converter in your image-editing softwarewill spread the captured dynamic range across all 16 bits as seen on the com-puter screen, a raw file provides the best representation of the captured light.
POST-CAPTURE PROCESSINGWhen the image is captured without overexposing the white level, image-editing software can be used to open up the shadows and create a photo-graph that matches the previsualized image. (Note: Both CS2 and CS3 featureraw file conversion capabilities. In the paragraphs that follow, we will look athow Photoshop CS2 is used to make post-capture enhancements and willthen outline the way the process differs when using CS3.)The process is straightforward. The image should be processed in 16 bits
per channel. (In Camera Raw, use the pull-down menu to the right of the
THE ZONE SYSTEM FOR DIGITAL PHOTOGRAPHY 119
The yellow highlighted portion shows where theselection for depth is found in Camera Raw.
CAPTURE YOUR IMAGES IN THE RAW
MODE TO MAXIMIZE THE POTENTIAL
OF THIS APPROACH.
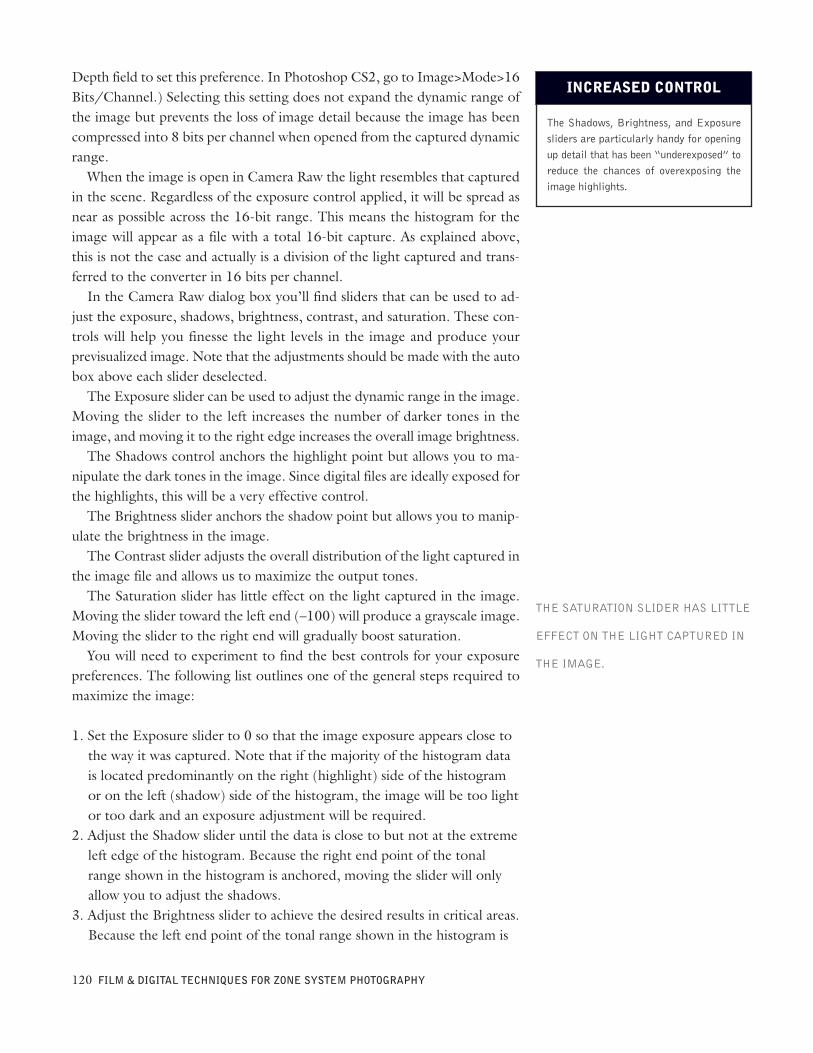
Depth field to set this preference. In Photoshop CS2, go to Image>Mode>16Bits/Channel.) Selecting this setting does not expand the dynamic range ofthe image but prevents the loss of image detail because the image has beencompressed into 8 bits per channel when opened from the captured dynamicrange.When the image is open in Camera Raw the light resembles that captured
in the scene. Regardless of the exposure control applied, it will be spread asnear as possible across the 16-bit range. This means the histogram for theimage will appear as a file with a total 16-bit capture. As explained above,this is not the case and actually is a division of the light captured and trans-ferred to the converter in 16 bits per channel.In the Camera Raw dialog box you’ll find sliders that can be used to ad-
just the exposure, shadows, brightness, contrast, and saturation. These con-trols will help you finesse the light levels in the image and produce yourprevisualized image. Note that the adjustments should be made with the autobox above each slider deselected.The Exposure slider can be used to adjust the dynamic range in the image.
Moving the slider to the left increases the number of darker tones in theimage, and moving it to the right edge increases the overall image brightness.The Shadows control anchors the highlight point but allows you to ma-
nipulate the dark tones in the image. Since digital files are ideally exposed forthe highlights, this will be a very effective control.The Brightness slider anchors the shadow point but allows you to manip-
ulate the brightness in the image.The Contrast slider adjusts the overall distribution of the light captured in
the image file and allows us to maximize the output tones.The Saturation slider has little effect on the light captured in the image.
Moving the slider toward the left end (–100) will produce a grayscale image.Moving the slider to the right end will gradually boost saturation.You will need to experiment to find the best controls for your exposure
preferences. The following list outlines one of the general steps required tomaximize the image:
1. Set the Exposure slider to 0 so that the image exposure appears close tothe way it was captured. Note that if the majority of the histogram datais located predominantly on the right (highlight) side of the histogramor on the left (shadow) side of the histogram, the image will be too lightor too dark and an exposure adjustment will be required.
2. Adjust the Shadow slider until the data is close to but not at the extremeleft edge of the histogram. Because the right end point of the tonalrange shown in the histogram is anchored, moving the slider will onlyallow you to adjust the shadows.
3. Adjust the Brightness slider to achieve the desired results in critical areas.Because the left end point of the tonal range shown in the histogram is
120 FILM & DIGITAL TECHNIQUES FOR ZONE SYSTEM PHOTOGRAPHY
The Shadows, Brightness, and Exposuresliders are particularly handy for openingup detail that has been “underexposed” toreduce the chances of overexposing theimage highlights.
INCREASED CONTROL
THE SATURATION SLIDER HAS LITTLE
EFFECT ON THE LIGHT CAPTURED IN
THE IMAGE.
anchored, moving the slider will adjust only the highlights. Move theslider until the data is close to but not at the extreme right edge of thehistogram.
4. Adjust the Contrast slider to increase or decrease the tonal differencebetween the darkest and lightest parts of the image. When the slider ismoved toward the right (produces a positive number), a contrastierimage results. When the slider is moved toward the left (produces a neg-ative number) the tonal range is wider and contrast is diminished. Thiswider tonal range allows for a more optimal output.
5. Moving the Saturation slider to the right can boost the intensity of thecolors in the scene, but it should be used sparingly, as it can also pro-duce an unrealistic portrayal of the scene. By moving the slider to theextreme left edge, you can create a grayscale image from a color original.Though this is a simple approach, one of the many other available colorconversion methods will produce a better result.
6. Once the preview image appears as desired, rename and save the file.The raw file converter will then process the image and save it as an inter-
The image matches the previsualization.There is detail in all areas of the imageincluding the star created by the sun’s
reflection diffracted by the iris in the lens.While the sun’s orb is beyond the sensor’s
sensitivity, there is detail in the clouds as wellas in the shadow details. Photo by Glenn Rand.
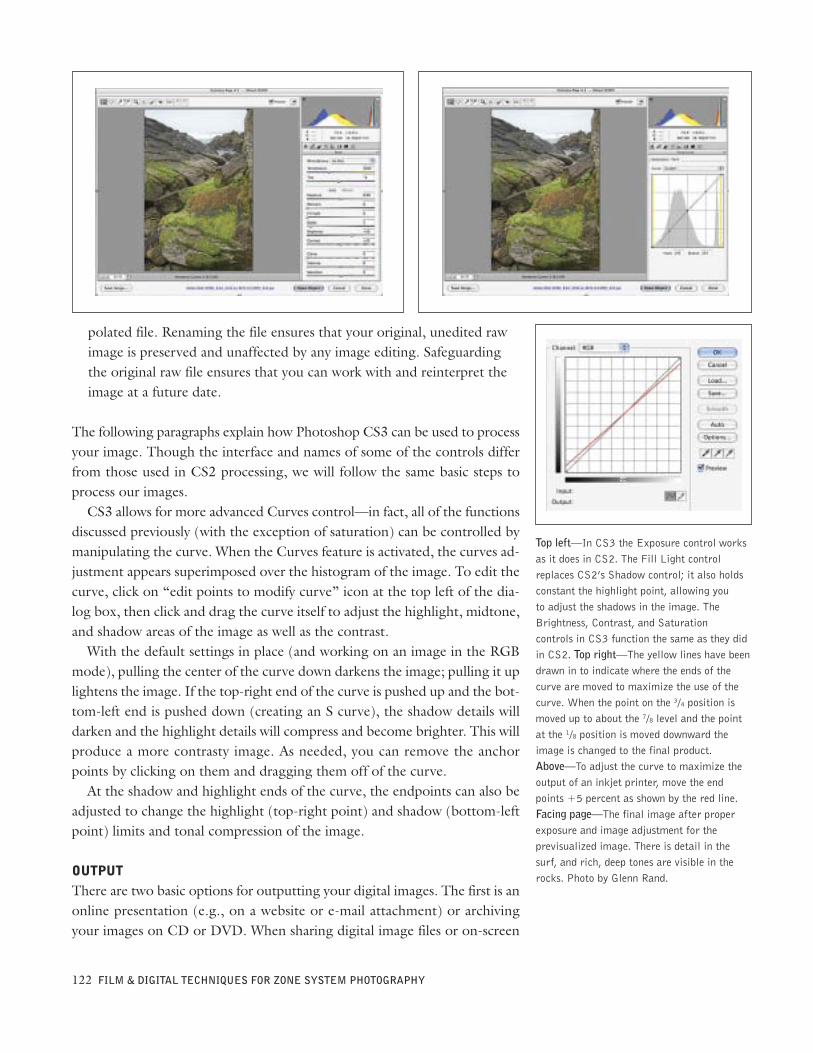
polated file. Renaming the file ensures that your original, unedited rawimage is preserved and unaffected by any image editing. Safeguardingthe original raw file ensures that you can work with and reinterpret theimage at a future date.
The following paragraphs explain how Photoshop CS3 can be used to processyour image. Though the interface and names of some of the controls differfrom those used in CS2 processing, we will follow the same basic steps toprocess our images.CS3 allows for more advanced Curves control—in fact, all of the functions
discussed previously (with the exception of saturation) can be controlled bymanipulating the curve. When the Curves feature is activated, the curves ad-justment appears superimposed over the histogram of the image. To edit thecurve, click on “edit points to modify curve” icon at the top left of the dia-log box, then click and drag the curve itself to adjust the highlight, midtone,and shadow areas of the image as well as the contrast.With the default settings in place (and working on an image in the RGB
mode), pulling the center of the curve down darkens the image; pulling it uplightens the image. If the top-right end of the curve is pushed up and the bot-tom-left end is pushed down (creating an S curve), the shadow details willdarken and the highlight details will compress and become brighter. This willproduce a more contrasty image. As needed, you can remove the anchorpoints by clicking on them and dragging them off of the curve.At the shadow and highlight ends of the curve, the endpoints can also be
adjusted to change the highlight (top-right point) and shadow (bottom-leftpoint) limits and tonal compression of the image.
OUTPUTThere are two basic options for outputting your digital images. The first is anonline presentation (e.g., on a website or e-mail attachment) or archivingyour images on CD or DVD. When sharing digital image files or on-screen
122 FILM & DIGITAL TECHNIQUES FOR ZONE SYSTEM PHOTOGRAPHY
Top left—In CS3 the Exposure control worksas it does in CS2. The Fill Light controlreplaces CS2’s Shadow control; it also holdsconstant the highlight point, allowing youto adjust the shadows in the image. TheBrightness, Contrast, and Saturationcontrols in CS3 function the same as they didin CS2. Top right—The yellow lines have beendrawn in to indicate where the ends of thecurve are moved to maximize the use of thecurve. When the point on the 3/4 position ismoved up to about the 7/8 level and the pointat the 1/8 position is moved downward theimage is changed to the final product.Above—To adjust the curve to maximize theoutput of an inkjet printer, move the endpoints +5 percent as shown by the red line.Facing page—The final image after properexposure and image adjustment for theprevisualized image. There is detail in thesurf, and rich, deep tones are visible in therocks. Photo by Glenn Rand.
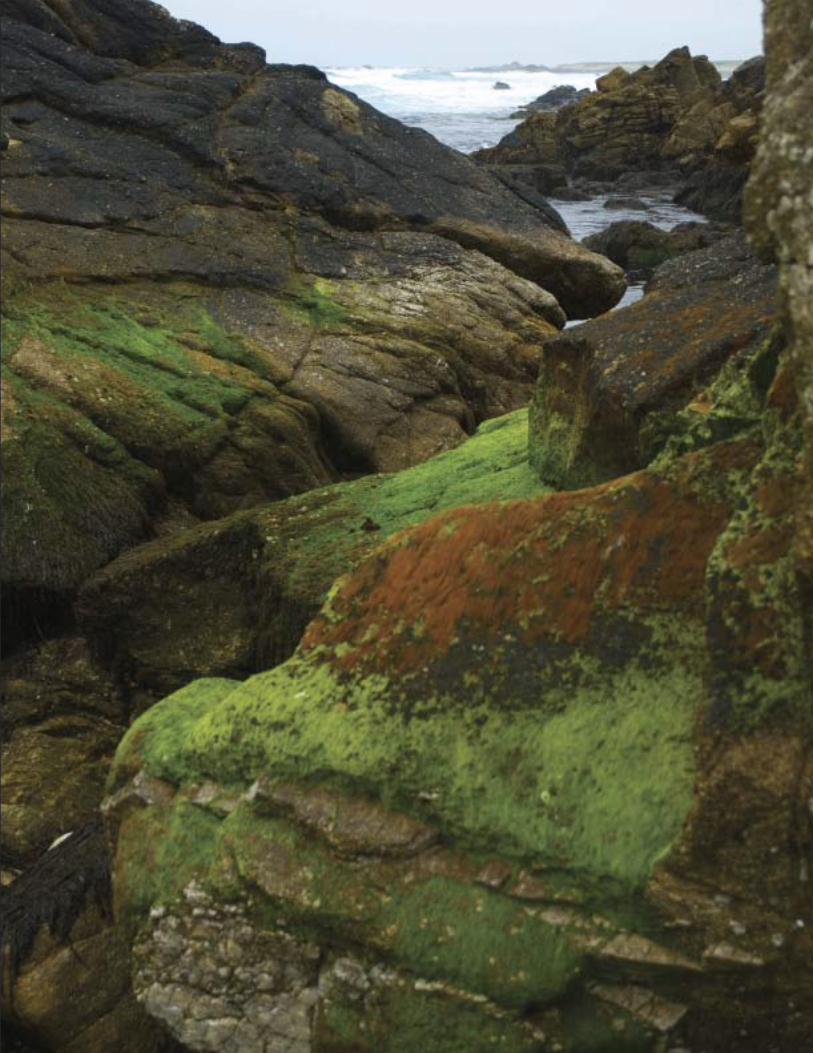
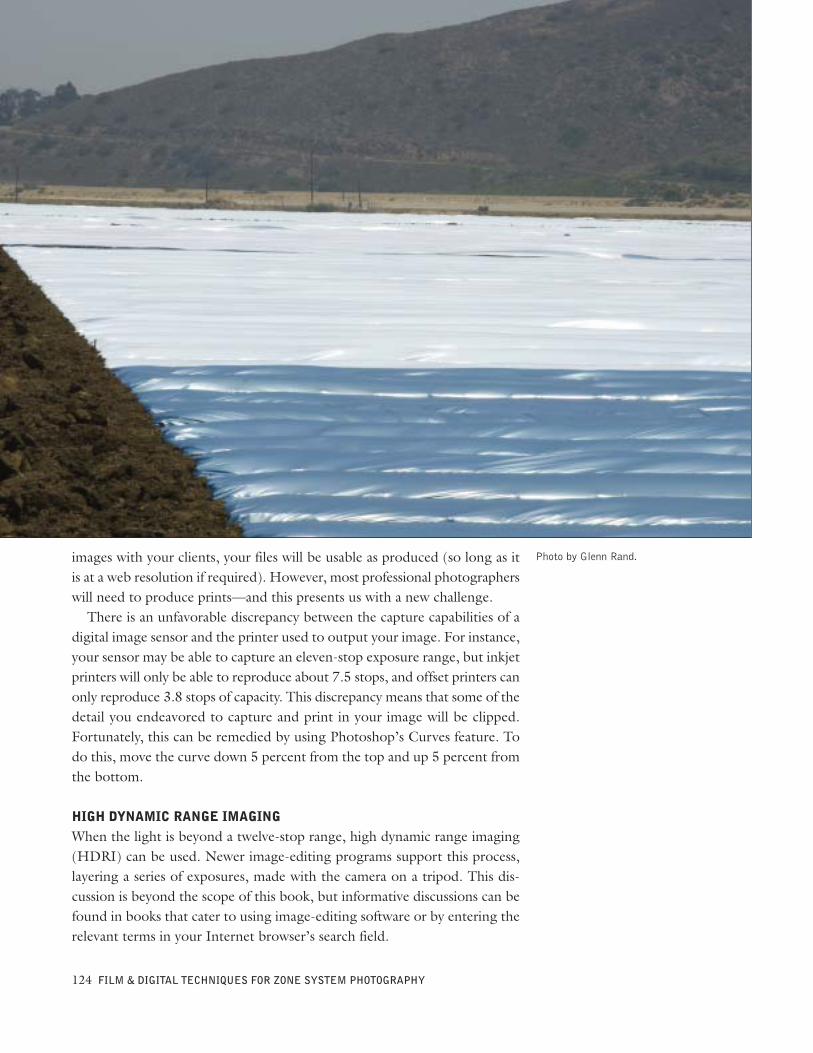
images with your clients, your files will be usable as produced (so long as itis at a web resolution if required). However, most professional photographerswill need to produce prints—and this presents us with a new challenge.There is an unfavorable discrepancy between the capture capabilities of a
digital image sensor and the printer used to output your image. For instance,your sensor may be able to capture an eleven-stop exposure range, but inkjetprinters will only be able to reproduce about 7.5 stops, and offset printers canonly reproduce 3.8 stops of capacity. This discrepancy means that some of thedetail you endeavored to capture and print in your image will be clipped.Fortunately, this can be remedied by using Photoshop’s Curves feature. Todo this, move the curve down 5 percent from the top and up 5 percent fromthe bottom.
HIGH DYNAMIC RANGE IMAGINGWhen the light is beyond a twelve-stop range, high dynamic range imaging(HDRI) can be used. Newer image-editing programs support this process,layering a series of exposures, made with the camera on a tripod. This dis-cussion is beyond the scope of this book, but informative discussions can befound in books that cater to using image-editing software or by entering therelevant terms in your Internet browser’s search field.
124 FILM & DIGITAL TECHNIQUES FOR ZONE SYSTEM PHOTOGRAPHY
Photo by Glenn Rand.
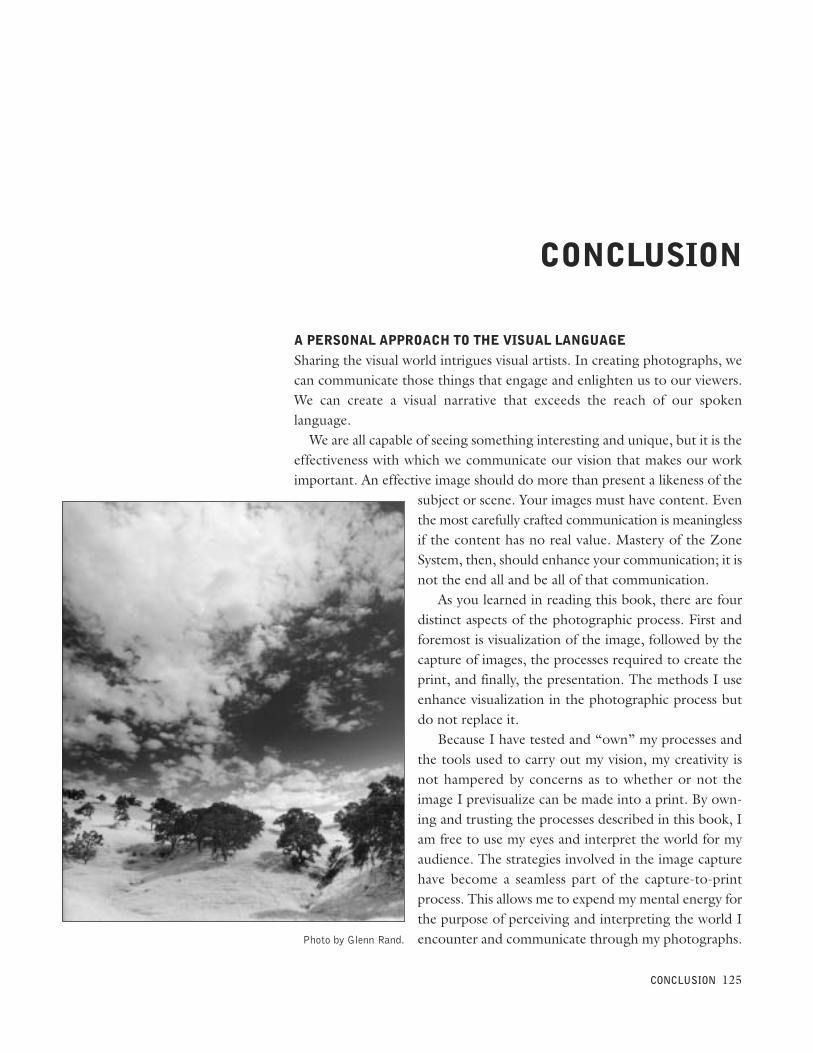
A PERSONAL APPROACH TO THE VISUAL LANGUAGESharing the visual world intrigues visual artists. In creating photographs, wecan communicate those things that engage and enlighten us to our viewers.We can create a visual narrative that exceeds the reach of our spokenlanguage.We are all capable of seeing something interesting and unique, but it is the
effectiveness with which we communicate our vision that makes our workimportant. An effective image should do more than present a likeness of the
subject or scene. Your images must have content. Eventhe most carefully crafted communication is meaninglessif the content has no real value. Mastery of the ZoneSystem, then, should enhance your communication; it isnot the end all and be all of that communication.
As you learned in reading this book, there are fourdistinct aspects of the photographic process. First andforemost is visualization of the image, followed by thecapture of images, the processes required to create theprint, and finally, the presentation. The methods I useenhance visualization in the photographic process butdo not replace it.
Because I have tested and “own” my processes andthe tools used to carry out my vision, my creativity isnot hampered by concerns as to whether or not theimage I previsualize can be made into a print. By own-ing and trusting the processes described in this book, Iam free to use my eyes and interpret the world for myaudience. The strategies involved in the image capturehave become a seamless part of the capture-to-printprocess. This allows me to expend my mental energy forthe purpose of perceiving and interpreting the world Iencounter and communicate through my photographs.
CONCLUSION 125
CONCLUSION
Photo by Glenn Rand.
AAdobe Camera Raw, 119–24Adobe Photoshop, 114, 119–24color sampler, 114CS2, 119–122CS3, 119, 122curves, 122histogram, 122
ANSI, 36, 54, 55Aperture calibration, 10Average gradient, 40
BBackground, 113Bleaching, 102–3Blooming, 114Burning, 97–99, 100–101
CCharacteristic curve, 40–41,
56–64, 87film curve, 40, 41–42, 48, 5456–64
paper curve, 40, 41–42, 48Chemical fog, 36Chromatic adaptation, 24Clipping, 111, 114, 115Color, 21–22, 111Color fringing, 114Constants, 9–10, 53–54
Contrast, 28, 40, 46, 62, 79–92,100–101, 103, 111
correction, 79–92index, 28, 40, 46, 62
Contrast range, See Contrast, index
DDark slide, 57Density, 30, 46, 50, 54, 88Densitometer, 30, 53, 58, 64Development, 53–64, 93–97Digital capture, 85, 105–124Digital sensor, See Image sensorDmax, 41, 49, 55–56, 58–59, 94,
101, 103Dmin, 36, 46, 48, 49, 55–56,
58–59, 86, 101, 103Dodging, 83–85, 97–100, 101Dynamic range, 23, 24, 25–27, 36,
37, 44, 47, 48, 53, 62,69–70, 71, 72, 118
EEighteen percent gray, See Zone VEnlarger, 46, 54, 56–57, 101–2Expansion/compaction, 49–51,
56, 60, 61–62, 64, 70,75–76, 89, 93–94
Exposure index, 18, 30, 55, 113,114, 115, 118
Exposures, multiple, 85
Exposure range, See Exposureindex
FField charts, 76, 77File formats, 80, 107, 113, 119JPEG, 119raw, 80, 107, 113, 119
Film, 10–18, 40, 41–42, 48, 54,55, 56–64, 69, 87, 89
curve, 40, 41–42, 48, 5456–64
intensifying/toning negatives,104
ISO, 48, 56, 62–64speed test, 10–18
Filter factor, 83Filters, 16, 21, 42, 54, 79–83Fixer, 95Flare, 14, 45–48, 68camera system, 45–46scenic, 14, 46–48, 68
Flashing, 85, 101–2Fog, 36, 46, 55
GGamma, 40Gradient, average, 40Gray card, 14, 83, 86–87, 113Gray scale, See Zone scale
126 FILM & DIGITAL TECHNIQUES FOR ZONE SYSTEM PHOTOGRAPHY
INDEX
HHigh dynamic range imaging, 85,
105–122High key, 34Human vision, 23, 24, 47
IImage sensor, 48, 107–10Intensifying negatives, 104ISO rating/setting, 48, 56, 62–64,
113, 114
LLight, 25–28, 46, 49, 51, 76angle of incidence, 25diffuse, 27–28, 46fill, 76hard, See Light, specularintensity, 28normal, 49, 51overcast, 28, 46, 51main, 76ratio, 76reflected, 25–27soft, See Light, diffusespecular, 27–28, 51, 74, 113sweet, 28
Low key, 32
MMatboard, 14, 83Metering, 10–13, 41, 42–44, 115average value metering, 32, 35,44, 67
dark-tone metering, 32, 43,112, 115
highlight detail metering,43–44, 115
incident, 76, 113reflective, 13, 43, 113spot, 13, 83target, 13–14TTL, 87
Middle gray, See Zone V
NNoise, 110, 118N values, 60–64, 67, 70, 71,
88–90, 118
OOutputCD/DVD, 122inkjet printers, 110, 111, 124offset printers, 124online viewing, 124
Overdevelopment, SeeExpansion/compaction
Overexposure, 43, 64, 86, 113,114, 115, 116, 117, 118
PPaper, 36, 37, 40, 41–42, 49,
53–56, 93, 97Pre-exposure, 85–87, 101–2Presensitizing, See FlashingPrevisualization, 8, 12, 21, 47, 53,
67Printers, 110, 111, 124Printing, darkroom, 93–100development, 93–97global controls, 93local controls, 97–100multi-contrast, 96
RReciprocity failure, 85, 87, 89–90Reciprocity, Law of, 31, 62Resolution, 124
SSBR, See Subject brightness rangeShutter speed calibration, 10Speed point, 46, 62Step wedge, 54, 55, 62Stop bath, 95Studio, 9Subject brightness range, 60, 61,
89
TTarget, metering, 13–14Tonality, 21–22Tonal relationships, 48–49Toning negatives, 104Tripod, 16, 82
UUnderdevelopment, See
Expansion/CompactionUnderexposure, 36, 85
VVariables, 9–10, 53, 68
WWhite point, 114
ZZone 0, 30Zone I, 31Zone II, 31Zone III, 32Zone IV, 32Zone V, 32–34Zone VI, 34Zone VII, 34Zone VIII, 35–36Zone IX, 36Zone X, 36–37Zones, 30–37, 69–76, 118dark, 30–32detail, 32–35highlight, 35–37overall control, 69–72, 76, 118placement, 39–44tonal control, 72–76
Zone ruler, See Zone scaleZone scale, 29–37
INDEX 127
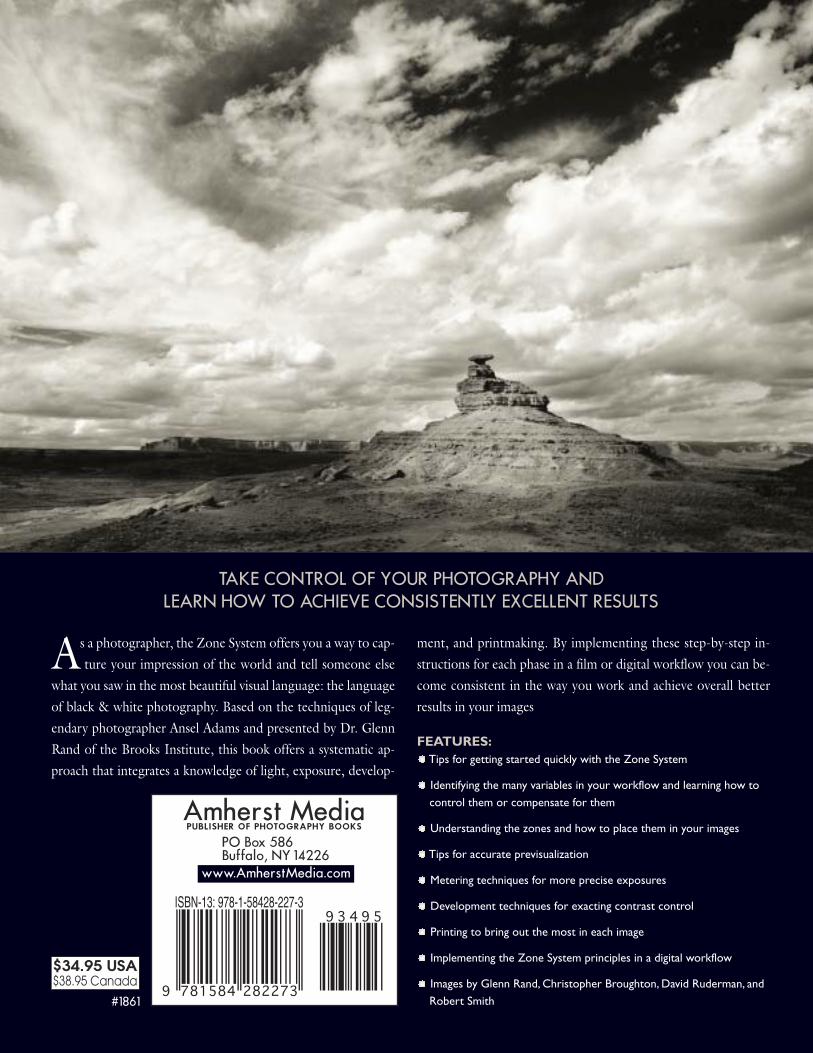
Amherst MediaPUBLISHER OF PHOTOGRAPHY BOOKS
PO Box 586Buffalo, NY 14226
www.AmherstMedia.com
$34.95 USA$38.95 Canada
#1861
TAKE CONTROL OF YOUR PHOTOGRAPHY ANDLEARN HOW TO ACHIEVE CONSISTENTLY EXCELLENT RESULTS
Asa photographer, the Zone System offers you a way to cap-ture your impression of the world and tell someone else
what you saw in the most beautiful visual language: the languageof black & white photography. Based on the techniques of leg-endary photographer Ansel Adams and presented by Dr. GlennRand of the Brooks Institute, this book offers a systematic ap-proach that integrates a knowledge of light, exposure, develop-
ment, and printmaking. By implementing these step-by-step in-structions for each phase in a film or digital workflow you can be-come consistent in the way you work and achieve overall betterresults in your images
FEATURES:Tips for getting started quickly with the Zone System
Identifying the many variables in your workflow and learning how tocontrol them or compensate for them
Understanding the zones and how to place them in your images
Tips for accurate previsualization
Metering techniques for more precise exposures
Development techniques for exacting contrast control
Printing to bring out the most in each image
Implementing the Zone System principles in a digital workflow
Images by Glenn Rand, Christopher Broughton, David Ruderman, andRobert Smith
Recommended