Fire and rescue workforce and pensions statistics: England, April 2016 to March 2017
2nd Edition
Statistical Bulletin 18/17
9 August 2018

Since the publication of Fire and rescue workforce and pensions statistics: England April 2016 to March 2017 on 26 October 2017 two fire and rescue authorities (Bedfordshire and Greater London) have provided amended figures on workforce and diversity. The Greater London change increases the total full time equivalent staff figure. This revision has been made in line with our published revisions policy. The change affecting the diversity information about staff in Bedfordshire is more minor, but was made for convenience at the same time. The relevant tables were revised on 3 April 2018.
These amendments have resulted in total workforce numbers (full time equivalent) and diversity of new joiner figures in this release also being updated for consistency.
Contents
Page
1 Key facts ............................................................................................................... 1
2 Introduction ........................................................................................................... 2
3 Total workforce and leavers ................................................................................. 3
Total workforce ........................................................................................................ 3
Workforce leavers .................................................................................................... 4
4 Workforce Diversity .............................................................................................. 5
Gender ..................................................................................................................... 5
Ethnicity ................................................................................................................... 7
Age .......................................................................................................................... 8
Religion (Experimental Statistics) ............................................................................ 9
Sexual Orientation (Experimental Statistics) .......................................................... 10
Workforce Joiner Diversity ..................................................................................... 10
5 Firefighters’ health and safety ............................................................................ 11
6 Firefighters’ Pensions ......................................................................................... 13
Pension Scheme Expenditure and Income ............................................................ 13
Pension Scheme Membership ............................................................................... 16
7 Further information ............................................................................................. 18
1
1 Key facts
This release presents statistics which cover 31 March 2017 specifically (for point in time
statistics) or the financial year 2016/17 (1 April 2016 to 31 March 2017) for fire and rescue
services (FRSs) in England. The results show:
Total workforce and leavers
• 40,964 staff (FTE) were employed by FRSs on 31 March 2017. This was a three per cent decrease compared with the previous year (42,307 in 2016). Since the peak in 2009, the number of FRS staff has decreased by an average of more than two and a half per cent per year.
• 33,049 staff (FTE) were employed as firefighters on 31 March 2017. This was a four per cent decrease compared with the previous year (34,395 in 2016). Since 2009 the number of firefighters has decreased by an average of almost three per cent per year.
• During the financial year 2016/17, 4,425 staff left FRSs. This is 10 per cent of staff headcount. Since 2009/10 the proportion of FRS staff leaving has been on a slow upward trend from seven per cent to 10 per cent in 2016/17. This is partly caused by increases in the rate of staff retiring either through “normal” retirement, “early” retirement or ill health.
Workforce diversity
• 5.2 per cent (1,838) of firefighters were women in England in 2017. This compares with 5.0 per cent in the previous year (1,824 in 2016). Since 2010 the main cause in the increase in the proportion of women firefighters has been a decrease in the number of men firefighters.
• 3.9 per cent (1,244) of firefighters were from an ethnic minority group in England in 2017. This compares with 3.8 per cent in the previous year (1,270 in 2016). This has been caused by the number of white firefighters decreasing by a greater rate than the number of firefighters from an ethnic minority group. There were 134 fewer firefighters from an ethnic minority group in 2017 than in 2011. This compares with 14.6 per cent of the English population in the 2011 Census coming from an ethnic minority group.
Firefighter health and safety
• There was a total of 2,523 firefighter injuries during 2016/17, three per cent lower than in the previous year (2,602). The number of firefighter injuries has been on a downward trend for over a decade.
Firefighter pensions
• The Firefighters’ Pension Scheme deficit in 2016/17 was around £535.3 million. This was a five per cent increase compared with the previous year (£510.6 million in 2015/16). Expenditure was around £818.2 million while income was around £282.9 million.
2
2 Introduction
In order to improve the clarity of the Home Office’s fire statistics some of the previous releases have been replaced by more topic-focussed publications. This is one of the new publications and it brings together statistics on workforce and firefighters’ pensions which were previously released in Fire and rescue authorities operational statistics and Firefighters' pension scheme statistics This release covers total fire and rescue service workforce statistics, the diversity of that workforce, the health and safety of the firefighters, firefighters’ pensions and also includes, for the first time, information on the diversity of new joiners. This publication covers the financial year 1 April 2016 to 31 March 2017 with point in time statistics from 31 March 2017. The publication will be updated annually.
A new publication with information from the previous operational statistics release has been published on the same day as this release: Fire prevention and protection statistics, England, April 2016 to March 2017. This includes information on Fire Safety Audits and.
Information on workforce and on-duty firefighter health and safety is recorded by individual FRSs and is provided to the Home Office through a manual collection via excel spreadsheets. Pensions statistics are provided to the Home Office via an online data collection system.
This publication is accompanied by fire data tables, which can be found on the fire statistics data tables page which contains all data tables on fire published by the Home Office. The following tables have been updated and added as part of this publication: Fatalities and casualties: 0508 and 0509.
Workforce: 1101, 1102, 1103, 1104, 1105, 1106, 1107, 1110, 1111, 1112, 1120, 1121 and 1123.
Pensions: 1401, 1402, 1403, 1404 and 1405.
Since the publication of Fire and rescue workforce and pensions statistics: England April 2016 to March 2017 on 26 October 2017 two fire and rescue authorities (Bedfordshire and Greater London) have provided amended figures on workforce and diversity. The Greater London change increases the total full time equivalent staff figure. This revision has been made in line with our published revisions policy. The change affecting the diversity information about staff in Bedfordshire is more minor, but made for convenience at the same time. These revisions affect some of the figures given in the commentary.
3
3 Total workforce and leavers
Total workforce
FRSs are asked the number of wholetime and full time equivalent (FTE) staff they employ as
of 31 March each year, broken down by role and contract type.
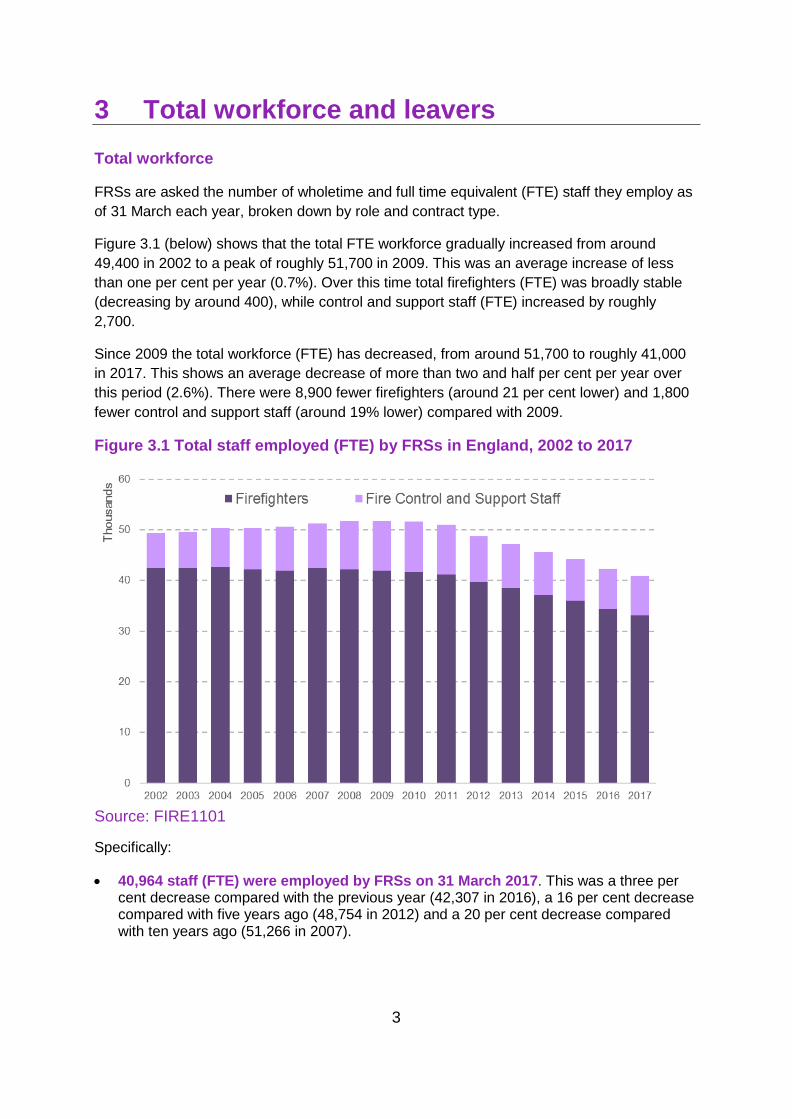
Figure 3.1 (below) shows that the total FTE workforce gradually increased from around
49,400 in 2002 to a peak of roughly 51,700 in 2009. This was an average increase of less
than one per cent per year (0.7%). Over this time total firefighters (FTE) was broadly stable
(decreasing by around 400), while control and support staff (FTE) increased by roughly
2,700.
Since 2009 the total workforce (FTE) has decreased, from around 51,700 to roughly 41,000
in 2017. This shows an average decrease of more than two and half per cent per year over
this period (2.6%). There were 8,900 fewer firefighters (around 21 per cent lower) and 1,800
fewer control and support staff (around 19% lower) compared with 2009.
Figure 3.1 Total staff employed (FTE) by FRSs in England, 2002 to 2017
Source: FIRE1101
Specifically:
• 40,964 staff (FTE) were employed by FRSs on 31 March 2017. This was a three per cent decrease compared with the previous year (42,307 in 2016), a 16 per cent decrease compared with five years ago (48,754 in 2012) and a 20 per cent decrease compared with ten years ago (51,266 in 2007).
4
• 33,049 FRS staff (FTE) were firefighters (whether wholetime1 or retained duty system2) on 31 March 2017. This was a four per cent decrease compared with the previous year (34,395 in 2016), a 17 per cent decrease compared with five years ago (39,678 in 2012) and a 22 per cent decrease compared with ten years ago (42,385 in 2007).
• 7,915 FRS staff (FTE) were fire control3 or support staff4. This was no change compared with the previous year (7,912 in 2016), a 13 per cent decrease compared with five years ago (9,075 in 2012) and a 11 per cent decrease compared with ten years ago (8,881 in 2007).
Further information on total workforce can be found in fire data tables 1101 and 1102.
Workforce leavers
Information on leavers is collected on a headcount (i.e. an individual rather than FTE) basis.
The list of reasons individuals left the service in table FIRE1111 is not exhaustive, in fact
almost a quarter of staff leaving in 2016/17 left for “other reasons”, which is consistent with
recent years. The Home Office has reviewed the leaver’s categories with the aim of
amending the information collected from 2017/18 in order to provide a more complete picture
of reasons for leaving.
Since data became available in 2010 the proportion of FRS staff that left the FRS has
increased slowly from seven per cent to eleven per cent in 2016/17. This is partly caused by
increases in the rate of staff retiring through either “normal retirement”, “early retirement” or
“ill health”.
Specifically:
• During the financial year 2016/17, 4,425 staff left FRSs. This is ten per cent of staff
headcount. This proportion was ten per cent in the previous year (4,333 staff in 2015/16)
and eight per cent five years ago (4,230 in 2011/12).
• The most common reason staff left FRSs in 2016/17 was because of a “normal” or “early”
retirement, which accounted for a total of 33 per cent (1,446) of those leaving. The vast
majority of staff leaving for this reason were wholetime firefighters (1,106). This was 33
people per thousand members of FRS staff. In the previous year this rate was 33 people
while five years ago the rate was 24 people.
• The second most common reason staff left FRSs in 2016/17 was to take employment
outside FRSs, which accounted for 26 per cent (1,137) of those leaving. Almost half of
staff leaving for this reason were retained duty firefighters (533).
• In 2016/17, 101 FRS staff retired through “ill health”, two per cent of those leaving. This
was 2.3 people per thousand members of FRS staff. In the previous year this rate was
1.9 people while five years ago the rate was 1.7 people.
Further information on workforce leavers can be found in fire data tables 1110 and 1111.
1 A full-time firefighter, regardless of rank. 2 A firefighter responding when required during their ‘on call’ hours. 3 A uniformed member of staff working in a fire and rescue service control centres to answer emergency calls and deal with mobilising, communications and related activities, regardless of rank. 4 A member of staff employed by the FRS who is not a firefighter or in fire control. It includes for example administrative roles, clerical support, analytical support, finance, vehicle maintenance, property management etc.
5
4 Workforce diversity
This section covers information on five diversity characteristics – gender, ethnicity, age,
religion and sexual orientation as well as new statistics on those joining FRSs.
The figures in this section are taken as of 31 March 2017.
Gender
Gender statistics are published at FRS level in table 1103.
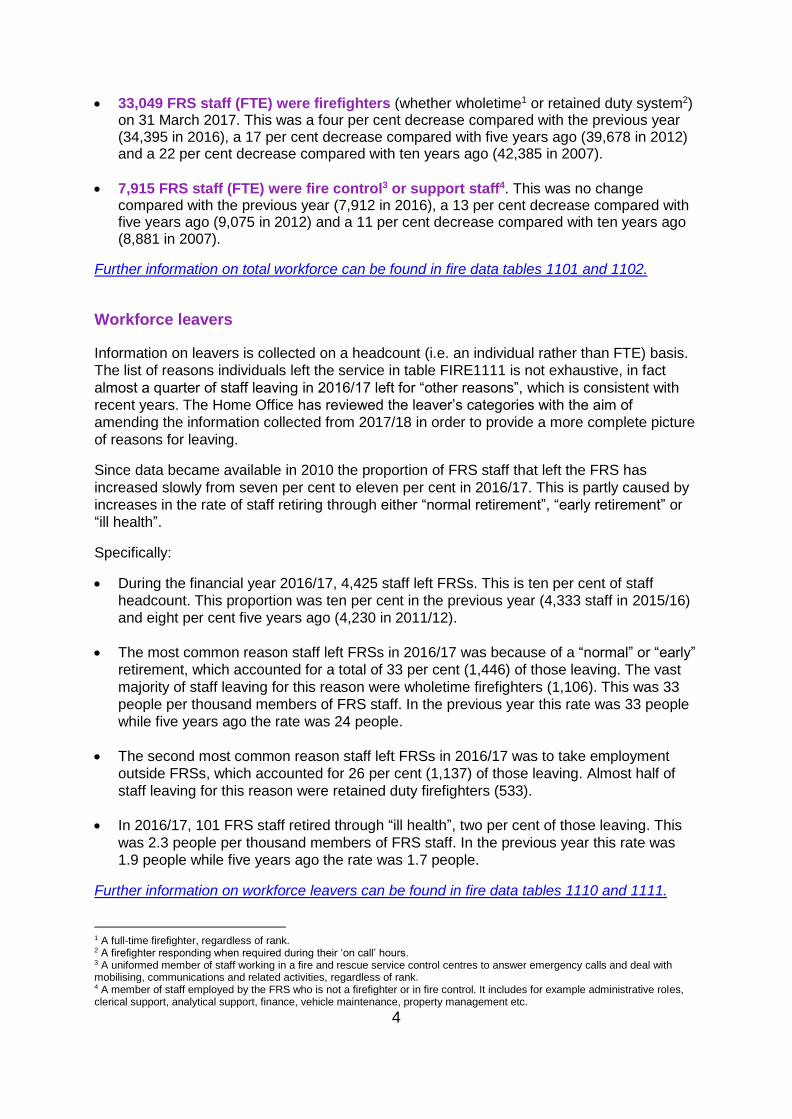
The number and proportion of women firefighters have slowly increased from 2002 (the first
year for which comparable data are available). In 2002, 1.7 per cent (753) of all firefighters
were women, by 2017 this proportion had reached 5.2 per cent (1,838). The percentage of
police officers in England that were women in 2017 (29.1%)5 is over five times the
percentage of firefighters that are women.
Figure 4a: Gender of firefighters in England, 2002 to 2017
Source: FIRE1103
In the seven years since 2010 the main cause in the increase in the proportion of women
firefighters has been a decrease in the number of men firefighters. The number of women
firefighters has slightly increased by around 100 over this time whilst the number of men
firefighters has decreased by almost 8,800.
In contrast in the eight years between 2002 and 2010 the cause of proportion of firefighters
who were women increasing from 1.7 per cent to 3.9 per cent was both the number of
women firefighters increasing and number of men firefighters decreasing.
5 https://www.gov.uk/government/statistics/police-workforce-england-and-wales-31-march-2017
6
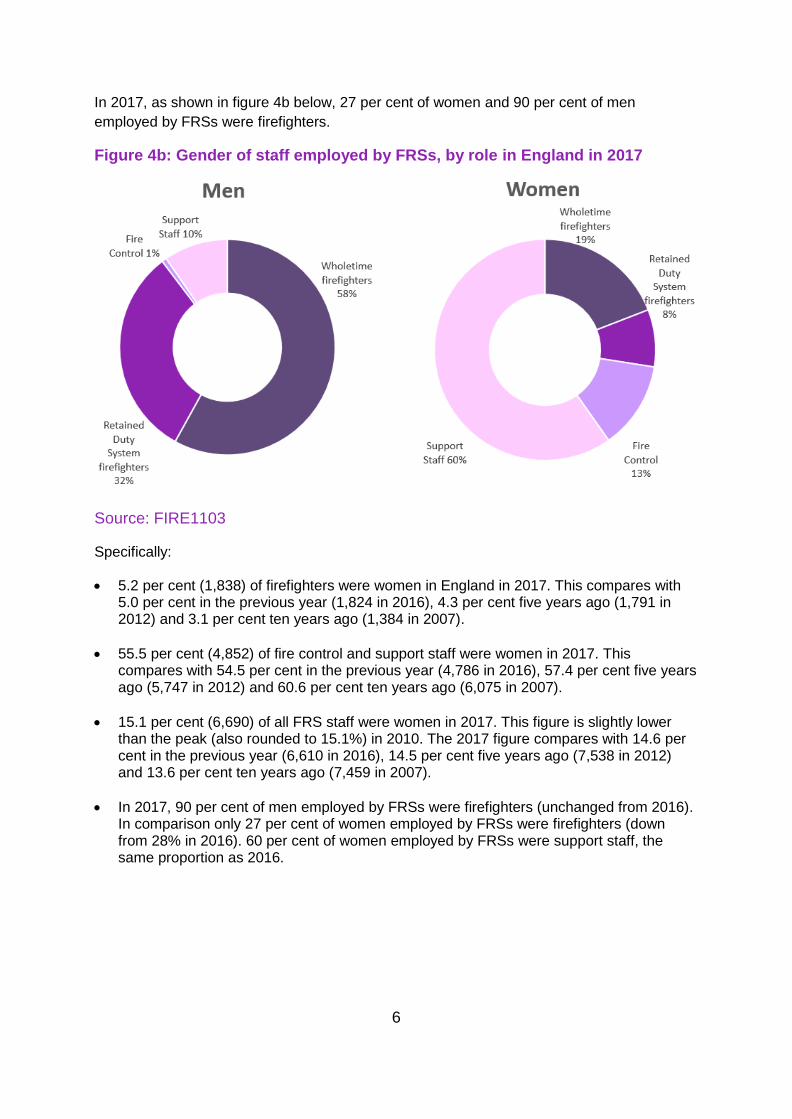
In 2017, as shown in figure 4b below, 27 per cent of women and 90 per cent of men
employed by FRSs were firefighters.
Figure 4b: Gender of staff employed by FRSs, by role in England in 2017
Source: FIRE1103
Specifically:
• 5.2 per cent (1,838) of firefighters were women in England in 2017. This compares with 5.0 per cent in the previous year (1,824 in 2016), 4.3 per cent five years ago (1,791 in 2012) and 3.1 per cent ten years ago (1,384 in 2007).
• 55.5 per cent (4,852) of fire control and support staff were women in 2017. This compares with 54.5 per cent in the previous year (4,786 in 2016), 57.4 per cent five years ago (5,747 in 2012) and 60.6 per cent ten years ago (6,075 in 2007).
• 15.1 per cent (6,690) of all FRS staff were women in 2017. This figure is slightly lower than the peak (also rounded to 15.1%) in 2010. The 2017 figure compares with 14.6 per cent in the previous year (6,610 in 2016), 14.5 per cent five years ago (7,538 in 2012) and 13.6 per cent ten years ago (7,459 in 2007).
• In 2017, 90 per cent of men employed by FRSs were firefighters (unchanged from 2016). In comparison only 27 per cent of women employed by FRSs were firefighters (down from 28% in 2016). 60 per cent of women employed by FRSs were support staff, the same proportion as 2016.
7
Ethnicity
All FRSs collect and provide ethnicity information to the Home Office, however 5,022 (11.3%)
of staff did not state an ethnicity in 2017. This proportion has varied between 7.2 per cent
and 11.3 per cent over the past six years. Ethnicity statistics are published at FRS level in
table 1104.
The proportion of firefighters that were from an ethnic minority group6 has increased slowly
since 2011 (from when consistent data are available) from 3.5 per cent to 3.9 per cent in
2017. This compares with 14.6 per cent of the English population in the 2011 Census. The
percentage of police officers in England in 2017 that are from an ethnic minority group (6.5
per cent) is over one and half times the percentage of firefighters that are from an ethnic
minority group (3.9 per cent).
There were 134 fewer firefighters from an ethnic minority group in 2017 than in 2011,
however as the number of white firefighters has decreased by a greater rate than the
number of firefighters from an ethnic minority group, the proportion of firefighters that were
from an ethnic minority group increased. All four ethnic minority groups were under-
represented as firefighters when compared with the 2011 Census7.
Similarly, the proportion of fire control and support staff from an ethnic minority group
increased from 6.0 per cent in 2011 to 6.8 per cent in 2017 but the actual number decreased
from 614 to 525. As for firefighters, all four ethnic groups were under-represented when
compared with the resident population.
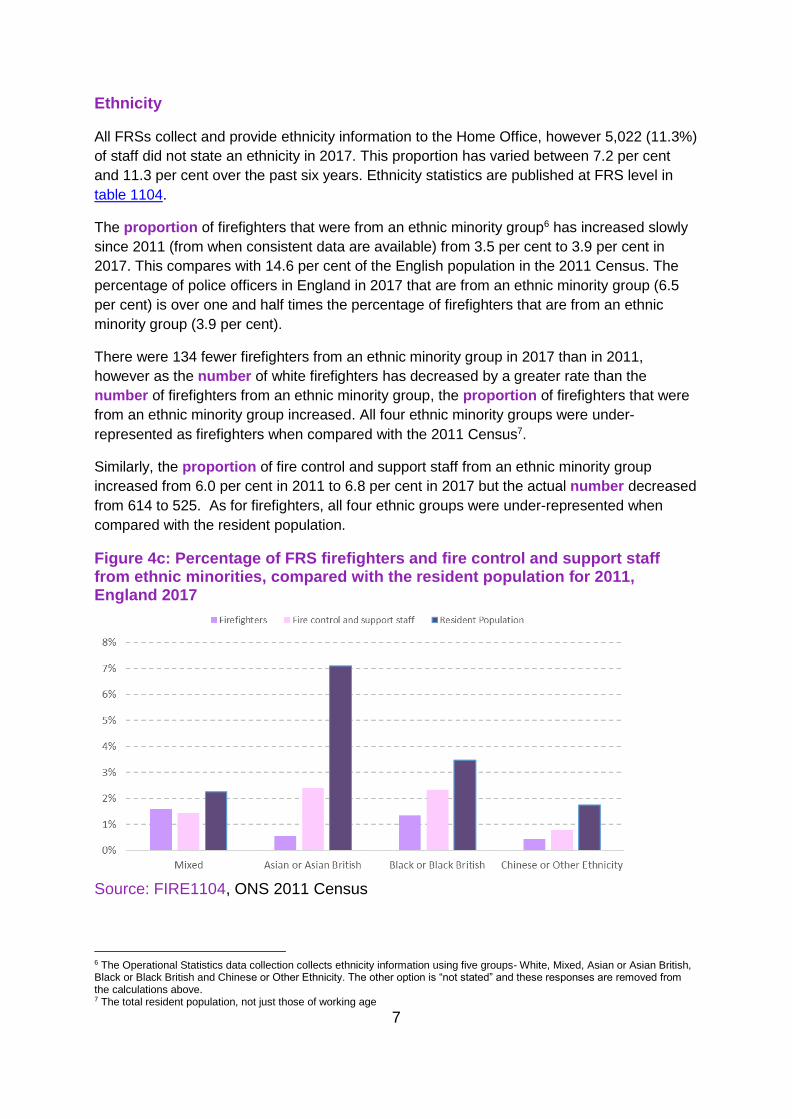
Figure 4c: Percentage of FRS firefighters and fire control and support staff from ethnic minorities, compared with the resident population for 2011, England 2017
Source: FIRE1104, ONS 2011 Census
6 The Operational Statistics data collection collects ethnicity information using five groups- White, Mixed, Asian or Asian British, Black or Black British and Chinese or Other Ethnicity. The other option is “not stated” and these responses are removed from the calculations above. 7 The total resident population, not just those of working age
8
Specifically:
• 3.9 per cent (1,244) of firefighters were from an ethnic minority group in England in 2017. This compares with 3.8 per cent in the previous year (1,270 in 2016) and 3.5 per cent five years ago (1,337 in 2012). This compares with 14.6 per cent of the English population in the 2011 Census.
• 6.8 per cent (525) of fire control and support staff were from an ethnic minority group in England in 2017. This compares with 6.6 per cent in the previous year (530 in 2016) and 6.2 per cent five years ago (588 in 2012).
• 4.5 per cent (1,769) of FRS staff were from an ethnic minority group in England in 2017. This compares with 4.4 per cent in the previous year (1,800 in 2016) and 4.1 per cent five years ago (1,965 in 2012).
• In 2017, 70 per cent of FRS staff from an ethnic minority group were firefighters (compared with 71% in 2016), in comparison 81 per cent of those with a white ethnicity employed by FRSs were firefighters (unchanged from 2016).
Age
Statistics on the age of FRS staff by role are published at FRS level in table 1105.
Overall, the age of firefighters is increasing. In 2017 the average age of a firefighter was 42
compared with 40 five years ago.
Specifically:
• 35 per cent (12,604) of firefighters were between 46 and 55 years of age in 2017. This compares with 34 per cent in the previous year (12,603 in 2016) and 29 per cent five years ago (12,238 in 2012). These figures are higher than the 22 per cent of the resident population8 aged 16 to 64 (and hence “working age”) who were aged 46 to 55 in June 2016.
• Only three per cent (1,038) of firefighters were aged 16 to 24 in 2017. This proportion was also three per cent in the previous year (1,096 in 2016) and four per cent five years ago (1,575 in 2012). These figures are far lower than the 18 per cent of the resident population aged 16 to 64 (and hence “working age”) who were aged 16 to 24 in June 2016.
8 https://www.ons.gov.uk/peoplepopulationandcommunity/populationandmigration/populationestimates/bulletins/annualmidyearpopulationestimates/latest
9
Religion (experimental statistics)
Religion statistics are published at FRS level in table 1106.
Seven FRSs did not have information on religion in the datasets they supplied to the Home
Office in 2017, meaning that no data were available for 12 per cent of staff, although this is
less than the 27 per cent in 2011. A further 35 per cent of all FRS staff chose to not state
their religion in 2017 (broadly the same percentage as previous years). All of these
responses are excluded from the calculations below.
Figures are available from 2011 and have shown the proportion of firefighters that are
Christian has been the biggest religious group, with proportions ranging from 56 to 62 per
cent. In 2017 this figure was 56 per cent. These compare with 59 per cent of England’s
resident population in the 2011 Census.
The second largest group of firefighters is those that stated they had “no religion”, ranging
from 32 to 38 per cent over time. In 2017 this figure was 38 per cent. This compares with 25
per cent of England’s resident population in the 2011 Census.
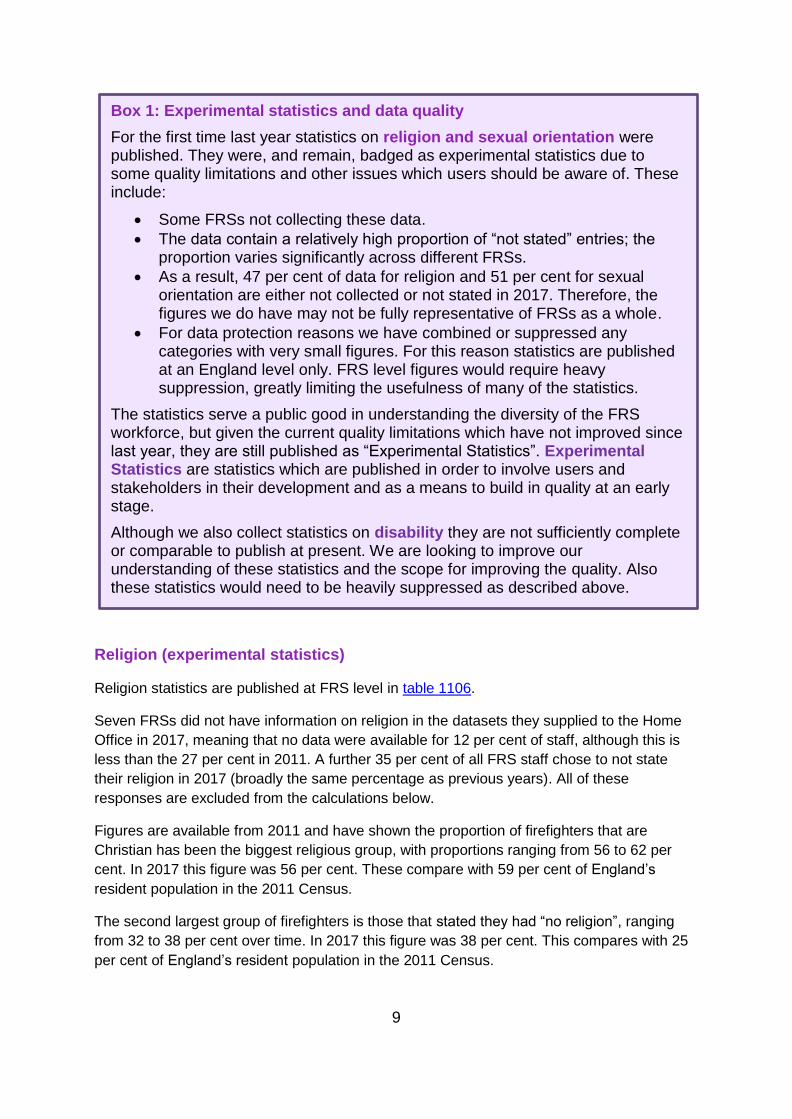
Box 1: Experimental statistics and data quality
For the first time last year statistics on religion and sexual orientation were published. They were, and remain, badged as experimental statistics due to some quality limitations and other issues which users should be aware of. These include:
• Some FRSs not collecting these data.
• The data contain a relatively high proportion of “not stated” entries; the proportion varies significantly across different FRSs.
• As a result, 47 per cent of data for religion and 51 per cent for sexual orientation are either not collected or not stated in 2017. Therefore, the figures we do have may not be fully representative of FRSs as a whole.
• For data protection reasons we have combined or suppressed any categories with very small figures. For this reason statistics are published at an England level only. FRS level figures would require heavy suppression, greatly limiting the usefulness of many of the statistics.
The statistics serve a public good in understanding the diversity of the FRS workforce, but given the current quality limitations which have not improved since last year, they are still published as “Experimental Statistics”. Experimental Statistics are statistics which are published in order to involve users and stakeholders in their development and as a means to build in quality at an early stage.
Although we also collect statistics on disability they are not sufficiently complete or comparable to publish at present. We are looking to improve our understanding of these statistics and the scope for improving the quality. Also these statistics would need to be heavily suppressed as described above.
10
The figures for fire control and support staff show a similar pattern although they appear less
likely to state “no religion” (ranging from 27 to 31 per cent) and more likely to be Christian
(ranging from 62 to 66 per cent). In 2017 these figures were 31 per cent (no religion) and 62
per cent (Christian).
Sexual orientation (experimental statistics)
Sexual orientation statistics are published at FRS level in table 1107.
Eight FRSs did not have information on sexual orientation in the datasets they supplied to the
Home Office in 2017, meaning that no data were available for 13 per cent of staff, although
this is less than the 27 per cent in 2011. A further 38 per cent of all FRS staff chose to not
state their sexual orientation in 2017 (broadly the same percentage as previous years). All of
these responses are excluded from the calculations below.
Figures are available from 2011 and have shown the proportion of firefighters that stated they
were gay, lesbian or bisexual has been three per cent in each year between 2011 and 2017.
The figures for fire control and support staff were also three per cent over this time.
Workforce joiner diversity
This year, for the first time, the Home Office collected information on the diversity of those
joining FRSs. This was a voluntary collection for FRSs but 39 of the 46 FRSs (when including
North West Fire Control) completed the return. The Home Office proposes to make this
collection mandatory for 2017/18.
The proportion of women, staff from an ethnic minority and younger staff within new joiners in
2017 was greater than from within total staff.
Specifically:
• During 2016/17, there were 1,480 new firefighters (by headcount not FTE) across the 39 FRSs who supplied data, six per cent of all firefighters in those FRSs.
• During 2016/17, 8.7 per cent of new firefighters were women, this is greater than the current 5.2 per cent of all firefighters that are women.
• During 2016/17, 4.4 per cent of new firefighters were from an ethnic minority group, this is greater than the 3.9 per cent of all firefighters that were from an ethnic minority group.
• During 2016/17, 72 per cent of new firefighters were 35 or under, this is greater than the 26 per cent of all firefighters that were 35 or under.
11
5 Firefighters’ health and safety
Data are collected on injuries sustained by on duty firefighters and whether they were
sustained during operational incidents (at fires, road traffic collisions or at other special
service incidents) or during training (operational or fitness) and routine activities. The
collection asks for the total number of personnel injured, the number of ‘over 3 day injuries’,
the number of RIDDOR9 major injuries, and the number of fatalities.
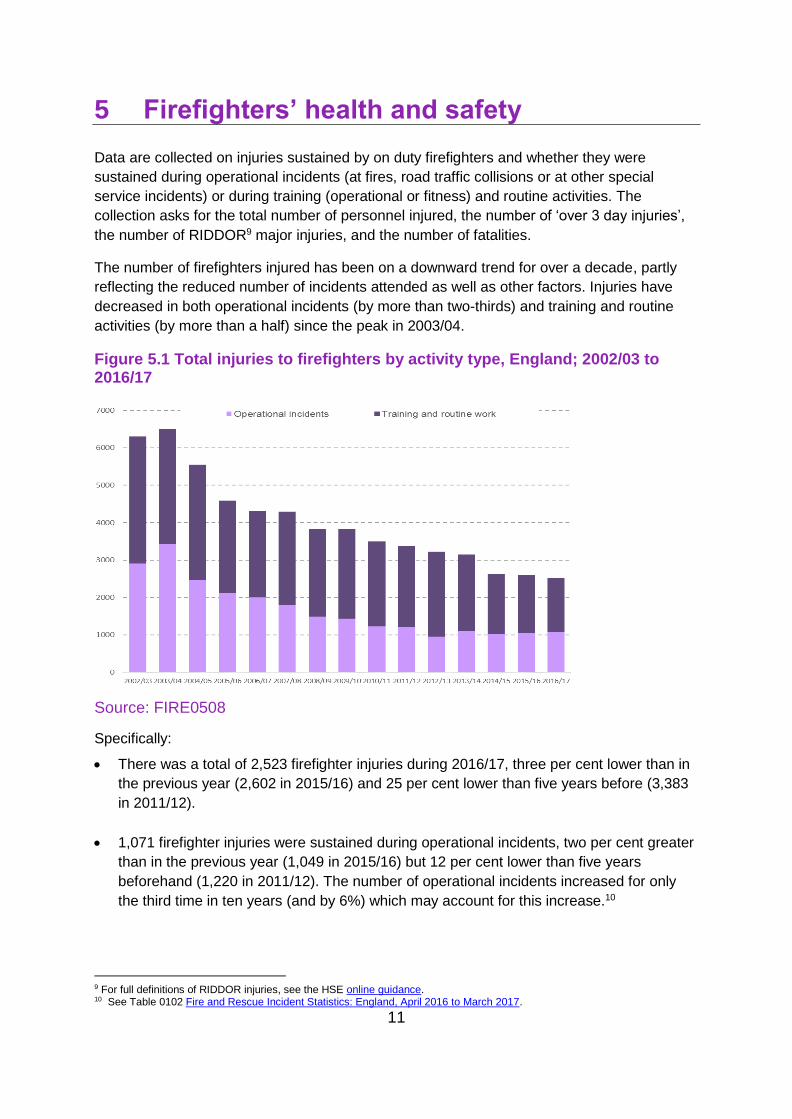
The number of firefighters injured has been on a downward trend for over a decade, partly
reflecting the reduced number of incidents attended as well as other factors. Injuries have
decreased in both operational incidents (by more than two-thirds) and training and routine
activities (by more than a half) since the peak in 2003/04.
Figure 5.1 Total injuries to firefighters by activity type, England; 2002/03 to 2016/17
Source: FIRE0508
Specifically:
• There was a total of 2,523 firefighter injuries during 2016/17, three per cent lower than in
the previous year (2,602 in 2015/16) and 25 per cent lower than five years before (3,383
in 2011/12).
• 1,071 firefighter injuries were sustained during operational incidents, two per cent greater
than in the previous year (1,049 in 2015/16) but 12 per cent lower than five years
beforehand (1,220 in 2011/12). The number of operational incidents increased for only
the third time in ten years (and by 6%) which may account for this increase.10
9 For full definitions of RIDDOR injuries, see the HSE online guidance. 10 See Table 0102 Fire and Rescue Incident Statistics: England, April 2016 to March 2017.
12
• 180 were classed as major injuries11, compared with 49 in the previous year and 60 five
years earlier.
• There were no firefighter fatalities recorded in 2016/17, and one fatality in 2015/16. Over
the last decade there have been 16 firefighter fatalities in total.
Further information on firefighters’ health and safety found in fire data tables 0508 and 0509.
11 For a full definition please see the Definitions document
13
6 Firefighters’ Pensions
Last year the Home Office published a separate release entitled ‘Firefighters’ Pensions
Statistics: Financial and scheme membership data on the firefighters’ pension schemes in
England’. This section covers the same topics as that publication as well as some new opt-
out statistics. The release has been compiled by the Firefighters’ Pensions Team and the
Fire and Rescue Statistics Team at the Home Office.
This release provides income, expenditure and membership submitted by all 45 fire and
rescue authorities (FRAs) in England. This includes data from 1 April 2016 to 31 March 2017.
There are three pension schemes for firefighters: the 1992 Scheme, the 2006 Scheme and
the 2015 Scheme (See full definitions).
The responsibility for the policy and legislation of the three firefighters’ pension schemes in
England rests with the Home Office, whilst the administration and payment of individual
pensions and benefits is the responsibility of each employing FRA. Under the current
financing arrangements of the pension schemes, the employer’s contribution together with
the employee’s contribution is paid into a local pension fund account, managed by each FRA.
Each FRA pays eligible pension costs out of this account. Any shortfall between receipts and
expenditure is met by an annual top-up grant paid by the Home Office.
Pension scheme expenditure and income
Pension scheme expenditure in this context refers to total eligible pension spend by
employers in respect of their retired employees and paid directly out of their local pension
fund account.
Since 2010/11, from when consistent and comparable data were collected, the firefighters'
pension scheme expenditure has gradually increased, with the 2016/17 total (around £820
million) 35 per cent greater than in 2010/11 (around £600 million). The only exception to the
gradual increase was caused by a large redress payment12 of £89 million in 2015/16.
12 In May 2015, the Pensions Ombudsman’s findings in the case of Milne v the Government Actuary’s Department (GAD) meant that FRAs were required to pay commutation redress to affected members of the 1992 Scheme who retired between 2001 and 2006.
14
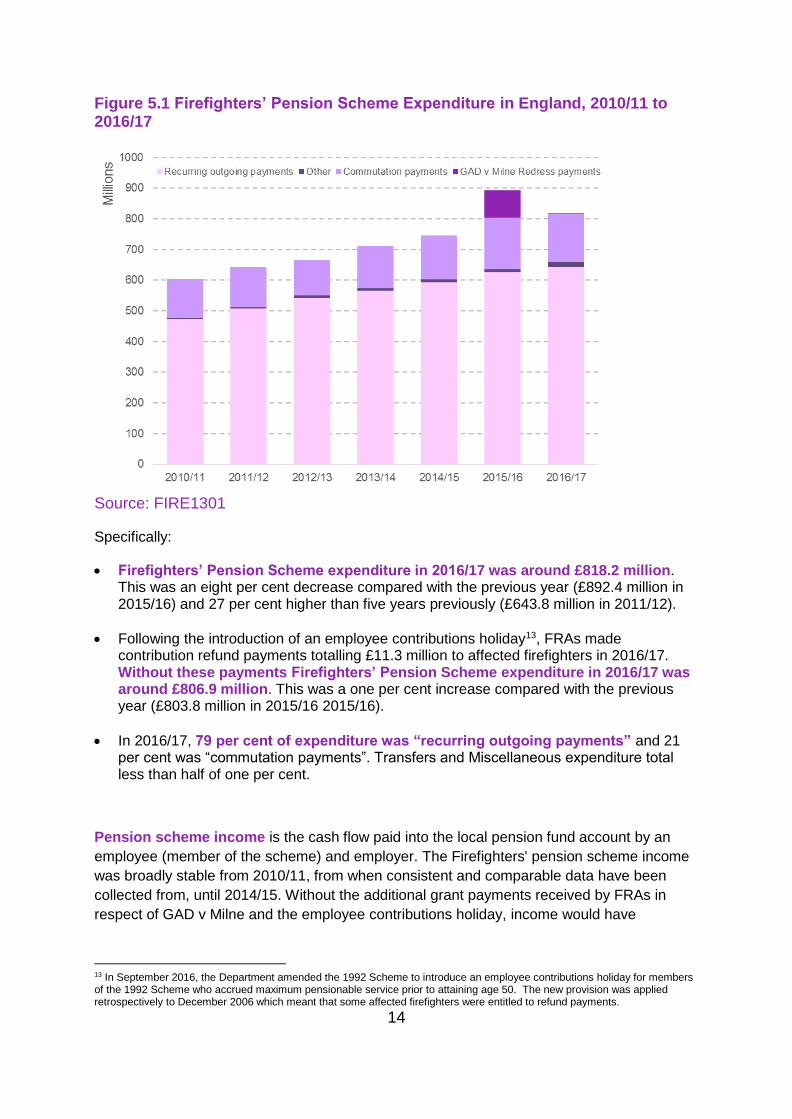
Figure 5.1 Firefighters’ Pension Scheme Expenditure in England, 2010/11 to 2016/17
Source: FIRE1301
Specifically:
• Firefighters’ Pension Scheme expenditure in 2016/17 was around £818.2 million. This was an eight per cent decrease compared with the previous year (£892.4 million in 2015/16) and 27 per cent higher than five years previously (£643.8 million in 2011/12).
• Following the introduction of an employee contributions holiday13, FRAs made contribution refund payments totalling £11.3 million to affected firefighters in 2016/17. Without these payments Firefighters’ Pension Scheme expenditure in 2016/17 was around £806.9 million. This was a one per cent increase compared with the previous year (£803.8 million in 2015/16 2015/16).
• In 2016/17, 79 per cent of expenditure was “recurring outgoing payments” and 21 per cent was “commutation payments”. Transfers and Miscellaneous expenditure total less than half of one per cent.
Pension scheme income is the cash flow paid into the local pension fund account by an
employee (member of the scheme) and employer. The Firefighters' pension scheme income
was broadly stable from 2010/11, from when consistent and comparable data have been
collected from, until 2014/15. Without the additional grant payments received by FRAs in
respect of GAD v Milne and the employee contributions holiday, income would have
13 In September 2016, the Department amended the 1992 Scheme to introduce an employee contributions holiday for members of the 1992 Scheme who accrued maximum pensionable service prior to attaining age 50. The new provision was applied retrospectively to December 2006 which meant that some affected firefighters were entitled to refund payments.
15
decreased by 14 per cent. The 2016/17 income figure (around £280 million) is nine per cent
lower than in 2010/11 (around £310 million).
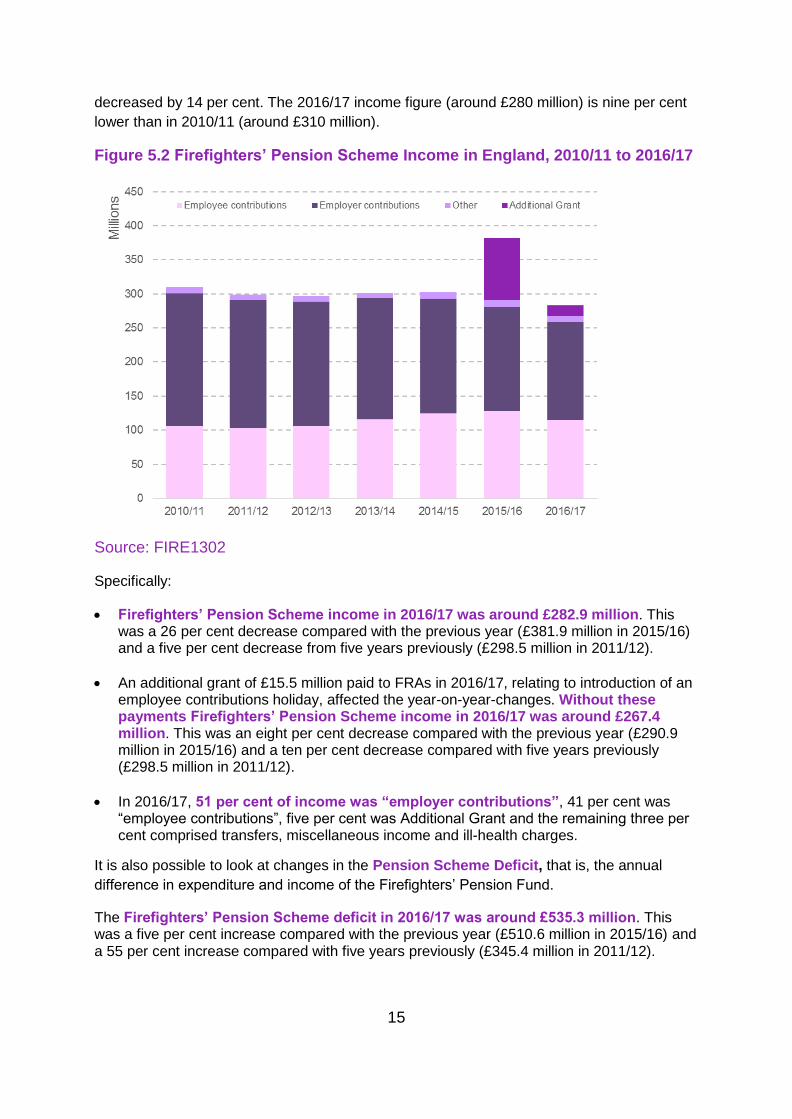
Figure 5.2 Firefighters’ Pension Scheme Income in England, 2010/11 to 2016/17
Source: FIRE1302
Specifically:
• Firefighters’ Pension Scheme income in 2016/17 was around £282.9 million. This was a 26 per cent decrease compared with the previous year (£381.9 million in 2015/16) and a five per cent decrease from five years previously (£298.5 million in 2011/12).
• An additional grant of £15.5 million paid to FRAs in 2016/17, relating to introduction of an employee contributions holiday, affected the year-on-year-changes. Without these payments Firefighters’ Pension Scheme income in 2016/17 was around £267.4 million. This was an eight per cent decrease compared with the previous year (£290.9 million in 2015/16) and a ten per cent decrease compared with five years previously (£298.5 million in 2011/12).
• In 2016/17, 51 per cent of income was “employer contributions”, 41 per cent was “employee contributions”, five per cent was Additional Grant and the remaining three per cent comprised transfers, miscellaneous income and ill-health charges.
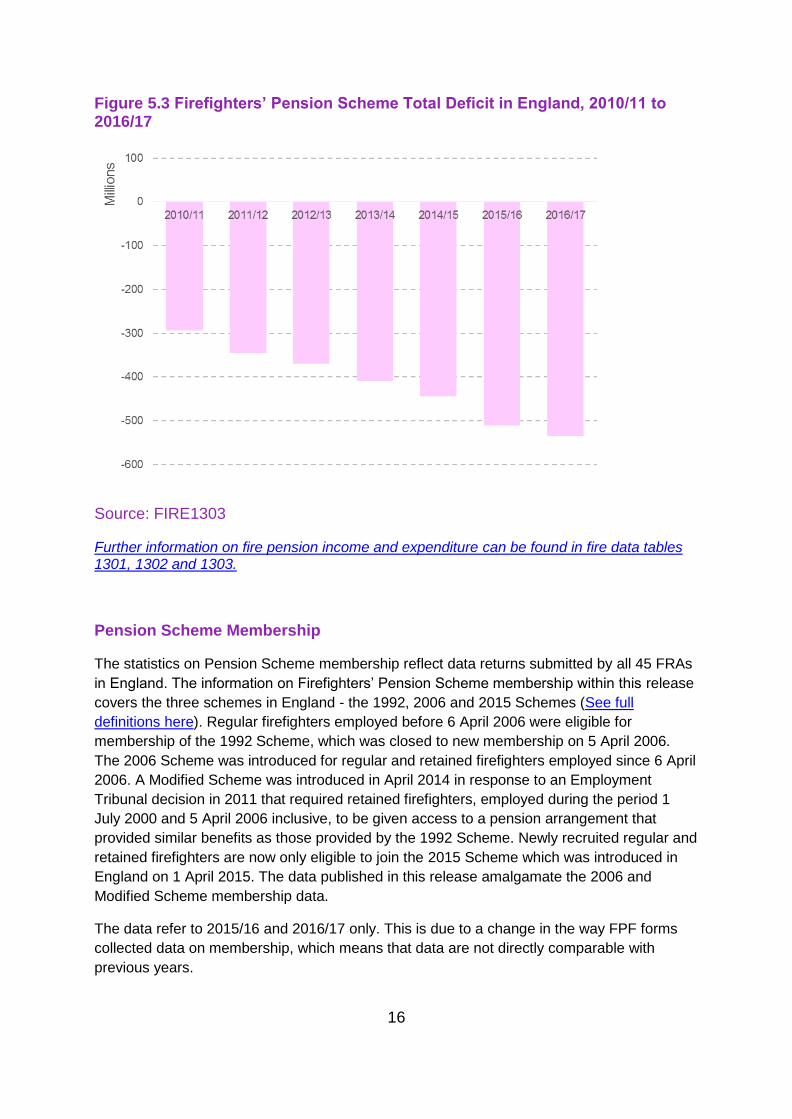
It is also possible to look at changes in the Pension Scheme Deficit, that is, the annual
difference in expenditure and income of the Firefighters’ Pension Fund.
The Firefighters’ Pension Scheme deficit in 2016/17 was around £535.3 million. This was a five per cent increase compared with the previous year (£510.6 million in 2015/16) and a 55 per cent increase compared with five years previously (£345.4 million in 2011/12).
16
Figure 5.3 Firefighters’ Pension Scheme Total Deficit in England, 2010/11 to 2016/17
Source: FIRE1303
Further information on fire pension income and expenditure can be found in fire data tables 1301, 1302 and 1303.
Pension Scheme Membership
The statistics on Pension Scheme membership reflect data returns submitted by all 45 FRAs
in England. The information on Firefighters’ Pension Scheme membership within this release
covers the three schemes in England - the 1992, 2006 and 2015 Schemes (See full
definitions here). Regular firefighters employed before 6 April 2006 were eligible for
membership of the 1992 Scheme, which was closed to new membership on 5 April 2006.
The 2006 Scheme was introduced for regular and retained firefighters employed since 6 April
2006. A Modified Scheme was introduced in April 2014 in response to an Employment
Tribunal decision in 2011 that required retained firefighters, employed during the period 1
July 2000 and 5 April 2006 inclusive, to be given access to a pension arrangement that
provided similar benefits as those provided by the 1992 Scheme. Newly recruited regular and
retained firefighters are now only eligible to join the 2015 Scheme which was introduced in
England on 1 April 2015. The data published in this release amalgamate the 2006 and
Modified Scheme membership data.
The data refer to 2015/16 and 2016/17 only. This is due to a change in the way FPF forms
collected data on membership, which means that data are not directly comparable with
previous years.
17
Information on opt-outs are published here for the first time.
Of the total number of pensioner members as at 31 March 2017, 96 per cent (39,974) were members who have retired and were in receipt of benefits from the 1992 Scheme. This was also 96 per cent (39,251) on 31 March 2016. The other four per cent were in different schemes. Pensioners are those firefighters who have retired from service and are in receipt of their pension benefits.
14 per cent of deferred members were still employed as a firefighter. Deferred members include those firefighters who continue in employment but have elected to opt-out of their membership of the pension scheme, and those who have left their employment before reaching the age at which they are entitled to receive their pension benefits.
66 per cent (15,120) of active regular members and 85 per cent (7,137) of active retained members belonged to the 2015 Scheme as at 31 March 2017. The large majority of members being in the 2015 Scheme is due to the transition of 1992 and 2006 Scheme members to the 2015 Scheme on 1 April 2015. Active members are personnel currently employed in the role of a firefighter and who are members of one of the pension schemes and pay employee contributions based on the pensionable pay that they earn. Retained members are personnel contracted to be available for agreed periods of time for firefighting purposes, but who may also have an alternative employment elsewhere.
There were 601 opt-outs from Pension Schemes in 2016/17, 94 per cent (563) were opt-outs from the 2015 Scheme. Of these 601 opt-outs, 253 (42 per cent) related to firefighters who had been re-enrolled to membership in accordance with auto-enrolment requirements, 187 (31 per cent) related to new recruits who elected not to join, and 161 (27 per cent) related to scheme members who opted out and became entitled to a deferred pension.
Further information on fire pension scheme membership can be found in fire data tables 1304 and 1305.
18
7 Further information
Guidance for using these statistics and other fire statistics publications can be found on or via
the fire statistics collection page
www.gov.uk/government/collections/fire-statistics
This publication is accompanied by reference data tables. All the fire statistics tables can be
found at
www.gov.uk/government/statistical-data-sets/fire-statistics-data-tables
Improving workforce statistics
If you have any comments on any of the statistics or presentation in this release, especially
on the Experimental Statistics on diversity please contact us on Email:
The information published in this release is kept under review, taking into account the needs
of users, burdens on suppliers and producers, in line with the Code of Practice for Official
Statistics. If you have any comments, suggestions or enquiries, please contact the team via
email using [email protected] or via the user feedback form on the fire
statistics collection page.
Media enquiries via Home Office news desk:
Office hours: 020 7035 3535; 7am-8pm Monday-Friday
Out of hours: 07659 174240
Statistical or public enquiries:
The responsible statistician for this publication is Deborah Lader.
To contact the Fire Statistics team:
Email: [email protected]
ISBN: 978-1-78655-428-4
ISSN: 1759-7005
© Crown copyright 2018
This publication is licensed under the terms of the Open Government Licence v3.0
except where otherwise stated. To view this licence, visit
nationalarchives.gov.uk/doc/open-government-licence/version/3 or write to the
Information Policy Team, The National Archives, Kew, London TW9 4DU, or email:
Where we have identified any third party copyright information you will need to obtain
permission from the copyright holders concerned.
This statistical bulletin is produced to the highest professional standards and is free from political interference. It has been produced by statisticians working in the Home Office Analysis and Insight Directorate in accordance with the Home Office’s statement of compliance with the Code of Practice for Official Statistics, which covers Home Office policy on revisions and other matters. The Chief Statistician, as Head of Profession, reports to the National Statistician with respect to all professional statistical matters and oversees all Home Office National Statistics products with respect to the Code, being responsible for their timing, content and methodology.
Recommended


![Cap. 173] Pensions CHAPTER 173. PENSIONS. 173.pdf · Pensions, etc., to cease on bankruptcy. 14. Pensions, etc., may cease on sentence to term of imprisonment. 15. Pensions, etc.,](https://img.pdfslide.net/doc/110x75/5f32c41fe2aa25713c052446/cap-173-pensions-chapter-173-173pdf-pensions-etc-to-cease-on-bankruptcy.jpg)