Antonio Galán Penalva
Fire Safety Consultant
February 2016
Fire Statistics
Fire statistics
Page | 1
1. Aim and previous considerations …………………………………………………………………………… 2
2. Fire Statistics in Spain .…………………………………………………………………………………………... 3
3. Comparison fire statistics data of Spain and Europe …………………………………..………….. 10
4. Comparison fire statistics data of Spain and Europe, with the rest of the world ……… 13
5. Conclusions .………………………………….………………………………………………………………………. 16
6. Bibliography ..………………………………………………………………………………………………………… 17
7. Information concerning to the author…………………………………………………………………….. 17
Fire statistics
Page | 2
The purpose of this document is to collect in a summarized way the main results of fire
statistics recently published by different entities, both national and international.
Furthermore, an objective analysis of these results is performed and the most obvious
conclusions are showed.
In order to have a better understanding of the data that are displayed in the following sections
(Fire Statistics in Spain), previously it is important to take into account the following
considerations that are showed in the Study of Victims of Fire in Spain 2014 (APTB and Mapfre
Foundation):
- They have been recorded as killed in fire or explosion to all those who have died in the
fire place.
- They have also had this same consideration as those to which the study authors were
able to track and died after being hospitalized as a direct result of the incident
occurred.
- They have not taken into account those injured or killed in fire and/or explosion in
vehicles when the cause of death was the accident itself.
- They have not taken into account the victims of explosions of fireworks intentionally
manipulated in popular celebrations, or victims of voluntary exposure to fire,
firecrackers, etc.
- They not considered as fire victims the deaths that have been classified as suicides by
explosions, through the use of fire or of any other type of combustion.
- Finally, they have not been considered victims of the fire caused by intentioned fire or
explosions for the purpose of committing a murder or hide a violent death.
This document is only informative and compiles the information in the studies indicated in the
bibliography.
1. Aim and previous considerations
Fire statistics
Page | 3
Statistical data for Spain have been taken from "Estudio de Victimas de Incendios en España
2014”," published by the Mapfre Foundation and APTB in December 2015. Below, the most
relevant results are displayed.
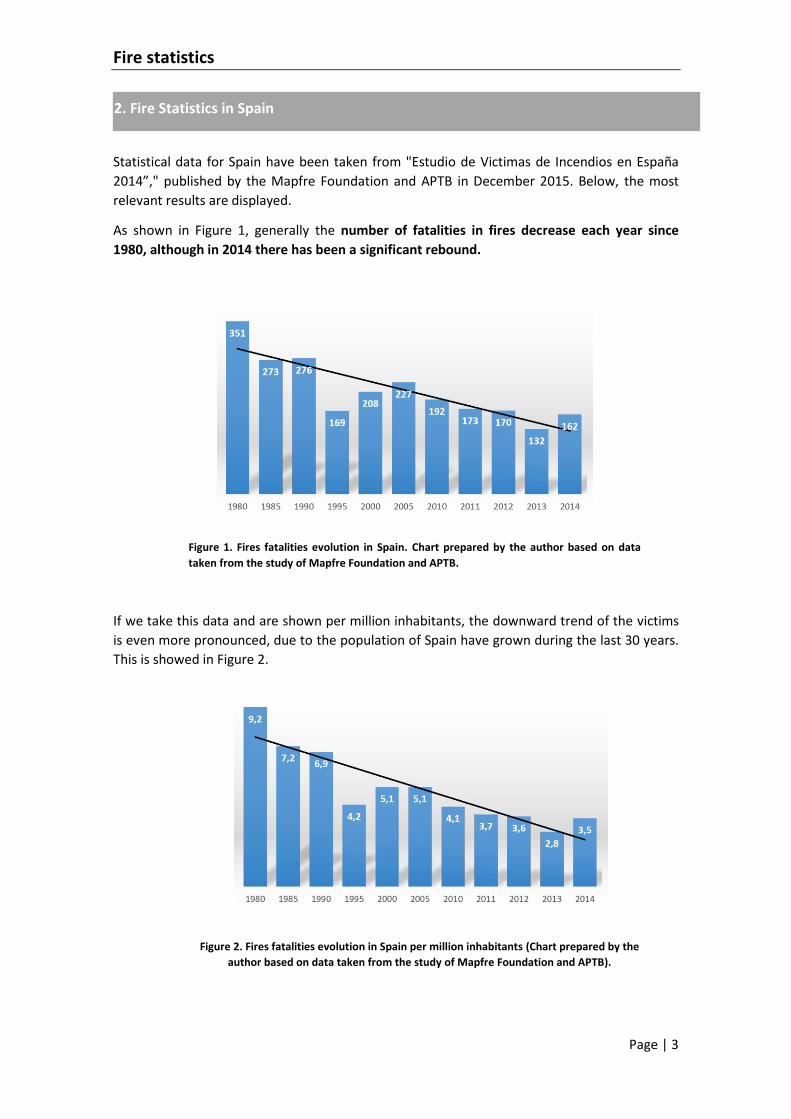
As shown in Figure 1, generally the number of fatalities in fires decrease each year since
1980, although in 2014 there has been a significant rebound.
Figure 1. Fires fatalities evolution in Spain. Chart prepared by the author based on data
taken from the study of Mapfre Foundation and APTB.
If we take this data and are shown per million inhabitants, the downward trend of the victims
is even more pronounced, due to the population of Spain have grown during the last 30 years.
This is showed in Figure 2.
Figure 2. Fires fatalities evolution in Spain per million inhabitants (Chart prepared by the
author based on data taken from the study of Mapfre Foundation and APTB).
2. Fire Statistics in Spain
Fire statistics
Page | 4
Despite the increase of victims occurred in 2014, the data continue to show us that Spain has
one of the lowest rates of victims. Even so, it must continue to work to reduce these numbers.
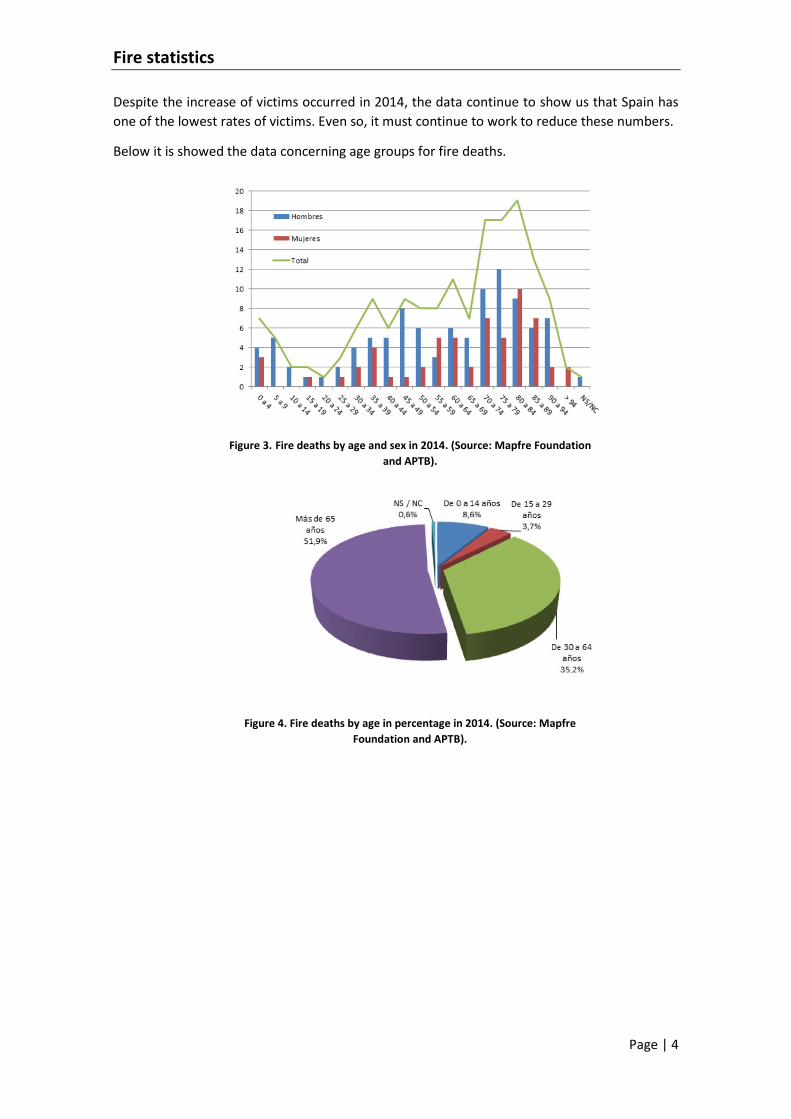
Below it is showed the data concerning age groups for fire deaths.
Figure 3. Fire deaths by age and sex in 2014. (Source: Mapfre Foundation
and APTB).
Figure 4. Fire deaths by age in percentage in 2014. (Source: Mapfre
Foundation and APTB).
Fire statistics
Page | 5
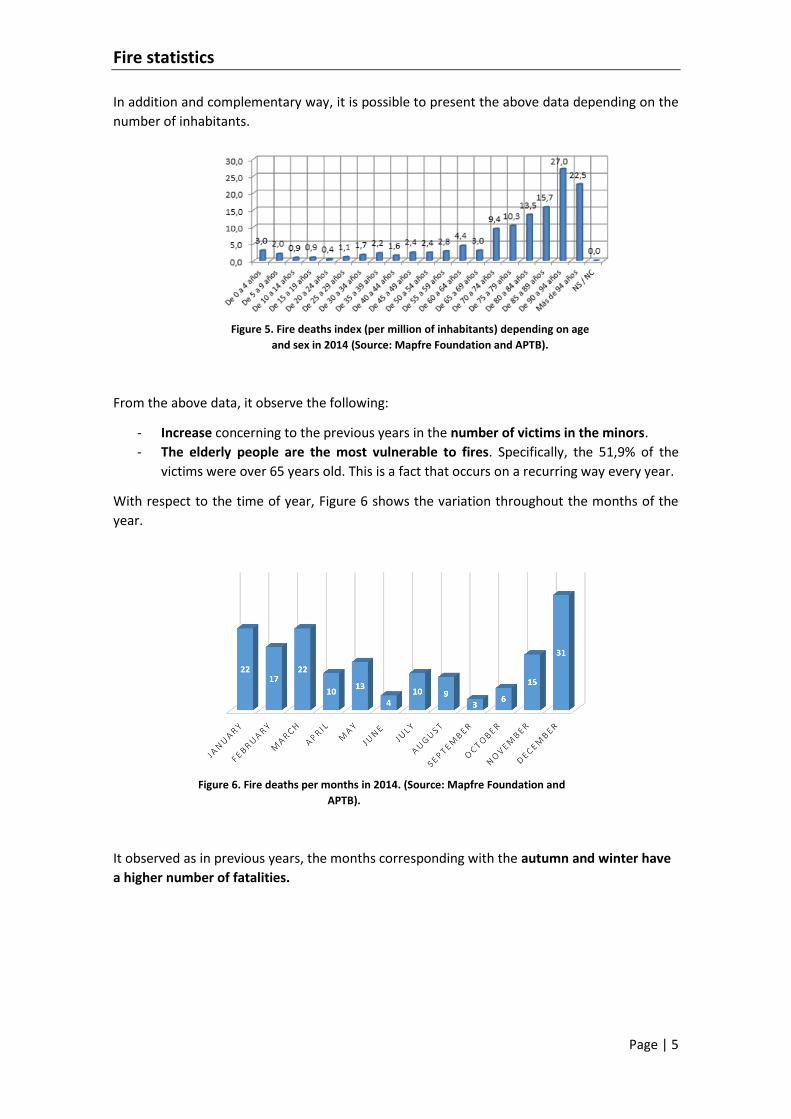
In addition and complementary way, it is possible to present the above data depending on the
number of inhabitants.
Figure 5. Fire deaths index (per million of inhabitants) depending on age
and sex in 2014 (Source: Mapfre Foundation and APTB).
From the above data, it observe the following:
- Increase concerning to the previous years in the number of victims in the minors.
- The elderly people are the most vulnerable to fires. Specifically, the 51,9% of the
victims were over 65 years old. This is a fact that occurs on a recurring way every year.
With respect to the time of year, Figure 6 shows the variation throughout the months of the
year.
Figure 6. Fire deaths per months in 2014. (Source: Mapfre Foundation and
APTB).
It observed as in previous years, the months corresponding with the autumn and winter have
a higher number of fatalities.
Fire statistics
Page | 6
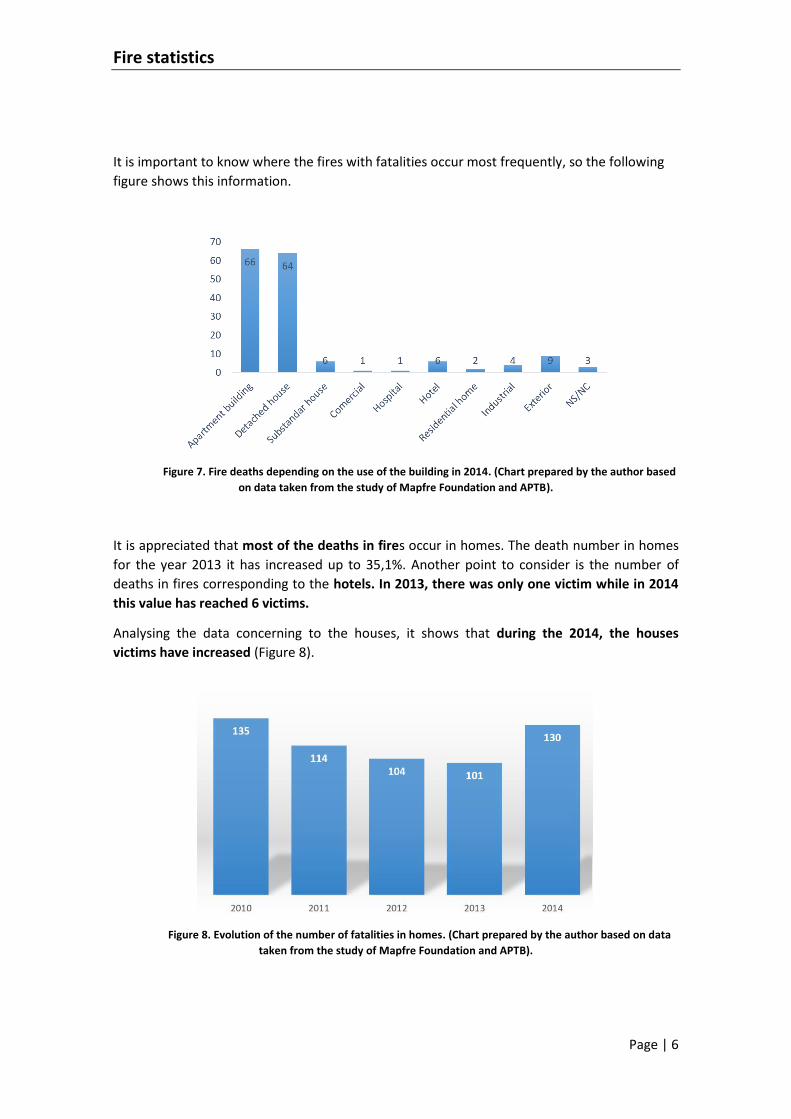
It is important to know where the fires with fatalities occur most frequently, so the following
figure shows this information.
Figure 7. Fire deaths depending on the use of the building in 2014. (Chart prepared by the author based
on data taken from the study of Mapfre Foundation and APTB).
It is appreciated that most of the deaths in fires occur in homes. The death number in homes
for the year 2013 it has increased up to 35,1%. Another point to consider is the number of
deaths in fires corresponding to the hotels. In 2013, there was only one victim while in 2014
this value has reached 6 victims.
Analysing the data concerning to the houses, it shows that during the 2014, the houses
victims have increased (Figure 8).
Figure 8. Evolution of the number of fatalities in homes. (Chart prepared by the author based on data
taken from the study of Mapfre Foundation and APTB).

Fire statistics
Page | 7
Although the number of victims in 2014 was high, if we take these data per million inhabitants,
the resulting rate really low (Figure 9).
Figure 9. Evolution of the number of fatalities in homes per million of inhabitants. (Chart prepared by
the author based on data taken from the study of Mapfre Foundation and APTB).
Concerning to the height of the house where the largest number of casualties occurs, the 1st
floor is where it has a higher mortality (Figure 10).
Figure 10. Number of fatalities in houses depending on number of storey of the building. (Chart
prepared by the author based on data taken from the study of Mapfre Foundation and APTB).
However, it had to keep in mind that the first 3 storeys have a higher incidence higher storeys
because Spain has a greater number of homes located on the lower storeys.
Fire statistics
Page | 8
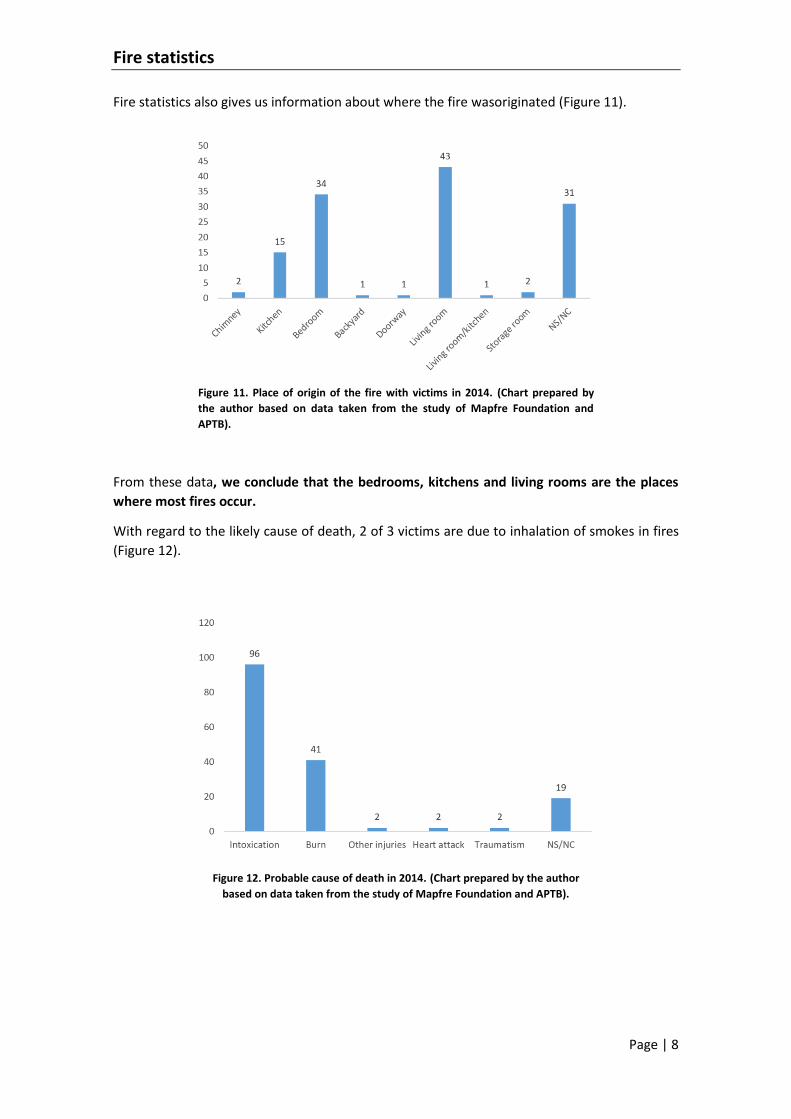
Fire statistics also gives us information about where the fire wasoriginated (Figure 11).
Figure 11. Place of origin of the fire with victims in 2014. (Chart prepared by
the author based on data taken from the study of Mapfre Foundation and
APTB).
From these data, we conclude that the bedrooms, kitchens and living rooms are the places
where most fires occur.
With regard to the likely cause of death, 2 of 3 victims are due to inhalation of smokes in fires
(Figure 12).
Figure 12. Probable cause of death in 2014. (Chart prepared by the author
based on data taken from the study of Mapfre Foundation and APTB).
Fire statistics
Page | 9
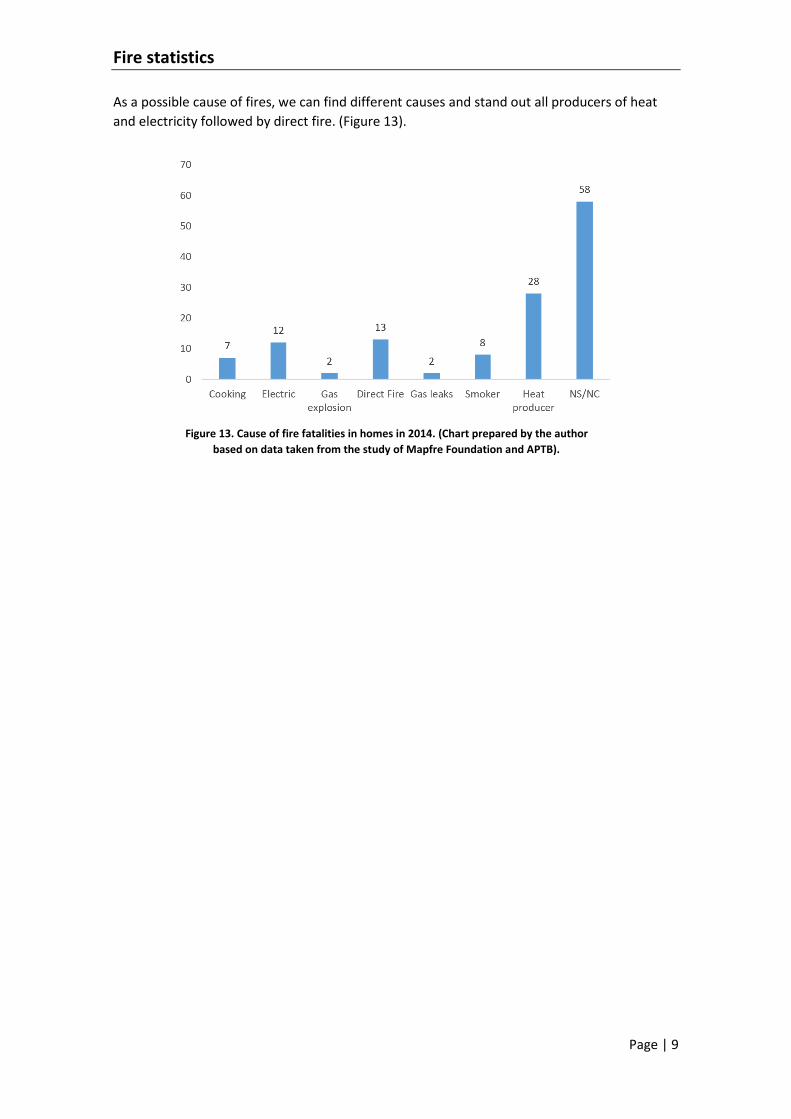
As a possible cause of fires, we can find different causes and stand out all producers of heat
and electricity followed by direct fire. (Figure 13).
Figure 13. Cause of fire fatalities in homes in 2014. (Chart prepared by the author
based on data taken from the study of Mapfre Foundation and APTB).
Fire statistics
Page | 10
This section will be shown the situation of Spain with respect to other European countries, and
its relationship to the number of casualties in fires. The analysis is divided into two parts.
- The period included between 1979 and 2007
- The period included between 2008 and 2010
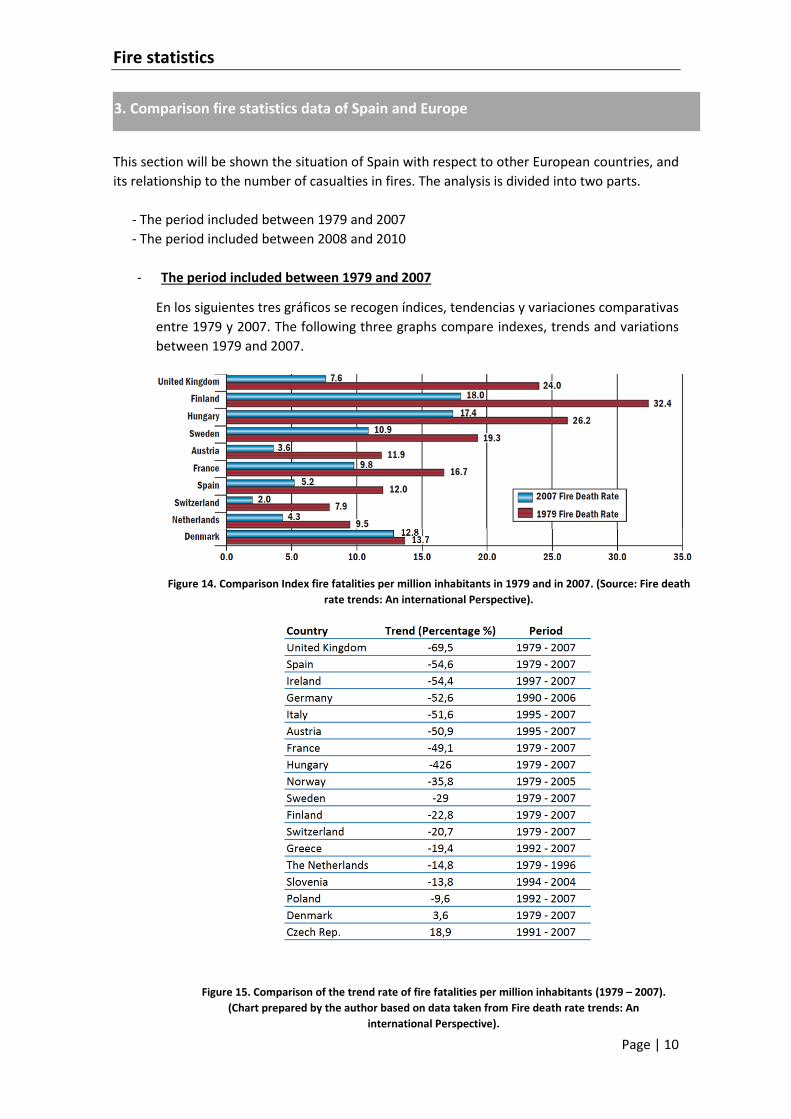
- The period included between 1979 and 2007
En los siguientes tres gráficos se recogen índices, tendencias y variaciones comparativas
entre 1979 y 2007. The following three graphs compare indexes, trends and variations
between 1979 and 2007.
Figure 14. Comparison Index fire fatalities per million inhabitants in 1979 and in 2007. (Source: Fire death
rate trends: An international Perspective).
Figure 15. Comparison of the trend rate of fire fatalities per million inhabitants (1979 – 2007).
(Chart prepared by the author based on data taken from Fire death rate trends: An
international Perspective).
3. Comparison fire statistics data of Spain and Europe
Fire statistics
Page | 11
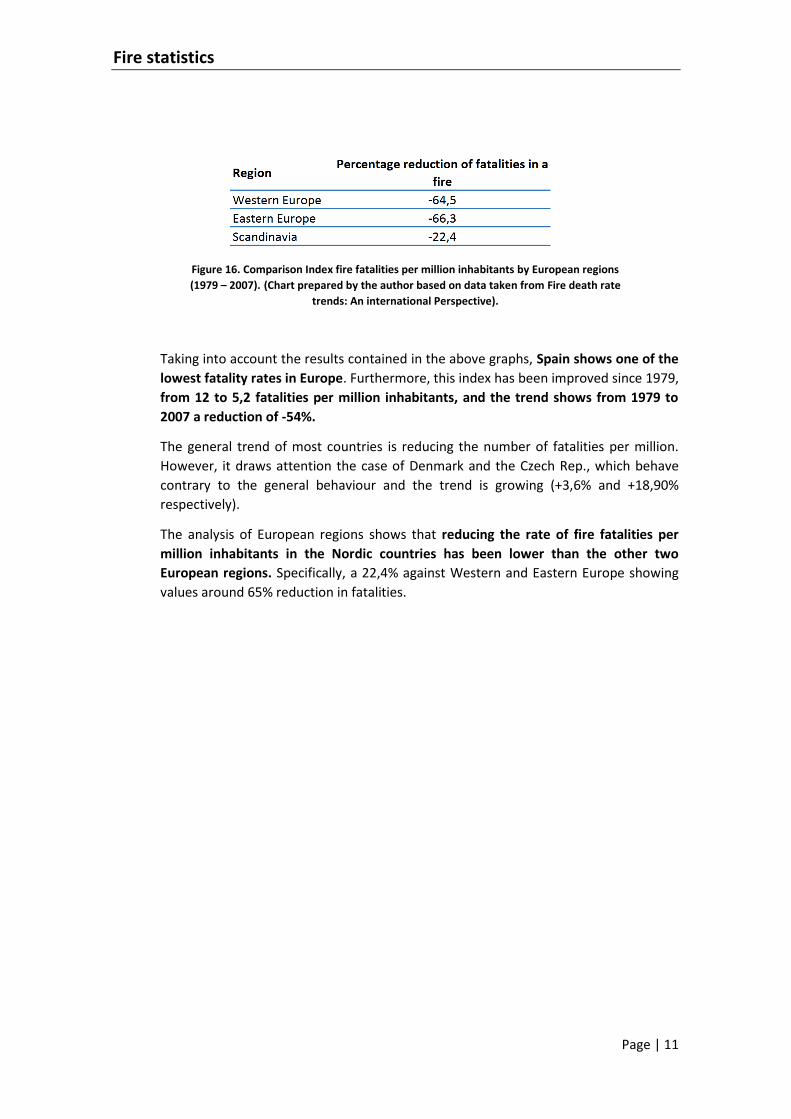
Figure 16. Comparison Index fire fatalities per million inhabitants by European regions
(1979 – 2007). (Chart prepared by the author based on data taken from Fire death rate
trends: An international Perspective).
Taking into account the results contained in the above graphs, Spain shows one of the
lowest fatality rates in Europe. Furthermore, this index has been improved since 1979,
from 12 to 5,2 fatalities per million inhabitants, and the trend shows from 1979 to
2007 a reduction of -54%.
The general trend of most countries is reducing the number of fatalities per million.
However, it draws attention the case of Denmark and the Czech Rep., which behave
contrary to the general behaviour and the trend is growing (+3,6% and +18,90%
respectively).
The analysis of European regions shows that reducing the rate of fire fatalities per
million inhabitants in the Nordic countries has been lower than the other two
European regions. Specifically, a 22,4% against Western and Eastern Europe showing
values around 65% reduction in fatalities.
Fire statistics
Page | 12
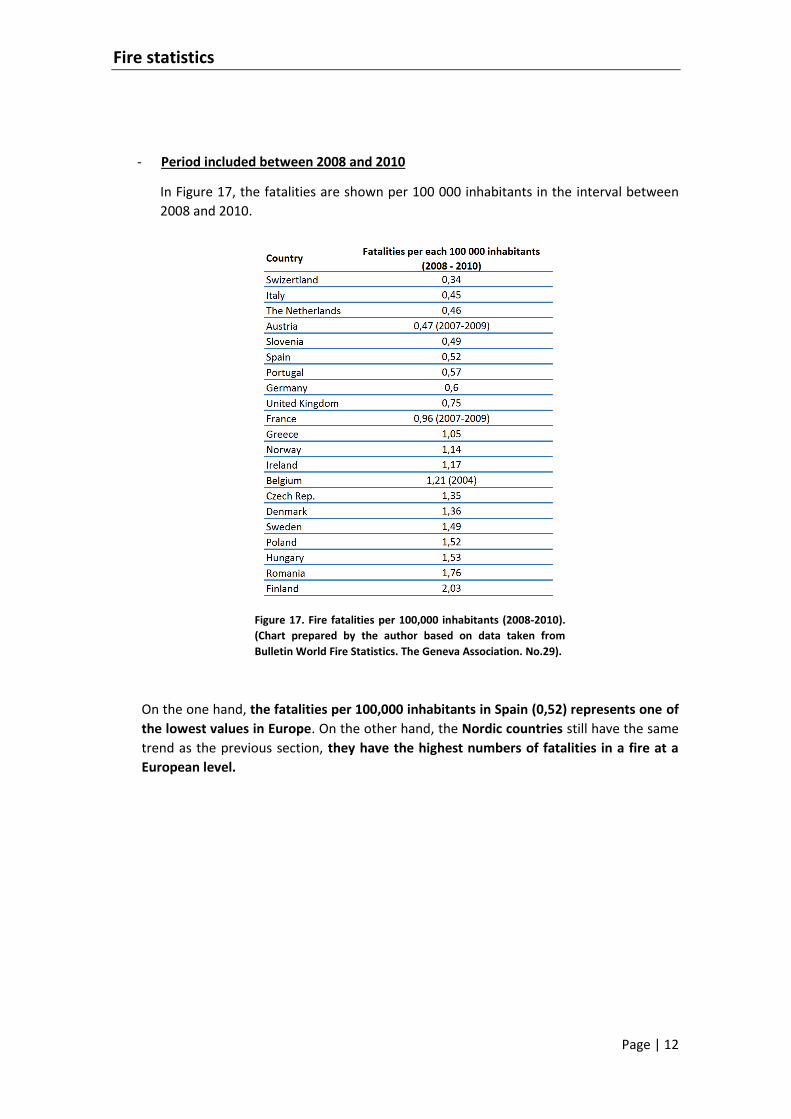
- Period included between 2008 and 2010
In Figure 17, the fatalities are shown per 100 000 inhabitants in the interval between
2008 and 2010.
Figure 17. Fire fatalities per 100,000 inhabitants (2008-2010).
(Chart prepared by the author based on data taken from
Bulletin World Fire Statistics. The Geneva Association. No.29).
On the one hand, the fatalities per 100,000 inhabitants in Spain (0,52) represents one of
the lowest values in Europe. On the other hand, the Nordic countries still have the same
trend as the previous section, they have the highest numbers of fatalities in a fire at a
European level.
Fire statistics
Page | 13
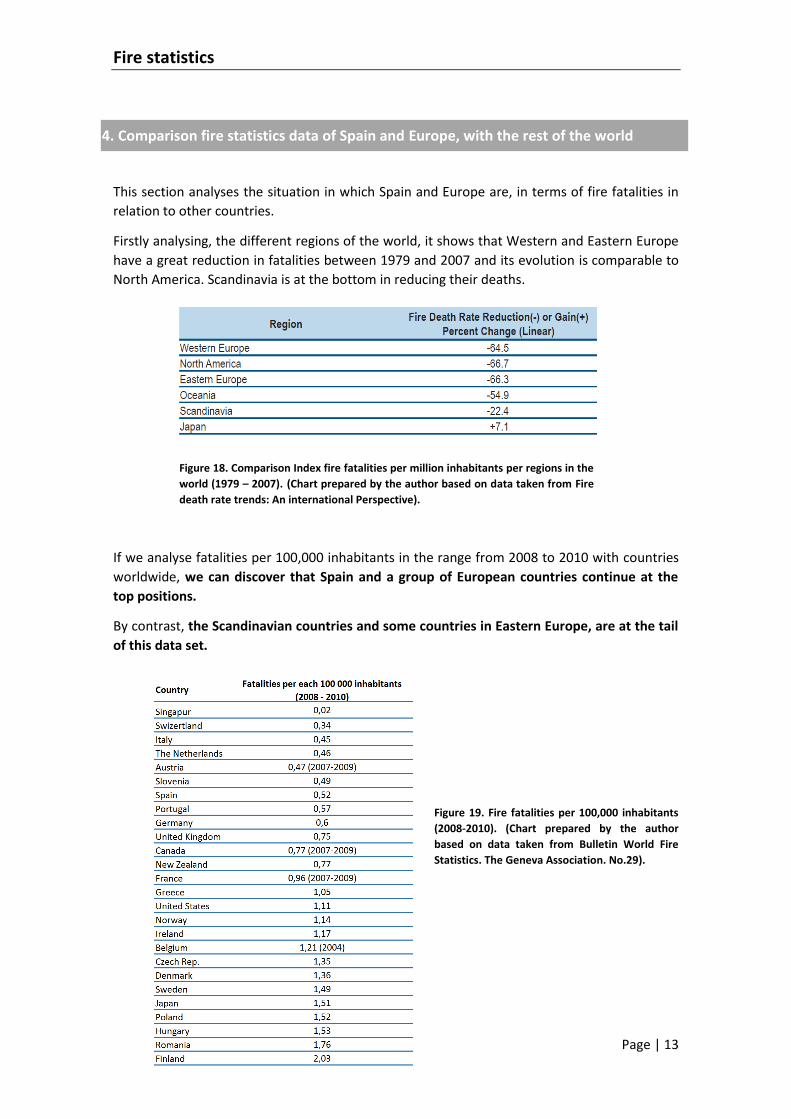
This section analyses the situation in which Spain and Europe are, in terms of fire fatalities in
relation to other countries.
Firstly analysing, the different regions of the world, it shows that Western and Eastern Europe
have a great reduction in fatalities between 1979 and 2007 and its evolution is comparable to
North America. Scandinavia is at the bottom in reducing their deaths.
Figure 18. Comparison Index fire fatalities per million inhabitants per regions in the
world (1979 – 2007). (Chart prepared by the author based on data taken from Fire
death rate trends: An international Perspective).
If we analyse fatalities per 100,000 inhabitants in the range from 2008 to 2010 with countries
worldwide, we can discover that Spain and a group of European countries continue at the
top positions.
By contrast, the Scandinavian countries and some countries in Eastern Europe, are at the tail
of this data set.
Figure 19. Fire fatalities per 100,000 inhabitants
(2008-2010). (Chart prepared by the author
based on data taken from Bulletin World Fire
Statistics. The Geneva Association. No.29).
4. Comparison fire statistics data of Spain and Europe, with the rest of the world
Fire statistics
Page | 14
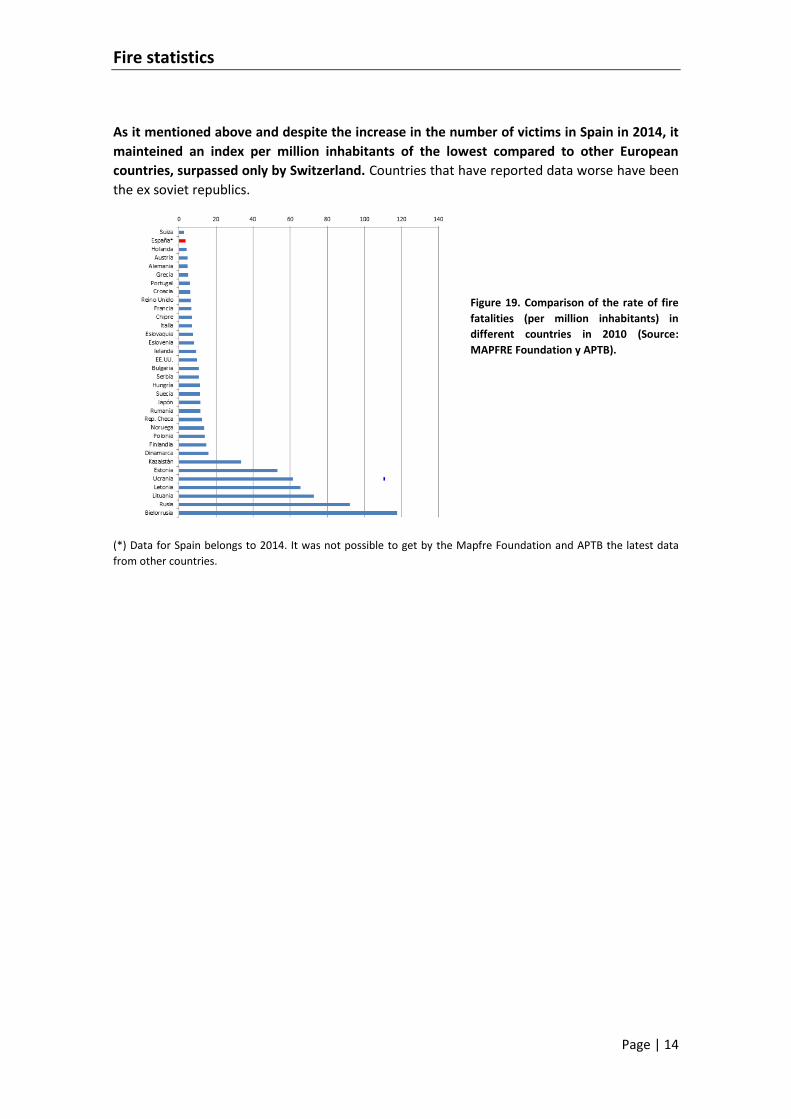
As it mentioned above and despite the increase in the number of victims in Spain in 2014, it
mainteined an index per million inhabitants of the lowest compared to other European
countries, surpassed only by Switzerland. Countries that have reported data worse have been
the ex soviet republics.
Figure 19. Comparison of the rate of fire
fatalities (per million inhabitants) in
different countries in 2010 (Source:
MAPFRE Foundation y APTB).
(*) Data for Spain belongs to 2014. It was not possible to get by the Mapfre Foundation and APTB the latest data
from other countries.
Fire statistics
Page | 15
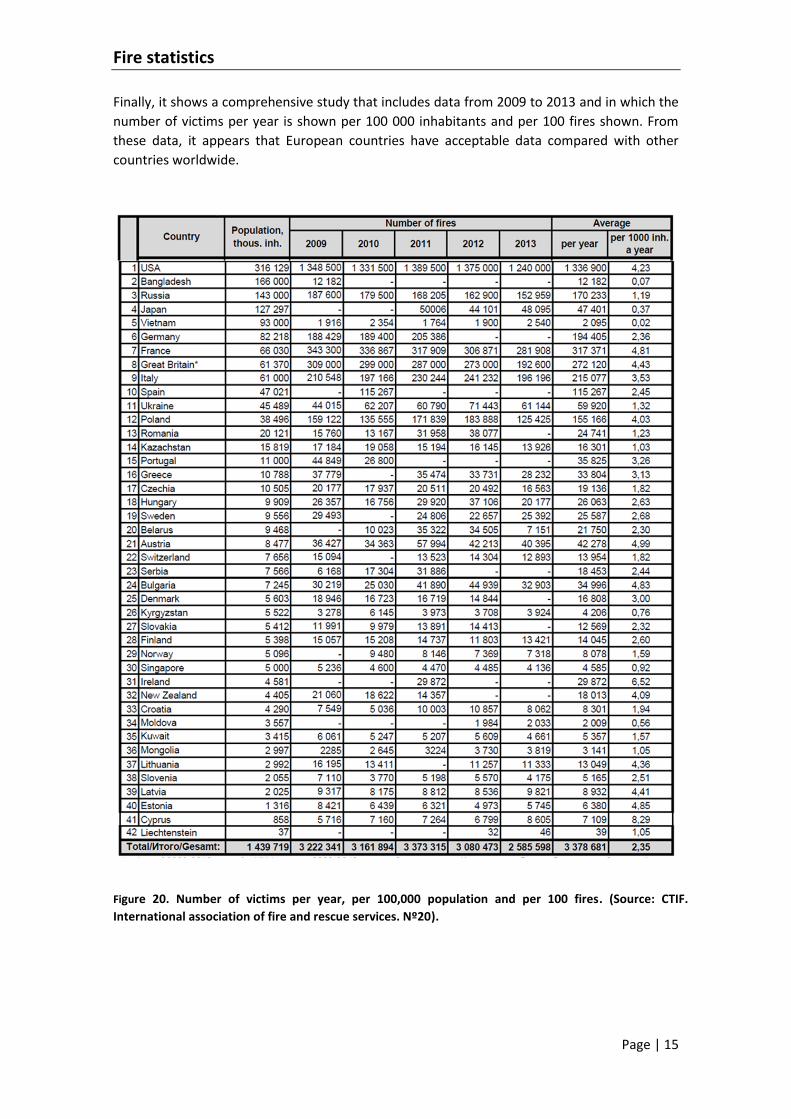
Finally, it shows a comprehensive study that includes data from 2009 to 2013 and in which the
number of victims per year is shown per 100 000 inhabitants and per 100 fires shown. From
these data, it appears that European countries have acceptable data compared with other
countries worldwide.
Figure 20. Number of victims per year, per 100,000 population and per 100 fires. (Source: CTIF.
International association of fire and rescue services. Nº20).
Fire statistics
Page | 16
The conclusions of this study can be grouped at national, european and global level:
National level:
Most fire fatalities occur in the coldest months of the year
The people with an age higher than 65 years old are still the most vulnerable age
segment in case of fire. In addition, in 2014 there has been an increase in mortality in
children.
Deaths in buildings represent for almost 80% of all deaths.
The causes that have caused more deaths in residential fires are mainly heat
producing devices. Other common causes include electricity, cooking and smoking.
The main cause of death in case of fire is intoxication, specifically 2 of each 3
fatalities.
European level:
Since 1979, Spain has been one of the countries in which most has reduced fatalities
in fires.
The Nordic countries have the highest number of fatalities in fires.
Worlwide level:
The rate of victims per million inhabitants in Spain in 2014 is 3,48. This value
represents one of the lowest in the world.
The rate of fire per million inhabitants in Spain is at the lowest figures, overcame
only by Switzerland.
Victims show that European countries are relatively low compared to other countries.
5. Conclusions
Fire statistics
Page | 17
Estudio de víctimas de incendios en España 2014. Mapfre Foundation and APTB.
December 2015.
Fire death rate trends: An international Perspective. Volume 12, Issue 8/July 2011.
U.S Department of Homeland Security – U.S. Fire Administration.
Bulletin World Fire Statistics. The Geneva Association. No.29, April 2014.
CTIF. International association of fire and rescue services. Nº20. 2015.
Antonio has the Bachelor of Chemistry (Univ. Alcalá de Henares), Postgraduate as Loss Adjuster(Univ. Barcelona and INESE) and Fire Safety: Technical Cycle (CFPA-Europe and Cepreven).
In addition and complementary to previous training, he studied the course "Inspection and Evaluation of Multi-risks in Industries" and the NFPA modular seminar which included the following standards:
- NFPA 13, Installation of Sprinkler Systems.
- NFPA 20, Installation of Stationary Pumps for Fire Protection.
- NFPA 25, Inspection, Testing, and Maintenance of Water-Based Fire Protection
Systems
Currently, Antonio provides consulting services regarding to fire safety, specialized in reaction to fire.
Furthermore, he is Chairman of the national subcommittee on standardization of fire safety(Reaction to fire) (CTN-23-SC6), member of the national subcommittee on standardization of fire safety engineering (CTN-23-SC8), assists to the meetings of the CEN/TC 127 "Fire Safety in Buildings" and collaborates with Cepreven in the development and participation as lecturer in courses on passive protection.
For 9 years, he has developed his professional career in the field of fire safety (Laboratory of Reaction to Fire (Protection Passive Fire)), being remarkable the position of Technical Director of Laboratory and lecturer of the Master in Engineering Protection Fire at the University of Comillas and Professionals fire protection engineering (APICI).
6. Bibliography
7. Information concerning to the author
Recommended