Univers
ity of
Cap
e Tow
n
LINEAR LIBRARY c 1 0088 3930
Ill II~ Ill ~ I Flow-Injection Analysis of the Platinum-Group Metals
A Thesis Presented for the Degree of
DOCTOR OF PHILOSOPHY
in the Department of CHEMISTRY
UNIVERSITY OF CAPE TOWN
February 1995
by
DEREKAUER
;
; t'' ·, ~. < ~
; 'E - .. ,. • ~ > • • •• • •
. . -:·:. ~ ~· ,.·,;·,. ;~;!(:;:;''_(.dO:- . 1
_ji

Univers
ity of
Cap
e Tow
n
The copyright of this thesis vests in the author. No quotation from it or information derived from it is to be published without full acknowledgement of the source. The thesis is to be used for private study or non-commercial research purposes only.
Published by the University of Cape Town (UCT) in terms of the non-exclusive license granted to UCT by the author.
Flow-Injection Analysis of the Platinum-Group Metals
/ I
DerekAuer
/
0\G\T\SED
1 0 AUG i.u1i.

Flow-Injection Analysis of the Platinum-Group Metals
by
Derek Auer
Supervisor: Associate Professor Klaus R. Koch,
Department of Chemistry, University of Cape Town,
South Africa.
Flow-Injection Analysis of the Platinum-Group Metals
by
DerekAuer
Process Analytical Science Group, Analytical Science Division,
Council for Mineral Technology, Randburg, Republic of South Africa
February 1995
ABSTRACT
To date the principle methods for the determination of the platinum-group metals (PGMs)
use an "off-line" assay with flame-atomic absorption spectrometry and visible spectrometry.
Both suffer numerous interferences and involve time-consuming and arduous laboratory
separation methods prior to analysis. An "on-line" method for the rapid assay of the PGMs is
indeed a lacking component in the analysts' repertoire of methods.
This study describes the development of spectrophotometric methods for the
determination of the PGMs using flow-injection analysis (FIA). The principle of exploiting the
remarkably specific and selective reaction of stannous halides with the PGMs to yield a series of
intensely coloured complexes in acidic solutions forms the basis of these methods. The reaction
is subject to relatively few interferences from other transition metals.
A high speed scanning spectrophotometer is employed to obtain second order data. The
successful manipulation of the data enables the determination of PGMs as single components
and also simultaneously in mixtures. Attention is focused on the establishment of principles for
successful multi-component analysis of PGMs. The development of a software program for
multi-wavelength data manipulation was mandatory and is described. Criteria for successful
selection of analytical wavelengths are discussed.
The usefulness of multi-dimensional graphical data representation is demonstrated in a
stop-flow study of the palladium reaction with tin(II) chloride. Qualitative information is
provided regarding the nature of complexes and their interactions. Correlation of
spectrophotometric data with complex solution colour changes is made. The requirements for
future progress in multi-component FIA determinations as well as the direction for future
research conclude the study.
Flow-Injection Analysis of the Platinum-Group Metals
Table of Contents
Abstract
Table of Contents
List of Figures
List of Tables
. . . . . . . . . . . . . . . . . . . . . . . . . . . . ~ ......................... .
Acknow Iedgements
1 Introduction
ii
Vlll
XIV
XVl
1
1.1 Determination of the Platinum-Group Metals . . . . . . . . . . . . . . . . . . . . 5
1.2
1.3
1.4
1.5
1.6
1.7
1.8
The Platinum-Tin(II) Chloride Complex
The Palladium-Tin(II) Chloride Complex
The Rhodium-Tin(II) Chloride Complex
Tin(II) Bromide Complexes
Flow-Injection Analysis
Objectives of Research
References
10
14
17
20
22
31
33
2 Theory . . . . . . . . . . . . . . . . . . . . . . . . . . . . . . . . . . . . . . . . . . . . . . . . . . 39
2.1 Analytical Visible Spectrophotometry . . . . . . . . . . . . . . . . . . . . . 39
2.1.1 Absorption of Radiation
2.1.2 Absorption Laws
2.1.3
2.1.4
Deviations from Beer's Law ......................... .
Spectrophotometric Detectors
ll
40
43
46
48
2.2
Flow-Injection Analysis of the Platinum-Group Metals
Quantitation of Spectrophotometry 52
2.2.1 Single Component Analysis (SCA) ... ; . . . . . . . . . . . . . . . . . . 54
2.2.2 Multi-Component Analysis (MCA) . . . . . . . . . . . . . . . . . . . . . . . 57
2.2.3 Multi-Wavelength Linear Regression Analysis (MLRA) . . . . . . 65
2.2.4 Wavelength Selection 69
2.3 Principles of Flow-Injection Analysis . . . . . . . . . . . . . . . . . . . . . . . . . . 70
2.4
2.3.1 Dispersion and Mixing Processes ...................... .
2.3.1.1
2.3.1.2
2.3.1.3
2.3.1.4
Convection (Laminar flow)
Secondary Flow
Molecular Diffusion
Turbulent (chaotic) Flow
2.3.2 The Dispersion Coefficient
2.3.3 A Novel Non-equilibrium Environment ................... .
2.3.4 Manifold Design Criteria
References
71
71
72
73
74
75
78
78
80
3 Data Acquisition and Analysis . . . . . . . . . . . . . . . . . . . . . . . . . . . . . . . . . 81
3.1
3.2
Automation and Control
3.1.1 Objectives of Automation
3.1.2 Computer-Aided Flow Analysis
Microcomputer Software Development
3.2.1 Microcomputers and Accessories
3.2.2 Meeting the Challenge of the Graphical User Interface ....... .
3.2.3 Program Structure and Design
82
82
83
86
87
87
.90
3.2.4 Data Storage . . . . . . . . . . . . . . . . . . . . . . . . . . . . . . . . . . . . . . . 96
lll
3.3
3.4
3.5
3.6
Flow-Injection Analysis of the Platinum-Group Metals
3.2.5 Software Performance and Validation
Experimental Procedure
Programming Language Remarks
Conclusions
References
98
. 98
100
101
102
4 Flow-Injection Analyis Manifold Design and Optimisation . . . . . . . . 103
4.1 Preliminary Manifold Design Investigations . . . . . . . . . . . . . . . . . . . . . 104
4.1.1 Spectrophotometer Flowcell . . . . . . . . . . . . . . . . . . . . . . . . . . . 106
4.1.2 Manifold Configuration . . . . . . . . . . . . . . . . . . . . . . . . . . . . . . . 107
4.2
4.3
4.4
4.1.3 Ultra-Violet Spectrophotometric Detection
4.1.4 Peak Height or Peak Area Measurement?
4.1.5 Spectra FOCUSTM Data Acquisition
Optimisation of the FIA Manifold
4.2.1 Sample Injection Volume
4.2.2 Reaction Coil Length
............................
4.2.3 Reagent and Carrier Flow Rate
4.2.4 Reagent and Carrier Concentrations
4.2.5 Sample Acid Concentration
Conclusions
References ........................................... ~ ..
IV
107
108
108
110
112
114
116
119
126
126
128
Flow~lnjection Analysis of the Platinum-Group Metals
5 Single Component Analysis of the Platinum-Group Metals . . . . . . . . 129
5.1 The Determination of Platinum . . . . . . . . . . . . . . . . . . . . . . . . . . . . . 130
5.2
5.3
5.4
5.5
5.6
5.1.1 The Effect of the Platinum Oxidation State 130
5.1.2 Visible Spectra of the Platinum-Tin(II) Chloride Complexes . . . 131
5.1.3 Calibration
5.1.4 Analysis of Synthetic Solutions
5.1.5 Analytical Features and Performance
The Determination of Palladium
134
135
138
139
5.2.1 Stopped-Flow Investigation . . . . . . . . . . . . . . . . . . . . . . . . . . 139
5.2.2 Visible Spectra of the Palladium-Tin(II) Chloride Complexes . . . 148
5.2.3 Calibration . . . . . . . . . . . . . . . . . . . . . . . . . . . . . . . . . . . . . . . . 150
5.2.4 Analysis of Synthetic Solutions
5.2.5 Analytical Features and Performance
The Determination of Rhodium
151
152
153
5.3.1 Visible Spectra of the Rhodium-Tin(II) Bromide Complexes . . . 153
5.3.2 Calibration . . . . . . . . . . . . . . . . . . . . . . . . . . . . . . . . . . . . . . . . 155
5.3.3 Analysis of Synthetic Solutions
5.3.4 Analytical Features and Performance
Preliminary Interference Study
5.4.1 Base Metal Interferences
157
157
158
159
5.4.2 Interferences from other Platinum-Group Metals . . . . . . . . . . . 161
Conclusions
References
v
162
163
6
Flow-Injection Analysis of the Platinum-Group Metals
Multi-Component Analysis of the Platinum-Group Metals 164
6.1 The Determination of Platinum and Palladium in HCl......... . . . . . . 165
6.1.1 Wavelength Selection
6.1.2 Multi-Component Analysis
Classical Simultaneous Linear Equations
Sequential Analyte Determination
165
169
169
170
6.1.2.1
6.1.2.2
6.1.2.3
6.1.2.4
Multi-Wavelength Linear Regression Analysis . . 171
Reference Determination
6.1.3 Calibration
6.1.4 Analysis of Synthetic Solutions
6.1.5 Analytical Features and Performance
6.1.6 Base Metal Interference Study
171
173
173
175
176
6.2 The Determination of Platinum and Ruthenium in HCI . . . . . . . . . . . . . 177
6.2.1 Visible Spectra of the Ruthenium-Tin(II) Chloride Complexes . . 177
6.2.2 Calibration
6.2.3 Analysis of Synthetic Solutions
6.2.4 Analytical Features and Performance
6.3 The Determination of Platinum in the Presence of Other
Platinum-Group Metals in HCI
6.3.1 The Determination of Platinum in the Presence of Iridium
178
180
181
181
182
6.3.2 The Determination of Platinum in the Presence of Rhodium 184
6.4 The Potential of Multi-Component Analysis in HBr.. . . . . . . . . . . . . . . 185
6.5
6.6
6.7
Future Work
Conclusions
References
vi
188
189
190
Flow-Injection Analysis of the Platinum-Group Metals
7 Summary . . . . . . . . . . . . . . . . . . . . . . . . . . . . . . . . . . . . . . . . . . . . . . . . . 191
8
7.1 Process Analytical Science . . . . . . . . . . . . . . . . . . . . . . . . . . . . . . . . . 191
7.2
7.3
7.4
7.5
7.6
Automated Data Acquisition and Device Control
The Determination of the Platinum-Group Metals by FIA ......... .
Visual Basic TM Software and Data Manipulation
Multi-Array Photometric Detectors in FIA
Closing Comments ....................................... .
Experimental
8.1 Chemicals, Reagents and Glassware
192
193
195
196
197
198
198
8.2 Atomic Absorption of Platinum . . . . . . . . . . . . . . . . . . . . . . . . . . . . . . . 200
8.3 Inductively Coupled Plasma-Atomic Emission Spectroscopy . . . . . . . . . 201
8.4 Potassium Iodate Oxidations . . . . . . . . . . . . . . . . . . . . . . . . . . . . . . . . . 203
8.5
8.6
FIA Apparatus and Sample Injection Technique
8.5.1
8.5.2
8.5.3
Peristalic Pumps
Injection Valves
Connectors and Tubing
8.5.4 Sample Injection Technique
References
204
204
204
205
205
207
Appendix 1 : Publications and Presentations 208
vii
1.1
1.2
1.3
1.4
1.5
1.6
Flow-Injection Analysis of the Platinum-Group Metals
List of Figures
Flow production chart for treatment of ores to the concentrate stage. Adapted
from Kirk-Othmer Encyclopaedia of Chemical Technology
The structural configuration of the unusual quinqueco-ordinate pentakis-
(trichlorostannato )platinum(II) anion
The proposed structural formula for the Pd-Sn anionic chloro-complex
A formulated structure for an anionic rhodium complex
Flow scheme (top) and concept (below) of analytical techniques based on
the injection of the sample analyte into a flowing carrier stream
Schematic of a single-line flow-injection analysis manifold with a chart
recorder to record the transient detector response
1.7 Schematic of a six-port rotary injection valve showing the "load" and "inject"
1.8
2.1
2.2
positions
Scheme of a two-line manifold (merging streams) with the characteristic
transient signal response obtained. See text for details
Simplified model for light absorption
Theoretical model for light absorption. Ex represent different electronic
transitions, S0 represents the ground electronic state and S1 the excited
electronic state. Vibration energy levels (vx) are shown - rotational and
translational levels being omitted for clarity
2.3 Attenuation of a beam of radiation by an absorbing solution. The fraction of the
incident radiation, 10, that is absorbed is a function of thickness, b (path length),
of the solution layer, and the concentration, c, of the absorbing species in the
4
12
15
19
24
25
26
29
41
42
light path 43
2.4 Typical deviations from Beer's Law. The curves refer to: (1) a positive
deviation, (2) a system that obeys the law, (3) negative deviation, and
( 4) deviation independant of concentration
2.5 Block diagram of a photoelectric effect-based detector
2.6 Rapid forward optical scanning detector. Adapted from Spectra FOCUS TM
Operators Manual, Spectra Physics, 1989, California, U.S.A.
viii
47
49
51
Flow-Injection Analysis of the Platinum-Group Metals
2. 7 The use of confirmation analysis, reference wavelengths, and wavelength
averaging across the absorption maximum to enhance the reliability of single
component analysis
2.8 Conventional multi-component analysis for a two component (X andY)
absorbing system using two wavelengths, A.1 and A.2
2.9 The effect of random measurement errors on quantitative results using the
simple classical multi-component calculation. Components X and Y have
56
58
distinctly different spectra 60
2.10 The effect of random measurement errors on quantitative results using the
simple classical multi-component calculation. Components X and Y have
very similar, overlapping spectra
2.11 The effect of random measurement errors on quantitative results using
61
multi-component analysis by a least-squares fit over a spectral range 62
2.12 A MLRA plot for a binary mixture of 40 11g.cm-3 Pt(IV) and 60 ~-tg.cm-3 Pd(II).
Each data point corresponds to a measurement at a wavelength in the range
368 to 484 nm at 4 nm intervals. Pt(IV) found, 39.5 ~-tg.cm-3, and Pd(II) found
59.9 1-tg.cm-3• The MLRA correlation is -0.991 and Match Factor 999.8
2.13 The absorption spectrum (•) and theoretical spectrum (-) for a binary mixture
of 40 ~-tg.cm -3 Pt(IV) and 60 11g.cm -3 Pd(II). Each data point in the absorption
67
spectrum corresponds to a measurement at a wavelength, Aj. 68
2.14 Isovelocity streamlines under laminar flow (convective transport) conditions
forming a parabolic flow velocity profile within a FIA manifold tube. 72
2.15 Secondary flow characteristics on laminar flow conditions caused by the
effect of a curved flow path 73
2.16 The effect of molecular diffusion within a FIA manifold tube on the injected
sample zone in the axial (top) and radial (bottom) directions
2.17 An originally homogenous sample zone (top right) disperses during its motion
through a reaction coil (top center). This changes the original square profile
(lower right) of concentration C0, to a profile (center) comprising a continuum
of concentrations with a maximum, Cmax
ix
74
76
Flow-Injection Analysis of the Platinum-Group Metals
3.1 External relay for devices without built-in TIL control logic. f>CB-relay
represents printed circuit board relay with a coil of 5V and 500Q; Device relay
represents a relay with coil matching the voltage requirements of the device; V+
represents a positive voltage requirement of the device; Gnd represents ground
connection, and 1/0 represents the input/output ports of the distribution board 84
3.2 Schematic representation of the FIA manifold comprising a peristaltic pump, P;
injection valve, IV; selection valve, SV; spectrophotometric detector, D; carrier
stream, C; reagent stream, R; and waste, W. The general-purpose 1/0 interface
card is housed within the computer and is linked to the detector and devices via
the distribution board, DB. Digital( ..... ) and analog signals(----) are shown 85
3.3 The Visual Basic TM graphical user interface showing the various parts of the
interface and their relationship with one another 89
3.4 Dendrogram of the ReduceTEK program showing the various menu options and
program functions
3.5 Processed standard spectra view in ReduceTEK, operating under Windows,
showing spectral data acquired and processed between 368 and 668 nm for
palladium standards (10 to 100 ~tg.cm-3). The various components of the
91
display screen have been annotated (viz. menu, button bar, program icons) 94
3.6 Typical multi-linear regression analysis (MLRA) screen view as depicted
during data processing of platinum-palladium mixtures in ReduceTEK 3.2. Each
window is interlinked and any change in one automatically updates the others 95
4.1
4.2
4.3
Schematic diagram of the merging stream flow-injection manifold
Absorbance response surface map for a 125 ~L sample of 100 ~g.cm·3 Pt(IV).
(FIA manifold as in Figure 4.1). Absorbance spectra of the reacted sample zone
are captured at 2 second intervals here by the SpectraFOCUS TM scanning
spectrophotometer
Absorbance response surface map for a 125 ~tL sample of 100 ~tg.cm·3 Pd(II)
on passage through the detector flowcell. (FIA manifold as in Figure 4.1). Note
the distinct spectral character of the absorbance spectra shown
X
104
105
109

Flow-Injection Analysis of the Platinum-Group Metals
4.4 The effect of changing the injected sample volume .. The profiles shown were
recorded for a 10 !J.g.cm·3 Pt(IV) solution at the absorbance maximum, 400 nm.
Larger sample volumes (not shown for clarity) did not increase the peak
4.5
height absorbance significantly
The effect of the reaction coil length, at a reagent concentration of 0.05 M
tin(II) chloride, on the response of : A, 20 !J.g.cm -3 Pd(II) at A = 400 nm; B,
10 !J.g.cm·3 Pt(IV) at A= 400nm; and C, 20 !J.g.cm·3 Pd(II) at A= 635 nm
4.6 Absorbance response surface map showing the effect of the flow rate on peaks
for a 10 !J.g.cm -3 Pt(IV) sample. The plot is composed of 8 peaks, observed at
113
115
400 nm, using different flow rates. There are 400 data points across each peak 117
4. 7 Contour plot of Figure 4.6 showing the effect of the flow rate on peaks for a
4.8
4.9
10 !J.g.cm -3 Pt(IV) sample. The change of the peak width with changing flow rate
is clearly seen in the contour plot
Absorbance response surface map on the FIA profile peaks fot a 10 !J.g.cm-3
Pt(IV) sample at 400 nm. The tin(II) chloride concentration was varied in 0.05 M
increments and the hydrochloric acid concentration in 0.5 M increments to
create the surface
The distribution of tin(II) chloro species as a function of hydrochloric
acid concentration
4.10 Three-dimensional response surface plots to show the effect of tin(II) chloride
and hydrochloric acid on the relative standard deviation for replicate experiments
of 10 !J.g.cm-3 Pt(IV) measured at 400 nm. Each experiment was performed at
least four times
4.11 Absorbance response surface map on peaks for a 20 !J.g.cm·3 Pd(II) sample at
400 nm. The tin(II) chloride concentration was varied in 0.05 M increments and
118
120
121
123
the hydrochloric acid concentration in 0.5 M increments to create the surface 125
5.1 Electronic (absorption) spectra of the platinum-tin(II) chloride complexes
recorded using 0.2 M tin(II) chloride on passage through the flowcell. The
spectra correspond to (1) 8.0 ~tg.cm-3, and (2) 4.0 !J.g.cm·3 Pt(IV). Individual
data points are shown at 4 nm intervals
XI
132
Flow-Injection Analysis of the Platinum-Group Metals
5.2 Absorption spectra of a 10 !J.g.cm-3 Pt(IV) solution as recorded when the flow of
the sample is stopped within the flowcell. Spectra were collected over 600
seconds; constant absorbances were obtained from 250 seconds onwards are not
shown for clarity
5.3 Typical replicate injections for platinum standards and samples of varying
concentrations using a tin(II) chloride concentration of 0.2 M. Numerals refer
to concentration in !J.g.cm-3• The letters refer to samples of (a) 60, (b) 10, (c) 45,
133
(d) 90, (e) 30, and (f) 80 !J.g.cm-3 Pt(IV) 137
5.4 Absorbance response surface map for a solution of 100 !J.g.cm-3 Pd(II) in
0.1 M tin(II) chloride recorded using a stop-flow approach. Absorption spectra
were recorded at one second intervals until 15 seconds, and therafter at 5 second
intervals. See text for details 141
5.5 Contour plot for Figure 5.4 to show the distinct spectral character as a function
of time for palladium using a stop-flow approach. See text for details 142
5.6 Absorption response surface maps for a solution of 100 !J.g.cm-3 Pd(II) as recorded
using a stop-flow approach. The letters refer to the tin(II) chloride concentration
used; viz. (a) 0.05 M, (b) 0.1 M, (c) 0.2 M, and (d) 0.4 M tin(II) chloride 145
5.7 Absorption spectra of the palladium-tin(II) chloride complexes recorded
on passage through the flowcell using a tin(II) chloride concentration of 0.05 M.
The spectra correspond to (1) 100, (2) 80, (3) 60, ( 4) 40, ( 5) 20, ( 6) 10, and
(7) 5 !J.g.cm -3 Pd(II). 149
5.8 The absorption spectra of a 100 ~tg.cm -3 Rh(III) solution as recorded on stopping
the flow of the sample within the flowcell. The rapid kinetics of the reaction of
rhodium(III) with tin(II) bromide in an acidic HBr medium is clearly evident 154
5.9 Absorption spectra for (1) 100, (2) 50, and (3) 20 !J.g.cm-3 Rh(III) recorded on
reaction with 0.2 M tin(II) bromide in 1 M HBr
6.1 Relative standard deviation (R.s.d., %) of quadruplicate injections of platinum
samples as a function of the wavelength to aid wavelength selection. The letters
correspond to concentrations of (a) 10 !J.g.cm-3, and (b) 50 !J.g.cm-3 Pt(IV). R.s.d.
156
values were higher than 1.6% at wavelengths above 480 nm. 167
xii
Flow-Injection Analysis of the Platinum-Group Metals
6.2 Plot of the quotient of the absorptivities (al,j and a2,j) as a function of the
wavelength, j, to show regions of maximum and minimum curve divergence.
The curves correspond to (1) quotient of the absorptivities, (2) 100 ~J-g.cm-3 Pd(II),
and (3) 100 !:lg.cm-3 Pt(IV) 168
6.3 Absorption spectra recorded at the FIA peak maximum on passage through
6.4
the detector flowcell, for (1) 10 ~J-g.cm-3 Pt(IV), and (2) 20 !:lg.cm-3 Ru(III!IV),
recorded using a tin(II) chloride concentration of 0.2 M
Absorption spectra recorded at the FIA peak maximum on passage through the
detector flowcell, for (1) 10 !:lg.cm-3 Pt(IV), (2) 150 ~:tg.cm-3 Rh(III), and
(3) 200 !:lg.cm -3 Ir(IV)
6.5 Plot of the slope of the linear calibration curves for (1) Rh(III), and (2) Pt(IV),
179
183
as a function of the wavelength using 0.2 M tin(II) bromide as the reagent 186
Xlll
3.1
3.2
Flow-Injection Analysis of the Platinum-Group Metals
List of Tables
ReduceTEK main menu options and descriptions
File Extensions (*.Extension) and File Contents for ReduceTEK 3.2 (unless
noted otherwise) files
4.1 Range of variables examined for the FIA manifold optimisation for the
simultaneous determination of platinum and palladium
5.1 Comparisons between the FIA peak heights of injected Pt(II) and Pt(IV) sample
solutions into reagent streams of varying tin(II) chloride concentration
5.2 Features of the calibration graphs for the determination of platinum at various
wavelengths and tin(II) chloride concentrations
5.3 Least-squares statistical fits of "true" versus "found" concentrations for the
determination of Pt(IV). The tin(II) chloride concentration was 0.05 M
5.4 Features of the calibration graphs for the determination of palladium at various
wavelengths and tin(II) chloride concentrations
5.5 Least-squares statistical fits of "true" versus "found" concentrations for the
determination of Pd(II). The tin(II) chloride concentration was 0.05 M
5.6 Features of the calibration graphs for the determination of rhodium at
various wavelengths and tin(II) bromide concentrations
5.7 Least-squares statistical fits of "true" versus "found" concentrations for the
92
97
111
131
135
136
150
151
155
determination of Rh(III). The tin(II) bromide concentration used was 0.2 M 157
5.8 Interference tolerance at the 20 f,lg.cm-3 Pt(IV) and Pd(II) levels monitoring
at the given wavelength with a tin(II) chloride concentration of 0.05 M. Tabulated
numerals represent the maximum tolerated concentration of an interferent in
f,lg.cm-3• See text for details 160
5.9 The resolution of synthetic mixtures containing interferences and 10 f,lg.cm-3 Pt(IV)
at various wavelengths by SCA. Tabulated numerals represent concentrations
• -3 m f,lg.cm 161
xiv
Flow-Injection Analysis of the Platinum-Group Metals
6.1 Results on analysis of 35 mixtures of Pt(IV) and Pd(II) shown as the correlation
between the concentrations "taken" and those "found". Various mixture resolution
methods were used. Comparitive results found by ICP-AES are shown 174
6.2 The resolution of synthetic mixtures of 10 !lg.cm-3 Pt(IV) and 24 ~-tg.cm-3 Pd(II)
containing interferences by MLRA over a wavelength range of 368 nm to
420nm
6.3 Features of the calibration graphs for the multi-component determination of
ruthenium
6.4 Results of resolution of mixtures of Pt(IV) and Ru(III/IV) by MLRA
8.1 Flame-atomic absorption spectrometer operating parameters
8.2 ICP-AES spectrometer operating parameters
8.3 Linear least-squares equations for calibration curves of platinum, palladium,
and rhodium by ICP-AES
XV
176
178
180
200
202
202
Flow-Injection Analysis of the Platiimm-Group Metals
Acknowledgements
First and foremost, this work was made possible by the permission and generous
financial assistance of the Council for Mineral Technology. The author further wishes to
express his appreciation to the management of the Analytical Science Division, specifically
Mr Ron Mallett, Dr Graham Marshall, and Mrs Tina Pohlandt-Watson, for supporting this
work and making those difficult decisions that were ultimately in my best interests.
Special thanks must go to Dr Graham D. Marshall for his valued comments on this
thesis, even when other responsibilities required his attention. His resourceful approaches
contributed significantly to the success of this work.
I would also like to extend my sincerest appreciation to my supervisor, Associate
Professor Klaus R. Koch, for sharing his passion for Analytical Chemistry with me, and for
introducing me to the world of flow-injection analysis.
To all my friends in the Chemistry Department at the University of Cape Town -
particularly Tarron Meyer - thank you for your support and listening ear when the "going got
tough." To my colleagues and friends at Mintek- Deon, Dick, Malcolm, and Vincente - thank
you for your encouragement during the latter stages of this project.
To my family - Mom, Dad, Gary, and Emma-Jayne - many thanks for your love and
support throughout my studies and research at University. Every minute was worth it !
Finally, I wish to express my most profound gratitude to my precious wife, Bronwyn
Leigh, for all her love and support during the pleasant and trying times of this doctoral work. I
will never be able to compute the contribution and difference she made to this work and to my
life. Thank you ever so much, my sweetheart!!!
xvi
Flow-Injection Analysis of the Platinum-Group Metals
In loving memory of my grandparents who were unable to vzew this
completed work -
Leonard Charles Mason ( 1920- 1993)
Rosy Auer ( 1914 • 1994)
xvii

Flow-Injection Analysis of the Platinum-Group Metals
"Their strength is to sit still. Now go, write it before them in a table, and
note it in a book, that it may be for time to come for ever and ever. "
Isaiah 30:7b,8.
XVlll
Flow-Injection Analysis of the Platinum-Group Metals
Chapter 1.
Introduction
The platinum-group metals, gold and silver, collectively referred to as the noble metals,
have throughout history occupied a position of considerable social and economic importance.
The demand for specifically the platinum-group metals (PGMs) over recent years has increased
significantly whilst their wide range of technological applications from catalysts to cancer
chemotherapy clearly shows their importance in the world market. 1
The automotive industry is currently using the largest share of the world production of
the PGMs.2'3 This is a direct consequence of the incorporation of platinum and palladium, as
oxidative catalysts, and rhodium, as a reduction catalyst for nitrous oxides, in automobile
catalytic converters. Use in these applications will grow substantially in the next decade as
ever more stringent exhaust-gas emission standards are introduced by legislation in the
developed world.4 The "clean air'' legislation introduced by the European Economic
Community (EEC) made the incorporation of autocatalysts in all new European gasoline
powered vehicles compulsory with effect from the beginning of 1993.3 Similar steps are being
initiated in the United States of America.5 Platinum oxidation catalysts are used outside the
automobile industry in numerous air-pollution abatement processes to remove carbon
monoxide and harmful organic vapours.
The chemical and petrochemical industries exploit the efficient catalytic properties of the
PGMs. An example of this is the use of platinum, or a platinum-rhodium alloy, as a gauze, to
catalyse the partial combustion (oxidation) of ammonia to yield nitric oxide. Nitric oxide is
used as a raw material for the production of nitric acid, fertilisers and explosives. PGMs are
also used as catalysts for organic syntheses. Hydrogenation, dehydrogenation, isomerisation
and oligmerisation are typical examples of this. Platinum catalysts in the petrochemical
industry assist in the production of high octane gasoline and aromatic compounds.
1
Flow-Injection Analysis of the Platinum-Group Metals
Frequent use is made of platinum vessels when melting special types of glasses. Traces
of platinum are introduced into the molten silicate mass. This incorporation of platinum into
the glass matrix changes its expected properties. The market for glass and glass fibres is
healthy in world terms, with applications in the housing, marine and optical industries. Glass
fibres are used in the production of printed circuit boards. These printed circuit boards are
important in our modern computer age.
The precious metals also fill a traditional role in the jewellery industry. Apart from the
conventional solid solution gold-jewellery alloys, the production of coloured platinum
intermetallic compounds and ordered intermetallic compounds of gold, called "Spangold",6 are
a recent local development in the jewellery industry. Platinum jewellery has made inroads into
the gold-dominated market for items such as marriage rings, earrings, pendants and bracelets.
The electrical and electronic industries use alloys of the PGMs in low voltage, low
energy and other electrical contacts, thick- and thin-film circuits, high temperature
thermocouples, spark plug electrodes, wires, and oxygen sensors. The booming world-wide
demand for mobile telephones has helped the price of palladium to double in the past year.7
This precious metal is needed for the multi-layer ceramic capacitors used in cellular telephones.
The new wide-screen television sets and computers also use palladium in their electronic
components.
Fuel cells3 in which catalytic platinum electrodes convert fuel directly into electricity will
become an increasing consumer of platinum in the future. The 1990s should see the
establishment of a firm market for the fuel cell. Some are already commercially available and
operational. A growing awareness for clean, efficient, and versatile sources of power for the
future, has spurred the growth of this market.
The significance of the PGMs in the medical and dental industry, particularly with respect
to platinum in cancer chemotherapy, is growing.8 The discovery of the antitumor activity of
certain platinum amine compounds,9 a commonly known one being cis-diamminedichloro
platinum(II) ( cisplatin), led to the launch of intensive research efforts in attempts to
successfully treat human malignancies. Applications of the PGMs extend to the manufacture
of some pharmaceuticals, antibiotics (Paracetamol is a common analgesic manufactured with
2
Flow-Injection Analysis of the Platinum-Group Metals
the aid of platinum), and as dental restorative materials (palladium based alloys). They find
application in the construction of medical equipment such as heart pacemakers, catheters and
hypodermic-needle tubing.
Miscellaneous applications of the PGMs and their alloys extend to decorative work on
china, glass and ceramics, and use in laboratory apparatus such as crucibles used for high
temperature fusion. There are considerable investment opportunities, particularly in platinum,
as coins and bars (500g and 1000g). Speculative investment often results from the regular
fluctuation of the price of platinum.
These growing demands for the PGMs present a formidable challenge to the precious
metal industry to improve the efficiency of methods of recovery, separation, preconcentration,
and analysis across the full range of concentration levels.
There are two principle sources of the PGMs. The smaller of the two is the reprocessing
industry that recovers and refines precious metal scrap and spent catalysts. PGMs obtained in
this manner are known as "secondary platinum-group metals".
The other supply of the PGMs, and the more important one, is from mining of ore
deposits containing the precious metals. There are two major types of ore deposits found in
countries of the world's largest producers - Russia, the Republic of South Africa, Canada,
Colombia, and the United States of America. The first type, which is the more significant
contributor, are large igneous ore bodies. The second are placer ore bodies.
Large igneous ore bodies, that are often layered intrusions, contain mafic and ultramafic
rocks that are the largest source of PGMs. The major PGM minerals in these bodies are
sulphides, arsenides, sperrylite (PtAs2), cooperite (PtS) and braggite ((Pt, Pd, Ni)S). These
minerals are often associated with other sulphides, such as copper, nickel, iron, and with
chromite. In placer ore deposits, the precious metals generally occur in their native form.
The rarity and demand for the PGMs has resulted in their commanding high prices. The
financial value attached to the PGMs makes it imperative that the metallurgical recovery of the
metals from these geological deposits and from industrial waste products be efficient and
economical. The flow chart in Figure 1.1 shows the essential steps in the recovery procedure
3
----·~-~-~.----..- -~- .-c;_ ~· .-.·- ~-
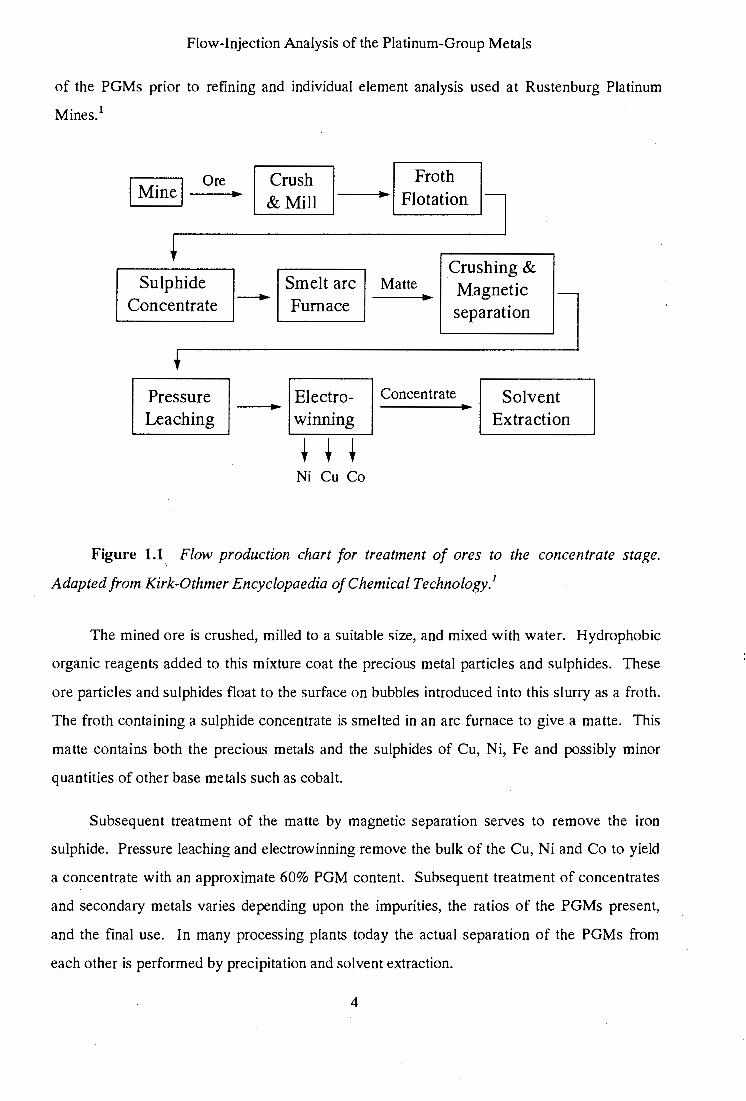
Flow-Injection Analysis of the Platinum-Group Metals
of the PGMs prior to refining and individual element analysis used at Rustenburg Platinum
Mines.1
I Minej Ore
+ Sulphide
Concentrate
Pressure Leaching
Crush .. & Mill
___.
..
Smelt arc Furnace
Electrowmmng
Ni Cu Co
Froth 1 Flotation l
Crushing & Matte Magnetic 1-
separation
Concentrate Solvent Extraction
Figure 1.1 Flow production chart for treatment of ores to the concentrate stage.
Adapted from Kirk-Othmer Encyclopaedia ofChemical Technology.1
The mined ore is crushed, milled to a suitable size, and mixed with water. Hydrophobic
organic reagents added to this mixture coat the precious metal particles and sulphides. These
ore particles and sulphides float to the surface on bubbles introduced into this slurry as a froth.
The froth containing a sulphide concentrate is smelted in an arc furnace to give a matte. This
matte contains both the precious metals and the sulphides of Cu, Ni, Fe and possibly minor
quantities of other base metals such as cobalt.
Subsequent treatment of the matte by magnetic separation serves to remove the iron
sulphide. Pressure leaching and electrowinning remove the bulk of the Cu, Ni and Co to yield
a concentrate with an approximate 60% PGM content. Subsequent treatment of concentrates
and secondary metals varies depending upon the impurities, the ratios of the PGMs present,
and the final use. In many processing plants today the actual separation of the PGMs from
each other is performed by precipitation and solvent extraction.
4
Flow-Injection Analysis of the Platinum-Group Metals
The refining of the concentrate to separate the precious metals from one another takes
advantage of the ready solubility of gold, platinum, and palladium in aqua regia. Rhodium,
iridium, ruthenium, osmium, and silver are insoluble in aqua regia. Gold is separated from the
soluble elements by reduction to the metallic form from the chloride solution by addition of
ferrous salts or sulphur dioxide. The solution is then treated with ammonium chloride to
precipitate the platinum as ammonium chloroplatinate, leaving palladium in solution.
A solution of palladium(II) tetrammine dichloride is obtained on heating the solution
with ammonia and hydrochloric acid. Addition of hydrochloric acid precipitates palladium
dichloride diammine, which is soluble in cold dilute ammonia. This series of reactions gives a
high purity salt which is readily converted to the metal on heating.
The undissolved material after aqua regia treatment, plus minor amounts of platinum
group metals recovered from solutions after removal of platinum and palladium, is mixed with
any available concentrates high in rhodium, iridium, and ruthenium. Fluxing materials,
including lead carbonate and carbon, are added. The mixture is elevated to a high temperature
in a crucible. The molten charge is poured into a conical mould. After solidification, the slag
is removed and the lead, containing rhodium, iridium, silver and ruthenium, is melted,
granulated and treated with nitric acid. Lead and silver are dissolved, removed, and recovered
by this treatment. The insoluble residue contains the platinum by-metals. Sodium bisulphate
fusion and a complex series of steps including precipitation, acid treatment, reduction, heat
treatment and purification, yield rhodium sponge, ruthenium and iridium powder and
potassium osmate. There is notable dependence of the treatment procedure on the precious
metals contained in the sample.
1.1 Determination of the Platinum-Group Metals
In recent years, considerable interest has been shown in the development of techniques
for the determination of the PGMs. This interest has been stimulated by the development of
sophisticated and expensive instrumentation of high sensitivity (particularly inductively coupled
plasma-mass spectrometry, ICP-MS) capable of extending applications to samples containing
5
Flow-Injection Analysis of the Platinum-Group Metals
11g.dm -3 • levels of these elements. Despite these advances in instrumentation, most analytical
techniques require a preconcentration and separation step so that these ~-tg.dm-3 detection limits
can be achieved. Separation is usually required in order to overcome interferences during the
measurement process.
Many current procedures use fire assay. This technique originated in biblical times and,
with certain modifications, is practised widely today. The reason for the requirement of fire
assay is that the PGMs occur in nature at very low concentration levels and are frequently
inhomogeneously distributed in the rock as discrete metal particles. In order to obtain
reasonably representative samples and to be able to determine to 11g.dm-3 levels, or lower, it is
necessary to take larger samples, typically 50 to lOOg. Enormous improvements in detection
limits have been achieved, 10 particularly when fire assay is used as a collection technique prior
to detection using an ultra-sensitive instrumental technique.
The traditional lead fire assay collection11'12 provides a means of preconcentrating gold,
platinum, palladium and rhodium. Their efficient collection on a silver cupellation button is
critically dependant on the "flux" composition (the mixture of reagents added to the sample
prior to fusion) and assay conditions. Low recoveries for rhodium are not uncommon.
The neo-classical fire assay procedure with nickel sulphide collection13 is gaining
popularity because it provides efficient collection for the complete range of PGMs. Special
techniques are required to avoid the loss of volatile osmium compounds at the button
dissolution stage. The procedure is somewhat more time consuming as the removal of the
nickel sulphide matrix requires acid dissolution. Unfortunately, the recovery of gold is not as
efficient as with lead collection.
Subsequent to the preconcentration step is the final measurement of the individual
elements. Such a measurement technique must show specific sensitivity to the element of
interest and provide the required accuracy and precision. The analysis is complicated since
very rarely does only one PGM occur in a sample and interference from the other PGMs is
• 11g.dm-3 =parts per billion
6
Flow-Injection Analysis of the Platinum-Group Metals
widespread. An overview of the prevalent measurement techniques for the PGMs
demonstrates the complexity of the procedures and instrumentation.
Prior to 1960, spectrophotometric methods were the techniques of choice for trace
analysis. There are an abundance of colour forming reagents for the PGMs14 and a surplus of
methods for the quantitative determination of the PGMs. The most frequently used
concentration ranges used are nearer the lower !J.g.cm·3t regions. A selection of colour
forming reagents for platinum, palladium, and rhodium is outlined. Some are used directly
whereas others are used in conjunction with an extraction step.
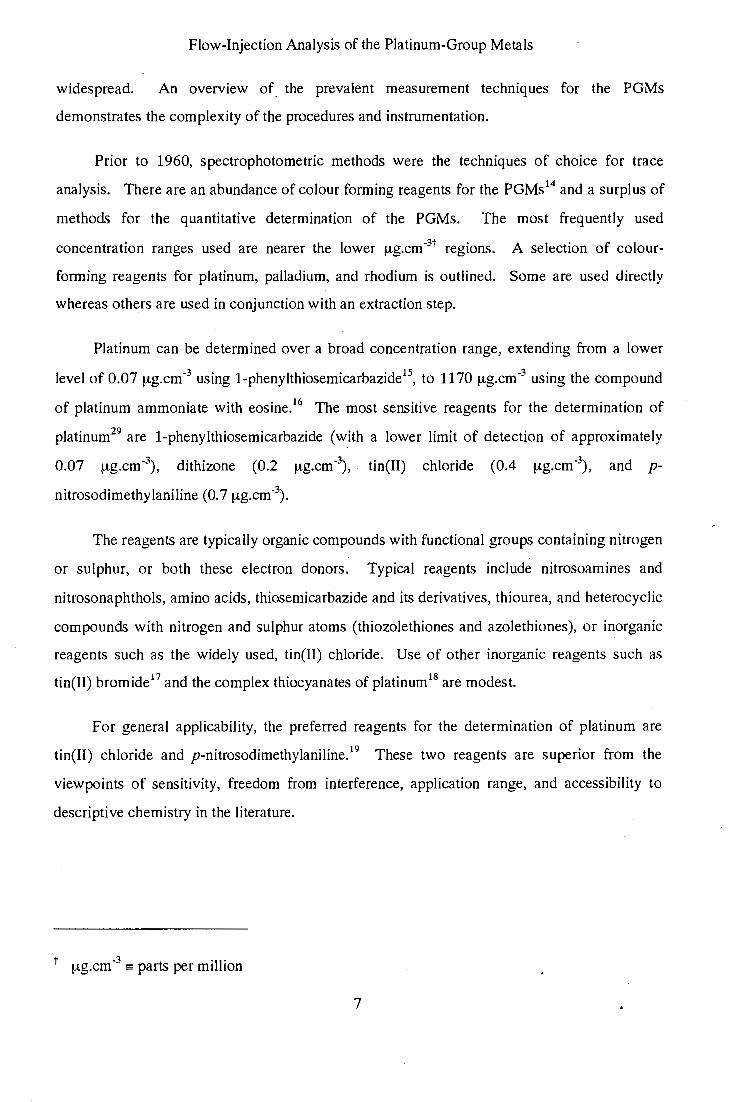
Platinum can be determined over a broad concentration range, extending from a lower
level of 0.07 !J.g.cm-3 using 1-phenylthiosemicarbazide15, to 1170 !J.g.cm-3 using the compound
of platinum ammoniate with eosine.16 The most sensitive reagents for the determination of
platinum29 are 1-phenylthiosemicarbazide (with a lower limit of detection of approximately
0.07 !J.g.cm -3), dithizone (0.2 !J.g.cm -3), tin(II) chloride (0.4 !J.g.cm "3), and p
nitrosodimethylaniline (0.7 !J.g.cm-3).
The reagents are typically organic compounds with functional groups containing nitrogen
or sulphur, or both these electron donors. Typical reagents include nitrosoamines and
nitrosonaphthols, amino acids, thiosemicarbazide and its derivatives, thiourea, and heterocyclic
compounds with nitrogen and sulphur atoms (thiozolethiones and azolethiones), or inorganic
reagents such as the widely used, tin(II) chloride. Use of other inorganic reagents such as
tin(II) bromide17 and the complex thiocyanates of platinum18 are modest.
For general applicability, the preferred reagents for the determination of platinum are
tin(II) chloride and p-nitrosodimethylaniline.19 These two reagents are superior from the
viewpoints of sensitivity, freedom from interference, application range, and accessibility to
descriptive chemistry in the literature.
t !-lg.cm -3 = parts per million
7
Flow-Injection Analysis of the Platinum-Group Metals
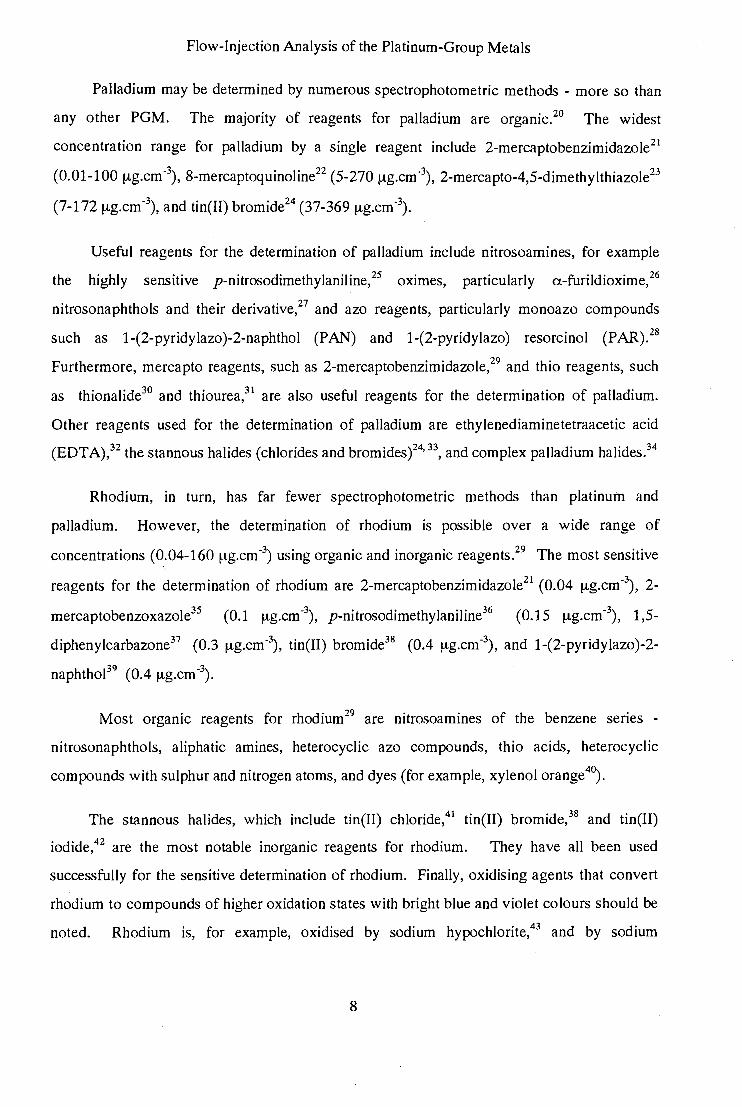
Palladium may be determined by numerous spectrophotometric methods - more so than
any other PGM. The majority of reagents for palladium are organic.20 The widest
concentration range for palladium by a single reagent include 2-mercaptobenzimidazole21
(0.01-1 00 !lg.cm "3), 8-mercaptoquinoline22 ( 5-270 11g.cm -\ 2-mercapto-4,5-dimethylthiazole23
(7-172 11g.cm "3), and tin(II) bromide24 (37-369 !lg.cm "3).
Useful reagents for the determination of palladium include nitrosoamines, for example
the highly sensitive p-nitrosodimethylaniline/5 oximes, particularly a-furildioxime/6
nitrosonaphthols and their derivative/7 and azo reagents, particularly monoazo compounds
such as 1-(2-pyridylazo)-2-naphthol (PAN) and 1-(2-pyridylazo) resorcinol (PAR).28
Furthermore, mercapto reagents, such as 2-mercaptobenzimidazole,29 and thio reagents, such
as thionalide30 and thiourea,31 are also useful reagents for the determination of palladium.
Other reagents used for the determination of palladium are ethylenediaminetetraacetic acid
(EDTA),32 the stannous halides (chlorides and bromides)24' 33, and complex palladium halides.34
Rhodium, in turn, has far fewer spectrophotometric methods than platinum and
palladium. However, the determination of rhodium is possible over a wide range of
concentrations (0.04-160 ~tg.cm-3) using organic and inorganic reagents.Z9 The most sensitive
reagents for the determination of rhodium are 2-mercaptobenzimidazole21 (0.04 !lg.cm·\ 2-
mercaptobenzoxazole35 (0.1 !lg.cm-3), p-nitrosodimethylaniline36 (0.15 !lg.cm-3), 1,5-
diphenylcarbazone37 (0.3 !lg.cm-~, tin(II) bromide38 (0.4 !lg.cm·\ and 1-(2-pyridylazo)-2-
naphthol39 (0.4 !lg.cm-3).
Most organic reagents for rhodium29 are nitrosoamines of the benzene series -
nitrosonaphthols, aliphatic amines, heterocyclic azo compounds, thio acids, heterocyclic
compounds with sulphur and nitrogen atoms, and dyes (for example, xylenol orange4~.
The stannous halides, which include tin(II) chloride,41 tin(II) bromide,38 and tin(II)
iodide,42 are the most notable inorganic reagents for rhodium. They have all been used
successfully for the sensitive determination of rhodium. Finally, oxidising agents that convert
rhodium to compounds of higher oxidation states with bright blue and violet colours should be
noted. Rhodium is, for example, oxidised by sodium hypochlorite,43 and by sodium
8
Flow-Injection Analysis of the Platinum-Group Metals
hypobromite44 in alkaline solutions. The latter is the preferred method29 for determinations of
this type.
The lack of knowledge regarding the solution chemistry of the PGMs has contributed to
the difficulty of developing methods for their efficient separation and determination.
Practically all the methods mentioned deal with the problem of interfering constituents,
particularly from other PGMs present in the solution.45
Spectrophotometric methods are still important for the determination of microgram
amounts of iridium, osmium and ruthenium, the common methods being leuco-crystal violet, 46
thiourea,47 and sodium thiocyanate48, respectively. Nevertheless, their general use for the
remainder of the PGMs has declined sharply with the advent of other spectroscopic methods.49
The most common final measurement techniques include flame-atomic absorption
spectrometry (FAAS), instrumental neutron activation analysis (INAA) and inductively
coupled plasma-atomic emission spectrometry (ICP-AES). As FAAS is relatively inexpensive
and relatively easy to operate, it has come within reach of most industries, and become a
widely used technique. FAAS is basically a single element technique with ~tg.cm-3 sensitivity.
However, it suffers from serious matrix and mutual element interferences50'51 and only when
used in conjunction with graphite furnace-atomic absorption spectrometry (GFAAS), does it
compete with the ~g.dm -3 sensitivity of INAA.
The multi-element capability of INAA and ICP-AES is offset by the need for
sophisticated hardware (a reactor) and time for the former, and the lack of heavy-element
sensitivity for the latter. The current technique of choice at low concentrations would
therefore be GFAAS, although the need for careful control of the solution chemistry is of
paramount importance.
New and powerful tools, such as ICP-MS, are capable of sensitivity comparable to
GFAAS and spark-analysis-for-traces (SAFT).52 SAFT is based on sparking a sample
collected into a lead button which has been flattened to give a disk. Measurement of the
intensity of the elemental lines is made relative to lead. This approach was initially investigated
9
Flow-Injection Analysis of the Platinum-Group Metals
at MINTEK.* Although new instrumental techniques are often extremely sensitive, there is still
a great need for separation and preconcentration of the analyte of interest.
It is evident from the consideration of the spectrophotometric methods and instrumental
techniques used for the determination of the PGMs that as the complexity of the
determinations increase, so too does the cost of the instrumentation.
1.2 The Platinum-Tin(II) Chloride Complex
The reaction of tin(II) chloride with platinum-group metals has been known for over a
century.53•54
•55
'56 The reaction, first reported by Wohler, 55 between tin(II) chloride and PtCl/
or PtC162
- in dilute hydrochloric acid (HCI) solutions (greater than 0.5 mol.dm-3 § (M) HCI),
rapidly leads to the development of an intense red-orange colour. This colour has been
exploited analytically for the spectrophotometric determination of trace amounts of
platinum.57•58
•34 The nature of this interaction of tin(II) chloride has been the subject of a
number of studies utilising ab~orptiometric,59•60 preparative,61•62 M6ssbauer,63 and
heteronuclear nuclear magnetic resonance (NMR) spectroscopic techniques.64•65
Many authors have tried to isolate the complexes formed on platinum reaction with
tin(II) chloride and to study their properties. The lack of agreement regarding the nature and
composition of these complexes, and the formal oxidation state of the platinum in these
complexes, has afforded numerous publications.55'66
'67 Notable disagreement as to the origin of
the red-orange colour is evident.
W6hler55 suggested the red colour was due to colloidal platinum produced on reaction of
tin(II) chloride with Pt(IV) but reported no definite stoichiometry. This reaction is analogous
to the "purple of Cassius" when gold chloride is similarly treated.56 This postulate was
disproved by Ayres and Meyer66 who showed that the coloured material readily passes through
a semi-permeable membrane, such as colliodion. Further evidence against the postulate of a
* Council for Mineral Technology, Randburg, Republic of South Africa.
§ Molarity, mol.dm-3, denoted as M.
10
Flow-Injection Analysis of the Platinum-Group Metals
colloidal material was outlined by Elizarova and Matvienko67• They argued that an increase in
optical density (absorbance) of solutions at tin(II) chloride concentrations greater than that
required for the reduction of platinum, was indicative of complex formation. Furthermore, the
extractability of the red colour into organic solvents supports evidence for the presence of a
complex. Ahmed and Koch68 showed this in a study of platinum extraction into methyl
isobutyl ketone (MIBK).
The red colour has also been attributed to chloroplatinous acid,69 and Pt(II).70 Both have
been disproved by ingenious experiments on the part of Ayres and Meyer.66 The former,
chloroplatinous acid, may be discounted on the basis of colour comparisons between the
reaction of tin(II) chloride and 10 11g.cm -3 Pt(IV) , and the inherent colour of a concentrated,
1000 ~-tg.cm-3, chloroplatinous acid solution. Both final colours are approximately the same
and the measured absorption spectra show vast differences. The latter, Pt(II), was discounted
when Pt(IV) was evaporated to fumes with sulphuric acid to expel hydrochloric acid, and the
solution treated with tin(II) sulphate. No colour developed. Therefore, simple reduction to
Pt(II) cannot account for the colour reaction.
The origin of the red-orange colour on platinum reaction with tin(II) chloride is now
known to result from the rapid reduction of any Pt(IV) species71 to Pt(II), followed by, or
concomitant with, complex formation of PtCl/- with the SnCh- moiety to yield a series of
anionic [Pt(SnCh)nCknt (n = 1 to 4) complexes, as well as the relatively stable [Pt(SnCh)sf
complex anion.72'73 Characteristic absorption spectra show two absorbance maxima (A.= 310,
400 nm) and a shoulder at 475 nm.72 The latter complex, [Pt(SnCh)sf, has been
characterised by X-ray crystallography in the solid state/4 and NMR studies prove its existence
in hydrochloric acid solution.64
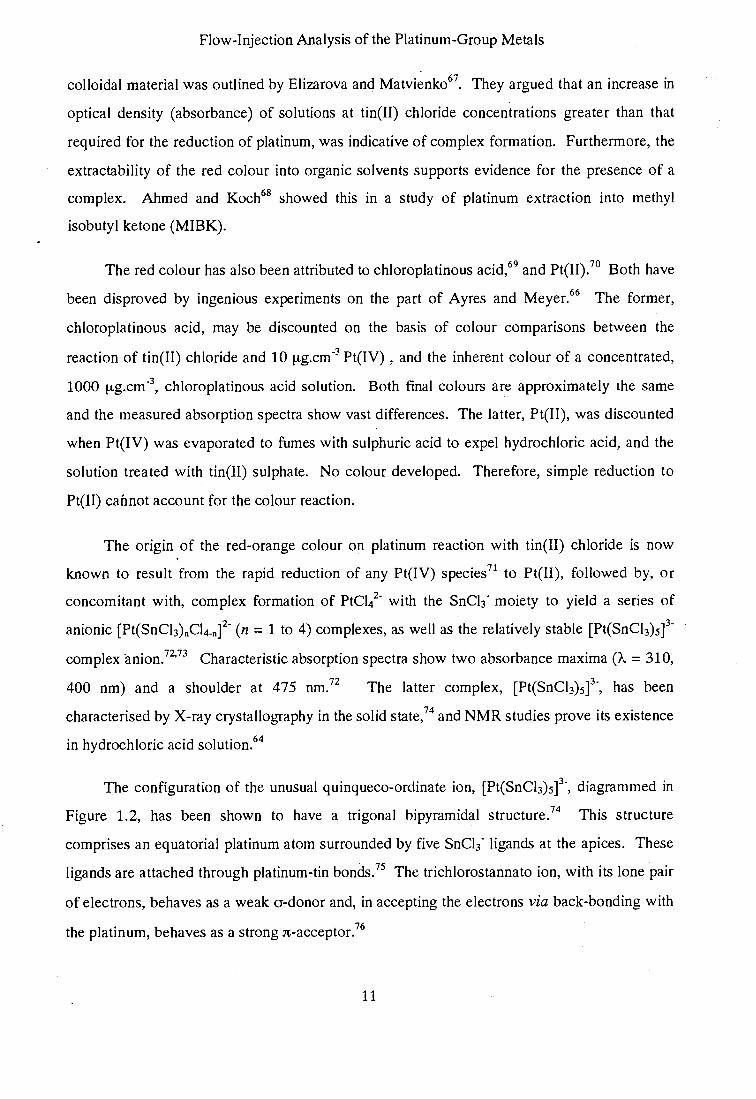
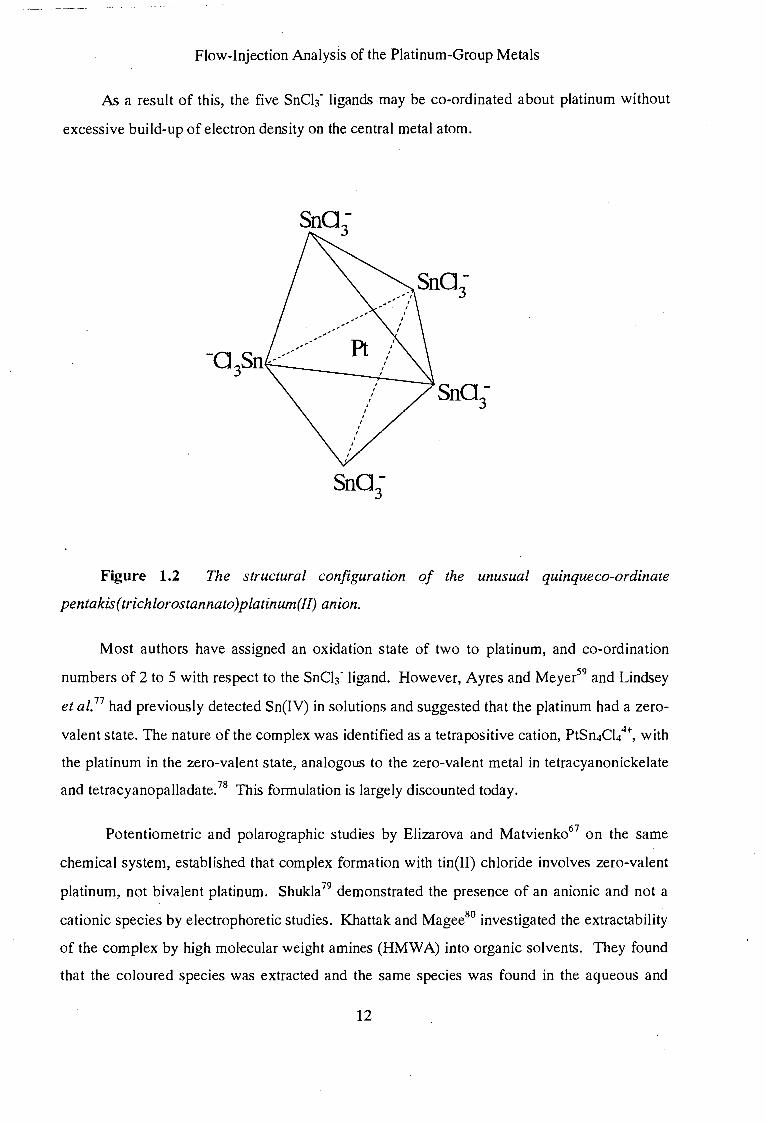
The configuration of the unusual quinqueco-ordinate ion, [Pt(SnCh)st, diagrammed in
Figure 1.2, has been shown to have a trigonal bipyramidal structure.74 This structure
comprises an equatorial platinum atom surrounded by five SnCh- ligands at the apices. These
ligands are attached through platinum-tin bonds.75 The trichlorostannato ion, with its lone pair
of electrons, behaves as a weak a-donor and, in accepting the electrons via back-bonding with
the platinum, behaves as a strong :rt-acceptor.76
11
Flow-Injection Analysis of the Platinum-Group Metals
As a result of this, the five SnCh- ligands may be co-ordinated about platinum without
excessive build-up of electron density on the central metal atom.
Figure 1.2 The structural configuration of the unusual quinqueco-ordinate
pentakis(trichlorostannato)platinum(II) anion.
Most authors have assigned an oxidation state of two to platinum, and co-ordination
numbers of 2 to 5 with respect to the SnCh- ligand. However, Ayres and Meyer59 and Lindsey
eta!. 77 had previously detected Sn(IV) in solutions and suggested that the platinum had a zero
valent state. The nature of the complex was identified as a tetra positive cation, PtSn4Cl4 4
+, with
the platinum in the zero-valent state, analogous to the zero-valent metal in tetracyanonickelate
and tetracyanopalladate.78 This formulation is largely discounted today.
Potentiometric and polarographic studies by Elizarova and Matvienko67 on the same
chemical system, established that complex formation with tin(II) chloride involves zero-valent
platinum, not bivalent platinum. Shukla79 demonstrated the presence of an anionic and not a
cationic species by electrophoretic studies. Khattak and Magee80 investigated the extractability
of the complex by high molecular weight amines (HMWA) into organic solvents. They found
that the coloured species was extracted and the same species was found in the aqueous and
12
Flow-Injection Analysis of the Platinum-Group Metals
amine phases by comparison of absorption spectra. This confirmed the findings of Shukla 79 but
was in disagreement with the structure proposed by Ayres and Meyer.59
Extensive spectrophotometric studies on the reaction of tin(II) chloride and Pt(II), in
hydrochloric acid solution, by Ayres and Meyer,59 showed that the SnCh- moiety can bond to
the platinum in several mole ratios- Pt(II):Sn(II) ratios of 1:4, 1:2, 1:1, 3:2, 2:1, 3:1, and 5:1-
with the principle complex having a Pt(II):Sn(II) mole ratio of 5:1.
Young et a/.72 determined the structure of a number of platinum-metal tin(II) complexes
showing that they were anionic with formulated structures: cis- and trans- [PtCI2(SnCb)zt,
[RuC]z(SnCb)zt, [RhzCh(SnCh)4t, and [lrzCiz(SnCb)4t"· The trichlorostannate(II) ion is
considered to be acting as a donor anionic ligand of strength comparable to the chloride ion.
Young and his co-workers were able to isolate the proposed square-planar cis- and trans
isomers of (PtC]z(SnCh)zt as the tetramethlyammonium salts- one yellow and the other red.
Although it was not possible for these workers to determine unequivocally the
configurations of the two isomers, the yellow form was considered to be the cis.: isomer. Some
d11-dn bonding between platinum and tin would cause the cis-isomer to be more stable than the
trans-isomer. This is because in the latter configuration there would be competition between
the two SnCb- groups for the same d-orbitals of platinum. The result is a less stable complex
and weaker bonding. Their results show that, while the red form is favoured kinetically, the
yellow is more stable thermodynamically.
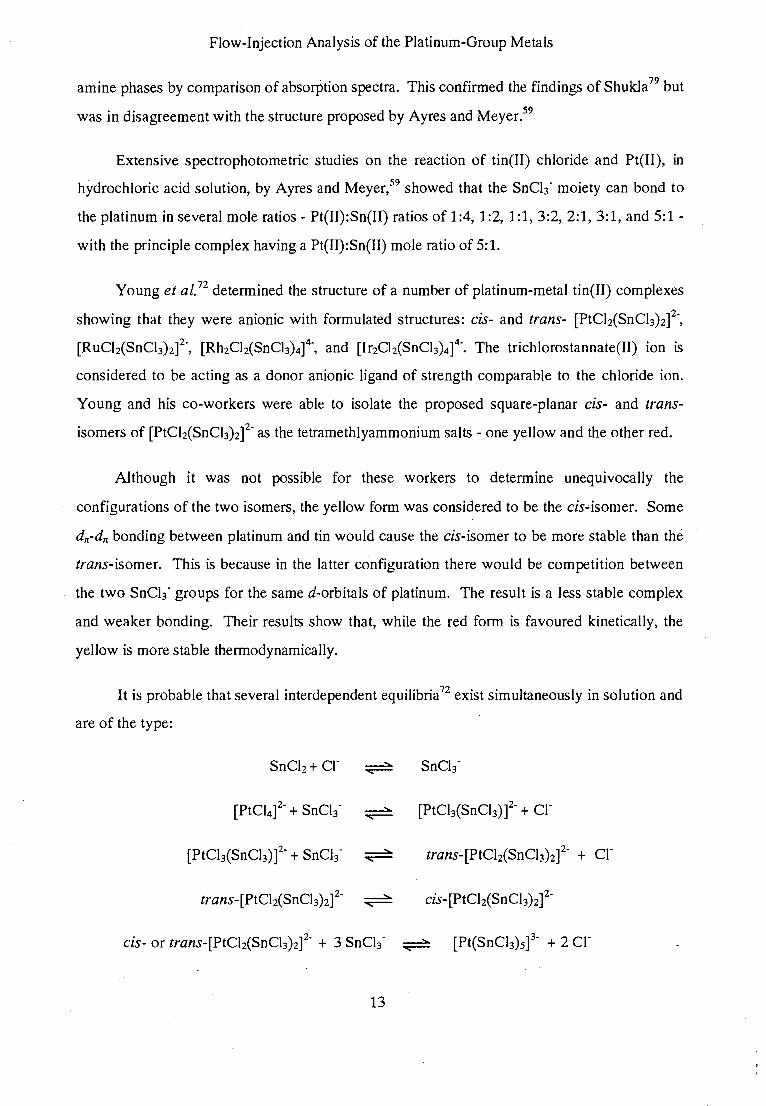
It is probable that several interdependent equilibria72 exist simultaneously in solution and
are of the type:
SnCiz+ cr SnCb-
(PtCb(SnCh)t + SnCh- trans-[PtC]z(SnCh)zt + Cr
trans- [PtC]z(Sn Cb )zt cis-[PtCl2(SnCh)2]2
-
cis- or trans-[PtC]z(SnCb)zf" + 3 SnCb- [Pt(SnCb)st + 2 cr
13
Flow-Injection Analysis of the Platinum-Group Metals
If substitution of PtCI/- by SnCh. takes place in two steps one would expect a trans
effect from SnCh- stronger than cr, favouring initial formation of the trans-isomer. This was
observed by Young and his co-workers.72
The 119Sn-M6ssbauer spectroscopic study of trichlorostannyl platinum complexes
undertaken by Parish and Rowbotham63 has questioned the existence of the trans-isomer,
[PtCh(SnCh)zf. This is because this complex has identical Mossbauer and infra-red
parameters as the red anion, [Pt(SnCh)5t. A more recent NMR study64 has indicated that the
predominant species present in 3 M HCI appears to be from a mixture of the yellow
[PtCh(SnCh)zf and red [Pt(SnCh)st complexes.
It may be concluded that the coloured species resultant from reaction of platinum with
tin(II) chloride appears to be due to either,
(1) [Pt(SnCh)nCI4-nt (n = 1 to 4), or [Pt(SnCh)st, or a mixture, and
(2) anionic in nature with both platinum and tin in the divalent oxidation state.
1.3 The Palladium-Tin(II) Chloride Complex
The most widely used method for. the spectrophotometric determination of palladium is
based on the compounds formed on reacting palladium with the stannous halides, particularly
tin(II) chloride.Z9 A slight variation of this reaction is the orange-red colour produced when a
solution containing palladium is treated with tin(II) chloride together with mercury(II) chloride
in hydrochloric acid. This was reported by Pollard81 as a specific qualitative ~pot test for
palladium.
As in the case of platinum, the existence of stable d7cdrr. bonds between the metal and
stannous halides have been found. 75 Evidence of mixed polynuclear compounds that contain
metal-halogen bridging bonds were also found. This bridging effect is more prevalent in
complexes with rhodium and palladium than other PGMs.82 In most instances, formation of
these compounds, bridging and non-bridging, is accompanied by a change in the oxidation state
of the PGM metal ion. The complexes are typical charge-transfer complexes so the study of
14
Flow-Injection Analysis of the Platinum-Group Metals
their electronic absorption spectra is of particular interest. A typical example of this approach
is found in the study of the reaction between tin(II) chloride and palladium.
The reaction of Pd(II) with tin(II) chloride in hydrochloric acid solution is more rapid
and apparently more complicated than that with Pt(II/IV), resulting in a series of rapid colour
changes, from yellow-orange (A.= 420 nm) to red (A.= 355, 420 nm), through blue, and finally
to dark green (A. = 380, 465, 636 nm). The origin of these colour changes is not well
understood. It has been established that several complex species are involved. The nature of
these complexes depends on inter alia the Pd(II):Sn(II) mole ratio and the hydrochloric acid
concentration.83'84 This accounts for variations in the reporting of the observed colours by
some authors. Ayres and Meyer,66 for example, report a black colour where blue has been
reported elsewhere.84
The complexes of palladium with tin(II) chloride have been least studied. Young and his
co-workers72 studied the structures of the tin(II) chloride complexes of the other PGMs, but
omitted palladium because an unstable complex was formed. Ayres and Meyer66 found that the
green complex was only extractable to a slight extent, and proposed it to be colloidal in nature;
dialysis tests showed no evidence of it passing through a colloidion material.
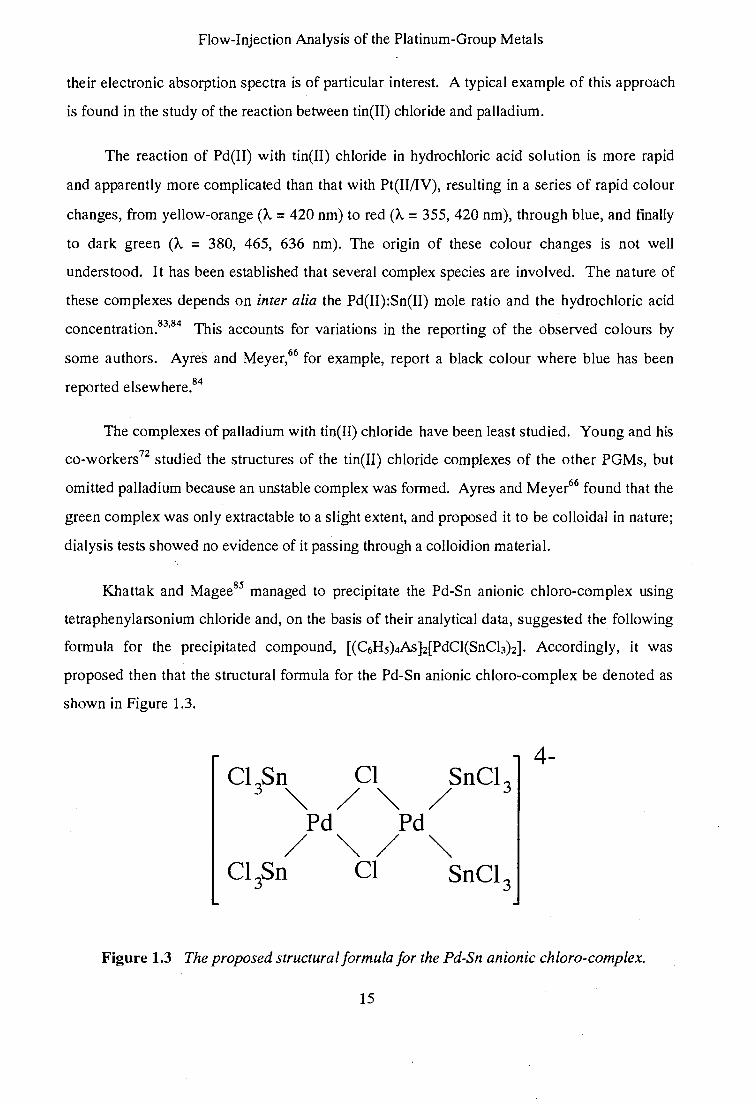
Khattak and Magee85 managed to precipitate the Pd-Sn anionic chloro-complex using
tetraphenylarsonium chloride and, on the basis of their analytical data, suggested the following
formula for the precipitated compound, [(C6H5) 4As]z[PdCI(SnCh)2]. Accordingly, it was
proposed then that the structural formula for the Pd-Sn anionic chloro-complex be denoted as
shown in Figure 1.3.
4-
Figure 1.3 The proposed structural formula for the Pd-Sn anionic chloro-complex.
15
Flow-Injection Analysis of the Platinum-Group Metals
Further investigations by these authors involved the determination of the extractability of
the complexes formed into tri-n-octylamine.86 Two different complexes were found, the first
red-brown, and the second yellow. Both are readily extracted into tri-n-octylamine in benzene.
The yellow species possessed a definite absorption maximum (A= 410 nm) in the amine phase,
indicating stabilisation on extraction. This work, akin to work on platinum extraction by high
molecular weight amines,80 supported the conclusion that the species were anionic in nature.
The yellow and red complexes could be extracted into polar solvents, indicating their
charged states. Absorption spectra taken of the red form in 3-methylbutanol revealed two
absorption bands, at 355 nm and 420 nm (the latter being characteristic of the yellow form).
The red complex appeared to be a short-lived species, sensitive to atmospheric oxygen, and
converted to the yellow species rapidly. Addition of fresh tin(II) <?hloride leads to the
production of the red form. This indicated that the red and yellow forms exist in solution in a
state of dynamic equilibrium.83
Complexes of palladium with tin(II) chloride in hydrochloric acid solution showed the
existence of at least three complex species, depending on the reaction conditions.83 In addition
to the postulated red and yellow species by Khattak and Magee,86 a third and more stable
compl.ex resulting in a green colour exists. This complex is the final product at any
concentrations of HCl, tin(II) chloride and Pd(II). Sufficiently high concentrations of tin(il)
chloride leads to the rapid formation of the yellow and red colours, which are then converted
to the green colour. Further increase in tin(II) chloride concentration was found to define the
maximum characteristic of the green form (hyperchromic effect at 636 nm) more clearly.
Further increase in tin(II) chloride concentration results in the decomposition of this species to
give a brown solution from which metallic palladium separates. The remaining solution was
almost colourless.
Zayats eta!. 84 found that the nature of interaction in the tin(II) chloride, Pd(II), and HCl
system depends on the mole ratio of palladium and tin(II) chloride. in solution as well as the
hydrochloric acid concentration. In solutions with a Pd(II):Sn(II) mole ratio of 1:2, or less, an
unstable green palladium hydrosol is formed which coagulates on standing.
16
Flow-Injection Analysis of the Platinum-Group Metals
These authors84 have proposed that this occurs according to the reaction:
Pd(II) + Sn(II) Pd(O) + Sn(IV)
Metallic palladium may be recovered from the coagulated hydrosol. The characteristic
absorption spectral bands are absent here. This is indicative of the absence of complex
formation at these mole ratios.
At constant ratios of palladium and tin(II) chloride concentrations, the composition and
stability of complexes formed was dependant on the hydrochloric acid concentration. The
complexes formed with a Pd(II):Sn(II) mole ratio of 1:8, in 0.5 M HCI, gave a green colour to
the solution. In 2 M HCI, yellow, and in 8 M HCI, red-brown colours are formed. The
complex formation was found to be dependant on the total concentration of metal salts. At
fixed Pd(II):Sn(II) ratios, a considerable decrease in the concentration of the metal salts in
solution, irrespective of the acidity, resulted in the formation of the yellow colour. Proof was
given that in 2M HCI the interaction of components led to the formation of primarily the green
colour in concentrated metal salt solutions. In 8 M HCl an unstable violet colour, which
converts to red-brown, is formed in concentrated solutions. The yellow colour appears in less
concentrated metal salt solutions.
In summary, as in the case of platinum, it appears that the palladium-tin(II) chloride
complex is anionic. In contrast to platinum, several species exist depending on the conditions.
The green colour appears to predominate over all the colours generated by other complex
forms, and is a result of the most stable complex over the widest range of conditions.
1.4 The Rhodium-Tin(II) Chloride Complex
The existence of three complexes in solution has been established for the reaction of
tin(II) chloride with rhodium in hydrochloric acid. Sandell58 stated that either the red complex
(A. = 300, 475 nm), developed in 2 M HCI, or the yellow complex (A. = 310, 425 nm),
occurring in less acidic media, could be used for spectrophotometric determination of rhodium.
The third complex is an intermediate complex with an absorption maximum at 372 nm.
17
Flow-Injection Analysis of the Platinum-Group Metals
Although use of the red form is a less sensitive way to determine rhodium than the
yellow form, it is preferred because of its colour stability and reproducibility within the time
interval of colour development. Difficulties were experienced87 in applying the yellow colour
to quantitative spectrophotometric work. These colours originally were the basis for detection
of the presence of rhodium,88 and later, after investigation of these colour reactions, formed the
basis of routine quantitative determinations of rhodium.41'58
'89
'90 The tin(II) chloride reaction
has been applied to the determination of rhodium in alloys and materials, in plutonium,91 in
uranium and in uranium alloys,92 and fission products.93
Formation of the red or yellow complexes is reported to be principally dependant on the
SnCh-:Cr ratio.94 The red and yellow colours are reversibly developed- the latter is converted
to the red complex by addition of hydrochloric acid. This is believed to be due to the
dependence on the SnCh-:Cr ratio rather than the Rh(III):Sn(II) ratio. The yellow form
appears on addition of water. There are differences in opinions concerning the quantitative
aspects of this change, and to optimum conditions for the formation of these complexes. Ayres
et aC5 stated that the full colour intensity was attained in 3 to 5 minutes near the boiling
point, with variations of acid concentration from 0.1 to 4 M HCI. Stein96 found that heating
for at least 15 minutes was required, and even then constant absorbance was not obtained after
standing for 60 minutes. Maynes and McBryde97 found that after heating for 40 minutes the
absorbance showed a slow drift on cooling. Heating for 60 minutes yielded a stable
absorbance, after 30 minutes, for at least 24 hours. Beamish and Van Loon98 also found
heating for 60 minutes to be sufficient for a stable absorbance. The acidity, time and
temperature of heating, are additional factors that affect the formation of reaction products.
The equilibria being studied by the aforementioned authors is considered to be of the
form shown below. Of particular interest is the effect of the ratio of SnCh- to cr 94 in the
equilibria. The possibility of Rh(I) complexes is ignored.
[RhCI6-n(HzO)nt + mSnCb- [RhCl 6 _ n _ m (SnCh) mt + mer + nHzO
Young et a/. 72 determined the structure of a number of tin(II) complexes with PGMs
showing that they were anionic with a formulated structure given in Figure 1.4. For the
18
Flow-Injection Analysis of the Platinum-Group Metals
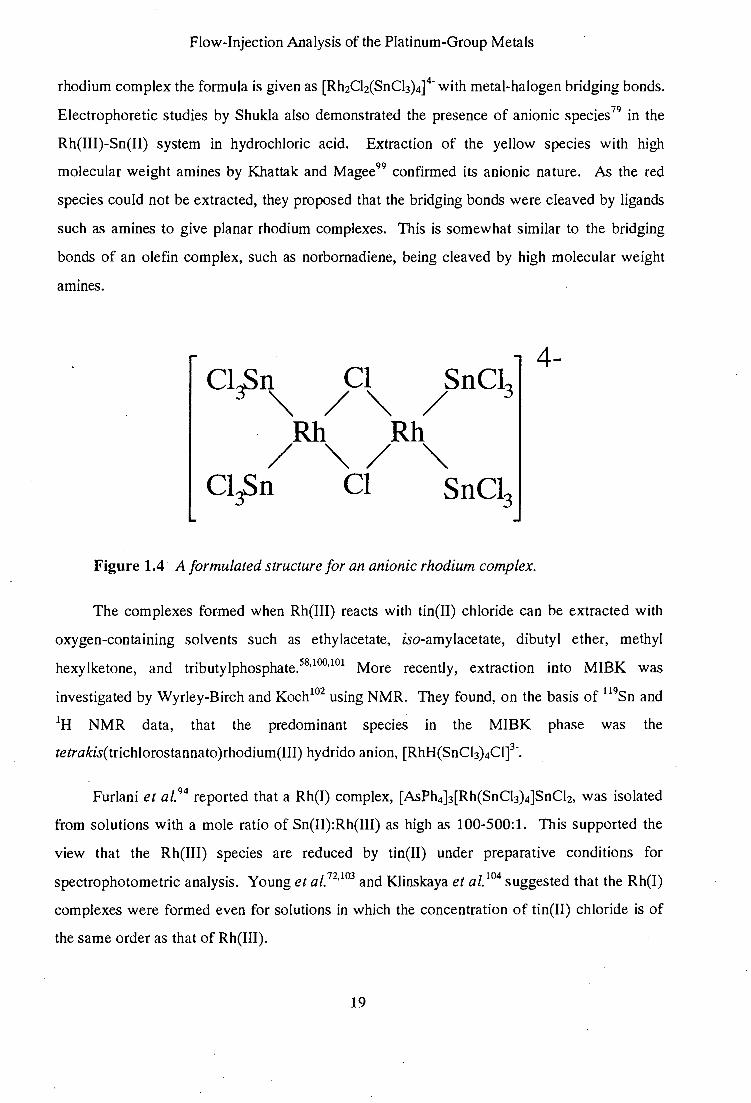
rhodium complex the formula is given as [RhzCiz(SnCh)4t with metal-halogen bridging bonds.
Electrophoretic studies by Shukla also demonstrated the presence of anionic species 79 in the
Rh(III)-Sn(II) system in hydrochloric acid. Extraction of the yellow species with high
molecular weight amines by Khattak and Magee99 confirmed its anionic nature. As the red
species could not be extracted, they proposed that the bridging bonds were cleaved by ligands
such as amines to give planar rhodium complexes. This is somewhat similar to the bridging
bonds of an olefin complex, such as norbornadiene, being cleaved by high molecular weight
amines.
4-
Figure 1.4 · A formulated structure for an anionic rhodium complex.
The complexes formed when Rh(III) reacts with tin(II) chloride can be extracted with
oxygen-containing solvents such as ethylacetate, iso-amylacetate, dibutyl ether, methyl
hexylketone, and tributylphosphate.58'100
'101 More recently, extraction into MIBK was
investigated by Wyrley-Birch and Koch102 using NMR. They found, on the basis of 119Sn and
1H NMR data, that the predominant species in the MIBK phase was the
tetrakis(trichlorostannato)rhodium(III) hydrido anion, [RhH(SnCh)4Cit.
Furlani et al. 94 reported that a Rh(I) complex, [AsPh4]3[Rh(SnCI3) 4]SnC}z, was isolated
from solutions with a mole ratio of Sn(II):Rh(III) as high as 100-500:1. This supported the
view that the Rh(III) species are reduced by tin(II) under preparative conditions for
spectrophotometric analysis. Young et al.72'103 and Klinskaya et al. 104 suggested that the Rh(I)
complexes were formed even for solutions in which the concentration of tin(II) chloride is of
the same order as that of Rh(III).
19
Flow-Injection Analysis of the Platinum-Group Metals
In addition to the reported rhodium(!) complexes, rhodium(III) complexes, such as
[N(CH3)4]3[Rh(SnCh)nCl6_n] (n = 1 to 4), have been isolated by Kimura eta/. 105 from solutions
with Sn(II):Rh(III) ratios of 1-4:1. The oxidation state of rhodium was determined by
elemental analysis and the values of the reducing equivalents of the compounds in the reaction
with iron(III). The existence of several rhodium(III)-tin(II) complexes, such as
[N(CH3)4]3[Rh(SnCh)nCl6_n] (n = 2 to 5), in solutions having Rh(III):Sn(II) ratios of 1:2-8, was
confirmed by 119Sn Mossbauer spectroscopy.106 Saito et a/. 107 characterised a series of
[Rh(SnCh)nCl6-nt (n = 1 to 5) complexes having Rh(III):Sn(II) ratios of 1:0.5-5, by Fourier
transform NMR in solutions of 3 M HCI. At a higher Rh(III):Sn(II) mole ratio of 1:6, the
redox process between Rh(III) and tin(II) chloride to form the rhodium(!) complex anion,
[Rh(SnCh)st, was demonstrated. A kinetic investigation108 also found evidence for a "purple
species", assumed to be the [Rh(SnCh)st complex.
The complexity of the rhodium(III)-tin(II) chloride-hydrochloric acid system is evident
and notably poorly understood, although advances in analytical instrumentation are permitting
investigation into the true nature of the species present.
1.5 Tin(II)"·Bromide Complexes
Substitution of tin(II) bromide for tin(II) chloride gives greater sensitivity in the
determination of the PGMs. 109 The reaction products and reaction schemes are presumed to
be similar to those discussed for the tin(II) chloride system.58 For example, it is known that
the reaction of platinum with SnCh- and SnBr3- produces platinum-tin(II) complexes of the
type [Pt(SnX3)nN-nt (n = 1 to 4) and [Pt(SnX3) 5t where X = Cl, Br. 110'111 Accordingly,
attention is devoted in this section to absorption spectrum characteristics.
The absorption spectrum of the platitmm-tin(II) complexes in 2 M hydrochloric acid have
absorption maxima at A= 310 nm and 400 nm, whereas in 2 M hydrobromic acid (HBr) the
absorption maxima have shifted to longer wavelengths (A = 358 nm and 460 nm).112 This
characteristic shift of the maximum absorbance to longer wavelengths is called a
20
Flow-Injection Analysis of the Platinum-Group Metals
"bathochromic shift" (also a red shift):· The shift arises from a difference in the ionisation
potential of the halogens, chlorine and bromine. Bromine has a lower ionisation potential than
chlorine. Hence, if all the chlorine atoms in the Pt(SnCh)/- anion were replaced with bromine
atoms, its absorption spectra would show an absorption maximum shift to longer wavelengths.
The reactions of the PGMs with tin(II) bromide have not been investigated to the same
extent as the tin(II) chloride reactions. Emphasis has been placed on the chloride system with
minimal mention of the bromide system.100'107 Nevertheless, the reactions of the PGMs with
tin(II) bromide have been used analytically.58 The reactions of four PGMs with tin(II) bromide
are summarised below.
A red colour (A = 463 nm) develops immediately at room temperature and is stable for
several days on reaction of platinum with tin(II) bromide in HBr. The acidity should be 1 M
HBr or greater. In the case of rhodium, a red-orange colour (A = 475 nm) develops at room
temperature but this changes to yellow (A = 427 nm) after several hours. Perchloric acid
stabilises the yellow colour. Reagent and acid concentrations require control. Palladium forms
a yellow-brown colour (A = 385 nm, plateau 440 to 460 nm) on reaction with tin(II) bromide,
the intensity of which depends on the tin(II) bromide and HBr concentrations. The complex is
stable for an hour under conditions of 3 M HBr and 0.1 M tin(II) bromide. In the case of
iridium, no significant colour development is observed at room temperature, even after several
days. A yellow colour develops on heating (A = 403 nm), which is stable for several hours
(-2-3M HBr and 0.1-0.2 M tin(II) bromide). Tin(II) bromide itself absorbs below 400 nm, as
does tin(II) chloride, and any minor absorbance from the reagent is readily corrected by the use
of a blank solution.
It is evident from the text that both the tin(II) chloride and tin(II) bromide systems
require critical control of the experimental conditions prior to spectrophotometric
measurements. Should accurate control not be maintained, th~ experimental results would no
doubt be in question. An analysis using a common manual spectrophotometric method (that is
sample preparation, dilution, reagent addition, dilution, incubation for a fixed time period, and
•• The opposite effect, to shorter wavelengths, is referred to as a hypsochromic (blue) shift.
21
Flow-Injection Analysis of the Platinum-Group Metals
finally measurement against known standard solutions taken through the same procedure) is
lengthy and requires considerable analytical experience and capability. An improved
experimental approach that would reduce the complexity of the steps, and thereby better the
reproducibility prior to measurement, would be invaluable.
Having considered the complex chemistries taking place on reaction of the PGMs with
tin(II) chloride and tin(II) bromide, one may be quite wary of attempting to study such a
system with new flow-based technology. Nevertheless, these complex chemistries and
associated problems with analysis posed a considerable challenge and opportunity to the
author. The following section will detail the finer aspects of the flow-based technology used in
this research.
1.6 Flow-Injection Analysis
Any measurement in a chemical laboratory involving liquids comprises the following
operations: solution handling, analyte detection, data collection, and computation of the
results. Computers and sophisticated detectors aid scientists in the latter two tasks, but
solution handling requires an arsenal of skills essential to the successful completion of the task.
Mixing, decanting, pipetting, and other volumetric operations are still performed manually,
even in the most advanced laboratories, using apparatus that was designed more than 200 years
ago. Moreover, volumetric glassware was designed for the manual handling of large volumes
(5-500 cm3) as one cannot readily manipulate smaller volumes with the required reproducibility
using conventional glassware. The handling of large volumes translates into large volumes of
hazardous laboratory waste, large quantities of expensive reagents, and a high probability of
glass cuts and chemical burns as a result of chemical contact.
Some industrial laboratories have turned to robotics to enhance the efficiency of
laboratory tasks and to remove humans from potential danger. However, robots are limited
mechanically and conceptually by their inability to simulate human manipulations. Manual
handling of robots requires extensive programming and active feedback control, and they are
generally too expensive. Their use is justified in the case of repetitive operations (such as
22
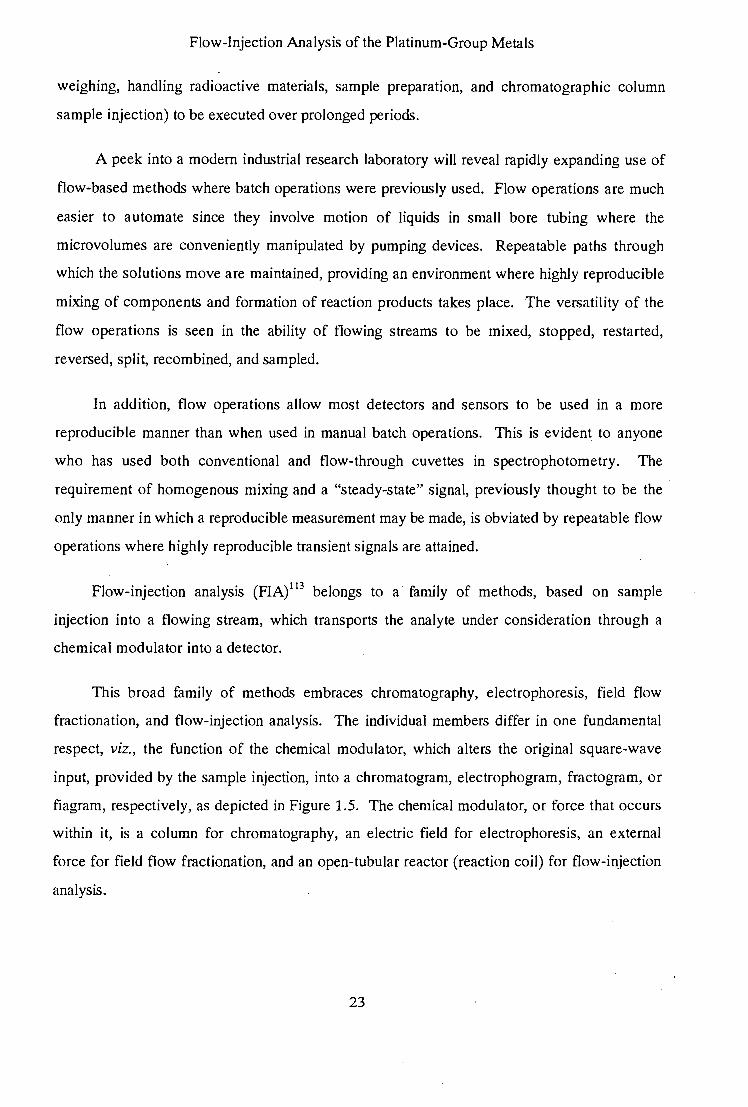
Flow-Injection Analysis of the Platinum-Group Metals
weighing, handling radioactive materials, sample preparation, and chromatographic column
sample injection) to be executed over prolonged periods.
A peek into a modem industrial research laboratory will reveal rapidly expanding use of
flow-based methods where batch operations were previously used. Flow operations are much
easier to automate since they involve motion of liquids in small bore tubing where the
microvolumes are conveniently manipulated by pumping devices. Repeatable paths through
which the solutions move are maintained, providing an environment where highly reproducible
mixing of components and formation of reaction products takes place. The versatility of the
flow operations is seen in the ability of flowing streams to be mixed, stopped, restarted,
reversed, split, recombined, and sampled.
In addition, flow operations allow most detectors and sensors to be used in a more
reproducible manner than when used in manual batch operations. This is evident to anyone
who has used both conventional and flow-through cuvettes in spectrophotometry. The
requirement of homogenous mixing and a "steady-state" signal, previously thought to be the
only manner in which a reproducible measurement may be made, is obviated by repeatable flow
operations where highly reproducible transient signals are attained.
Flow-injection analysis (FIA)113 belongs to a family of methods, based on sample
injection into a flowing stream, which transports the analyte under consideration through a
chemical modulator into a detector.
This broad family of methods embraces chromatography, electrophoresis, field flow
fractionation, and flow-injection analysis. The individual members differ in one fundamental
respect, viz., the function of the chemical modulator, which alters the original square-wave
input, provided by the sample injection, into a chromatogram, electrophogram, fractogram, or
fiagram, respectively, as depicted in Figure 1.5. The chemical modulator, or force that occurs
within it, is a column for chromatography, an electric field for electrophoresis, an external
force for field flow fractionation, and an open-tubular reactor (reaction coil) for flow-injection
analysis.
23
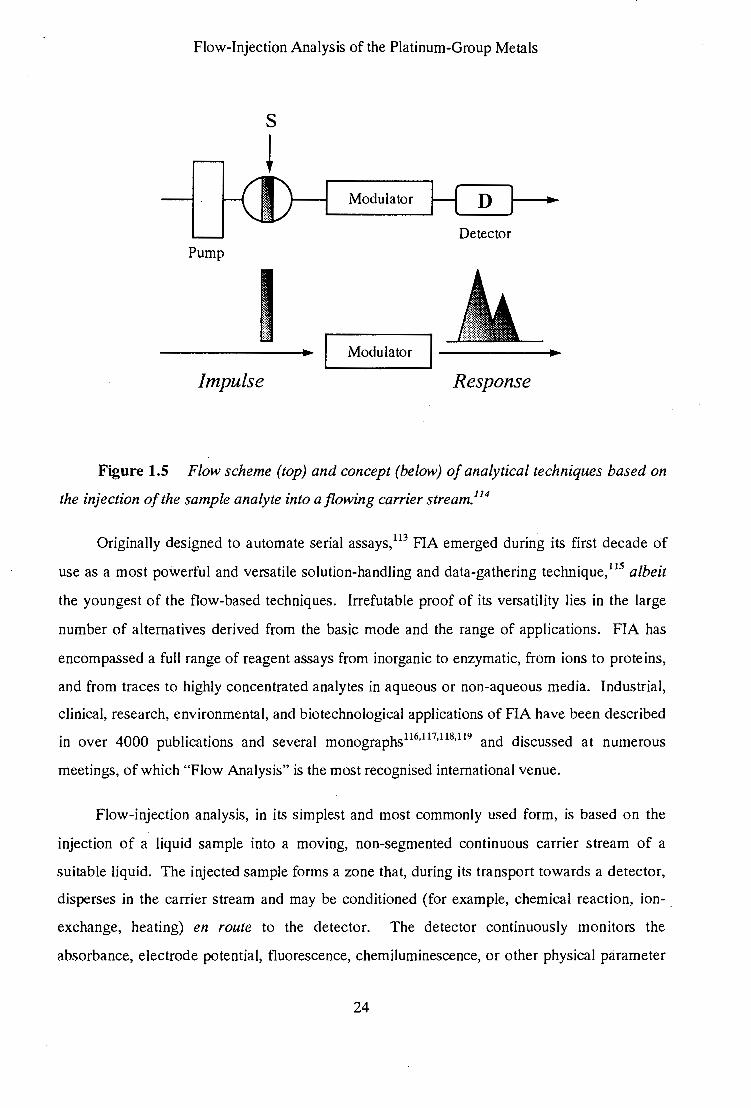
Flow-Injection Analysis of the Platinum-Group Metals
Modulator
Detector Pump
I Modulator
Impulse Response
Figure 1.5 Flow scheme (top) and concept (below) of analytical techniques based on
the injection of the sample analyte into a flowing carrier stream.114
Originally designed to automate serial assays, 113 FIA emerged during its first decade of
use as a most powerful and versatile solution~ handling and data-gathering technique, 115 albeit
the youngest of the flow-based techniques. Irrefutable proof of its versatility lies in the large
number of alternatives derived from the basic mode and the range of applications. FIA has
encompassed a full range of reagent assays from inorganic to enzymatic, from ions to proteins,
and from traces to highly concentrated analytes in aqueous or non-aqueous media. Industrial,
clinical, research, environmental, and biotechnological applications of FIA have been described
in over 4000 publications and several monographs116•117
'118
'119 and discussed at numerous
meetings, of which "Flow Analysis" is the most recognised international venue.
Flow-injection analysis, in its simplest and most commonly used form, is based on the
injection of a liquid sample into a moving, non-segmented continuous carrier stream of a
suitable liquid. The injected sample forms a zone that, during its transport towards a detector,
disperses in the carrier stream and may be conditioned (for example, chemical reaction, ion-.
exchange, heating) en route to the detector. The detector continuously monitors the
absorbance, electrode potential, fluorescence, chemiluminescence, or other physical parameter
24
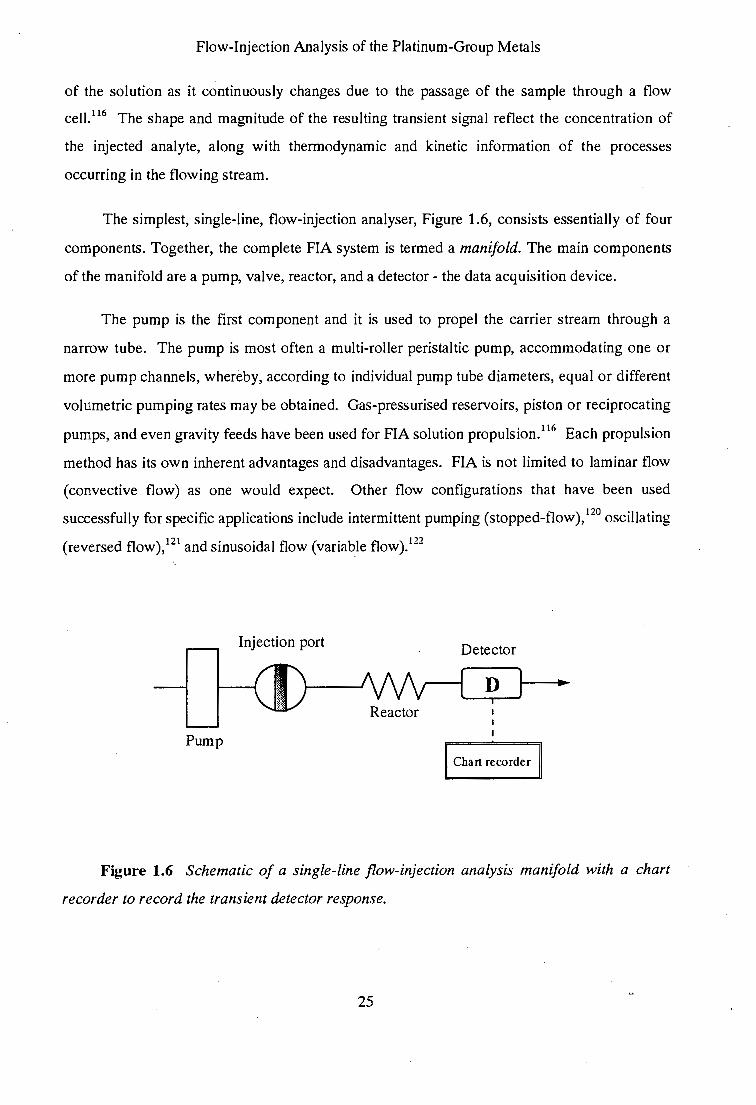
-I I
Flow-Injection Analysis of the Platinum-Group Metals
of the solution as it continuously changes due to the passage of the sample through a flow
cell.116 The shape and magnitude of the resulting transient signal reflect the concentration of
the injected analyte, along with thermodynamic and kinetic information of the processes
occurring in the flowing stream.
The simplest, single-line, flow-injection analyser, Figure 1.6, consists essentially of four
components. Together, the complete FIA system is termed a manifold. The main components
of the manifold are a pump, valve, reactor, and a detector - the data acquisition device.
The pump is the first component and it is used to propel the carrier stream through a
narrow tube. The pump is most often a multi-roller peristaltic pump, accommodating one or
more pump channels, whereby, according to individual pump tube diameters, equal or different
volumetric pumping rates may be obtained. Gas-pressurised reservoirs, piston or reciprocating
pumps, and even gravity feeds have been used for FIA solution propulsion.116 Each propulsion
method has its own inherent advantages and disadvantages. FIA is not limited to laminar flow
(convective flow) as one would expect. Other flow configurations that have been used
successfully for specific applications include intermittent pumping (stopped-flow), 120 oscillating
(reversed flow), 121 and sinusoidal flow (variable flow). 122
Injection port Detector
Pump Chart recorder
Figure 1.6 Schematic of a single-line flow-injection analysis manifold with a chart
recorder to record the transient detector response.
25
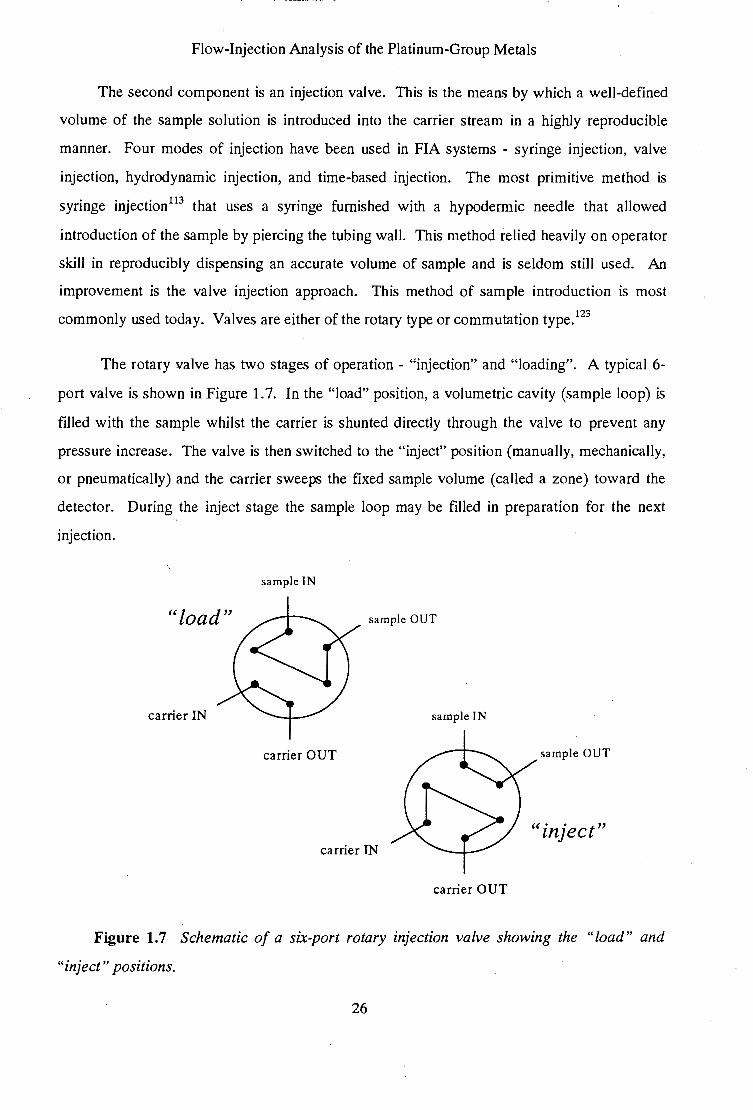
Flow-Injection Analysis of the Platinum-Group Metals
The second component is an injection valve. This is the means by which a well-defined
volume of the sample solution is introduced into the carrier stream in a highly reproducible
manner. Four modes of injection have been used in FIA systems - syringe injection, valve
injection, hydrodynamic injection, and time-based injection. The most primitive method is
syringe injection113 that uses a syringe furnished with a hypodermic needle that allowed
introduction of the sample by piercing the tubing wall. This method relied heavily on operator
skill in reproducibly dispensing an accurate volume of sample and is seldom still used. An
improvement is the valve injection approach. This method of sample introduction is most
commonly used today. Valves are either of the rotary type or commutation type. 123
The rotary valve has two stages of operation - "injection" and "loading". A typical 6-
port valve is shown in Figure 1. 7. In the "load" position, a volumetric cavity (sample loop) is
filled with the sample whilst the carrier is shunted directly through the valve to prevent any
pressure increase. The valve is then switched to the "inject" position (manually, mechanically,
or pneumatically) and the carrier sweeps the fixed sample volume (called a zone) toward the
detector. During the inject stage the sample loop may be filled in preparation for the next
injection.
sample IN
"load" sample OUT
carrier IN sample IN
carrier OUT sample OUT
"inject" carrier IN
carrier OUT
Figure 1. 7 Schematic of a six-port rotary injection valve showing the "load" and
"inject" positions.
26
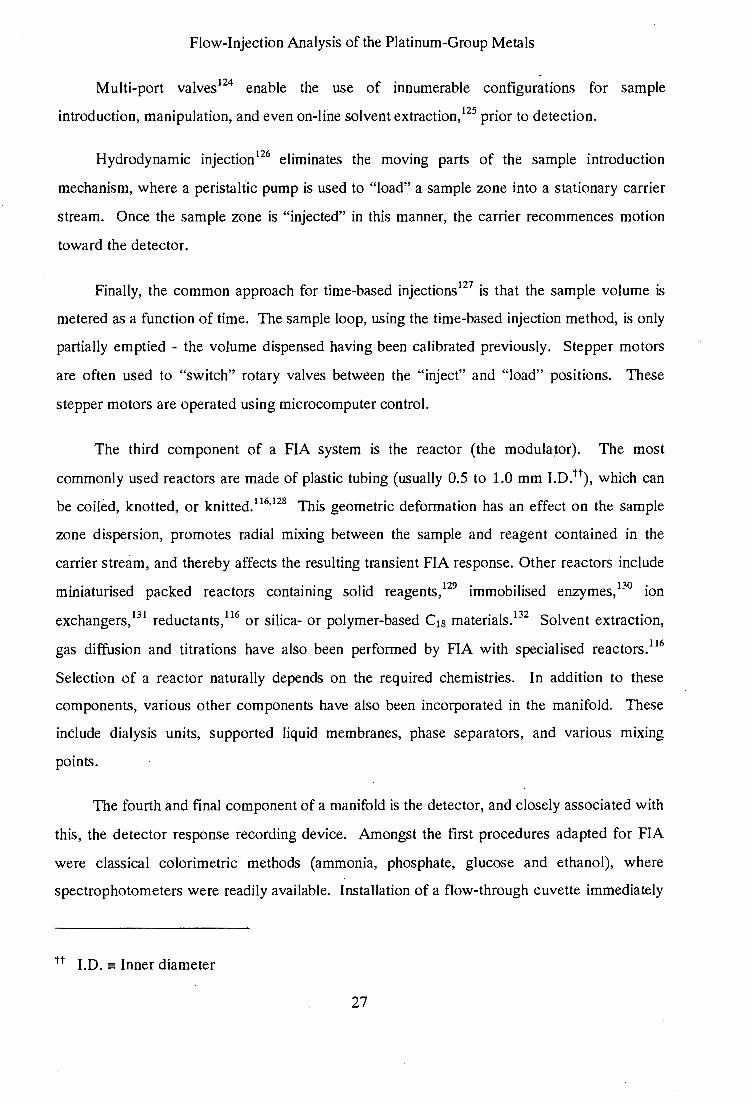
Flow-Injection Analysis of the Platinum-Group Metals
Multi-port valves124 enable the use of innumerable configurations for sample
introduction, manipulation, and even on-line solvent extraction, 125 prior to detection.
Hydrodynamic injection 126 eliminates the moving parts of the sample introduction
mechanism, where a peristaltic pump is used to "load'~ a sample zone into a stationary carrier
stream. Once the sample zone is "injected" in this manner, the carrier recommences motion
toward the detector.
Finally, the common approach for time-based injections127 is that the sample volume is
metered as a function of time. The sample loop, using the time-based injection method, is only
partially emptied - the volume dispensed having been calibrated previously. Stepper motors
are often used to "switch" rotary valves between the "inject" and "load" positions. These
stepper motors are operated using microcomputer control.
The third component of a FIA system is the reactor (the modulator). The most
commonly used reactors are made of plastic tubing (usually 0.5 to 1.0 mm I.D.tt), which can
be coiled, knotted, or knitted. 116•128 This geometric deformation has an effect on the sample
zone dispersion, promotes radial mixing between the sample and reagent contained in the
carrier stream, and thereby affects the resulting transient FIA response. Other reactors include
miniaturised packed reactors containing solid reagents, 129 immobilised enzymes, 130 ion
exchangers,131 reductants, 116 or silica- or polymer-based C18 materials.132 Solvent extraction,
gas diffusion and titrations have also been performed by FIA with specialised reactors. 116
Selection of a reactor naturally depends on the required chemistries. In addition to these
components, various other components have also been incorporated in the manifold. These
include dialysis units, supported liquid membranes, phase separators, and various mixing
points.
The fourth and final component of a manifold is the detector, and closely associated with
this, the detector response recording device. Amongst the first procedures adapted for FIA
were classical colorimetric methods (ammonia, phosphate, glucose and ethanol), where
spectrophotometers were readily available. Installation of a flow-through cuvette immediately
tt I.D. =Inner diameter
27
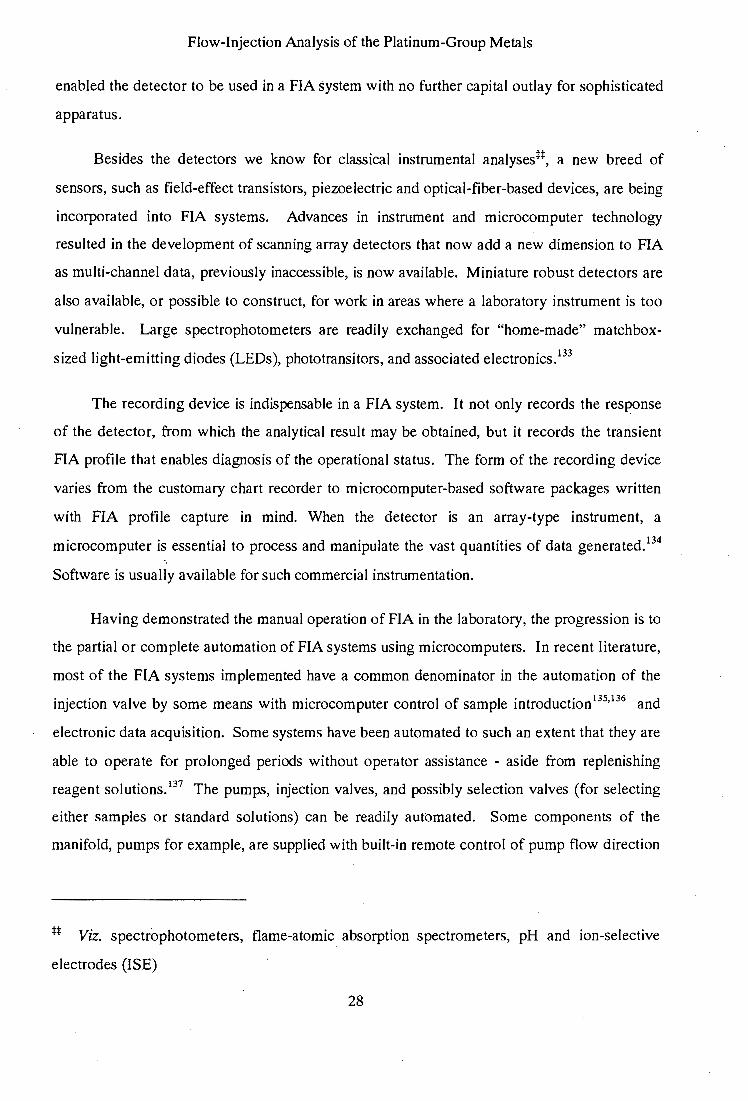
Flow-Injection Analysis of the Platinum-Group Metals
enabled the detector to be used in a FIA system with no further capital outlay for sophisticated
apparatus.
Besides the detectors we know for classical instrumental analyses**, a new breed of
sensors, such as field-effect transistors, piezoelectric and optical-fiber-based devices, are being
incorporated into FIA systems. Advances in instrument and microcomputer technology
resulted in the development of scanning array detectors that now add a new dimension to FIA
as multi-channel data, previously inaccessible, is now available. Miniature robust detectors are
also available, or possible to construct, for work in areas where a laboratory instrument is too
vulnerable. Large spectrophotometers are readily exchanged for "home-made" matchbox
sized light-emitting diodes (LEOs), phototransitors, and associated electronics.133
The recording device is indispensable in a FIA system. It not only records the response
of the detector, from which the analytical result may be obtained, but it records the transient
FIA profile that enables diagnosis of the operational status. The form of the recording device
varies from the customary chart recorder to microcomputer-based software packages written
with FIA profile capture in mind. When the detector is an array-type instrument, a
microcomputer is essential to process and manipulate the vast quantities of data generated.134
Software is usually available for such commercial instrumentation.
Having demonstrated the manual operation of FIA in the laboratory, the progression is to
the partial or complete automation of FIA systems using microcomputers. In recent literature,
most of the FIA systems implemented have a common denominator in the automation of the
injection valve by some means with microcomputer control of sample introduction135'136 and
electronic data acquisition. Some systems have been automated to such an extent that they are
able to operate for prolonged periods without operator assistance - aside from replenishing
reagent solutions.137 The pumps, injection valves, and possibly selection valves (for selecting
either samples or standard solutions) can be readily automated. Some components of the
manifold, pumps for example, are supplied with built-in remote control of pump flow direction
tt Viz. spectrophotometers, flame-atomic absorption spectrometers, pH and ion-selective
electrodes (ISE)
28
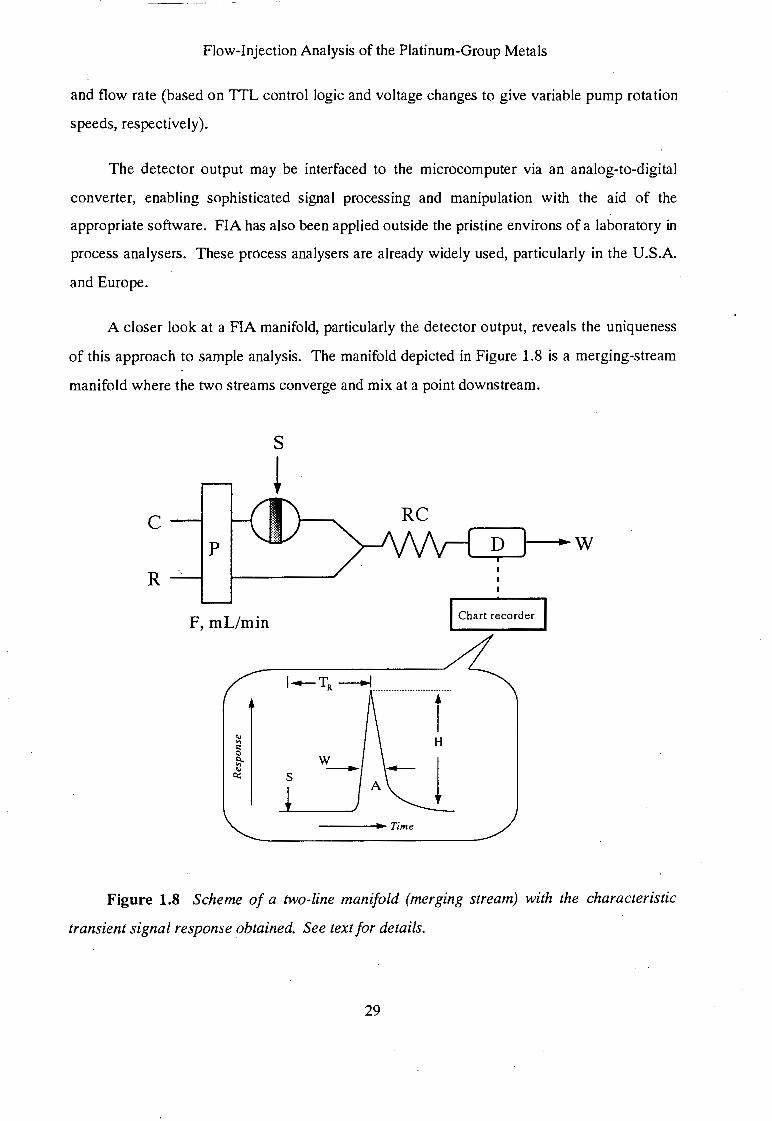
Flow-Injection Analysis of the Platinum-Group Metals
and flow rate (based on TTL control logic and voltage changes to give variable pump rotation
speeds, respectively).
The detector output may be interfaced to the microcomputer via an analog-to-digital
converter, enabling sophisticated signal processing and manipulation with the aid of the
appropriate software. FIA has also been applied outside the pristine environs of a laboratory in
process analysers. These process analysers are already widely used, particularly in the U.S.A.
and Europe.
A closer look at a FIA manifold, particularly the detector output, reveals the uniqueness
of this approach to sample analysis. The manifold depicted in Figure 1.8 is a merging-stream
manifold where the two streams converge and mix at a point downstream.
c
R
F, mL/min
1--"I --.1 R •·••················•·········
i H
s 1 w ----_.Time
Figure 1.8 Scheme of a two-line manifold (merging stream) with the characteristic
transient signal response obtained. See text for details.
29
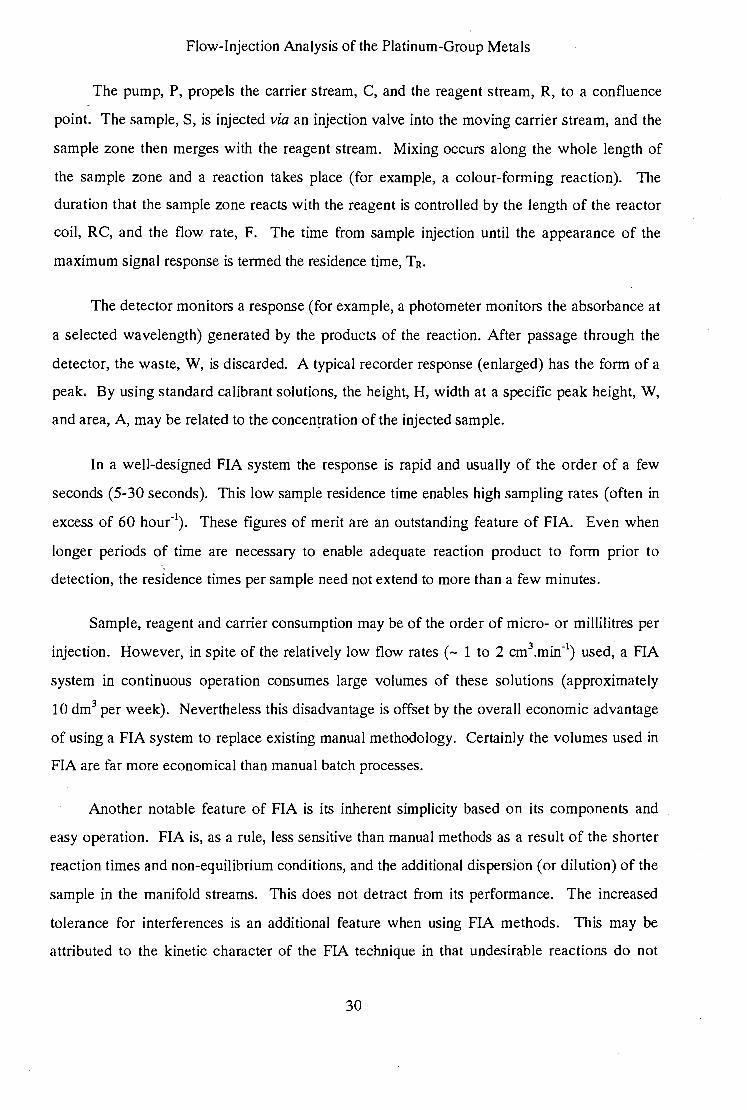
• •
Flow-Injection Analysis of the Platinum-Group Metals
The pump, P, propels the carrier stream, C, and the reagent stream, R, to a confluence
point. The sample, S, is injected via an injection valve into the moving carrier stream, and the
sample zone then merges with the reagent stream. Mixing occurs along the whole length of
the sample zone and a reaction takes place (for example, a colour-forming reaction). The
duration that the sample zone reacts with the reagent is controlled by the length of the reactor
coil, RC, and the flow rate, F. The time from sample injection until the appearance of the
maximum signal response is termed the residence time, TR.
The detector monitors a response (for example, a photometer monitors the absorbance at
a selected wavelength) generated by the products of the reaction. After passage through the
detector, the waste, W, is discarded. A typical recorder response (enlarged) has the form of a
peak. By using standard calibrant solutions, the height, H, width at a specific peak height, W,
and area, A, may be related to the concen!ration of the injected sample.
In a well-designed FIA system the response is rapid and usually of the order of a few
seconds (5-30 seconds). This low sample residence time enables high sampling rates (often in
excess of 60 houf1). These figures of merit are an outstanding feature of FlA. Even when
longer periods of time are necessary to enable adequate reaction product to form prior to \
detection, the residence times per sample need not extend to more than a few minutes.
Sample, reagent and carrier consumption may be of the order of micro- or millilitres per
injection. However, in spite of the relatively low flow rates (- 1 to 2 cm3.min-1) used, a FIA
system in continuous operation consumes large volumes of these solutions (approximately
10 dm3 per week). Nevertheless this disadvantage is offset by the overall economic advantage
of using a FIA system to replace existing manual methodology. Certainly the volumes used in
FIA are far more economical than manual batch processes.
Another notable feature of FIA is its inherent simplicity based on its components and
easy operation. FIA is, as a rule, less sensitive than manual methods as a result of the shorter
reaction times and non-equilibrium conditions, and the additional dispersion (or dilution) of the
sample in the manifold streams. This does not detract from its performance. The increased
tolerance for interferences is an additional feature when using FIA methods. This may be
attributed to the kinetic character of the FIA technique in that undesirable reactions do not
30
Flow-Injection Analysis of the Platinum-Group Metals
have the opportunity to take place in the short residence period. Their effect on the final signal
is thereby significantly reduced. These features have no doubt contributed to the world-wide
use and recognition of FlA.
Future application of flow-injection analysis in the analytical laboratory and in industrial
fields will no doubt be of notable proportion considering the advances made to date. Elo
Hansen,138 one of the two "inventors" of FIA, comments critically that FIA is far from being
exploited because "the ultimate test for an analytical technique is not that it can do better
than what can be done by other means, but that it permits us to do something that cannot be
done in any other manner." It is with this statement in mind that this work to study and
determine the platinum-group metals by flow-injection analysis was undertaken.
1. 7 Objectives of Research
In view of the wealth of information regarding the spectrophotometric determination of
the PGMs, and considering the potential of FIA in the research and process environments, a
combination of these two would no doubt be powerfully synergistic. Such a solution, or
substantial improvements to the problems encountered in the batch-mode method of analysis,
would be unique; particularly if multi-element capability could be added. A method for the
simultaneous determination of the PGMs would require a suitable multi-channel data
acquisition system and sophisticated software for processing this multi-channel data.
As analytes in multi-component systems are not physically separated in FIA, such data
processing is required to enable accurate deconvolution of overlapping absorption spectra.
The field of chemometrics involves the employment of mathematical methods to extract
chemical information from data collected from multi-dimensional detectors. The current trends
show a definite propensity toward the use of multi-channel detectors to enable resolution of
multi-component systems.
Chapter 2 of this thesis is devoted to the theory and application of quantitative analytical
visible spectrophotometry. Single and multi-component methods will be presented, along with
criteria for the selection of analytical wavelengths to facilitate multi-component mixture
31
Flow-Injection Analysis of the Platinum-Group Metals
resolution. The principles of FIA as a powerful analytical tool based on controlled solution
manipulation is introduced.
The requirements of a data acquisition system and sophisticated software for prqcessing
multi-channel data are addressed in Chapter 3. Computer-aided Flow Analysis methodology
enables facile automation and control of the data acquisition. The development of a new and
versatile software package, based on the Microsoft® Windows TM operating environment, is
outlined and serves as the mathematical tool for single and multi-component analysis.
In Chapter 4, the design and optimisation of the FIA manifold is described. An emphasis
is placed on the development of FIA methods where careful consideration of several
experimental parameters is undertaken. The concept of "Flow Chemography", 139 where the
data from flow-based techniques is presented graphically or pictorially, is illustrated by the use
of the developed software, in conjunction with third-party graphical software, to. represent
three-dimensional surfaces that are used to facilitate manifold optimisation.
The development of single component methods for the determination of the PGMs in an
"on-line" fashion using FIA is the topic of Chapter 5. Exploration of the finer details of the
chemistry occurring in solution is undertaken by means of multi-dimensional plots. A critical
investigation of the complexes . formed on reaction of Pd(II) with tin(II) chloride will be
undertaken. In addition, the effect of various interferences is determined.
Chapter 6 is devoted to the development of methodology for the multi-component
determination of the PGMs by FlA. Binary component mixtures of some PGMs in tin(II)
chloride are considered with the view to illustrate the complexity, yet in some ways simple
task, of multi-component mixture resolution. Preliminary steps toward a mathematical method
of wavelength selection for MCA will be outlined. The results of investigations into the use of
tin(II) bromide as a reagent for the simultaneous determination of PGMs are reported.
A comprehensive summary of this work and its significant findings is presented ill
Chapter 7. The direction for future research involving multi-component FIA, and FIA ill
general, is given. Finally, details pertaining to the experimental work such as the analytical
instrumentation used, chemicals and their suppliers, and FIA apparatus are noted in Chapter 8.
32
··-- -- ---~~-.,..__. ................ ---· . . : .~--,-.--~~- _-;_. ' - ·--. -
Flow-Injection Analysis of the Platinum-Group Metals
1.8 References
1. "Kirk-Othmer Encyclopaedia of Chemical Technology", 3rd edn., John Wiley & Sons,
New York, 1982, Vol18, 228.
2. Nathan, B., "The Platinum Yearbook 1991", Woodhead, London, 1991.
3. Coombes, J.S., "Platinum 1993: Interim Review", Johnson Matthey, London.
4. Walsh, M.P., Platinum Metals Rev., 1992, 36, 126; ibid, 1993, 36, 7.
5. Coombes, J.S., "Platinum 1991", Johnson Matthey, London.
6. "MintekAnnual Report 1993", Council for Mineral Technology, Randburg, Rep. S.
Afr., 1993, 25.
7. Gooding, K., Financial Times, November 1994, 26.
8. Kelland, L.K., Clarke, S.J., and McKeage, M.J., Platinum Metals Rev., 1992, 36, 178.
9. Rosenberg, B., VanCamp, L., Trosko, J.E., and Mansour, V.H., Nature (London),
1969, 222, 385.
10. Date, A.R., Davis, A.E., and Cheung, Y.Y.,Analyst, 1987, 112, 1217.
11. Smith, E.A., "The Sampling andAssay of the Precious Metals", Revised 2nd edn.,
Met-Chem. Research, Colorado, 1987.
12. Van Loon, J.C., Pure Appl. Chern., 1977,49, 1495.
13. Robert, R.V.D., VanWyk, E., and Palmer, R., Nat. Inst. Metal/., Rep. S. Afr., 1971,
No.1371.
14. Marckzenko, Z., "Separation and Spectrophotometric determination of the elements.",
2nd edn., Ellis Horwood Ltd., England, 1986, 453.
15. Komatsu, S., and Onishi, K., 1. Chern. Soc. Japan, 1955, 76, 661.
16. El Ghaniry, M., and Frei, R., Talanta, 1969, 16, 235.
17. Danilova, V.N., and Lisichenok, S.L., Zh. Anti!. Khim., 1969, 24(7),1061.
18. Fortsythe, J.H.M., Magee, R.J., and Wilson, C.U., Talanta, 1960, 3, 324.
19. Kirkland, J., and Yoe, J., Analyt. Chern., 1954, 26, 1335.
20. Beamish, F.E., and McBryde, W.A.E., Anal. Chim. Acta, 1958, 18, 551.
21. Bera, B., and Chakrabartty, M., Mikrochim. Acta, 1966, 6, 1094.
22. Bankovskii, Y.A., and Ievinysh, A.F., Zh. Anal. Khim., 1960, 13, 507.
33
Flow-Injection Analysis of the Platinum-Group Metals
23. Rod ford, A.J ., Analyst, 1960, 85, 445.
24. Pantani, F., and Piccardi, G., Anal. Chim. Acta, 1960, 22, 231.
25. Faye, G.H., and Inman, N.R.,Analyt. Chem., 1961,33, 278.
26. Menis, 0., and Rains, T.C., Anal. Chem., 1955, 27, 532.
27. Cheng, K.L., Anal. Chem., 1954, 26, 1894.
28. Stanley, R.W., and Cheney, G.E., Talanta, 1966, 13, 1619.
29. Ginzburg, S.I., et al., ''Analytical Chemistry of the Platinum Metals", John Wiley and
Sons, New York, 1975.
30. Busev, AI., and Shishkova, AN., Zh. Anal. Khim., 1968, 23, 1675.
31. Nilsch, W., Mikrochim. Acta, 1954, 530.
32. MacNevin, W.M., and Kriege, O.H., Anal. Chem., 1954, 26, 1768.
33. Khattak, M.A., and Magee, R.J., Anal. Chim. Acta, 1966, 35(1),17.
34. Payne, S.T., Analyst, 1960, 85, 698.
35. Ryan, D., Analyt. Chem., 1950, 22, 599.
36. Wilson, R., and Jacobs, W., Analyt.Chem., 1961,33, 1650.
37. Ayres, G.; and Johnson, F., Anal. Chim. Acta, 1960, 23, 448.
38. Berman, S., and Ironside, R., Can. J. Chem., 1958, 36, 1151.
39. Busev, A.l., Groessl, V.G., and Ivanov, V.M., Anal. Lett., 1968, 1( 4), 267.
40. Otomo, M.,JapanAnalyst, 1968, 17, 125.
41. Ayres, G.H., Tuffly, B.L., and Forrester, J.S., Anal. Chem., 1955, 27, 1742.
42. Berg, E.W., and Youmans, H.L.,Anal. Chim.Acta, 1961,25,366.
43. Ayres, G.H., and Young, F.,Analyt. Chem., 1952, 24, 165.
44. Pantini, F., Talanta, 1962, 9, 15.
45. Beamish, F.E., and Van Loon, J.C., "Recent Advances in the Analytical Chemistry of
the Noble Metals", Vol. 48, Permagon Press, New York, 1972.
46. Ayres, G.H., and Bolleter, W.T.,Anal. Chem., 1957,29, 72.
47. Tschugaeff, L., C. R. Acad. Sci. Paris, 1918, 167, 235.
48. Belew, W.L., Wilson, G.R., and Corbin, L.T.,Analyt. Chem., 1961,33, 886.
49. Van Loon, J.C., Trends in Anal. Chem., 1985, 4( 4), 24.
50. Strasheim, A., and Wessels, G.J., Appl. Spectrosc., 1963, 17, 65.
34
Flow-Injection Analysis of the Platinum-Group Metals
51. Mallett, R.C., Pearton, D.C.G., Ring, E.J., and Steele, T.W., Talanta, 1972, 19, 181.
52. "Council for Mineral Technology Bulletin", Rep. S. Afr., No. 40, Aug., 1991.
53. Schneider, R., Poggendorff's Ann., 1869, 136, 105.
54. . Ditte, M.A., Ann. Chim. Phys., 1882, 27, 145.
55. Wohler, L., Chem. -Ztg., 1907, 31, 938.
56. Spengel, A., and Wohler, L., Z. Chem. Ind. Kolloide, 1909, 7, 243.
57. Thompson, S.O., Beamish, F.E., and Scott, M., Ind. Eng. Chem., 1937, 9, 420.
58. Sandell, E.B., "Colorimetric Determination of Traces of Metals", 3rd edn.,
lnterscience, New York, 1959.
59. Meyer, A.S., and Ayres, G.H.,1. Am. Chem. Soc., 1955, 77, 2671.
60. Elizarova, G.L., and Matrienko, L.G., Russ. 1. Inorg. Chem., 1973, 18, 254.
61. Young, J.F., Gillard, R.D., and Wilkinson, G., 1. Chem. Soc., 1964, 5176.
62. Baird, M.C., 1. Inorg. Nucl. Chem., 1967, 29, 367.
63. Parish, R.V., and Rowbotham, P.J.,1. Chem. Soc. Dalton Trans., 1973, 37.
64. Nelson, J.H., Cooper, V., and Rudolph, R.W., Inorg. Nucl. Chem. Lett., 1980, 16, 263.
65. Koch, K.R., Fazakerley, G.V., and Dijkstra, E., Inorg. Chim. Acta, 1980, 45(2), 51.
66. Ayres, G.H., and Meyer, A.S., Anal. Chem., 1951, 23(2), 299.
67. Elizarova, G.L., and Matrienko, L.G., Russ. 1. Inorg. Chem., 1970, 15(6), 823.
68. Ahmed, N., and Koch, K.R., Anal. Chim. Acta, 1984, 162, 347.
69. Treadwell, F.P., and Hall, W.T., "Analytical Chemistry", 6th edn., Vol. 1, John Wiley
and Sons, New York, 1921.
70. Hunter, D., Milton, R., and Perry, K.M.A., Brit. 1. Ind. Med., 1945, 2, 95.
71. Moodley, K.G., and Nicol, M.J., 1. Chem. Soc. Dalton, 1977, 239.
72. Young, J.F., Gillard, R.D., and Wilkinson, G.,1. Chem. Soc., 1964, 5176.
73. Wilson, W.L., Holt, M.S., and Nelson, J.H., Chem. Rev., 1989, 89, 11.
74. Alcock, N.W., and Nelson, J.H., Inorg. Chem., 1982, 21, 1196.
75. Cramer, R.D., Lindsey Jr, R.V., Prewitt, C.T., and Stolberg, U.G.,1. Amer. Chem.
Soc., 1965, 87(3), 658.
76. Lindsey Jr, R.V., Parshall, G.W., and Stolberg, U.G., 1. Amer. Chem. Soc., 1965,
87(3), 659.
35
Flow-Injection Analysis of the Platinum-Group Metals
77. Lindsey Jr, R.V., Parshall, G.W., and Stolberg, U.G., Inorg. Chern., 1966, 5, 109.
78. Estes, J.W., and Burger, W.M.,J.Amer. Chern. Soc., 1942,64, 2715; 1943,65, 1484.
79. Shukla, S.K., Ann. Chim.(Paris), 1961, 13, 1432.
80. Khattak, M.A., and Magee, R.J., Talanta, 1965, 12, 733.
81. Pollard, W.B.,Analyst, 1942, 67, 184.
82. Adams, D.M., and Chandler, R.J.; Chern. Ind., 1965, No.6, 269.
83. Shlenskaya, V.I., Biryukov, A.A., and Moryakova, L.N., Russ. J. Inorg. Chern., 1969,
14, 255.
84. Zayats, AI., Psareva, T.S., and Shabanov, V.F., Russ. J. Inorg. Chern., 1976, 21, 393.
85. Khattak, M.A., and Magee, R.J., Chern. Commun., 1959, 17, 400.
86. Khattak, M.A., and Magee, R.J.,Anal. Chim. Acta, 1966,35, 17.
87. McBryde, W.A.E., and Yoe, J.H., Anal. Chern., 1948, 20(11), 1094.
88. Wolbling, H., Ber., 1934, 67, 773.
89. Kalinin, S.K., and Yakovleva, G.A., Zh. Anal. Khim., 1970, 25(2), 312.
90. Beamish, F.E., Talanta, 1965, 12, 789.
91. Smith, M.E., Analyt. Chern., 1958, 30, 912.
92. Karttunen, J.O., and Evans, H.B., Analyt. Chern., 1963, 35, 1043.
93. Cheneley, R.B., and Osmond, R.G., U.S. Atomic Energy Res. Establ., 1956, No. 10,
1870.
94. Furlani, C., Zinato, E., and Furlan, F., Atti. Accad. Naz. Lincei, Rend. Cl. Sci. Fis.
Mat., natur., 1965,38,517.
95. Ayres, G.H., Tuffly, B.L., and Forrester, J.S.,Anal. Chern., 1955, 27, 230.
96. Stein, H.H., M.Sc Thesis, Univ. of Minnesota (cited in ref. 58).
97. Maynes, A.D., and McBryde, W.A.E., Analyst, 1954, 79, 230.
98. Beamish, F.E., and Van Loon, J.C., ''Analysis of the Noble Metals", Academic Press,
New York, 1977.
99. Khattak, M.A., and Magee, R.J., Anal. Chim. Acta, 1969, 45, 297.
100. Kalinin, S.K., Stolyarov, K.P., and Yakovleva, G.A., Zh. Anal. Khim., 1970, 25(1),
107.
101. Kalinin, S.K., and Yakovleva, G.A., Zh. Anal. Khim., 1978, 33(10), 1995.
36
Flow-Injection Analysis of the Platinum-Group Metals
102. Koch, K.R., and Wyrley-Birch, J.M., Inorg. Chim. Acta, 1985, 102, L5.
103. Davies, A.G., Wilkinson, G., and Young, J.F.,1.Am. Chern. Soc., 1963,85,1692.
104. Klinskaya, I. Yu., Rosenkevich, M.B., Sakharovski, Yu.l., Kinet. Katal., 1978, 19,
329.
105. Kimura, T., Miki, E., Mizumachi, K., and Ishimori, T., Chern. Lett., 1976, 1325.
106. Antonov, P.G., Kukushkin, Yu. N., Anufriev, V.I., Vasil'ev, LN., and Konovalov,
L.V., Russ. 1. Inorg. Chern., 1979, 24(2), 231.
107. Saito, Y., Moriyama, H., Aoki, T., and Shinoda, S., 1. Chern. Soc., Dalton. Trans.,
1981, 639.
108. Iwasaki, S., Nagai, T., Mild, E., Mizumacji, K., and Ishimori, T., Bull. Chern. Soc.
1pn., 1984, 57, 386.
109. Pantani, F., and Piccardi, G., Anal. Chim. Acta, 1960, 22, 231.
110. Pietropaolo, R., Grazini, M., and Beiluco, V., Inorg. Chern., 1969, 8, 7.
111. Idem; ibid., 1969, 8, 1506.
112. Beamish, F. E., "The Analytical Chemistry of the Noble Metals", Permagon Press,
Oxford, 1966.
113. Ruzicka, J., and Hansen, E.H., Anal. Chim. Acta, 1975, 78, 145.
114. Ruzicka, J.,Anal. Chim. Acta, 1992,261, 3.
115. Ruzicka, J., and Hansen, E.H., Anal. Chim. Acta, 1986, 179, 1.
116. Ruzicka, J., and Hansen, E.H., "Flow Injection Analysis", 2nd edn., Wiley, New York,
1988; 1stedn., 1981.
117. Ueno, K., and Kina, K., "Introduction toFlowlnjectionAnalysis", Kodansha
Scientific, Toyko, 1983.
118. Valcarcel, M., and Luque de Castro, M.D., "Flow Injection Analysis. Principles and
Applications.", Horwood, Chichester, 1987.
119. Karlberg, B., and Pacey, G.E., "Flow Injection Analysis- a Practical Guide",
Elsevier, Amsterdam, 1989.
120. Ruzicka, J., and Hansen, E.H.,Anal. Chim. Acta, 1978, 99, 37.
121. Olsen, S., Ruzicka, J., and Hansen, E.H., Anal. Chim. Acta, 1982, 136, 101.
122. Marshall, G.D., Ruzicka, J., and Christian, G.D.,Anal. Chern., 1990, 62, 1891.
37
Flow-Injection Analysis of the Platinum-Group Metals
123. Bergamin, H., Krug, F.J., and Zagatto, E.A.G., Anal. Chirn. Acta, 1986, 179, 103.
124. Erickson, B.C., Ruzicka, J., and Kowalski, B., Anal. Chern., 1987, 59, 1246.
125. Karlberg, B., Fres. Z. Anal. Chern., 1988,329, 660.
126. Ruzicka, J., and Hansen, E.H.,Anal. Chirn. Acta, 1983,45, 1.
127. Tyson, J.F., and Stone, D.C., Analyst, 1987, 112, 515 ..
128. Selavka, C.M., Jiao, K-S., and Krull, I.S., Anal. Chem., 1987, 55, 2221.
129. Almuaibed, A.M., and Townshend, A., Anal. Chim. Acta, 1991, 245, 115.
130. Gorton, L., and Ogren, L., Anal. Chirn. Acta, 1981, 130, 45.
131. Ruzicka, J., Hansen, E.H., Olsen, S., and Pessenda, L.C.R., Analyst, 1983, 108, 905.
132. Ruzicka, J., and Arnhdahl, A., Anal. Chirn. Acta, 1988, 216, 243.
133. Marshall, G.D., Taylor, M.J.C., Barnes, D.E., and Williams, S.J.S., Process Control
and Quality, 1992, 2, 249.
134. Owen; A.J., "The Diode-Array Advantage in UV/Visible Spectroscopy", Hewlett
Packard, Germany, 1988.
135. Rios, A., Valcercel, M., and Agudo, M., Anal. Chirn. Acta, 1992, 264, 265.
136. Romero-Saldana, M., Rios, A., Luque de Castro, M.D., and Valcarcel, M., Talanta,
1991, 38(3), 291.
137. Toei, K., et al., Anal. Chim. Acta, 1992, 261, 345.
138. Hansen, E.H., Quim. Analitica, 1989, 8(2), 139.
139. Kowalski, B.R., Ruzicka, J., and Christian, G.D., Trends in Anal. Chem., 1990, 9(1),
8.
38
Flow-Injection Analysis of the Platinum-Group Metals
Chapter 2.
Theory
2.1 Analytical Visible Spectrophotometry
Optical spectrospcopy encompasses methods developed for the investigation of matter
with the aid of electromagnetic radiation, which may interact with the system. Spectrometry
deals with the measurements of the physical phenomena that provide informative data on the
system. One variant of spectroscopy is that of absorption methods.
Analytical visible spectrometric methods for the determination of elements are based on
the absorption of visible radiation by sample solutions and are of particular significance for
chemical analysis. Spectrometry involves the use of a spectrometer. A spectrometer is used to
investigate absorption and emission spectra over almost the whole range of the electromagnetic
spectrum. When a spectrometer is fitted with a phototransducer it is known as a
spectrophotometer.
The basis of spectrophotometric methods is the relationship established between the
emitted or absorbed radiation intensity and the concentration of atoms or molecules in a
particular system.1 In order to determine a species spectrophotometrically, the species is
usually converted into a coloured complex by some form of reaction (for example, heat,
reagent addition, pH change). The inherent colour of the original species is used less often.
Spectrophotometric methods are remarkable for their versatility, sensitivity, and
precision. All the elements, except the noble gases, may be determined in this manner. A very
extensive range of concentrations may be covered, from macroquantities to traces (less than
0.01% of a solid sample). These methods are among the most precise instrumental methods at
the disposal of the analytical scientist.
Furthermore, the basic apparatus required, a spectrophotometer, IS relatively
inexpensive. Current trends in spectrophotometric instrumental development, particularly in
39
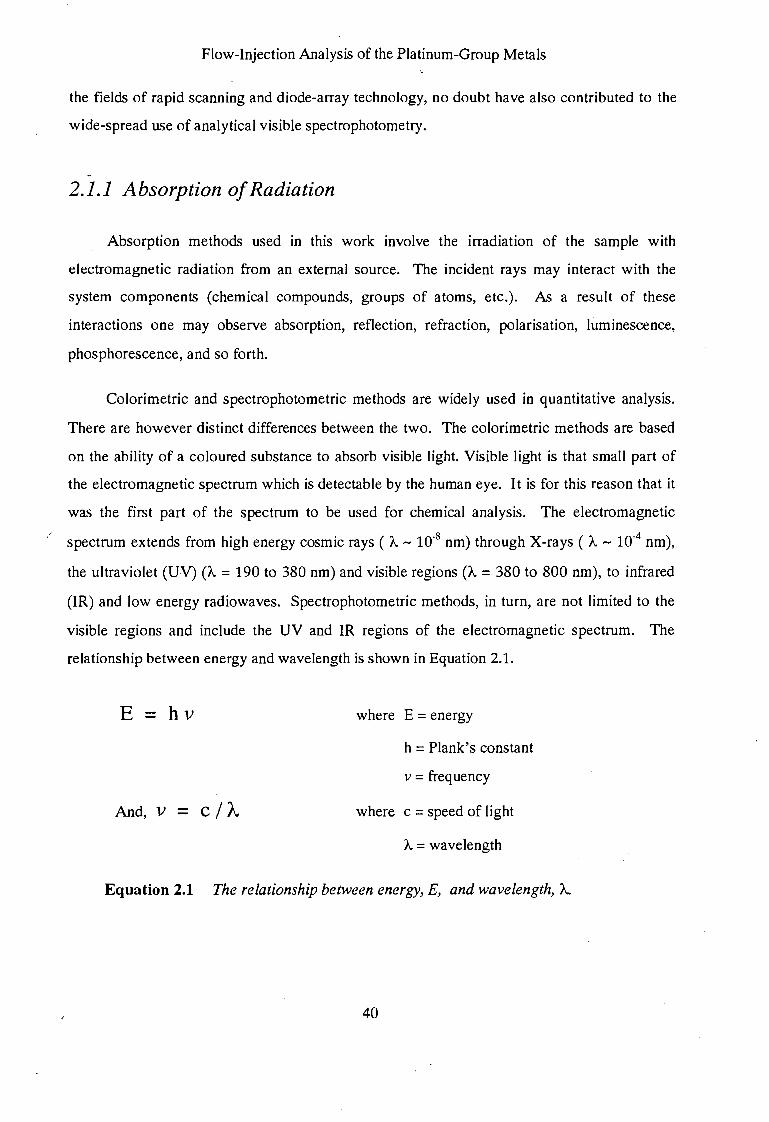
Flow-Injection Analysis of the Platinum-Group Metals
the fields of rapid scanning and diode-array technology, no doubt have also contributed to the
wide-spread use of analytical visible spectrophotometry.
2.1.1 Absorption of Radiation
Absorption methods used in this work involve the irradiation of the sample with
electromagnetic radiation from an external source. The incident rays may interact with the
system components (chemical compounds, groups of atoms, etc.). As a result of these
interactions one may observe absorption, reflection, refraction, polarisation, luminescence,
phosphorescence, and so forth.
Colorimetric and spectrophotometric methods are widely used in quantitative analysis.
There are however distinct differences between the two. The colorimetric methods are based
on the ability of a coloured substance to absorb visible light. Visible light is that small part of
the electromagnetic spectrum which is detectable by the human eye. It is for this reason that it
was the first part of the spectrum to be used for chemical analysis. The electromagnetic
spectrum extends from high energy cosmic rays (A- 10-8 nm) through X-rays (A- 10-4 nm),
the ultraviolet (UV) (A= 190 to 380 nm) and visible regions (A= 380 to 800 nm), to infrared
(IR) and low energy radiowaves. Spectrophotometric methods, in turn, are not limited to the
visible regions and include the UV and IR regions of the electromagnetic spectrum. The
relationship between energy and wavelength is shown in Equation 2.1.
E hv
And, v c/A.
where E =energy
h = Plank's constant
v =frequency
where c = speed of light
A = wavelength
Equation 2.1 The relationship between energy, E, and wavelength, A.
40
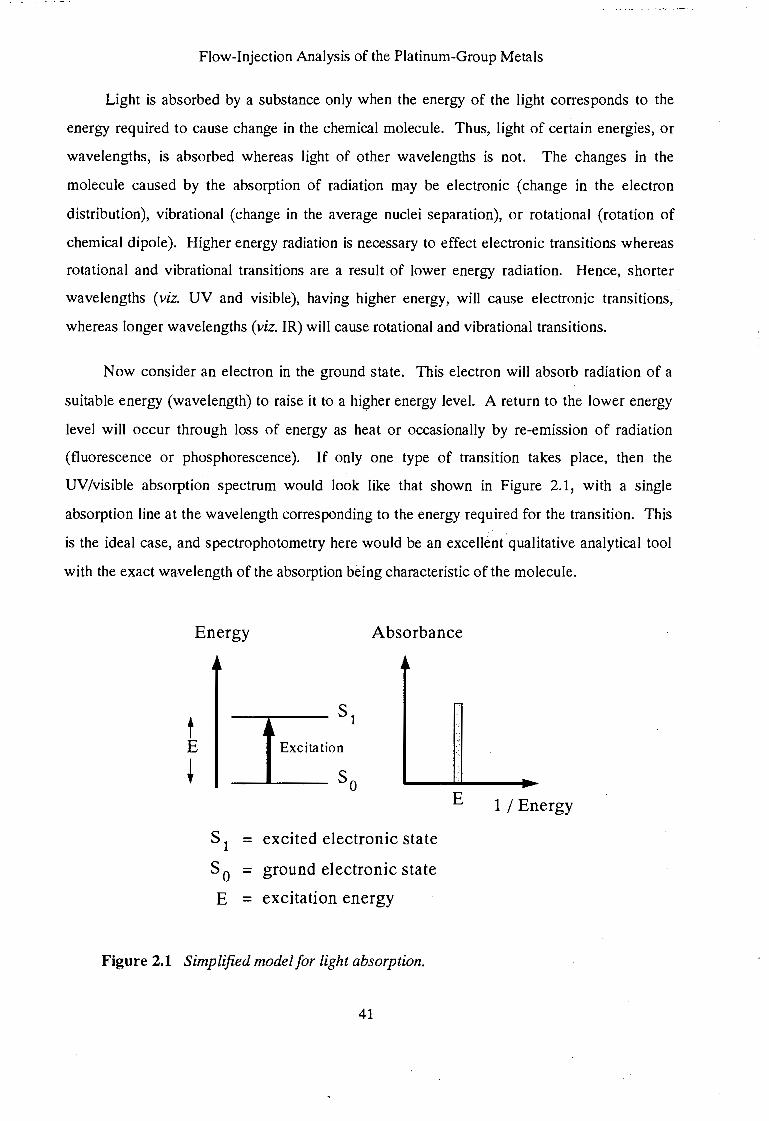
Flow-Injection Analysis of the Platinum-Group Metals
Light is absorbed by a substance only when the energy of the light corresponds to the
energy required to cause change in the chemical molecule. Thus, light of certain energies, or
wavelengths, is absorbed whereas light of other wavelengths is not. The changes in the
molecule caused by the absorption of radiation may be electronic (change in the electron
distribution), vibrational (change in the average nuclei separation), or rotational (rotation of
chemical dipole). Higher energy radiation is necessary to effect electronic transitions whereas
rotational and vibrational transitions are a result of lower energy radiation. Hence, shorter
wavelengths (viz. UV and visible), having higher energy, will cause electronic transitions,
whereas longer wavelengths (viz. IR) will cause rotational and vibrational transitions.
Now consider an electron in the ground state. This electron will absorb radiation of a
suitable energy (wavelength) to raise it to a higher energy level. A return to the lower energy
level will occur through loss of energy as heat or occasionally by re-emission of radiation
(fluorescence or phosphorescence). If only one type of transition takes place, then the
UV/visible absorption spectrum would look like that shown in Figure 2.1, with a single
absorption line at the wavelength corresponding to the energy required for the transition. This
is the ideal case, and spectrophotometry here would be an excellent qualitative analytical tool
with the exact wavelength of the absorption being characteristic of the molecule.
Energy Absorbance
E 1 I Energy
st = excited electronic state
so ground electronic state
E = excitation energy
Figure 2.1 Simplified model for light absorption.
41
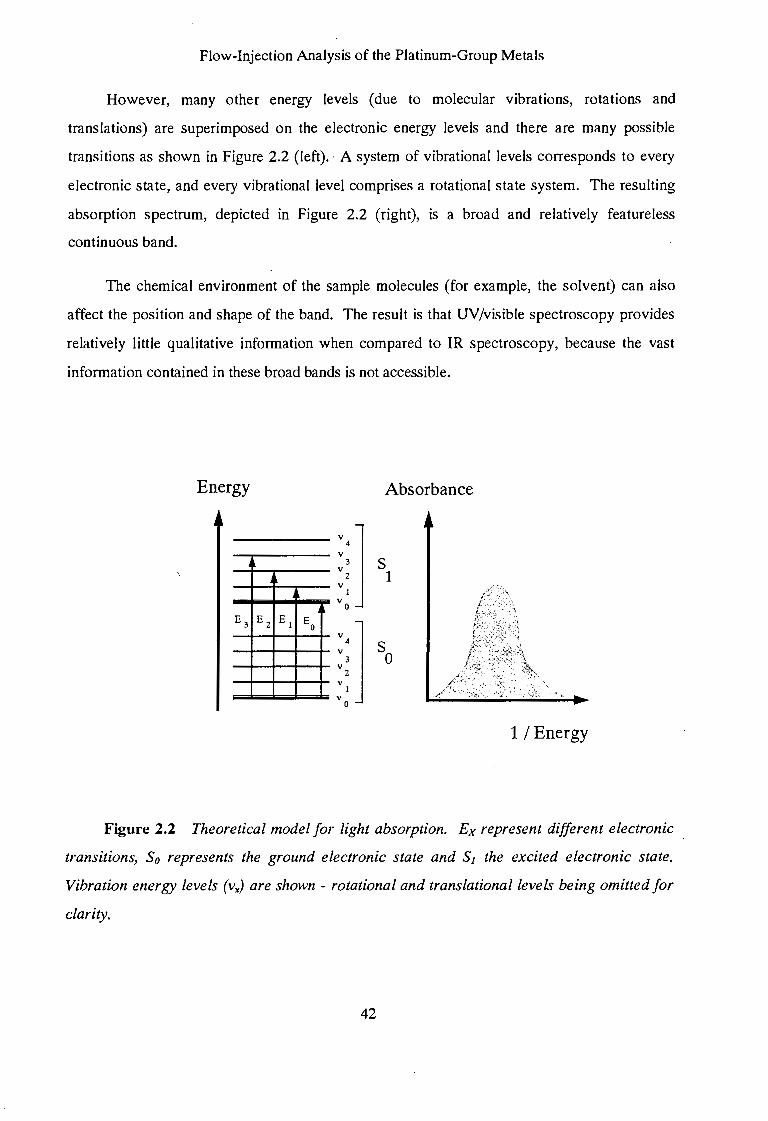
Flow-Injection Analysis of the Platinum-Group Metals
However, many other energy levels (due to molecular vibrations, rotations and
translations) are superimposed on the electronic energy levels and there are many possible
transitions as shown in Figure 2.2 (left).· A system of vibrational levels corresponds to every
electronic state, and every vibrational level comprises a rotational state system. The resulting
absorption spectrum, depicted in Figure 2.2 (right), is a broad and relatively featureless
continuous band.
The chemical environment of the sample molecules (for example, the solvent) can also
affect the position and shape of the band. The result is that UV /visible spectroscopy provides
relatively little qualitative information when compared to IR spectroscopy, because the vast
information contained in these broad bands is not accessible.
Energy Absorbance
v 4
v 3 s v 2 1
v 1
vo
E3 E2 El E 0
v 4 s v 3 0
v 2
v 1
v 0
1 I Energy
Figure 2.2 Theoretical model for light absorption. Ex represent different electronic
transitions, S0 represents the ground electronic state and S1 the excited electronic state.
Vibration energy levels (vx) are shown - rotational and translational levels being omitted for
clarity.
42
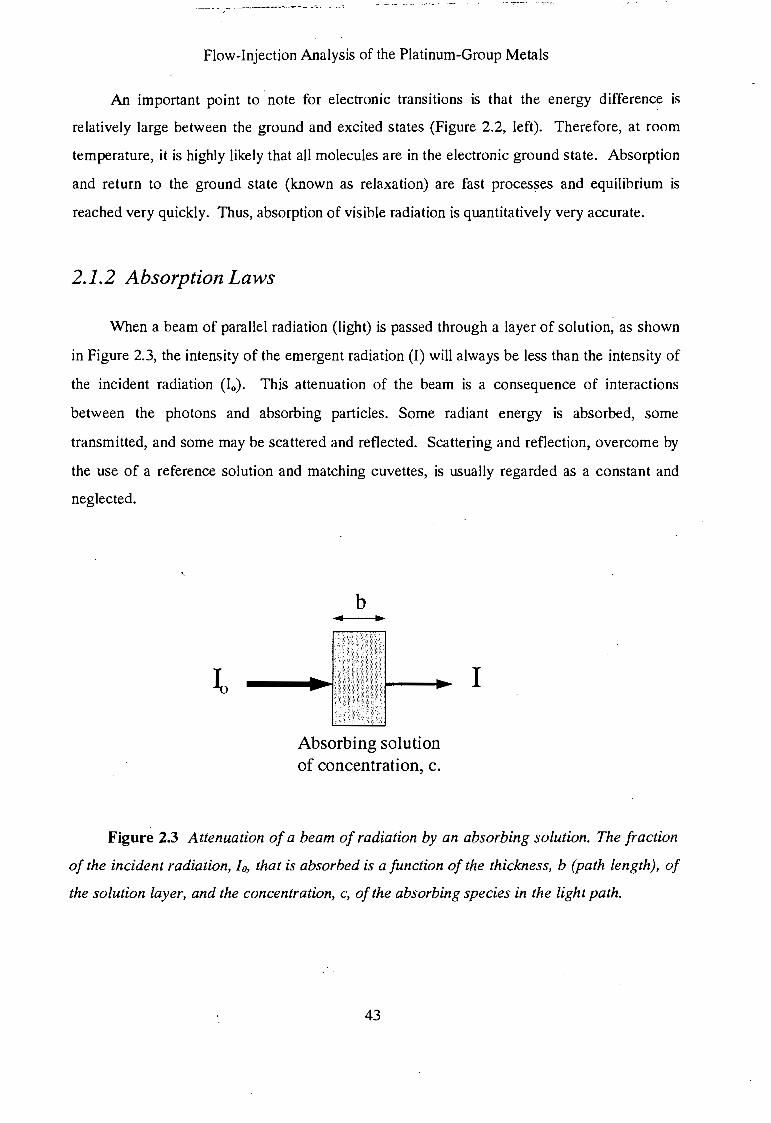
Flow-Injection Analysis of the Platinum-Group Metals
An important point to ·note for electronic transitions is that the energy difference is
relatively large between the ground and excited states (Figure 2.2, left). Therefore, at room
temperature, it is highly likely that all molecules are in the electronic ground state. Absorption
and return to the ground state (known as relaxation) are fast processes and equilibrium is
reached very quickly. Thus, absorption of visible radiation is quantitatively very accurate.
2.1.2 Absorption Laws
When a beam of parallel radiation (light) is passed through a layer of solution, as shown
in Figure 2.3, the intensity of the emergent radiation (I) will always be less than the intensity of
the incident radiation (10). This attenuation of the beam is a consequence of interactions
between the photons and absorbing particles. Some radiant energy is absorbed, some
transmitted, and some may be scattered and reflected. Scattering and reflection, overcome by
the use of a reference solution and matching cuvettes, is usually regarded as a constant and
neglected.
b
Absorbing solution of concentration, c.
I
Figure 2.3 Attenuation of a beam of radiation by an absorbing solution. The fraction
of the incident radiation, 10, that is absorbed is a function of the thickness, b (path length), of
the solution layer, and the concentration, c, of the absorbing species in the light path.
43
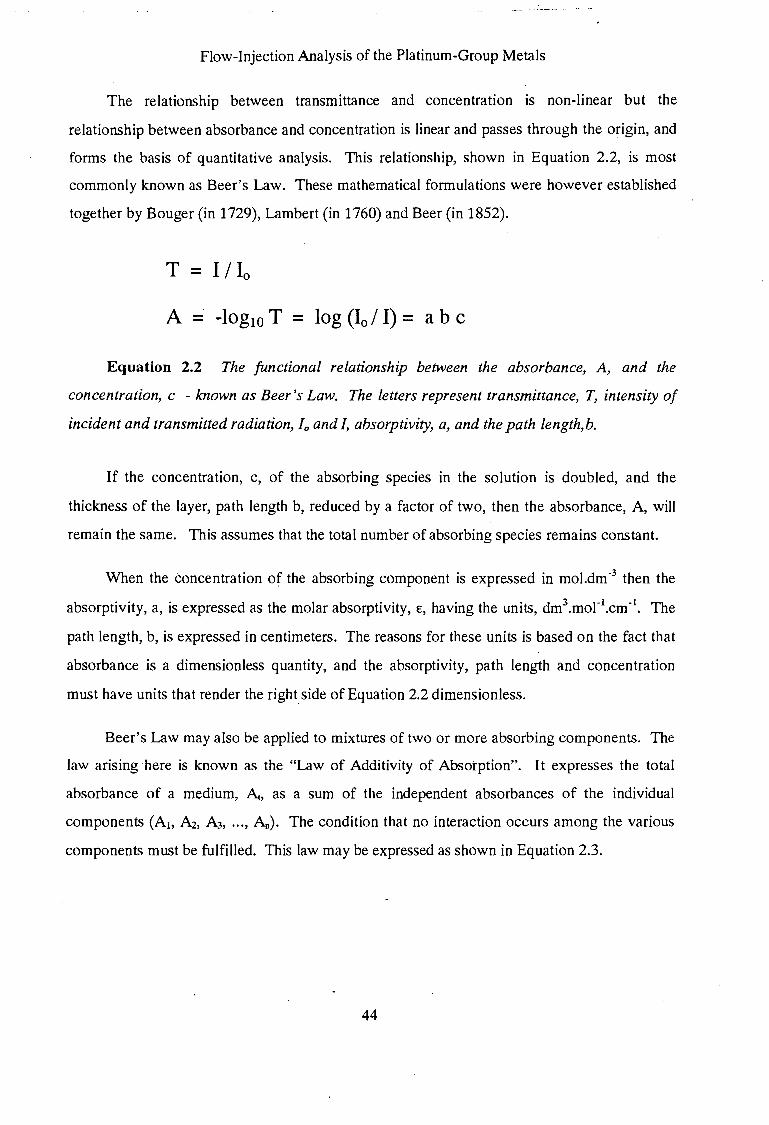
Flow-Injection Analysis of the Platinum-Group Metals
The relationship between transmittance and concentration is non-linear but the
relationship between absorbance and concentration is linear and passes through the origin, and
forms the basis of quantitative analysis. This relationship, shown in Equation 2.2, is most
commonly known as Beer's Law. These mathematical formulations were however established
together by Bouger (in 1729), Lambert (in 1760) and Beer (in 1852).
T I I Io.
A -log10 T = log (10 I I) = a b c
Equation 2.2 The functional relationship between the absorbance, A, and the
concentration, c - known as Beer's Law. The letters represent transmittance, T, intensity of
incident and transmitted radiation, Io and I, absorptivity, a, and the path length, b.
If the concentration, c, of the absorbing species in the solution is doubled, and the
thickness of the layer, path length b, reduced by a factor of two, then the absorbance, A, will
remain the same. This assumes that the total number of absorbing species remains constant.
When the concentration of the absorbing component is expressed in mol.dm -3 then the
absorptivity, a, is expressed as the molar absorptivity, E, having the units, dm3.mor1.cm-1• The
path length, b, is expressed in centimeters. The reasons for these units is based on the fact that
absorbance is a dimensionless quantity, and the absorptivity, path length and concentration
must have units that render the right side of Equation 2.2 dimensionless.
Beer's Law may also be applied to mixtures of two or more absorbing components. The
law arising here is known as the "Law of Additivity of Absorption". It expresses the total
absorbance of a medium, At, as a sum of the independent absorbances of the individual
components (AI. A2, A3, ••• , Au). The condition that no interaction occurs among the various
components must be fulfilled. This law may be expressed as shown in Equation 2.3.
44
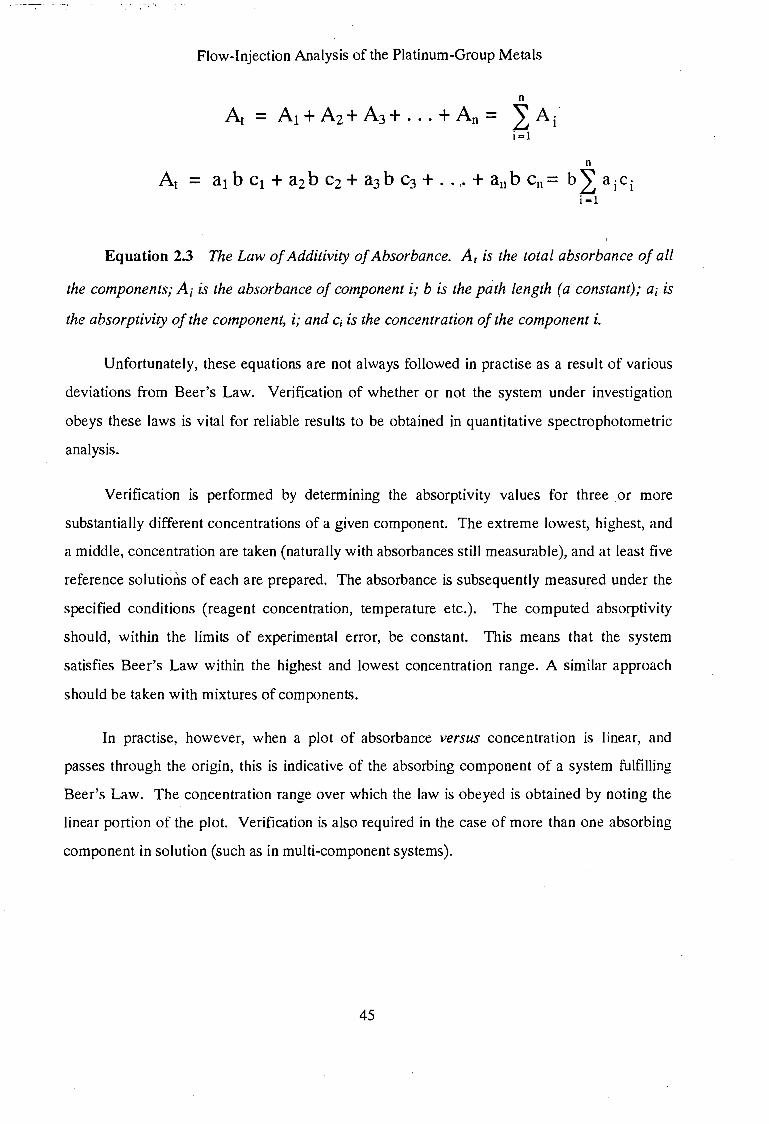
Flow-Injection Analysis of the Platinum-Group Metals
n
At A1 + Az+ A3+ ... +An= I Ai i=l
n
A1 a 1 b c1 + a 2 b c2 + a 3 b C3 + . . .. + a11 b Cn = b ~ a i c i i=l
Equation 2.3 The Law of Additivity of Absorbance. Ar is the total absorbance of all
the components; Ai is the absorbance of component i; b is the path length (a constant); ai is
the absorptivity of the component, i; and c; is the concentration of the component i.
Unfortunately, these equations are not always followed in practise as a result of various
deviations from Beer's Law. Verification of whether or not the system under investigation
obeys these laws is vital for reliable results to be obtained in quantitative spectrophotometric
analysis.
Verification is performed by determining the absorptivity values for three or more
substantially different concentrations of a given component. The extreme lowest, highest, and
a middle, concentration are taken (naturally with absorbances still measurable), and at least five
reference solutions of each are prepared. The absorbance is subsequently measured under the
specified conditions (reagent concentration, temperature etc.). The computed absorptivity
should, within the limits of experimental error, be constant. This means that the system
satisfies Beer's Law within the highest and lowest concentration range. A similar approach
should be taken with mixtures of components.
In practise, however, when a plot of absorbance versus concentration is linear, and
passes through the origin, this is indicative of the absorbing component of a system fulfilling
Beer's Law. The concentration range over which the law is obeyed is obtained by noting the
linear portion of the plot. Verification is also required in the case of more than one absorbing
component in solution (such as in multi-component systems).
45
Flow-Injection Analysis of the Platinum-Group Metals
Binary mixtures of the components, at varying concentrations, are prepared and the
absorbance values of the solutions are made at the same previously selected wavelengths.
Absorbance values are calculated for the same binary mixtures from their concentrations and
individual absorptivities at each wavelength by means of Equation 2.3. A comparison of the
experimental and calculated absorbances at each wavelength should, within experimental error,
coincide. If so, then the system obeys the additivity law. As the number of components
increase, so does the experimental error. A reasonable limit to the number of components that
could be resolved by multi-component analysis is five or six.
The verification of additivity is performed far more rapidly by making use of advanced
spectrophotometers linked to microcomputers. The absorption spectra of the pure
components are stored in the microcomputer. Thereafter, the test mixture spectra are
recorded. The measured spectra are compared electronically to the calculated mixture spectra
that are derived from the stored pure component spectra. If no deviations from the additivity
law occur, the calculated and actual pure component spectra should coincide.
2.1.3 Deviations from Beer~ Law
Based on theoretical considerations, the relationship between absorbance, A, and
concentration, c, is linear. In practise, however, some deviations from linearity do occur.
Some of these deviations, shown graphically in Figure 2.4, are fundamental and represent real
limitations to Beer's Law. Others occur as a consequence of the manner in which the
absorbance measurements are made (instrumental deviations), or as a result of chemical
changes associated with concentration changes (chemical deviations).
Beer's Law is successful in describing the absorption behaviour of dilute solutions only.
At high concentrations, the average distances between particles of the absorbing species are
diminished to the point where each particle affects the charge distribution of its neighbours.
This interaction may alter their ability to absorb a given wavelength of radiation. A similar
effect is sometimes encountered in dilute solutions of the absorbing species that contain high
and varying concentrations of other species, for example electrolytes. The proximity of the
46
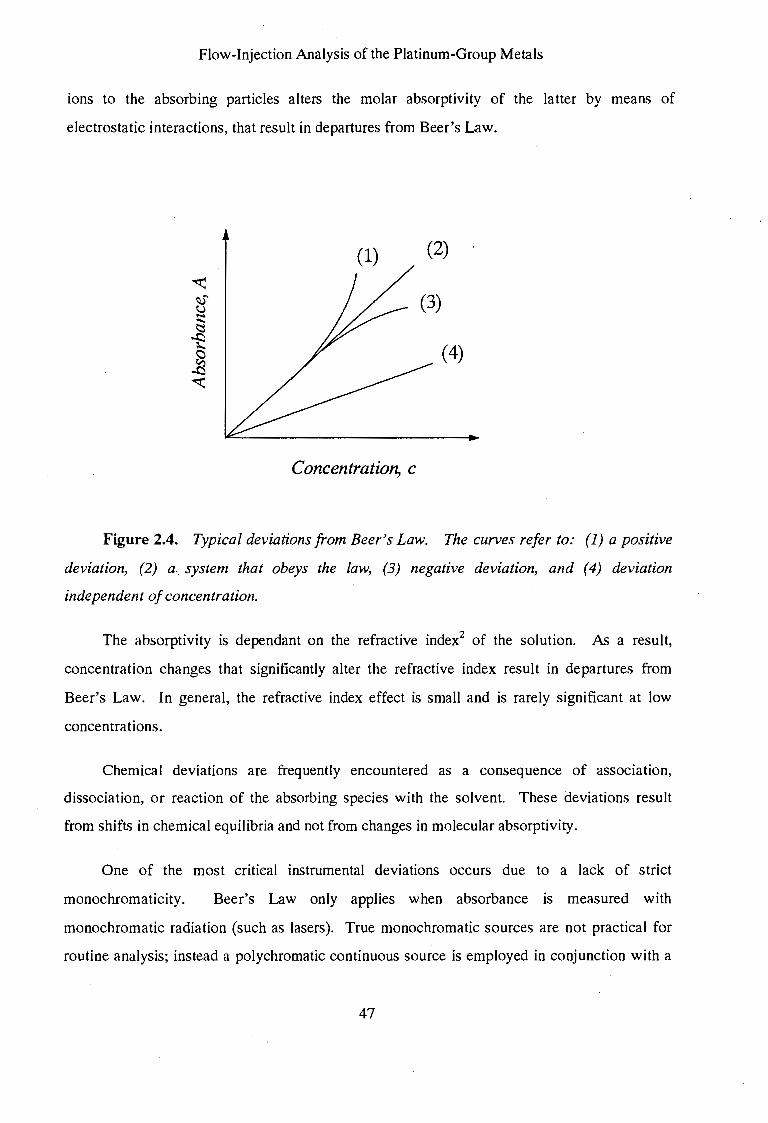
Flow-Injection Analysis of the Platinum-Group Metals
ions to the absorbing particles alters the molar absorptivity of the latter by means of
electrostatic interactions, that result in departures from Beer's Law.
(2)
-.::r:: ~ ... '-.) ;;::: 1::::
--e (4) 0 ~ -.::r::
Concentration, c
Figure 2.4. Typical deviations from Beer's Law. The curves refer to: (1) a positive
deviation, (2) a., system that obeys the law, (3) negative deviation, and (4) deviation
independent of concentration.
The absorptivity is dependant on the refractive index2 of the solution. As a result,
concentration changes that significantly alter the refractive index result in departures from
Beer's Law. In general, the refractive index effect is small and is rarely significant at low
concentrations.
Chemical deviations are frequently encountered as a consequence of association,
dissociation, or reaction of the absorbing species with the solvent. These deviations result
from shifts in chemical equilibria and not from changes in molecular absorptivity.
One of the most critical instrumental deviations occurs due to a lack of strict
monochromaticity. Beer's Law only applies when absorbance is measured with
monochromatic radiation (such as lasers). True monochromatic sources are not practical for
routine analysis; instead a polychromatic continuous source is employed in conjunction with a
47
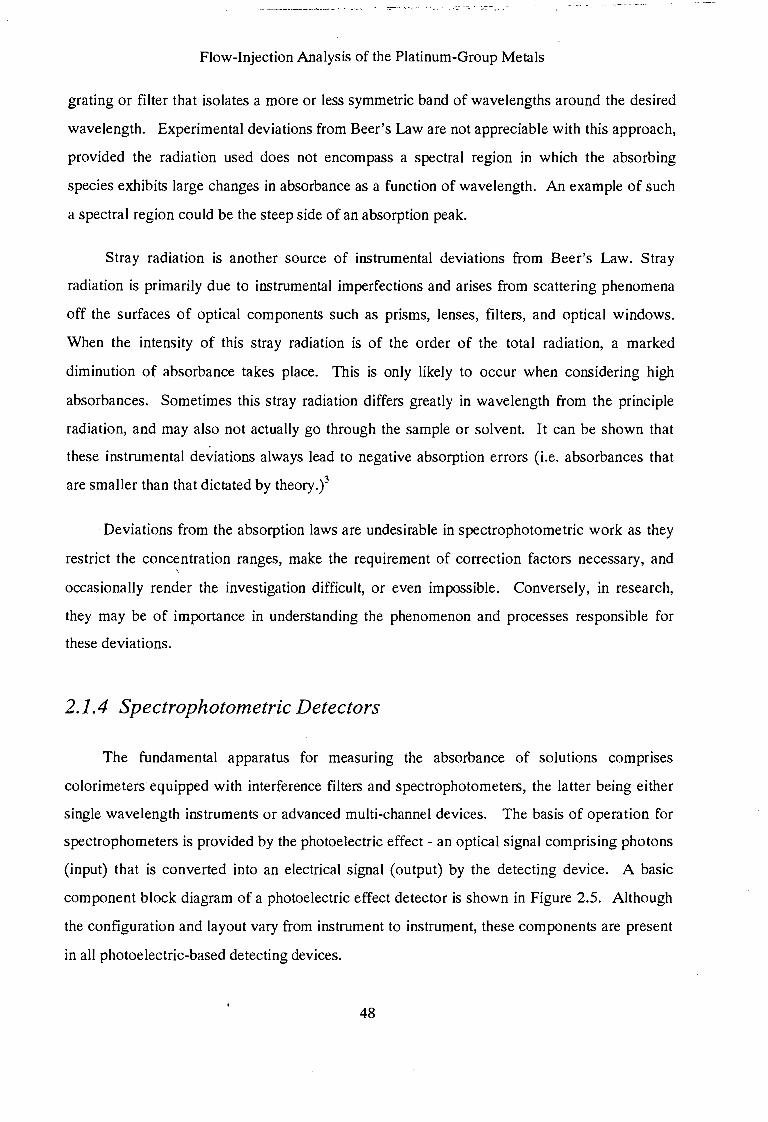
Flow-Injection Analysis of the Platinum-Group Metals
grating or filter that isolates a more or less symmetric band of wavelengths around the desired
wavelength. Experimental deviations from Beer's Law are not appreciable with this approach,
provided the radiation used does not encompass a spectral region in which the absorbing
species exhibits large changes in absorbance as a function of wavelength. An example of such
a spectral region could be the steep side of an absorption peak.
Stray radiation is another source of instrumental deviations from Beer's Law. Stray
radiation is primarily due to instrumental imperfections and arises from scattering phenomena
off the surfaces of optical components such as prisms, lenses, filters, and optical windows.
When the intensity of this stray radiation is of the order of the total radiation, a marked
diminution of absorbance takes place. This is only likely to occur when considering high
absorbances. Sometimes this stray radiation differs greatly in wavelength from the principle
radiation, and may also not actually go through the sample or solvent. It can be shown that
these instrumental deviations always lead to negative absorption errors (i.e. absorbances that
are smaller than that dictated by theory.)3
Deviations from the absorption laws are undesirable in spectrophotometric work as they
restrict the concentration ranges, make the requirement of correction factors necessary, and
occasionally render the investigation difficult, or even impossible. Conversely, in research,
they may be of importance in understanding the phenomenon and processes responsible for
these deviations.
2.1.4 Spectrophotometric Detectors
The fundamental apparatus for measuring the absorbance of solutions comprises
colorimeters equipped with interference filters and spectrophotometers, the latter being either
single wavelength instruments or advanced multi-channel devices. The basis of operation for
spectrophometers is provided by the photoelectric effect - an optical signal comprising photons
(input) that is converted into an electrical signal (output) by the detecting device. A basic
component block diagram of a photoelectric effect detector is shown in Figure 2.5. Although
the configuration and layout vary from instrument to instrument, these components are present
in all photoelectric-based detecting devices.
48
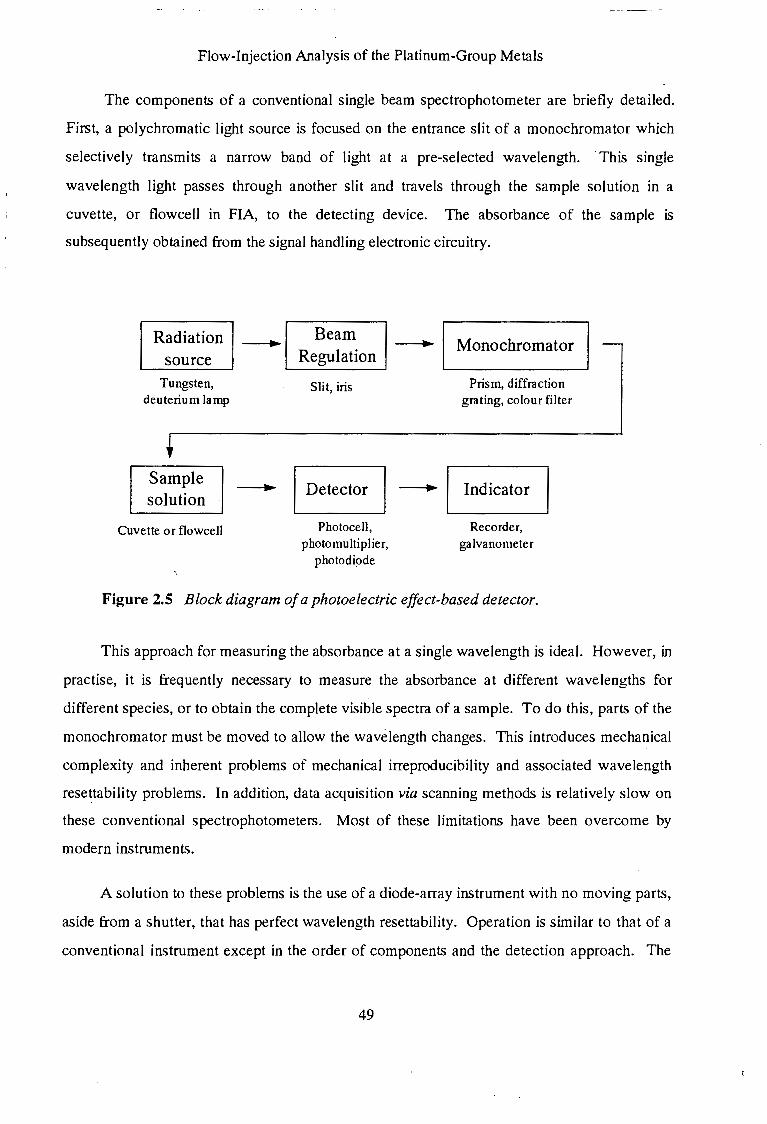
Flow-Injection Analysis of the Platinum-Group Metals
The components of a conventional single beam spectrophotometer are briefly detailed.
First, a polychromatic light source is focused on the entrance slit of a monochromator which
selectively transmits a narrow band of light at a pre-selected wavelength. This single
wavelength light passes through another slit and travels through the sample solution in a
cuvette, or flowcell in FIA, to the detecting device. The absorbance of the sample is
subsequently obtained from the signal handling electronic circuitry.
Radiation source ....__
Tungsten, deuterium lamp
Sample solution
Cuvette or flowcell
Beam Regulation
Slit, iris
- I Detector I -Photocell,
photomultiplier, photodiode
Monochromator
Prism, diffraction grating, colour filter
Indicator
Recorder, galvanometer
Figure 2.5 Block diagram of a photoelectric effect-based detector.
-
This approach for measuring the absorbance at a single wavelength is ideal. However, in
practise, it is frequently necessary to measure the absorbance at different wavelengths for
different species, or to obtain the complete visible spectra of a sample. To do this, parts of the
monochromator must be moved to allow the wavelength changes. This introduces mechanical
complexity and inherent problems of mechanical irreproducibility and associated wavelength
resettability problems. In addition, data acquisition via scanning methods is relatively slow on
these conventional spectrophotometers. Most of these limitations have been overcome by
modern instruments.
A solution to these problems is the use of a diode-array instrument with no moving parts,
aside from a shutter, that has perfect wavelength resettability. Operation is similar to that of a
conventional instrument except in the order of components and the detection approach. The
49
___ ,.,-... ..,: ____ .;.· ...... · .-::-·:;::·:...:.~.: .. --~-~.., . ..-~--- -~. '· .-·-·-;---·
Flow-Injection Analysis of the Platinum-Group Metals
polychromatic light source is passed through the sample solution, after being focused by a lens,
and then passes through a slit. The light is dispersed by a polychromator into its component
wavelengths (at 2 nm intervals). A photosensitive area, less than 2 cm2, containing several
hundred photodiode detector elements, measures the narrow band of the spectrum. The
polychromator comprises an entrance slit and a holographic grating. The optics are said to be
"reversed-optics" as the position of the sample and dispersive element are reversed in
comparison with a conventional spectrophotometer.
Diode-array detectors also have limitations other than their extravagant costs.
Background noise levels at very low absorbances (less than 0.05 A.U.*) are higher. The
requirement for reasonably lengthy integration times (of the order of a few seconds) at low
absorbances complicates measurement systems based on a constantly changing sample stream,
particularly in FlA. Unfortunately, the designers of certain diode-array instruments did not
consider the mounting of the cuvette holder to be significantly important. This could be
improved by using optical fiber technology to reduce the stray light, noise levels, and slight
flowcell movement considerably. The diode-array is far faster than conventional
spectrophotometric detectors when considering relative sensitivity against spectral scanning
time, but this is ·.offset by the limitations of diode-arrays at lower absorbance levels. The
relative sensitivity as a function of scanning time simply means that to attain equivalent
sensitivity, a conventional instrument is required to scan for a considerably longer period than a
diode-array instrument.
New high-speed drive technology for holographic diffraction gratings, permitting fast
and reliable wavelength changes, low-noise operation, and on-the-fly spectral scanning, has
revolutionised rapid scanning spectrophotometric detectors. These advances have placed rapid
scanning detectors in a class of their own. The optical design in these in..struments incorporates
a concave holographic grating with an advanced servomechanism positioning system to
achieve similar wavelength resettability as in diode-array instruments.
• AU.= Absorbance units
50
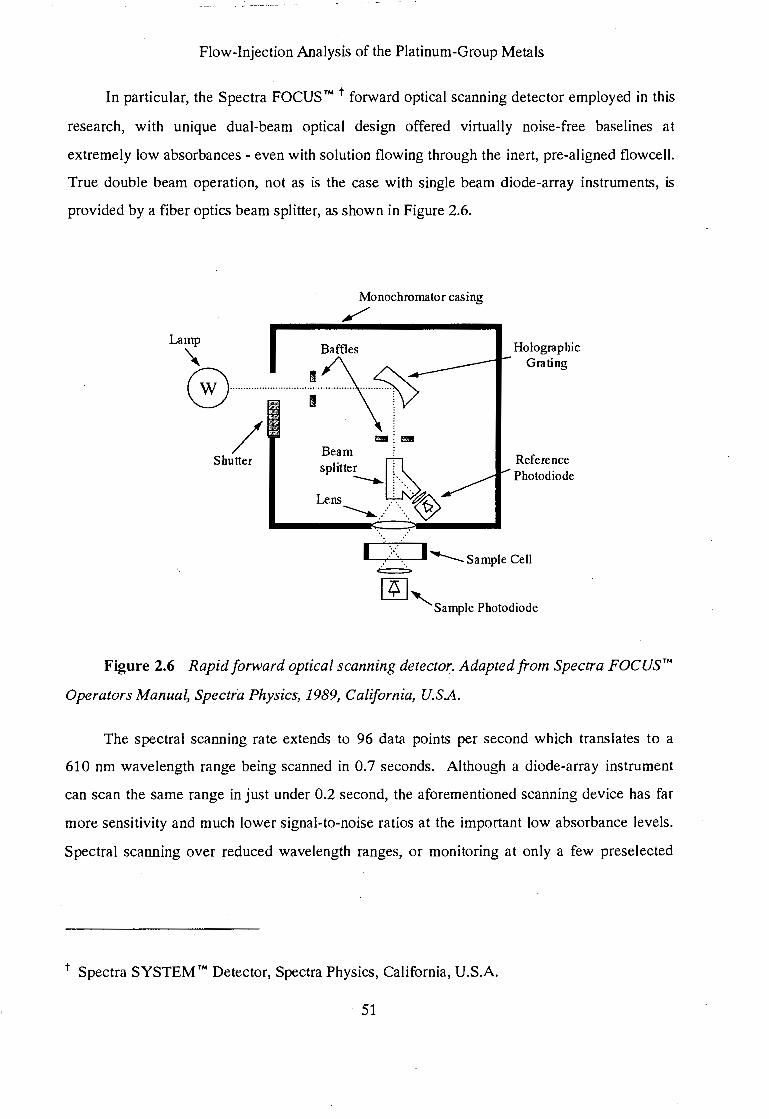
Flow-Injection Analysis of the Platinum-Group Metals
In particular, the Spectra FOCUS™ t forward optical scanning detector employed in this
research, with unique dual-beam optical design offered virtually noise-free baselines at
extremely low absorbances- even with solution flowing through the inert, pre-aligned flowcell.
True double beam operation, not as is the case with single beam diode-array instruments, is
provided by a fiber optics beam splitter, as shown in Figure 2.6.
Monochromator casing
/ Lamp
'\. Baffles
G::~~ /, Beam •1•
Shutter [11 splitter [ --.._:·. Lens :'.. -~ ---.. .. ~
Holographic Grating
Reference Photodiode
I .:·:. 1....__ Sample Cell ~
CfJ, Sample Photodiode
Figure 2.6 Rapid forward optical scanning detector. Adapted from Spectra FOCUS™
Operators Manual, Spectra Physics, 1989, California, U.SA.
The spectral scanning rate extends to 96 data points per second which translates to a
610 nm wavelength range being scanned in 0.7 seconds. Although a diode-array instrument
can scan the same range in just under 0.2 second, the aforementioned scanning device has far
more sensitivity and much lower signal-to-noise ratios at the important low absorbance levels.
Spectral scanning over reduced wavelength ranges, or monitoring at only a few preselected
t Spectra SYSTEM™ Detector, Spectra Physics, California, U.S.A.
51
· Flow-Injection Analysis of the Platinum-Group Metals
wavelengths (to a maximum of 32) simultaneously, reduces the time per scan and instrument
absorbance up-date time.
The large quantities of analytically useful data generated by such detectors is accessible
to the user via the standard instrument rear-panel accessories (millivolt recorder outputs, auto
zero and remote start triggering, and an RS-232 serial interface port for remote digital control
via microcomputer software).
2.2 Quantitation in Spectrophotometry
Absorption spectroscopy based on visible and ultraviolet radiation is indispensable to the
analyst for quantitative analysis. The important characteristics related to quantitation are
outlined.
• Wide applicability. A vast range of inorganic, organic and biochemical species
absorb radiation and are thus amenable to quantitative determination. Several non
absorbing species may be determined after chemical conversion to absorbing
derivatives. '
• High sensitivity. Detection limits typically range from 10"2 to 10-6%. The
approximate absolute lower limit for solution absorption methods, in terms of
constituent weight, is based on reactions with highly sensitive colour reagents.
Extremely low levels (0.001 to 0.003 !-lg) of the element have been detected.
• Moderate to high selectivity. Wavelengths can be found where the analyte alone
absorbs, making separations unnecessary. Corrections for overlapping bands may be
made if additional wavelengths are used. More often than not, specific reagents
which react with the one element of interest are not available, and partial separations
may be required.
• Good accuracy. Relative errors in concentration with typical spectrophotometric
methods are of the order of 1 to 5%. Special precautions can further reduce these.
52
Flow-Injection Analysis of the Platinum-Group Metals
• Special techniques. Techniques such as differential, derivative, and dual-wavelength
spectrophotometry, not to mention multi-component analysis methods, have enabled
analysis of highly complicated and otherwise unsolvable systems.
Quantitative spectrophotometric analysis techniques may be classified on the basis of
certain criteria, viz. the number of components to be determined (i.e. single or multi
component) and whether direct or indirect methods are employed.
The underlying principle in direct methods is selective absorption of the component being
determined. These components include organic compounds with a chromophoric group, and
species which may react with a chromophoric reagent. A typical example is the reaction of
iron(III) with thiocyanate to give a series of intensely red-coloured complexes. This enables
the trace determination of iron(III) at a wavelength of 480 nm.
Indirect methods involve some operation giving rise to an absorption proportional to the
component concentration. Operations may include complex formation, oxidation, reduction,
and derivative formation. Indirect methods are used less frequently than the popular direct
methods.
The most common and simplest spectrophotometric methods used today involve single
component quantitation using a single analytical wavelength. In principle, mixtures containing
two or more components may be analysed provided another measurement at a different
wavelength per additional component is made. However, as the number of components
increase, so does experimental error and any possible deviations from the absorptivity laws.
Components that have visible spectra similar to one another require an alternate
approach for their accurate determination. This involves "overdetermining" the system by
using more wavelengths than theoretically required in an effort to minimise errors. By using
many wavelength data points, synthetic spectra are derived for various concentrations of the
components known to be present. These component spectra are electronically fitted to the
mixture spectrum until a close match is found. Of course, spectra for standard solutions of
each component are required.
53
Flow-Injection Analysis of the Platinum-Group Metals
2.2.1 Single Component Analysis (SCA)
In spectrophotometric analysis the following are considered to be single component
determinations:
•
•
•
one absorbing component in a solution, or in a mixture of components, that do not
absorb within the given spectral range,
one absorbing component against a background of a sum of other absorbing
components where the absorption can be eliminated, and
selective absorption of the component to be determined by means of a suitable
chemical reaction.
These single component methods usually entail the use of a single analytical wavelength.
However, when background absorption of other components is to be eliminated, further
measurements at additional wavelengths may be required. The wavelength associated with the
strongest absorption band is commonly used as the analytical wavelength (the wavelength at
which absorption measurements are taken) but medium-strength peaks and shoulders may also
be used.
Preparation of a calibration curve from pure standards is essential in quantitative work.
This calibration enables the verification of Beer's Law and the slope of the calibration curve
yields the absorptivity of the component under investigation. The absorptivity is then used,
along with the measured sample absorbance signal, to give a numerical evaluation of the
sample concentration as outlined in Equation 2.4.
(1)
(2) Asample). = aA. b Csample Csample = Asample,A. I a).. b
Equation 2.4 The calculation of a sample concentration at a single analytical
wavelength, A. Astd,A. and Asample,A. represent the absorbances of the standard and sample at
wavelength, /...; aA. represents the absorptivity of the component; b is the path length; and Cstd
and Csample are the concentrations of the standards and samples respectively.
54
Flow-Injection Analysis of the Platinum-Group Metals
Furthermore, with the use of·rapid scanning spectrophotometers, the quality of results
obtained from single component analysis may be improved by a variety of means that are not
normally investigated. Conventional spectrophotometers have wavelength resettability errors,
and hence the wavelength of the absorption maximum is used. This is often not the best
wavelength for linearity and/or reproducibility.
Access to a range of wavelengths through a scanning spectrophotometer enhances the
selection of an analytical wavelength. This may be accomplished by software tools that, after
measurements over a wavelength range, can display the calibration and the uncertainty in
linearity and reproducibility of absorbance measurement at each wavelength.
Other analytical tools, shown in Figure 2. 7, such as wavelength averaging over a
wavelength range or the absorption peak maximum, may be used for quantitative work instead
of the single absorbance values at a wavelength maximum.
Confirmation wavelengths, usually located on either side of the selected analytical
wavelength, allow detection of impurities and/or other absorbing species by simple ratio
methods. If there are no other absorbing species, then the ratio of the absorbance at two
wavelengths would be constant. Any deviation from this indicates the presence of another
species. This would be evident in Figure 2.7 with "b" interfering in the determination of "a".
Internal referencing methods allow for compensation of all effects that cause erroneous
absorbance readings but which are mainly independent of wavelength (for example, lamp
intensity changes and refractive index effects). The reference wavelength is selected at a
position removed from the absorbing region of the analyte. These methods enhance the
reliability of the single component results in terms of accuracy, precision, and dynamic ranges.
Internal referencing may also be adapted in a manner that facilitates the subtraction of an
interferent provided that (1) the absorption spectra of such an interferent is known, and (2) the
absorbance of the interferent is constant at the wavelengths used over the concentration range
expected in the sample. This approach is used in Chapter 6 for the subtraction of interfering
absorbing components.
55
Flow-Injection Analysis of the Platinum-Group Metals
Figure 2.7 The use of confirmation analysis, reference wavelengths, and wavelength
averaging across the absorption maximum to enhance the reliability of single component
analysis.
56
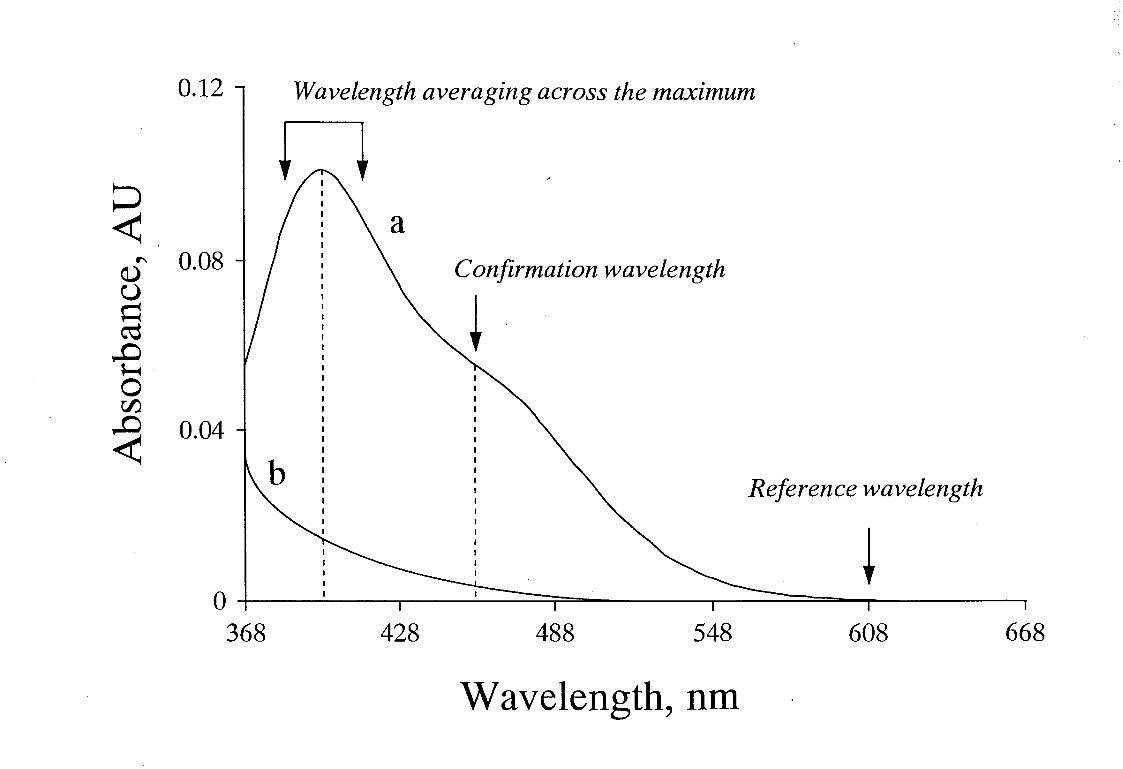
0.12 ., Wavelength averaging across the maximum
~ I I I \ a ~ o.o8 l I I \ Confirmation wavelength Q) I
u ~ ~ ~ ~·
0 rJJ.
< 0.04 1\ h I I "\.
Reference wavelength
~ I --- ----0
368 428 488 548 608 668
Wavelength, nm
Flow-Injection Analysis of the Platinum-Group Metals
2.2.2 Multi-Component Analysis (MCA)
Multi-component analysis is the simultaneous determination of analyte concentrations in
a mixture of components from their absorption spectra by making use of a least-square fit and
assuming that Beer's Law is valid. The analysis of more than one absorbing component in a
solution is becoming an attractive tool for the analyst as microprocessor based
spectrophotometers are readily linked to powerful microcomputers. ·
Commercially available software packages4 for spectrophotometric multi-component
analysis and advanced chemometric applications are based on ordinary multiple regression
methods. Either one wavelength-per-component or wide spectral ranges are employed. These
are known as exactly "determined" systems and "over-determined" systems respectively.
Complex mathematical algorithms are required to resolve the mixtures when the spectra
of . the components of interest overlap extensively. The application of quantitative
chemometrics, particularly principle component regression (PCR) and partial least-squares
regression (PLSR), to multivariate chemical data from multi-channel FIA detector systems is
becoming more widespread within research laboratories as more complex systems are required
to be resolved and analysed.
These chemometric methods are examples of indirect calibration methods (i.e. not
requiring individual component spectra to be known in advance). They do, however, require a
comprehensive set of calibration samples which span the expected range of components and
chemical interactions. These multivariate techniques are discussed in detail by Martens and
Naes,5•6 and Kowalski and Beebe.7
57
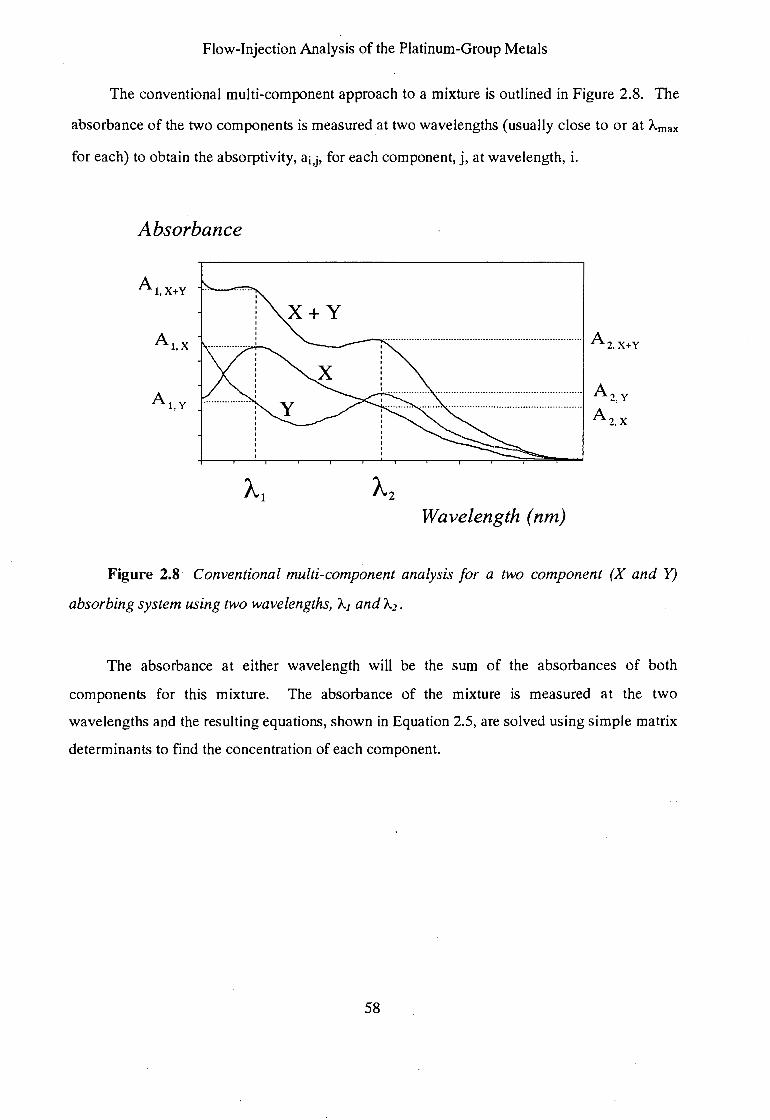
Flow-Injection Analysis of the Platinum-Group Metals
The conventional multi-component approach to a mixture is outlined in Figure 2.8. The
absorbance of the two components is measured at two wavelengths (usually close to or at Amax
for each) to obtain the absorptivity, ai,j, for each component, j, at wavelength, i.
Absorbance
Al,X+Y
Al,Y
Wavelength (nm)
A2,Y
A2.X
Figure 2.8 Conventional multi-component analysis for a two component (X and Y)
absorbing system using two wavelengths, A.1 and A.2 •
The absorbance at either wavelength will be the sum of the absorbances of both
components for this mixture. The absorbance of the mixture is measured at the two
wavelengths and the resulting equations, shown in Equation 2.5, are solved using simple matrix
determinants to find the concentration of each component.
58
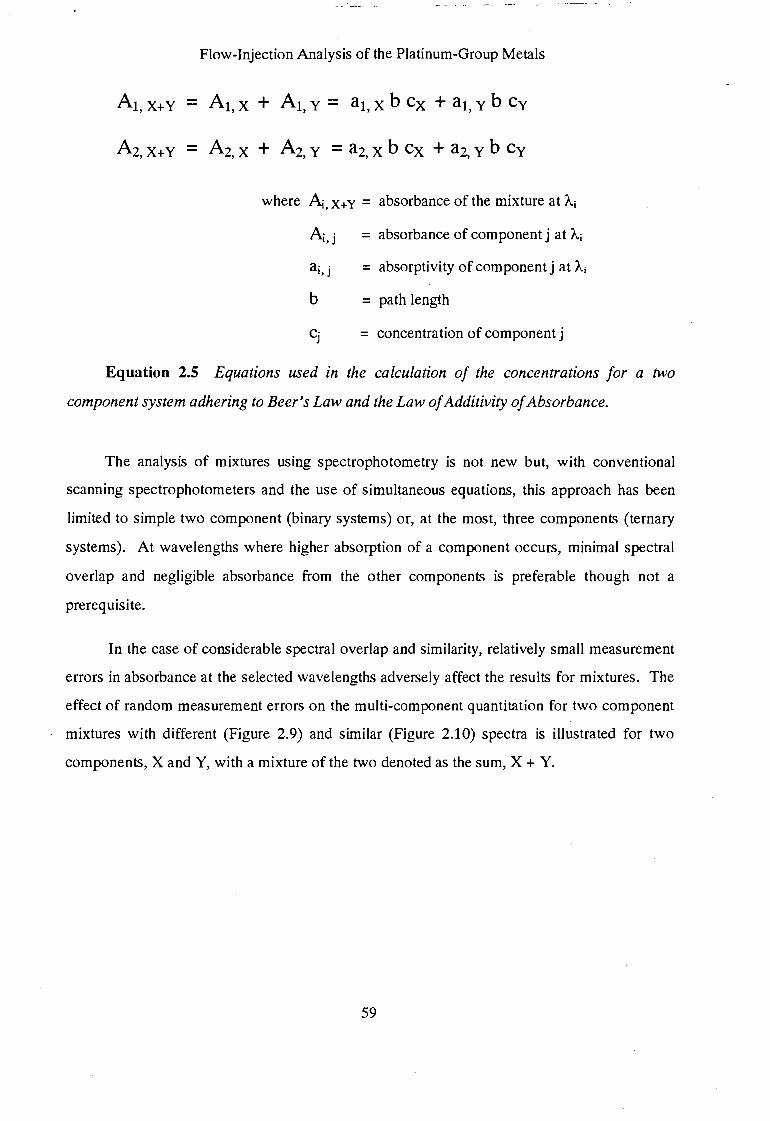
Flow-Injection Analysis of the Platinum-Group Metals
At, X+Y - At, x + At, y = at, x b ex +at, y b cy
Az, X+ y Az, x + Az, y = az, x b ex + az, y b cy
where A,X+Y = absorbance of the mixture at Ai
A, j = absorbance of component j at Ai
ai, j = absorptivity of component j at Ai
b = path length
Cj = concentration of component j
Equation 2.5 Equations used in the calculation of the concentrations for a two
component system adhering to Beer's Law and the Law of Additivity of Absorbance.
The analysis of mixtures using spectrophotometry is not new but, with conventional
scanning spectrophotometers and the use of simultaneous equations, this approach has been
limited to simple two component (binary systems) or, at the most, three components (ternary
systems). At wavelengths where higher absorption of a component occurs, minimal spectral
overlap and negligible absorbance from the other components is preferable though not a
prerequisite.
In the case of considerable spectral overlap and similarity, relatively small measurement
errors in absorbance at the selected wavelengths adversely affect the results for mixtures. The
effect of random measurement errors on the multi-component quantitation for two component
mixtures with different (Figure 2.9) and similar (Figure 2.10) spectra is illustrated for two
components, X andY, with a mixture of the two denoted as the sum, X + Y.
59
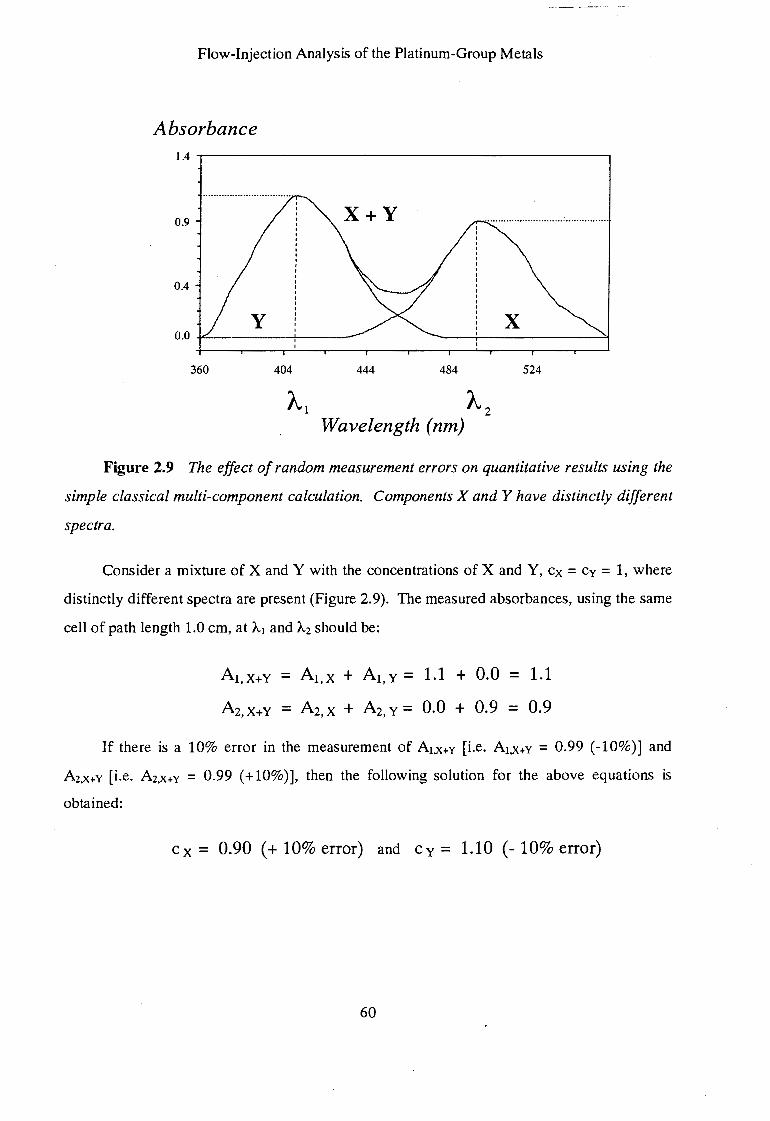
Flow-Injection Analysis of the Platinum-Group Metals
Absorbance 1.4 -r---------------------------,
0.9
X
360 404 444 484 524
Al A2 Wavelength (nm)
Figure 2.9 The effect of random measurement errors on quantitative results using the
simple classical multi-component calculation. Components X andY have distinctly different
spectra .
. Consider a mixture of X and Y with the concentrations of X and Y, ex = Cy = 1, where
distinctly different spectra are present (Figure 2.9). The measured absorbances, using the same
cell of path length 1.0 em, at /....1 and /....2 should be:
Al,X+Y Al,X + Al, y = 1.1 + 0.0 = 1.1
A2,X+Y = A2,X + A2, y = 0.0 + 0.9 0.9
If there is a 10% error in the measurement of A1.x+Y [i.e. A1.x+Y = 0.99 (-10%)] and
A2.x+Y [i.e. A2.x+Y = 0.99 (+10%)], then the following solution for the above equations is
obtained:
ex= 0.90 (+ 10% error) and cy = 1.10 (-10% error)
60
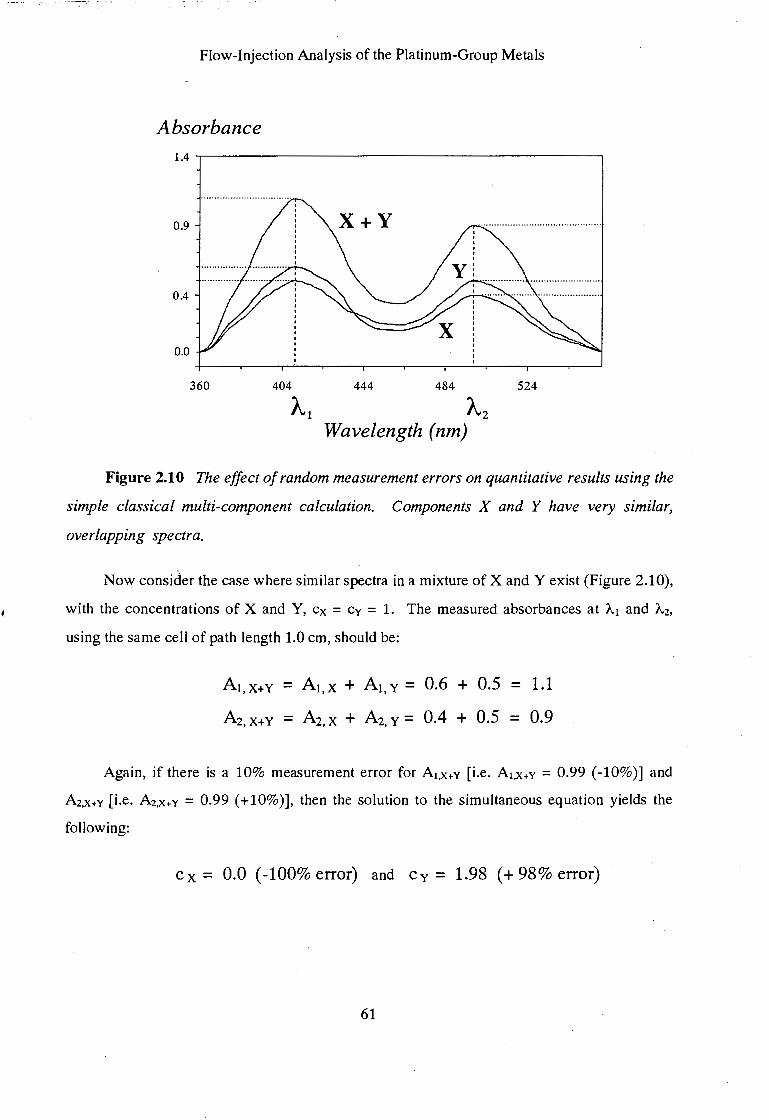
Flow-Injection Analysis of the Platinum-Group Metals
Absorbance
360 404
A1 444 484
Az Wavelength (nm)
524
Figure 2.10 The effect of random measurement errors on quantitative results using the
simple classical multi-component calculation. Components X and Y have very similar,
overlapping spectra.
Now consider the case where similar spectra in a mixture of X andY exist (Figure 2.10),
with the concentrations of X and Y, ex = Cy = 1. The measured absorbances at A. 1 and A.2,
using the same cell of path length 1.0 em, should be:
Al,X+Y = Al,X + Al, y = 0.6 + 0.5 1.1
A2,X+Y A2,x + Az, y = 0.4 + 0.5 0.9
Again, if there is a 10% measurement error for A1,x+Y [i.e. A1,x+Y = 0.99 (-10%)] and
A2,x+Y [i.e. Az.x+Y = 0.99 ( + 10% )], then the solution to the simultaneous equation yields the
following:
ex= 0.0 (-100% error) and Cy = 1.98 (+ 98% error)
61
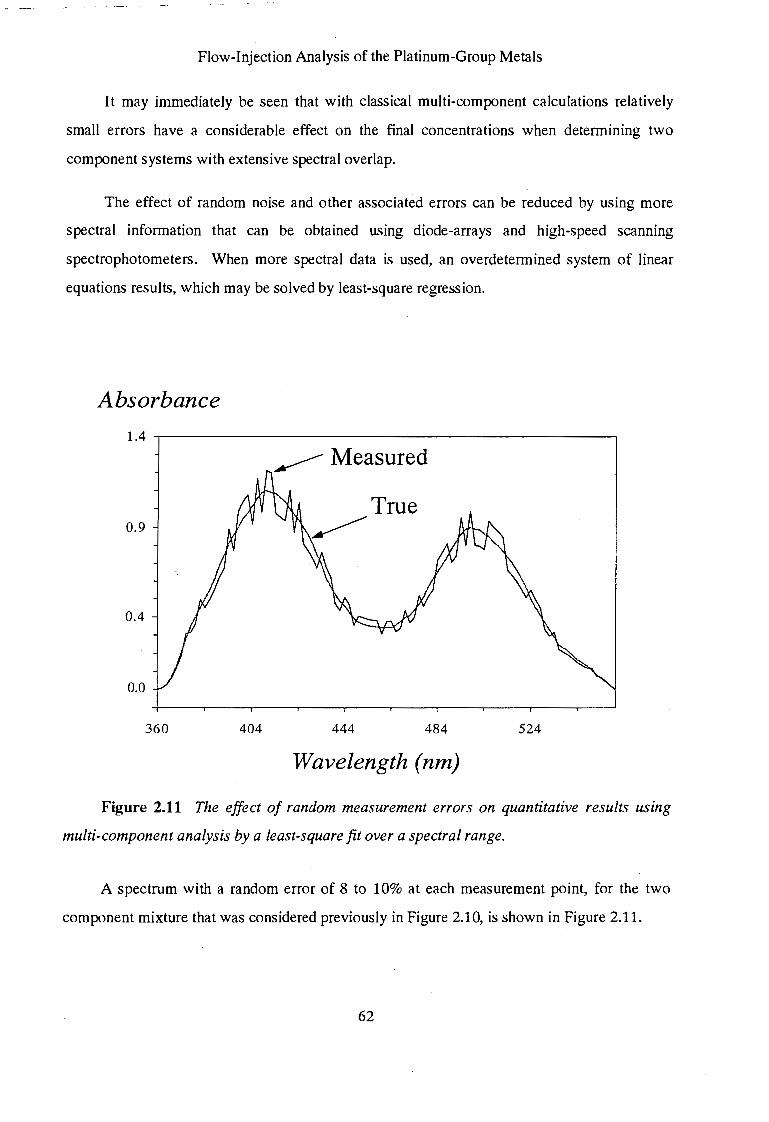
Flow-Injection Analysis of the Platinum-Group Metals
It may immediately be seen that with classical multi-component calculations relatively
small errors have a considerable effect on the final concentrations when determining two
component systems with extensive spectral overlap.
The effect of random noise and other associated errors can be reduced by using more
spectral information that can be obtained using diode-arrays and high-speed scanning
spectrophotometers. When more spectral data is used, an overdetermined system of linear
equations results, which may be solved by least-square regression.
Absorbance
1.4 .--------------------------------------------------.
~Measured
True 0.9 ~
0.4
0.0
360 404 444 484 524
Wavelength (nm)
Figure 2.11 The effect of random measurement errors on quantitative results using
multi-component analysis by a least-square fit over a spectral range.
A spectrum with a random error of 8 to 10% at each measurement point, for the two
component mixture that was considered previously in Figure 2.1 0, is shown in Figure 2.11.
62
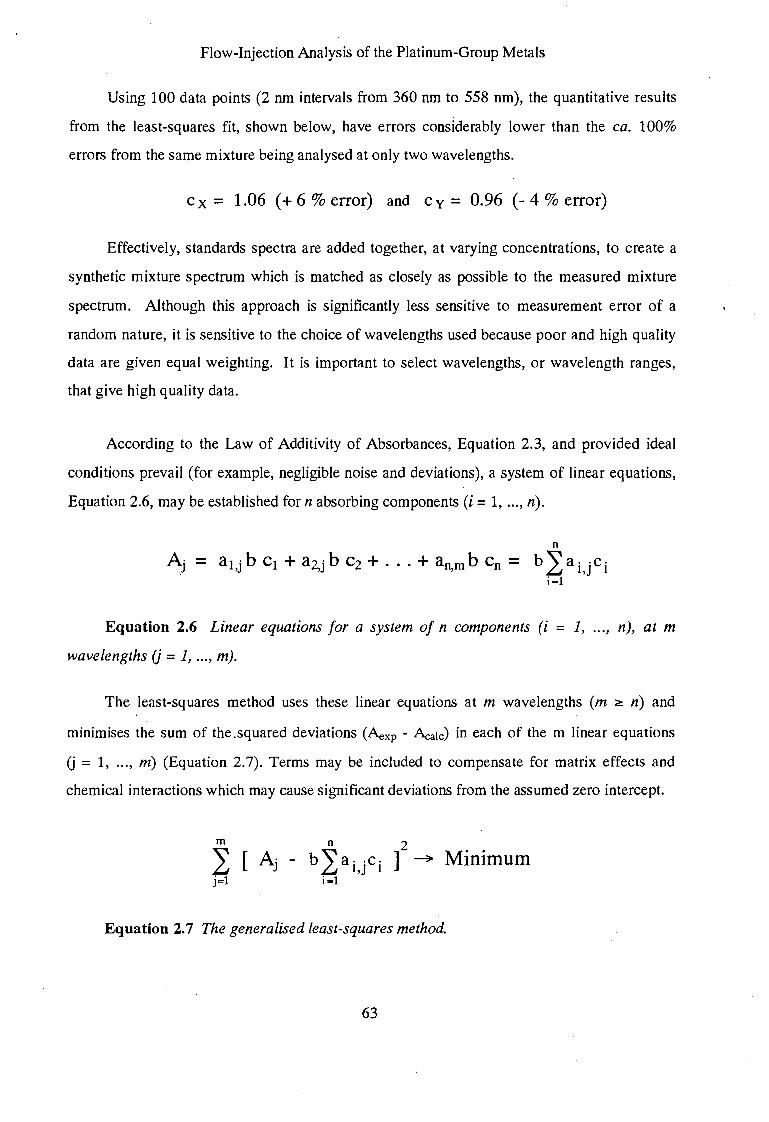
Flow-Injection Analysis of the Platinum-Group Metals
Using 100 data points (2 nm intervals from 360 nm to 558 nm), the quantitative results
from the least-squares fit, shown below, have errors considerably lower than the ca. 100%
errors from the same mixture being analysed at only two wavelengths.
ex= 1.06 (+ 6% error) and cy = 0.96 (- 4% error)
Effectively, standards spectra are added together, at varying concentrations, to create a
synthetic mixture spectrum which is matched as closely as possible to the measured mixture
spectrum. Although this approach is significantly less sensitive to measurement error of a
random nature, it is sensitive to the choice of wavelengths used because poor and high quality
data are given equal weighting. It is important to select wavelengths, or wavelength ranges,
that give high quality data.
According to the Law of Additivity of Absorbances, Equation 2.3, and provided ideal
conditions prevail (for example, negligible noise and deviations), a system of linear equations,
Equation 2.6, may be established for n absorbing components (i = 1, ... , n).
n
~j al,j b C1 + a2,j b Cz + ... + an,m b Cn = b ~a i,jci i=l
Equation 2.6 Linear equations for a system of n components (i = 1, ... , n), at m
wavelengths (j = 1, ... , m).
The least-squares method uses these linear equations at m wavelengths (m ~ n) and
minimises the sum of the.squared deviations (Aexp - Acalc) in each of the m linear equations
U = 1, ... , m) (Equation 2.7). Terms may be included to compensate for matrix effects and
chemical interactions which may cause significant deviations from the assumed zero intercept.
m n 2
~ [ Aj - b ,2ai,jci ] ~ Minimum j=l i-1
Equation 2.7 The generalised least-squares method.
63
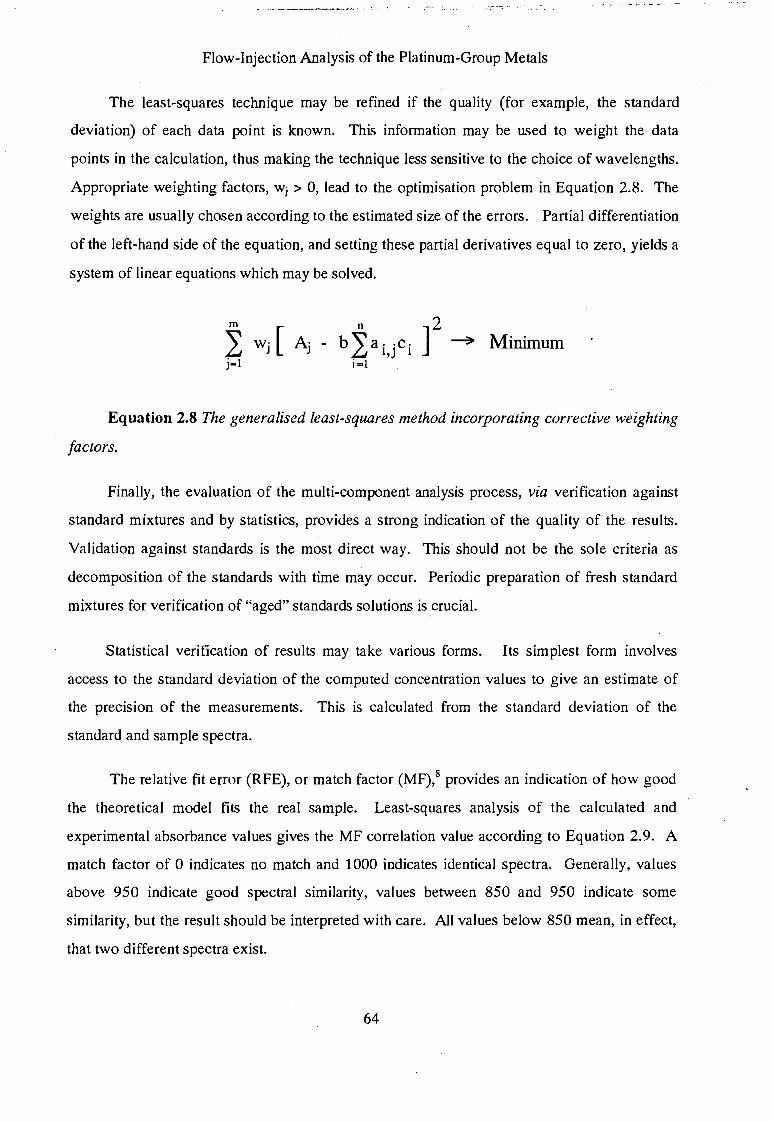
Flow-Injection Analysis of the Platinum-Group Metals
The least-squares technique may be refined if the quality (for example, the standard
deviation) of each data point is known. This information may be used to weight the data
points in the calculation, thus making the technique less sensitive to the choice of wavelengths.
Appropriate weighting factors, wi > 0, lead to the optimisation problem in Equation 2.8. The
weights are usually chosen according to the estimated size of the errors. Partial differentiation
of the left-hand side of the equation, and setting these partial derivatives equal to zero, yields a
system of linear equations which may be solved.
rn [ n ]2 ~ Wj Aj - b 2:ai,jci ~ Minimum jal i=l
Equation 2.8 The generalised least-squares method incorporating corrective weighting
factors.
Finally, the evaluation of the multi-component analysis process, via verification against
standard mixtures and by statistics, provides a strong indication of the quality of the results.
Validation against standards is the most direct way. This should not be the sole criteria as
decomposition of the standards with time may occur. Periodic preparation of fresh standard
mixtures for verification of "aged" standards solutions is crucial.
Statistical verification of results may take various forms. Its simplest form involves
access to the standard deviation of the computed concentration values to give an estimate of
the precision of the measurements. This is calculated from the standard deviation of the
standard and sample spectra.
The relative fit error (RFE), or match factor (MF),8 provides an indication of how good
the theoretical model fits the real sample. Least-squares analysis of the calculated and
experimental absorbance values gives the MF correlation value according to Equation 2.9. A
match factor of 0 indicates no match and 1000 indicates identical spectra. Generally, values
above 950 indicate good spectral similarity, values between 850 and 950 indicate some
similarity, but the result should be interpreted with care. All values below 850 mean, in effect,
that two different spectra exist.
64
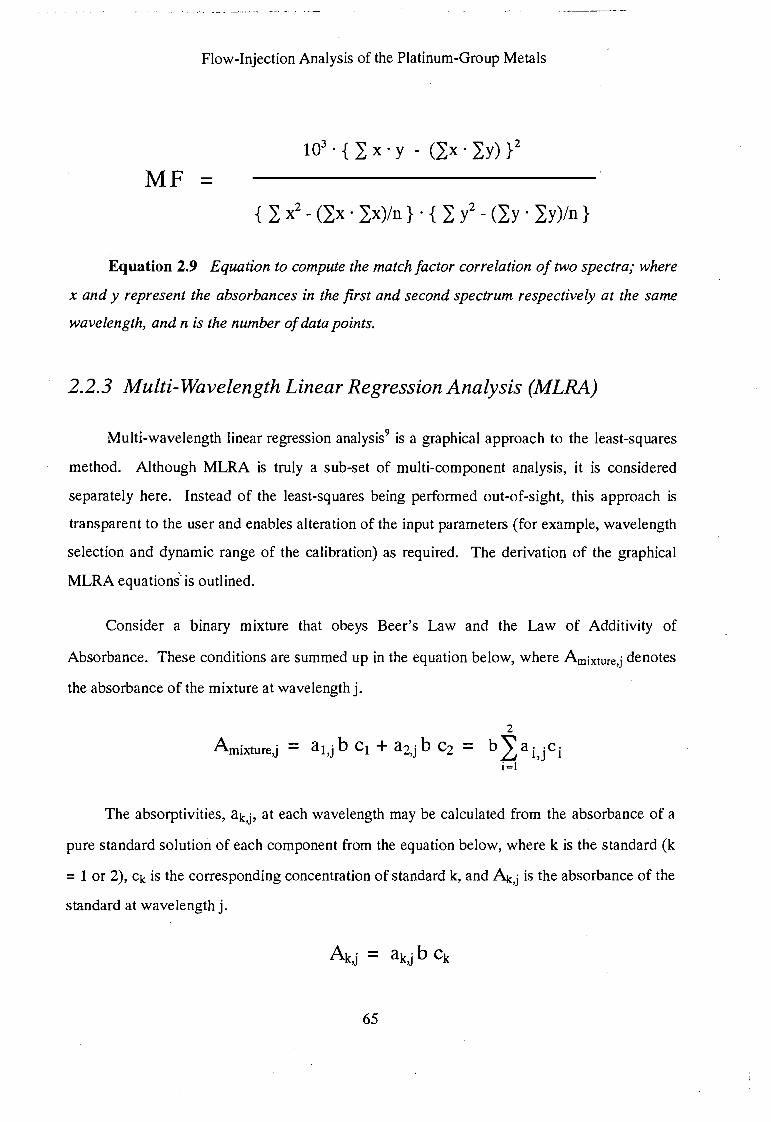
Flow-Injection Analysis of the Platinum-Group Metals
MF { 2: x2
- (}:x · }:x)/n} · { 2: l- (}:y · }:y)/n}
Equation 2.9 Equation to compute the match factor correlation of two spectra; where
x andy represent the absorbances in the first and second spectrum respectively at the same
wavelength, and n is the number of data points.
2.2.3 Multi-Wavelength Linear Regression Analysis (MLRA)
Multi-wavelength linear regression analysis9 is a graphical approach to the least-squares
method. Although MLRA is truly a sub-set of multi-component analysis, it is considered
separately here. Instead of the least-squares being performed out-of-sight, this approach is
transparent to the user and enables alteration of the input parameters (for example, wavelength
selection and dynamic range of the calibration) as required. The derivation of the graphical
MLRA equations· is outlined.
Consider a binary mixture that obeys Beer's Law and the Law of Additivity of
Absorbance. These conditions are summed up in the equation below, where Amixture,j denotes
the absorbance of the mixture at wavelength j.
Amixture,j al,j b c1 + az,j b Cz
2
b~a. ·C· LJ I,J I i=l
The absorptivities, ak,j, at each wavelength may be calculated from the absorbance of a
pure standard solution of each component from the equation below, where k is the standard (k
= 1 or 2), Ck is the corresponding concentration of standard k, and ~.j is the absorbance of the
standard at wavelength j.
65
.-:.~,·· .. --.-~
Flow-Injection Analysis of the Platinum-Group Metals
If the same cell (and hence the same path length) and normalised standard spectra of unit
concentration are used, then appropriate substitution and rearrangement will give the following
equation in the form of a straight line.
Plotting the values obtained at the different wavelengths, j, as A1,j I Amixture,j versus
A2,j I Amixture,j gives a straight line of slope -c2 I c1 and a y-axis intercept of 1/c1. This allows
calculation of the concentrations c1 and c2. This method is illustrated in Figure 2.12 for a
mixture of 40 !-lg.cm-3 Pt(IV) and 60 ~-tg.cm-3 Pd(II). The experimental absorption spectrum
and the theoretical spectrum for this mixture is shown in Figure 2.13. Good agreement across
the spectral range is evident.
Ranges of wavelengths, a complete spectrum, or specifically selected wavelengths over
the full spectrum, are readily handled using MLRA. The system may be extended to ternary
mixtures where a plane fitted to the data using a least-squares method - the intercepts and
slopes in two dimensions are used ·to evaluate the three concentrations.
66
Flow-Injection Analysis of the Platinum-Group Metals
Figure 2.12 A MLRA plot for a binary mixture of 40 f.tg.cm·3 Pt(/V) and 60 ~tg.cm·3
Pd(II). Each data point corresponds to a measurement at a wavelength in the range 368 to
484 nm at 4 nm intervals. Pt(IV) found, 39.5 f.tg.cm-3, and Pd(//) found 59.9 f.tg.cm-3
• The
MLRA correlation is -0.991 and Match Factor 999.8.
67
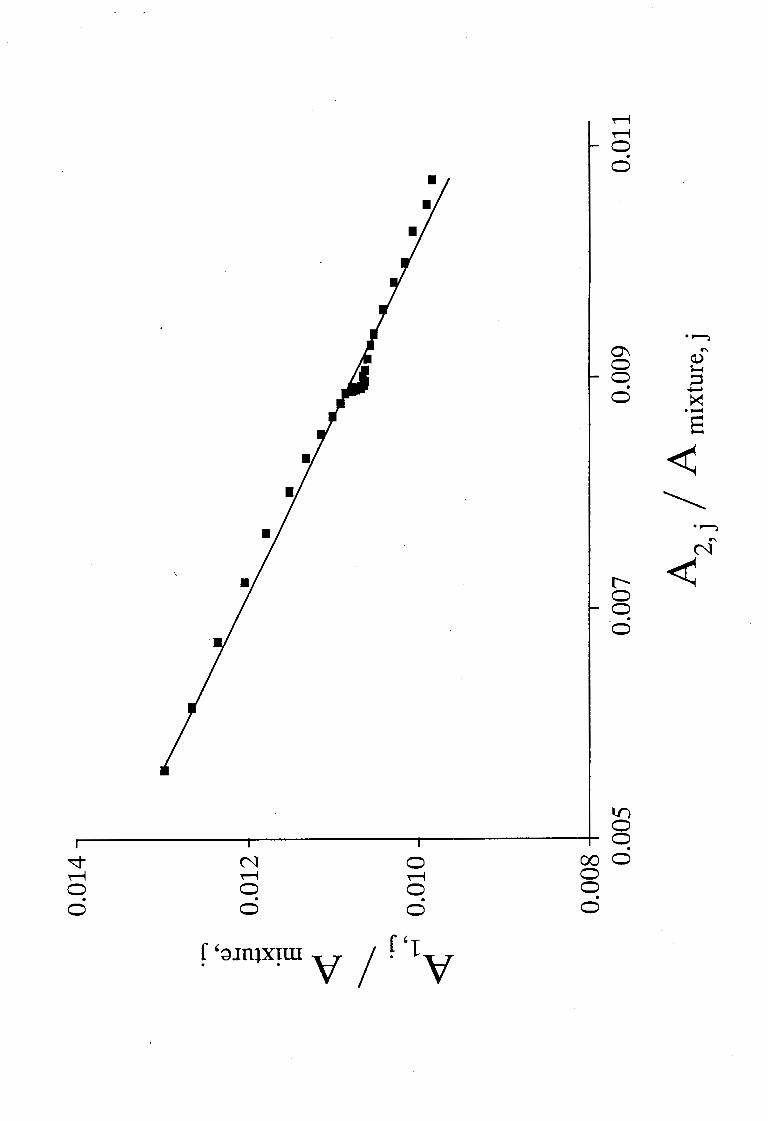
·~
0\ "' 0 (J)
;...... 0 ~ . ~
0 :>< ·-s < ~
·~ "' N
r--... < 0 0 . 0
lr) 0 0 .
~ N 0 00 0 M M M 0 0 0 0 0 . . . . 0 0 0 0
f ':umx~rn V I ('1 ·v
Flow-Injection Analysis of the Platinum-Group Metals
Figure 2.13 The absorption spectrum (•) and theoretical spectrum(-~ for a binary
mixture of 40 ~-tg.cm-3 Pt(IV) and 60 ~-tg.cm-3 Pd(/1). Each data point in the absorption
spectrum corresponds to a measurement at a wavelength, Aj. '
68
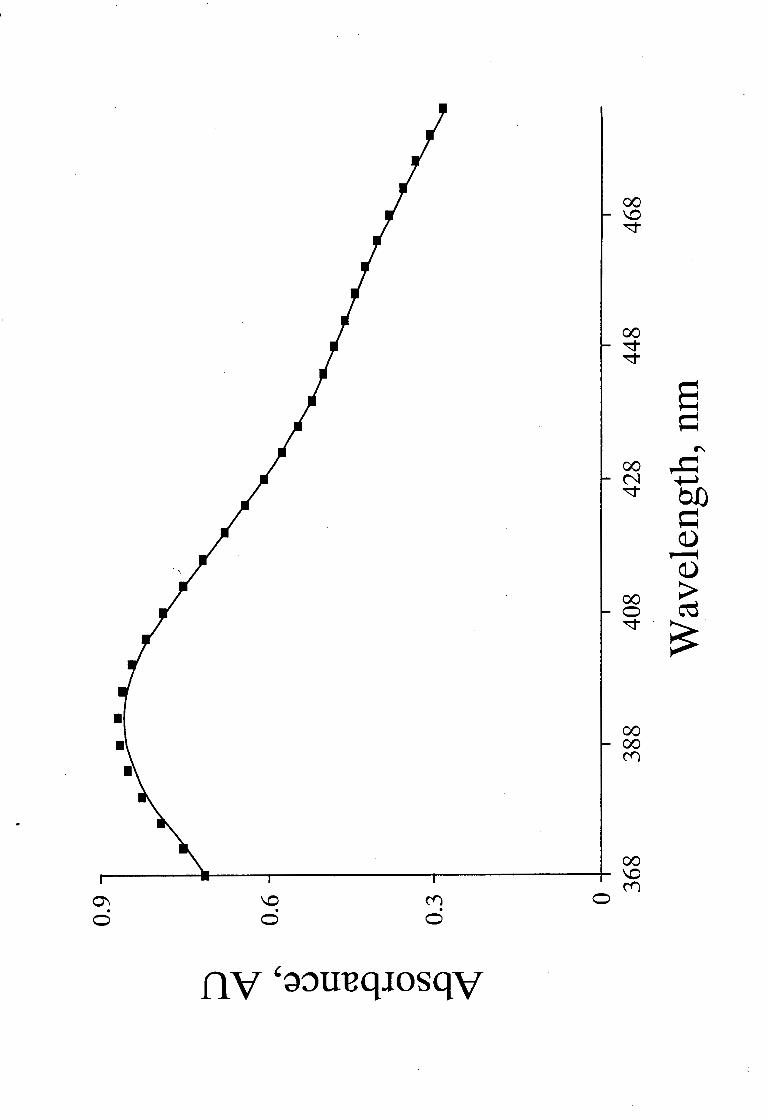
~ . 0
00 ~ ~
00 N ~
00 C) ~
00 00 ~
8 ~ ~
~ ~
~ 0 ~ ~
~ > ~
~
Flow-Injection Analysis of the Platinum-Group Metals
The least-squares fit is performed using the standard approach assuming that the y-axis
contains all the error, and that the x-axis is "error-free". This was not so in this case.
Nevertheless, this approach was employed throughout as the difference in final concentration
when the axes were reversed was found to be minimal. It has been shown10 that the artifice of
averaging the results of a regression of yon x, and then, x on y, leads to similar errors.
2.2.4 Wavelength Selection
The selection of wavelengths at which measurements are made is crucial to the least
squares analysis of spectrophotometric data. The literature emphasises fairly complicated
approaches to successfully select analytical wavelengths and wavelength ranges. 11'12
'13.14 It is
anticipated that considerably more attention will be placed on this wavelength selection
problem as MCA becomes a routine task in analysis.
Usually the absorbance maximum, or regions of the greatest difference, in the spectra of
the individual components are used as the fundamental criterion for wavelength selection.
Consider the binary system (Equation 2.5) where the greatest difference between the spectra is
desirable. The best way to find two wavelengths, or a range of wavelengths, that satisfy the
criterion of curve divergence is to plot the ratio of absorptivities, a l,j I a2,j, over a range of
wavelengths, j. The two wavelengths of maximum divergence will be the maximum and
minimum in the plot. Such plots are used in Chapter 6 for wavelength selection.
The same approach of selecting wavelengths may be followed in overdetermined
systems. The error caused by poor selection of wavelengths in the case where only a few (less
than 5) wavelengths are used, may be reduced by the use of additional wavelengths.
69
Flow-Injection Analysis of the Platinum-Group Metals
There are several criteria that should be considered when using MCA. These criteria,
though not comprehensive, give an indication of the factors to consider.
•
•
•
•
•
•
•
The system must obey Beer's Law and the Law of Additivity of Absorbances .
The number and identity of the components in the mixture must be known .
The number of selected wavelengths must be larger than the number of components .
There must be some degree of spectral difference between the components .
The selected wavelengths should be distributed over the spectral range of larger
absorptivities for each of the components to enable higher sensitivities (especially
where overlap is prevalent).
The wavelength axis is fixed and the calculation is done in the absorbance domain .
The ratios between the absorptivities of each component should be as large as possible .
If any of these criteria do not hold, or are not met, the multi-component calculations may
be severely affected. Finally, a practical consideration is the availability of standards in the
pure form for the components of interest.
2.3 Principles of Flow-Injection Analysis
Flow-injection analysis (FIA) is based on four major factors: (1) reproducible and direct
injection, (2) reproducible operational timing, (3) controlled dispersion processes, and
( 4) unsegmented flow characteristics. These factors combine to make FIA not only a new
analytical tool, but a new analytical concept.15 Although significant developments in FIA have
been made, the quantity of dynamic (or physical) and kinetic (or chemical) information
contained within the transient peak profile is far from being fully exploited.
Before the full capabilities of FIA are realised, a reasonable understanding of the basic
fluid dynamics mechanisms occurring in a manifold are required. Manipulation of these basic
transport principles can yield highly innovative FIA applications. The first, and probably the
most important consideration, is that of dispersion anq mixing processes within a manifold.
70
Flow-Injection Analysis of the Platinum-Group Metals
2.3.1 Dispersion and Mixing Processes
The purpose of transporting a sample through a flow-injection analysis manifold is to
treat the sample (chemically and physically) in such a way that it will yield an analytical
response that is highly reproducible. The sensitivity (response per unit concentration) of the
FIA response is influenced by the physical processes occurring as a result of the manifold
configuration such as solution flow rate, tube inner diameter, sample volume, and reactor
length, as well as the chemical processes of formation of a species under conditions prevalent
in the manifold.
The sample treatment occurs by a combination of physical phenomenon such as
convection (laminar or Newtonian flow), secondary flow, molecular diffusion effects, and
chemical effects due to a reaction occurring. In addition, turbulent (chaotic) flow can also be
used to supplement the mixing process. In this case, reactors packed with small diameter
beads17 intensify mixing in all directions. Regions of turbulent flow may be created by using
merging streams to enhance mixing across the whole length of the sample zone. These
physical phenomenon are outlined below in greater detail.
2.3.1.1 Convection (Laminar flow)
The movement of a fluid in a flowing stream through cylindrical tubing under laminar
flow conditions is controlled by convective forces and is a well understood and documented
phenomenon.16 In a straight tube a parabolic velocity profile is formed, where the elements of
fluid have zero linear velocity at the tube walls whereas those at the centre of the tube have
twice the average velocity.
The resultant velocity profile in a longitudinal cross-section of a straight tube is shown in
Figure 2.14. The parallel lines depict isovelocity streamlines. A streamline is simply the path a
liquid particle takes in a steady flow environment.
71
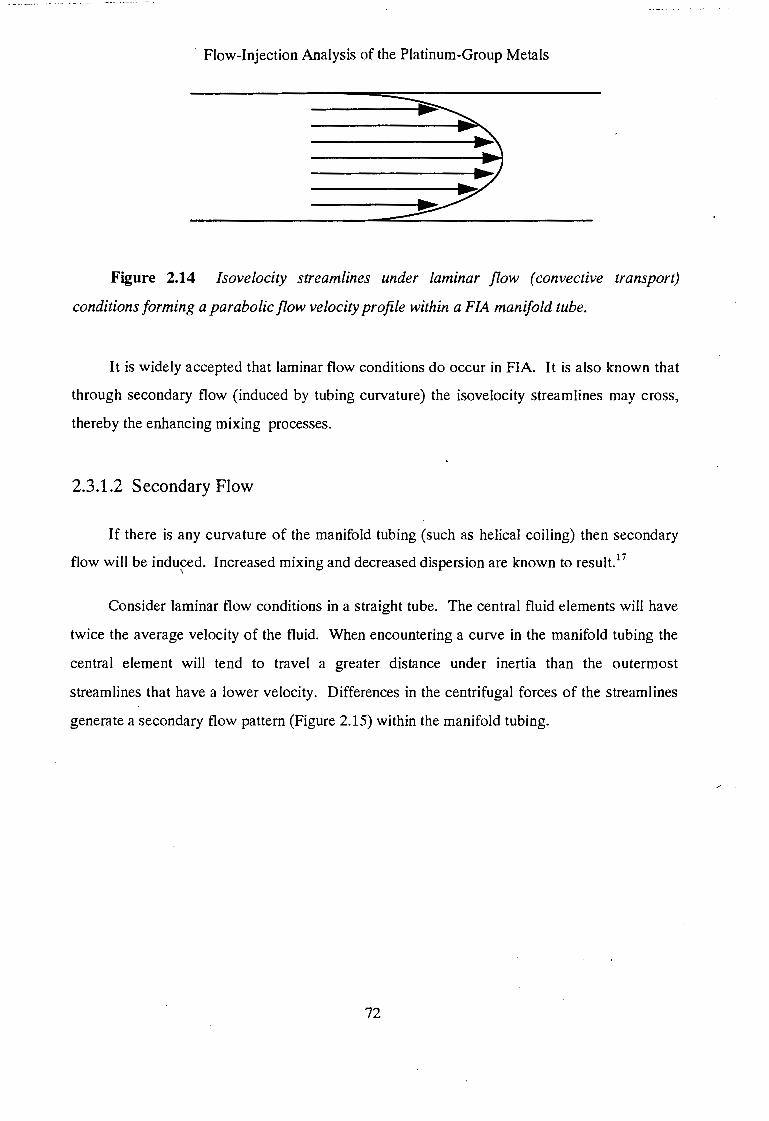
· Flow-Injection Analysis of the Platinum-Group Metals
Figure 2.14 Isovelocity streamlines under laminar flow (convective transport)
conditions forming a parabolic flow velocity profile within a FIA manifold tube.
It is widely accepted that laminar flow conditions do occur in FlA. It is also known that
through secondary flow (induced by tubing curvature) the isovelocity streamlines may cross,
thereby the enhancing mixing processes.
2.3.1.2 Secondary Flow
If there is any curvature of the manifold tubing (such as helical coiling) then secondary
flow will be indu~ed. Increased mixing and decreased dispersion are known to result. 17
Consider laminar flow conditions in a straight tube. The central fluid elements will have
twice the average velocity of the fluid. When encountering a curve in the manifold tubing the
central element will tend to travel a greater distance under inertia than the outermost
streamlines that have a lower velocity. Differences in the centrifugal forces of the streamlines
generate a secondary flow pattern (Figure 2.15) within the manifold tubing.
72
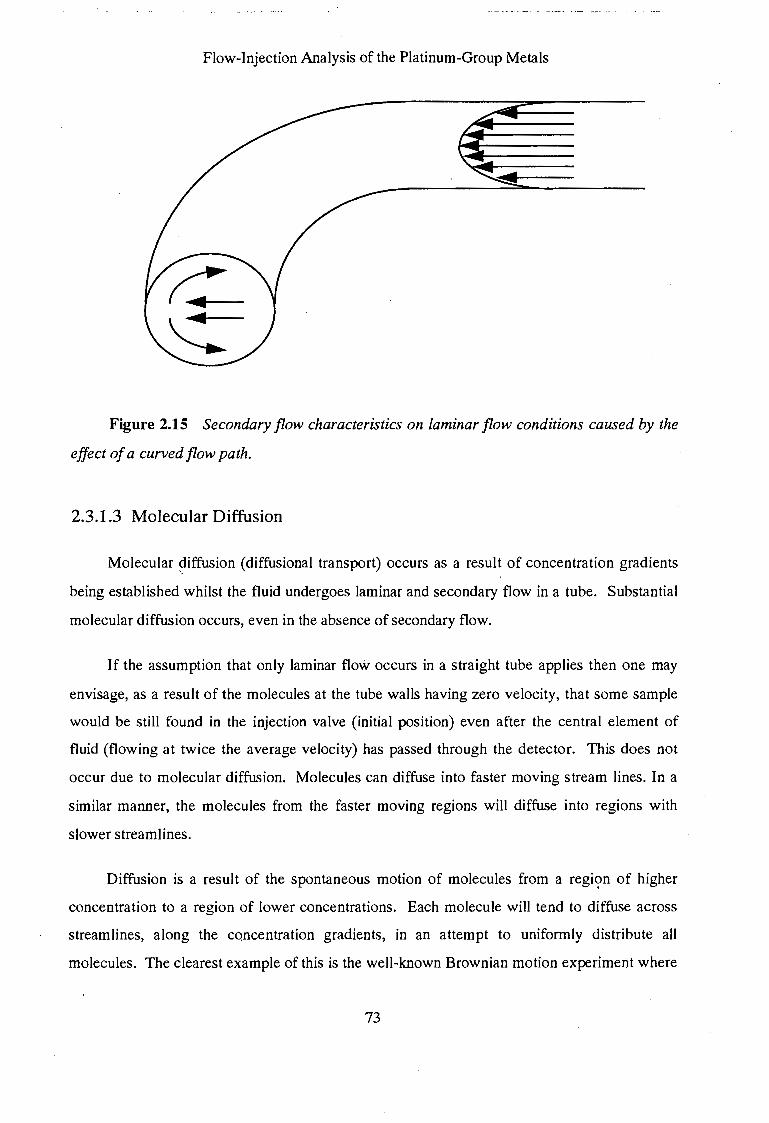
Flow-Injection Analysis of the Platinum-Group Metals
Figure 2.15 Secondary flow characteristics on laminar flow conditions caused by the
effect of a curved flow path.
2.3.1.3 Molecular Diffusion
Molecular ~iffusion (diffusional transport) occurs as a result of concentration gradients
being established whilst the fluid undergoes laminar and secondary flow in a tube. Substantial
molecular diffusion occurs, even in the absence of secondary flow.
If the assumption that only laminar flow occurs in a straight tube applies then one may
envisage, as a result of the molecules at the tube walls having zero velocity, that some sample
would be still found in the injection valve (initial position) even after the central element of
fluid (flowing at twice the average velocity) has passed through the detector. This does not
occur due to molecular diffusion. Molecules can diffuse into faster moving stream lines. In a
similar manner, the molecules from the faster moving regions will diffuse into regions with
slower streamlines.
Diffusion is a result of the spontaneous motion of molecules from a regi<;m of higher
concentration to a region of lower concentrations. Each molecule will tend to diffuse across
streamlines, along the concentration gradients, in an attempt to uniformly distribute all
molecules. The clearest example of this is the well-known Brownian motion experiment where
73
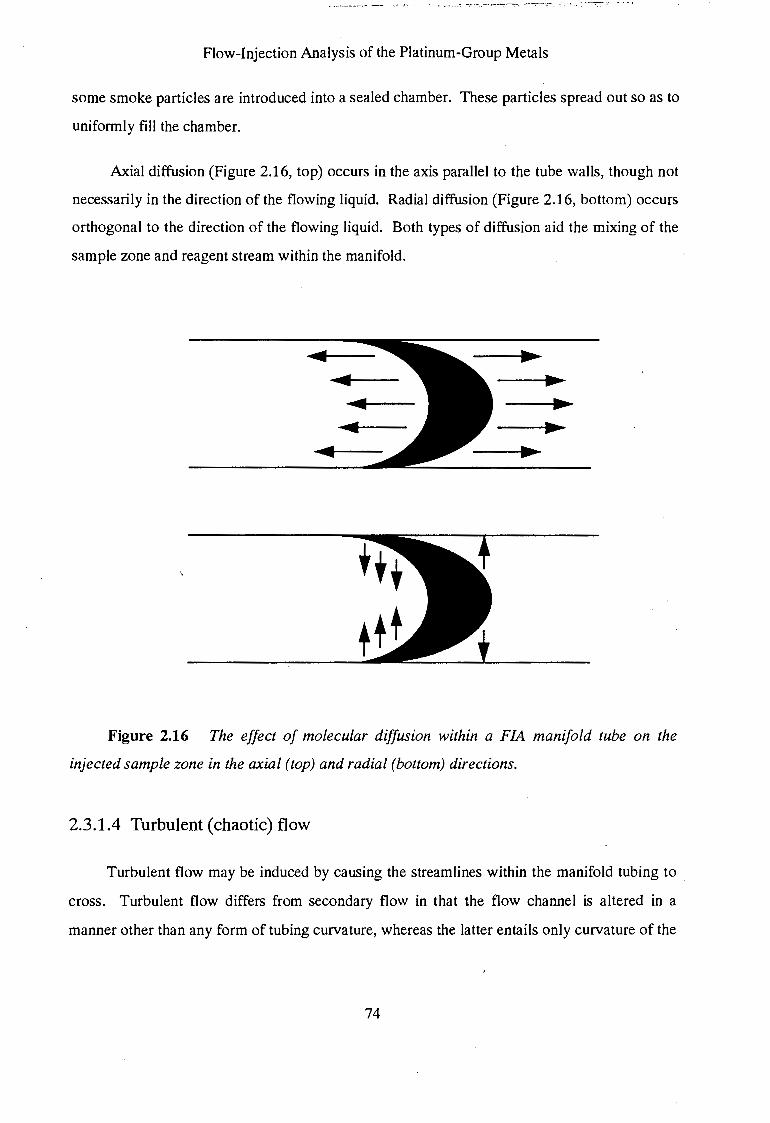
Flow-Injection Analysis of the Platinum-Group Metals
some smoke particles are introduced into a sealed chamber. These particles spread out so as to
uniformly fill the chamber.
Axial diffusion (Figure 2.16, top) occurs in the axis parallel to the tube walls, though not
necessarily in the direction of the flowing liquid. Radial diffusion (Figure 2.16, bottom) occurs
orthogonal to the direction of the flowing liquid. Both types of diffusion aid the mixing of the
sample zone and reagent stream within the manifold .
.... .... ....
....
Figure 2.16 The effect of molecular diffusion within a FIA manifold tube on the
injected sample zone in the axial (top) and radial (bottom) directions.
2.3.1.4 Turbulent (chaotic) flow
Turbulent flow may be induced by causing the streamlines within the manifold tubing to
cross. Turbulent flow differs from secondary flow in that the flow channel is altered in a
manner other than any form of tubing curvature, whereas the latter entails only curvature of the
74
Flow-Injection Analysis of the Platinum-Group Metals
manifold tubing. Such flow channel alterations may be in the form of single-bead string
reactors, a stirred mixing chamber, or a tee-piece (enabling two streams to merge ). 17
The result of turbulent flow is a rapid averaging of the velocity profiles due to chaotic
movement of the fluid elements with mixing taking place in all directions of similar intensity
and rapidity. For example, when a tee-piece is used the sample zone is mixed along its whole
length in a rapid and reproducible manner when the two streams merge.
2.3.2 The Dispersion Coefficient
An FIA peak may be characterised by (1) its position as a function of time, (2) its peak
width generally measured at a convenient distance from the baseline, (3) the. maximum peak
height, and ( 4) the overall peak area. These values change as a function of the FIA manifold
operating conditions (viz. flow rate, reaction coil length, merging streams, etc.) Another
parameter which is very useful is the "Dispersion Coefficient."
Consider a sample solution, contained within the valve sample loop prior to injection as
depicted in Figur~ 2.17. The sample is homogenous and has an original concentration C0• The
height of this original square wave signal would be proportional to the concentration. When
the sample is injected into the moving carrier stream (Figure 2.17, Inj.), it follows the
movement of this stream, forming a dispersed zone with a form dependant on the manifold
geometry and flow velocity.
As a result of dispersion, the peak height of the transient signal will never exceed that of
the theoretical square wave response unless of course an enrichment technique is used. The
extent of dispersion* is termed the "Dispersion Coefficient." This dispersion coefficient, D, has
been defined as the ratio of concentrations of the sample material before (C~ and after the
dispersion process has taken place17 as denoted in Equation 2.10.
+ The term dispersion is not only due to "pure" dispersion but also due to dilution when, for
instance, other streams merge with the carrier stream.
75
Flow-Injection Analysis of the Platinum-Group Metals
Figure 2.17 An originally homogenous sample zone (top right) disperses during its
motion through a reaction coil (top center). This changes the original square profile (lower
right) of concentration C0, to a profile (center) comprising a continuum of concentrations
with a maximum, Cmax-
76
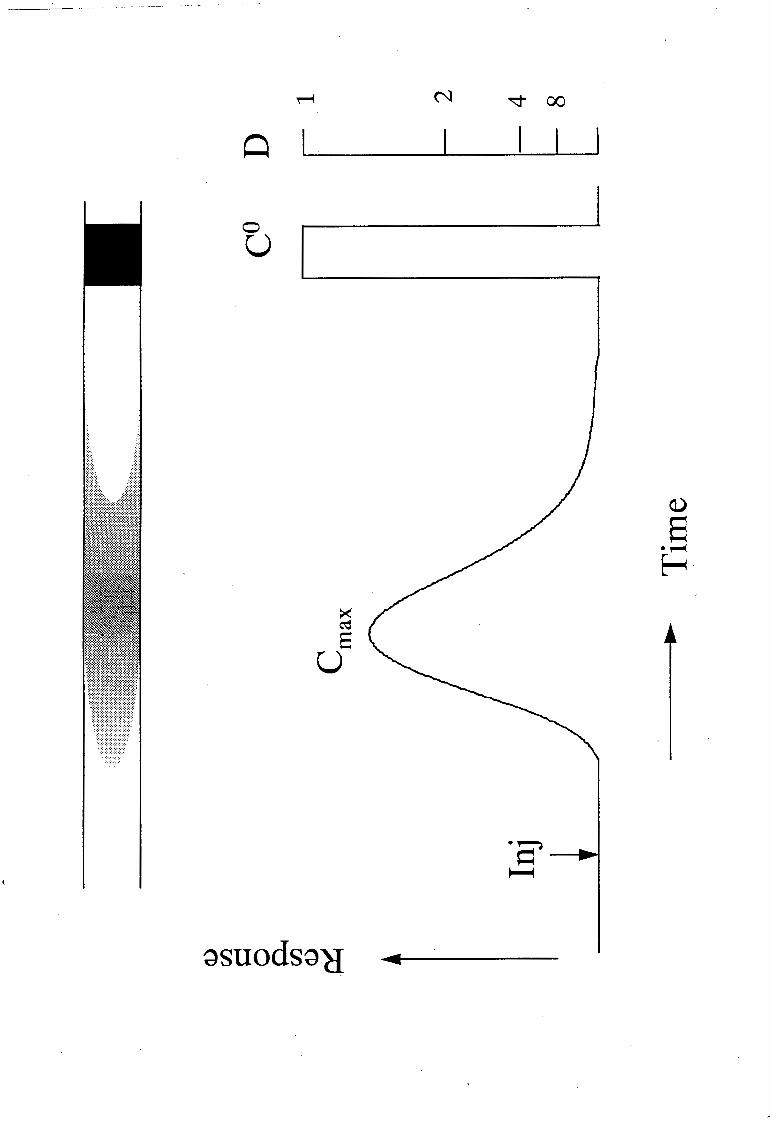
I I
0 u
gsuodsg~ ~~~-------
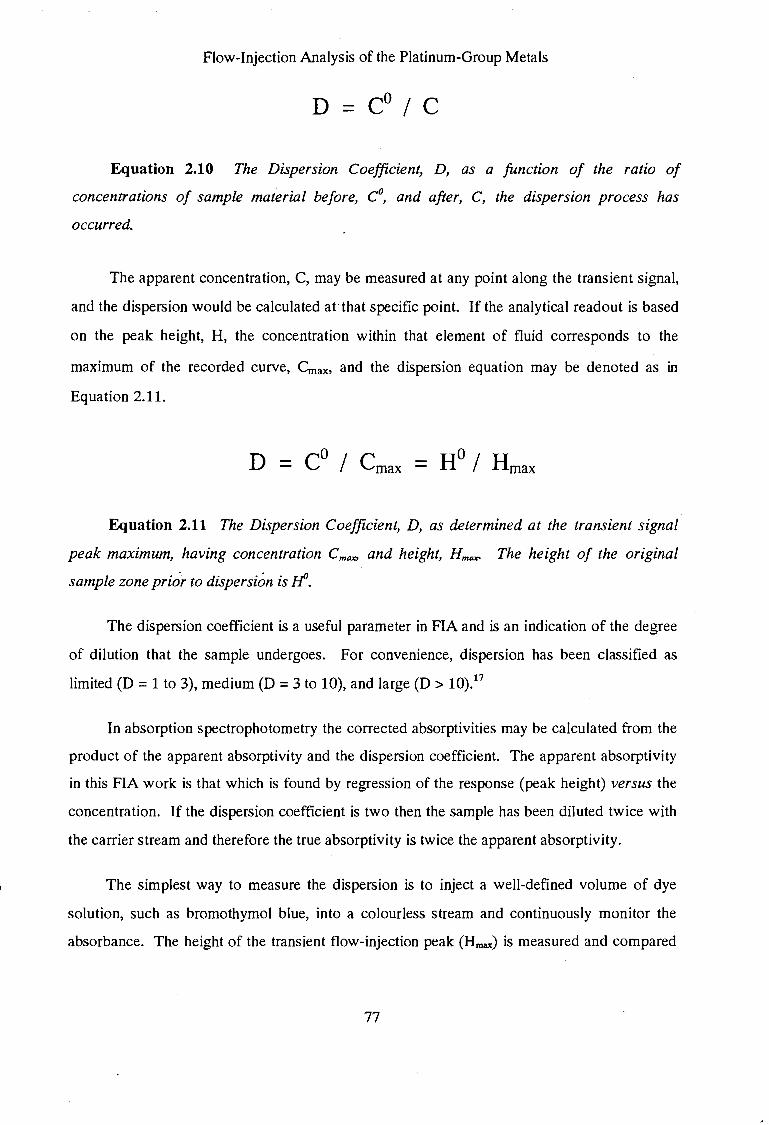
Flow-Injection Analysis of the Platinum-Group Metals
D=C0 /C
Equation 2.10 The Dispersion Coefficient, D, as a function of the ratio of
concentrations of sample material before, C0, and after, C, the dispersion process has
occurred.
The apparent concentration, C, may be measured at any point along the transient signal,
and the dispersion would be calculated at· that specific point. If the analytical readout is based
on the peak height, H, the concentration within that element of fluid corresponds to the
maximum of the recorded curve, Cmax. and the dispersion equation may be denoted as in
Equation 2.11.
D
Equation 2.11 The Dispersion Coefficient, D, as determined at the transient signal
peak maximum, having concentration Cm= and height, Hmox- The height of the original
sample zone prio.r to dispersion is d.
The dispersion coefficient is a useful parameter in FIA and is an indication of the degree
of dilution that the sample undergoes. For convenience, dispersion has been classified as
limited (D = 1 to 3), medium (D = 3 to 1 0), and large (D > 1 0).17
In absorption spectrophotometry the corrected absorptivities may be calculated from the
product of the apparent absorptivity and the dispersion coefficient. The apparent absorptivity
in this FIA work is that which is found by regression of the response (peak height) versus the
concentration. If the dispersion coefficient is two then the sample has been diluted twice with
the carrier stream and therefore the true absorptivity is twice the apparent absorptivity.
The simplest way to measure the dispersion is to inject a well-defined volume of dye
solution, such as bromothymol blue, into a colourless stream and continuously monitor the
absorbance. The height of the transient flow-injection peak (Hmax) is measured and compared
77
Flow-Injection Analysis of the Platinum-Group Metals
to the signal recorded when the flowcell is filled with undiluted dye (H0). Provided that Beer's
Law is followed, the dispersion coefficient may be calculated from Equation 2.11.
2.3.3 A Novel Non-equilibrium Environment
The pursuit of homogenous mixing and ensuring complete chemical reaction is a concept
that has been engrained in analysts as a requirement for reproducible measurement, particularly
in spectrophotometric techniques. This misconception clouded even the remote possibility of
monitoring a reaction at any time other than at the reaction completion.
This concept of a "steady-state signal" can be abandoned in FlA. Although the reagent
and sample mixing is incomplete, and chemical equilibrium is not attained, the use of the well
defined environment of the FIA manifold ensures highly reproducible results. This is a result of
the manifolds' constant configuration, flow rate, and timing.
The immediate implications of this novel non-equilibrium environment are that the
sampling frequency increases due to shorter reaction times, and solution consumption is
decreased. Further ramifications of non-equilibrium conditions are that complete colour
development is no longer a prerequisite and the possibility of studying transient species
becomes a reality.
2.3.4 Manifold Design Criteria
In designing an effective FIA manifold, cognisance should be taken of several guidelines
that have been summarised by Ruzicka and Hansen17 in a series of rules. These rules relate,
mathematically, the effect of sample volume, reactor length, flow rate, reactor geometry, and
give an indication of the way to increase the sampling rate of a manifold. These rules aid in the
optimisation of a manifold under construction. A combination of the application of the rules
and an experimental optimisation approach is frequently used.
78
Flow-Injection Analysis of the Platinum-Group Metals
The common aims in optimisation include attempts to obtain high sample throughput,
minimal dispersion, adequate sensitivity for the analyte, low peak widths, and reduce solution
consumption. Some of these are mutually exclusive. The emphasis on any one factor varies
between applications.
Marshall18 summarised the typical approach used by FIA practitioners m method
development with the remarkably accurate statement -
" ... many FIA practitioners prefer to rely on an empirical approach. FIA is quite
forgiving in that a system which has not been optimised can yield satisfactory results: "
79
Flow-Injection Analysis of the Platinum-Group Metals
2.4 References
1. Nowicka-Jankowska, T., Gorczynska, K., Michalik, A., and Wieteska, E.,
. "Comprehensive Analytical Chemistry :Analytical Visible and Ultraviolet
Spectrometry", Vol. XIX, Elsevier, New York, 1986.
2. Kortum, G., and Seiler, M., Angew. Chern., 1939, 52, 687.
3. Meehan, E.J ., "Treatise on Analytical Chemistry", 2nd edn., lnterscience, New
York, 1981.
4. "The Unscrambler" Software Package, Ver. 5.0, Camo AS, Norway, 1993.
5. Martens, H., and Naes, T., Trends Anal. Chern., 1984,3, 204.
6. Martens, H., and Naes, T., Trends Anal. Chern., 1984, 3, 266.
7. Kowalski, B.R., and Beebe, K.R.,Anal. Chern., 1987, 59(17), 1007A.
8. Huber, L., "Applications of diode-array detection in HPLC ", Hewlett Packard,
West Germany, 1989.
9. Blanco, M., Gene, J., lturriaga, H., Maspoch, S., and Riba, J., Talanta, 1987, 34(12),
987.
10. York, D., Can. J. Phys., 1966, 44, 1079.
11. Frans, S.D., and Harris, J.M.,Anal. Chern., 1985,57, 2680.
12. Brown, C.W., et al., Anal. Chern., 1982, 54, 1472.
13. Conners, K.A., and Chukwuenweniwe, J.E.,Anal. Chern., 1979, 51(8), 1262.
14. Rossi, D.T., and Pardue, H.L., Anal. Chim. Acta, 1985, 175, 153.
15. Hansen, E.H., Quim. Anal., 1989, 8(2), 139.
16. Knudsen, J.G., and Katz, D.L., "Fluid Dynamics and Heat Transfer", McGraw-Hill,
New York, 1958.
17. Ruzicka, J., and Hansen, E.H., "Flow Injection Analysis", 2nd edn., Wiley
lnterscience, New York, 1988.
18. Marshall, G.D., PhD Thesis, University of Pretoria, Rep. S. Afr, 1994.
80
Flow-Injection Analysis of the Platinum-Group Metals
Chapter 3.
Data Acquisition and Analysis
Data acquisition and analysis are important aspects of chemical analysis. Data acquisition
methods may vary from a simple steady-state measurement being noted, to a FIA transient
profile being recorded on a chart recorder. Fortunately, the use of microcomputer data
acquisition has become routine and it is possible to record the vast quantities of data required
for multi-component analysis in a convenient fashion. This data acquisition includes any form
of apparatus control antecedent to, and required by, the data acquisition procedure. Data
analysis incorporates the handling and manipulation of the collected data in order to obtain
results.
Automation and control of FIA apparatus has become an integral part of the data
acquisition and analysis process. The ability of microcomputers to process vast quantities of
data, and to facilitate the interface to analytical instrumentation enables complete automation
of the control pr~cess from sample injection to result delivery.
Automation and control of the experimental apparatus are detailed in this chapter.
Computer-aided Flow Analysis is introduced by means of a dedicated data acquisition and
device control software package called FlowTEK™ .1'2 This software provides the necessary
FIA manifold automation and control.
With the increased use of microcomputers to acquire data, it is essential that the
researcher have a working knowledge of basic programming techniques and be au fait with
statistical packages and spreadsheets. This will enable suitable manipulation, analysis, and
presentation of FIA data. Many FIA methods generate data peculiar to the specific manifold
used. Such data often require manipulations that commercial software programs do not
provide.
81
Flow-Injection Analysis of the Platinum-Group Metals
The mathematical routines for quantitation in spectrophotometry were outlined in the
previous chapter. Such computations clearly require the use of specific software. The
development of a multi-purpose and versatile software program to manipulate and process
multi-wavelength data is described. It is intended that this software development will lay the
foundation for future work to exploit all the data available from a FIA profile, and when a
multi-channel detector is used. The programming language to develop this software is
introduced as a very powerful tool in analytical data processing.
3.1 Automation and Control
Microcomputer control requires some form of interface linking FIA devices to a
microcomputer, and software to control the devices. A means to acquire data from the
detector is also necessary. Microcomputer control allows similar samples to be analysed in a
FIA-based analyser in an unattended and automated fashion for several days or longer.
Each FIA experiment produces large quantities of data in comparison to a single value
result obtained from manual batch-type operations. This collected data requires storage,
manipulation to a usable form, and finally computation and interpretation to yield the analytical
results. Automation of these steps is highly desirable for several reasons.
3.1.1 Objectives of Automation
The objectives of automation in the laboratory or in a chemical process vary but both are
a result of a consideration of at least a few, if not all, of the following points:
• Processing large numbers of samples
• Increased sample throughput
• Reduction of human participation to reduce errors and lower costs
• Process control
• Lowering reagent and sample consumption
• Facilitating an analysis
• Handling vast quantities of data
82
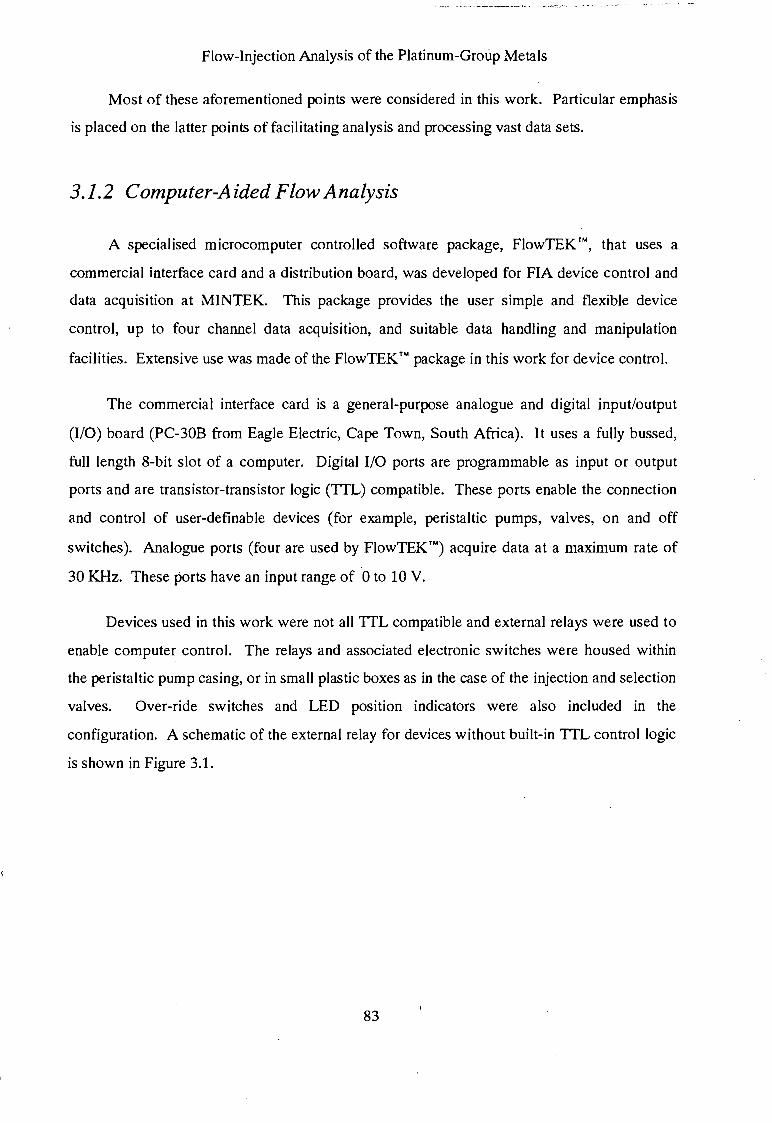
Flow-Injection Analysis of the Platinum-Group Metals
Most of these aforementioned points were considered in this work. Particular emphasis
is placed on the latter points of facilitating analysis and processing vast data sets.
3.1.2 Computer-Aided Flow Analysis
A specialised microcomputer controlled software package, FlowTEK™, that uses a
commercial interface card and a distribution board, was developed for FIA device control and
data acquisition at MINTEK. This package provides the user simple and flexible device
control, up to four channel data acquisition, and suitable data handling and manipulation
facilities. Extensive use was made of the FlowTEKT" package in this work for device control.
The commercial interface card is a general-purpose analogue and digital input/output
(1/0) board (PC-30B from Eagle Electric, Cape Town, South Africa). It uses a fully bussed,
full length 8-bit slot of a computer. Digital 1/0 ports are programmable as input or output
ports and are transistor-transistor logic (TTL) compatible. These ports enable the connection
and control of user-definable devices (for example, peristaltic pumps, valves, on and off
switches). Analogue ports (four are used by FlowTEKT") acquire data at a maximum rate of
30KHz. These ports have an input range of 0 to 10 V.
Devices used in this work were not all TTL compatible and external relays were used to
enable computer control. The relays and associated electronic switches were housed within
the peristaltic pump casing, or in small plastic boxes as in the case of the injection and selection
valves. Over-ride switches and LED position indicators were also included in the
configuration. A schematic of the external relay for devices without built-in TTL control logic
is shown in Figure 3.1.
83
To device
Flow-Injection Analysis of the Platinum-Group Metals
Device Relay
V+
ov
~· PCB Relay
Figure 3.1 External relay for devices without built-in ITL control logic. PCB-relay
represents printed circuit board relay with a coil of 5V and 500Q; Device relay represents a
relay with coil matching the voltage requirements of the device; V+ represents the positive
voltage requirement of the device; Gnd represents ground connection, and 110 represents the
input/output ports of the distribution board.
The FIA manifold configuration, used in conjunction with FlowTEK'M device control, is
depicted in Figure 3.2. It comprised a two-line (merging stream) FIA manifold. The carrier
and reagent streams were propelled by a peristaltic pump at a constant flow rate. Samples
were introduced into the manifold via an injection valve. The injection valve was connected to
a 6-port selection valve to enable selection of up to six different solutions for measurement.
Both valves were pneumatically switched under computer control. The detector "autozero"
and "remote start" controls were controlled by the computer via the FlowTEK'M distribution
board.
84
Flow-Injection Analysis of the Platinum-Group Metals
Figure 3.2 Schematic representation of the FIA manifold comprising a peristaltic
pump, P; injection valve, N; selection valve, SV; spectrophotometric detector, D; carrier
stream, C; reagent stream, R; and waste, W. The general-purpose l/0 interface card is
housed within the computer and is linked to the detector and devices via the distribution
board, DB. Digital( ..... ) and analog signals(----) are shown.
85
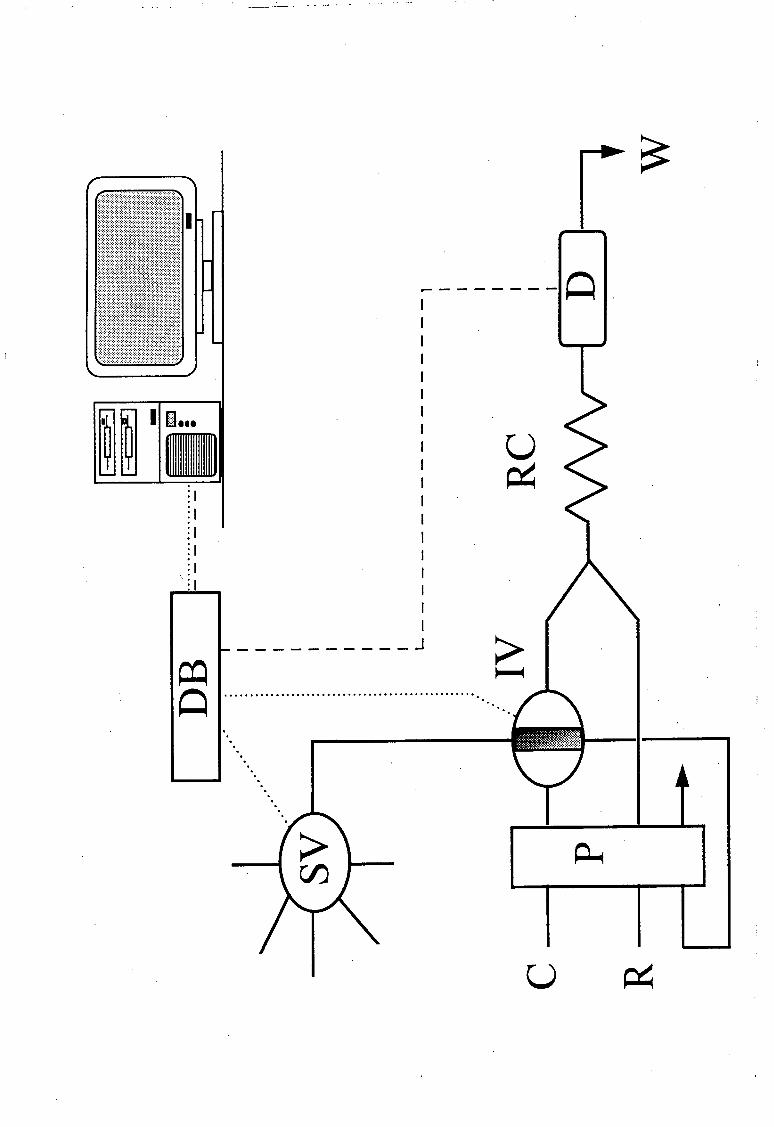
--------0 I
~
I I I I I I I I I I I I I
r-----------J
o·················································
·.
u
Flow-Injection Analysis of the Platinum-Group Metals
3.2 Microcomputer Software Development
The development of MCA methods for the determination of the PGMs necessitated the
use of several analytical wavelengths. The high-speed scanning spectrophotometer used, the
Spectra FOCUS 1 M, was shipped with OS/2 and Microsoft® WindowsTM version 2 based
software programs that allow serial transfer of the recorded spectral scans to a remote
computer. Neither of these software programs attained suitable operational status.
The cause of these problems seems to have been due to unknown conflicts between the
software and the detector and computer hardware. It was also found from an operational
system elsewhere that the spectral data were inaccessible due to the complex storage format.
Furthermore, no comprehensive data manipulation or multi-component-based software exists
for this instrument.
As the detector has only four analogue output ports, an alternative approach, although
tedious, was used. The detector stored the recorded spectral scans and these scans were
subsequently "played-back" through a single analogue output port. The FlowTEKTM software
was used to collect this data. The detector "download" rate settings were adjusted to allow
the absorbance-time data acquired by FlowTEKTM to be readily converted into absorbance
wavelength data.
Additional software was therefore required. to enable adequate data handling and
analysis. As the author is most familiar with the Basic programming language, the selection of
Visual Basic TM as the development tool was natural. The software developed can operate
under the Microsoft® Windows and OS/2 platforms. The latter enabled true multi-tasking and
allowed concurrent data collection via FlowTEKTM and data analysis by the user.
The software developed during the course of this study was tentatively called
"ReduceTEK". The current version is 3.2. This version contains most of the features of
previous versions.
86
Flow-Injection Analysis of the Platinum-Group Metals
3.2.1 Microcomputers and Accessories
Two computers were used - a 386 DX 33 MHz computer with 8 Megabytes (Mb) of
RAM, an 80Mb hard disk drive, an Intel® math co-processor, and a super visual graphics array
(SVGA) screen, as well as a 286 12 MHz computer with 640 K memory, a 20Mb hard disk
drive, and a visual graphics array (VGA) screen. They were fitted with standard "floppy"
(1.2 Mb) and "stiffy" (1.44 Mb) disk drives.
The FlowTEKTM package was run on either the 286 or 386 DX computer under a DOS®
(Disk Operating System®) shell. Operation of FlowTEKTM' in the DOS® shell, using the multi
tasking 32-bit OS/2 2.0 Presentation ManagerTM platform was possible for the 386 DX
computer. The Spectra FOCUS TM detector was coupled to the computer running the
FlowTEKTM software. Most experimental data was acquired over the full absorption spectra
(368 to 668 nm). In addition, data acquisition at only four wavelengths was performed in
some cases.
An Epson LX-400 dot matrix printer was used for hard copies of the data files and (li)
results. A Microsoft- mouse was used throughout the work.
3.2.2 Meeting the Challenge of the Graphical User Interface
Visual Basic TM is a visual development environment (VDE) that offers a simple approach
to Windows TM or OS/2 based program and interface design. The essential difference between
Visual Basic TM code and a DOS® program is that the Visual Basic TM code does not operate in a
procedural fashion (i.e. starting at the first command and moving through a sequence of
commands). Instead, it is event-driven programming, where the code that is used remains idle
until called upon to respond to a specific user- or system-initiated event.
In addition to this difference, Windows TM -based programs share screen space and
computing time. This allows multiple windows to be displayed simultaneously.
The event-driven application design makes the programmer more productive by
providing the appropriate tools for the different aspects of graphical user interface (GUI)
87
Flow-Injection Analysis of the Platinum-Group Metals
development. The essential components of Visual Basic TM program development are shown
with reference to a portion of sample code taken directly from ReduceTEK. The code in
Figure 3.3 is from the file management part of the ReduceTEK software.
Some steps in graphic user interface (GUI) design and programming are outlined. First,
the GUI for the application is created by drawing objects in a graphical way. An object can
refer to a form or control (such as a command button, text box, file control lists, drop-down
menu, etc.). The "Toolbox" has a selection of common tools needed in Visual Basic TM
applications. In Figure 3.3 such objects are seen in the form "Select Data File ... ". The current
selection points to a command button ("OK") and a list of files is displayed in a file control list.
The objects drawn are then refined by setting their properties. The "properties bar" shows the
caption text for the current selection command button. The text entered, "OK", is displayed
on the command button. Many other properties relating to the screen display and functioning
of the objects may be set.
The interface is then made to react to the user by writing code that responds to events
that occur in the GUI. In the "source code window" typical code for such an event is shown.
The object here i~ the command button "OK" .and the event (see the "event menu") is "Click" -
a mouse button click. In other words, when a mouse-click is identified on the OK-button then
the code shown is executed. Many other events, such as drag-and-drop options, double
clicks, and mouse movement, can also be handled. Aform and module in the minimised state
are shown. The module, "Spectrum.BAS" here, is a collection of code that is not linked to a
form. An event on a form accesses this code by means of sub-routine calls.
Meeting the challenge of the GUI is therefore essentially the development of software
that makes full use of the provided features and capabilities of the programming language
without forgetting the necessity for easy interaction with the user.
88
Flow-Injection Analysis of the Platinum-Group Metals
Figure 3.3 The Visual Basic•M graphical user interface showing the various parts of
the interface and their relationship with one another.
89
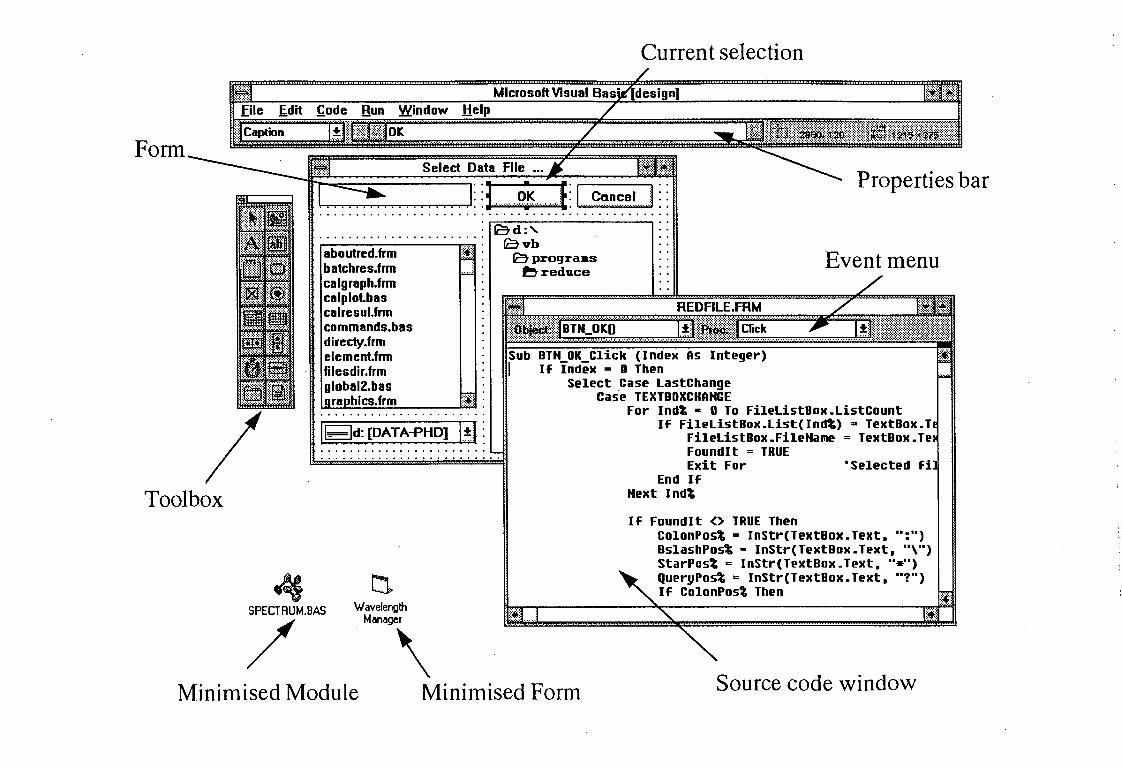
Form
Toolbox
4
••••••••••••••• 0. 0 •••
- - ·-·-···-aboutred.trm batchres.frm calgraph.frm calplot.bas calresul.fnn commands.bas directy.frm element.fnn filesdir.frm global2.bas raphics.frm [if
0 •• 0 •••• 0 ••••••••• 0 0. 0.
--------
IEJd: [DATA-PHD] 1.~:1:
D. SPECTAUM.BAS Wavelength
Manager
/ \
d:'-(Ovb
(Oprograas ~reduce
Current selection
Properties bar
Sub BTH OK Click (Index As I If Index = n Then
Select Case lastChange Case TEXTBOXCHAHCE
For lndt • H To FilelistBox.ListCount If FilelistBox.list(lnd%) g TextBox.
FilelistBox.FileHa~e = TextBox. Foundlt = TRUE Exit For
End If Hext lnd't
If Foundlt <> TRUE Then ColonPos% = InStr(TextBox. Text. '' :") BslashPos%- InStr(TextBox.Text. "\") StarPos% = InStr(TextBox.Text. "*") QueryPost = InStr(TextBox.Text. "?") If ColonPos% Then
Minimised Module Minimised Form Source code window
Flow-Injection Analysis of the Platinum-Group Metals
3.2.3 Program Structure and Design
ReduceTEK is a menu-driven program developed using Microsoft® Visual Basic TM. The
size of the executable file is 304 K. A 270 K Visual BasicTM DLL (dynamic link libraryi and
default ReduceTEK configuration files are required for program operation.
The modularity and flexibility of the program were achieved by the use of independent
sub-routines and function calls within separate source code modules. The standard Windows TM
GUI elements, such as pull-down menus and dialog boxes, were included as required. A
dendrogram of the program is shown in Figure 3.4.
Each level in the program is activated through menu choices. These are selected by
means of a pointing device, arrow keys, or "short-cut" keys (viz. Alt-F to access the ".Eile"
drop-down menu). The button bar performs the same function as the relevant main menu
selection. These buttons have been included, along with "short-cut" keys, to enable more rapid
selection of the most frequently used main menu options. Details of the main menu options are
shown in Table 3.1.
90
Flow-Injection Analysis of the Platinum-Group Metals
Figure 3.4 Dendrogram of the ReduceTEK program showing the various menu options
and program functions.
91
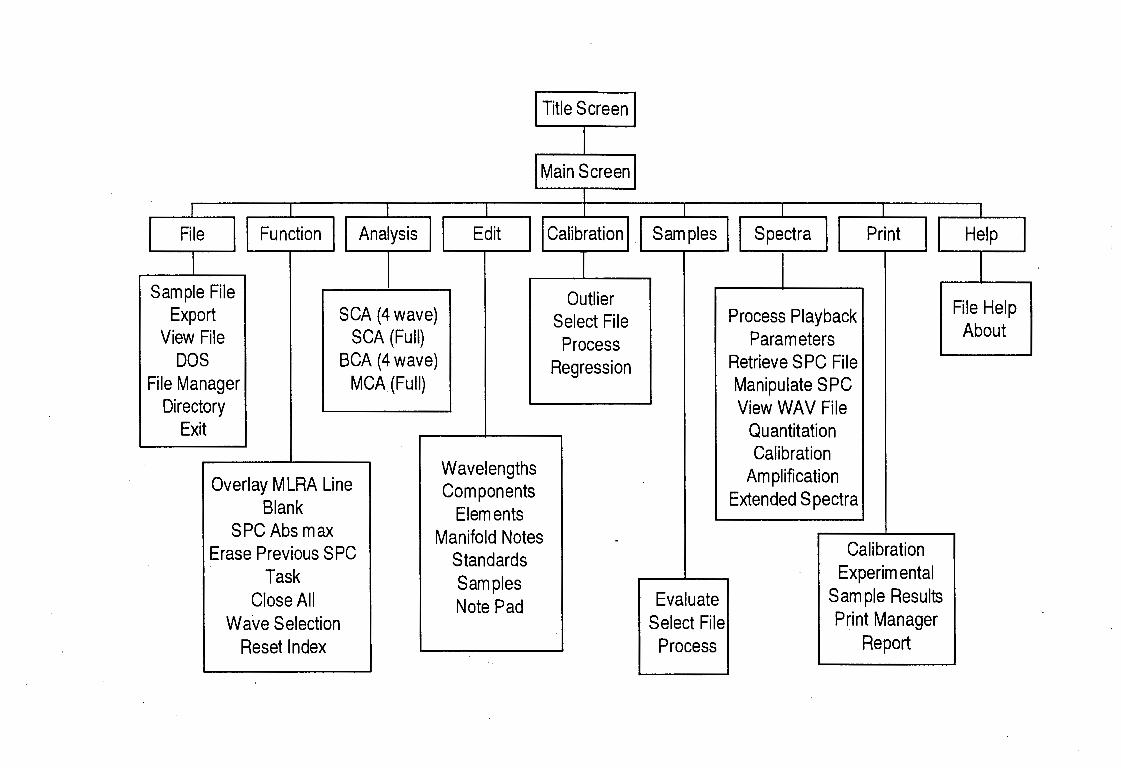
I l
~ I Fun;tion II An~ysis I ~ Print l .1 Sam pies II Spectra II I ._____,..------1 I , I
Sample File Export
View File DOS
File Manager Directory
Exit
SCA (4 wave) SCA (Full)
BCA (4 wave) MCA(Full)
Overlay MLRA Line Blank
SPC Abs max Erase Previous SPC
Task Close All
Wave Selection Reset Index
Wavelengths Components
Elements Manifold Notes
Standards Samples Note Pad
Outlier Select File Process
Regression
Evaluate Select File Process
Process Playback Parameters
Retrieve SPC File Manipulate SPC View WAV File
Quantitation Calibration
Amplification Extended Spectra
Calibration Experimental
Sample Results Print Manager
Report
File Help About
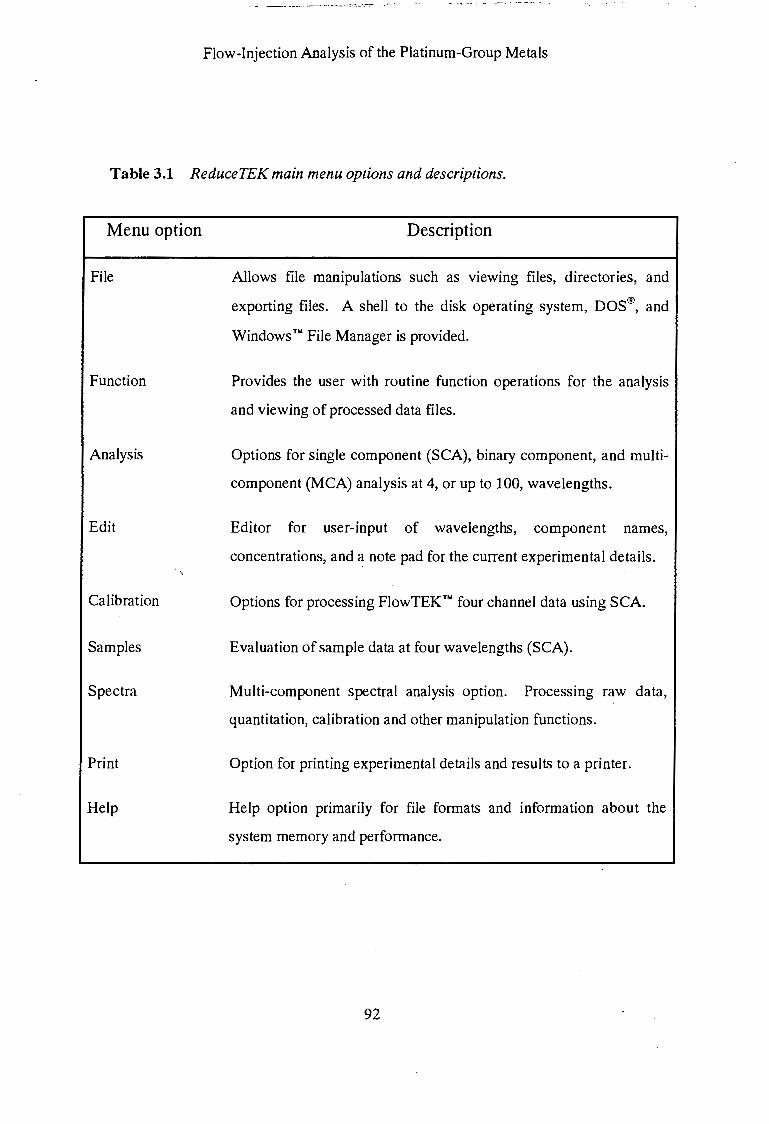
- -- ~---------..~~~-.--·.-- ~ -.
Flow-Injection Analysis of the Platinum-Group Metals
Table 3.1 ReduceTEK main menu options and descriptions.
Menu option
File
Function
Analysis
Edit
Calibration
Samples
Spectra
Help
Description
Allows file manipulations such as viewing files, directories, and
exporting files. A shell to the disk operating system, DOS®, and
Windows TM File Manager is provided.
Provides the user with routine function operations for the analysis
and viewing of processed data files.
Options for single component (SCA), binary component, and multi
component (MCA) analysis at 4, or up to 100, wavelengths.
Editor for user-input of wavelengths, component names,
concentrations, and a note pad for the current experimental details.
Options for processing FlowTEKTM four channel data using SCA.
Evaluation of sample data at four wavelengths (SCA).
Multi-component spectral analysis option. Processing raw data,
quantitation, calibration and other manipulation functions.
Option for printing experimental details and results to a printer.
Help option primarily for file formats and information about the
system memory and performance.
92
Flow-Injection Analysis of the Platinum-Group Metals
ReduceTEK is divided into several interlinked "modules", each accounting for an aspect
of the data handling. These modules are separate units comprising a "pop-up" window and its
requisite code. The module first prompts for the file to be viewed, retrieves that file, and
displays it using appropriate scales and axes. For example, a view of the standard absorption
spectra after averaging is shown in Figure 3.5 in the "Spectra window".
Multiple window views give the user the analysis parameters used, results in tabular
and graphical format, and statistical analyses simultaneously. Each window is interlinked to
the others so that a change in one automatically updates the others. A multiple window view
for a multi-wavelength sample analysis is shown in Figure 3.6 illustrating the transparency of
the analysis methodology to the user. Similar multiple-window views are used for
manipulation of the data when using only a few wavelengths.
93
Flow-Injection Analysis of the Platinum-Group Metals
Figure 3.5 Processed standard spectra vzew in ReduceTEK, operating under
Windows ™, showing spectral data acquired and processed between 368 and 668 nm for
Pd(II) standards (10 to 100 J.tg.cm-3). The various components of the display screen have
been annotated (viz. menu, button bar, program icons).
94
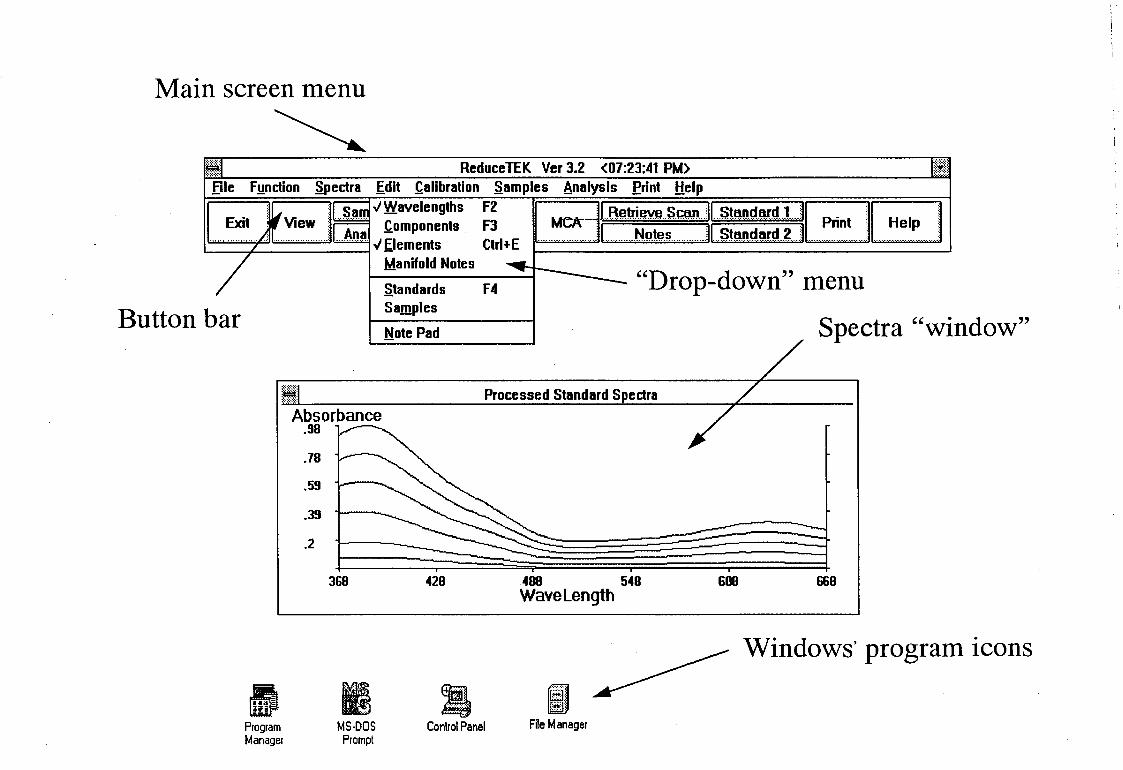
Main screen menu
Button
~ E:J ReduceTEK Ver 3.2 <07:23:41 PM> !Ifill file Fynction fulectra fdit .C,alibration
r--- ../Wavelengths :(View ~ Exit .C,omponents
................. ../: ~ / ../flements
/ Manifold Notes
5,tandards
bar Samples
Note Pad
~1i Absorbance
.98
.78
.59
.39
.2
368 428
.Samples Analysis Erint Help F2 8 .. !\!!!Ii!N!! .. sCM.II ... st"".~w .. l ... !BB F3 I. ........... N.9t~.~ ............. JI. .. s.t~.~.~.~r.~ .. ~ .... l .......... ~.~ ........ : .......... ~ .. ~ ....... Ctri+E
~ "Drop-down" menu F4
" Spectra "w:
Processed Standard Spectra
488 548 600 668 Wavelength
ndow"
~ Windows· program icons
.l!t ~
Program Manager • MS-DOS
Prompt • I . Control Panel File Manager
Flow-Injection Analysis of the Platinum-Group Metals
Figure 3.6 Typical multi-linear regression analysis (MLRA) screen view as depicted
during data processing of platinum-palladium mixtures in ReduceTEK 3.2. Each window is
interlinked and any change in one automatically updates the others.
95
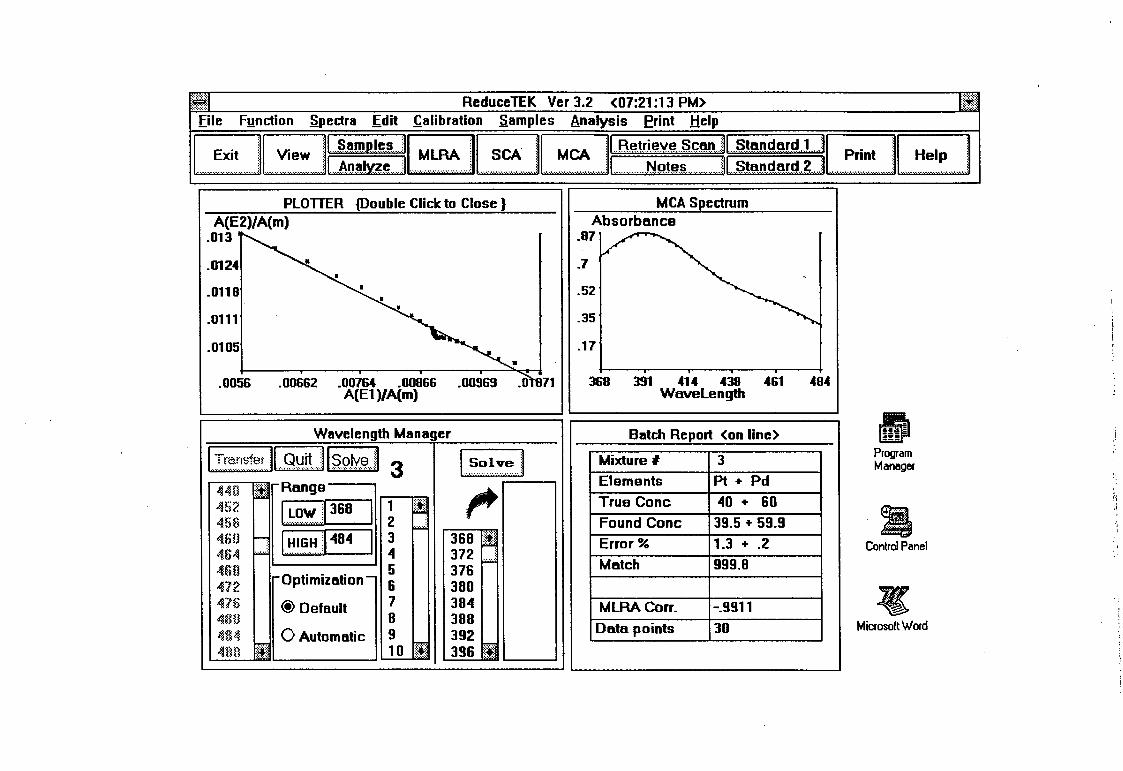
~I ReduceTEK Ver 3.2 <07:21 :13 PM> t:+J Eile Fynction ,S.pectra .Edit ~alibration .S.amples Analysis Erint Help
BEJL~~roel~~~~ MLRA II seA II MCA ~~~.!.!i!'V~ ggmj[§W,mf«~!!lJ IBB ......... ~.~~ ..... : I .... Ao~l~i!:~ ..... ~l ....................... .: ....................... : ........................ : I ............. NQl~.~ ............ JI...s.J.,J.td . .,rd .. ~ .... J .......... ~~.~ .................... ~ .. -~ ....... :
PLOTTER {Double Click to Close } MCA Spectrum A(E2)/A(m) Absorbance
.013 .87
. 0124 • .7 • -
.0118 I .52 • •
.0111 .35
.0105 .17 •
.0056 .00662 .00764 .00866 .00969 . O't871 368 391 414 438 461 484 A(E1)/A(m) Wavelength
Wavelength Manager Batch Report <on line> dl . I : rcmsfer II Quit ill solve ll
1 ... ~(;)-~-~.~-..il Mixture# 3 Program ...................................... , ..... ................. ,: 3 Manager
Elements Pt + Pd 44fl it Range
~ [ .. ~.~~ .. :1368 I I True Cone 40 + so 45?. 1 • 456 2 Found Cone 39.5 + 59.9
1 .. "..~-~.~ .. :1484 I 3 =:.;;
460 f---: 368 t!J, Error% 1.3 + .2 Control Panel ·164 r=i 4 372 """"'' Match 999.8 460 5 376 472 r Optimization- 6 380
'« 476 ®Default 7 384 MLRA Corr. -.9911 480 8 388
Data points 30 Microsoft Word ·184 0 Automatic 9 392 4tln ¥ 10 ~ 396 ~ ...
i·i .i
Flow-Injection Analysis of the Platinum-Group Metals
3.2.4 Data Storage
All data files generated by FlowTEKTM and ReduceTEK are stored in the ASCII· format.
Although the ASCII data files use more hard disk space than other methods of encoded or
compressed storage, the requirement of facilitating data transfer to statistical packages,
spreadsheets, and editors was important. Typical file extensions and file contents for
ReduceTEK are tabulated in Table 3.2.
In FlowTEKTM' the peak parameters (height, area, width, time, and concentration)
together with the date and time of the measurement, and the profile names are stored in one
data file called the "Reducc:d Data" file. The profile file contains the actual data points that
describe the FIA response profile. The data is stored as the original raw data from the analog
to-digital converter.
In this work, data was either collected at four wavelengths using the four output
channels of the Spectra FOCUS TM detector and the reduced data files were imported by
ReduceTEK for data processing, or data was collected over the full absorption spectra
(368 nm to 668 nm) and then "played-back" from the detector memory to FlowTEKTM. The
profile files were then accessed by ReduceTEK for analysis.
• ASCII = American Standard Code for Information Interchange
96
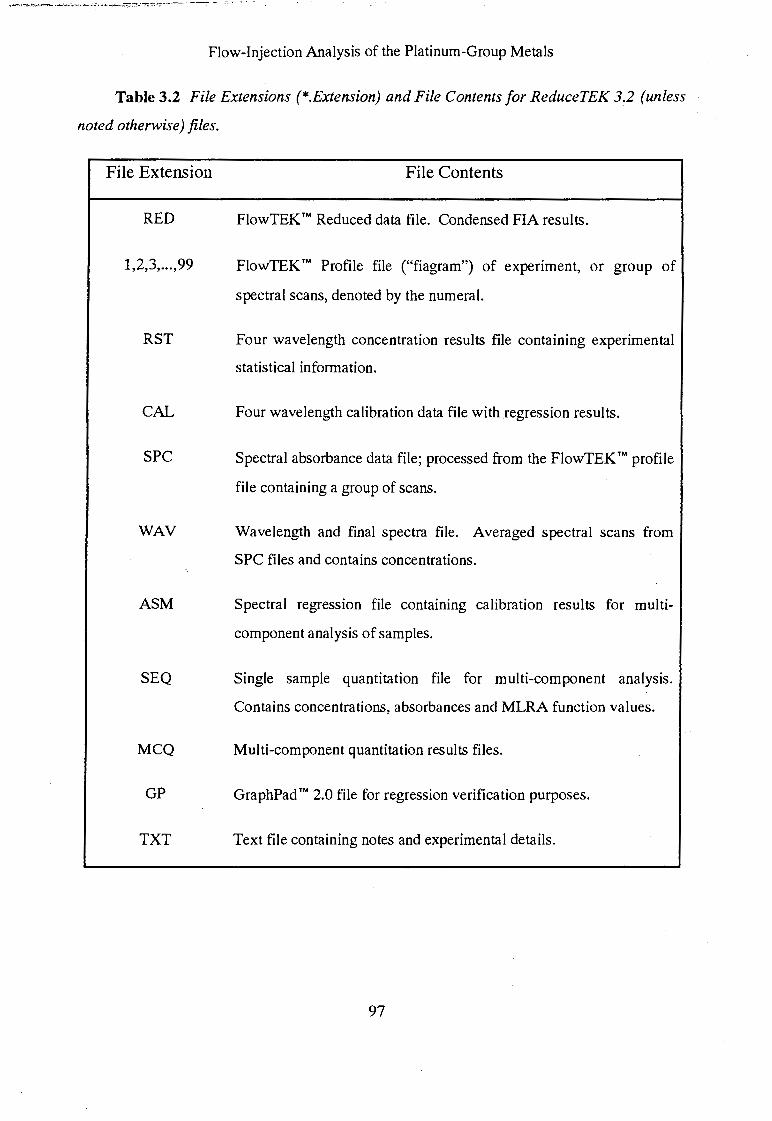
Flow-Injection Analysis of the Platinum-Group Metals
Table 3.2 File Extensions (*.Extension) and File Contents for ReduceTEK 3.2 (unless
noted otherwise) files.
File Extension File Contents
RED FlowTEKT"' Reduced data file. Condensed FIA results.
1,2,3, ... ,99 FlowTEK™ Profile file ("fiagram") of experiment, or group of
spectral scans, denoted by the numeral.
RST Four wavelength concentration results file containing experimental
statistical information.
CAL Four wavelength calibration data file with regression results.
SPC Spectral absorbance data file; processed from the FlowTEK™ profile
file containing a group of scans.
WAY Wavelength and final spectra file. Averaged spectral scans from
SPC files and contains concentrations.
ASM Spectral regression file containing calibration results for multi
component analysis of samples.
SEQ Single sample quantitation file for multi-component analysis.
MCQ
GP
TXT
Contains concentrations, absorbances and MLRA function values.
Multi-component quantitation results files.
GraphPad™ 2.0 file for regression verification purposes.
Text file containing notes and experimental details.
97

Flow-Injection Analysis of the Platinum-Group Metals
3.2.5 Software Performance and Validation
The OS/2 2.0 operating system enables the ReduceTEK software program to operate in
a Win-OS/2 shell. The program is also fully compatible with the more familiar and popular
Windows ™ environment.
The program was specifically written for the Spectra FOCUSTM detector and FlowTEKTM
package, but the Windows TM -based manipulation of the data may be applied to any multi
channel detector where the data is acquired with FlowTEKrM. Data may also be manually
entered via an editor, in the FlowTEKTM data format, and processed as before by ReduceTEK.
All mathematical algorithms and program modules were tested with simulated data.
Manual computations were also performed where applicable. No deviation in either validation
approach was found. Statistical programs, such as GraphPADTM 2.0, were also employed to
verify the statistical functions. After any code alterations or additions, the mathematical tests
were again performed to ensure reliability and confidence in the results.
The program print options are compatible with printers like the dot matrix Epson LX-
400 and the Hewlett Packard LaserJet IIIP. Ideally, a mouse or pointing device should be
used, although complete keyboard operation was built into the program.
3.3 Experimental Procedure
The experimental procedure followed involves a reasonably complex series of steps.
Extensive investigation to find alternative options that could be followed for the particular
detector used in this work proved fruitless. The semi-automatic procedure followed here
allowed adequate investigation into the simultaneous determination of the PGMs by FIA with
spectrophotometric detection.
98
Flow-Injection Analysis of the Platinum-Group Metals
The sequence of steps, from the initial FIA experiments, to the final results obtained from
ReduceTEK using multi-component analysis over a range of wavelengths, are listed.
1. Perform FIA experiments, under FlowTEKTM control, and store the absorption
spectral scans of each sample and standard in the detector memory.
2. "Play-back" the spectra via a FlowTEKTM input channel (up to 25 spectra can be
"played-back" to FlowTEKTM)
3. Store the spectra in a compressed format in FlowTEKTM profile files.
4. Correct spurious data points which result from the imperfect means of acquiring
the data.
5. Enter various parameters required by ReduceTEK, such as the number of spectra,
concentrations, absorbance full scale settings, element names, and number of
components.
6. Store final blank corrected and averaged spectra for a particular standard or
sample, with associated mixture information in a *.WAV file.
7. Quantitation performed by ReduceTEK using one of the quantitation options on
retrieval of the stored standard and sample files.
8. The analytical results are viewed on screen, stored to file, and, if required, printed.
As would be expected, the time per analysis (including data processing) was longer as a
result of the semi-automatic procedure of data handling. The FIA experiments were carried
out in an unattended mode of operation. The detector also collected the spectral scans
automatically. After a maximum of 25 scans had been collected, the data "play-back" to
FlowTEKTM was started. This was fairly rapid as spectra may be "played-back" at an
accelerated rate.
The task of checking and correcting each spectral scan for spurious peaks was by far the
most tedious. A typical check of 20 spectral scans could take over an hour depending on the
number of corrections necessary. In cases where several corrections were required, FIA
experiments and data capture were repeated. The full quantitation and output of results by
ReduceTEK is swift.
99
Flow-Injection Analysis of the Platinum-Group Metals
No doubt the procedure used has limitations, but these are not of a nature that render it
invalid, or mathematically incorrect. The correction of spurious points is undesirable,
however, the "intelligent" software required to handle the variability of spurious peaks is
beyond the scope of this work. The preferred solution to overcome these limitations would be
to use the international standard RS-232 serial-based communication with the
spectrophotometer. This would obviate the analogue recording of the "played-back" data.
Without access to the communication protocol (from the detector suppliers) this route cannot
be utilised. Such possibilities are being investigated.
3.4 Programming Language Remarks
The usefulness of Visual Basic rM as a program development tool was clearly
demonstrated. It facilitates convenient and powerful Windows TM -based programming
capabilities in the research environment. It is an ideal starting point for individuals launching
into Windows TM -based programming - especially from a DOS® programming background (such
as MS-Quick Basic or GW-BASIC). Although minor variations in the code do occur, there is
no need to learn ~completely new programming language, such as Visual C++ TM.
The amount of time spent on designing a complex graphical user-interface is significantly
reduced using Visual Basic rM. At last the burden of creating the visual and highly interactive
environmental framework within which the user writes the necessary source code has been
placed on the applications developers. No longer does an application require half of its code to
be devoted to the user-interface. The programmer's skills, efforts, and time may now be
directed into "building that better mousetrap" within the developing software. Comprehensive
on-line help and a tutorial within the programming language assist the user in the switch from a
typical procedural, or "top-down", program structure, to the event-driven Visual Basic TM
programming style.
100
Flow-Injection Analysis of the Platinum-Group Metals
3.5 Conclusions
The simplicity inherent in FIA was exploited significantly by automation of the manifold
components and data acquisition process. The procedure employed in "down-loading"
absorption spectra from the detector could be improved significantly by serial communications.
Nevertheless, the rudimentary foundation to incorporating multi-channel manipulations of FIA
data as a standard feature in future Computer-aided Flow Analysis software has been placed in
position.
The powerful features of Visual Basic ™ as a Windows TM -based programming
environment for software development was illustrated in the development of the software
program, ReduceTEK. This software provided an efficient and versatile means of handling
multi-channel data, and facilitated rapid processing of results.
The software user has a convenient tool whereby absorption spectra may be manipulated
so as to extract significant amounts of otherwise inaccessible information. The framework of
ReduceTEK, and expertise developed in Visual Basic TM coding, will no doubt facilitate further
development of the software to include other complex chemometric functions. -,
101

··--~--·--- .. ~~------ ....
Flow-Injection Analysis of the Platinum-Group Metals
3.6 References
1. Marshall, G.D., and Van Staden, J.F.,Anal. Instrum., 1992, 20(1), 79.
2. FlowTEK™ Software Package, Council for Mineral Technology, Randburg, Rep. S.
Afr.
3. Microsoft® Visual Basic™ Programmer's Guide, ver. 1.0, 1991.
102
Flow-Injection Analysis of the Platinum-Group Metals
Chapter 4.
Flow-Injection Analysis Manifold Design and
Optimisation
The performance of an analytical instrument depends strongly on the optimisation of
several parameters. Chemical variables (reagent and carrier solution concentration) and
physical variables (flow rates, reaction coil lengths, sample injection volume) of the FIA
manifold must all be optimised, as must the method of detection (wavelength range, number of
replicate scans). Rarely are these parameters independent1 and the purpose of optimisation is
to find the best set of conditions to solve the particular analytical problem within a reasonable
number of experiments.
A more complete characterisation of chemical systems may be obtained by using three
dimensional response surface plots. These highly informative plots assist in the optimisation
and understanding of FIA systems and are a convenient means of visualising multivariate
interactions. "Flow Chemography"2 is the term used to describe such use of graphical
representations of data from flow systems. Widespread use of this representation of data is
anticipated as more information is required from experiments. Visual interpretation of the data
allows the user to obtain insights into the complex chemical reactions occurring within the
manifold, and facilitates selection of optimum experimental conditions.
This chapter details the initial FIA manifold design and configuration made prior to a
thorough optimisation of the FIA manifold for tin(II) chloride methods. The optimisation of
the manifold took into consideration that adequate sensitivity and high precision would be
essential in the simultaneous determination of platinum and palladium. It must be noted that
the optimum conditions for individual components are not necessarily optimum for an analysis
of mixtures.
103
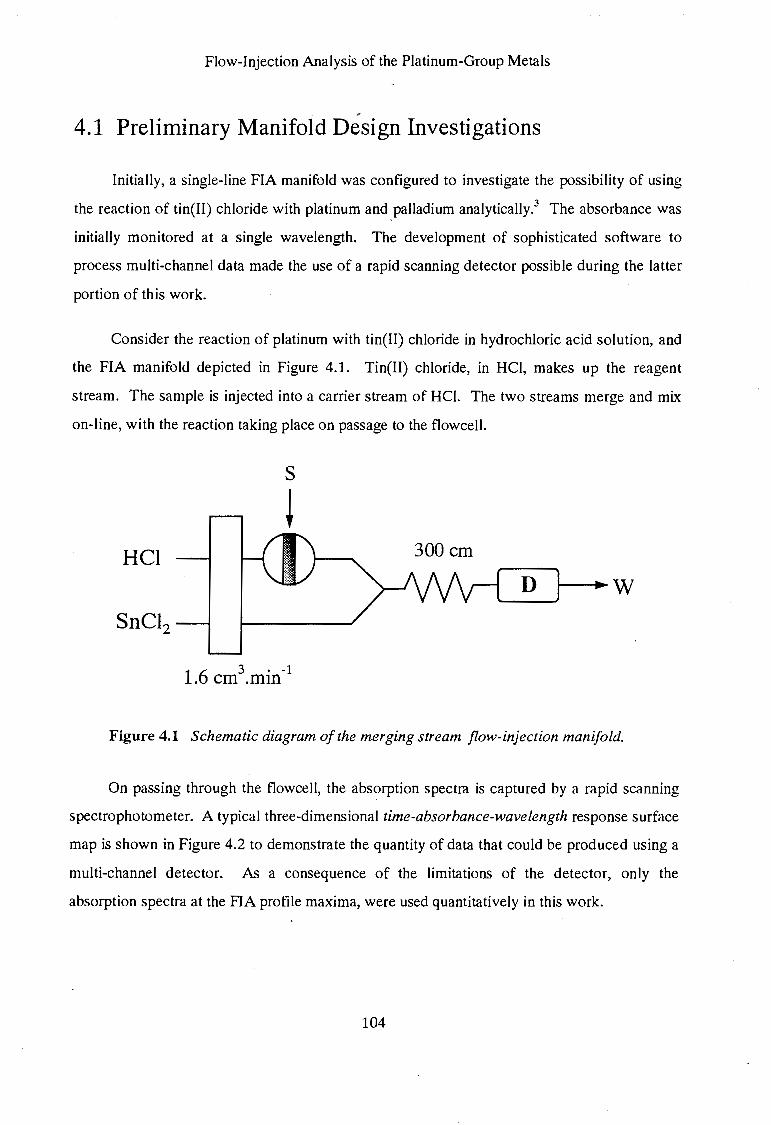
Flow-Injection Analysis of the Platinum-Group Metals
,.
4.1 Preliminary Manifold Design Investigations
Initially, a single-line FIA manifold was configured to investigate the possibility of using
the reaction of tin(II) chloride with platinum and yalladium analytically.3 The absorbance was
initially monitored at a single wavelength. The development of sophisticated software to
process multi-channel data made the use of a rapid scanning detector possible during the latter
portion of this work.
Consider the reaction of platinum with tin(II) chloride in hydrochloric acid solution, and
the FIA manifold depicted in Figure 4.1. Tin(II) chloride, in HCl, makes up the reagent
stream. The sample is injected into a carrier stream of HCI. The two streams merge and mix
on-line, with the reaction taking place on passage to the flowcell.
HCI 300cm
SnCl2
1 6 3 . -1 . cm.mm
Figure 4.1 Schematic diagram of the merging stream flow-injection manifold.
On passing through the flowcell, the absorption spectra is captured by a rapid scanning
spectrophotometer. A typical three-dimensional time-absorbance-wavelength response surface
map is shown in Figure 4.2 to demonstrate the quantity of data that could be produced using a
multi-channel detector. As a consequence of the limitations of the detector, only the
absorption spectra at the FIA profile maxima, were used quantitatively in this work.
104
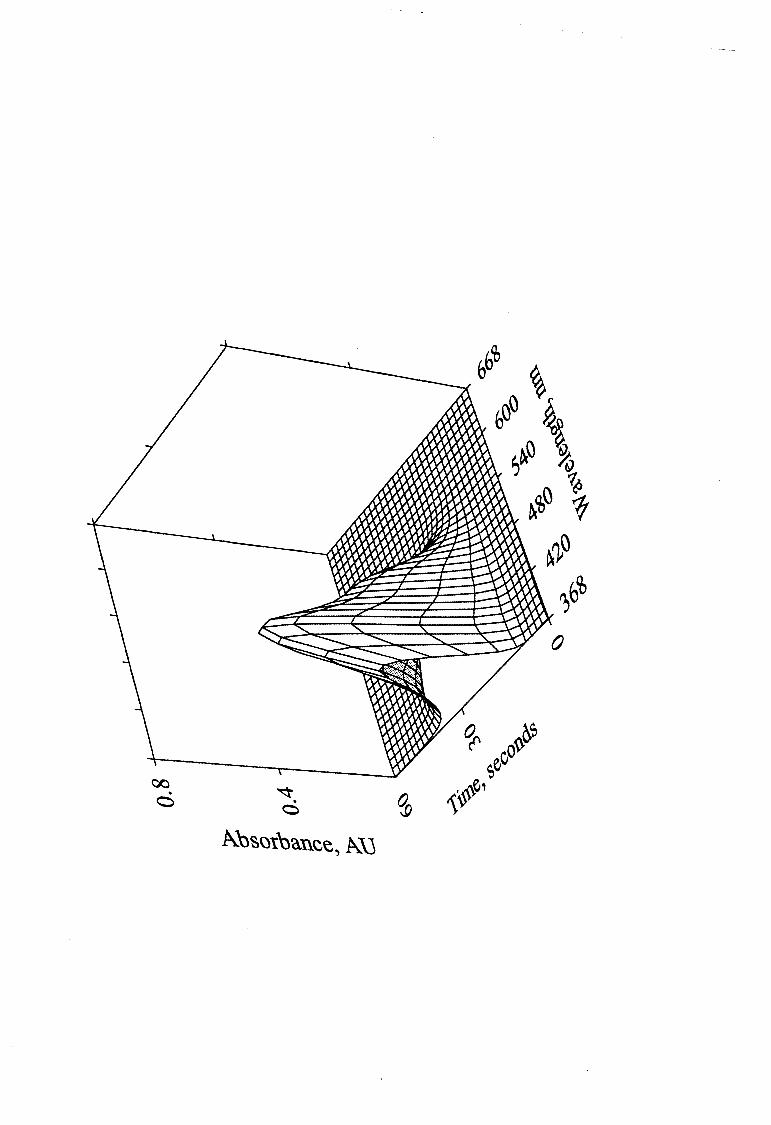
00 . c
Flow-Injection Analysis of the Platinum-Group Metals
Note that intersections on the grids of the response surface maps shown in this, and
subsequent chapters, do not correspond to single data points. In each case, more data points
than grid intersection points were used in the three-dimensional plotting. The grid
intersections were limited for visual purposes and do not affect the overall trends observed.
4.1.1 Spectrophotometer Flowcell
The spectrophotometer flowcell is an important component of a FIA system. The
flowcell produces significant effects that are caused by the finite volume sampled by the light
beam, as well as the disruption of laminar flow conditions in the manifold tubing.4 Selection of
a flowcell should be made after careful consideration of its geometry, optical volume, and the
composition of "wettable" components.
Three flowcells were considered. The first two were standard 10 mm path length Hellma
quartz flowcells with illuminated volumes of 30 ~L and 70 ~L respectively. They were
mounted in a flowcell housing accessory. Excessive dispersion of the sample zone was found
on passage through these relatively large diameter flowcells. Stray light could not be excluded
from the flowcell housing and these flowcells also tended to shift slightly in their housing with
time. Any bubbles that were accidentally introduced into the system lodged in comers of these
cells. All of the above-mentioned effects contributed to an increased baseline noise. These
cells were not used in this work.
The third flowcell was a biocompatible flowcell shipped with the Spectra FOCUS TM
detector. All "wettable" parts were made of Kel-FTM and the flowcell had sapphire windows.
Although the path length was only 6 mm (illuminated volume of 9 ~L), the added flowcell
stability, lack of any stray light entering due to of its well-sealed housing, and limited additional
dispersion, more than compensated for this shorter path length. The nature of the highly acidic
solutions being used restricted the selection of a flowcell to one which had inert "wettable"
components.
106
Flow-Injection Analysis of the Platinum-Group Metals
4.1.2 Manifold Configuration
A further consideration with regard to the FIA system was the actual manifold
configuration. Two configurations were considered - a single stream manifold, and a two
stream manifold where the streams merge prior to the detector. Two factors were considered
in the configuration selection, viz. the magnitude of the analytical signal and the magnitude of
the baseline noise. Both significantly affect the detection limit and are normally maximised and
minimised respectively.
The immediate apparent advantage of using a single stream system over a merging
stream system is the lack of further dilution at the confluence point. This consideration would
appear to indicate a higher expected sensitivity· for the single stream system. However,
sensitivity is not the only design criterion. A good signal-to-noise ratio is also important.
The blank and sample response could not be distinguished in the single-line manifold
when injecting samples of low concentrations of platinum ( < 0.1 !-lg.cm.3). Both showed
similar, although small, responses. This problem arises due to the Schlieren effect caused by
mixing of solutions with different refractive indices.5 Mixing occurs along the full length of the
sample zone in the case of a merging stream manifold, and the refractive index effect is
virtually eliminated. The blank response is not distinguishable from the baseline in the merging
stream manifold. Considerable improvement in the lower limit of determination was obtained
for platinum.
4.1.3 Ultra-Violet Spectrophotometric Detection
The sensitivity of the platinum-tin(Il) chloride reaction can, in principle, be improved 2
to 4 times by monitoring the absorbance at a wavelength of 310 nm6• However, background
interference precludes the use of this wavelength. Furthermore, the detector used could not
simultaneously scan the visible and ultra-violet range of the absorption spectra. Consequently,
attention was focused only on the visible regions of the absorption spectra.
Sensitivity refers to the response of the analytical signal per unit concentration.
107
Flow-Injection Analysis of the Platinum-Group Metals
4.1.4 Peak Height or Peak Area Measurement?
Another factor considered in the preliminary investigations for this work was the use of
peak height and peak area measurements. In a FIA system, both the peak height and peak area
are proportional to the analyte concentration/ hence either can be used for quantitative
analysis. Ideally, a linear regression of the peak height versus peak area for the calibration
standard set should have a unit correlation coefficient and zero intercept. This would indicate
conformity of the transient peak profile across the calibration concentration range and that
unexplained chemistries, causing deviations of the profile, were not the cause of any spurious
peak height deviations. This was verified at several wavelengths across the absorption spectra
for each analyte in a mixture. Linearity within the range of the calibration standards solutions
was found in each case.
Besides the profile conformity verification, peak height measurements were employed
throughout. The Spectra FOCUS™ detector, having limited memory and storage facilities,
was unable to collect absorbance spectra satisfactorily across the entire flow-injection peak
profile to enable peak area integration.
4.1.5 Spectra FOCUS™ Data Acquisition
The Spectra FOCUS TM detector has a mechanism to recognise the peak maximum (by the
change in absorbance with time), and initiates spectral scanning itself. The desired wavelength
range is scanned at a user-selectable rate which is determined by the number of wavelengths,
wavelength intervals, and number of repetitive scans to be averaged. Despite the lower
wavelength ability of the instrument being 360 nm, a lower wavelength of 368 nm was used.
The upper limit of the instrument extends to 800 nm. The palladium-tin(II) chloride system
has an absorbance maximum at 636 nm (Figure 4.3). An upper wavelength limit of 668 nm
was selected to ensure incorporation of this maximum. This enabled a wavelength range of
300 nm to be used in all quantitative work. Some qualitative spectral scans were performed
using a wavelength range extending to 768 nm.
108
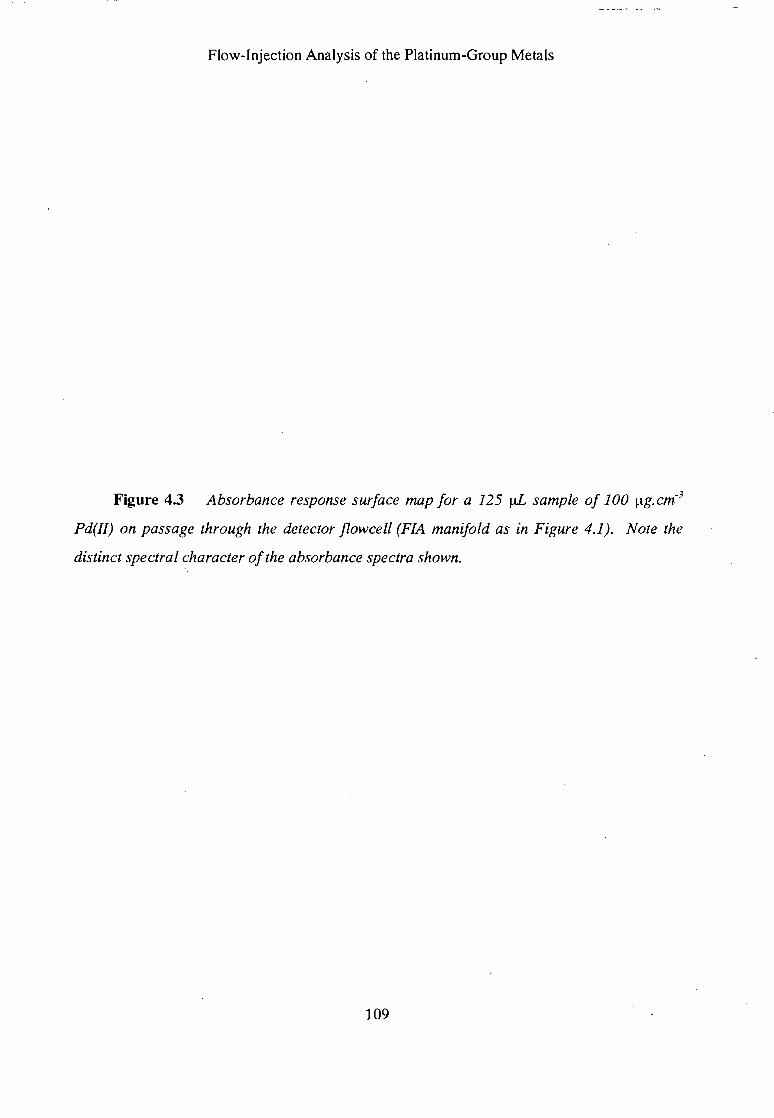
Flow-Injection Analysis of the Platinum-Group Metals
Figure 4.3 Absorbance response surface map for a 125 f.AL sample of 100 ~tg.cm-3
Pd(Il) on passage through the detector flowcell (FIA manifold as in Figure 4.1). Note the
distinct spectral character of the absorbance spectra shown.
109

Flow-Injection Analysis of the Platinum-Group Metals
Absorbance spectra were collected at wavelength intervals between 2 and 10 nm using
single, duplicate, and quadruplicate scans. A spectral scan time for the peak height of more
than a few seconds is not desired as the FIA signal is transient and rapid. The spectral scan
should, ideally, be symmetrically distributed over the FIA profile maximum. Cognisance was
taken of the detector's memory availability in the choice of the number of wavelengths to
include.
A compromise between response, spectral scan time, and the memory limitations resulted
in the use of a duplicate scan (average spectra were stored) at 4 nm intervals (affording 76
points to define the absorbance spectrum). A maximum of 25 spectra could be stored prior to
the required down-loading from the detector. The duration of a typical single spectral scan
was 0.95 seconds.
4.2 Optimisation of the FIA Manifold
The univariate method7 of optimisation requires parameters to be independent. This
method can produce sub-optimum settings if variables are dependant on one another.
Furthermore, a la.rge number of experiments are required because each parameter is optimised
in a univariant fashion. However, if these interactions are not significant, the univariant
approach functions well. 1
A more efficient optimisation strategy is the simplex optimisation method. This method
was first proposed by Spendley,8 later modified by Neider and Mead,9 and has numerous
variations.10 Simplex optimisation involves an experimental re-adjustment of all the variable
parameters toward an optimal configuration. Subsequent experimental conditions are
suggested by the optimisation algorithm based on the previous experiment results. 11 The
simplex method is widely used and the number of experiments required for optimisation is
considerably less for complicated multi-variable systems. The chance of attaining sub-optimum ' settings is greatly reduced because this approach operates on a response surface, and therefore
accommodates dependant variables.
An iterative univariate method of optimisation was used in this work. Once an optimum
was found, or more often, a setting that enabled solution of the analytical problem, the
110
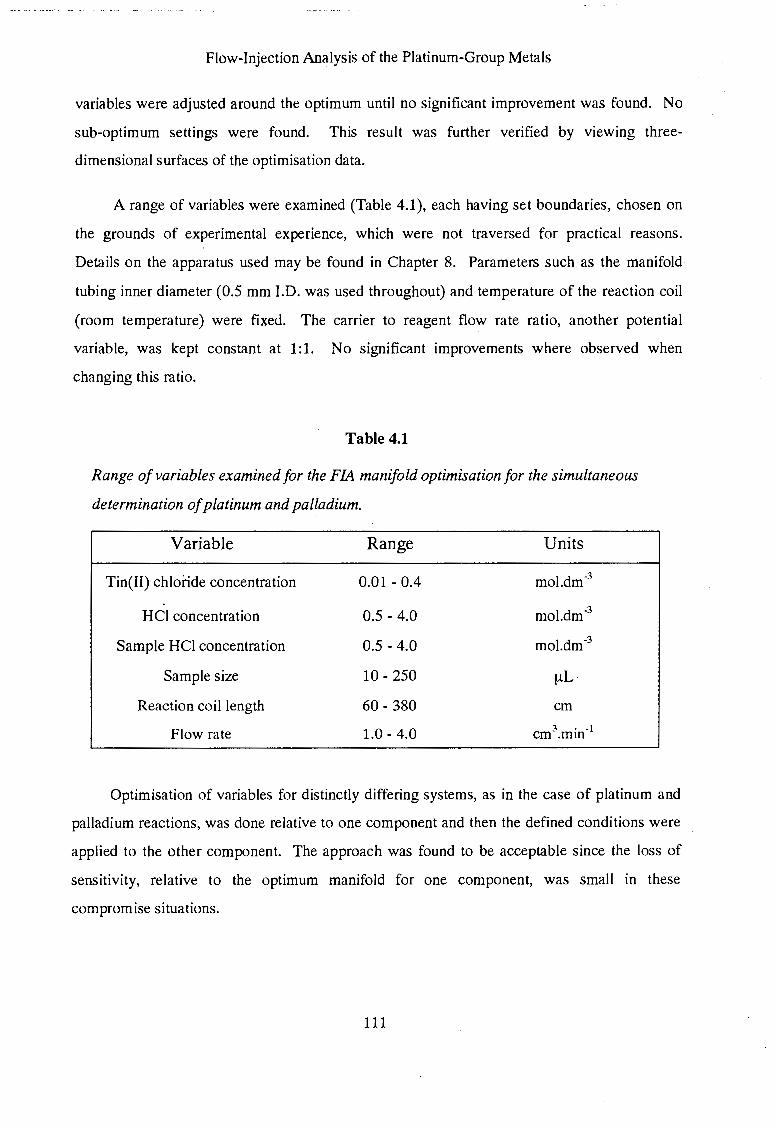
Flow-Injection Analysis of the Platinum-Group Metals
variables were adjusted around the optimum until no significant improvement was found. No
sub-optimum settings were found. This result was further verified by viewing three
dimensional surfaces of the optimisation data.
A range of variables were examined (Table 4.1), each having set boundaries, chosen on
the grounds of experimental experience, which were not traversed for practical reasons.
Details on the apparatus used may be found in Chapter 8. Parameters such as the manifold
tubing inner diameter (0.5 mm I.D. was used throughout) and temperature of the reaction coil
(room temperature) were fixed. The carrier to reagent flow rate ratio, another potential
variable, was kept constant at 1:1. No significant improvements where observed when
changing this ratio.
Table 4.1
Range of variables examined for the FIA manifold optimisation for the simultaneous
determination of platinum and palladium.
Variable
Tin(II) chloride concentration
HCl concentration
Sample HCl concentration
Sample size
Reaction coil length
Flow rate
Range
0.01 - 0.4
0.5- 4.0
0.5- 4.0
10- 250
60- 380
1.0- 4.0
Units
mol.dm-3
mol.dm-3
mol.dm-3
f.lL
Optimisation of variables for distinctly differing systems, as in the case of platinum and
palladium reactions, was done relative to one component and then the defined conditions were
applied to the other component. The approach was found to be acceptable since the loss of
sensitivity, relative to the optimum manifold for one component, was small in these
compromise situations.
111
Flow-Injection Analysis of the Platinum-Group Mt:tals
It is necessary to select a response which will indicate the best conditions in order to
optimise the FIA manifold. It· is important that the response chosen is reproducible to
complete a successful optimisation.
The criteria used were based on compromises between several factors, namely,
• maximising the peak height for both the platinum- and palladium-tin(II) chloride
systems,
•
•
•
minimising the relative standard deviations (r.s.d.) of replicate experiments,
maintaining a low peak width to yield higher sample throughput, and,
maximising the signal-to-noise ratio (SIN) to maintain high levels of accuracy at the
lower concentrations investigated.
4.2.1 Sample Injection Volume
The sample volume has a considerable effect on the response. The desired sample
volume should enable high sample throughput (sampling rate), a negligible carry-over, and
provide high reproducibility and sensitivity.
Absorbance changes recorded at increasing volumes of a fixed concentration of Pt(IV)
are shown in Figure 4.4. The FIA profiles shown were recorded using a reaction coil length of
180 em, tin(II) chloride concentration of 0.1 M, and flow rate of 1.8 cm3.min-1• The sample
volume was controlled by the duration that the valve was in the "inject" position. The exact
volume dispensed was titrimetrically calibrated at the chosen flow rate (Chapter 8). Aside
from the effect on absorbance, very similar response trends were found for palladium, as well
as when different tin(II) chloride concentrations, reaction coil lengths, and flow rates were
used.
Peak height and peak width both increased with increasing sample size until a plateau
formed at volumes greater than 200 f.A.L. The r.s.d. of quadruplicate injections at each volume
was better than 0.7% except at the lower volume extremes ( < 50 f.A.L) where the r.s.d.
increased to over 1%.
112
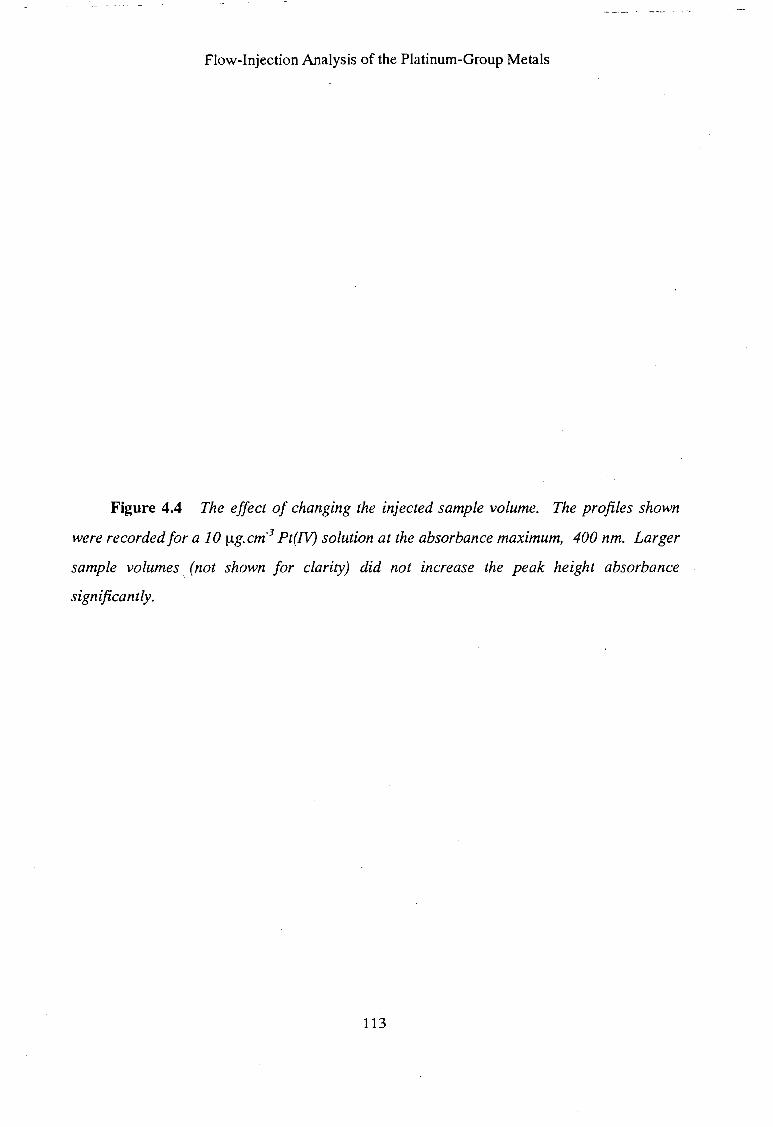
Flow-Injection Analysis of the Platinum-Group Metals
Figure 4.4 The effect of changing the injected sample volume. The profiles shown
were recorded for a 10 f.!g.cm·3 Pt(IV) solution at the absorbance maximum, 400 nm. Larger
sample volumes_ (not shown for clarity) did not increase the peak height absorbance
significantly.
113

00 0 . 0
..q-0 . 0
0
0 0 C"l
0 V) ~
0 0 ~
0 V)
~ :::s_
..., 0)
s ~ ~
0 > 0) ~
~ s ro rJJ
Flow-Injection Analysis of the Platinum-Group Metals
Peak widths broaden with increased sample volume and decreased the sample throughput
as a result of increased tailing of the FIA peaks. Adequate sensitivity was found with a sample
volume of 125 !!Land tailing of the peak was kept to a minimum. The sample throughput of a
FIA system is generally described by the number of samples per hour. 12 The sample
throughput in this work was of the order of 54 hour-1•
Two phenomena that affect the response take place en route to the detector - a chemical
reaction and physical dispersion. The latter will decrease the signal with increasing coil length
whereas the effect of the former depends on the nature of reaction and complexes forming or
disappearing.7 A combination of the two effects gives the final response recorded. In order to
verify this, the effect of physical dispersion can be removed by stopping the sample within the
flowcell. The chemical reaction is then monitored over time. The response over the whole
spectra remained constant on reaction of platinum with tin(II) chloride, but several complex
reactions take place on the reaction of palladium with tin(II) chloride. These effects will be
elaborated upon later.
4.2.2 Reaction Coil Length
The effect of the reaction coil length is seen in Figure 4.5. An increase in reaction coil
length resulted in a decrease in peak height absorbance in the case of palladium at 400 nm. In
contrast, the response for platinum showed a slight increase in the peak height absorbance at
this wavelength before decreasing as the effect of dispersion became a more dominant factor
than the reaction kinetics.
A residence time which was long enough for the palladium reaction to pass through a
series of colour changes to the relatively stable dark green colour (f... = 636 nm) is required.
This residence time can be conveniently controlled by variation of the reaction coil length. The
complexes giving rise to this colour provide the best compromise between spectral character
and sensitivity.
114
Flow-Injection Analysis of the Platinum-Group Metals
Figure 4.5 The effect of the reaction coil length, using a reagent concentration of
0.05 M tin(II) chloride, on the response of: A, 20 ~g.cm·3 Pd(/1) at A= 400 nm,
B, 10 ~g.cm·3 Pt(IV) at A= 400nm, and
C, 20 ~g.cm·3 Pd(/1) at A= 635 nm.
115
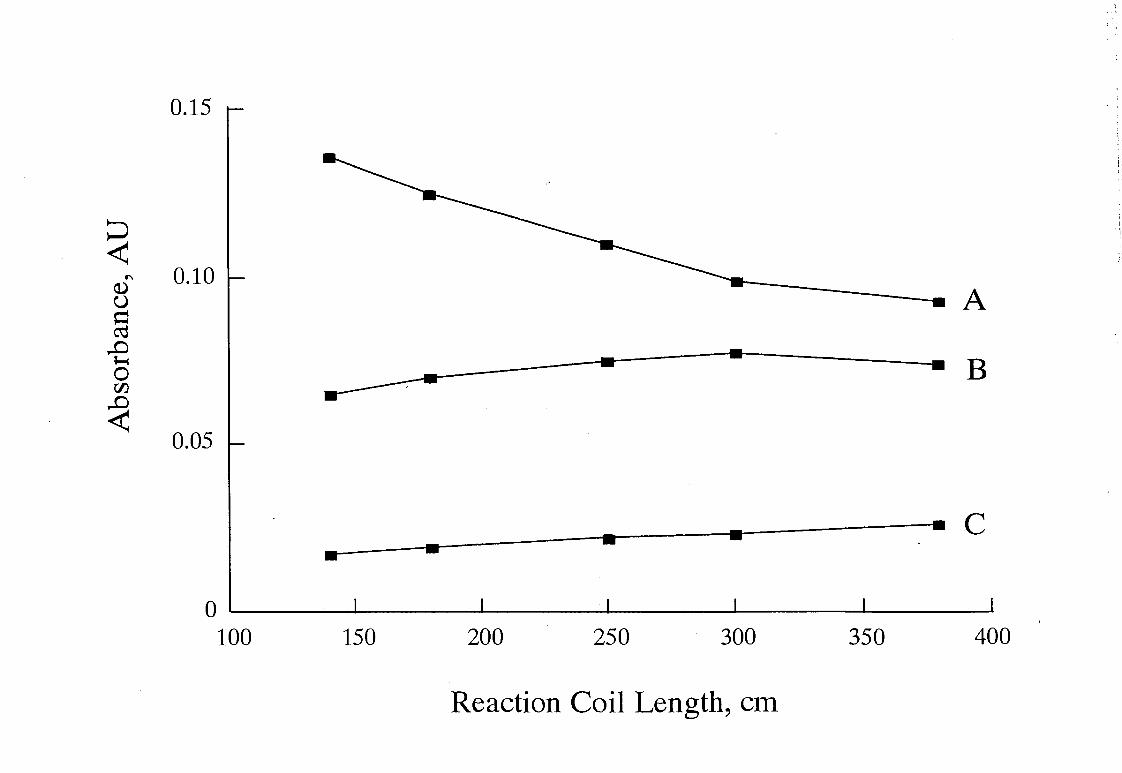
~ ~
<1.) u Q cd
.-e 0 rJJ
<
0.15
0.10 A
~ • • • B
0.05
• • c . . -• 0 ~----~------~------~------~------~----~ 100 150 200 250 300 350 400
Reaction Coil Length, em
., ..
; I I
Flow-Injection Analysis of the Platinum-Group Metals
The length of the reaction coil was varied between 60 and 400 em during the
optimisation. Longer coil lengths only had the effect of decreasing the response as a result of
physical dispersion effects. The shortest coil length used was limited to 60 em as spikes
generated when the valve was switched pneumatically resulted in a small spurious signal being
generated. A reaction coil length of 60 em was sufficient to separate the true FIA response
from the spurious signal. Data acquisition was only commenced a few seconds later to ensure
that the effect of the valve switching had subsided. It was found that reaction coils shorter
than 100 em gave irreproducible results. This was particularly true in the case of palladium.
This is accounted for in that the complexes forming were unstable and still undergoing
significant change. This would result in considerable variation in the absorption spectrum.
A reaction coil length of 300 em was chosen for the platinum-palladium system. This
length provided a measurable response for both elements, low r.s.d. of replicate injections, and
sufficient time for the palladium reaction to proceed satisfactorily.
4.2.3 Reagent and Carrier Flow Rate
The effect of the flow rate, shown in Figure 4.6 and Figure 4. 7, was two-fold. In the
absence of a chemical reaction, an increased flow rate will tend to decrease the signal 13 due to
dispersion. In the presence of a chemical reaction, the flow rate will affect the time that the
reaction has to take place prior to detection. High flow rates will result in low sample
residence times and, if a colour is still developing as detection takes place, will reduce the
effective response.
A flow rate of 1.6 cm3.min-1 was selected as an optimum for subsequent analytical use.
This resulted in low pulsing effects, a low r.s.d. for replicate injections, and provided sufficient
time for the palladium reaction to proceed satisfactorily. The response for platinum was
comparable to that found when lower flow rates were used. However, lower flow rates
showed poor repeatability and were therefore unsuitable.
116
Flow-Injection Analysis of the Platinum-Group Metals
Figure 4.6 Absorbance response surface map showing the effect of flow rate on peaks
for a 10 ~g.cm-3 Pt(IV) sample. The plot is composed of 8 peaks, observed at 400 nm, using
different flow rates. There are 400 data points across each peak. \
117
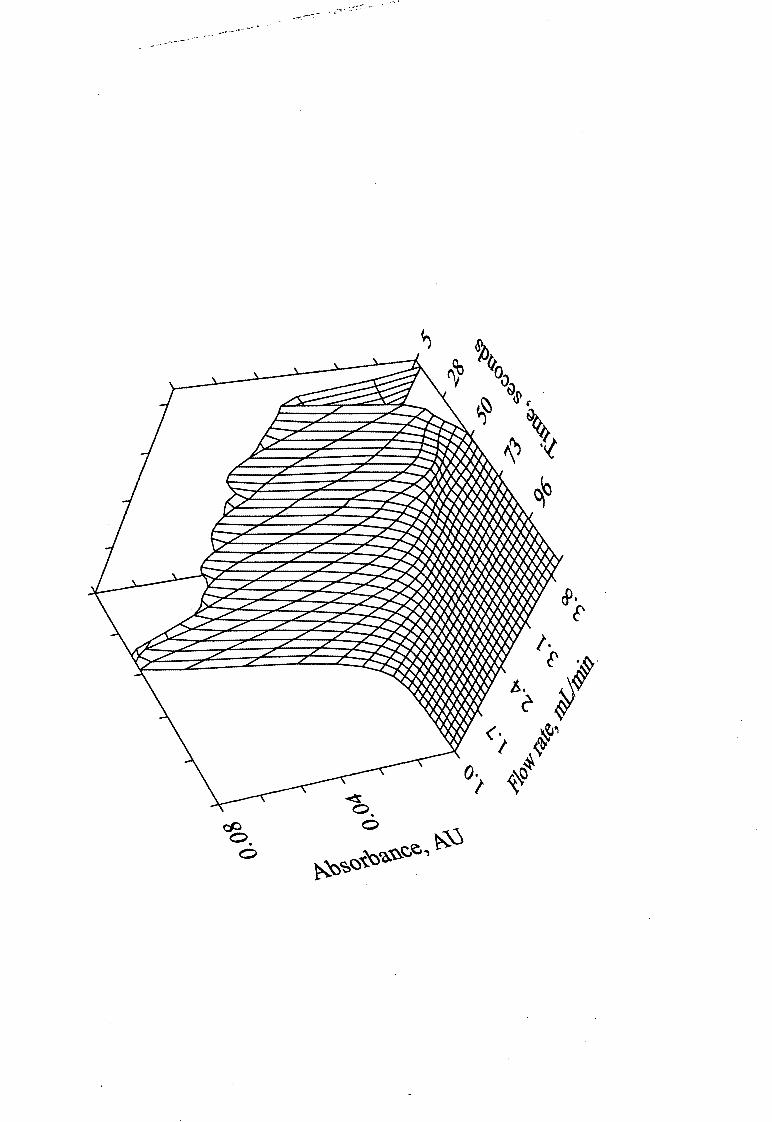
--------
<!t o.
0
>fs:>'i:l;c,{o~r:j:,' ~
. ~- .-. . . ~-,.. .
1 1 1 1 1 1 1 1 1 1 1 1 1 1 1 1 1 1 1 1 1 1 1 1 1 1 1 1 1 1 1 1 1 1 1 1 1 1 1 1 1 1 1 1 1 1 1 1 1 1 1 1 1 1 1 1 1 1 1 1 1 1 1 1 1 1 1 1 1 1 1 1 1 1 1
Flow-Injection Analysis of the Platinum-Group Metals
Figure 4.7 Contour plot of Figure 4.6 showing the effect of flow rate on peaks for a
10 ~g;cm·3 Pt(N) sample. The change of the peak width with changing flow rate is clearly
seen in the contour plot. -.
118
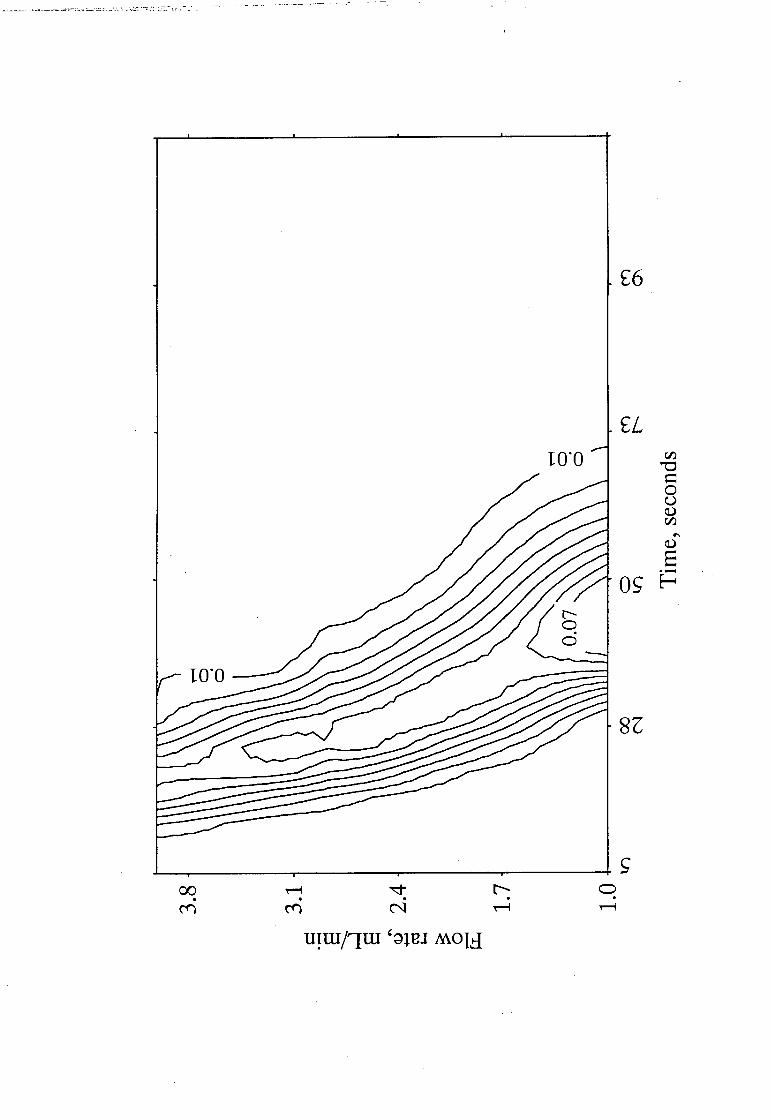
£6
£L tZl
'"0 c 0 u ~ tZl
.... ~
a ·-0~ ~
8Z
00 0 . .
U!UitJUI '~n1u M.O{d
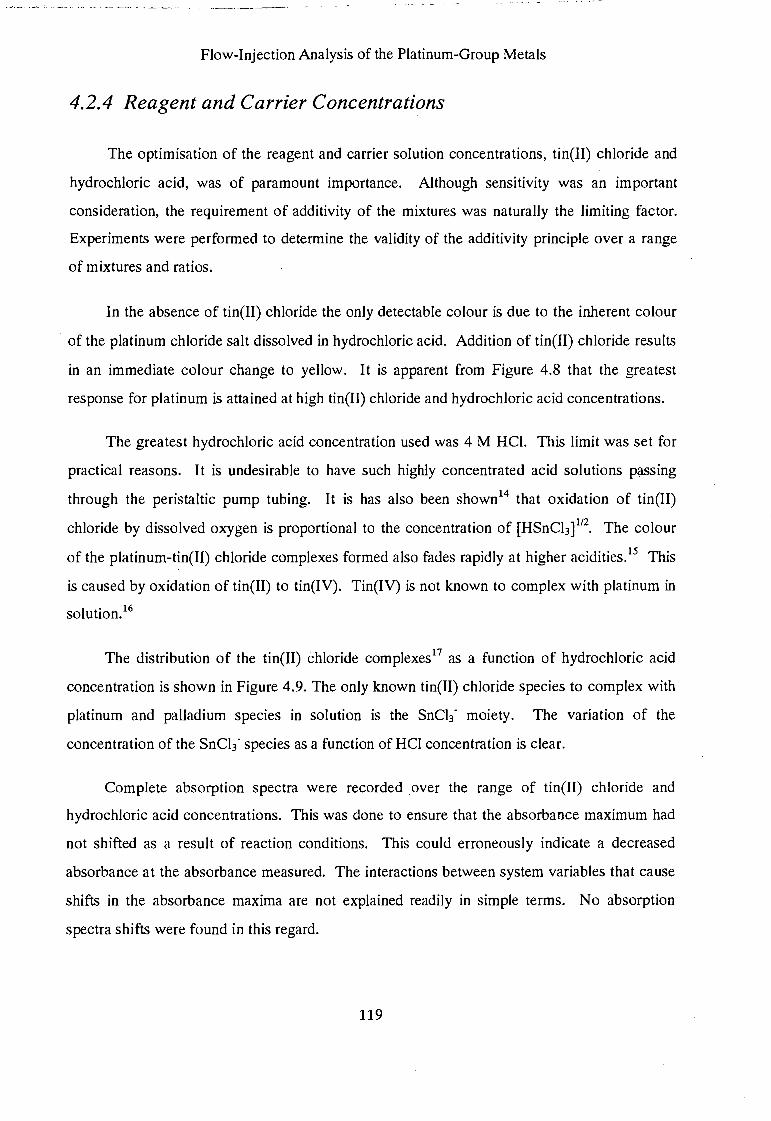
Flow-Injection Analysis of the Platinum-Group Metals
4.2.4 Reagent and Carrier Concentrations
The optimisation of the reagent and carrier solution concentrations, tin(II) chloride and
hydrochloric acid, was of paramount importance. Although sensitivity was an important
consideration, the requirement of additivity of the mixtures was naturally the limiting factor.
Experiments were performed to determine the validity of the additivity principle over a range
of mixtures and ratios.
In the absence of tin(II) chloride the only detectable colour is due to the inherent colour
of the platinum chloride salt dissolved in hydrochloric acid. Addition of tin(II) chloride results
in an immediate colour change to yellow. It is apparent from Figure 4.8 that the greatest
response for platinum is attained at high tin(II) chloride and hydrochloric acid concentrations.
The greatest hydrochloric acid concentration used was 4 M HCI. This limit was set for
practical reasons. It is undesirable to have such highly concentrated acid solutions passing
through the peristaltic pump tubing. It is has also been shown14 that oxidation of tin(II)
chloride by dissolved oxygen is proportional to the concentration of [HSnCh] 112• The colour
of the platinum-tin(II) chloride complexes formed also fades rapidly at higher acidities.15 This
is caused by oxidation of tin(II) to tin(IV). Tin(IV) is not known to complex with platinum in
solution.16
The distribution of the tin(II) chloride complexes17 as a function of hydrochloric acid
concentration is shown in Figure 4.9. The only known tin(II) chloride species to complex with
platinum and palladium species in solution is the SnCh- moiety. The variation of the
concentration of the SnCh- species as a function of HCI concentration is clear.
Complete absorption spectra were recorded over the range of tin(Il) chloride and
hydrochloric acid concentrations. This was done to ensure that the absorbance maximum had
not shifted as a result of reaction conditions. This could erroneously indicate a decreased
absorbance at the absorbance measured. The interactions between system variables that cause
shifts in the absorbance maxima are not explained readily in simple terms. No absorption
spectra shifts were found in this regard.
119
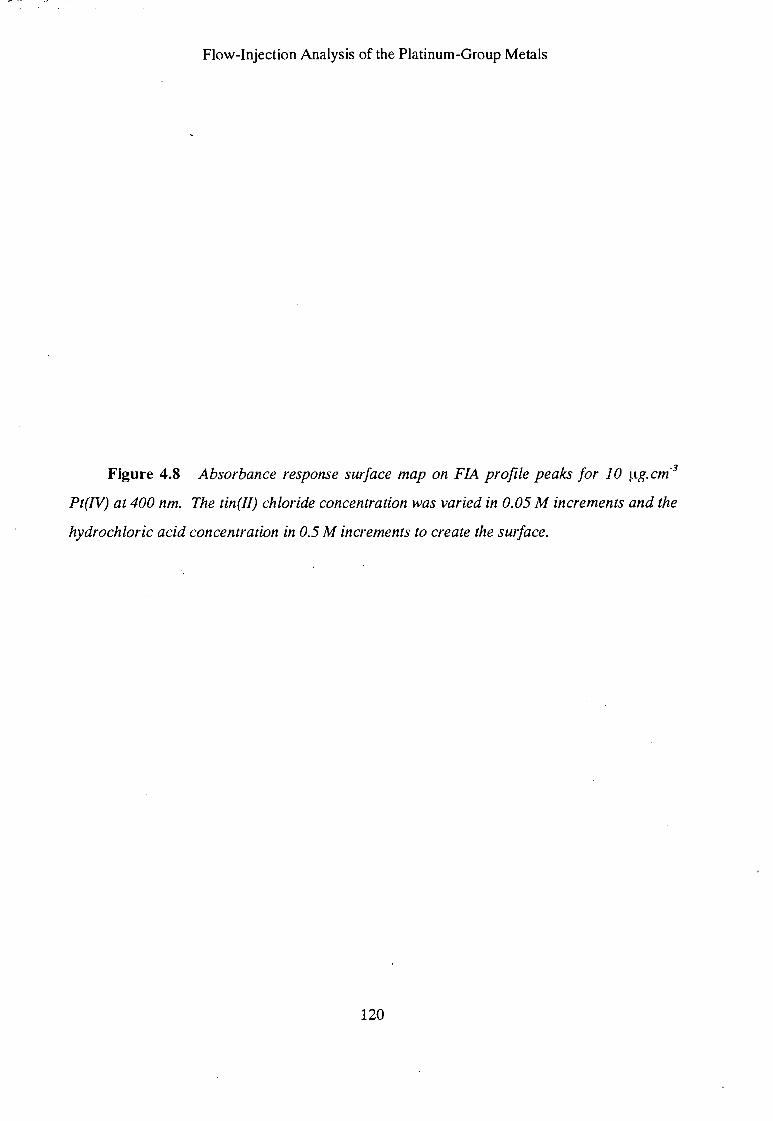
Flow-Injection Analysis of the Platinum-Group Metals
Figure 4.8 Absorbance response surface map on FIA profile peaks for 10 ~tg.cm-3
Pt(JV) at 400 nm. The tin(II) chloride concentration was varied in 0.05 M increments and the
hydrochloric acid concentration in 0.5 M increments to create the surface.
120
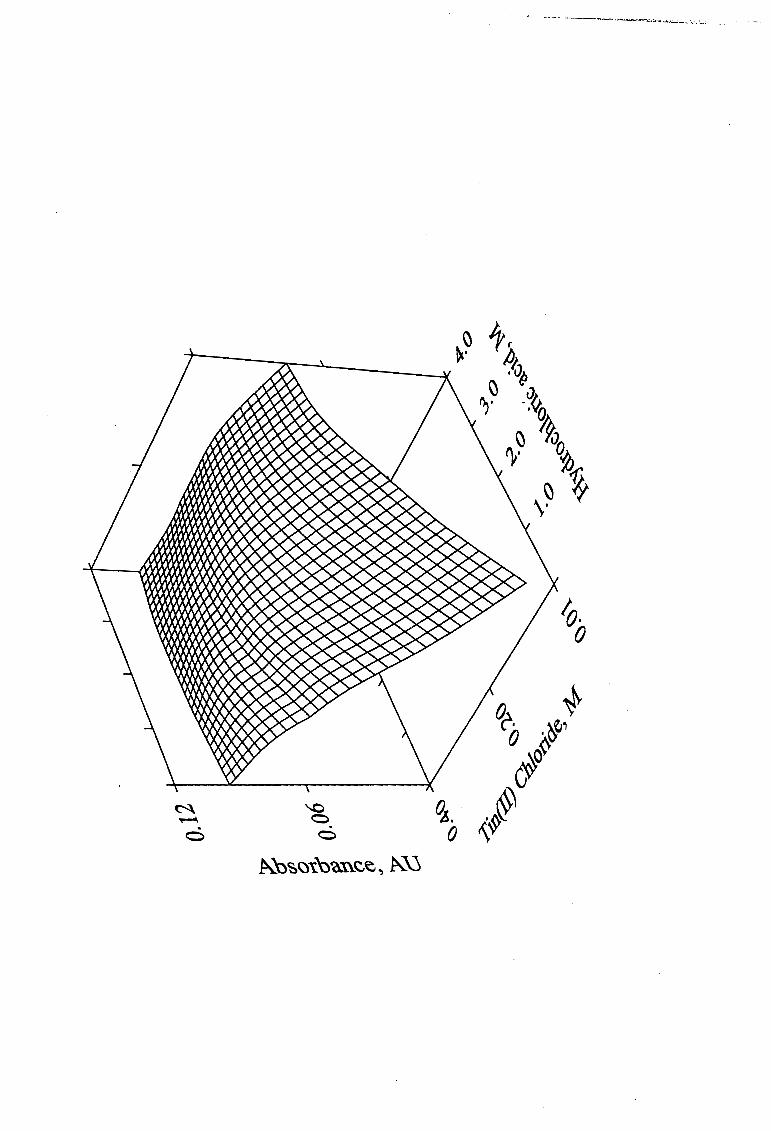
lo. 0
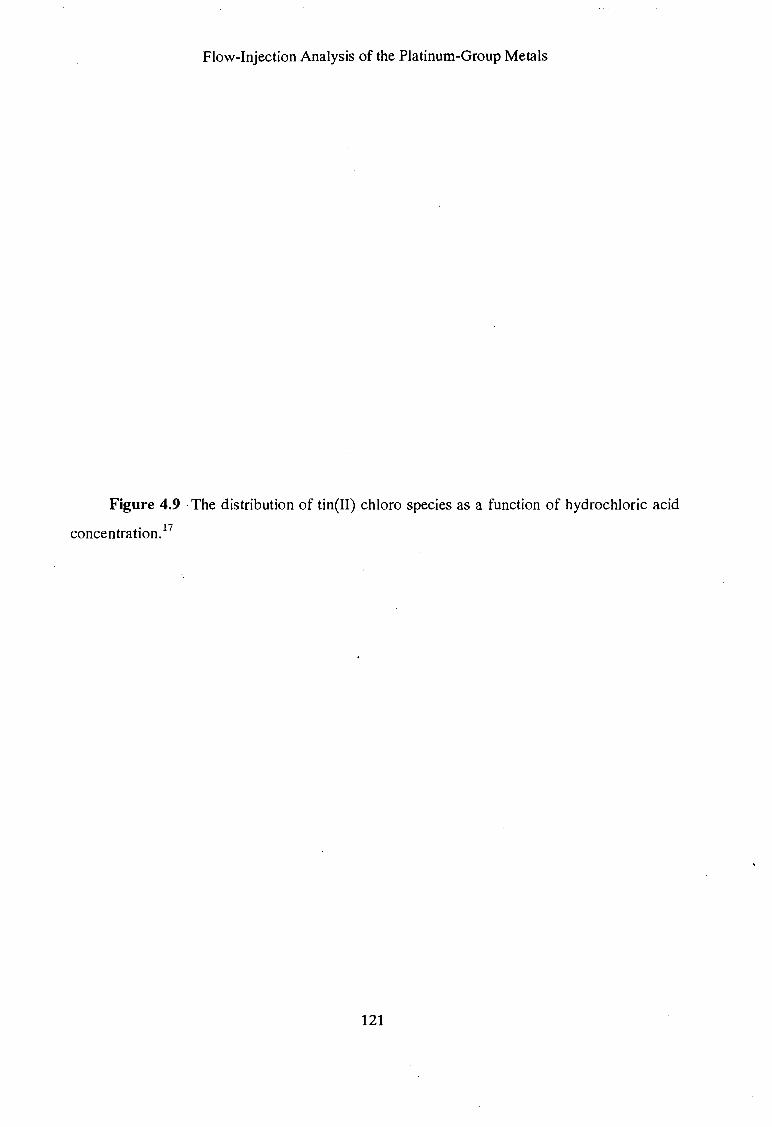
Flow-Injection Analysis of the Platinum-Group Metals
Figure 4.9 ·The distribution of tin(II) chloro species as a function of hydrochloric acid
concentration.17
121
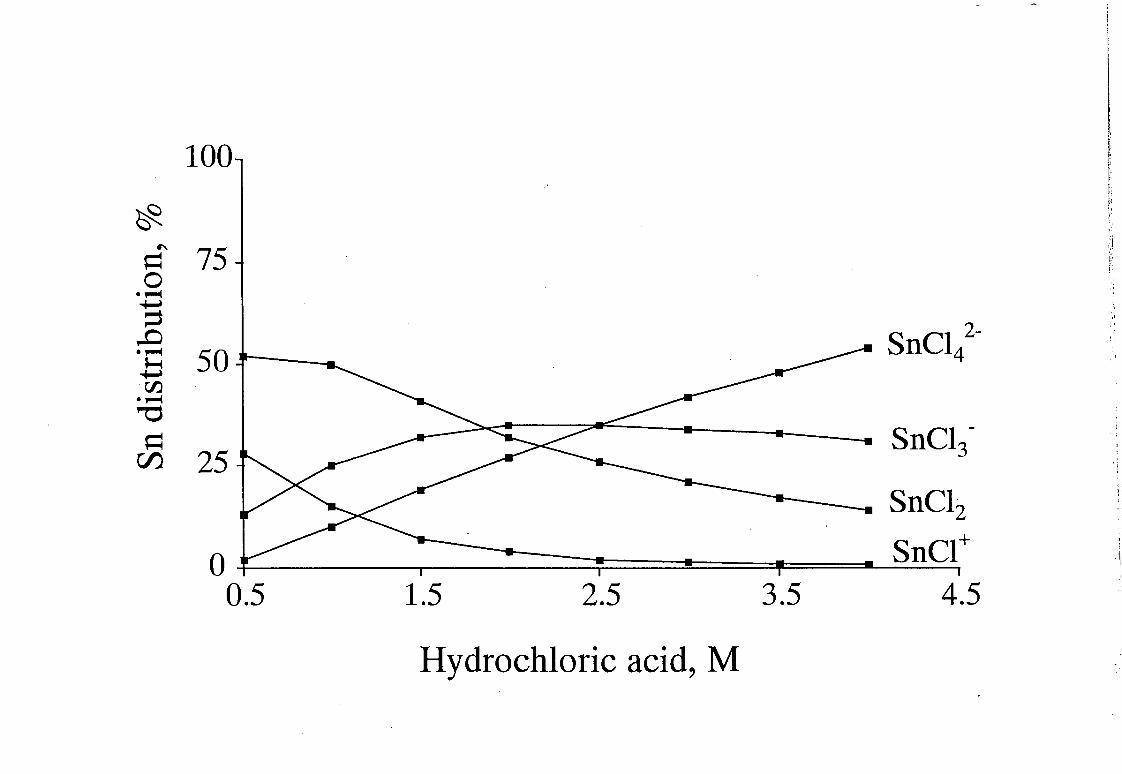
100
~ ~" 75 0 ·~ ~ ::l
..0 . c: 50 _!~:" --~ 00 ·~ '"d ~
rJJ 25
SnC142
-
SnC13-
SnC12
'"' Cl+ I
3.5 4.5 or:::= 0.5 ' ~ • , • :sn I
1.5 2.5
Hydrochloric acid, M
I 'I
~ f, t I: p
pr ~ ~ I
;::
Flow-Injection Analysis of the Platinum-Group Metals
The criterion most commonly used in FIA optimisation is sensitivity, usually as the peak
height. However, a failure to take repeatability into account can have dire consequences.10
Repeatability is quantified here by the percentage relative standard deviation of replicate peak
responses (at least triplicate experiments) across the search space. The areas of intersection
between the lowest r.s.d. and highest sensitivity serve to confirm the best experimental
conditions for the system. The r.s.d. is expected to be higher at lower absorbances due to the
increased signal-to-noise ratio.
It was found that during acquisition of data that monitoring at four wavelengths, by
linking the four analogue outputs of the detector directly to FlowTEK™, yielded lower r.s.d.
values in comparison to scanning the spectrum over several wavelengths and then down
loading these spectral scans to FlowTEK™. The r.s.d. for single wavelength monitoring (used
in this optimisation) were usually below 0.7%, even at wavelengths other than the absorbance
maximum. The scanning approach yielded, at best, 0.6% r.s.d., commonly, 1.5% r.s.d., and in
the worst cases, a maximum r.s.d. of 4% was found. This scatter was acceptable considering
the process of data manipulation used.
In the case, of platinum at a wavelength of 400 nm, an increase in tin(II) chloride and
hydrochloric acid concentrations is accompanied by an increase in absorbance. This is shown
in Figure 4.8. A plateau is reached at higher concentrations, viz. greater than 0.25 M tin(II)
chloride and 2.5 M HCI. However, at these higher concentrations the r.s.d. is notably higher
(Figure 4.10), of the order of 2 to 3 times greater, than at lower tin(II) chloride and HCl
concentrations. The r.s.d. is adequately low at an acid concentration of 1 M HCI.
This increased r.s.d. is probably a result of a combination of physical effects, such as
increased viscosity of the solutions and the resulting effect on the mixing process, and chemical
effects, such as the effect of the experimental conditions on reaction rates and complex
formation.
122
Flow-Injection Analysis of the Platinum-Group Metals
Figure 4.10 Three-dimensional response surface plots to show the effect of tin(II)
chloride and hydrochloric acid on the relative standard deviation for replicate experiments of
10 1-1g. cm-3 Pt(IV) measured at 400 nm. Each experiment was performed at least four times.
123
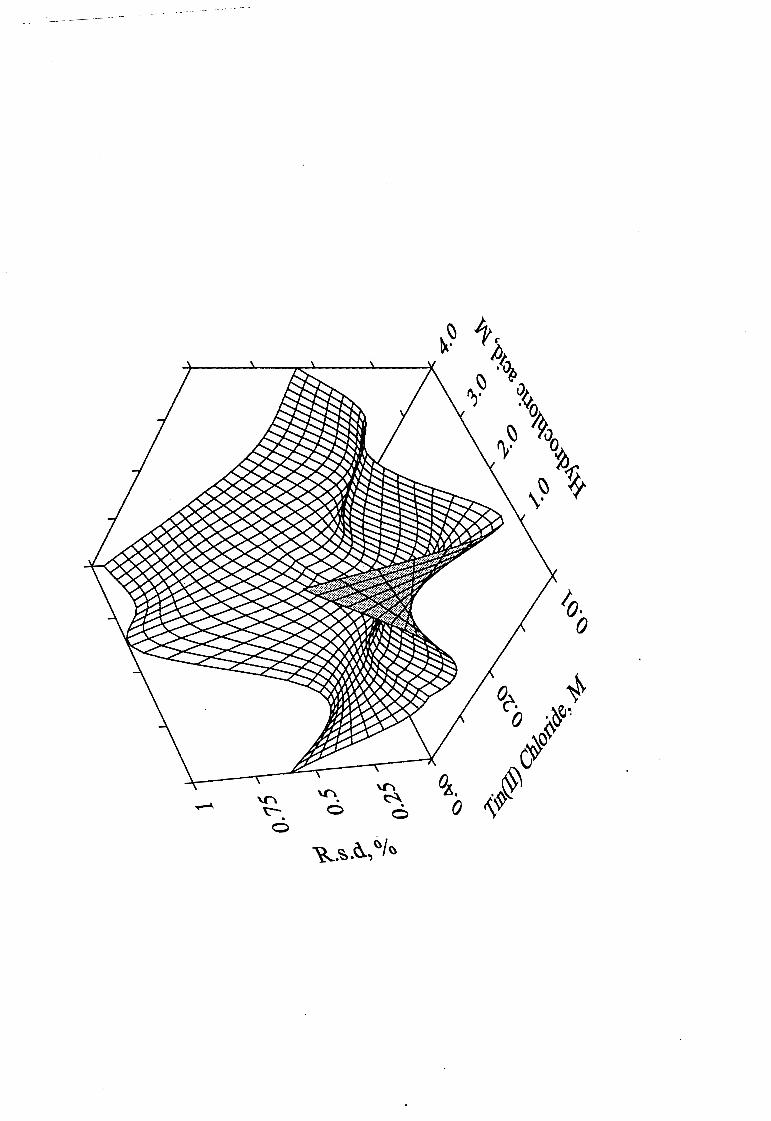
--- -~-~-·. - - -··-
Flow-Injection Analysis of the Platinum-Group Metals
The effect of tin(II) chloride and HCl on the response for palladium (Figure 4.11) shows
that an increase in the tin(II) chloride concentration is accompanied by a sharp decrease in
absorbance. Similarly, an increase in the HCl concentration decreased the absorbance, albeit a
small amount. A plateau is found in regions of low tin(II) chloride and higher hydrochloric
acid concentrations.
The shape of the response surface is indicative of the species being formed under certain
experimental conditions only. At higher hydrochloric acid concentrations there is a decrease in
the percentage of the active SnCh- species (Figure 4.9) and this effect may be seen clearly in
Figure 4.11 at low tin(II) chloride concentrations. In effect, the shape of the plot of
percentage tin(II) distribution against the hydrochloric acid concentration for the SnCh- moiety
follows the same trend seen spectrophometrically at 0.1 M tin(II) chloride, for example.
A degree of spectral difference is a requirement in the resolution of mixtures. It was
therefore important to obtain adequate sensitivity for palladium at wavelength ranges where
the platinum absorption spectrum differed substantially from that of palladium. A compromise
in terms of platinum sensitivity and r.s.d. was made in the selection of operating conditions of
1 M hydrochlori~ acid and 0.05 M tin(II) chloride. Although the platinum sensitivity was
lower, the palladium sensitivity was considerable higher as compared to a position on the
surface corresponding to 0.3 M tin(II) chloride and 3 M HCI. These considerations clearly
illustrate the value of considering all the factors, not only sensitivity in selection of operating
conditions.
124
Flow-Injection Analysis of the Platinum-Group Metals
Figure 4.11 Absorbance response surface map on peaks for a 20 !lg.cm·3 Pd(/1)
sample at 400 nm. The tin(Il) chloride concentration was varied in 0.05 M increments and
the hydrochloric .acid concentration in 0.5 M increments to create the surface.
125
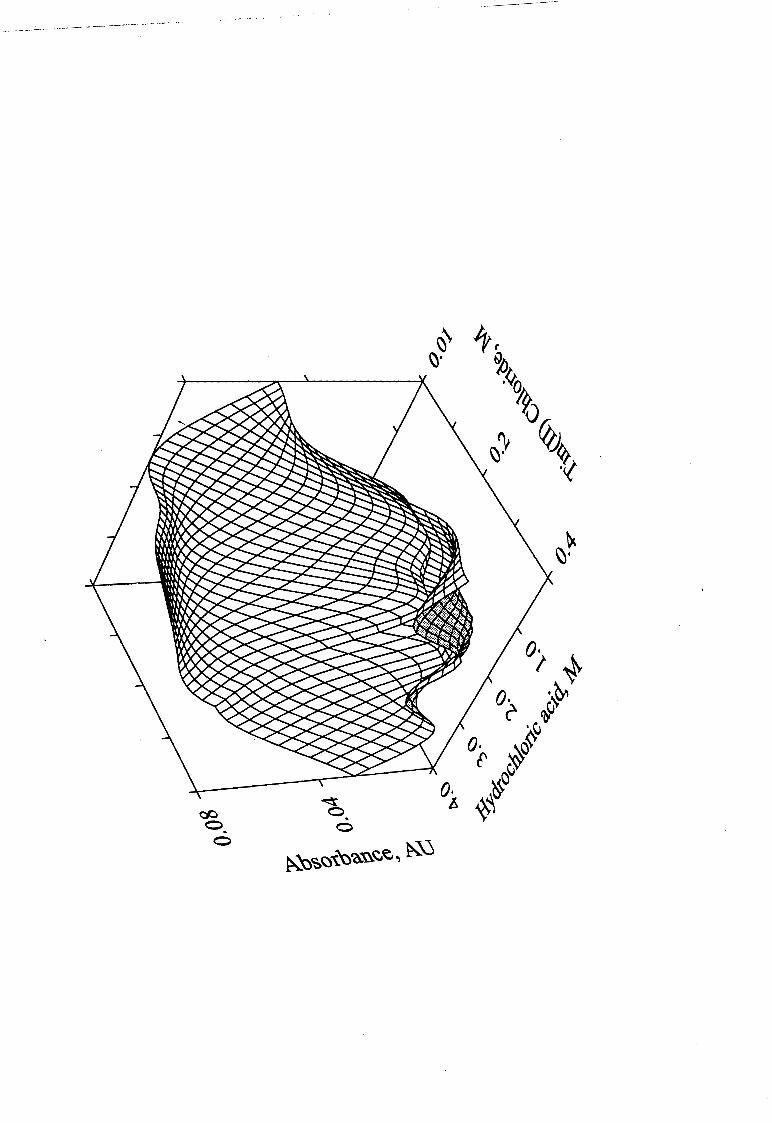
~ 0 6
... -----.--.-.
Flow-Injection Analysis of the Platinum-Group Metals
4.2.5 Sample Acid Concentration
The effect of the sample hydrochloric acid concentration is of importance as changes in
the nature of the sample, for example, an acid process stream being monitored, may occur.
The FIA method should be sufficiently robust to handle such variations.
An increase in the sample hydrochloric acid concentration (between 2 and 4 M) resulted
in nearly a two-fold increase in the r.s.d. of the peak height absorbances. The response did not
alter significantly. The increased r.s.d. trend may, as before, occur due to the increased
solution viscosity, changed mixing processes, and complex chemistry taking place. The
merging stream manifold reduced the effect of the sample hydrochloric acid concentration.
The optimum sample acid concentration is that of the reagent and carrier streams HCl
concentration, i.e. 1 M HCI. Samples in 4 M HCl could still be accurately analysed.
4.3 Conclusion
In FIA a form of univariate optimisation is usually sufficient to find experimental
conditions that give good sensitivity and high sample throughput as the response surfaces are
usually in the form of a hill (with shape "n") or slope (with shape "/"). However, care is
required to ensure that sub-optimum maxima are not obtained when using this type of
optimisation.
Three-dimensional response surfaces provide a uniqueness not present when viewing
data in two-dimensions. The requirement for large volumes of data points to generate these
three-dimensional graphics is not an obstacle. A FIA system that is fully automated may
readily collect such data over an extended period. The interaction of parameters and
comparisons of response surface for different components, facilitates the selection of
conditions for multi-component analysis.
Optimisation usually involves consideration of the response of the system. Given a
suitably versatile data acquisition system, surfaces of other parameters, such as the r.s.d. of the
response, are generated without any additional experiments. It is evident from this chapter that
126
Flow-Injection Analysis of the Platinum-Group Metals
a critical consideration of several manifold parameters is necessary to yield a working FIA
manifold for determination of the PGMs. A further requirement of the optimum conditions
was that they could be used in the simultaneous determination of mixtures of platinum and
palladium. This was found to be the case.
Finally, where several parameters are to be considered, the possibility of moving from a
three-dimensional space into higher, multi-dimensional vector space does not impose a
limitation as such mathematical routines can be readily accomplished with sophisticated
microcomputer software.
127
Flow-Injection Analysis of the Platinum-Group Metals
4.4 References
1. Betterridge, D., et al., Anal. Chem., 1983, 55, 1292.
2. Kowalski, B.R., Ruzicka, J., and Christian, G.D., Trends in Anal. Chem., 1990, 9(1),
8.
3. Auer, D., and Koch, K.R., Talanta, 1993, 40(12), 1975.
4. Stone, D.C., and Tyson, J.F.,Anal. Chim. Acta, 1986, 179, 427.
5. Ham, G., Anal. Proc., 1981, 18, 69.
6. Young, J.F., Gillard, R.D., and Wilkinson, G., I. Chem. Soc. Dalton, 1977, 239.
7. Ruzicka, J., and Hansen, E.H., "Flow Injection Analysis", 2nd edn., Wiley lnterscience,
New York, 1988.
8. Spendley, W., Hext, G.R., and Himsworth, F.R., Technometrics, 1962,4, 441.
9. Neider, J.A., and Mead, R., Comput. 1., 1965, 78, 308.
10. Betteridge, D., Howard, A.G., and Wade, A.P., Talanta, 1985, 8B, 723.
11. Morgan, S.L., and Deming, S.N.,Anal. Chem., 1974,46, 1170.
12. Prownpuntu, A., and Titapiwatanakun, U., Analyst, 1991, 116, 191.
13. Ruzicka, J., and Hansen, E.H., Anal. Chim. Acta, 1978, 99, 37.
14. Lachman, S.J., and Tompkins, F.C., Trans. Faraday Soc., 1949, 40, 136.
15. Koch, K.R., and Yates, J.E., Anal. Chim. Acta, 1983, 147, 235.
16. Milner, 0.1., and Shipman, G.F., Anal. Chem., 1955, 27(9), 1476.
17. Wyrley-Birch, J.M., MSc. Thesis, University of Cape Town, Rep. S. Africa, 1984.
128
~ _________ ______...,.. __ ._,__. :··· .. ·~---- .. --.. ::~: ··.;~. ··. -·. ·.·--·-";, -·. ··:-- :--
Flow-Injection Analysis of the Platinum-Group Metals
Chapter 5.
Single Component Analysis of the
Platinum-Group Metals
The reaction of tin(II) chloride with the platinum-group metals has been widely used in
the colorimetric determination of platinum and palladium.1'2
'3 Brightly coloured complexes
form very rapidly in hydrochloric acid solution. The nature of the complexes, and hence the
colour, are critically dependant on the reaction conditions. These rapid reaction rates are ideal
for application in flow-injection analysis (FIA). An intense red-orange colour forms on
reaction of platinum with tin(II) chloride, whereas in the case of palladium a series of colour
changes occur that ultimately result in an olive-green colour.
The palladium-tin(II) chloride reaction was investigated by means of a stopped-flow
approach. Visualisation of the data in three-dimensional surfaces aided correlation of the
colour changes with local absorption maxima. This graphical approach assists the elucidation
of underlying complex chemistries. Evidence is presented regarding the nature of species
causing the final olive-green colour by considering the reaction of palladium with tin(II)
chloride and tin(II) bromide.
The reaction of rhodium with tin(II) chloride is slower than the reaction with platinum
and palladium. Lengthy incubation times are required that often involve boiling of the
solution.4 This limits the application of tin(II) chloride as an analytical reagent for rhodium by
FlA. Similarly, iridium and ruthenium react very slowly at room temperature with tin(II)
chloride.5 Rhodium, iridium, and ruthenium, should therefore be determined with a reagent
other than tin(II) chloride. The reaction of tin(II) bromide6 with rhodium is considerably more
rapid and sensitive for rhodium than the corresponding reaction with tin(II) chloride.
Results pertaining to the single component analysis of platinum and palladium with tin(II)
chloride, and rhodium with tin(II) bromide, are detailed. A preliminary interference study
shows the potential of this work in a process environment.
129
Flow-Injection Analysis of the Platinum-Group Metals
5.1 The Determination of Platinum
The origin of the red-orange colour on reaction of platinum with tin(II) chloride is
known to result from the rapid reduction of any Pt(IV) species to Pt(II),7 followed by, or
concomitant with, complex formation of PtCI/- with the SnCb- moiety. This results in a series
of [Pt(SnCb)nC14-nt (n = 1 to 4) complexes as well as the relatively stable [Pt(SnCb)5t complex anion.7
'8 This reaction is well known and forms the basis of an established manual
spectrophotometric method for trace levels of platinum.9
Investigation here sought to develop an automated approach based on FIA for trace
determination of platinum. This forms the foundation for the simultaneous determination of
platinum and palladium, and the simultaneous determination of other PGMs with platinum.
The manifold configuration and experimental conditions used in the following SCA
determinations (unless specified otherwise) are a merging stream manifold with a final flow
rate of 1.6 cm3.min-\ a reaction coil length of 300 em, and sample injection volume of 125 f..lL
All solutions (reagent, carrier, and samples) were made up in 1 M HCl or 1 M HBr.
5.1.1 The Effect of the Platinum Oxidation State
The effect of the oxidation state of the platinum was investigated by preparation of
separate solutions containing identical amounts of Pt(IV) and Pt(II) respectively. The
concentrations were verified to be the same by flame atomic-absorption spectrometry and ICP
AES. All else being equal, any variation in the FIA response would be due to the different
oxidation states of the platinum.
A range of tin(II) chloride concentrations and manifold configurations (flow rate,
reaction coil length) were examined using solutions of Pt(II!IV) having concentrations of
10 f..lg.cm-3 and 100 f..lg.cm-3• Triplicate injections were made in each case. Peak height and
peak area comparisons were made. Peak height absorbance results for one configuration are
shown in Table 5.1. No significant difference was found, and it is concluded that the platinum
valency has no significant effect upon the FIA response. Pt(IV) was subsequently used
throughout this work.
130
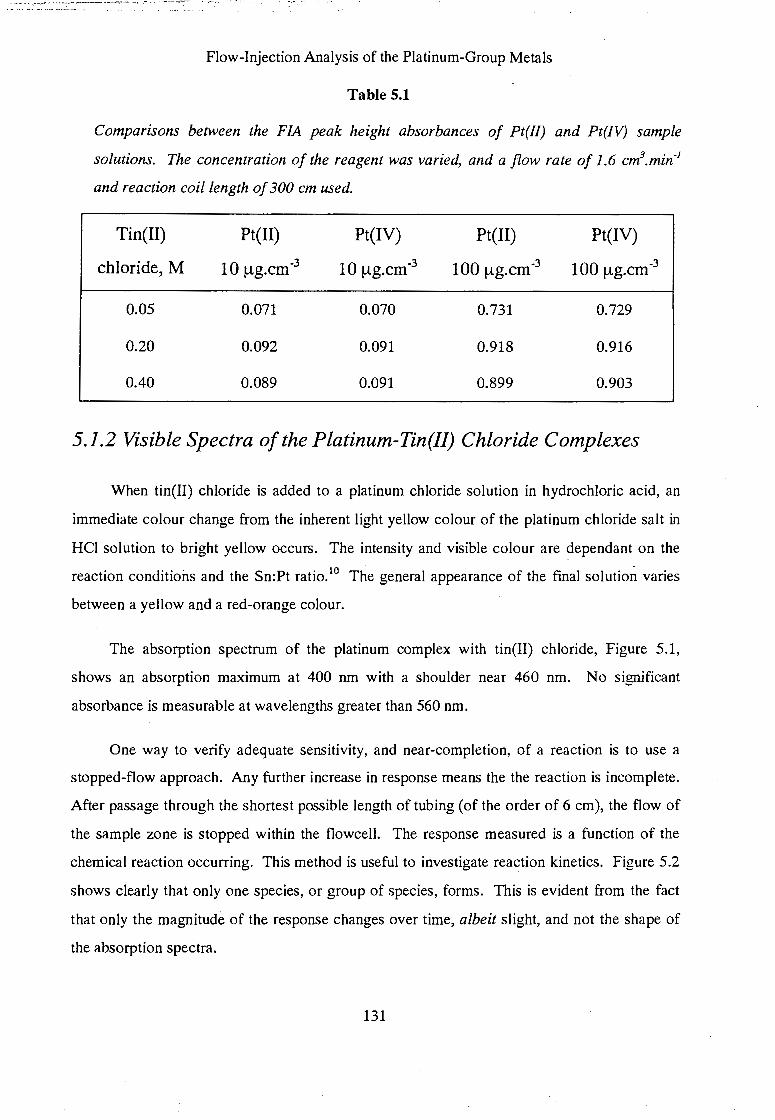
.. ~-.----.·--~-,----··---:-.-· -·· .-. '' ---~-
Flow-Injection Analysis of the Platinum-Group Metals
Table 5.1
Comparisons between the FIA peak height absorbances of Pt(/1) and Pt(IV) sample
solutions. The concentration of the reagent was varied, and a flow rate of 1.6 cm3.min-1
and reaction coil length of 300 em used.
Tin( II) Pt(II) Pt(IV) Pt(II) Pt(IV)
chloride, M 10 !J-g.cm -3 10 !J-g.cm-3 100 !J-g.cm-3 100 !J-g.cm-3
0.05 0.071 0.070 0.731 0.729
0.20 0.092 0.091 0.918 0.916
0.40 0.089 0.091 0.899 0.903
5.1.2 Visible Spectra of the Platinum-Tin(!!) Chloride Complexes
When tin(II) chloride is added to a platinum chloride solution in hydrochloric acid, an
immediate colour change from the inherent light yellow colour of the platinum chloride salt in
HCl solution to bright yellow occurs. The intensity and visible colour are dependant on the
reaction conditions and the Sn:Pt ratio. 10 The general appearance of the fmal solution varies
between a yellow and a red-orange colour.
The absorption spectrum of the platinum complex with tin(II) chloride, Figure 5.1,
shows an absorption maximum at 400 nm with a shoulder near 460 nm. No significant
absorbance is measurable at wavelengths greater than 560 nm.
One way to verify adequate sensitivity, and near-completion, of a reaction is to use a
stopped-flow approach. Any further increase in response means the the reaction is incomplete.
After passage through the shortest possible length of tubing (of the order of 6 em), the flow of
the sample zone is stopped within the flowcell. The response measured is a function of the
chemical reaction occurring. This method is useful to investigate reaction kinetics. Figure 5.2
shows clearly that only one species, or group of species, forms. This is evident from the fact
that only the magnitude of the response changes over time, albeit slight, and not the shape of
the absorption spectra.
131
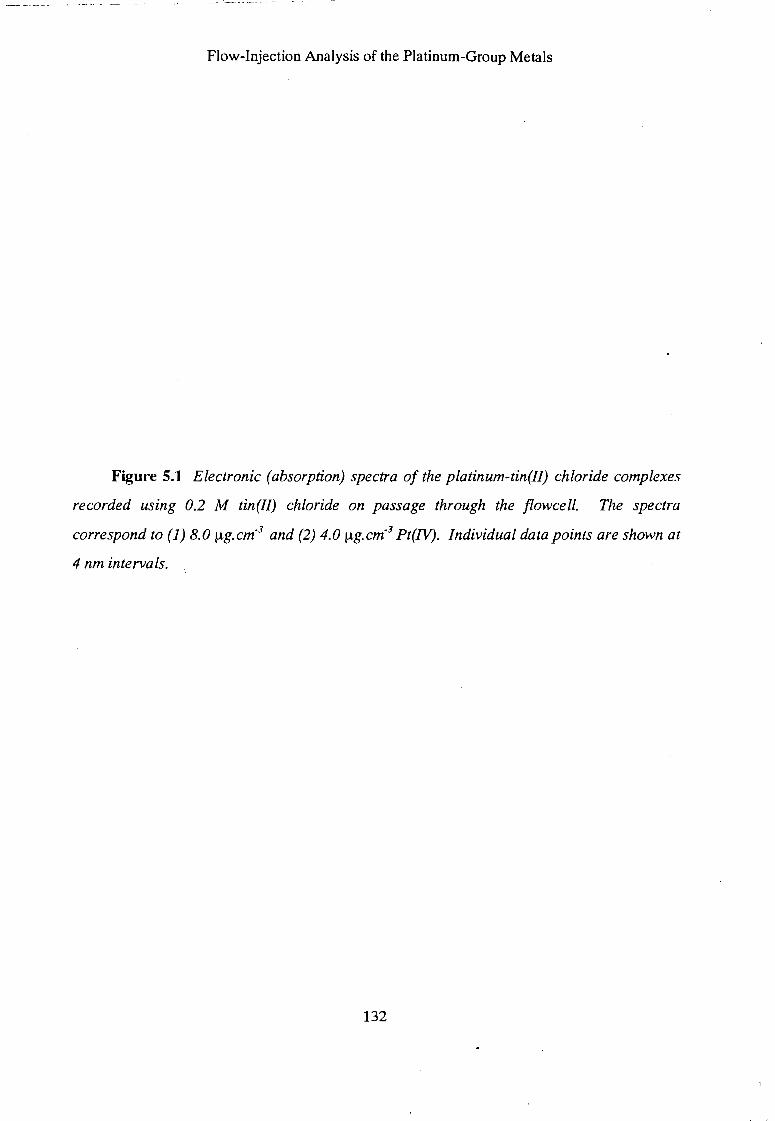
Flow-Injection Analysis of the Platinum-Group Metals
Figure 5.1 Electronic (absorption) spectra of the platinum-tin(l/) chloride complexes
recorded using 0.2 M tin(Il) chloride on passage through the flowcell. The spectra
correspond to (1) 8.0 ~g.cm·3 and (2) 4.0 ~g.cm·3 Pt(N). Individual data points are shown at
4 nm intervals.
132
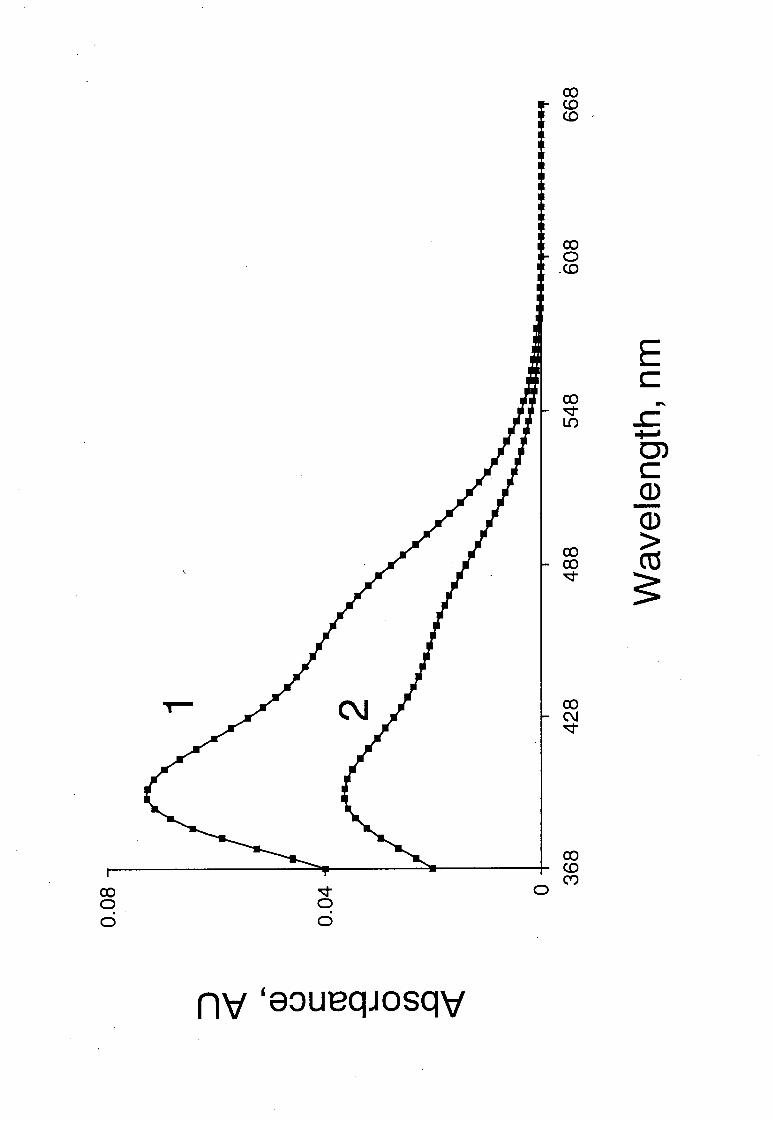
co 0 0
v 0 0
co <0 <0-
co 0
.<0
co v L()
co co v
co C\1 v
E c
... ..c ......., 0'> c CD -CD > ctS
~
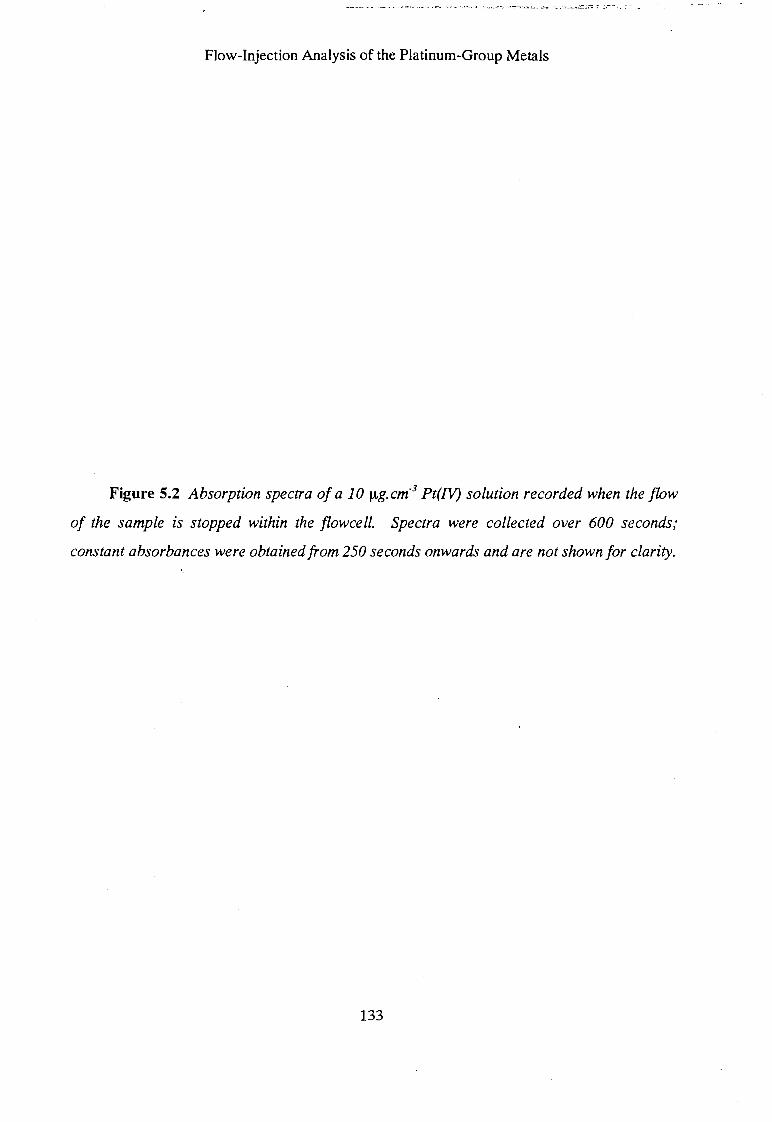
Flow-Injection Analysis of the Platinum-Group Metals
Figure 5.2 Absorption spectra of a 10 ~g. cm-3 Pt(N) solution recorded when the flow
of the sample is stopped within the flowcell. Spectra were collected over 600 seconds;
constant absorbances were obtained from 250 seconds onwards and are not shown for clarity.
133
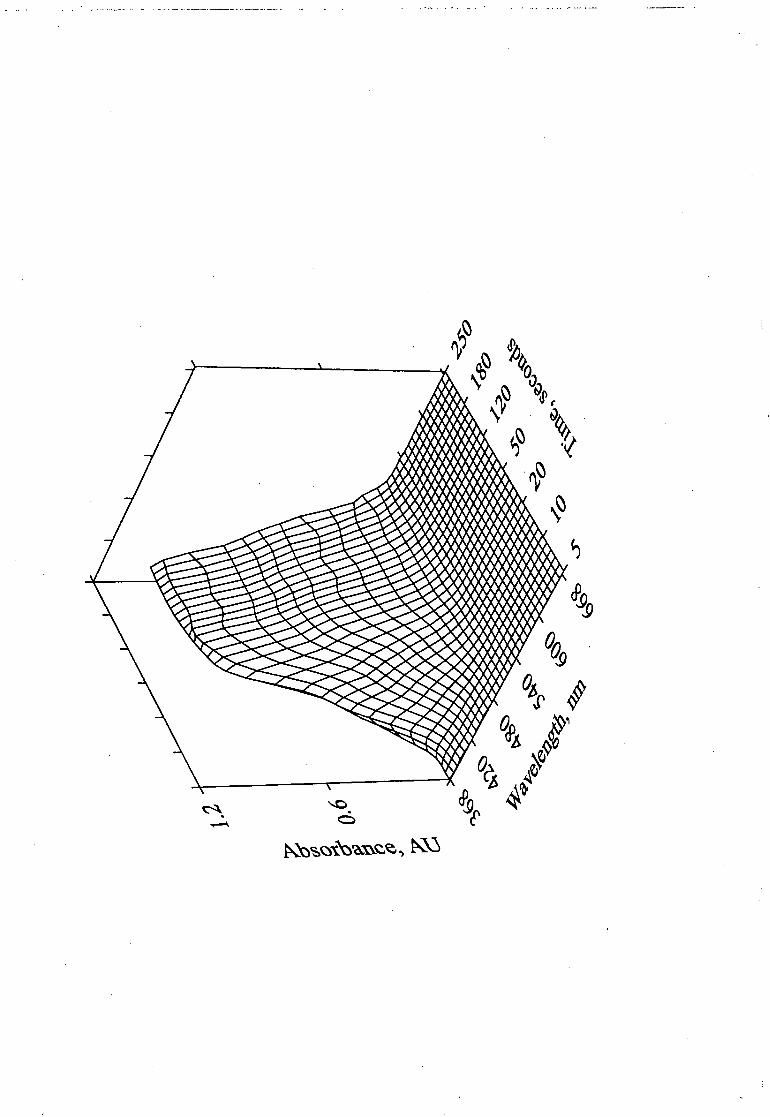
Flow-Injection Analysis of the Platinum-Group Metals
5.1.3 Calibration
As the transient FIA signal height is proportional to the concentration of the analyte
contained in the injected sample, measurement of the peak height absorbance for each
calibration standard yields a calibration graph. Calibration computations of this nature were
performed by ReduceTEK.
Since aqueous standards and synthetic samples were used, it was unnecessary to use a
standard additions approach. Calibration was performed immediately prior to sample analyses
by injection of at least four calibrants, each measured in at least triplicate, spread across the
linear range. Replicate injection of an analyte-free "blank" solution showed no significant
difference from the continuously flowing carrier solution even after signal amplification.
Accordingly, the carrier stream was used as a continuous measure of the blank solution.
Statistical features of the calibration graphs for recorded data at three wavelengths are
shown in Table 5.2. Linearity between 1 and 100 !lg.cm-3 Pt(IV) was found_ An upper limit of
100 ~-tg.cm-3 was set for the determination of Pt(IV). Linearity may be extended to a
concentration of 700 !lg.cm -3 by reducing the injection volume. This effectively results in "on
line" dilution of the sample allowing large concentrations to be handled without the need for
serial dilution.
The reproducibility, expressed as the relative standard deviation for replicate (n = 11)
injections of a 10 !lg.cm-3 Pt(IV) sample, and sensitivity were excellent at all tin(II) chloride
concentrations used.
Noise over the wavelength range used was found to be negligible even when the reagent
and carrier were pumped through the Spectra Focusn• detector tlowcell. The digital readout
of the detector for the continuous blank solution was invariably less than 0.0003 AU.
Attempts to extend the calibration graph below 1.0 !lg.cm -3 Pt(IV) using a tin(II)
chloride concentration of 0.2 M proved successful at a wavelength of 400 nm. Although the
calibration graph was linear to 0.1 !lg.cm-3 Pt(IV) (r = 0.998), the relative standard deviation
of replicate injections (n = 16) for the lower standards were higher. A solution of 0.1 !lg.cm-3
134
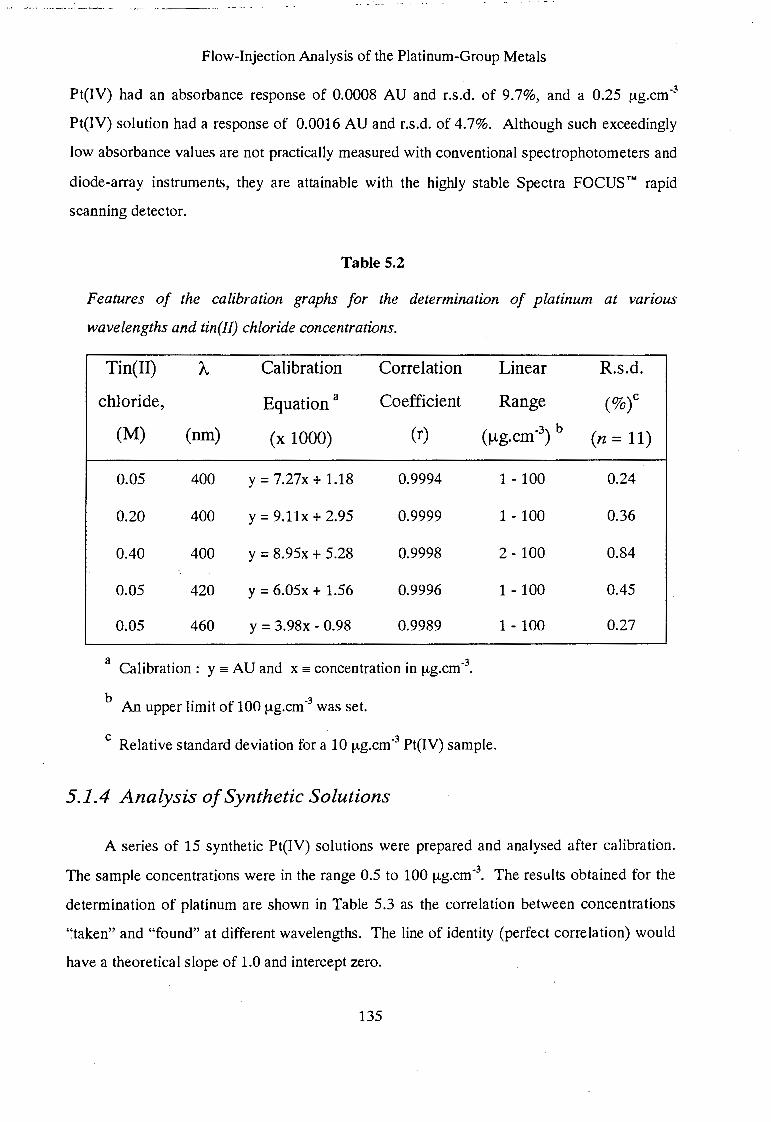
Flow-Injection Analysis of the Platinum-Group Metals
Pt(IV) had an absorbance response of 0.0008 AU and r.s.d. of 9.7%, and a 0.25 f-tg.cm-3
Pt(IV) solution had a response of 0.0016 AU and r.s.d. of 4. 7%. Although such exceedingly
low absorbance values are not practically measured with conventional spectrophotometers and
diode-array instruments, they are attainable with the highly stable Spectra FOCUS rM rapid
scanning detector.
Table 5.2
Features of the calibration graphs for the determination of platinum at various
wavelengths and tin(!!) chloride concentrations.
Tin(II) A Calibration Correlation
chloride, Equation a Coefficient
(M) (nm) (x 1000) (r)
0.05 400 y = 7.27x + 1.18 0.9994
0.20 400 y = 9.11x + 2.95 0.9999
0.40 400 y = 8.95x + 5.28 0.9998
0.05 420 y = 6.05x + 1.56 0.9996
0.05 460 y = 3.98x- 0.98 0.9989
a Calibration: y =AU and x =concentration in !-tg.cm-3•
b An upper limit of 100 f-tg.cm-3 was set.
Linear
Range
(!J-g.cm-3) b
1- 100
1- 100
2- 100
1- 100
1- 100
c Relative standard deviation for a 10 ~-tg.cm-3 Pt(IV) sample.
5.1.4 Analysis of Synthetic Solutions
R.s.d.
(%t
(n = 11)
0.24
0.36
0.84
0.45
0.27
A series of 15 synthetic Pt(IV) solutions were prepared and analysed after calibration.
The sample concentrations were in the range 0.5 to 100 !-lg.cm-3• The results obtained for the
determination of platinum are shown in Table 5.3 as the correlation between concentrations
"taken" and "found" at different wavelengths. The line of identity (perfect correlation) would
have a theoretical slope of 1.0 and intercept zero.
135
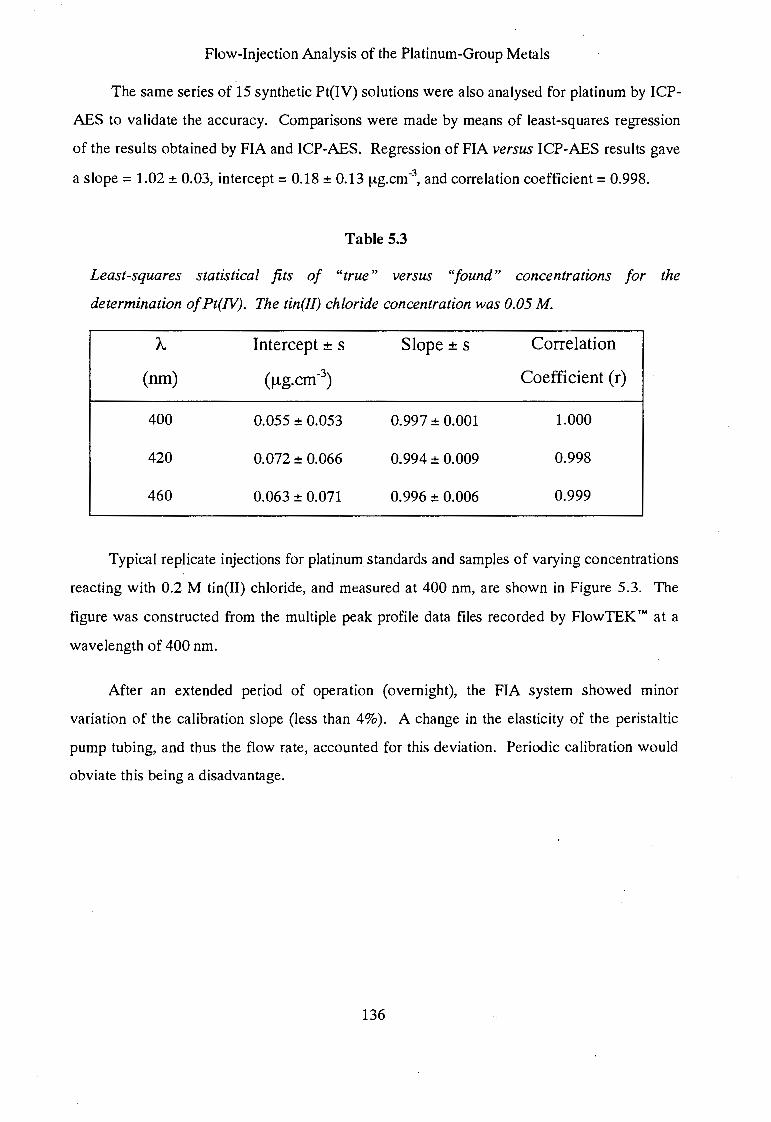
Flow-Injection Analysis of the Platinum-Group Metals
The same series of 15 synthetic Pt(IV) solutions were also analysed for platinum by ICP
AES to validate the accuracy. Comparisons were made by means of least-squares regression
of the results obtained by FIA and ICP-AES. Regression of FIA versus ICP-AES results gave
a slope= 1.02 ± 0.03, intercept= 0.18 ± 0.13 !-lg.cm-3, and correlation coefficient= 0.998.
Table 5.3
Least-squares statistical fits of "true" versus "found" concentrations for the
determination of Pt(IV). The tin(Il) chloride concentration was 0.05 M.
A. Intercept ± s
(run) (!lg.cm-3)
400 0.055 ± 0.053
420 0.072 ± 0.066
460 0.063 ± 0.071
Slope± s
0.997 ± 0.001
0.994 ± 0.009
0.996 ± 0.006
Correlation
Coefficient (r)
1.000
0.998
0.999
Typical replicate injections for platinum standards and samples of varying concentrations
reacting with 0.2 M tin(II) chloride, and measured at 400 nm, are shown in Figure 5.3. The
figure was constructed from the multiple peak profile data files recorded by FlowTEKTM at a
wavelength of 400 nm.
After an extended period of operation (overnight), the FIA system showed minor
variation of the calibration slope (less than 4% ). A change in the elasticity of the peristaltic
pump tubing, and thus the flow rate, accounted for this deviation. Periodic calibration would
obviate this being a disadvantage.
136
Flow-Injection Analysis of the Platinum-Group Metals
Figure 5.3 Typical replicate injections for platinum standards and samples of varying
concentrations using a tin(II) chloride concentration of 0.2 M. Numerals refer to
concentration in ~-tg.cm·3• The letters refer to samples of (a) 60, (b) 10, (c) 45, (d) 90, (e) 30,
and (f) 80 ~-tg.cm:3 Pt(IV).
137
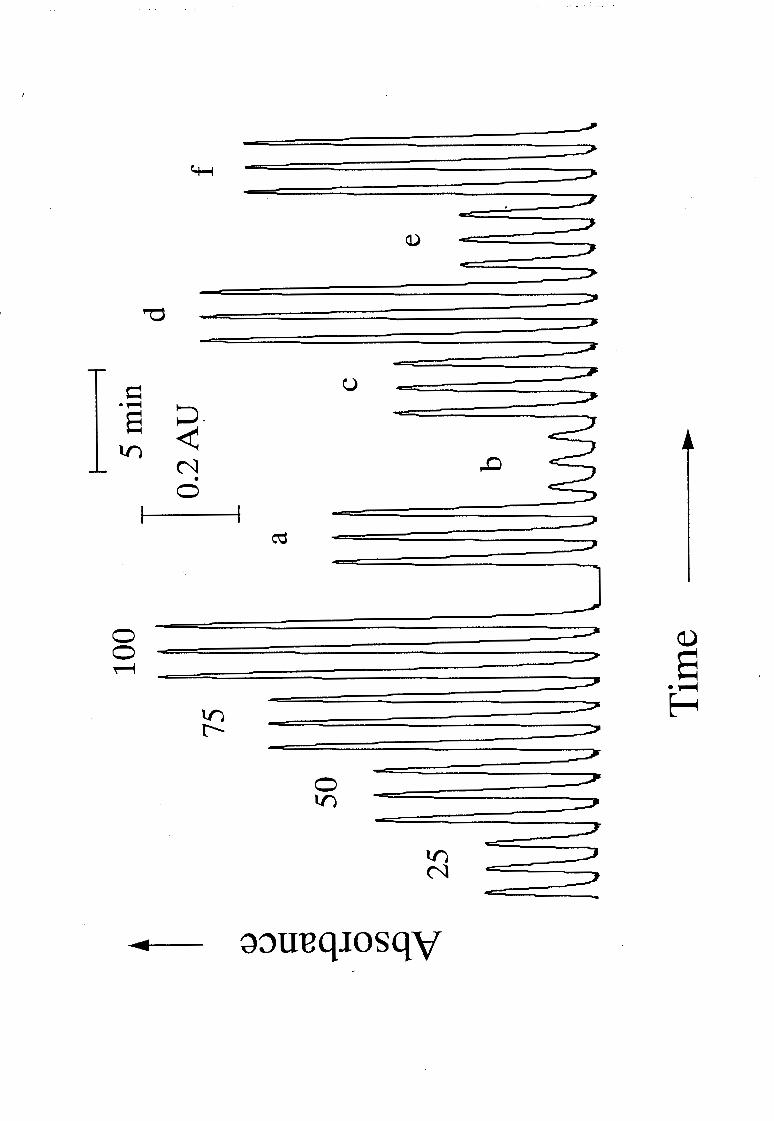
0 0 M
0 tn
Flow-Injection Analysis of the Platinum-Group Metals
5.1.5 Analytical Features and Performance
Studies on the detection limit were carried out by injecting a blank solution and
measuring at 400 nm. The limit of detection and limit of determination were calculated
according to the IUPAC recommendations.11 IUPAC recommends that the limit of detection,
defined in terms of either concentration (CL) or amount (qL), be related to the smallest measure
of response (xL) that can be detected with reasonable certainty in a given analytical procedure,
where
and x8 is the mean of the blank measures (at least 30 replicates were used in this work),
S8 is the standard deviation of the blank measures, and k is a numerical constant. The
detection limit is given by
where S is the sensitivity of the method. A value of k = 3 is strongly recommended for
computation of the limit of detection. In turn, the limit of determination is computed with a
value of k = 10.
The limit of detection was calculated to be 47 f..lg.dm-3 Pt(IV), and the limit of
determination at 156 f..lg.dm-3 Pt(IV) using a tin(II) chloride concentration of 0.05 M.
Subsequently, a solution of 50 f..lg.dm-3 Pt(IV) was prepared and analysed. The response did
not differ significantly from the baseline. The limit of determination was fixed at 156 ~tg.dm-3 •
A solution of 100 f..lg.dm-3 Pt(IV) was differentiable from the baseline noise, however the r.s.d.
of 16 replicate experiments was as high as 9.7%.
No "carry-over" was found when alternating between high (100 f..lg.cm-3) and low
(5 f..lg.cm-3) concentration standards provided sufficient time was allowed for the baseline
signal to be re-established. The sampling rate was 54 hour-1• The FIA manifold allowed
unattended operation for extended periods under FlowTEK™ control.
138
Flow-Injection Analysis of the Platinum-Group Metals
5.2 The Determination of Palladium
A series of colour changes take place when solutions of palladium are treated with tin(II)
chloride in hydrochloric acid. The prominent colour changes are from a yellow-orange colour
(A. = 420 nm), to red (A. = 355, 420 nm), through blue, and finally to an olive green colour
(A.= 380, 460, 636 nm).
The aim of this investigation was to develop an automated approach of analysis based on
FIA for the trace determination of palladium. This work would also serve as a foundation for
the simultaneous determination of platinum and palladium. The previously uncharacterised
blue colour was investigated. Evidence is provided that strongly suggests that the green colour
may be ascribed to the existence of specific complexes and not to a colloidal material as has
been postulated.12
Complexes give rise to absorption bands in the absorption spectrum. These bands are
manifested in the colour of the solution. The differing spectral characteristics of these colours,
apart from indicating the presence of complex species in solution, provide a means to study
these complexes:· In this way, an association of colour changes with local absorption maxima
are confirmed and the absorption maximum associated with the blue colour determined. A
qualitative consideration of the effects of tin(II) chloride, H+, and cr concentrations assist in
elucidation of the underlying complex chemistry.
5.2.1 Stopped-Flow Investigation
Stopped-flow injection is based on stopping the flow of the sample zone when it is in the
detector tlowcell and recording the response as a function of time at a particular wavelength,
or wavelengths. Since stopping of the sample zone is highly reproducible, it is possible to
accurately compare reactions under differing experimental conditions. The physical dispersion
component of the signal is removed and the response becomes a function of the chemical
reaction occurring.
139
Flow-Injection Analysis of the Platinum-Group Metals
A stopped-flow method was essential to capture the absorbance spectra for
characterisation of the red, yellow, and blue colours since these colour changes take place very
rapidly. A merging stream manifold with the shortest possible length of tubing between the
merging tee-piece and the spectrometer flowcell was used. Inertia on stopping the flow of the
solution occurred. As a result, knowledge of the exact time required until the sample zone was
stationary and positioned in the flowcell is essential. This was found by injecting bromothymol
blue dye and monitoring at a wavelength of 620 nm. The sample zone was completely
stationary in the flowcell after four seconds and the first spectral scan was initiated one second
later. Thereafter, scans were recorded at predetermined time intervals. A 100 J.tg.cm·3 Pd(ll)
sample was used in the stopped-flow study.
The following points should be regarded when viewing absorption spectra of complexes
in solution. An increase of absorbance at one wavelength and a corresponding decrease at
another wavelength is indicative of a complex, or series of complexes, forming and changing or
decomposing (not necessarily in equilibrium). An isosbestic point is the point of intersection of
a number of absorption curves on changing one of the parameters of a system in equilibrium.
Such a parameter may be concentration, temperature, or time.
Isosbestic points correspond to contour lines that are parallel to the time axis and in the
contour plot, have unchanged absorbance. A plateau in the absorption spectrum corresponds
to a contour line being parallel to the wavelength axis. The proximity of contour lines to one
another determines the absorption gradient of the particular spectral feature (for example, a
very sharp absorption peak would have circular contours close to one another).
Once the absorption spectra had been recorded as a function of time, an "animation" of
the chemical reaction was viewed over time. This allowed observation of the exact sequence
of events that finally gave the characteristic green colour. These results are presented
graphically in Figure 5.4 and Figure 5.5 using a three-dimensional graphic and a contour plot
to clearly indicate the spectral characteristics.
140
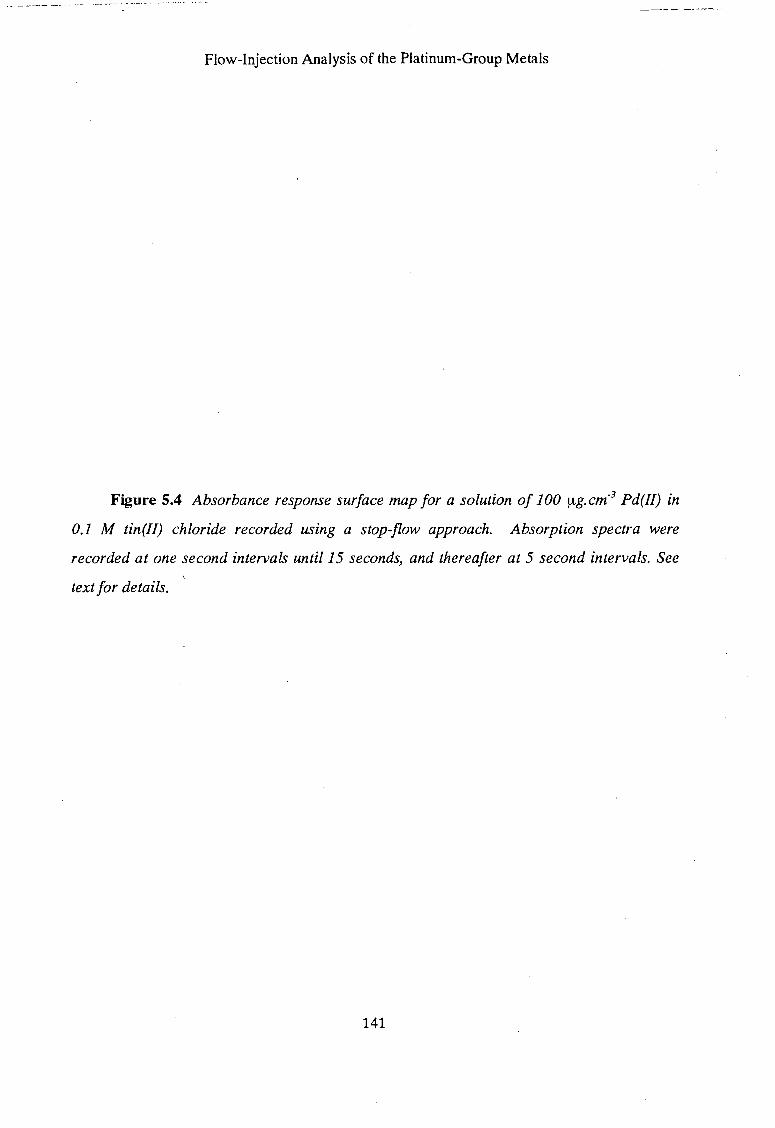
Flow-Injection Analysis of the Platinum-Group Metals
Figure 5.4 Absorbance response surface map for a solution of 100 ~-tg.cm-3 Pd(II) in
0.1 M tin(//) chloride recorded using a stop-flow approach. Absorption spectra were
recorded at one second intervals until 15 seconds, and thereafter at 5 second intervals. See
text for details.
141
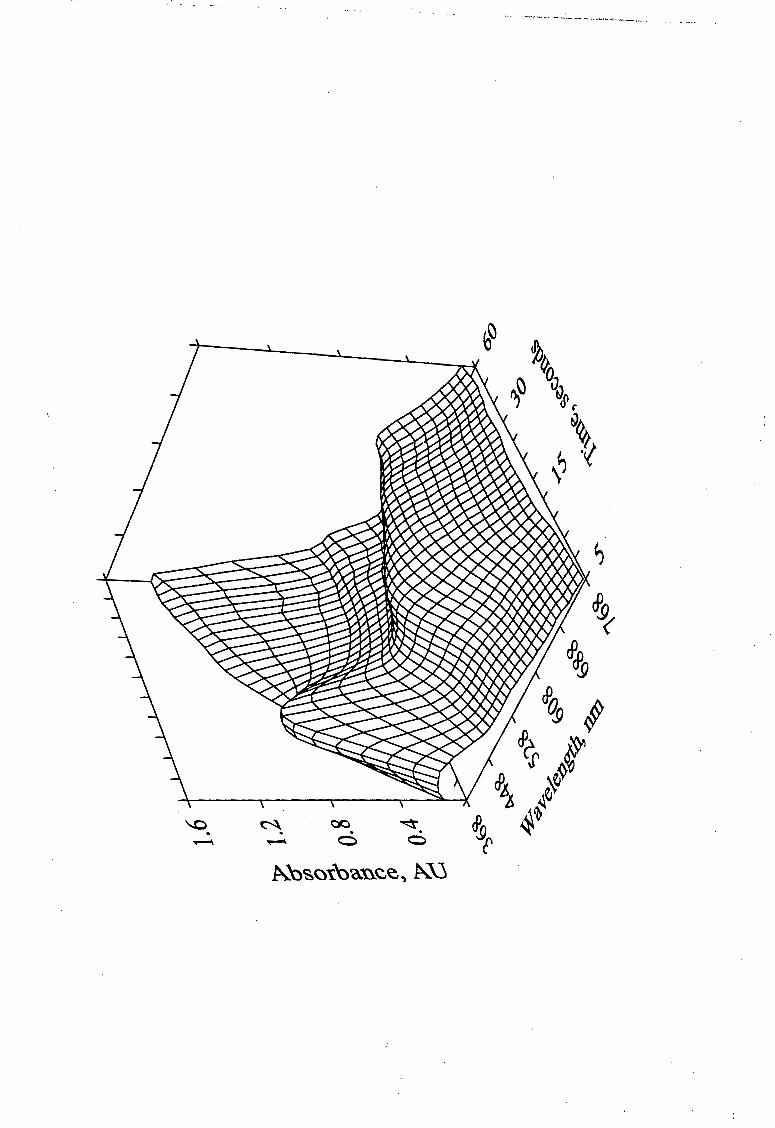
~ ~ . . 0 0
. ----· -·----···-·--·--·-·-.
Flow-Injection Analysis of the Platinum-Group Metals
Figure 5.5 Contour plot for Figure 5.4 to show the distinct spectral character as a
function of time for palladium using a stop-flow approach. See text for details.
142
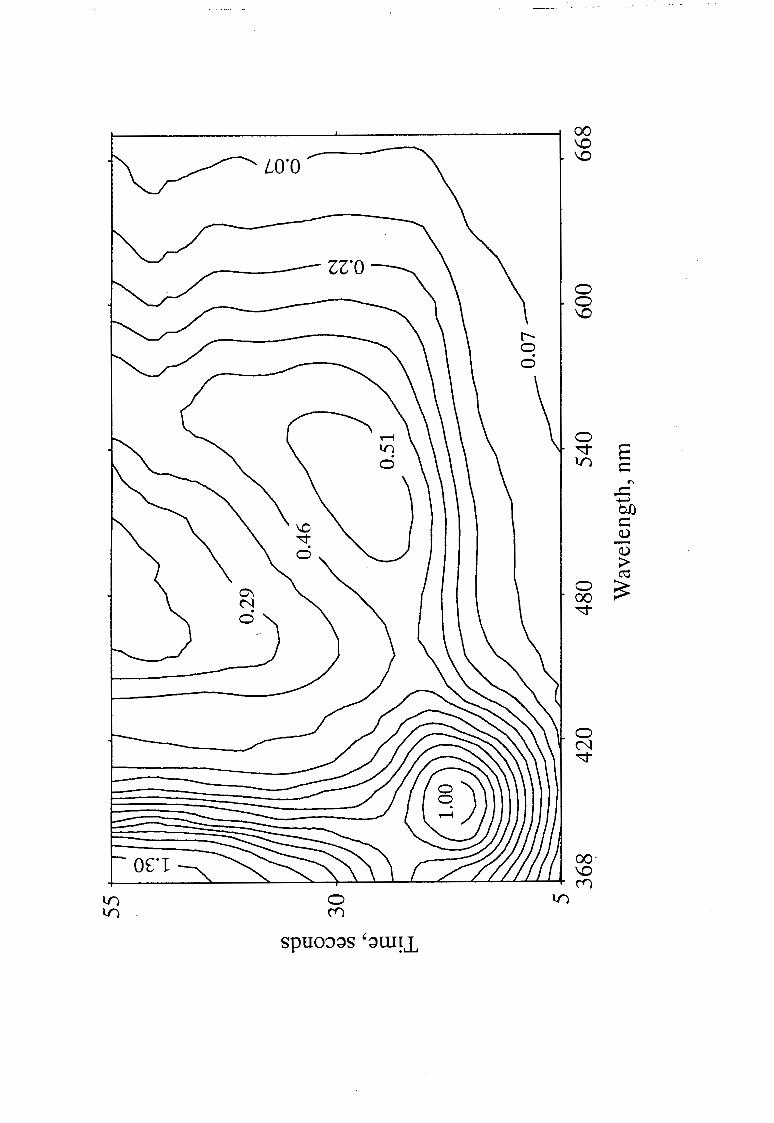
V) V)
t" 0 . 0
00 \0 \0
0 0 \0
0
""'" V)
0 00
""'"
E ~
.... ..c: ...... OJ) ~ C) -C) ;;> ro ~
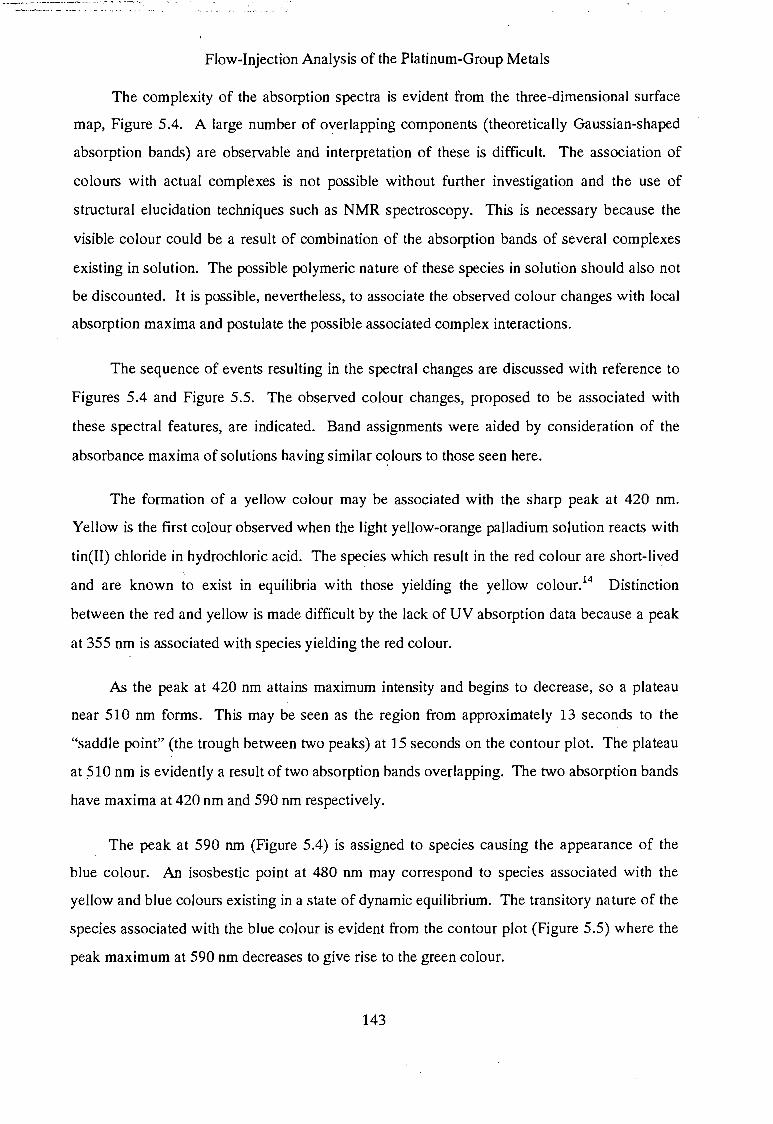
--~ .. -··-.··----·-- -. ·.- -- .. --. -...
Flow-Injection Analysis of the Platinum-Group Metals
The complexity of the absorption spectra is evident from the three-dimensional surface
map, Figure 5.4. A large number of overlapping components (theoretically Gaussian-shaped
absorption bands) are observable and interpretation of these is difficult. The association of
colours with actual complexes is not possible without further investigation and the use of
structural elucidation techniques such as NMR spectroscopy. This is necessary because the
visible colour could be a result of combination of the absorption bands of several complexes
existing in solution. The possible polymeric nature of these species in solution should also not
be discounted. It is possible, nevertheless, to associate the observed colour changes with local
absorption maxima and postulate the possible associated complex interactions.
The sequence of events resulting in the spectral changes are discussed with reference to
Figures 5.4 and Figure 5.5. The observed colour changes, proposed to be associated with
these spectral features, are indicated. Band assignments were aided by consideration of the
absorbance maxima of solutions having similar CC?lours to those seen here.
The formation of a yellow colour may be associated with the sharp peak at 420 nm.
Yellow is the first colour observed when the light yellow-orange palladium solution reacts with
tin(II) chloride in hydrochloric acid. The species which result in the red colour are short-lived
and are known to exist in equilibria with those yielding the yellow colour.14 Distinction
between the red and yellow is made difficult by the lack of UV absorption data because a peak
at 355 nm is associated with species yielding the red colour.
As the peak at 420 nm attains maximum intensity and begins to decrease, so a plateau
near 510 nm forms. This may be seen as the region from approximately 13 seconds to the
"saddle point" (the trough between two peaks) at 15 seconds on the contour plot. The plateau
at 510 nm is evidently a result of two absorption bands overlapping. The two absorption bands
have maxima at 420 nm and 590 nm respectively.
The peak at 590 nm (Figure 5.4) is assigned to species causing the appearance of the
blue colour. An isosbestic point at 480 nm may correspond to species associated with the
yellow and blue colours existing in a state of dynamic equilibrium. The transitory nature of the
species associated with the blue colour is evident from the contour plot (Figure 5.5) where the
peak maximum at 590 nm decreases to give rise to the green colour.
143
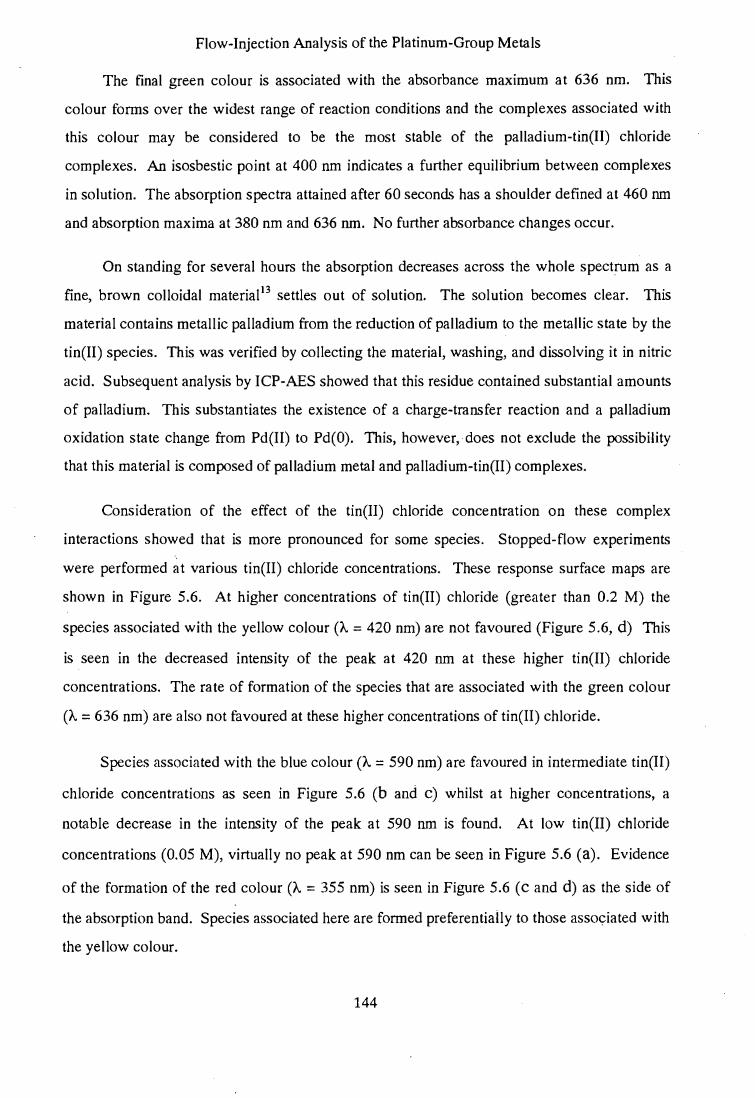
Flow-Injection Analysis of the Platinum-Group Metals
The final green colour is associated with the absorbance maximum at 636 nm. This
colour forms over the widest range of reaction conditions and the complexes associated with
this colour may be considered to be the most stable of the palladium-tin(II) chloride
complexes. An isosbestic point at 400 nm indicates a further equilibrium between complexes
in solution. The absorption spectra attained after 60 seconds has a shoulder defined at 460 nm
and absorption maxima at 380 nm and 636 nm. No further absorbance changes occur.
On standing for several hours the absorption decreases across the whole spectrum as a
fine, brown colloidal materia113 settles out of solution. The solution becomes clear. This
material contains metallic palladium from the reduction of palladium to the metallic state by the
tin(II) species. This was verified by collecting the material, washing, and dissolving it in nitric
acid. Subsequent analysis by ICP-AES showed that this residue contained substantial amounts
of palladium. This substantiates the existence of a charge-transfer reaction and a palladium
oxidation state change from Pd(II) to Pd(O). This, however, does not exclude the possibility
that this material is composed of palladium metal and palladium-tin(II) complexes.
Consideration of the effect of the tin(II) chloride concentration on these complex
interactions showed that is more pronounced for some species. Stopped-flow experiments
were performed at various tin(II) chloride concentrations. These response surface maps are
shown in Figure 5.6. At higher concentrations of tin(II) chloride (greater than 0.2 M) the
species associated with the yellow colour (A. = 420 nm) are not favoured (Figure 5.6, d) This
is seen in the decreased intensity of the peak at 420 nm at these higher tin(II) chloride
concentrations. The rate of formation of the species that are associated with the green colour
(A.= 636 nm) are also not favoured at these higher concentrations of tin(II) chloride.
Species associated with the blue colour (A. = 590 nm) are favoured in intermediate tin(II)
chloride concentrations as seen in Figure 5.6 (b and c) whilst at higher concentrations, a
notable decrease in the intensity of the peak at 590 nm is found. At low tin(II) chloride
concentrations (0.05 M), virtually no peak at 590 nm can be seen in Figure 5.6 (a). Evidence
of the formation of the red colour (A.= 355 nm) is seen in Figure 5.6 (c and d) as the side of
the absorption band. Species associated here are formed preferentially to those asso<;:iated with
the yellow colour.
144
~~~--------- --··
145
Flow-Injection Analysis of the Platinum-Group Metals
Figure 5.6 Absorption response surface maps for a solution of 100 ~g.cm·3 Pd(I/) as
recorded using a stop-flow approach. The letters refer to the tin(Il) chloride concentration
used; viz. (a) 0.05 M, (b) 0.1 M, (c) 0.2 M, and (d) 0.4 M tin(!!) chloride.
145
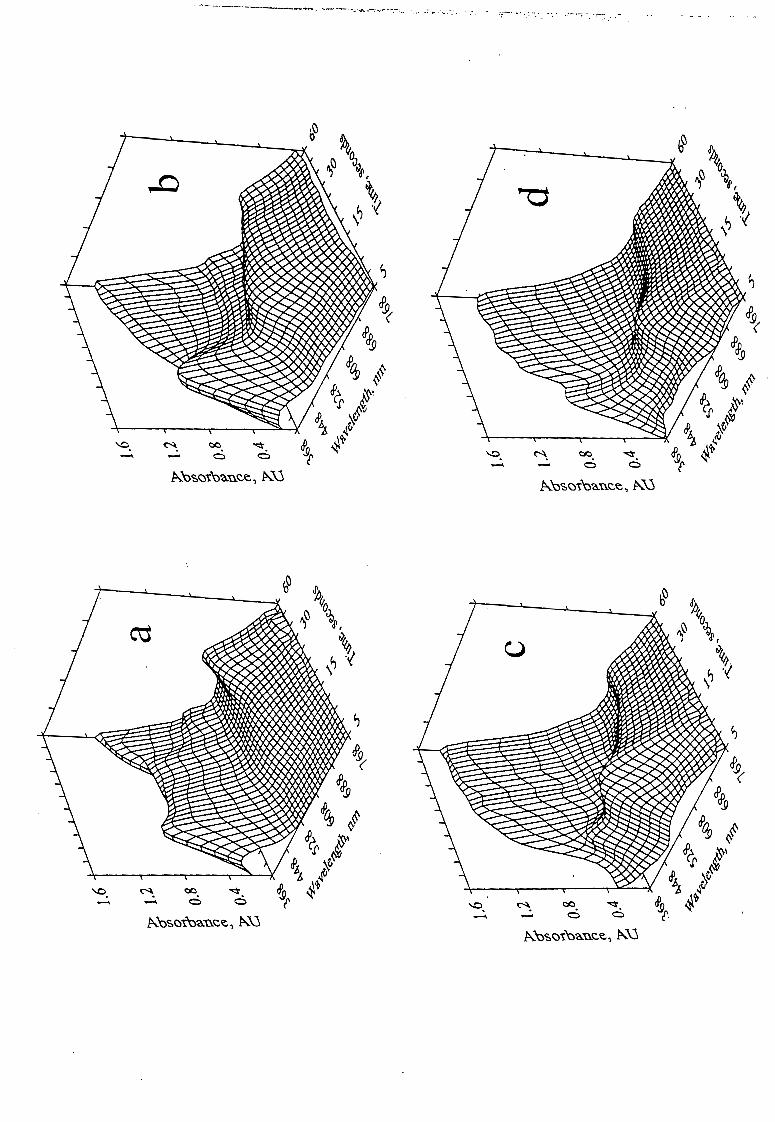
···---·-------..:..,.- ..... ---~~---;....r.--.· ...... -:-._ · .... ; .., .· ... .-:. ~:--· ~. . . . .. ·.- ·~ .. ··-:: .· . -
~~ b~ \ 0
~~ v~ ~~ 'bJI r
011,
\ "0 \ "' ·:( "' ·:( \ \
1
" f9 <fu < < Jlf9 Jl~
~ & ~ ~ ~ l
~ fc, ~~ Jlc} f J' ~~
~ :-..,e, cP. :-...~~ ~ .._v.;
~ ~ N 00 ~ &. ~reo '-0. N. 00 ~ 61 ~~
'-0. 6 ~ \(
6 (' - 0 r - 0
~b<:.Q~ban.ce, ~\j ~b<:.Q~ban.ce, ~\j
'-0. oo. ~. - 0 0 00 ~. 6 0
Flow-Injection Analysis of the Platinum-Group Metals '
The HCl concentration showed a marked effect on colour development. The rate of
formation of the species associated with the blue and green colours are severely inhibited,
however, the formation of the yellow colour remains unchanged, when the acid concentration
is increased, to a maximum of 4 M HCl. No subsequent decrease of absorbance is found at
420 nm when strongly acidic solutions of 4 M HCl are used. This suggests that the yellow
species favour higher acidities and any changes in the complex nature occur very slowly under
these conditions. In 1 M HCl, species associated with the yellow colour are rapidly converted
to those associated with the green colour. This type of observation is important when
considering the possible chemical composition of the species in solution.
A study as to whether the H+ or the cr ion was the contributing factor to this
phenomenon is reported. Increasing the concentration of H+ ion to 3 M by preparing all
solutions using perchloric acid showed no significant effect on the response. The fact that
changes in H+ ion concentration do not affect the colour formation is evidence that the chloro
complexes of the palladium and tin(II) species are involved in the reactions. Tin(II) has a
propensity to form labile chloro-complexes. The concentration of these in solution affect the
resulting complex formation.
The effect of the cr ion concentration was the most marked. The intensity of the
absorption bands decrease as the cr concentration is increased above 1.5 M (the H+
concentration being kept constant). This may be explained by a consideration of the chloro
species which are likely to be formed in equilibria.
SnC1 2 + CI-
SnCI- + CI-3
'
' S nC I 2 -4
At high cr concentration the above equilibria would be shifted to the right favouring
formation of the SnCl/- species which is not known to form complexes with palladium. This
effect was observed at cr concentrations greater then 1.5 M.
146
!'.- -.-.: ~ .. '7"':..- • :-
~.--~~ ...... _. __ ,.:._ ·--·~-~--- -~-
Flow-Injection Analysis of the Platinum-Group Metals
This is also a feasible explanation for the finding that higher HCl concentrations reduce
the formation of both the blue and green colours. The replacement of the cr ligand from the
co-ordination sphere of the tetrachloropalladate(II) species, PdCl/-, on reaction with the
SnCh- moiety, may also be inhibited by high concentrations of the cr ion. This result<; in a
reduction of the colour intensity.
Furthermore, on the basis of these observations, it is proposed that the yellow colour
may be attributed to a species having fewer SnCh- than cr ligands surrounding the palladium
central ion. This is seen since increased concentration of tin(II) chloride results in a decrease in
the intensity of the yellow colour at 420 nm. Higher concentrations of tin(II) chloride would
presumably favour species having more SnCh- ligands. As the yellow colour forms first when
tin(II) chloride is added, the replacement of at least a single cr ion from the co-ordination
sphere would be expected. The replacement of more cr ligands would be expected to be
inhibited in higher concentrations of HCI. The finding that the yellow colour is the most stable
in high HCl concentrations suggests that the species associated with the yellow colour could
well be of the form [PdCh(SnCh)f. An NMR study would be necessary to substantiate this
postulate.
The red and blue colours are attributed to intermediate complexes as their colour
formation depends critically on reaction conditions. The species associated with the green
colour could be expected to have more SnCh- than cr ligands. At higher concentration of
tin(II) chloride the rate of green colour formation at 636 nm is inhibited, whilst no significant
change is found in the case of the peak at 380 nm. The reaction, nevertheless, does occur and
exemplifies the stability of species associated with the green colour. The possibility of several
species existing simultaneously is evident by considering the number of overlapping absorption
bands.
The complexes associated with the green colour are stable for a relatively long period of
time before decomposition to a brown colloid. The fact that solutions containing these
complexes obey the basic law of light absorption (Table 5.4) at several tin(II) chloride
concentrations indicates the existence of a species with a constant composition. The molar
absorptivity of species yielding the green colour in 0.5 M tin(II) chloride was calculated to be
of the order of 1500 dm3.mor1.cm·1•
147
___ .:........;._~. ~--~-~--""'---""'·. ---
Flow-Injection Analysis of the Platinum-Group Metals
The molar absorptivity is dependant on the reaction time and reaction conditions.
Manipulation of these could result in an increase of the molar absorptivity, however, long
residence times for samples in FIA are undesirable. The increased time per experiment lowers
the number of samples per hour that may be analysed. The sensitivity does compare
favourably with the batch method where a molar absorptivity of 2800 dm3.mor1.cm-1 is found
after more than 20 minutes contact time.14
Conclusive support that the species associated with the green colour are in fact true
species and should not be associated with the brown hydosol is evident when comparisons with
the tin(II) bromide system are made. If these species do indeed give rise to a colloidal material
then the peak at 636 nm would be expected to remain in the same position if HBr replaced
HCI, and tin(II) bromide replaced tin(II) chloride. This is however not the case. The
wavelength of the absorption maximum in chloride medium (f.. = 636 nm) shifts to a longer
wavelength (f..= 710 nm) in the bromide medium. The spectrum is similar except for the shift
to longer wavelengths. Since bromine has a lower ionisation potential than that of chlorine,
replacement of the chloride atoms in complexes possibly in solution, such as [PdCl4_0 (SnCh)nf
(n = 1 to 4), 14 with bromide would result in a shift to longer wavelengths.
The above discussion of the complex chemistry reveals the power of spectral analysis for
qualitative, as well as quantitative, analysis. A platform for future work to study these
complex species and interactions has been established.
5.2.2 Visible Spectra of the Palladium-Tin(!!) Chloride Complexes
Palladium reacts rapidly with tin(II) chloride to give a series of colour changes,
corresponding to complex species forming and equilibrating. The transient species are
unstable. The solutions containing species yielding the green colour obey the basic law of light
absorption across the whole visible spectrum and, therefore, only this colour was used
analytically.
The spectra of the palladium complex with tin(II) chloride in 1 M HCI are shown in
Figure 5.7. Absorption maxima at 380 nm and 636 nm are evident. A shoulder exists at
460 nm and a plateau in the range 500 nm to 530 nm.
148
Flow-Injection Analysis of the Platinum-Group Metals
Figure 5. 7 Absorption spectra of palladium-tin(!!) chloride complexes recorded on
passage through the flowcell using a tin(Il) chloride concentration of 0.05 M. The spectra
correspond to (1) 100, (2) 80, (3) 60, (4) 40, (5) 20, (6) 10, and (7) 5 ~g.cm-3 Pd(Il).
149
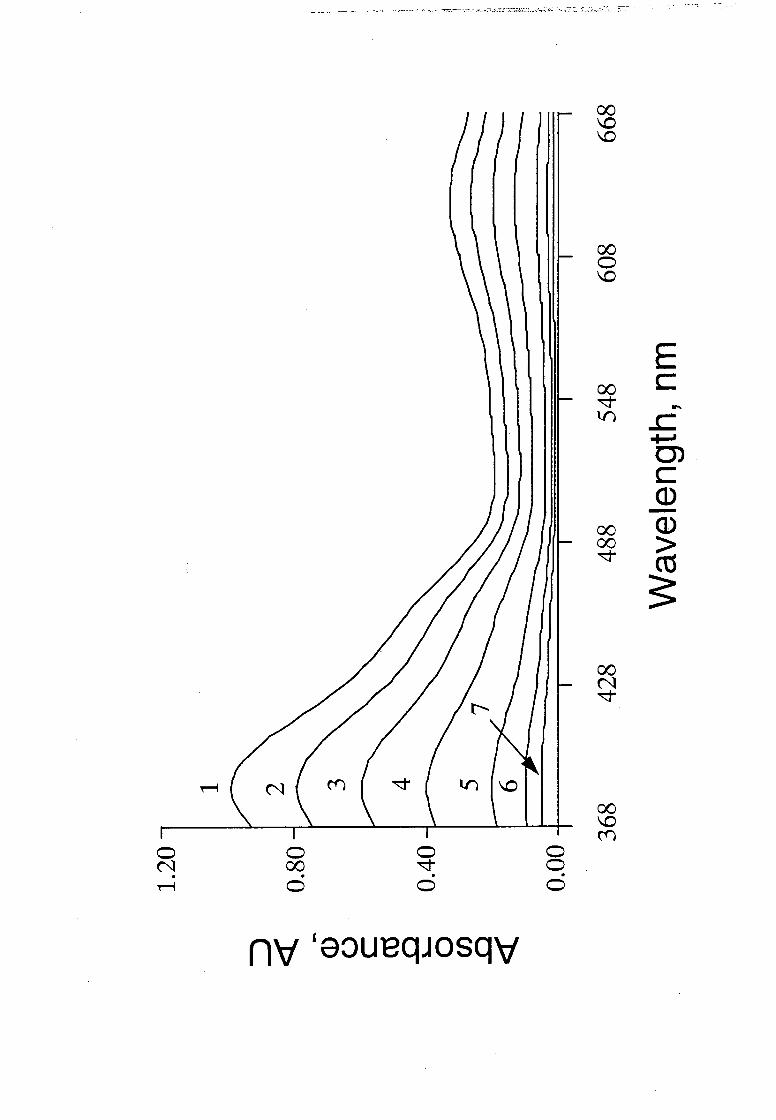
0 0 0 0 N 00 ~ 0 . . . . ~ 0 0 0
00 0 \.0
00
"""' lr)
00 00
"""'
00 \.0 ('f')
E c
..... ..c ......., C) c Q) -Q) > a1 s
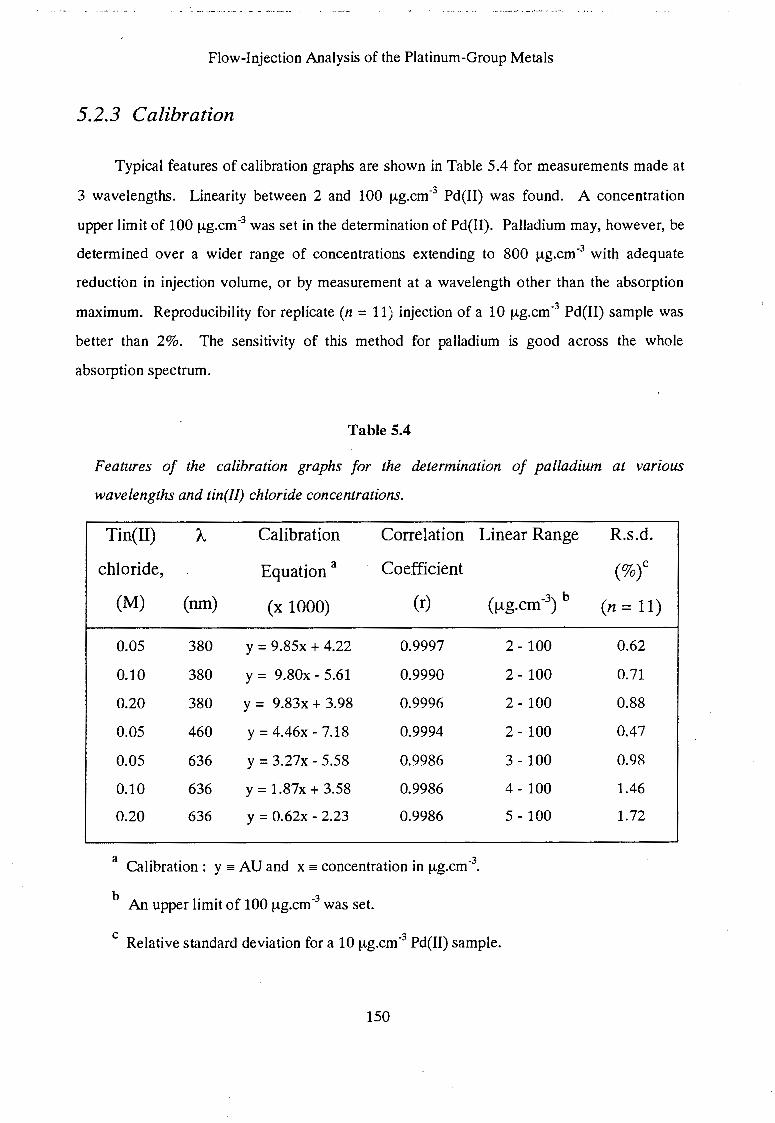
Flow-Injection Analysis of the Platinum-Group Metals
5.2.3 Calibration
Typical features of calibration graphs are shown in Table 5.4 for measurements made at
3 wavelengths. Linearity between 2 and 100 ~g.cm-3 Pd(II) was found. A concentration
upper limit of 100 ~g.cm-3 was set in the determination of Pd(ll). Palladium may, however, be
determined over a wider range of concentrations extending to 800 ~g.cm-3 with adequate
reduction in injection volume, or by measurement at a wavelength other than the absorption
maximum. Reproducibility for replicate (n = 11) injection of a 10 ~g.cm-3 Pd(II) sample was
better than 2%. The sensitivity of this method for palladium is good across the whole
absorption spectrum.
Table 5.4
Features of the calibration graphs for the determination of palladium at various
wavelengths and tin(Il) chloride concentrations.
Tin(II) A Calibration Correlation Linear Range R.s.d.
chloride, Equation a Coefficient (%)c
(M) (run) (x 1000) (r) (!-lg.cm-3) b (n=ll)
0.05 380 y = 9.85x + 4.22 0.9997 2- 100 0.62
0.10 380 y = 9.80x- 5.61 0.9990 2- 100 0.71
0.20 380 y = 9.83x + 3.98 0.9996 2- 100 0.88
0.05 460 y = 4.46x- 7.18 0.9994 2- 100 0.47
0.05 636 y = 3.27x- 5.58 0.9986 3- 100 0.98
0.10 636 y = 1.87x + 3.58 0.9986 4- 100 1.46
0.20 636 y = 0.62x - 2.23 0.9986 5- 100 1.72
a Calibration: y =AU and x =concentration in ~g.cm-3 •
· b An upper limit of 100 ~g.cm-3 was set.
c Relative standard deviation for a 10 ~g.cm-3 Pd(II) sample.
150
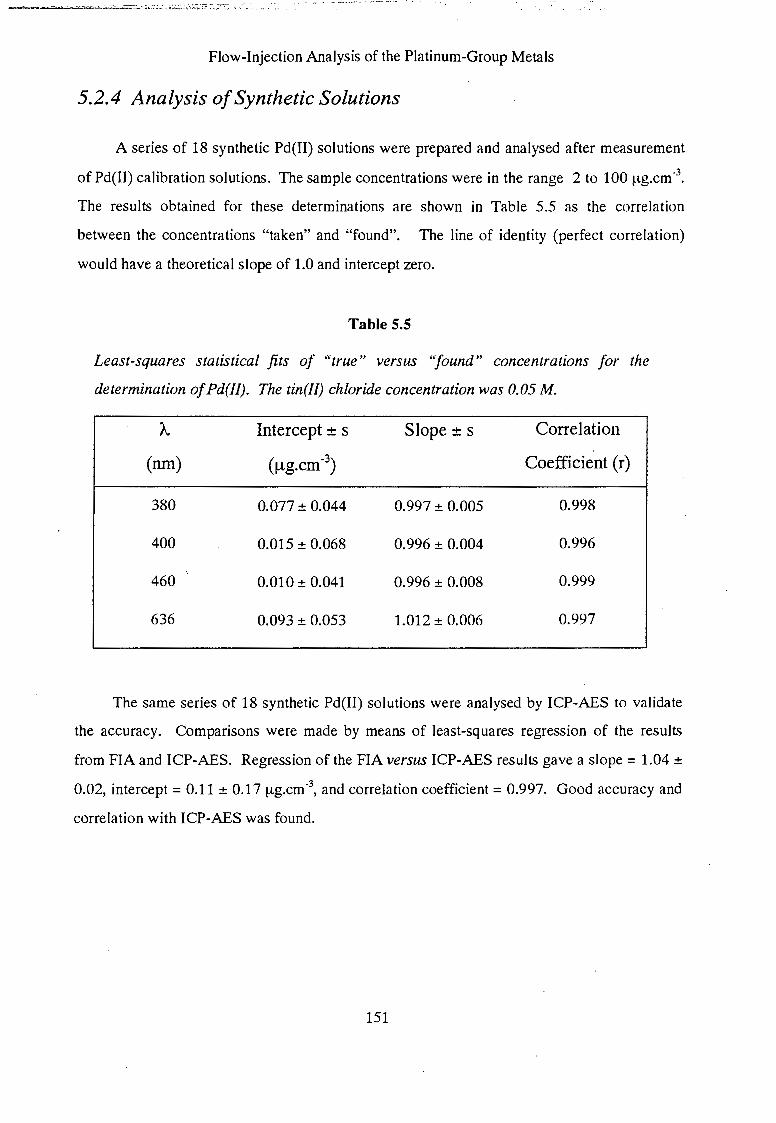
Flow-Injection Analysis of the Platinum-Group Metals
5.2.4 Analysis of Synthetic Solutions
A series of 18 synthetic Pd(II) solutions were prepared and analysed after measurement
of Pd(II) calibration solutions. The sample concentrations were in the range 2 to 100 ~tg.cm-3 •
The results obtained for these determinations are shown in Table 5.5 as the correlation
between the concentrations "taken" and "found". The line of identity (perfect correlation)
would have a theoretical slope of 1.0 and intercept zero.
Table 5.5
Least-squares statistical fits of "true" versus "found" concentrations for the
determination of Pd(//). The tin(//) chloride concentration was 0.05 M.
"A Intercept ± s
(run) (!J.g.cm "3)
380 0.077 ± 0.044
400 0.015 ± 0.068
460 0.010 ± 0.041
636 0.093 ± 0.053
Slope± s
0.997 ± 0.005
0.996 ± 0.004
0.996 ± 0.008
1.012 ± 0.006
Correlation
Coefficient (r)
0.998
0.996
0.999
0.997
The same series of 18 synthetic Pd(II) solutions were analysed by ICP-AES to validate
the accuracy. Comparisons were made by means of least-squares regression of the results
from FIA and ICP-AES. Regression of the FIA versus ICP-AES results gave a slope = 1.04 ±
0.02, intercept= 0.11 ± 0.17 ~g.cm-3, and correlation coefficient= 0.997. Good accuracy and
correlation with ICP-AES was found.
151
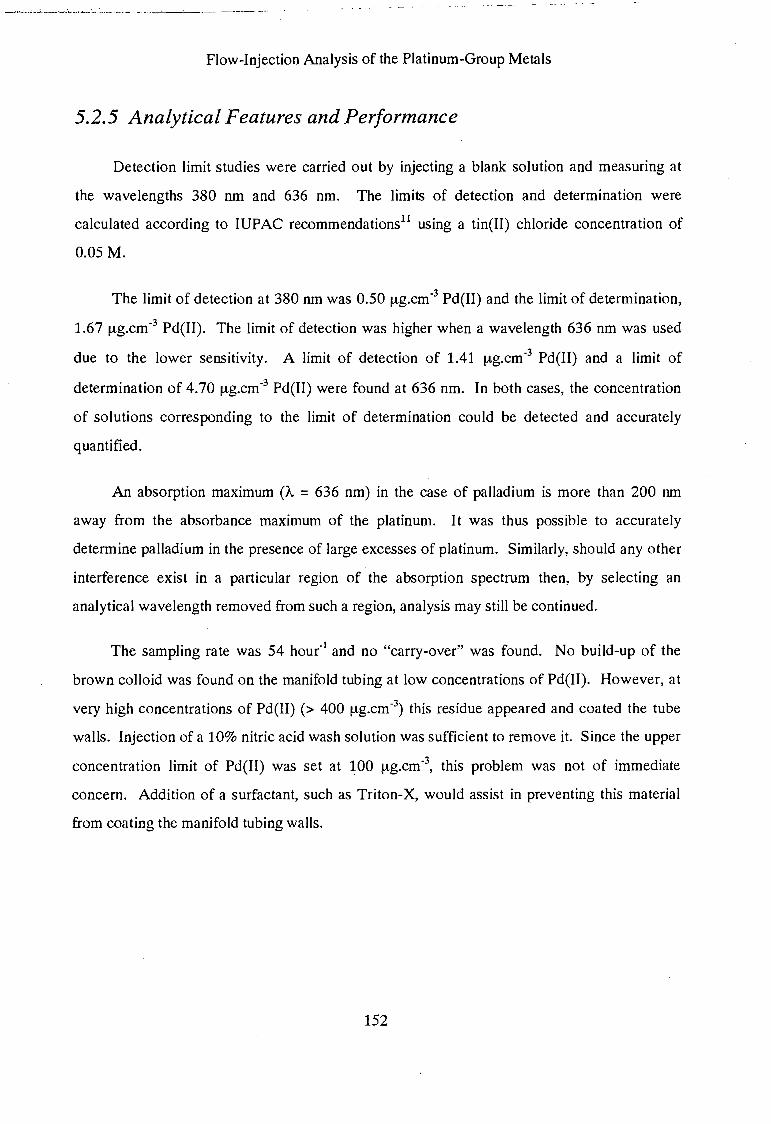
Flow-Injection Analysis of the Platinum-Group Metals
5.2.5 Analytical Features and Performance
Detection limit studies were carried out by injecting a blank solution and measuring at
the wavelengths 380 nm and 636 nm. The limits of detection and determination were
calculated according to IUPAC recommendations11 using a tin(II) chloride concentration of
0.05M.
The limit of detection at 380 nm was 0.50 !Ag.cm·3 Pd(II) and the limit of determination,
1.67 ~-tg.cm-3 Pd(II). The limit of detection was higher when a wavelength 636 nm was used
due to the lower sensitivity. A limit of detection of 1.41 ~-tg.cm-3 Pd(II) and a limit of
determination of 4.70 ~-tg.cm-3 Pd(II) were found at 636 nm. In both cases, the concentration
of solutions corresponding to the limit of determination could be detected and accurately
quantified.
An absorption maximum (A. = 636 nm) in the case of palladium is more than 200 nm
away from the absorbance maximum of the platinum. It was thus possible to accurately
determine palladium in the presence of large excesses of platinum. Similarly, should any other
interference exist in a particular region of the absorption spectrum then, by selecting an
analytical wavelength removed from such a region, analysis may still be continued.
The sampling rate was 54 hour-1 and no "carry-over" was found. No build-up of the
brown colloid was found on the manifold tubing at low concentrations of Pd(II). However, at
very high concentrations of Pd(II) (> 400 1-tg.cm-3) this residue appeared and coated the tube
walls. Injection of a 10% nitric acid wash solution was sufficient to remove it. Since the upper
concentration limit of Pd(II) was set at 100 ~-tg.cm-3, this problem was not of immediate
concern. Addition of a surfactant, such as Triton-X, would assist in preventing this material
from coating the manifold tubing walls.
152
Flow-Injection Analysis of the Platinum-Group Metals
5.3 The Determination of Rhodium
Preliminary FIA experiments using tin(II) chloride as a reagent for rhodium were
performed. As a result of the slow kinetics of this chemical system, extended reaction time and
heating of the reacting solution was required to ensure adequate colour development. This
was implemented by introducing a stop-flow period when the sample zone was in the reaction
coil. Despite this increase of the residence (reaction) time, and heating of the reaction coil
within a temperature controlled water bath, the sensitivity was not adequate for a suitable FIA
method. Poor reproducibility of these measurements further bedevilled the application of
tin(II) chloride in the determination of rhodium.
An alternative reagent, tin(II) bromide, 15 was then tested. Colour formation resulted
without the requirement of special reaction conditions such as elevated temperature or
extended reaction time. The same FIA manifold used for the determination of platinum and
palladium was used directly for rhodium. The sensitivity found when tin(II) bromide was used
was adequate for development of a FIA method.
5.3.1 Visible Spectra of the Rhodium-Tin(!!) Bromide Complexes
The reaction of tin(II) bromide with rhodium in hydrobromic acid results in a red-orange
colour (A. = 468 nm) that develops at room temperature. A second peak forms after several
minutes at 408 nm and appears as a yellow colour. The red-orange colour was used
analytically to develop a FIA method for the rapid determination of traces of rhodium using
tin(II) bromide.
A stop-flow experiment enabled the development of the red-orange colour to be
monitored over a period of time (Figure 5.8). Similar stop-flow surface plots were obtained
over a wide range of reagent concentrations.
153
-·-- ···-·--~-.---...---------~--:--·-. . ::--.!,.,0:..:.:..::. ---- ·-~-
Flow-Injection Analysis of the Platinum-Group Metals
Figure 5.8 The absorption spectra of a 100 ~g.cm-3 Rh(JII) solution as recorded on
stopping the flow of the sample within the flowcell. The rapid kinetics of the reaction of
rhodium( III) with tin( II) bromide in an acidic HBr medium is clearly evident.
154
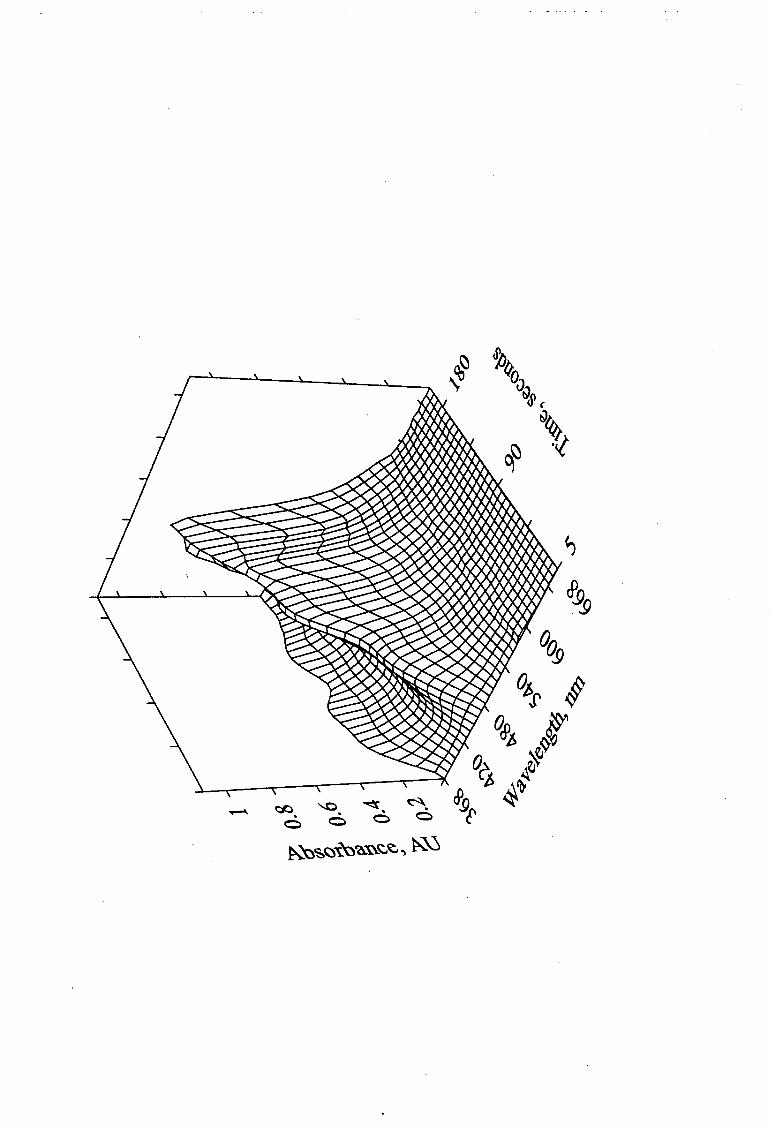

·- ·--·-- -- -.:...~.-;-:;::::.-:.!.:_-· ...
Flow-Injection Analysis of the Platinum-Group Metals
5.3.2 Calibration
Typical features of the calibration graphs are shown in Table 5.6. Linearity was found
to levels of 100 ~-tg.cm-3 Rh(III). As before, an upper limit of 100 1-tg.cm-3 was set for the
determination of Rh(III). The reproducibility for replicate injection (n = 11) of a solution of
5 1-tg.cm-3 Rh(III) was good. The excellent sensitivity for rhodium at higher tin(II) bromide
concentrations is noteworthy. The absorption spectra, recorded on passage through the
flowcell, for three Rh(III) standard solutions are shown in Figure 5.9.
Table 5.6
Features of the calibration graphs for the determination of Rh(lll) at various
wavelengths and tin(II) bromide concentrations.
Tin(II)
bromide,
(M)
0.05
0.05
0.20
0.40
Calibration
Equation a
(nm) (x 1000)
·. 408 y = 3.29x + 0.40
468 y = 5.50x + 1.21
468 y = 13.90x + 3.64
468 y = 18.42x + 7.42
Correlation Linear Range
Coefficient
(r)
0.9995 0.5- 100
0.9994 0.5- 100
0.9987 1- 100
0.9939 1- 100
a Calibration: y =AU and x =concentration in ~-tg.cm-3 •
b An upper limit of 100 !-tg.cm-3 was set.
c Relative standard deviation for a 5.0 1-tg.cm-3 Rh(III) sample.
155
R.s.d.
(%)c
(n = 11)
0.93
0.56
1.05
0.79
Flow-Injection Analysis of the Platinum-Group Metals
Figure 5.9 Absorption spectra for (1) 100, (2) 50, and (3) 20 ~g.cm-3 Rh(III) recorded
on reaction with 0.2 M tin(Il) bromide in 1 M HEr.
156
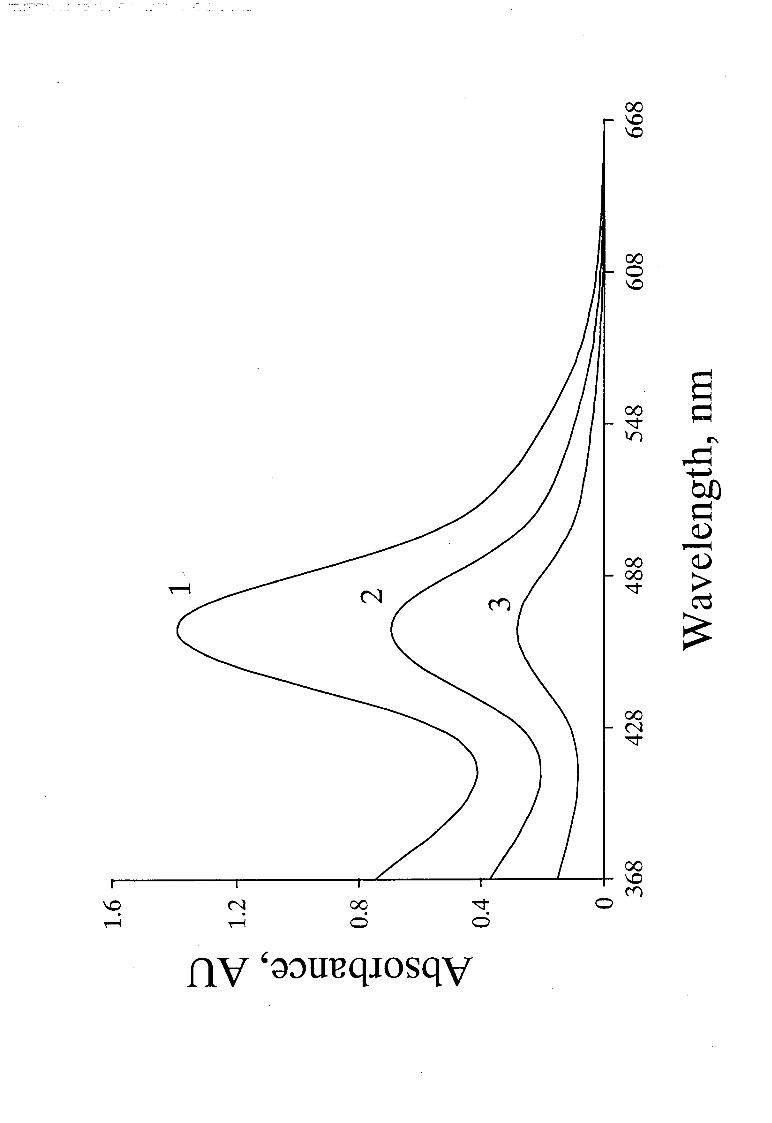
\0 N 00 """" 0 0 0 0
0 0
00 \0 \0
00 0 \0
00
"""" tn
00 00
""""
a ~ ~
~ ~
bl) ~ (J) ~
(J)
> ~
~
Flow-Injection Analysis of the Platinum-Group Metals
5.3.3 Analysis of Synthetic Solutions
A series of 12 synthetic Rh(lll) solutions were prepared and analysed after measurement
of Rh(III) calibration solutions. The sample concentrations in the range 1 to 100 f-tg.cm -3 were
analysed. These results are shown in Table 5.7 as the correlation between the concentrations
"taken" and "found". The line of identity (perfect correlation) would have a theoretical slope
of 1.0 and intercept zero. The correlation between the "true" and "found" concentrations
corresponded well at the three wavelengths shown.
Table 5.7
Least-squares statistical fits of "true" versus "found" concentrations for the
determination of Rh(lll). The tin(!!) bromide concentration used was 0.2 M.
A. Intercept ± s Slope± s
(run) (!J.g.cm-3)
468 0.039 ± 0.053 0.998 ± 0.003
408 -0.015 ± 0.068 1.011 ± 0.004
500 -0.064 ± 0.081 0.990 ± 0.008
5.3.4 Analytical Features and Performance
Correlation
Coefficient (r)
0.998
0.996
0.991
The limit of detection, 11 at a wavelength of 468 nm, and using a tin(II) bromide
concentration of 0.2 M, was calculated as 0.19 f-tg.cm-3 Rh(III), and the limit of
detennination11 0.64 f-tg.cm-3 Rh(III). The concentration of solutions corresponding to the
limit of determination could be detected and quantified. No "carry-over" between
consecutively injected samples of high (80 f..tg.cm-3) and low (5 f..tg.cm-3
) concentrations of
rhodium was found. The sampling rate was 54 hour"1•
157
Flow-Injection Analysis of the Platinum-Group Metals
5.4 Preliminary Interference Study
The platinum-group metals occur in small quantities in deposits of copper-nickel sulphide
ore. The ore concentrate produced after pre-treatment by fire assay and other mineralogical
means consists of about 50% PGMs, the remainder being gold, copper, nickel and base metals
such as iron, cobalt, magnesium and aluminium, amongst others.16 High quantities of iron and
lead would be expected in catalytic converters. High levels of tellurium may also be found
after precipitation of the PGMs with tellurium.16
Since these base metals are likely to be in solutions of real samples, it is important to
determine the tolerance of analytical methods for these interferents, and whether approaches
circumventing their interference are possible. On this note, a preliminary evaluation of
potential interferences was made for the reaction of platinum and palladium with tin(II)
chloride.
The potential interferences for the reaction between tin(II) chloride and the PGMs may
be roughly grouped into three categories, viz.
(i) oxidative interferences, leading to competitive consumption of the reagent,
tin(II) chloride,
(ii) absorptive interferences, having high molar absorptivities in the wavelength
region of interest, and
(iii) non-selective reaction of tin(II) chloride with substances other than the PGMs.
In general, the established high selectivity of the reaction of tin(II) chloride with the
PGMs17'18 makes interferences of type (iii) unlikely. However, interference from other PGMs
and Au(l/111) may be expected.
Since the carrier stream is 1 M in HCl, substantial interferences of the type (i) and (ii)
from the first row transition metals are unlikely, with the possible exception of Fe(III) and
Cr(VI) (as Cr20/-) which would be present in relatively high concentrations.
158
. ·.·.- ·-... ·:-~ -· ..
Flow-Injection Analysis of the Platinum-Group Metals
Anions such as sol-, N03-, CI04-, and Pol- do not interfere at relatively high levels
( < 0.1 M), although bromide and iodide ions should be kept to a minimum. Gross quantities of
nitric acid may be tolerated as this acid may be expelled by repeated evaporation with
hydrochloric acid prior to the residue being taken up in hydrochloric acid.
5.4.1 Base Metal Interferences
The determination of platinum and palladium by the proposed FIA method tolerates
many transition metals remarkably well. Interference tolerances at 20 !J.g.cm-3 levels for Pt(IV)
and Pd(II) were investigated. The interferent concentration that could be handled was such
that the response did not differ by more than 2% from that of a pure standard solution. The
maximum amount of each interferent tested was 400 !J.g.cm-3 for Pt(IV) and 200 !J.g.cm-3 for
Pd(II), unless otherwise specified. Each experiment was performed in triplicate.
The tolerance levels, shown in Table 5.8, were better than those previously reported 19,
presumably due to the merging configuration and the subsequent dilution of the interferents'
effect. It is clear that platinum and palladium can be measured in the presence of relatively
large amounts of the first row transition elements; particularly for Cr(VI) and Fe(III). The
colour inherent in these solutions is seen to decrease in intensity. This is due to reduction to
Cr(III) and Fe(II) on addition of tin(II) chloride.
159
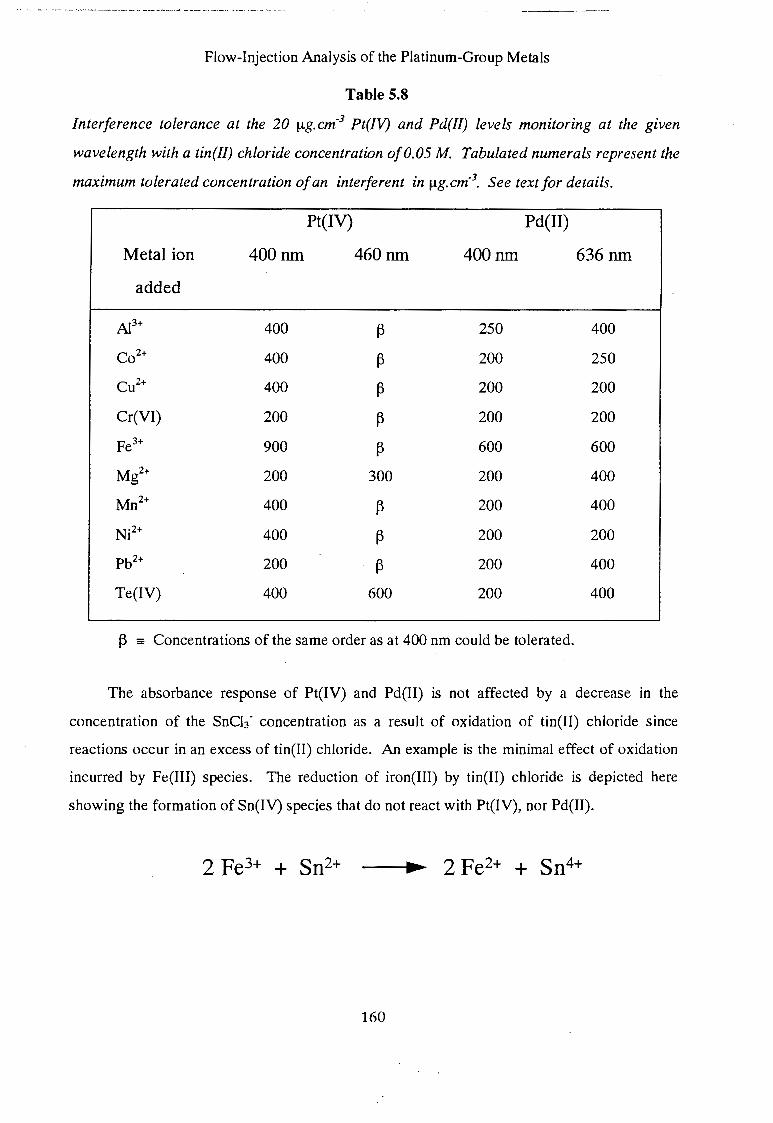
Flow-Injection Analysis of the Platinum-Group Metals
Table 5.8
Interference tolerance at the 20 f,.lg.cm·3 Pt(IV) and Pd(//) levels monitoring at the given
wavelength with a tin(//) chloride concentration of0.05 M. Tabulated numerals represent the
maximum tolerated concentration of an interferent in f,.lg.cm·3• See text for details.
Metal ion
added
Cr(VI)
Fe3+
Mgz+
Mn2+
Ni2+
Pb2+
Te(IV)
Pt(IV)
400nm
400
400
400
200
900
200
400
400
200
400
Pd(II)
460nm 400nm
~ 250
~ 200
~ 200
~ 200
~ 600
300 200
~ 200
~ 200
~ 200
600 200
~ = Concentrations of the same order as at 400 nm could be tolerated.
636nm
400
250
200
200
600
400
400
200
400
400
The absorbance response of Pt(IV) and Pd(II) is not affected by a decrease in the
concentration of the SnCb- concentration as a result of oxidation of tin(II) chloride since
reactions occur in an excess of tin(II) chloride. An example is the minimal effect of oxidation
incurred by Fe(III) species. The reduction of iron(III) by tin(II) chloride is depicted here
showing the formation of Sn(IV) species that do not react with Pt(IV), nor Pd(II).
2 Fe3+ + Sn2+ ----... ~ 2 Fe2+ + Sn4+
160
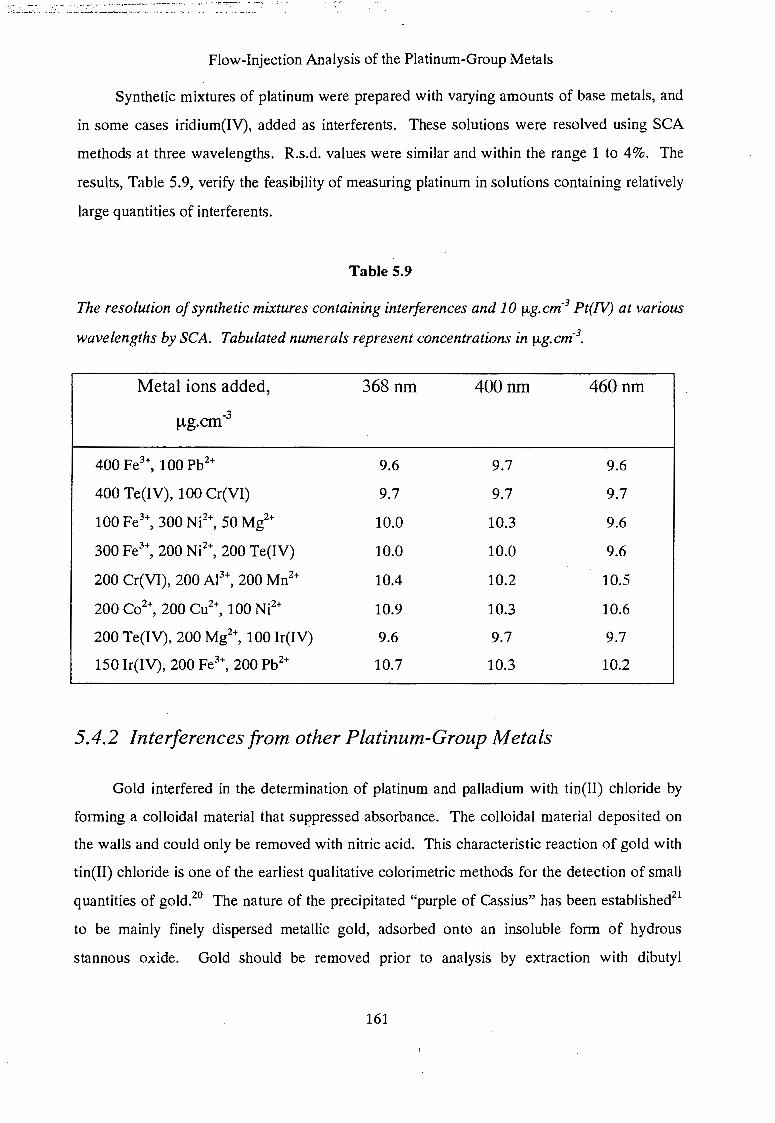
- •• ----"---.--~--··R----~- .--:"- ---.--:-:-.• .- •f'"•~ .-! ___ ,_-___ __ ·_: __ .,.~_.:._.:_.: .. _______ ~-·--· -
Flow-Injection Analysis of the Platinum-Group Metals
Synthetic mixtures of platinum were prepared with varying amounts of base metals, and
in some cases iridium(IV), added as interferents. These solutions were resolved using SCA
methods at three wavelengths. R.s.d. values were similar and within the range 1 to 4%. The
results, Table 5.9, verify the feasibility of measuring platinum in solutions containing relatively
large quantities of interferents.
Table 5.9
The resolution of synthetic mixtures containing interferences and 10 f.A.g.cm-3 Pt(N) at various
wavelengths by SCA. Tabulated numerals represent concentrations in f.A.g.cm-3•
Metal ions added,
~J.g.cm-3
400 Te(IV), 100 Cr(VI)
100 Fe3+, 300 Ni2+, 50 Mg2+
300 Fe3+, 200 Ni2+, 200 Te(IV)
200 Cr(VI), 200 A13+, 200 Mn2+
200 Co2+, 200 Cu2+, 100 Ni2
+
200 Te(IV), 200 Mg2+, 100 Ir(IV)
150 Ir(IV), 200 Fe3+, 200 Pb2+
368nm
9.6
9.7
10.0
10.0
10.4.
10.9
9.6
10.7
400nm
9.7
9.7
10.3
10.0
10.2
10.3
9.7
10.3
5.4.2 Interferences from other Platinum-Group Metals
460nm
9.6
9.7
9.6
9.6
10.5
10.6
9.7
10.2
Gold interfered in the determination of platinum and palladium with tin(II) chloride by
forming a colloidal material that suppressed absorbance. The colloidal material deposited on
the walls and could only be removed with nitric acid. This characteristic reaction of gold with
tin(II) chloride is one of the earliest qualitative colorimetric methods for the detection of small
quantities of gold.20 The nature of the precipitated "purple of Cassius" has been established21
to be mainly finely dispersed metallic gold, adsorbed onto an insoluble form of hydrous
stannous oxide. Gold should be removed prior to analysis by extraction with dibutyl
161
Flow-Injection Analysis of the Platinum-Group Metals
"Carbitol"22 or amyl acetate from solutions of hydrochloric acid.23 The PGMs remain in the
aqueous phase.
It was found that the primary interferences in the determination of platinum with tin(II)
chloride were other PGMs, such as iridium, ruthenium, and rhodium. Methods to handle such
interferences are outlined in Chapter 6.
5.5 Conclusions
Single component FIA methods were successfully developed for the determination of
traces of platinum, palladium, and rhodium. Platinum and palladium were determined using
tin(II) chloride, and rhodium using tin(II) bromide. Excellent recoveries for these methods
were obtained when synthetic samples were analysed. Investigation of the rhodium-tin(II)
chloride reaction showed that the kinetics of this reaction were not suited to FlA.
The investigation into the nature and composition of the complexes causing the colour
changes on reaction of palladium with tin(II) chloride affords conclusive evidence to the
existence of uncharacterised, transient species that give rise to a blue colour. Based on the
experimental evidence found in this study, it is stated that true complexes give rise to the olive
green colour when palladium reacts with tin(II) chloride in hydrochloric acid solution.
A consideration of interferences in the developed FIA methods showed the high
selectivity of tin(II) chloride for the PGMs. Good tolerance of the FIA methods for base
metals is clear, however, the tolerance of other PGMs is poor.
In order to determine platinum, palladium, and rhodium in the presence of each other,
and in the presence of other PGMs, it is necessary to either separate the PGMs from one
another, or to develop mathematical approaches that may accommodate such interferences.
The latter approach was further investigated in this work. To perform such mathematical
manipulation, it is imperative to move from the single wavelength mode of measurement into a
multi-wavelength mode. The application of these single component methods to multi
component analysis will be outlined in the next chapter.
162
Flow-Injection Analysis of the Platinum-Group Metals
5.6 References
1. Meyer, AS., and Ayres, G.H., J. Am. Chern. Soc., 1955, 77, 2671.
2. Elizarova, G.L., and Matrienko, L.G., Russ. J. Inorg. Chern., 1973, 18, 254.
3. Ayres, G.H., and Alsop, J.H., Anal. Chern., 1959, 31, 1135.
4. Maynes, A.D., and McBryde, W.A.E., Analyst, 1954, 79, 230.
5. Young, J .F., Gillard, R.D., and Wilkinson, G., J. Chern. Soc., 1964, 5176.
6. Berman, S.S., and Ironside, R., Can. J. Chern., 1958,36, 1151.
7. Moodley, K.G., and Nicol, M.J.,J. Chern. Soc. Dalton, 1977, 239.
8. Wilson, W.L., Holt, M.S., and Nelson, J.H., Chern. Rev., 1989, 89, 11.
9. Sandell, E.B., "Colorimetric Determination of Traces of Metals", 3rd edn.,
lnterscience, New York, 1959.
10. Meyer, AS., and Ayres, G.H.,J. Am. Chern. Soc., 1955, 77, 2671.
11. Analytical Methods Committee,Analyst, 1987, 112, 199.
12. Ayres, G.H., and Meyer, AS., Anal. Chern., 1951, 23(2), 299.
13. Harrington, D.E., Atomic Absorption Newsletter, 1970, 9(5), 106.
14. Shlenskaya, V.I., Biryukov, A.A., and Moryakova, L.N., Russ. J. Inorg. Chern., 1969,
4, 256.
15. Pantini, F., and Piccardi, G., Anal. Chim. Acta, 1960, 22, 231.
16. Jones, E.A., National Institute for Metallurgy, Rep. S. Afr., 1971, No. 1260.
17. Brackenbury, K.F.G., et al., Polyhedron, 1987, 6, 71.
18. Ayres, H.G., and Meyer, AS., Anal. Chern., 1951, 23, 299.
19. Auer, D., and Koch, K.R.-, Talanta, 1993, 40(12), 1975.
20. Von Wagner, R., "Manual of Chemical Technology", J. and A. Churchill, London,
1904,452.
21. Schneider, E.A., Z. Anorg. Chern., 1894, 5, 80.
22. Palmer, R., et al., National Institute for Metallurgy, Rep. S. Afr., 1971, No. 976.
23. Lehner, V., and Kao, C.H., J. Phys. Chern., 1926,30, 126.
163
Flow-Injection Analysis of the Platinum-Group Metals
Chapter 6.
Multi-Component Analysis of the
Platinum-Group Metals
This chapter will serve two purposes. First, the promising application of multi
component analysis to the determination of the PGMs by FIA will be presented, along with
data in its support. And second, suggestions for a reasonable direction of future research in
the field of multi-component analysis will be given.
Multi-component analysis (MCA) methods have become increasingly important due to
their ability to resolve systems of two or more components. Such simultaneous determination
of a mixture of components from their absorption spectra, by means of a least-squares fit, has
led to the extension of the boundaries of FIA which were previously limited to single
component determinations. A consequence and noteworthy advantage of application of multi
wavelength detectors is that the complete absorption spectrum is available for quantitative
analysis. No additional time period is incurred in obtaining such data. Although large volumes
of multi-channel data are usually involved in MCA, the advent of powerful computers and
numerous mathematical procedures for handling data enables rapid resolution of mixtures.
In the previous chapter, FIA methods were developed for the rapid and single
component determination of platinum, palladium, and rhoQium using the tin(II) halides in
strongly acidic solution. This foundation is added to in this chapter as single component FIA
methods are incorporated into methods for multi-component determinations. The MCA
mathematical approaches introduced in Chapter 2, and the spectrophotometric data
manipulation software program that was outlined in Chapter 3, are used to develop such multi
component analysis methods.
It should be noted that this is by no means a complete study of MCA of the PGMs by
FlA. Several stumbling blocks in terms of the complex chemistry and instrumental limitations
need to be circumvented in order to make this use of MCA in FIA an accepted and useful
164
Flow-Injection Analysis of the Platinum-Group Metals
approach. The advantages, as well as problems associated with this endeavour, will be
discussed. The initial steps in the development of a suitable mathematical procedure to aid
wavelength selection for MCA are also described in this chapter.
6.1 The Determination of Platinum and Palladium in HCI
Having established the optimum conditions and found good analytical performance for
the single component determinations of platinum and palladium with tin(II) chloride, the
natural succession was to combine these two platinum-group metals and resolve their mixtures
by multi-component analysis.
The multi-component analysis of the platinum-palladium-tin(II) chloride chemical system
with a high speed scanning spectrophotometer exemplifies the transition from single
wavelength methods to multi-wavelength methods in the analysis of complex systems. The
resolution of binary mixtures of these elements covering a range of concentrations and
concentration ratios using various MCA methods was performed.
The MCA methods used are classical simultaneous linear equation determinations,
sequential determination of components, multi-wavelength linear regression analysis (MLRA)/
and a reference determination where the response of one component is computationally
removed. Although the latter method is not multi-component analysis in the true sense, it
nevertheless does involve two components (the response of one component is computationally
removed) and more than one wavelength. Each of these methods necessitates selection of
wavelengths, or a wavelength range, to enable accurate resolution of the mixture into its
component concentrations.
6.1.1 Wavelength Selection
During single component determinations the maximum absorption position, or a shoulder
position, are taken as the analytical wavelengths. Any errors made in taking these as analytical
wavelengths (viz. wavelength resettability imprecision) are kept to a minimum. However, one
wavelength is not adequate for resolution of a mixture. In MCA the wavelengths selected
165
Flow-Injection Analysis of the Platinum-Group Metals
should include the wavelengths that give higher absorbances for both components, or at least
for one component of a mixture.
The general criteria for the selection of analytical wavelengths (Section 2.2.4) are based
on an assumption that the uncertainty of measurement at each wavelength is similar. It is
important that the uncertainty of replicate absorbance measurement be low at the analytical
wavelength(s) so as to maintain precision and ensure accuracy. Similarly, any deviations from
a linear calibration suggests that Beer's law is not adhered to.
A plot of wavelength versus the relative standard deviation of replicate measurements at
that wavelength for platinum is shown in Figure 6.1. Responses at wavelengths greater than
480 nm had higher r.s.d. values due to lower sensitivity for platinum. This type of plot aids in
the selection of wavelength ranges. Wavelengths with a high r.s.d. for replicate measurements
were not used. A similar situation is found for palladium with the r.s.d. increasing above 2% in
regions of low sensitivity. Similarly, these wavelength regions were not used. The deviations
from linearity of calibration curves for platinum and palladium over the analytical wavelength
ranges used were negligible. The platinum calibrations had a correlation of 0.998, or better,
for the range 368 to 480 nm. Palladium calibrations had correlation of 0.997, or better, for the
range 368 to 640 nm.
The best way to find wavelengths that satisfy the requirements of larger spectral
absorptivities and large differences between components is to plot the quotient of the
absorptivities of the two components as a function of the wavelength. Regions, or points, of
unity indicate the same absorptivity for each component at that wavelength(s). Maxima and
minima signify regions of best resolution for the component being the numerator and
denominator respectively.
Figure 6.2 shows the regions of best resolution for platinum (the numerator in the
equation) to be near 484 nm, and for palladium (denominator) to be near 368 and 636 nm.
Two intersection points, with values of unity, show wavelengths of constant absorbance for
both platinum and palladium. A plateau, approximately 410 to 440 nm, exists where there is
similar spectral character in both components. These regions should be avoided as a high
degree of spectral difference is required for accurate mixture resolution.
166
Flow-Injection Analysis of the Platinum-Group Metals
Figure 6.1 Relative standard deviation (R.s.d., %) of quadruplicate injections of
platinum samples as a function of the wavelength to aid wavelength selection. The letters
correspond to concentrations of (a) 10 !lg.cm-3, and (b) so' !lg.cm-3 Pt(IV). R.s.d. values were
higher than 1.6% at wavelengths above 480 nm.
167
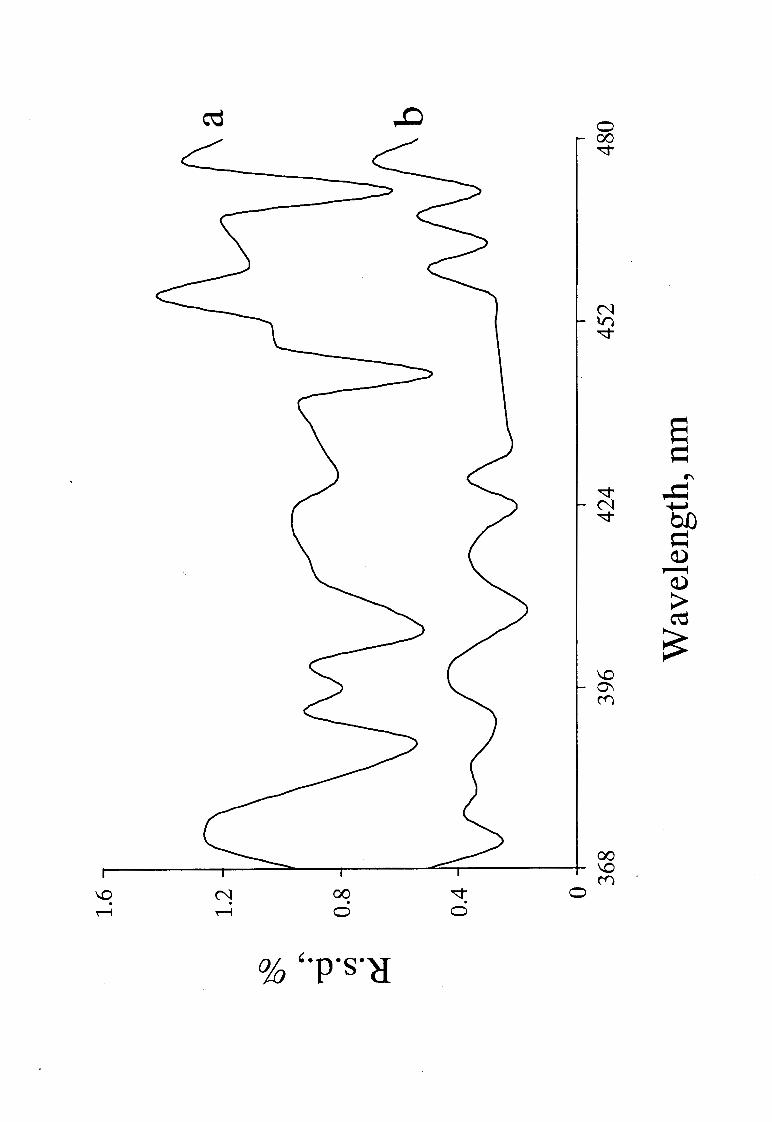
0 00
""'"
""'" N
""'"
\0 0\ C'f")
00 ~------~--~--~------~~-------+ \0
C'f")
\0 N 00 ""'"
0 . . . . 0 0
s ~
"' ,.d ~
b1J ~ d) ~ d)
> ro ~
Flow-Injection Analysis of the Platinum-Group Metals
Figure 6.2 Plot of the quotient of the absorptivities (a1,j and a2) as a function of the
wavelength, j, to show regions of maximum and minimum curve divergence. The curves
correspond to (1) quotient of the absorptivities, (2) 100 ~g.cm-3 Pd(Il), and (3) 100 ~tg.cm-3
Pt(IV).
168
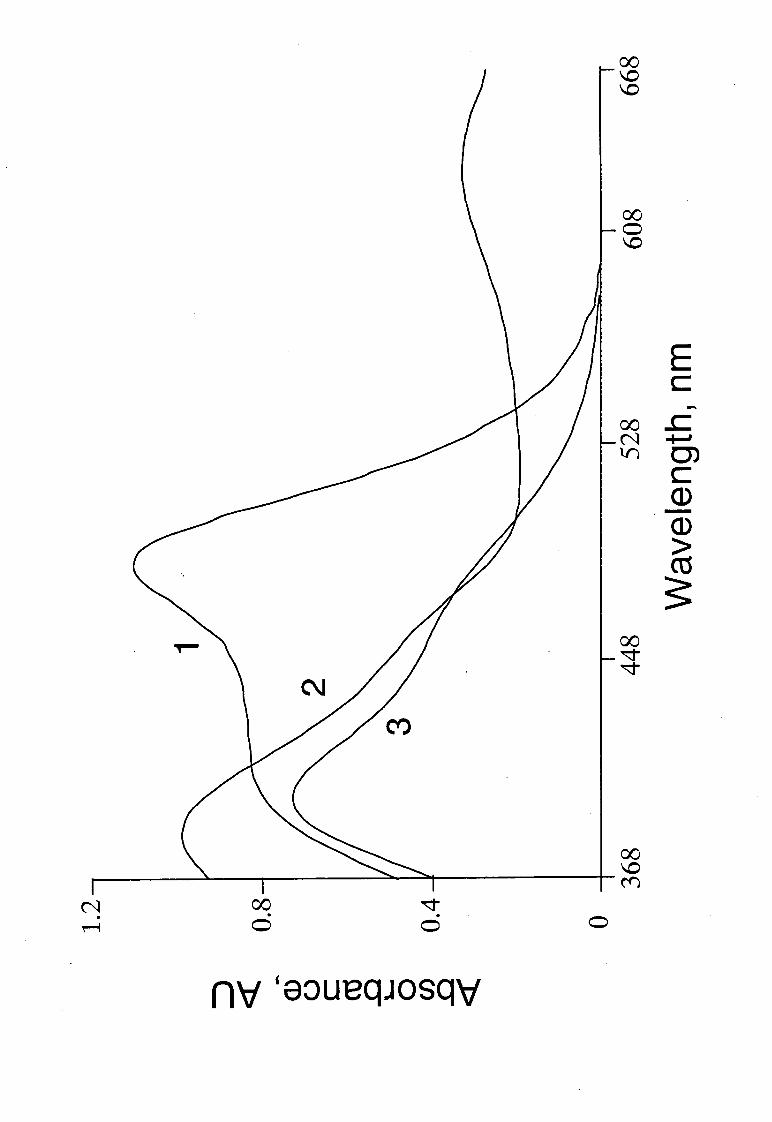
N . 00 . 0 ""'" . 0 0
nv 'a~ueqJosqv
00 0 \0
00 N lr)
00
""'" ""'"
E c
... ..c ....... en c Q) -Q)
> ct1 s
Flow-Injection Analysis of the Platinum-Group Metals
A mathematical approach for wavelength selection for MCA would indeed be of
exceptional value. Such an approach must incorporate the criteria indicated in Chapter 2
(Section 2.2.4). These criteria essentially ensure that data adhere to basic spectrophotometric
laws. However, these are insufficient for implementation in a mathematical approach which
would require algorithms to evaluate wavelength selection.
The fact that some analytical wavelengths are better than others with respect to accuracy
and precision needs consideration. A weighting scheme applied to spectral data points would
be relevant here. As the best precision is associated with the complete absorption spectrum,
and there is a corresponding loss of accuracy at wavelengths of lower sensitivity, the
requirement of a compromise between these two competing factors is clearly illustrated.
In the meantime, the consideration of the parameters such as adequate spectral
differences, maximum ratios between absorptivities, low r.s.d. at selected wavelengths, and
good agreement with Beer's law remain important in present empirical wavelength selection
approaches.
6.1.2 Multi-:,Component Analysis
Synthetic mixtures of platinum and palladium were analysed and resolved by four multi
component methods - classical simultaneous linear equations, sequential analyte determination,
multi-wavelength linear regression analysis, and reference determination of one component.
The computations were performed on identical sets of data by ReduceTEK.
6.1.2.1 Classical Simultaneous Linear Equations
The method of classical simultaneous linear equations involves solving a system of two
. linear equations based on the absorbances of the two analytes measured at two wavelengths
(usually their respective absorbance maxima).
169
Flow-Injection Analysis of the Platinum-Group Metals
The equations used for such a simultaneous determination at 368 nm and 400 nm are -
A368 apt. 368 [Pt] l + apd, 368 [Pd] l
~oo = apt. 4oo [Pt] l + apd. 4oo [Pd] l
where [ ] = concentration of Pt or Pd, lis the illuminated flow cell path length,
ai,i is the absorptivity of component i at wavelength j, and Aj the absorbance of
the mixture at wavelength j.
6.1.2.2 Sequential Analyte Determination
Sequential analyte determination involves the computation of one analyte concentration
and with that knowledge, the calculation of the concentration of the second analyte. The
absorbance measured at 636 nm is solely as a result of palladium in the sample. Palladium, in
the presence of excess platinum, may thus be determined. With the knowledge of the
palladium concentration, and the absorptivities (obtained from the calibration), the responses at
another wavelength, for instance at 400 nm, may be resolved into its' component absorbances.
The equations used in the resolution of a binary mixture at two wavelengths, 400 nm and
636 nm, are shown -
~36 = apd. 636 [Pd] l
~oo = apt. 4oo [Pt] l + apd. 40o [Pd] l
where [ ] = concentration of Pt or Pd, lis the illuminated flow cell path length,
and ai,i is the absorptivity of component i at wavelength j, and Ai the
absorbance measured at wavelength j.
170
Flow-Injection Analysis of the Platinum-Group Metals
6.1.2.3 Multi-Wavelength Linear Regression Analysis
Multi-wavelength linear regression analysis involves the use of several wavelengths to
"over-determine" a system comprising several linear equations. Least-squares fitting over the
range of wavelengths is performed and is represented graphically for the user on-screen in
ReduceTEK. The derivation of the equation is outlined in detail in Section 2.2.3. The equation
for the resolution of a binary system of components at wavelengths, j, is shown -
A l,j I A mixture,j = (1/c1) - ( c2ic1)(A 2,j I A mixture,j)
where c1 and c2 are the concentrations of component 1 and 2, Ai, i is the absorption of
component i at Aj, and Amixrurej the absorption of the mixture at Aj·
The relevant plot of A 1, i I A mixture, i versus A2, i I Amixture, i gives a straight line with a
slope of -cuc1. and y-axis intercept of 1/c1• This allows the calculation of concentrations c1
and c2• An example of such a plot for a mixture of platinum and palladium is shown earlier in
Chapter 2 (Figure 2.12). The absorption spectrum recorded for the mixture compares well
with the theoretical absorption spectrum (Figure 2.13) that is computed from the calibration \
solutions. During preliminary testing, mixtures were analysed over several wavelength ranges
and at wavelengths spread over the complete spectrum range. The former gave more accurate
results due to the selection of wavelength ranges that satisfy the criteria required for mixture
resolution.
6.1.2.4 Reference Determination
Reference determination involves the computational removal of the response of one
component by selecting two wavelengths of identical absorptivity for that component. The
wavelength of lower sensitivity is subtracted from the higher sensitivity wavelength so as to
yield a positive result for the concentration computation of the sought analyte. The criteria for
resolution in this manner is that the difference in absorptivity for the other component at the
two wavelengths be adequately high for measurement.
171
Flow-Injection Analysis of the Platinum-Group Metals
The term "reference" is used as this method is a variation of a similar method used in
diode-array instrumentation. Here an internal reference wavelength is chosen where no
absorption of solution components occur. The response at this wavelength is subtracted from
the absorption spectrum. This approach compensates for all effects that cause erroneous
absorbance readings, but which are independent of wavelength. An example of this is any lamp
instability.
The manipulation of spectrophotometric data using reference determination is illustrated
in the computational removal of palladium by difference measurement at the wavelengths
480 nm and 624 nm. It is also possible to remove the platinum component by difference
measurement at 388 nm and 412 nm. The equations used in the computational removal of
palladium are:
Atso- 624 (aPt, 480- apt, 624) [Pt] l
·: apd , 480 = apd, 624
where [ ] = concentration of Pt, l is the illuminated flow cell path length,
a;,j is the absorptivity of component i at wavelength j, and Atso _ 624 is the
absorbance difference between 480 nm and 624 nm.
Selection of wavelengths that satisfy the criteria for the reference method is facilitated by
an on-screen display in ReduceTEK. The calibration slopes given in text, and the spectral
scans at different concentrations depicted graphically, allow facile comparisons and reference
wavelength selection.
Another wavelength manipulation approach that was tested was that of wavelength
averaging. This approach involves averaging readings of a range of wavelengths spread
around a wavelength of interest. It is a useful approach in that a decreased r.s.d. may be found
where very "noisy" spectra are measured. No significant improvement of the SCA results were
found when using wavelength averaging for low absorbing samples and this was not
investigated further.
172
Flow-Injection Analysis of the Platinum-Group Metals
6.1.3 Calibration
A minimum of four calibration standards of each component, Pt(IV) and Pd(II), were
prepared with concentrations in the linear range. These standards were injected in triplicate
and spectra for each standard were obtained on averaging, after subtraction of the blank. A
normalised spectrum for each standard was obtained by regression of the absorbance versus
concentration. These normalised spectra were stored to disk and used for the resolution of the
mixtures. Spectra for standards and samples were acquired under the same experimental
conditions.
The typical calibration features for Pt(IV) and Pd(II) are very similar to those tabulated
earlier in Chapter 5. The calibrations were linear and correlation coefficientS ·were better than
0.997 in each case over the complete wavelength range.
6.1.4 Analysis of Synthetic Solutions
A series of 35 synthetic mixtures of platinum and palladium solutions were prepared and
analysed using the pertinent standard solutions. Mixtures contained varying amounts of
platinum and palladium in the range 5 to 100 ~J.g.cm-3• No synergistic effects were observed
within the ranges used. Hence, the responses of the mixtures were independent of their
respective component concentrations. The ratios of the one component to the other varied
between 1:10 and 10:1.
The mixtures were analysed using each of the resolution methods. Resolution by
simultaneous linear equations was performed at the absorbance maximum of each component.
The results obtained for these determinations are shown in Table 6.1 as the correlation
between concentrations "taken" and "found". Inductively coupled plasma-atomic emission
spectrometry, results found on analysis of the same solutions, showed good correlation with
the FIA multi-component determinations.
173
Flow-Injection Analysis of the Platinum-Group Metals
Table 6.1 Results of analysis of 35 mixtures of Pt(IV) and Pd(II) shown as the
correlation between the concentrations "taken" and those "found". Various mixture
resolution methods were used. Comparative results found by ICP-AES are shown.
174
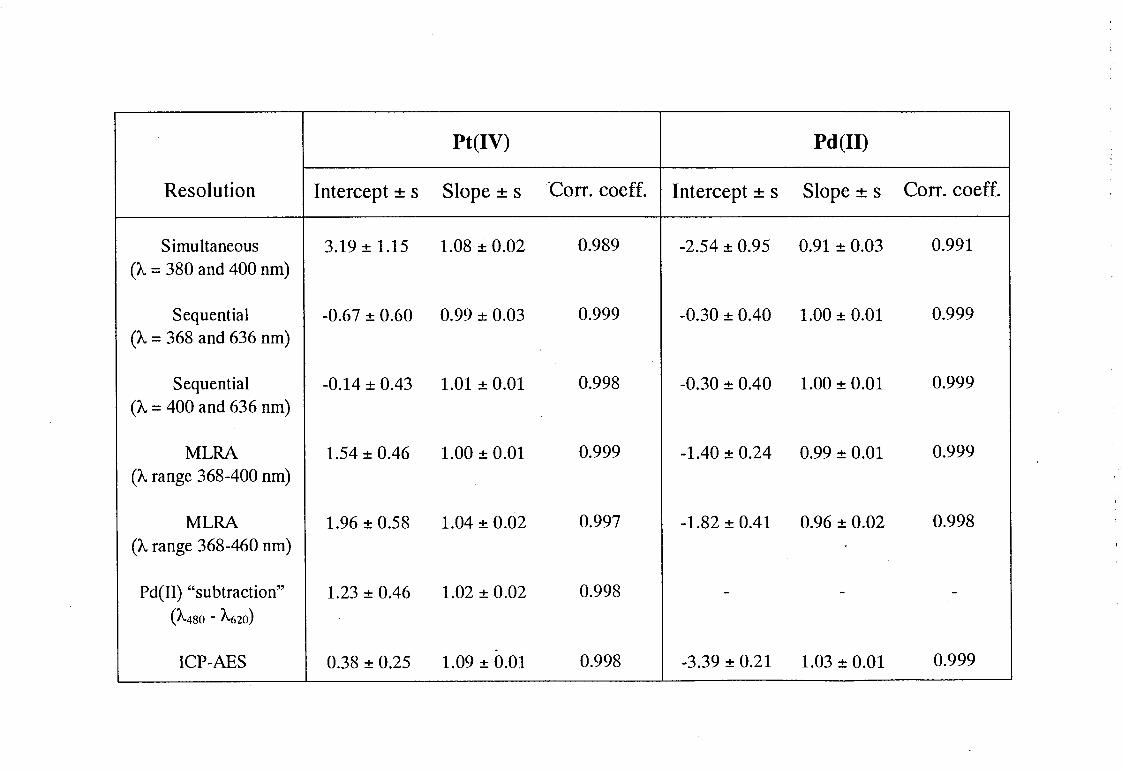
Pt(IV) Pd(II)
Resolution Intercept ± s Slope± s ·carr. coeff. Intercept ± s Slope± s Carr. coeff.
Simultaneous 3.19 ± 1.15 1.08 ± 0.02 0.989 -2.54 ± 0.95 0.91 ± 0.03 0.991 (A.= 380 and 400 nm)
Sequential -0.67 ± 0.60 0.99 ± 0.03 0.999 -0.30 ± 0.40 1.00 ± 0.01 0.999 (A. = 368 and 636 nm)
Sequential -0.14 ± 0.43 1.01 ± 0.01 0.998 -0.30 ± 0.40 1.00 ± 0.01 0.999 (A.= 400 and 636 nm)
MLRA 1.54 ± 0.46 1.00 ± 0.01 0.999 -1.40 ± 0.24 0.99 ± 0.01 0.999 (A. range 368-400 nm)
MLRA 1.96 ± 0.58 1.04 ± 0.02 0.997 -1.82 ± 0.41 0.96 ± 0.02 0.998 (A. range 368-460 nm)
Pd(II) "subtraction" 1.23 ± 0.46 1.02 ± 0.02 0.998 - - -(A.4so - A.62o) I
'
-ICP-AES 0.38 ± 0.25 1.09 ± 0.01 0.998 -3.39 ± 0.21 1.03 ± 0.01 0.999
Flow-Injection Analysis of the Platinum-Group Metals
The classical method of spectral resolution based on linear equations resulted in
substantial errors and deviations from linearity. This was expected because of the degree of
spectral overlap. The sequential approach of first computing the palladium concentration and
then using this result to compute the platinum concentration gave improved results and
superior correlation when compared to the results obtained using simultaneous equations. The
sequential approach enables accurate determination of palladium, at 636 nm, in the presence of
up to a 10-fold excess of platinum.
The MLRA approach also afforded good correlation over wavelength ranges from
368 nm to 400 nm, and 368 nm to 460 nm. The correlation over the latter range is slightly
poorer because of the similar spectral character found in this region (Figure 6.2). The
computational removal of palladium and measurement of platinum proved successful and is
useful particularly if the palladium concentration is not required.
6.1.5 Analytical Features and Performance
The precision (r.s.d.) achieved in the repeated (n = 11) resolution of a mixture (using
MLRA) of 15 p,g.cm-3 Pt(IV) and 20 !lg.cm-3 Pd(II) was 1.8% and 2.3% respectively.
Resolution of mixtures at levels lower than 5 !lg.cm-3 of each component was possible.
However, precision was poor (> 5%) as a result of the low absorbances and associated
increase in the r.s.d. of the measurement.
Accurate resolution of mixtures of platinum and palladium covering a broad range of
concentrations was performed by various multi-component methods. The possibility of
extending the number of components is only possible when MLRA is used because additional
wavelengths are required for component resolution.
Resolution of three component mixtures of platinum, palladium and rhodium were
attempted, but the poor sensitivity of rhodium in tin(II) chloride precluded it from being
resolved. The platinum and palladium concentrations obtained were consistently higher in the
presence of rhodium. This would be expected with the colour forming reaction of rhodium
and tin(II) chloride, albeit slow, does occur to some extent. The potential for MCA using
tin(II) bromide in HBr solutions is outlined later in this chapter. By using tin(II) bromide it is
175
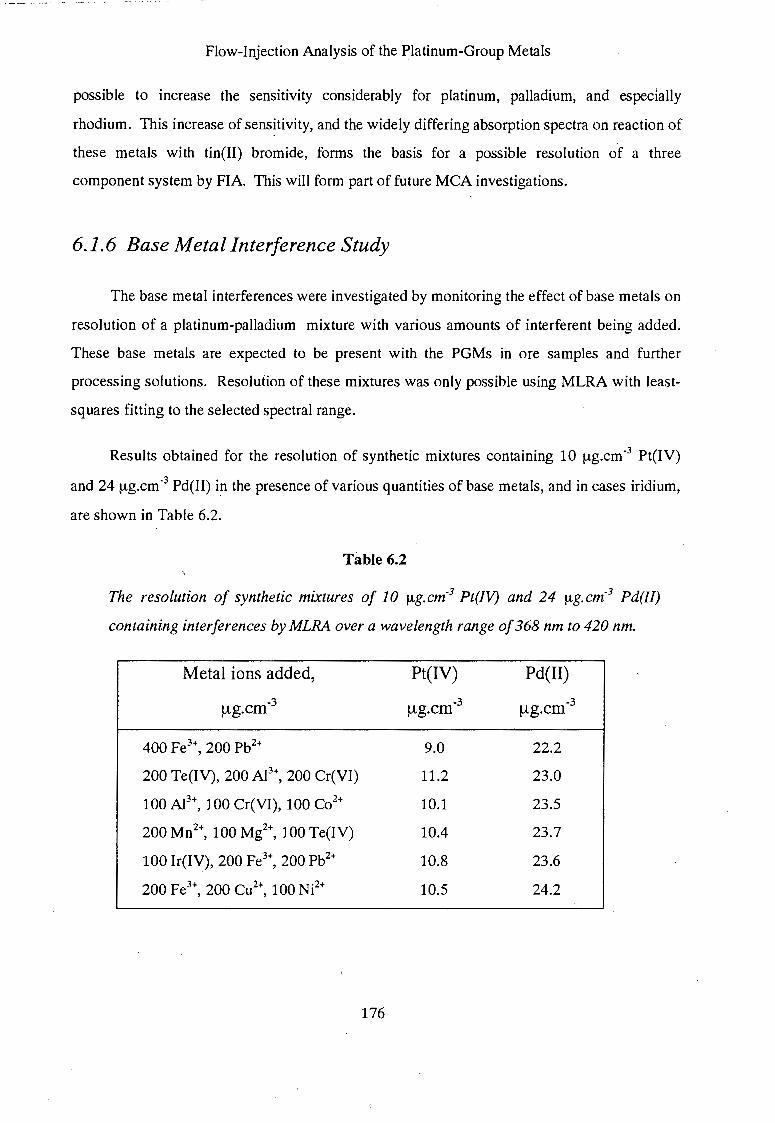
Flow-Injection Analysis of the Platinum-Group Metals
possible to increase the sensitivity considerably for platinum, palladium, and especially
rhodium. This increase of sensitivity, and the widely differing absorption spectra on reaction of
these metals with tin(II) bromide, forms the basis for a possible resolution of a three
component system by FlA. This will form part of future MCA investigations.
6.1.6 Base Metal Interference Study
The base metal interferences were investigated by monitoring the effect of base metals on
resolution of a platinum-palladium mixture with various amounts of interferent being added.
These base metals are expected to be present with the PGMs in ore samples and further
processing solutions. Resolution of these mixtures was only possible using MLRA with least
squares fitting to the selected spectral range.
Results obtained for the resolution of synthetic mixtures containing 10 ~g.cm·3 Pt(IV)
and 24 ~g.cm-3 Pd(II) in the presence of various quantities of base metals, and in cases iridium,
are shown in Table 6.2.
Table 6.2
The resolution of synthetic mixtures of 10 ~g. cm-3 Pt(JV) and 24 ~g. cm-3 Pd(II)
containing interferences by MLRA over a wavelength range of 368 nm to 420 nm.
Metal ions added, Pt(IV) Pd(II)
~g.cm-3 ~g.cm-3 ~g.cm-3
400 Fe3+, 200 Pb2+ 9.0 22.2
200 Te(IV), 200 Al3+, 200 Cr(VI) 11.2 23.0
100 Al3\ 100 Cr(VI), 100 Co2
+ 10.1 23.5
200 Mn2+, 100 Mg2+, 100 Te(IV) 10.4 23.7
100 lr(IV), 200 Fe3+, 200 Pb2+ 10.8 23.6
200 Fe3+, 200 Cu2+, 100 Ni2
+ 10.5 24.2
176
Flow-Injection Analysis of the Platinum-Group Metals
The FIA methods developed for the det~rmination of platinum and palladium,
simultaneously, and as single components, tolerate the presence of diverse interferent ions well.
This preliminary study of interferences illustrates the selectivity of tin(II) chloride for the
PGMs, and demonstrates the successful resolution of PGM mixtures by MLRA containing
substantial levels of typical interferents.
6.2 The Determination of Platinum and Ruthenium in HCI
Addition of tin(II) chloride to a test solution of commercial ruthenium (III/IV) chloride
results in the change of the original dark red-orange colour to pale blue, and then to pale
yellow on further standing. The colour change to blue can be attributed to a reduction from
Ru(IV) to Ru(III).2 The blue colour has been attributed to either Ru(III) or Ru(II)3.4
complexes with tin(II) chloride, possibly involving chloride bridges.
It seems that the Ru(IV) present in commercial ruthenium trichloride is first reduced to
Ru(III) and thereafter, the Ru(III) reduced to Ru(II) with concomitant complex formation with
tin(II) chloride to give yellow complexes of the type [Ru(SnCb)nC16•0t (n = 1 to 6) in HCl
solution. Complexes of the form [Ru(SnCb)2Cizf have also been found.5
The yellow colour formation is more rapid on heating. However, this is not convenient
in FIA applications. Tests with heating the reaction coil to 70 °C in a water bath resulted in
poor reproducibility.
6.2.1 Visible Spectra of the Ruthenium-Tin(!!) Chloride Complexes
The absorbance spectrum of ruthenium in 0.2 M tin(II) chloride shows an absorbance
maximum at 368 nm and plateau for wavelengths greater than 450 nm (Figure 6.3). The
intensity of the yellow colour was also a linear function of concentration (10 to 300 ~tg.cm-3).
Higher tin(II) chloride concentrations promote the kinetics of complex formation. Although
sensitivity for ruthenium is lower than that for platinum with the reaction being far from
completed, results confirm that the yellow colour may be used analytically.
177
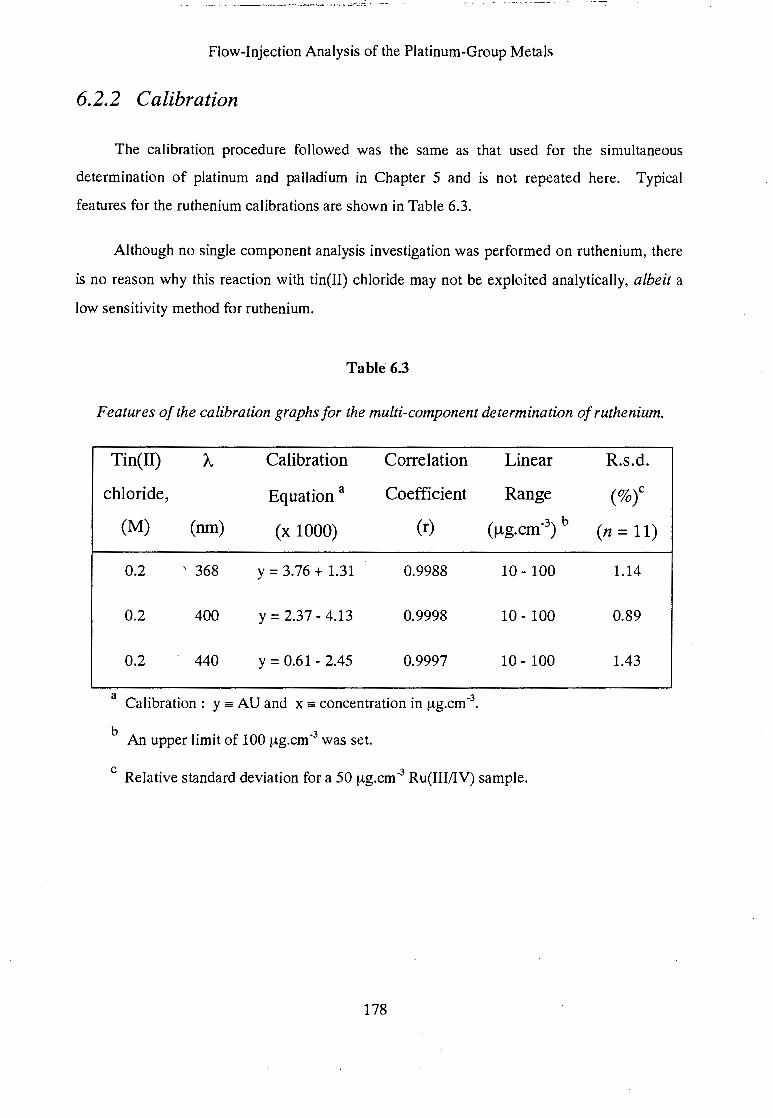
~--·- .. ---------~-··----... :: ., '- . .:..-.:;-:;. ~- ·.~-
Flow-Injection Analysis of the Platinum-Group Metals
6.2.2 Calibration
The calibration procedure followed was the same as that used for the simultaneous
determination of platinum and palladium in Chapter 5 and is not repeated here. Typical
features for the ruthenium calibrations are shown in Table 6.3.
Although no single component analysis investigation was performed on ruthenium, there
is no reason why this reaction with tin(II) chloride may not be exploited analytically, albeit a
low sensitivity method for ruthenium.
Table 6.3
Features of the calibration graphs for the multi-component determination of ruthenium.
Tin( II) Calibration Correlation Linear R.s.d.
chloride, Equation a Coefficient Range (%t
(M) (run) (x 1000) (r) (!-lg.cm-3) b (n = 11)
0.2 368 y = 3.76 + 1.31 0.9988 10- 100 1.14
0.2 400 y = 2.37- 4.13 0.9998 10- 100 0.89
0.2 440 y = 0.61 - 2.45 0.9997 10- 100 1.43
a Calibration: y =AU and x =concentration in ~-tg.cm-3 •
b An upper limit of 100 ~-tg.cm-3 was set.
c Relative standard deviation for a 50 ~-tg.cm-3 Ru(III/IV) sample.
178
Flow-Injection Analysis of the Platinum-Group Metals
Figure 6.3 Absorption spectra recorded at the FIA peak maximum on passage through
the detector flowcell, for (1) 10 ~-tg.cm-3 Pt(IV), and (2) 20 ~-tg.cm-3 Ru(Ill/IV), recorded using
a tin( II) chloride concentration of 0.2 M.
179
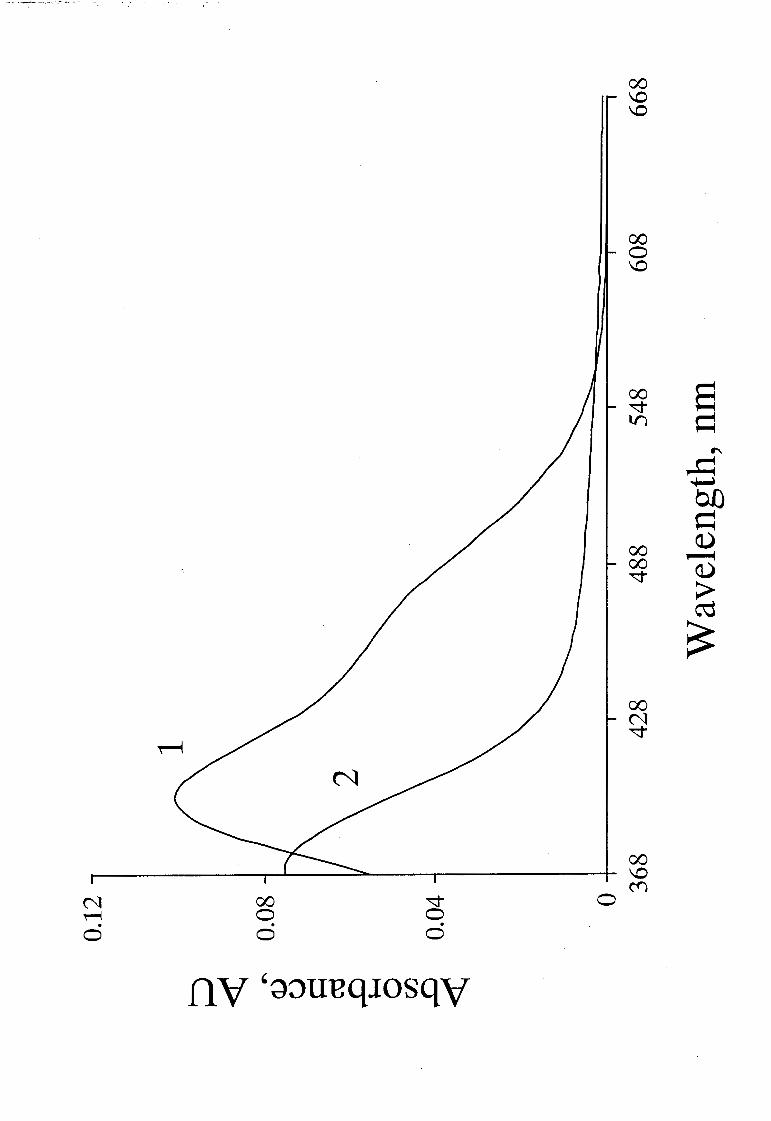
00 0 \0
00 -.::::t tn
00 00 -.::::t
00 N -.::::t
00 ~--------~~--~----~---------+ \0
00 0 . 0
-.::::t 0 . 0
trl 0
s ~
..._
~ ~
b[) ~ Q.) ~
Q.) ;>-C'd
~
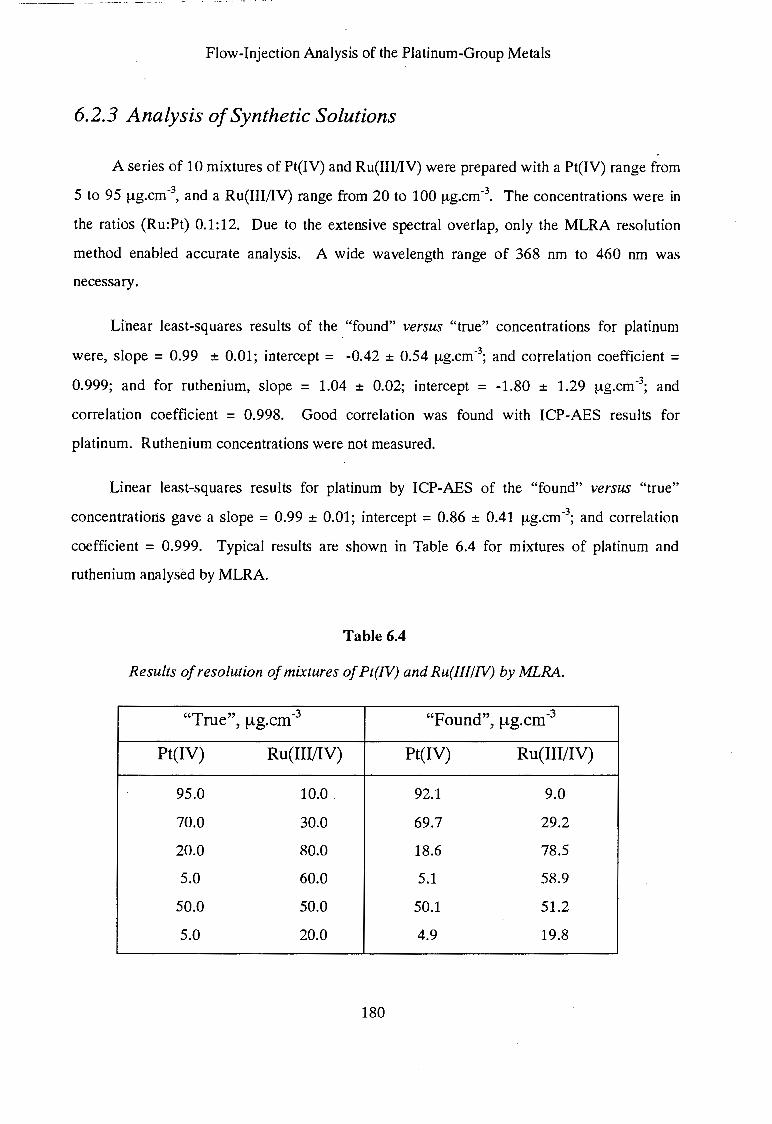
Flow-Injection Analysis of the Platinum-Group Metals
6.2.3 Analysis of Synthetic Solutions
A series of 10 mixtures of Pt(IV) and Ru(III/IV) were prepared with a Pt(IV) range from
5 to 95 f..tg.cm-3, and a Ru(III!IV) range from 20 to 100 f..tg.cm-3
• The concentrations were in
the ratios (Ru:Pt) 0.1:12. Due to the extensive spectral overlap, only the MLRA resolution
method enabled accurate analysis. A wide wavelength range of 368 nm to 460 nm was
necessary.
Linear least-squares results of the "found" versus "true" concentrations for platinum
were, slope = 0.99 ± 0.01; intercept = -0.42 ± 0.54 1-lg.cm-3; and correlation coefficient =
0.999; and for ruthenium, slope = 1.04 ± 0.02; intercept = -1.80 ± 1.29 f..tg.cm-3; and
correlation coefficient = 0.998. Good correlation was found with ICP-AES results for
platinum. Ruthenium concentrations were not measured.
Linear least-squares results for platinum by ICP-AES of the "found" versus "true"
concentrations gave a slope = 0.99 ± 0.01; intercept = 0.86 ± 0.41 f..tg.cm-3; and correlation
coefficient = 0.999. Typical results are shown in Table 6.4 for mixtures of platinum and
ruthenium analysed by MLRA.
Table 6.4
Results of resolution of mixtures of Pt(JV) and Ru(III/IV) by MLRA.
"True", f.!g.cm-3 "Found", f.!g.cm·3
Pt(IV) Ru(III!IV) Pt(IV) Ru(III/IV)
95.0 10.0 92.1 9.0
70.0 30.0 69.7 29.2
20.0 80.0 18.6 78.5
5.0 60.0 5.1 58.9
50.0 50.0 50.1 51.2
5.0 20.0 4.9 19.8
180
Flow-Injection Analysis of the Platinum-Group Metals
6.2.4 Analytical Features and Performance
A mixture of Pt(IV) and Ru(IIIIIV), 20 !-lg.cm-3 and 80 ~-tg.cm-3 respectively, was
repeatedly (n = 11) analysed and gave a precision (r.s.d.) of 1.9% and 2.6% for platinum and
ruthenium respectively. No attempts were made to analyse ruthenium at lower levels on
account of the lack of adequate sensitivity with tin(II) chloride. An alternative reagent would
be recommended for trace analysis of ruthenium by FlA.
Thus far, the determinations have primarily entailed the MLRA least-square fit of
standard spectra to mixture spectra in order to resolve the mixtures. The concentrations of the
PGMs determined by this approach correspond well with the theoretical values. The ability to
vary the wavelength ranges according to the chemical system being investigated, and being
able to fine-tune the resolution presents a formidable step in "interactive" multi-component
analysis. The importance of wavelength range selection is crucial to accurate MLRA-based
analyses.
6.3 The Determination of Platinum in the Presence of Other
Platinum-Group Metals in HCl
The determinations presented in subsequent sections make use of only two carefully
selected wavelengths and mathematical manipulation to enable mixture resolution. Again,
although these determinations are not in the true sense multi-component, they involve the use
of the responses of a multi-component absorbing system and more than one wavelength to
determine the concentration of a single component.
This demonstration of the use of two wavelengths may readily be extended to more
wavelengths to eliminate, or compensate for, interferences. Where previously separation of the
platinum from the iridium or rhodium was required prior to analysis, this approach makes the
separation step unnecessary. The intention here is not to replace the crucial separation steps,
but to illustrate the potential of this approach when interferences may be difficult to remove.
181
Flow-Injection Analysis of the Platinum-Group Metals
6.3.1 The Determination of Platinum in the Presence of Iridium
When tin(II) chloride is added to a test solution of iridium(IV) chloride, the orange
brown colour of the solution changes rapidly to pale yellow. It was found that this yellow
colour is a linear function of the iridium concentration. Although a coloured product forms on
heating,6 this method cannot be made the basis of an absorptiometric method for iridium using
FlA.
Although various iridium complexes involving the SnCh- moiety are known/ the reaction
between lr(IV) chloride and tin(II) chloride has not been examined in detail. As is the case
with Pt(IV), the reaction with tin(II) chloride is likely to involve a reduction of lr(IV) to
Ir(III), followed by complex formation with SnCI3-. Complex formation is very slow, or
possibly incomplete; at room temperature. Prolonged heating is required at 100°C to produce,
for example, [(CH3)4N]4[Ir20 2(SnCh)4].7
The intensity of the yellow colour is proportional to the iridium concentration over the
range 20 to 300 ~g.cm-3 Ir(IV) in the wavelength range 368 nm to 550 nm (correlation
coefficients were better than 0.997). The response was too low for accurate resolution by
multi-component analysis, however, a semi-quantitative indication of the iridium concentration
could be obtained.
Computational removal of iridium was possible if the response at 428 nm was subtracted
from that at 400 run (the absorptivity of Ir(IV) is the same at these two wavelengths). The
residual platinum response was adequate for accurate resolution using SCA. The absorption
spectra for standard solutions of platinum and iridium are shown in Figure 6.4. The poorer
sensitivity for iridium is clearly seen.
A series of 18 mixtures with Pt(IV) concentrations between 2 and 20 ~g.cm-3, and Ir(IV)
concentrations between 40 and 300 ~g.cm-3 (ratios Ir:Pt of 0.5:34) were analysed. Higher
concentrations of platinum are readily determined due to the negligible iridium component of
the absorption spectrum in these situations.
182
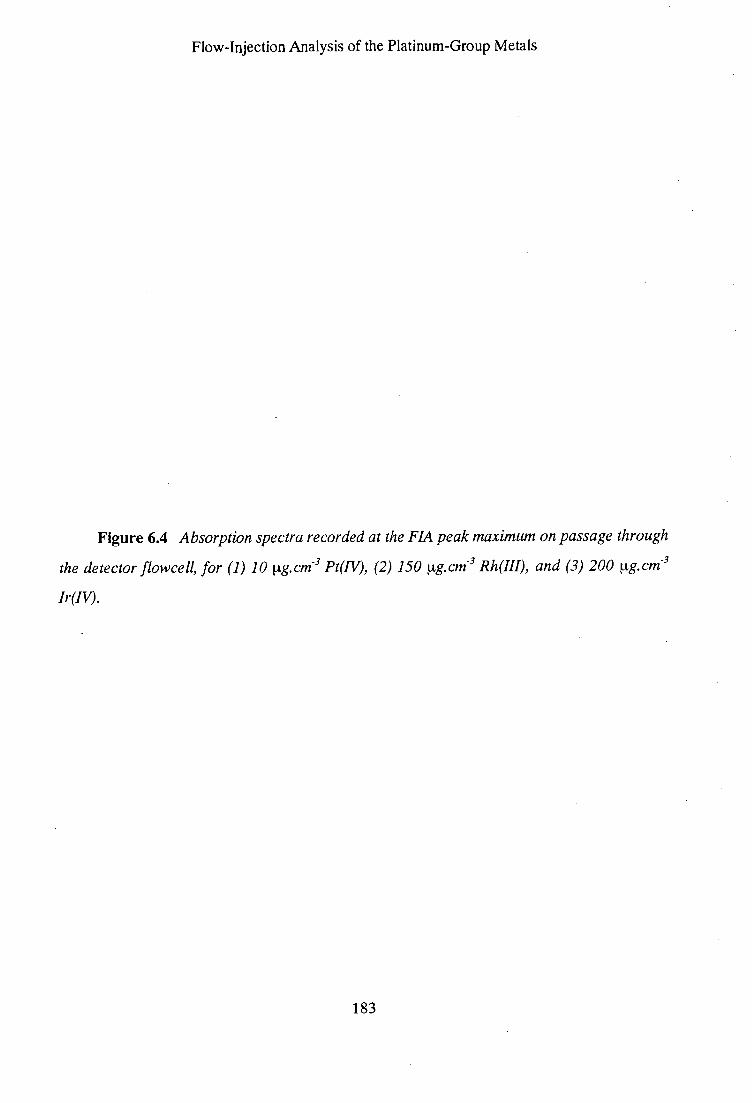
Flow-Injection Analysis of the Platinum-Group Metals
Figure 6.4 Absorption spectra recorded at the FIA peak maximum on passage through
the detector flowcell, for (1) 10 !!g.cm-3 Pt(IV), (2) 150 !!g.cm-3 Rh(Ill), and (3) 200 !!g.cm-3
lr(IV).
183
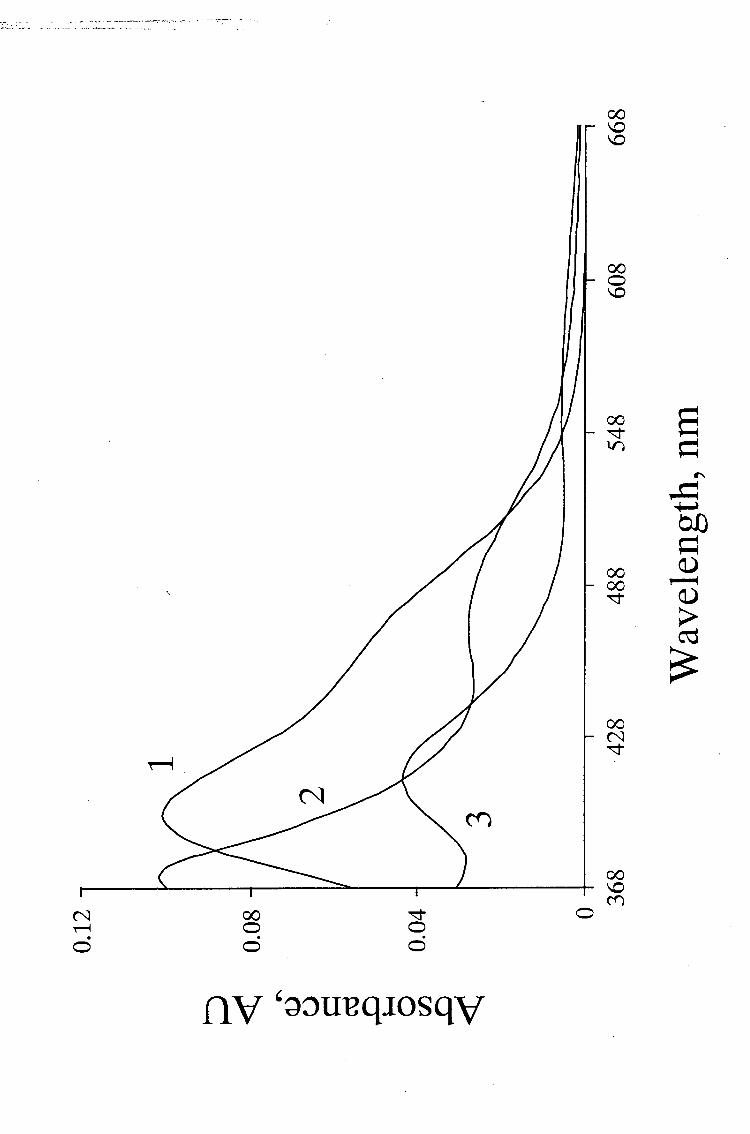
.-···----·~-- ---~----~----- .. - . -·--~- - -... -..... _ ... :. - .. ---. __ , _ _, ___ __._. ______ - ·--- .· ..
N ~ . 0
00 0 . 0
""'" 0 . 0
0
00 \0 \0
00 0 \0
00
""'" tr)
00 00
""'"
00 N
""'"
8 = " ~ ~
b1)
= Q..) ~
Q..)
> cd
~
Flow-Injection Analysis of the Platinum-Group Metals
Linear least-squares results of the "found". versus "true" concentrations for platinum
were, slope= 1.03 ± 0.03; intercept= 0.30 ± 0.36 ~-tg.cm-3; and correlation coefficient= 0.991.
The regression of ICP-AES results versus FIA results for the same solutions were, slope =
1.05 ± 0.10; intercept= -0.01 ± 0.01 ~-tg.cm-3 ; and correlation coefficient = 0.998. A mixture
of Pt(IV) and Ir(IV), containing 5 1-!g.cm-3 and 100 1-!g.cm-3 respectively, was repeatedly
(n = 11) analysed and gave precision of 3.1% for Pt(IV).
6.3.2 The Determination of Platinum in the Presence of Rhodium
Addition of tin(II) chloride to a test solution of rhodium(III) chloride resulted in the light
red colour changing to light yellow, and then, very slowly, to a deep raspberry red.
Rhodium(III) chloride reacts with tin(II) chloride in a manner similar to platinum. A variety of
Rh(III) and Rh(I) chloro(trichlorostannato )rhodium(III/1) complex anions, such as
[Rh(SnC13)nCl6_0t (n = 1 to 5), are formed.8'9 Heating increases the rate of colour formation
significantly. The colour development is critically dependant on the reaction conditions.
Rhodium was treated in the same way as iridium with computational subtraction when
determined in mixtures with platinum. A plateau is seen in the region 450 nm to 480 nm. This
plateau is the beginning of the slow formation of the purple-red (A.max = 475 nm) complex anion
that has been assigned the formula [Rh(SnCb)5(.10 By subtracting the response of the mixture
of platinum and rhodium at 488 nm from that at 448 nm, the concentration of platinum is
determined from the resulting calibration. The absorption spectra for solutions of platinum and
rhodium are shown earlier in Figure 6.4.
A series of 15 mixtures of Pt(IV) and Rh(III) were prepared with a Pt(IV) concentration
range from 5 to 100 1-!g.cm-3, and a Rh(III) concentration range from 2 to 100 ~tg.cm-3 (with
ratios of Rh:Pt of 0.1:13).
Linear least-squares results of the "found" versus "true" concentrations for platinum
were, slope = 1.00 ± 0.01; intercept = 0.08 ± 0.25 1-!g.cm-3; and correlation coefficient =
0.999. The results found by ICP-AES (for platinum only) were, slope = 1.04 ± 0.01; an
intercept= -0.10 ± 0.32 ~tg.cm-3 ; and correlation coefficient= 0.998.
184
Flow-Injection Analysis of the Platinum-Group Metals
A mixture of Pt(IV) and Rh(III), 10 ~-tg.cm-3 and 50 ~-tg.cm-3 respectively, was repeatedly
(n = 11) analysed and gave precision (r.s.d.) of 3.0% for platinum.
6.4 The Potential of Multi-Component Analysis in HBr
The potential for the multi-component determination of the PGMs - more specifically
platinum and rhodium - in hydrobromic acid solution with tin(II) bromide is significant.
Considerable improvement in the sensitivity of this system is evident for both metals, and the
kinetics of the rhodium reaction are far superior to that of the tin(II) chloride system.
However, the complex and varied chemistries occurring in solution pose a limitation on the
development of a simple method.
Attempts were made to perform the simultaneous determination of platinum and rhodium
in bromide medium. The reagent was prepared by dissolving the appropriate amount of tin(II)
chloride in HBr. All solutions were prepared in 1 M HBr. The absorption spectra of a
rhodium solution showed no difference when using tin metal dissolved in HBr to prepare
tin(II) bromide.
Attempts at resolution of mixtures proved unsuccessful since the Additivity Principle did
not hold. Although comparisons of the experimental and theoretical absorption spectra
showed some agreement, there were no definite trends that could indicate the reasons for the
discrepancies. Further attempts to find a set of conditions (such as the reagent concentration)
over which additivity could be found failed.
As encountered with the tin(II) chloride system, there is extensive overlap of the
absorption spectra (Figure 6.5) of platinum and rhodium. The absorption spectra are very
similar (a difference of about 30 nm at their respective maxima) and resolution was anticipated
to be difficult should any chemical effects alter the spectra even slightly. This seems to have
been the situation.
185
Flow-Injection Analysis of the Platinum-Group Metals
Figure 6.5 Plot of the slope of the linear calibration curves for (1) Rh(!II), and (2)
Pt(IV), as a function of wavelength using 0.2 M tin(II) bromide as the reagent.
186
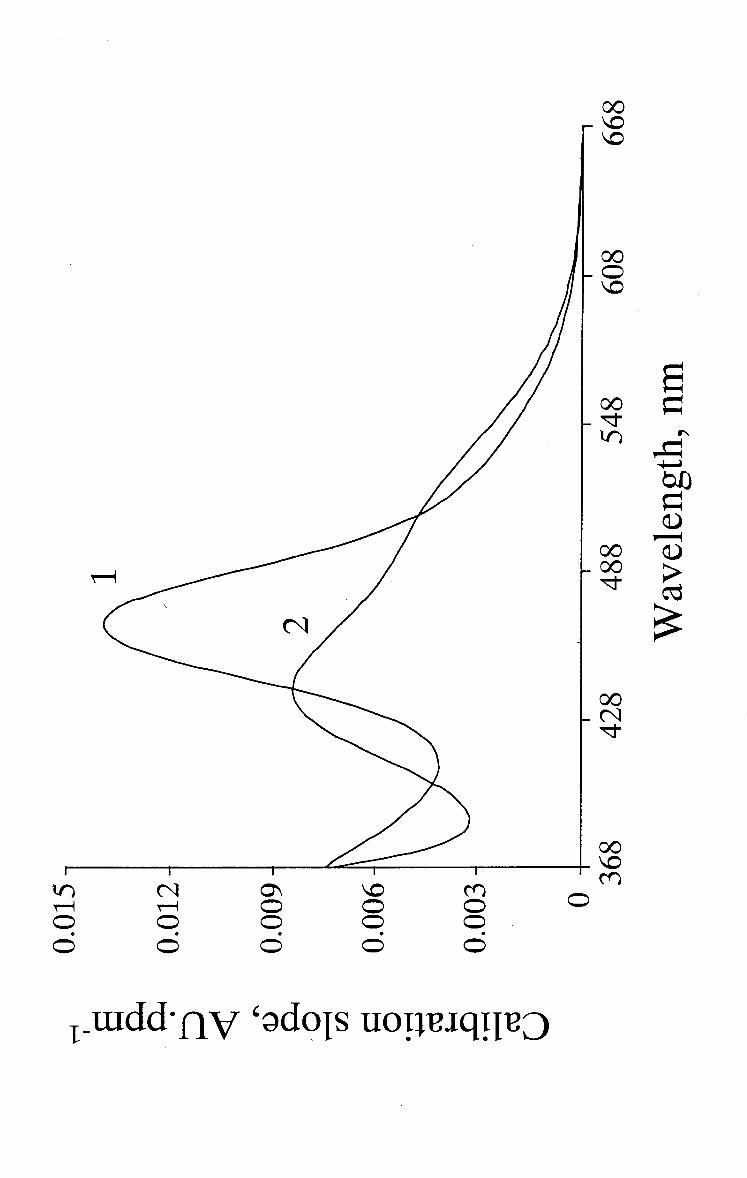
'lr) N 0\ \0 ('(') M M 0 0 0 0 0 0 0 0 . . . . . 0 0 0 0 0
0
00 0 \0
00 ~ 'lr)
00 00 ~
00 \0 ('(')
a ~
r'\
~ ~
bl) ~ Cl.) ~
Cl.) ;> C\j
~
Flow-Injection Analysis of the Platinum-Group Metals
Possible explanations reside in the nature of these chemical effects. The possibility of
competition between the rhodium and platinum for the reagent may largely be discounted as
large excesses of the reagent are present, and increasing the reagent concentration resulted in
little improvement in additivity. Despite an inherent colour of rhodium and platinum complex
bromides, it was determined that this colour was negligible relative to the colour formed on
reaction with tin(II) bromide.
The possibility of intermetallic clusters should also not be discounted without further
investigation. Such complexes would have a direct influence on the additivity of mixtures.
The possibility of the chemical system inducing some form of synergisitc effects should also be
investigated.
The most likely explanation is that the chloride, introduced when tin(II) chloride is used
in the reagent preparation, may result in complexes forming that contain both bromide and
chloride. The result would be a solution comprising complexes of the SnBr3• and SnC13•
moieties, but more likely a mixture of the two, or even some intermediate species. Substitution
of ligands in the complexes by cr and Br" to give mixed species is also possible. The influence
on the reproducibility of colour development and absorption spectra by these interactions \
would be noticeable.
Attempts were also made to perform simultaneous determination of rhodium in the
presence of iridium in bromide media. The iridium component of the response was small and
thus not ideal for simultaneous determination. Simple mathematical elimination of the iridium
component also proved difficult in these investigations. A range of conditions was investigated
once again, but an consistently high result was found for rhodium. No significant improvement
was found when using different experimental conditions. As mentioned earlier, the complex
chemistry occurring is most probably the cause of these difficulties.
187
Flow-Injection Analysis of the Platinum-Group Metals
6.5 Future Work
The ability to manipulate MCA data that has been introduced in this work should be
expanded to encompass other multi-channel resolution methodologies. Multi-component
calibration standards could be used to resolve the complex chemical systems encountered here.
Although this form of calibration is conceptually more complex than linear regression methods,
the future of MCA is founded on its ability to resolve mixtures in complex and real systems.
Therefore, it is imperative that the data generated by the added dimension introduced by a
multi-wavelength detector should be exploited fully by use of sophisticated software programs.
No attempt was made to include a comprehensive kinetics study of the various PGMs
with the stannous halides, although attention is drawn to their widely differing kinetics. This is
particularly so in tin(ll) chloride solutions. The slow kinetics of the rhodium colour formation
may be exploited analytically in mixtures with, platinum for example,· by making use of a
stopped-flow approach. As the platinum reaction is rapid it reaches completion after a few
seconds whereas the rhodium reaction will continue for a longer time period. The increasing
absorbance is thus directly attributed to the rhodium-tin(II) chloride reaction. This response
may be quantified with standard solutions.
The preliminary work using the tin(II) bromide system shows the potential for a method
to simultaneously determine platinum and rhodium by FlA. Further work toward realising this
is required. It is expected that such a determination will require more complicated
chemometric routines to enable accurate mixture resolution. The possibility of exploiting
kinetic differences between the rhodium and platinum in the bromide system should also be
investigated.
The fact that only the tin(II) halides were considered here should not detract from the
importance or potential of other reagents for the photometric determination of the PGMs by
FlA. The tin(II) halides merely provided a launch pad for multi-component work and software
development, and are well known and trusted reagents.
188
Flow-Injection Analysis of the Platinum-Group Metals
6.6 Conclusions
It is clear that the MCA-based methodologies described in this chapter show the
advantages of utilising the partial, or full, absorption spectrum instead of a single wavelength.
The MCA methods developed give excellent correlation of experimental and theoretical data.
To facilitate future MCA, an expansion of the criteria for wavelength selection used in this
work into the form of an algorithm is necessary.
The present work has added an original dimension to spectrophotometric determinations
based on exploiting and manipulating vast quantities of information-rich data. Where
traditional methods for the determination of PGMs in mixtures have been to separate them
virtually completely, a partial separation, or in certain cases no separation, may·now suffice for
accurate analysis.
It is also intended that this preliminary investigation of the PGMs using FIA and MCA
will encourage further research to find innovative solutions to the limitations encountered.
Solutions to these limitations would make FIA, in conjunction with MCA methods, a very
useful adjunct to ·trace methods of analysis in the PGM industry.
189
Flow-Injection Analysis of the Platinum-Group Metals
6. 7 References
1. Blanco, M., lturriaga, H., Gene, J., Paspochi, S., and Riba, J., Talanta, 1987, 34(12),
987.
2. Howe, J.L., 1. Am. Chem. Soc., 1927, 49, 2393.
3. Griffith, W.P., "The Chemistry of the Rarer Platinum Metals (Os, Ruthenium, Ir, and
Rh) ", Interscience Publishers, London, 1967.
4. Starik, I. E., and Barbanel, Y.A., Russ. 1. Inorg. Chem., 1961, 6(1), 109.
5. Balcerzak, M., and Wozniak, W., Microchem1., 1988,37, 326.
6. Kember, N.F., and Wells, R.A., Analyst, 1955, 80, 735.
7. Young, J.F., Gillard, R.D., and Wilkinson, G., 1. Chern. Soc., 1964, 5176.
8. Moriyama, H., Aoki, T., Shinoda, S., and Saito, Y., 1. Chem. Soc., Dalton Trans.,
1977, 639.
9. Davies, A.G., Wilkinson, G., and Young, J.F.,1. Am. Chem. Soc., 1963, 85, 1692.
10. Iwasaki, S., Nagai, T., Miki, E., Mizumacji, K., and Ishimori, T., Bull. Chem. Soc.
1pn., 1984, 57, 386.
190
Flow-Injection Analysis of the Platinum-Group Metals
Chapter 7.
Summary
"Where, at last, you reach the end of the beginning. "
7.1 Process Analytical Science
The new sub-discipline of Analytical Science, called Process Analytical Science (PAS), is
gaining in stature throughout the world. This has been a direct consequence of the
requirement for on-line and real-time monitoring of process streams. The virtually
instantaneous analysis of the sample stream allows immediate corrective action to be
implemented where necessary. Little human intervention is required and the financial benefits
of such an approach are considerable.
The use of FIA with its inherent economy of solution volumes, its uncomplicated
apparatus, and ready automation, is ideal for PAS. A chemical method developed in the
laboratory for FIA may be transferred to a robust Process Analyser to allow continuous
monitoring of a process stream. Not only are rapid measurement times required in the field,
but laboratories are also required to offer rapid turn-around times. These routine tasks can in
principle be performed automatically in suitable flow-injection instrumentation.
This investigation has laid the foundation for methodology suitable for implementation in
the laboratory and process environment. Such methodology, in the form of an analyser, would
naturally complement, not compete against, the existing and well-proven atomic absorption
and ICP-AES spectroscopic techniques. FIA has already proved itself as a viable approach to
Process Analysis. Future work will be focused on implementing the multi-element techniques
developed in this investigation to the automated environs of the process and modern
laboratory.
191
Flow-Injection Analysis of the Platinum-Group Metals
7.2 Automated Data Acquisition and Device Control
Flow-injection analysis, by virtue of its configuration and components, lends itself to
ready automation in the laboratory. Devices such as peristaltic pumps, injection valves,
selection valves, and detectors may be placed under microcomputer control to perform
repetitive and routine tasks. In so doing, the analyst is relieved of the need to perform such
mundane sample manipulations. An inexpensive FIA manifold may be operated manually with
the detector output being directed to a chart recorder. However, the advantages of an
automated approach in terms of productivity, financial savings and improved quality of data
outweigh the limited advantages of a manual approach.
Extensive use is made of automated device control in this work. The relative ease by
which a FIA manifold may be automated for analysis, whether for repetitive or diverse tasks, is
illustrated in the FIA methods developed. The microcomputer controlled data acquisition and
device control package, FlowTEKrM, provides the means for the integration of hardware
(devices) and software (user commands).
In this investigation, the automated system permits the rapid optimisation of the FIA
experimental parameters by a grid search approach. Data were collected for experiments over
a wide range of conditions. These data were used to generate three-dimensional plots which
enabled convenient selection of the optimum experimental conditions. Three-dimensional data
were also used to further understand the underlying chemical reactions occurring. The
requirement for a convenient data acquisition system to obtain this information is essential.
The least used output in FIA is the transient peak shape. The customary and convenient
measurement of peak height is bound to give way to the use of the entire transient profile. The
well-defined concentration gradient of the injected sample zone contains a virtually infinite
number of elements comprising different concentration ratios of the sample and reagents.
Previously the points on the transient profile were inaccessible, however now microcomputer
data acquisition renders these available for analytical use. Their adequate and novel
exploitation will discharge any reservations regarding the advantages of automation in FIA
methodologies.
192
Flow-Injection Analysis of the Platinum-Group Metals
7.3 The Determination of Platinum-Group Metals by FIA
The viability of the determination of the PGMs by FIA, and the usefulness of FIA for
multi-component analysis, has been demonstrated in this study. The combination of this
methodology, with the developed software, provides for a new application of FIA in the multi
component determination of the PGMs. This was achieved by making use of the familiar
stannous halide chemistry in a new and innovative way. The results attained using FIA in this
way could not be achieved using conventional approaches.
Emphasis was placed on the optimisation of the FIA manifold and on-line reaction
conditions using a combination of univariate techniques and three-dimensional response
surface maps. The latter provides an insight into interactions that would not normally be
observed when univariate optimisation is used. A criterion other than the FIA peak height,
namely the precision (expressed as the r.s.d.), was introduced as a means to select the most
suitable experimental conditions. Regions of high precision (i.e. low r.s.d.) are preferred.
Methods for the trace determination of platinum, palladium, and rhodium by FIA were
successfully developed after manifold optimisation. The sample throughput was 54 hour·1.
Calibration curves were linear to 100 ~-tg.cm·3, and the lower limits for accurate analysis were
of the order of 0.2 ~-tg.cm·3 for Pt(IV), 1.5 !lg.cm·3 for Pd(II), and 0.7 !lg.cm·3 for Rh(III) when
measuring at their respective absorption maxima. The multi-component methods developed in
this study enabled resolution of binary mixtures of platinum and palladium, and platinum and
ruthenium. Methods were also developed to enable the determination of platinum in the
presence of large quantities of iridium and rhodium. The analysis of synthetic samples yielded
excellent results. Preliminary interference studies indicated good tolerance of interferences
that would be expected to occur in typical PGM samples.
The use of three-dimensional graphics and two-dimensional contour surfaces to enable
visualisation of the experimental data proved highly informative and introduced a novel way of
deconvoluting the chemistry occurring, especially in the case of palladium. By using a
stopped-flow method, a qualitative investigation of the sequence of colour formation in the
palladium(II)-tin(ll) chloride system was made. The colour changes were correlated with
absorption spectrum features that are found spectrophotometrically. The effect of tin(ll)
193
Flow-Injection Analysis of the Platinum-Group Metals
chloride and hydrochloric acid concentrations on the complex formation, and thus the
absorption spectrum, were also considered. Several complexes give rise to the sequence of
colour changes resulting ultimately in an olive-green coloured solution. Conclusive evidence
was presented as to the nature of the complexes giving rise to this coloured solution.
Preliminary work with tin(II) bromide indicated that this reagent should receive more
attention as a reagent for multi-component PGM analysis. Evidently more sophisticated
calibration and chemometric routines will be required for this system. Implementation of such
routines in the software must endeavour to make these easily accessible to non
chemometricians.
Criteria for the difficult task of wavelength selection for mixture analysis were outlined.
Notably some spectral difference is required for accurate mixture resolution and the spectral
wavelengths should be distributed over the spectral range of higher absorptivities. Steps
towards the development a suitable mathematical approach to wavelength selection were
presented. Further work, on real and simulated spectra, will be required to assess the merit of
any mathematical approach to wavelength selection.
The principles established in this work can also be applied to other multi-component
chemical systems using multi-channel photometric data. Application of this approach can be
found in chromatography, quantitative solution infra-red spectrometry, and FIA with other
multi-channel detectors such as electrode arrays. Furthermore, higher order derivative spectra
could be resolved in a similar way. The increased selectivity attainable with derivative spectra
results from the fact that bands which overlap in the absorption spectra (zero order spectra)
appear as separate bands in the derivative spectra.
The analysis of mixtures of the PGMs without prior separation is however only possible
with software that can manipulate the multi-wavelength data. This necessitated the design and
development of a software program to perform such tasks.
194
Flow-Injection Analysis of the Platinum-Group Metals
7.4 Visual Basic ™ Software and Data Manipulation
The ReduceTEK software program was developed using the full-featured programming
platform, Visual Basic TM, in order to exploit the key features of Microsoft® Windows TM. The
requirement for this software arose due to the lack of software for the multi-channel detector
used in this work and others like it.
Tandem operation with the DOS®-based FlowTEKTM software enabled manipulation and
quantification of vast quantities of FIA data. A comprehensive file management system
ensured the integrity of the spectral data. Totally flexible single and multi-component analysis
routines were incorporated, along with easy spectral manipulation. The use of multiple
window views enabled a complete "picture" of the data to be generated.
This investigation has demonstrated the advantages of the graphical user-interface for
system optimisation, diagnosis, and interpretation of data. It is expected that GUis will form
an integral part of future computer-integrated analytical instrumentation. The advances in the
instrumentation per se have slowed considerably in recent years and attention has become
somewhat focused on making the available instrument more user-friendly via the anticipa.ted ·,
unprecedented use of software and GUis. Where previously an interface with an instrument
was a dial that was turned, a button pressed, or a meter needle observed - a graphical and
visual computer user-interface will be a worthy replacement.
The requirement for a Windows TM -based software package for flow-based techniques
that incorporates the powerful device control features of FlowTEKTM' and using GUI-based
data manipulation capabilities introduced in ReduceTEK, would be an invaluable asset to the
FIA researcher. It is reasonable to speculate that such a software package will extend the
boundaries of flow-based technology and their applications. The development of such a
package is underway in the Process Analytical Science Group at MINTEK. This has been
largely sparked by a realisation of the limitations of present software packages for multi
element determinations that have been highlighted in this study.
195
Flow-Injection Analysis of the Platinum-Group Metals
7.5 Multi-Array Photometric Detectors in FIA
The prime incentive behind the use of multi-channel photometric detectors is their ability
to provide additional scientific data without incurring any additional time or effort. This
additional data enables the application of multi-component analysis which results in analytical
information not readily available by using other methodology. There are some guidelines to
consider prior to the use, or purchase, of such multi-array photometric detectors for flow
based methods. These are often neglected and endanger the successful application of MCA to
a particular absorbing system.
• The detector should be mechanically simple and robust with high precision optics,
• have a well-designed flowcell that will not trap bubbles, or become fouled with reaction
products,
• conform to high standards of stability and low electronic noise levels,
• allow a high scan rate - with a minimum requirement of 2 seconds per absorption
spectra, although a greater frequency would be more desirable,
• include versatile MCA software (commercial or developed) with ready access to data,
• and allow remote control facilities (autozero, start scan, etc.) from a microcomputer.
FIA enjoyed an exponential growth for the first 10 to 15 years of its existence. In recent
years, as the technology has matured, that growth has tended to plateau out. This
investigation has focused on a new development on FIA, viz. multi-component analysis. All
indications are that as researchers investigate this new area, FIA will again enjoy a period of
rapid growth. Developments in this area will allow FIA to migrate from its present status as a
single element technique to the point where it is recognised as a viable multi-element
technique. This investigation confirms the viability of this new area of growth for FlA.
Prior to the advent of multi-array detectors the manipulation of the sample zone in
elegant ways was required to extract information that could be used in simultaneous
determinations. The use of the multi-array detectors has allowed a return to simple manifolds
with the detector providing the required discrimination for simultaneous determinations. A
combination of these two approaches will allow even greater accomplishments.
196
Flow-Injection Analysis of the Platinum-Group Metals
The result of a highly innovative physical and chemical manipulation of the sample zone
in conjunction with the detection capabilities of multi-array detectors would be unrivalled. It is
anticipated that tremendous breakthroughs, not predictable from extrapolation of current
trends, will be seen as FIA moves toward more exciting ways to gather chemical information.
7.6 Closing Comments
This thesis has focused on ways in which to determine the platinum-group metals by
flow-injection analysis- as a single component, or simultaneously, with the stannous halides, in
strongly acidic solutions. The pictorial presentation of multi-dimensional data has been shown
to facilitate a more complete understanding of the underlying chemistry. These same multi
dimensional plots aid in the design and optimisation of FIA manifolds. It has been shown that
the application of a multi-array detector to multi-component analysis depends heavily on
suitable software for mathematical manipulations of the vast quantities of data and the careful
selection of analytical wavelengths. Despite the dependence on sophisticated data acquisition
and manipulation techniques, the primary importance of a well-founded understanding of the
underlying chemistry has again been clearly demonstrated.
An important finding of this study is that analytical scientists, with their required skills of
statistics, computer science, physics, chemometrics, and electronics will continue to depend on
a fundamental understanding of chemistry.
197
Flow-Injection Analysis of the Platinum-Group Metals
Chapter 8.
Experimental
This chapter provides details on the experimental apparatus, reagents and their suppliers,
as well as experimental techniques used during the course of this work. The instrumentation
and the instrument settings used are tabulated. The FIA apparatus used in the construction of
the manifold is outlined in detail.
8.1 Chemicals, Reagents and Glassware
All chemicals and reagents used for experimental work were analytically pure and
obtained from various suppliers. K2PdCI4, K2PtCI4, K21rCI6, and RuCb·3H20 were obtained
on loan from Johnson Matthey Chemicals Limited. RhCh-nH20 and La(N03) 3·6H20 was
supplied by E.Merck, Darmstadt. Pt(IV) was obtained in the form of an atomic absorption
standard with a concentration of 1000 !-lg.cm-3 from BDH Chemicals. All additions in the
interference studies were made from their respective atomic absorption standards (BDH
Chemicals). Potassium iodate, KI03 was dried at l10°C for two hours and stored in a
desiccator. Chloroform (Analar grade) was used in the potassium iodate titrations. Sodium
tetraborate decahydrate (E. Merck), bromothymol blue, and 96% ethanol (Analar grade) were
used in the dispersion experiments.
Tin(II) chloride, SnCiz·2H20 (Analar grade), was obtained from NT Laboratory Supplies
and used without further purification. Tin(ll) chloride solutions were prepared by dissolving
the desired amount of the salt in the required volume of concentrated HCI. The initially cloudy
solution was allowed to stand for 15-20 minutes in a warm water bath until it was completely
clear. It was then cooled and diluted to volume. Metallic tin pieces (- 3 to 5 g) were added to
all stannous halide solutions as a preservative against oxidation by atmospheric oxygen. Acid
concentrations were kept above 0.5 M to prevent hydrolysis of the tin(II) chloride. A similar
approach was used in the preparation of tin(II) bromide solutions. Here tin(II) chloride was
used in hydrobromic acid. No significant difference was found whether dissolving tin metal in
198
Flow-Injection Analysis of the Platinum-Group Metals
HBr to prepare tin(II) bromide, or using tin(II) chloride in HBr. Spectrophotometric and
titrimetric comparisons were made. All stannous halide solutions were used the day after
preparation.
All solutions were prepared using fresh glass distilled water (GDW). The GDW was
stored in a large 25 dm3 glass container. Analytical grade concentrated hydrochloric acid
(10M) and concentrated hydrobromic acid (8.8 M) were used directly. Acid concentrations
were checked by standardisation against sodium tetra borate, although extreme accuracy of acid
concentration was not essential. The concentrations of the noble metal stock solutions were
standardised, where possible, against commercially available atomic absorption standards by
flame-atomic absorption spectrometry or inductively coupled plasma-atomic emission
spectrometry. Satisfactory agreement was obtained in both instances.
Glassware and polyethylene storage bottles were soaked in a strong Contract solution
and then in a minimum of 10% nitric acid. Vessels were thoroughly rinsed several times with
GDW and allowed to dry on a drying rack. A mixture of A and B grade glassware (volumetric
apparatus) was used throughout. A Gilson adjustable pipette (the maximum dispensed volume
being less than 1.2 cm3), previously calibrated by weighing the dispensed volumes, was used.
Larger volume so.lution manipulations were performed with grade A glass pipettes (5-50 cm3).
All weighing was done on a Mettler four decimal place balance and rough weighing on
an electronic top-loading balance. Flame-atomic absorption was performed on a Varian
Techtron 1000 AAS instrument. Inductively coupled plasma-atomic emission spectrometry
was performed on a Jobin-Yvon JY 70C combined simultaneous and sequential instrument.
Ultra-violet and visible spectrophotometry was initially performed on a Varian
Superscan-3 UVNisible spectrophotometer and an LKB Novaspec I (single wavelength)
spectrophotometer. All quantitative spectrophotometry was performed using a Spectra
FOCUS ™ forward optical scanning system with a 6 mm path length inert flow cell.
Two microcomputers were utilised - a 286 12 MHz processor was used as a file
management system and provided the initial automation, and a 386 DX 33 MHz processor
(with 8 Mb RAM and an Intel® math co-processor), running the OS/2 2.0 multitasking
199

Flow-Injection Analysis of the Platinum-Group Metals
operating system, enabled simultaneous data capture and processing. An Epson LX-400
printer was used for printing purposes. A Microsoft ™ mouse was used as a pointing device.
8.2 Atomic Absorption of Platinum
Platinum stock solutions were prepared by dissolving solid K2PtCl4, and making up to
volume in the appropriate HCl concentration. A La(N03) 3 stock solution of 20,000 ~lg.cm-3
was made and diluted ten times on addition to the standards to give a final lanthanum, La(III),
concentration of 0.2% (w/v). Lanthanum is used as a "releasing" agent. 1 A blank solution was
prepared without the addition of platinum. The solutions were in 1 M hydrochloric acid.
The Varian Techtron Model 1000 AAS was used in all measurements. No background
correction was used. A strongly-oxidising fuel-lean air-acetylene flame gave good sensitivities
for platinum with the spectrometer settings shown in Table 8.1.
Table 8.1 Flame-atomic absorption spectrometer operating parameters.
Lamp current (rnA)
Wavelength (nm)
Slit Width (nm)
Flame characteristics
10
265.9
0.2
Oxidising, fuel-lean air-acetylene flame
The system was optimised by aspirating a standard and adjusting the gas flow and burner
positioning parar_neters to give maximum sensitivity and stability. All analyses were done in
triplicate. The calibration curves for Pt(II) at wavelength 259.9 nm were linear to 100 ~lg.cm-3
(the maximum tested) with a characteristic concentration2 of 2.9 ~g.cm-3 for 1% absorption
(1% absorption= 0.0044 AU.).
The calibration slopes of the Pt(ll) and Pt(IV) solutions were the same, within
experimental error. The prepared concentrations of Pt(Il) (by weighing) where verified by this
means. Periodic verifications of the platinum concentration in standards and mixture solutions
were performed.
200
Flow-Injection Analysis of the Platinum-Group Metals
8.3 Inductively Coupled Plasma-Atomic Emission Spectroscopy
Inductively coupled plasma-atomic emission spectrometry was performed on a Jobin
Yvon JY 70C combined simultaneous and sequential instrument. The sequential and
simultaneous operational modes were both used in this work. No significant differences were
found.
Standards and samples used for FIA were used directly. All the solutions were in 1 M
hydrochloric acid. Calibrations were repeated at regular intervals and the instrumental long
term precision was better than 0.5% over the duration of the measurements. All standards and
samples were measured in at least triplicate.
Typical operating parameters and ICP instrument details are listed in Table 8.2.
Calibrations, using a minimum of three standard solutions, were repeated when the correlation
was poor (r < 0.97), or in the case of high deviations of individual data points. As synthetic
solutions were used throughout, these minimum requirements are appropriate.. Some typical
experimental calibration least-square results are shown in Table 8.3.
201
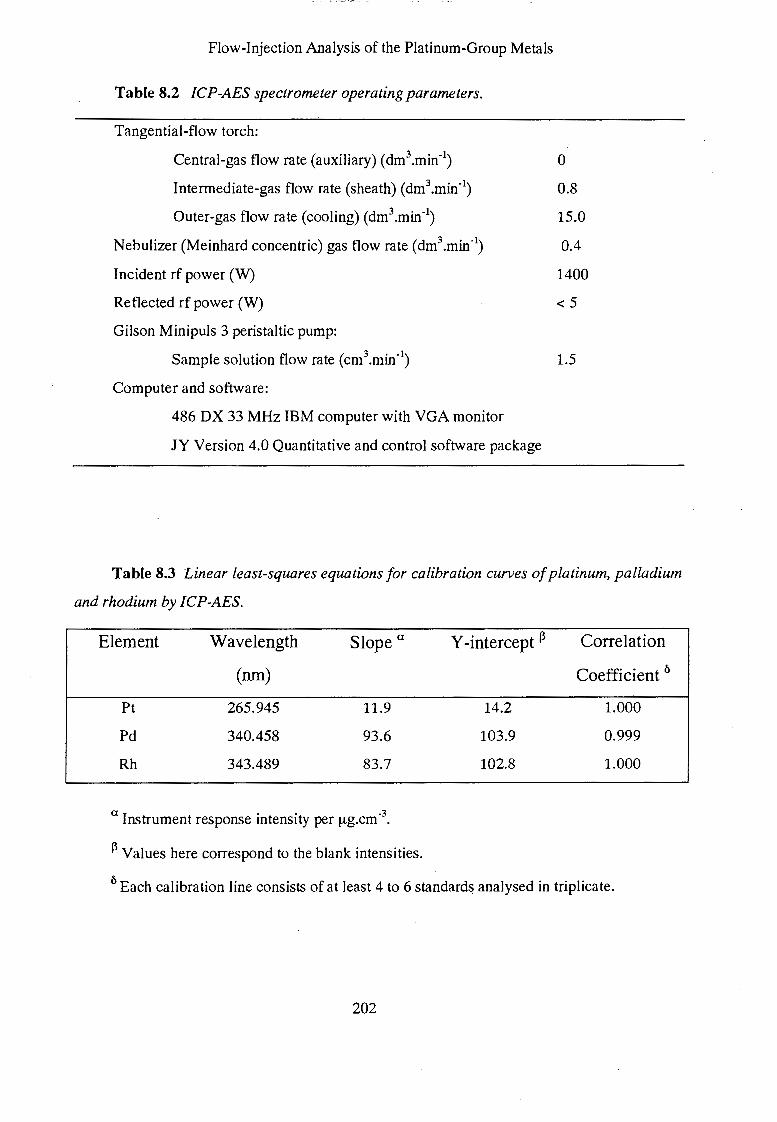
Flow-Injection Analysis of the Platinum-Group Metals
Table 8.2 ICP-AES spectrometer operating parameters.
Tangential-flow torch:
Central-gas flow rate (auxiliary) (dm3.min-1)
Intermediate-gas flow rate (sheath) (dm3.min-1)
Outer-gas flow rate (cooling) (dm3.min-1)
Nebulizer (Meinhard concentric) gas flow rate (dm3.min-1)
Incident rf power (W)
Reflected rf power (W)
Gilson Minipuls 3 peristaltic pump:
Sample solution flow rate (cm3.min-1)
Computer and software:
486 DX 33 MHz IBM computer with VGA monitor
JY Version 4.0 Quantitative and control software package
0
0.8
15.0
0.4
1400
<5
1.5
Table 8.3 Linear least-squares equations for calibration curves of platinum, palladium
and rhodium by ICP-AES.
Element
Pt
Pd
Rh
Wavelength
(nm)
265.945
340.458
343.489
Slope a
11.9
93.6
83.7
a Instrument response intensity per ~-tg.cm -3•
f3 Values here correspond to the blank intensities.
Y-intercept f3
14.2
103.9
102.8
Correlation
Coefficient 0
1.000
0.999
1.000
0 Each calibration line consists of at least 4 to 6 standards analysed in triplicate.
202
Flow-Injection Analysis of the Platinum-Group Metals
8.4 Potassium Iodate Oxidations
The titrimetric determination of tin(II) in hydrochloric acid by oxidation with potassium
iodate is a well-documented and widely used method.Z·3 Potassium iodate solution reacts
quantitatively with tin(II) in the presence of concentrated hydrochloric acid, according to the
overall equation:
2 SnC]z + KI03 + 6 HCl 2 SnC14 + KCl + ICl + 3 H20
2 Sn(II)
The titrimetric procedure involves the use of an immiscible organic solvent, chloroform,
with which the end point of the titration is determined. The end-point is marked by the
disappearance of the last trace of violet colour from the chloroform. This colour is a result of
the iodine formed during the reaction as a by-product. Iodine monochloride is not extracted
and imparts a pale yellow colour to the aqueous phase.
In the titration procedure for standardising a tin(II) solution, an aliquot of the solution
(1-3 cm3) was transferred to a conical flask. Rapid addition of 10 cm3 of concentrated HCI,
5 cm3 of chloroform, and 10 cm3 of GDW was made. The KI03 solution, 0.025 M, was added
by burette with vigorous shaking of the conical flask.
Initially both the aqueous and organic phases were colourless. On addition of
approximately 65% of the required volume of iodate the aqueous phase became reddish-brown
and the organic layer acquired a violet colour due to iodine. Addition of smaller increments of
the iodate caused the organic layer to go faintly violet. The titration was continued drop-wise
until the end-point was reached. Titrations were repeated until agreement to within 0.05 cm3
was attained.
The titrations were not performed under oxygen-free nitrogen as it was determined that
oxidation of Sn(II) to Sn(IV) by oxygen in the air was minimal over the duration of the
titration. The requirement of extremely accurate Sn(II) concentrations were not essential as
203
Flow-Injection Analysis of the Platinum-Group Metals
calibration standards are always analysed prior to samples. However, a minimum requirement
of at least 90% Sn(II) in a solution having been used for a few days was practised.
Freshly prepared solutions of tin(II) chloride/bromide had concentrations of Sn(II) in the
range 93% to 97%. Solutions were not used for more than a few days. Nevertheless, two
solutions were used for over a week and then were left to stand for a further week. They had
Sn(II) concentrations of 89% and 91%.
8.5 FIA Apparatus and Sample Injection Technique
8.5.1 Peristaltic Pumps
Peristaltic pumps used in this study were the Spectec Perimax 12 (Spetec GmbH, Erding,
Germany) and the Gilson Minipuls II (Gilson Medical Electronics, Inc., Wisconsin, U.S.A.).
Pump flow tubing of 1.42 mm I.D.(yellow tags) and 1.85 mm I.D.(green tags) were used and
calibrated gravimetrically. Pump tubing was replaced periodically, depending on the wear of
the tubes. The peristaltic pumps had a minimum of 10 rollers - contact of the pump tubing
with at least 5 at any time sufficed to keep pulsation low.
8.5.2 Injection Valves
The valves were of the rotary type from' Rheodyne (Rheodyne, California, U.S.A.), a
Model 5020 fixed-loop injection valve and a Model 5011 six-position selection valve, were
used. Both have uniform flow passages of 0.8 mm J.D. and "wettable" surfaces are made of
the fluoropolymers - Teflon TM (stator) and Kel-FTM (rotor). Both the injection and selection
valves were pneumatically operated, either manually via an over-ride switch, or under
microcomputer control using TTL input. Pneumatic actuators (operating at 70 psi minimum)
and solenoid control valve kits (240-V AC) were supplied by Rheodyne. Nitrogen was used to
drive the actuators.
204
Flow-Injection Analysis of the Platinum-Group Metals
8.5.3 Connectors and Tubing
All FIA manifold tubing, of 0.5 mm I.D., was made of poly(tetrafluoroethylene) (PTFE).
Tubing of 0.8 mm I.D. was used only in parts of the manifold not affecting the peak signal,
viz. the tubes used for drawing up samples and reagents. The injection valve was dismantled to
replace the 0.8 mm I.D. flow passages with 0.5 mm I.D. tubing. Tubing connections were
made either with commercially available Omnifit PTFE or PEEK™ threaded connectors and
90° mixing tees, or by push-fit connections. Reactor coils were made by uniformly coiling
tubing of varying length around a 15 mm I.D. perspex cylinder. All long lengths of tubing
were fixed in position to prevent movement and influence on the flow characteristics.
8.5.4 Sample Injection Technique
The use of time-based injections was preferred to changing sample loops to give different
injection volumes. The injection valve was under computer control with timing accuracy better
than one millisecond. The precision (r.s.d.) for replicate injections (n = 10) was better than
0.7%. The injection valve was fitted with either a 200 !AI or 300 !AI sample loop. By varying
the delay time between switching the valve to the "inject" position and returning to the "load"
position, different injection volumes were obtained.
The volume injected was calculated by repeated injection of standardised 5.0 M sodium
hydroxide into a clean vessel and titration with hydrochloric acid. Volume computations using
the volume flow rate and delay time, assuming negligible residual volume, compared
favourably. An alternative approach of injecting mercury and then weighing was not desirable.
The actual volume of the injected sample, V in !AI, is related to the valve residual volume,
Vd in !AI, the tubing radius, r in mm, and the sample loop length, L in mm, as in Equation 8.1.
Using three sample loops of different volumes, the residual volume was found to be 7 ~tl. This
is negligible for all practical purposes.
205
Flow-Injection Analysis of the Platinum-Group Metals
V = Vd + n: r2 L
Equation 8.1 Equation used to calculate the sample injection volume.
The conventional mode of sample injection is where the contents of the sample loop are
all flushed into the carrier stream. This means that both the front and rear interfaces of the
sample zone undergo dispersion, the rear to a greater extent than the front as a result of the
longer path through the sample loop. However, if the valve is switched back to the "load"
position before the rear interface of the sample zone passes into the manifold, then the rear
interface will be as dispersed as the front interface. As a result, the time it takes for the FIA
peak signal to return to the baseline is shorter, and a high sample throughput may be
maintained. This method of sample injection was used throughout this work.
206
Flow-Injection Analysis of the Platinum-Group Metals
8.6 References
1. Pitts, A.E., Van Loon, J.C., and Beamish, F.E.,Anal. Chim. Acta, 1970, 50, 181.
2. Ebdon, L., "An Introduction to Atomic Absorption Spectroscopy", Heydon & Son Ltd.,
London, 1982, 57.
3. Vogel, A.l., "A Textbook of Quantitative Inorganic Analysis", 3rd edn., Longman,
London, 1961.
4. Wilson, C.L., and Wilson, D.W., "Comprehensive Analytical Chemist1y", Vol. Ic,
Elsevier, Amsterdam, 1962.
207
Flow-Injection Analysis of the Platinum-Group Metals
Appendix 1 · Publications and Presentations
Presentations
D. Auer and K.R. Koch, SACI Young Chemists Meeting, Cape Town, South Africa, June
1992.
D. Auer and K.R. Koch, 3rd IUPAC Symposium on Analytical Chemistry in the Exploration,
Mining, and Processing of Materials, Sandton, South Africa, August 1992.
D. Auer and K.R. Koch, Winter Conference on Flow-Injection Analysis, Florida, United States
of America, January 1993.
D. Auer and K.R. Koch, Postgraduate Students Seminar, Council for Mineral Technology,
Randburg, South Mrica, November 1993.
D. Auer and K.R. Koch, Analytika 1994, Stellenbosch, South Africa, December 1994.
Publications
D.Auer and K.R. Koch, Talanta, 1993,40 (12), 1975.
D.Auer and K.R. Koch, submitted to Computers and Chemistry, 1995
D.Auer and K.R. Koch, submitted toAnalytica ChimicaActa, 1995
D.Auer and K.R. Koch, submitted to Talanta, 1995
D.Auer and K.R. Koch, in press,Analytica, 1995
Poster Presentation
D. Auer and K.R. Koch, "Flow-Injection Analysis of the Platinum-Group Metals. Is Multi
Element Analysis Possible ?", 32nd Convention of the South African Chemical Institute,
Halfway House, South Mrica, February 1994.
208
Recommended