1
Analytische Chemie I
Gel Electrophoresis
Separating DNA and Proteins
Supervisors
Charles Vidoudez, [email protected], 03641-948178
Matthew Welling, [email protected], 03641-948178
IAAC, Lehrstuhl für instrumentelle Analytik, Lessingstr. 8, Raum 306, 07743 Jena
At the beginning of the practical the theoretical introduction will be discussed. Please consider the
following control questions:
• What are the major differences between agarose gels and polyacrylamide gels? What are their
advantages and disadvantages?
• Which classes of molecules can be run on each type of gel?
• Which forces are influencing the molecules during their migration in the gels?
• What is the concept of restriction fragment analyses?
• How can large quantities of proteins of interest be obtained?
2
1. From the genetic code to proteins
All living cells on Earth store their information in the form of double-stranded molecules of DNA, which
provide the blueprints for proteins. In order to understand this code of life analytical methods were
developed that allow separation of these biomacromolecules. This lab class addresses the fundamental
methods currently employed for DNA and protein separation.
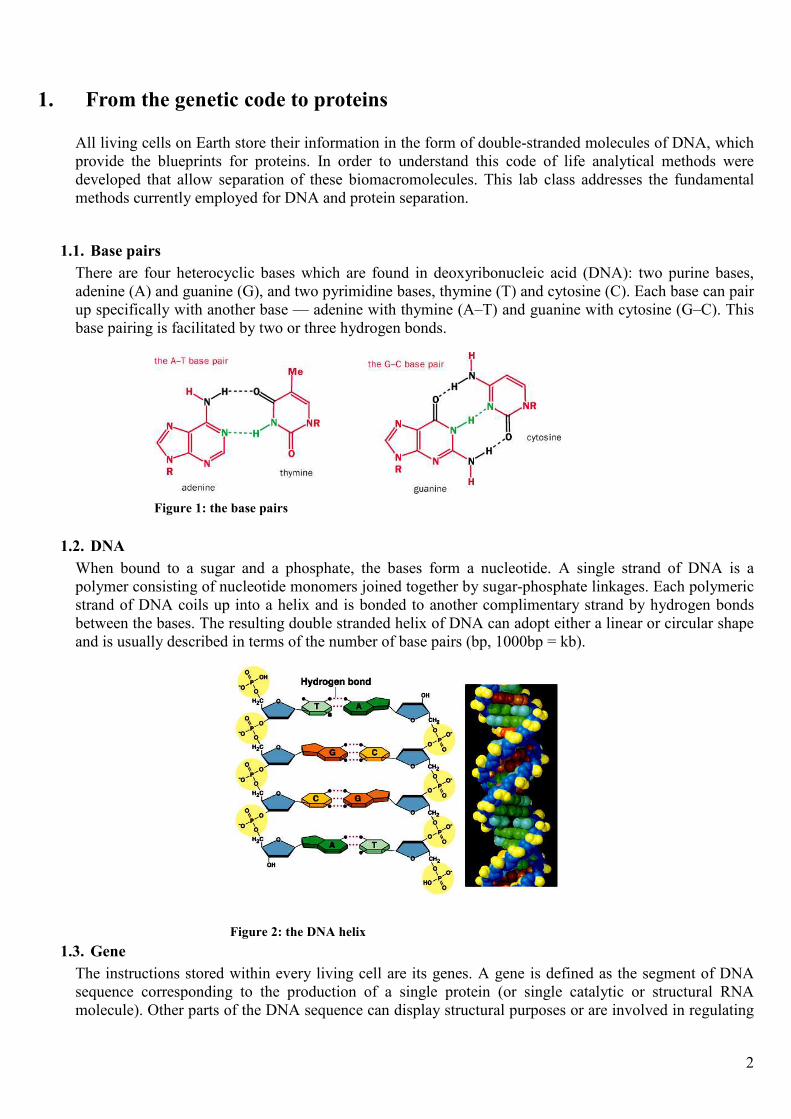
1.1. Base pairs
There are four heterocyclic bases which are found in deoxyribonucleic acid (DNA): two purine bases,
adenine (A) and guanine (G), and two pyrimidine bases, thymine (T) and cytosine (C). Each base can pair
up specifically with another base — adenine with thymine (A–T) and guanine with cytosine (G–C). This
base pairing is facilitated by two or three hydrogen bonds.
1.2. DNA
When bound to a sugar and a phosphate, the bases form a nucleotide. A single strand of DNA is a
polymer consisting of nucleotide monomers joined together by sugar-phosphate linkages. Each polymeric
strand of DNA coils up into a helix and is bonded to another complimentary strand by hydrogen bonds
between the bases. The resulting double stranded helix of DNA can adopt either a linear or circular shape
and is usually described in terms of the number of base pairs (bp, 1000bp = kb).
1.3. Gene
The instructions stored within every living cell are its genes. A gene is defined as the segment of DNA
sequence corresponding to the production of a single protein (or single catalytic or structural RNA
molecule). Other parts of the DNA sequence can display structural purposes or are involved in regulating
Figure 1: the base pairs
Figure 2: the DNA helix
3
the use of the genetic information. However, there are still sequences whose purposes have not yet been
discovered.
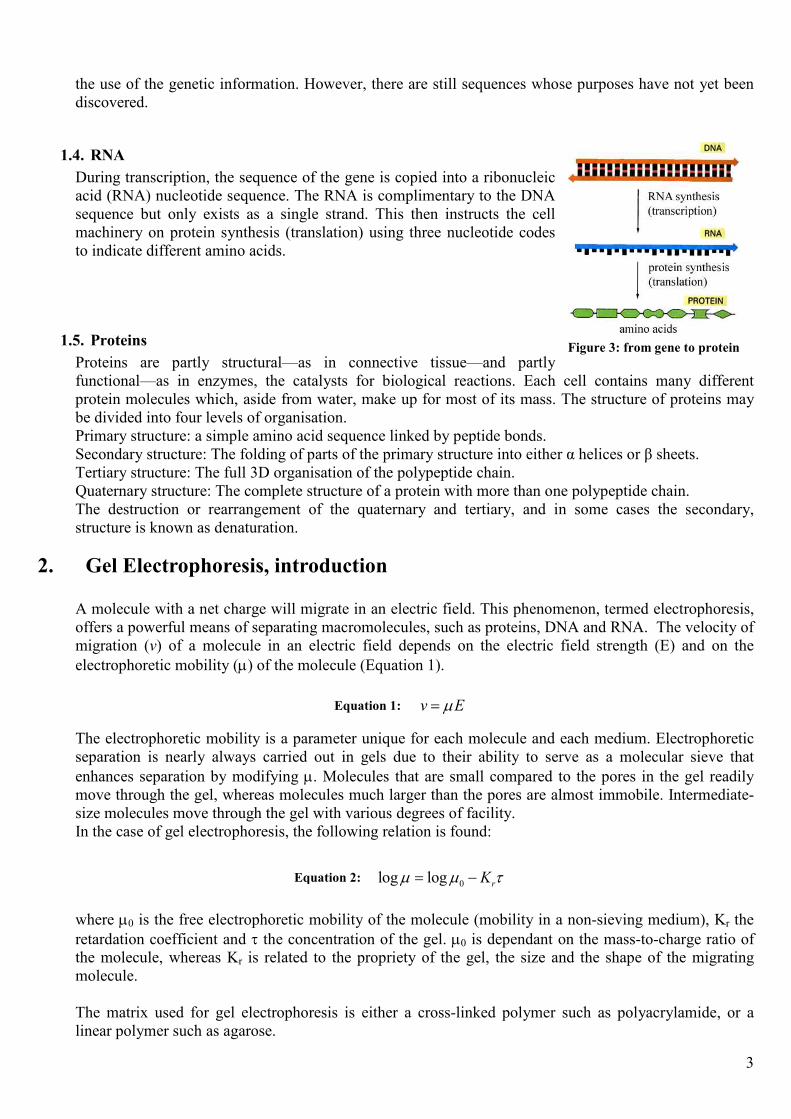
1.4. RNA
During transcription, the sequence of the gene is copied into a ribonucleic
acid (RNA) nucleotide sequence. The RNA is complimentary to the DNA
sequence but only exists as a single strand. This then instructs the cell
machinery on protein synthesis (translation) using three nucleotide codes
to indicate different amino acids.
1.5. Proteins
Proteins are partly structural—as in connective tissue—and partly
functional—as in enzymes, the catalysts for biological reactions. Each cell contains many different
protein molecules which, aside from water, make up for most of its mass. The structure of proteins may
be divided into four levels of organisation.
Primary structure: a simple amino acid sequence linked by peptide bonds.
Secondary structure: The folding of parts of the primary structure into either α helices or β sheets.
Tertiary structure: The full 3D organisation of the polypeptide chain.
Quaternary structure: The complete structure of a protein with more than one polypeptide chain.
The destruction or rearrangement of the quaternary and tertiary, and in some cases the secondary,
structure is known as denaturation.
2. Gel Electrophoresis, introduction
A molecule with a net charge will migrate in an electric field. This phenomenon, termed electrophoresis,
offers a powerful means of separating macromolecules, such as proteins, DNA and RNA. The velocity of
migration (v) of a molecule in an electric field depends on the electric field strength (E) and on the
electrophoretic mobility (µ) of the molecule (Equation 1).
The electrophoretic mobility is a parameter unique for each molecule and each medium. Electrophoretic
separation is nearly always carried out in gels due to their ability to serve as a molecular sieve that
enhances separation by modifying µ. Molecules that are small compared to the pores in the gel readily
move through the gel, whereas molecules much larger than the pores are almost immobile. Intermediate-
size molecules move through the gel with various degrees of facility.
In the case of gel electrophoresis, the following relation is found:
where µ0 is the free electrophoretic mobility of the molecule (mobility in a non-sieving medium), Kr the
retardation coefficient and τ the concentration of the gel. µ0 is dependant on the mass-to-charge ratio of
the molecule, whereas Kr is related to the propriety of the gel, the size and the shape of the migrating
molecule.
The matrix used for gel electrophoresis is either a cross-linked polymer such as polyacrylamide, or a
linear polymer such as agarose.
Figure 3: from gene to protein
v Eµ=Equation 1:
0log log rKµ µ τ= −Equation 2:
4
3. Agarose Gel Electrophoresis
3.1. Application
Agarose gels are the standard method used to separate, identify and purify DNA (and RNA). Their
resolving power is lower than polyacrylamide gels but the range of separation is greater and they are
easier to prepare. DNA fragments ranging from 200bp up to 50kb can be separated. They can also be used
as a tool to isolate a defined DNA fragment or as a preparative step in southern blot (DNA specific
detection) or northern blot (RNA specific detection).
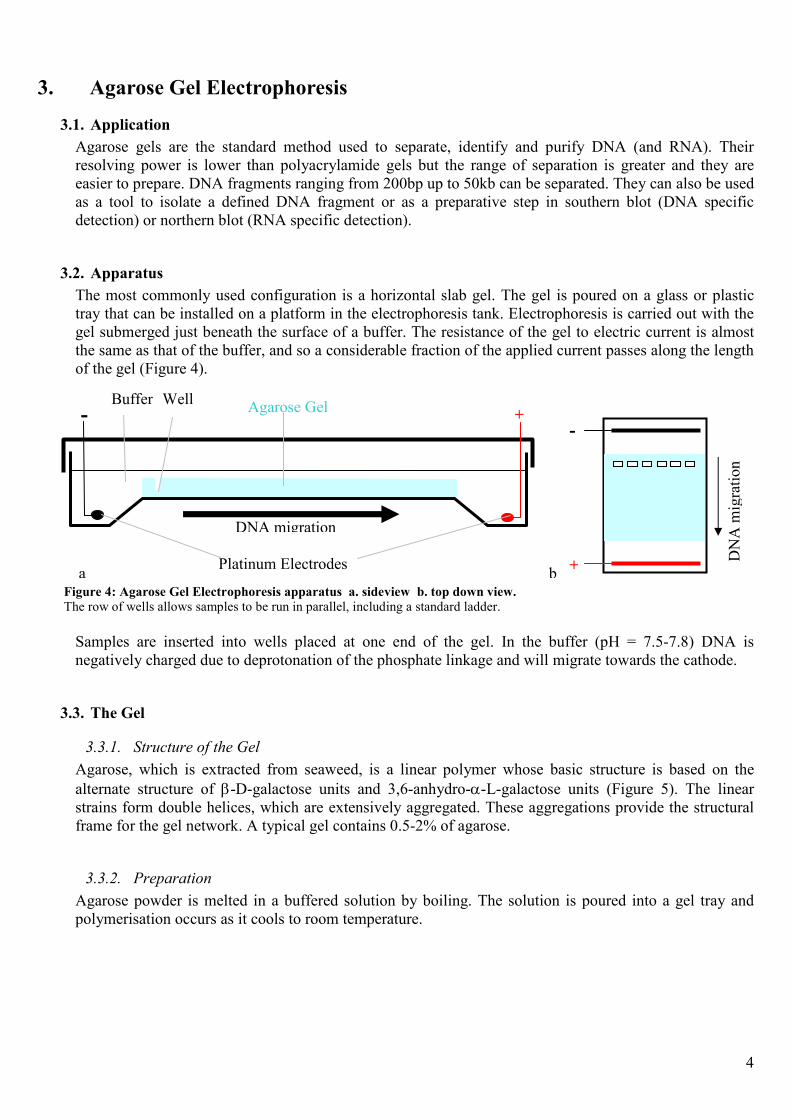
3.2. Apparatus
The most commonly used configuration is a horizontal slab gel. The gel is poured on a glass or plastic
tray that can be installed on a platform in the electrophoresis tank. Electrophoresis is carried out with the
gel submerged just beneath the surface of a buffer. The resistance of the gel to electric current is almost
the same as that of the buffer, and so a considerable fraction of the applied current passes along the length
of the gel (Figure 4).
Samples are inserted into wells placed at one end of the gel. In the buffer (pH = 7.5-7.8) DNA is
negatively charged due to deprotonation of the phosphate linkage and will migrate towards the cathode.
3.3. The Gel
3.3.1. Structure of the Gel
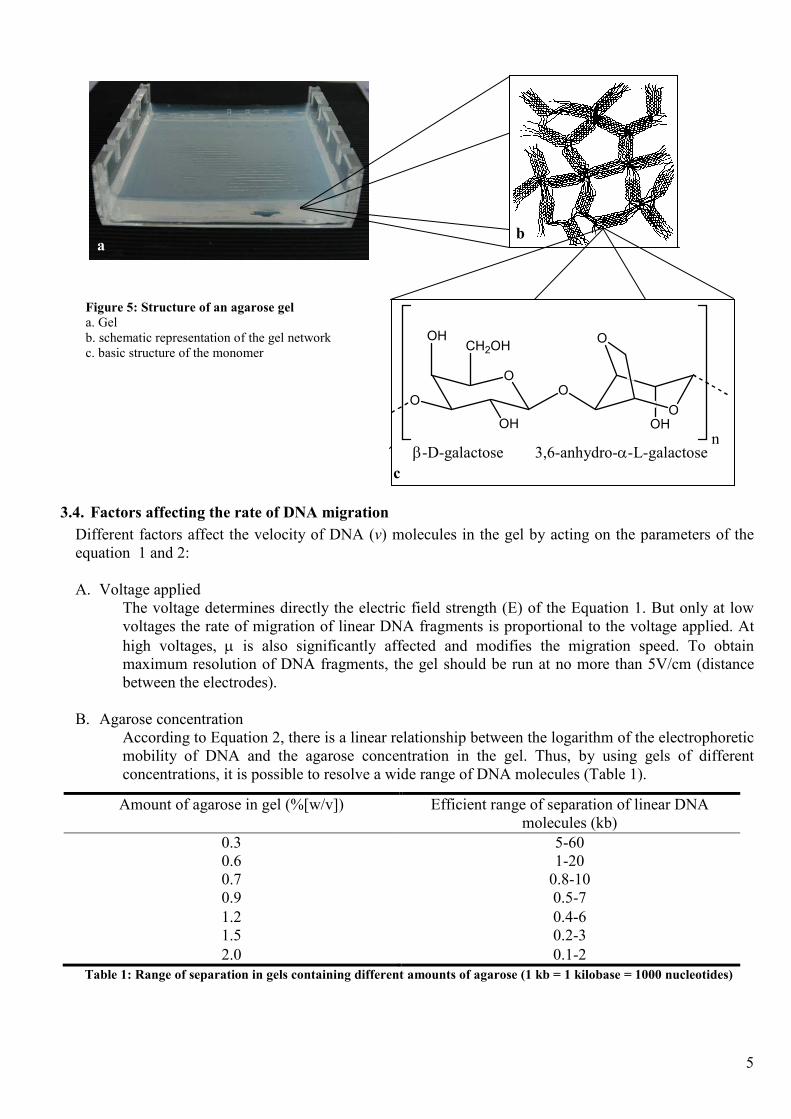
Agarose, which is extracted from seaweed, is a linear polymer whose basic structure is based on the
alternate structure of β-D-galactose units and 3,6-anhydro-α-L-galactose units (Figure 5). The linear
strains form double helices, which are extensively aggregated. These aggregations provide the structural
frame for the gel network. A typical gel contains 0.5-2% of agarose.
3.3.2. Preparation
Agarose powder is melted in a buffered solution by boiling. The solution is poured into a gel tray and
polymerisation occurs as it cools to room temperature.
- + Agarose Gel
Platinum Electrodes
DNA migration
Figure 4: Agarose Gel Electrophoresis apparatus a. sideview b. top down view.
The row of wells allows samples to be run in parallel, including a standard ladder.
Buffer Well
+
-
a b
DNA m
igration
5
3.4. Factors affecting the rate of DNA migration
Different factors affect the velocity of DNA (v) molecules in the gel by acting on the parameters of the
equation 1 and 2:
A. Voltage applied
The voltage determines directly the electric field strength (E) of the Equation 1. But only at low
voltages the rate of migration of linear DNA fragments is proportional to the voltage applied. At
high voltages, µ is also significantly affected and modifies the migration speed. To obtain
maximum resolution of DNA fragments, the gel should be run at no more than 5V/cm (distance
between the electrodes).
B. Agarose concentration
According to Equation 2, there is a linear relationship between the logarithm of the electrophoretic
mobility of DNA and the agarose concentration in the gel. Thus, by using gels of different
concentrations, it is possible to resolve a wide range of DNA molecules (Table 1).
Table 1: Range of separation in gels containing different amounts of agarose (1 kb = 1 kilobase = 1000 nucleotides)
Amount of agarose in gel (%[w/v]) Efficient range of separation of linear DNA
molecules (kb)
0.3 5-60
0.6 1-20
0.7 0.8-10
0.9 0.5-7
1.2 0.4-6
1.5 0.2-3
2.0 0.1-2
OH
O
O
O
OHCH2OH
O
OH
O
n
Figure 5: Structure of an agarose gel
a. Gel
b. schematic representation of the gel network
c. basic structure of the monomer
a b
c
β-D-galactose 3,6-anhydro-α-L-galactose
6
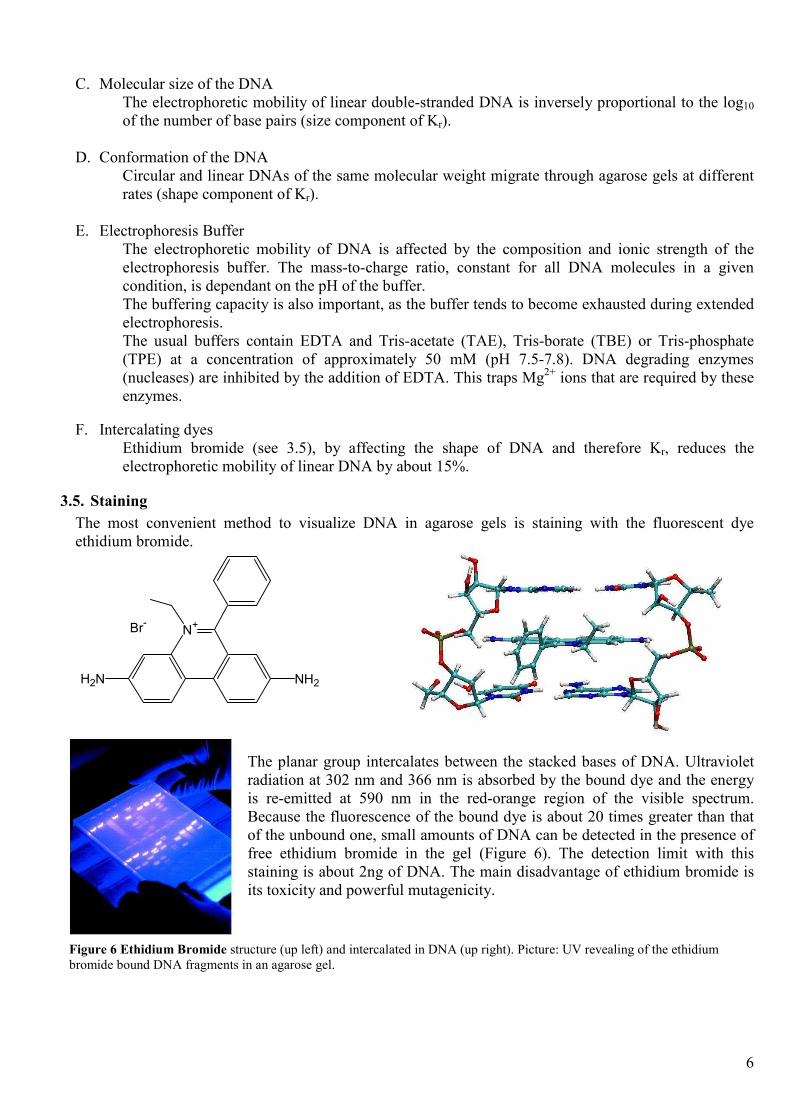
Figure 6 Ethidium Bromide structure (up left) and intercalated in DNA (up right). Picture: UV revealing of the ethidium
bromide bound DNA fragments in an agarose gel.
C. Molecular size of the DNA
The electrophoretic mobility of linear double-stranded DNA is inversely proportional to the log10 of the number of base pairs (size component of Kr).
D. Conformation of the DNA
Circular and linear DNAs of the same molecular weight migrate through agarose gels at different
rates (shape component of Kr).
E. Electrophoresis Buffer
The electrophoretic mobility of DNA is affected by the composition and ionic strength of the
electrophoresis buffer. The mass-to-charge ratio, constant for all DNA molecules in a given
condition, is dependant on the pH of the buffer.
The buffering capacity is also important, as the buffer tends to become exhausted during extended
electrophoresis.
The usual buffers contain EDTA and Tris-acetate (TAE), Tris-borate (TBE) or Tris-phosphate
(TPE) at a concentration of approximately 50 mM (pH 7.5-7.8). DNA degrading enzymes
(nucleases) are inhibited by the addition of EDTA. This traps Mg2+ ions that are required by these
enzymes.
F. Intercalating dyes
Ethidium bromide (see 3.5), by affecting the shape of DNA and therefore Kr, reduces the
electrophoretic mobility of linear DNA by about 15%.
3.5. Staining
The most convenient method to visualize DNA in agarose gels is staining with the fluorescent dye
ethidium bromide.
The planar group intercalates between the stacked bases of DNA. Ultraviolet
radiation at 302 nm and 366 nm is absorbed by the bound dye and the energy
is re-emitted at 590 nm in the red-orange region of the visible spectrum.
Because the fluorescence of the bound dye is about 20 times greater than that
of the unbound one, small amounts of DNA can be detected in the presence of
free ethidium bromide in the gel (Figure 6). The detection limit with this
staining is about 2ng of DNA. The main disadvantage of ethidium bromide is
its toxicity and powerful mutagenicity.
N+
H2N NH2
Br-
7
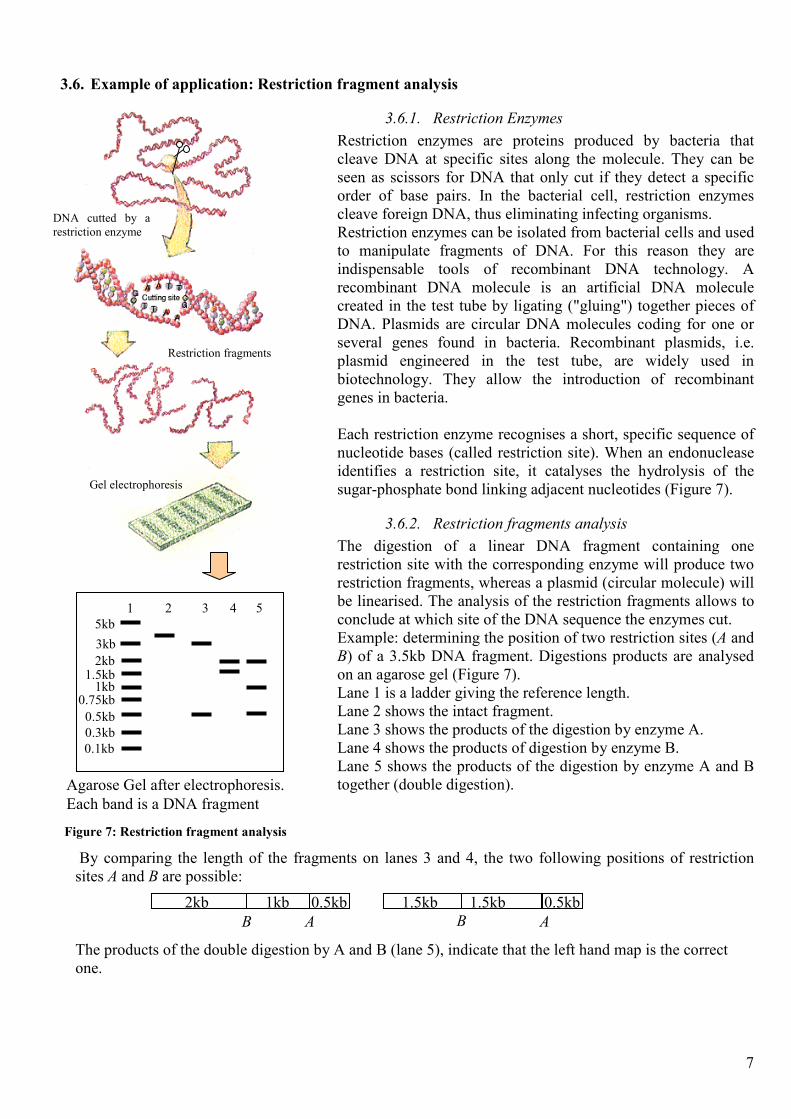
3.6. Example of application: Restriction fragment analysis
3.6.1. Restriction Enzymes
Restriction enzymes are proteins produced by bacteria that
cleave DNA at specific sites along the molecule. They can be
seen as scissors for DNA that only cut if they detect a specific
order of base pairs. In the bacterial cell, restriction enzymes
cleave foreign DNA, thus eliminating infecting organisms.
Restriction enzymes can be isolated from bacterial cells and used
to manipulate fragments of DNA. For this reason they are
indispensable tools of recombinant DNA technology. A
recombinant DNA molecule is an artificial DNA molecule
created in the test tube by ligating ("gluing") together pieces of
DNA. Plasmids are circular DNA molecules coding for one or
several genes found in bacteria. Recombinant plasmids, i.e.
plasmid engineered in the test tube, are widely used in
biotechnology. They allow the introduction of recombinant
genes in bacteria.
Each restriction enzyme recognises a short, specific sequence of
nucleotide bases (called restriction site). When an endonuclease
identifies a restriction site, it catalyses the hydrolysis of the
sugar-phosphate bond linking adjacent nucleotides (Figure 7).
3.6.2. Restriction fragments analysis
The digestion of a linear DNA fragment containing one
restriction site with the corresponding enzyme will produce two
restriction fragments, whereas a plasmid (circular molecule) will
be linearised. The analysis of the restriction fragments allows to
conclude at which site of the DNA sequence the enzymes cut.
Example: determining the position of two restriction sites (A and
B) of a 3.5kb DNA fragment. Digestions products are analysed
on an agarose gel (Figure 7).
Lane 1 is a ladder giving the reference length.
Lane 2 shows the intact fragment.
Lane 3 shows the products of the digestion by enzyme A.
Lane 4 shows the products of digestion by enzyme B.
Lane 5 shows the products of the digestion by enzyme A and B
together (double digestion).
By comparing the length of the fragments on lanes 3 and 4, the two following positions of restriction
sites A and B are possible:
The products of the double digestion by A and B (lane 5), indicate that the left hand map is the correct
one.
2kb 1kb 0.5kb 1.5kb 0.5kb 1.5kb
A A B B
DNA cutted by a
restriction enzyme
Restriction fragments
Gel electrophoresis
5kb
3kb
2kb 1.5kb 1kb
0.75kb
0.5kb
0.3kb
0.1kb
1 3 4 5 2
Agarose Gel after electrophoresis.
Each band is a DNA fragment
Figure 7: Restriction fragment analysis
8
4. PolyAcrylamide Gel Electrophoresis (PAGE)
4.1. Application
Proteins can be separated efficiently on polyacrylamide gels. PAGE of proteins is used as a preparative
method to separate proteins before further analysis but it can also be used as a direct analytical tool by
revealing the mass of the separated proteins directly in the gel (see 4.5.2).
4.2. The Gel
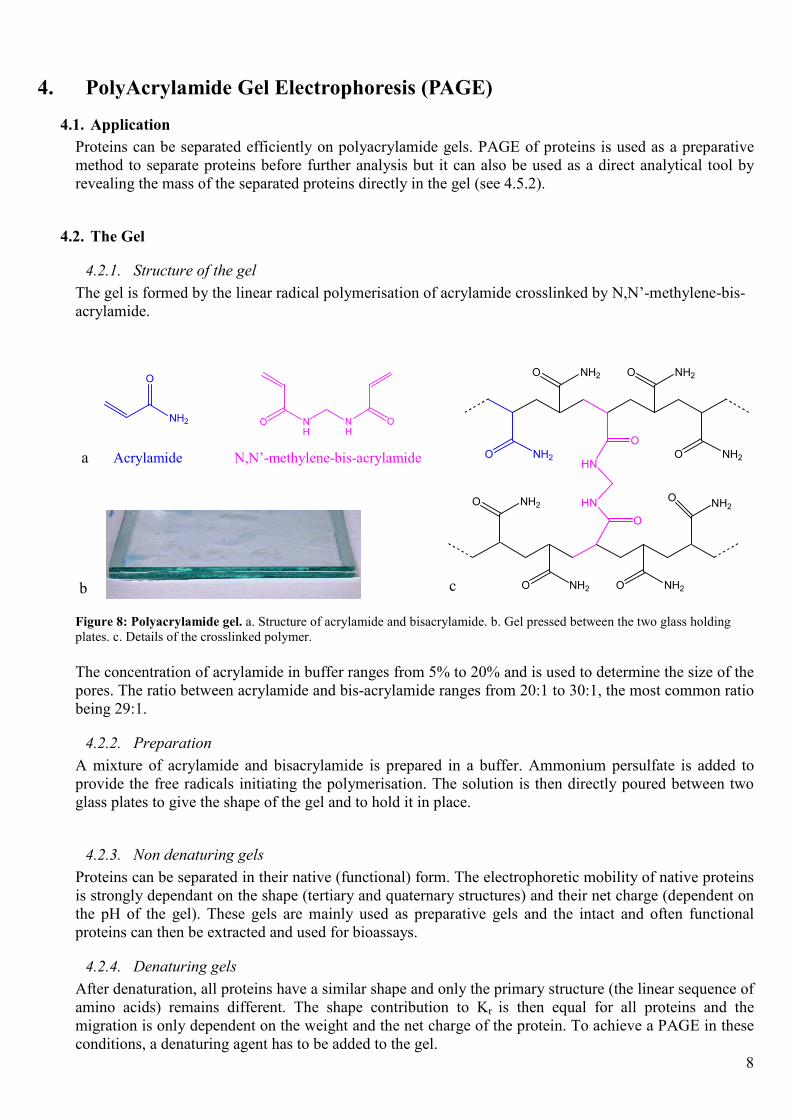
4.2.1. Structure of the gel
The gel is formed by the linear radical polymerisation of acrylamide crosslinked by N,N’-methylene-bis-
acrylamide.
Figure 8: Polyacrylamide gel. a. Structure of acrylamide and bisacrylamide. b. Gel pressed between the two glass holding
plates. c. Details of the crosslinked polymer.
The concentration of acrylamide in buffer ranges from 5% to 20% and is used to determine the size of the
pores. The ratio between acrylamide and bis-acrylamide ranges from 20:1 to 30:1, the most common ratio
being 29:1.
4.2.2. Preparation
A mixture of acrylamide and bisacrylamide is prepared in a buffer. Ammonium persulfate is added to
provide the free radicals initiating the polymerisation. The solution is then directly poured between two
glass plates to give the shape of the gel and to hold it in place.
4.2.3. Non denaturing gels
Proteins can be separated in their native (functional) form. The electrophoretic mobility of native proteins
is strongly dependant on the shape (tertiary and quaternary structures) and their net charge (dependent on
the pH of the gel). These gels are mainly used as preparative gels and the intact and often functional
proteins can then be extracted and used for bioassays.
4.2.4. Denaturing gels
After denaturation, all proteins have a similar shape and only the primary structure (the linear sequence of
amino acids) remains different. The shape contribution to Kr is then equal for all proteins and the
migration is only dependent on the weight and the net charge of the protein. To achieve a PAGE in these
conditions, a denaturing agent has to be added to the gel.
O NH2
O NH2
HN
O
HN
O NH2
O NH2
ONH2O NH2
O NH2 O NH2
O
c b
N
H
N
H
O O
O
NH2
Acrylamide N,N’-methylene-bis-acrylamide a
9
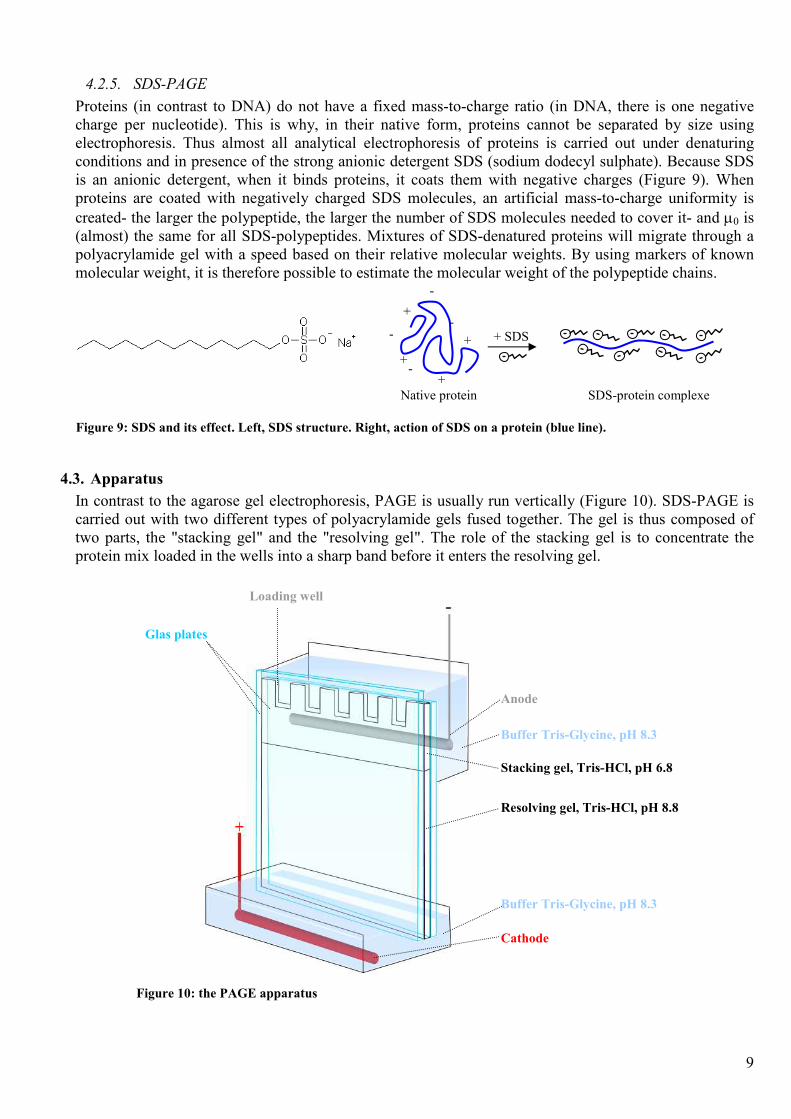
4.2.5. SDS-PAGE
Proteins (in contrast to DNA) do not have a fixed mass-to-charge ratio (in DNA, there is one negative
charge per nucleotide). This is why, in their native form, proteins cannot be separated by size using
electrophoresis. Thus almost all analytical electrophoresis of proteins is carried out under denaturing
conditions and in presence of the strong anionic detergent SDS (sodium dodecyl sulphate). Because SDS
is an anionic detergent, when it binds proteins, it coats them with negative charges (Figure 9). When
proteins are coated with negatively charged SDS molecules, an artificial mass-to-charge uniformity is
created- the larger the polypeptide, the larger the number of SDS molecules needed to cover it- and µ0 is
(almost) the same for all SDS-polypeptides. Mixtures of SDS-denatured proteins will migrate through a
polyacrylamide gel with a speed based on their relative molecular weights. By using markers of known
molecular weight, it is therefore possible to estimate the molecular weight of the polypeptide chains.
4.3. Apparatus
In contrast to the agarose gel electrophoresis, PAGE is usually run vertically (Figure 10). SDS-PAGE is
carried out with two different types of polyacrylamide gels fused together. The gel is thus composed of
two parts, the "stacking gel" and the "resolving gel". The role of the stacking gel is to concentrate the
protein mix loaded in the wells into a sharp band before it enters the resolving gel.
Figure 10: the PAGE apparatus
Buffer Tris-Glycine, pH 8.3
Anode
Cathode
Stacking gel, Tris-HCl, pH 6.8
Resolving gel, Tris-HCl, pH 8.8
Buffer Tris-Glycine, pH 8.3
Loading well
Glas plates
Native protein SDS-protein complexe
+ SDS
-
-
- -
-
+
+
+
+
Figure 9: SDS and its effect. Left, SDS structure. Right, action of SDS on a protein (blue line).
10
4.4. Factor influencing migration
The major factors influencing the migration of the SDS-Protein complexes in the resolving gel, apart
from the molecular weight, are the acrylamide-bisacrylamide ratio (affecting the “gel proprieties”
component of Kr) and the total polymer concentration (τ).
Cross-links formed from bisacrylamide add rigidity and tensile strength to the gel and form pores through
which the SDS-polypeptide complexes must pass. The size of these pores decreases as the
bisacrylamide:acrylamide ratio increases, reaching a minimum when the ratio is approximately 1:20.
Most SDS-Polyacrylamide gels are cast with a molar ratio of 1:29, which has been shown empirically to
be capable of resolving polypeptides that differ in size by as little as 3%.
Table 2 shows the linear range of separation obtained with gels containing 5% to 15% of polymer.
Table 2: Effective range of separation of SDS-Polyacrylamide gels, with a bisacrylamide:acrylamide ratio of 1:29
Acrylamide polymer concentration (%) Linear range of separation (kDa)
15 12-43
10 16-68
7.5 36-94
5.0 57-212
4.5. Staining
To reveal the protein in the polyacrylamide gels, different staining techniques have been developed. Two
different approaches can be used.
4.5.1. Staining resulting from a chemical reaction
In the silver staining, Ag+ ions form complexes with the Glutamate, Asparate and Cystein residues of the
proteins. Alkaline formaldehyde reduces the bound Ag+ from the complexes to Ag. The details of this
reaction are still unknown. The precipitated Ag reveals the protein in the gel.
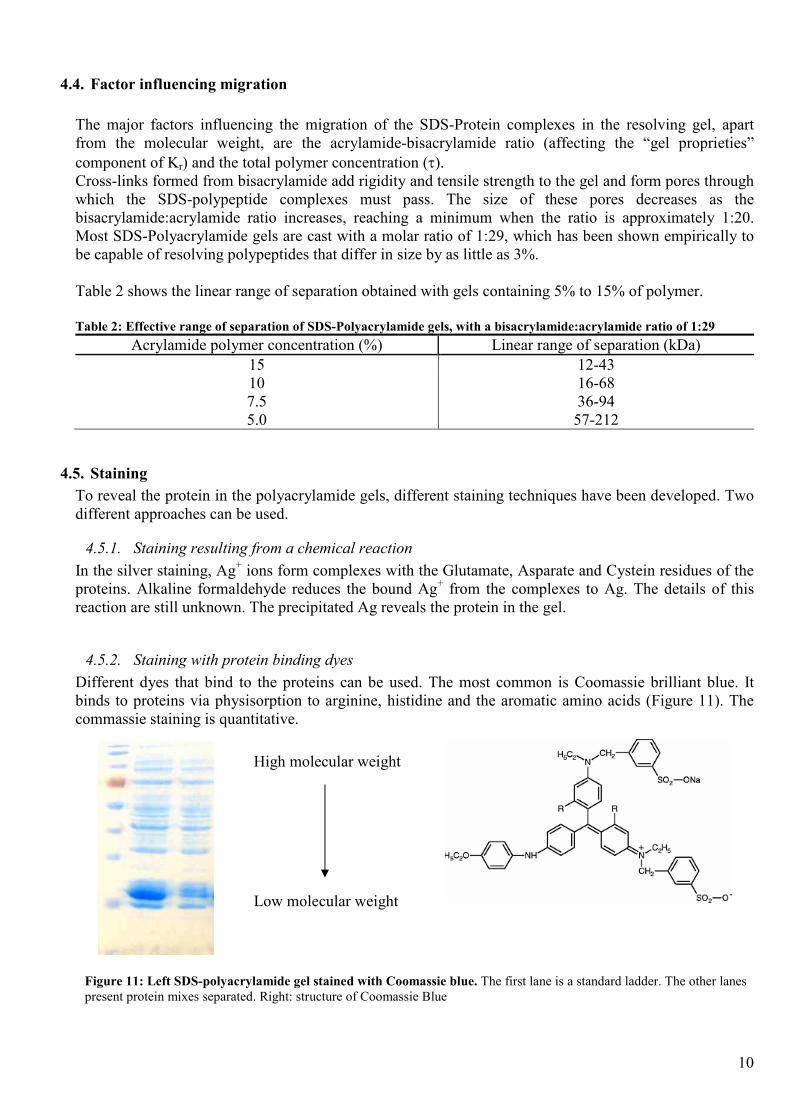
4.5.2. Staining with protein binding dyes
Different dyes that bind to the proteins can be used. The most common is Coomassie brilliant blue. It
binds to proteins via physisorption to arginine, histidine and the aromatic amino acids (Figure 11). The
commassie staining is quantitative.
Figure 11: Left SDS-polyacrylamide gel stained with Coomassie blue. The first lane is a standard ladder. The other lanes
present protein mixes separated. Right: structure of Coomassie Blue
High molecular weight
Low molecular weight
11
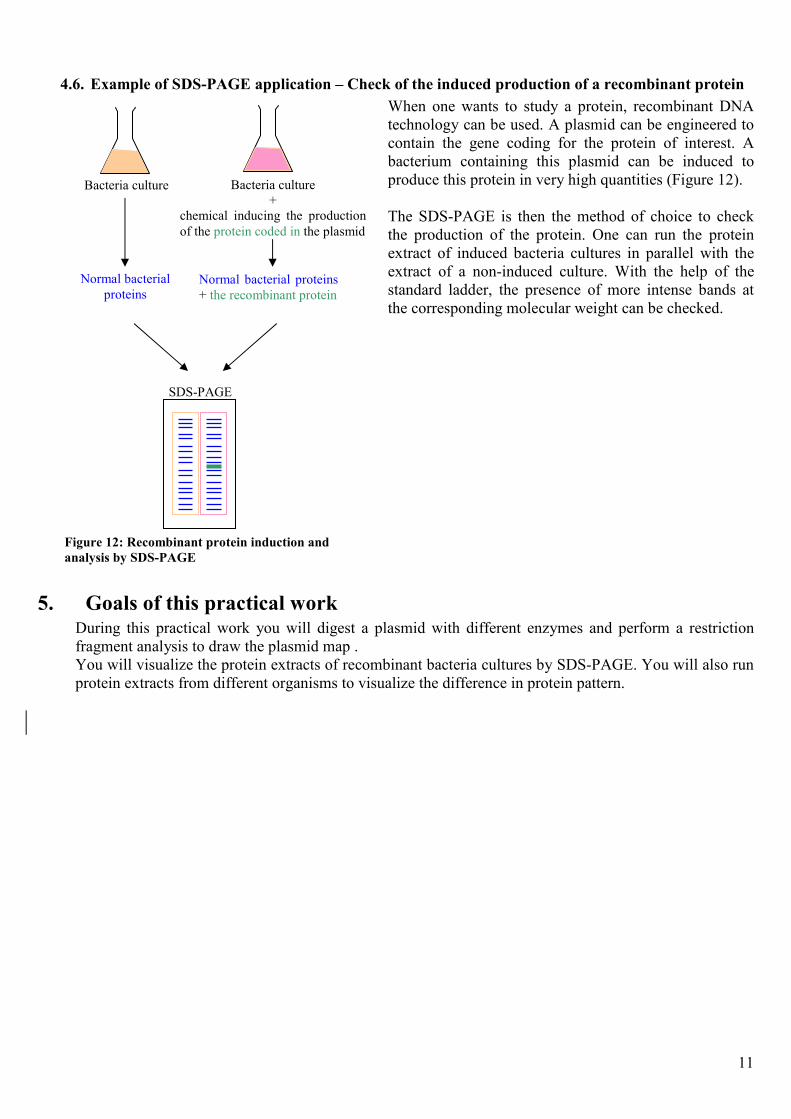
4.6. Example of SDS-PAGE application – Check of the induced production of a recombinant protein
When one wants to study a protein, recombinant DNA
technology can be used. A plasmid can be engineered to
contain the gene coding for the protein of interest. A
bacterium containing this plasmid can be induced to
produce this protein in very high quantities (Figure 12).
The SDS-PAGE is then the method of choice to check
the production of the protein. One can run the protein
extract of induced bacteria cultures in parallel with the
extract of a non-induced culture. With the help of the
standard ladder, the presence of more intense bands at
the corresponding molecular weight can be checked.
5. Goals of this practical work During this practical work you will digest a plasmid with different enzymes and perform a restriction
fragment analysis to draw the plasmid map .
You will visualize the protein extracts of recombinant bacteria cultures by SDS-PAGE. You will also run
protein extracts from different organisms to visualize the difference in protein pattern.
SDS-PAGE
Bacteria culture Bacteria culture
+
chemical inducing the production
of the protein coded in the plasmid
Normal bacterial
proteins Normal bacterial proteins
+ the recombinant protein
Figure 12: Recombinant protein induction and
analysis by SDS-PAGE
12
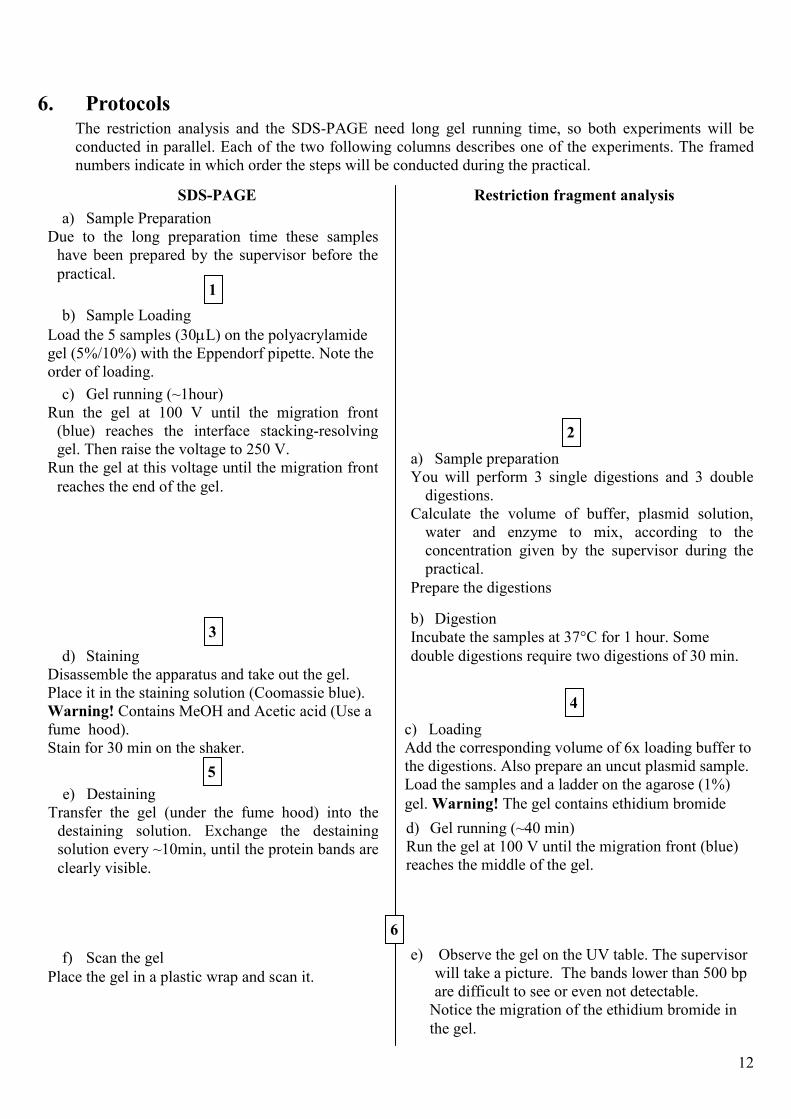
6. Protocols The restriction analysis and the SDS-PAGE need long gel running time, so both experiments will be
conducted in parallel. Each of the two following columns describes one of the experiments. The framed
numbers indicate in which order the steps will be conducted during the practical.
SDS-PAGE Restriction fragment analysis
f) Scan the gel
Place the gel in a plastic wrap and scan it.
e) Destaining
Transfer the gel (under the fume hood) into the
destaining solution. Exchange the destaining
solution every ~10min, until the protein bands are
clearly visible.
d) Staining
Disassemble the apparatus and take out the gel.
Place it in the staining solution (Coomassie blue).
Warning! Contains MeOH and Acetic acid (Use a
fume hood).
Stain for 30 min on the shaker.
c) Gel running (~1hour)
Run the gel at 100 V until the migration front
(blue) reaches the interface stacking-resolving
gel. Then raise the voltage to 250 V.
Run the gel at this voltage until the migration front
reaches the end of the gel.
b) Sample Loading
Load the 5 samples (30µL) on the polyacrylamide
gel (5%/10%) with the Eppendorf pipette. Note the
order of loading.
a) Sample Preparation
Due to the long preparation time these samples
have been prepared by the supervisor before the
practical. 1
3
5
e) Observe the gel on the UV table. The supervisor
will take a picture. The bands lower than 500 bp
are difficult to see or even not detectable.
Notice the migration of the ethidium bromide in
the gel.
d) Gel running (~40 min)
Run the gel at 100 V until the migration front (blue)
reaches the middle of the gel.
c) Loading
Add the corresponding volume of 6x loading buffer to
the digestions. Also prepare an uncut plasmid sample.
Load the samples and a ladder on the agarose (1%)
gel. Warning! The gel contains ethidium bromide
b) Digestion
Incubate the samples at 37°C for 1 hour. Some
double digestions require two digestions of 30 min.
a) Sample preparation
You will perform 3 single digestions and 3 double
digestions.
Calculate the volume of buffer, plasmid solution,
water and enzyme to mix, according to the
concentration given by the supervisor during the
practical.
Prepare the digestions
2
4
6
13
7. Analysis and report The report can be written in English (recommended) or in German.
Write a short introduction summarising the important concepts and use of gel electrophoresis (no
equations and not copied from the theory part).
Describe shortly what you did in the practical, including samples loading order, digestions you made
(which enzymes, buffers, concentration).
Make a table with the restriction fragment lengths you estimated from the gel, for each digestion.
According to this table, draw the map of the plasmid for the corresponding restriction sites.
Estimate the molecular weight of the recombinant protein and analyse the different protein patterns.
And in your descriptions of the practical part or the analysis, answer the following questions:
The loading buffers contain a dye and glycerol. Why?
How does ethidium bromide migrate in the agarose gel? Why?
Why is the digestion temperature 37°C?
8. References
Molecular Cloning, A laboratory Manual, 2
nd edition, Sambrook, Fritsch & Maniatis, Cold Spring Harbor
Laboratory Press, 1989.
The agarose double helix and its function in agarose gel structure, Arnott et al., Journal of Molecular
Biology, 1974, 90, p. 269
Der Experimentator: Proteinbiochemie/Proteomics, 4th edition, Rehm, Spektrum Akademischer Verlag,
2002
How does an SDS PAGE really work,
www.mullinslab.ucsf.edu/protocols/html/SDS_PAGE_protocol.htm
Molecular Biology of the Cell, 4th edition, Alberts, Garland Science, 2002
Gene cloning & DNA analysis, 5th edition, Brown, Blackwell Publishing, 2006
Organic Chemistry, Jonathon Clayden et al., 1st Ed., Oxford University Press, 2001.
http://www.bio.miami.edu/
http://www.ornl.gov/
Recommended