10 The Open Clinical Chemistry Journal, 2011, 4, 10-16
1874-2416/11 2011 Bentham Open
Open Access
Generating Evidence Based Interpretation of Hematology Screens via Anomaly Characterization
Gil David*,1, Larry Bernstein*
,2 and Ronald R. Coifman
1
1Department of Mathematics, Program in Applied Mathematics, Yale University, New Haven CT 06510, USA
2Triplex Consulting, New York Methodist Hospital, Brooklyn NY and Norwalk Hospital, Norwalk, CT, USA
Abstract: Introduction: We propose a simple, workable algorithm that provides assistance for interpreting any set of data
from the screen of a blood analysis with high accuracy, reliability, and inter-operability with an electronic medical record.
This has been made possible at least recently as a result of advances in mathematics, low computational costs, and rapid
transmission of the necessary data for computation.
Materials and Methods: The database used for this study is a file of 22,000 laboratory hemograms generated by two
Beckman-Coulter Gen-S analyzers over a two month period in a 630 bed acute care facility in Brooklyn. All control
samples, patient identifiers, and patients under 23 years old were stripped from the dataset. An experienced medical
practitioner reviewed all of the data used in generating the algorithm described. The differential diagnoses were outlined
prior to beginning the study, and preliminary studies were done to determine the reference ranges for each predictor. An
algorithm for anomaly detection and classification via anomaly characterization is proposed. For each patient, the
algorithm characterizes its anomalous profile and builds a differential metric to identify similar patients who are mapped
into a classification.
Results: The algorithm successfully classified patients into the diagnosis that were sufficient in sample size, and others are
still under observation. The algorithm correctly classified the patients as follows: Microcytic Anemia - 99.63%,
Normocytic Anemia - 98.03%, Mild SIRS - 73.42%, Thrombocytopenia - 99.52%, Leukocytopenia - 84.83%, Moderate /
Severe SIRS - 96.69% and Normal - 93.18%.
Discussion: This limited analysis of automated hematological results can be extended to the case of more complicated
conditions than presented, and can be extended to a combination of chemistry, hematology, immunology, and other data.
Keywords: Hemogram, Systemic Inflammatory Response Syndrome (SIRS), anemia, thrombocytopenia, structured data, interpretative comment, anomaly detection, anomaly characterization, non-linear differential diagnosis.
1. INTRODUCTION
Healthcare-associated infection (HAI) occurs in 5%-10% of hospitalized patients [1] and accounts nearly 100,000 deaths in US hospitals annually [2]. The risk of serious complications due to HAIs is particularly high for patients requiring intensive care [3, 4]. Preventing HAIs is one of 20 Priority Areas for National Action [5], and resulted in preventive measures tied to financial reimbursement. In addition, wider use of electronic data platforms to measure, report, and improve quality, National Quality Forum (NQF) has been endorsed by the NQF endorsed measures that combine data from two or more common electronic sources, including pharmacy, and laboratory systems, and other records, which cover sixteen conditions, including bone and joint conditions, cardiovascular disease, asthma and
respiratory illness, and diabetes [6].
*Address correspondence to these authors at the Department of Mathematics,
Program in Applied Mathematics, Yale University, New Haven CT 06510,
USA; Tel: 1-203-432-4345: Fax: 1-203-432-7316: E-mail: [email protected]
Triplex Consulting, New York Methodist Hospital, Brooklyn NY and
Norwalk Hospital, Norwalk, CT, USA; Tel/Fax: 203-261-8671;
E-mail: [email protected]
The timely identification of sepsis risk in acutely ill patient populations depends on an effective protocol for screening for risk to minimize the prospect of a suboptimal outcome in association with the systemic inflammatory response syndrome (SIRS), age, and disease related comorbidities, to allow for early antibiotic administration, to minimize the emergence of antibiotic resistance, and to shorten the stay and costs of intensive care unit stay, and to avoid the development of multiple organ dysfunction syndrome followed by death. Severe infection and sepsis, common causes of morbidity and mortality in intensive care units, are accompanied by clinical and laboratory signs such as changes in body temperature, leukocytosis, and tachycardia. However, these signs and symptoms of systemic inflammation may have an infectious or non-infectious aetiology and are neither specific nor sensitive for sepsis. A similar inflammatory response occurs in patients suffering from pancreatitis, major trauma, and burns without infectious complications. Patients with systemic infection and organ dysfunction or shock are often difficult to distinguish from patients with similar clinical signs and laboratory findings without infection. Since these common clinical and laboratory measurements lack sensitivity and
Generating Evidence Based Interpretation of Hematology Screens The Open Clinical Chemistry Journal, 2011, Volume 4 11
specificity, other tests are needed to give an early marker of the infectious cause of a generalized inflammatory response, to allow early diagnosis and the use of specific treatment.
This is a significant basis for the study we have undertaken to construct a software agent that can be applied to the instantaneous interpretation of the hemogram, which carries rapidly generated information about the most common conditions, such as, infection, anemia, and disordered coagulation. The hemogram is the most commonly performed test done on all patients seen in the emergency department, in the physicians' offices, and in the hospital population. It is the most essential test for anemia in children and adults, worldwide. This could be expanded to subset classifications, and can be combined with chemistry data once a firm foundation is set. While there is an example of the use of neural networks in cytological analysis, this work is unique in exploring multiple variables predicting one or several diagnostic endpoints and estimated the weighted probabilities of the results.
Predictive diagnostics is an emerging science. An
underlying principle lies in the work in bacterial taxonomy
by Eugene Rypka that illustrated a method of forming
clusters of elements with a high degree of similarity, with the
provision that each cluster (and its elements) will be disjoint
or separable to some degree from other clusters . The
development of Latent Class Clustering by the method of
Magidson and Vermunt [7-12] has held unfulfilled promise
in medical sciences. The introduction of LCM models
developed by Magidson and Vermunt allowed for examining
the structure of combinations of ordinal and continuous
variables in a data set, and the validity of the classes formed.
The possibility of examining a large data set with several
predictors and several disease states and a combination of
them in an individual patient is elusive, and there is still a
need to embed a classifying agent that could provide instantaneous second opinion.
Anomaly detection identifies patterns in a given dataset
that do not conform to an established normal behavior. The
detected patterns are called anomalies and often translated to
critical and actionable information in several application
domains since they deviate from their normal behavior.
Anomalies are also referred to as outliers, deviation,
peculiarity, etc. The anomaly detection problem, in its most
general form, is not easy to solve. In fact, most of the
existing anomaly detection techniques solve a specific
formulation (instance) of the problem. The formulation is
induced by various factors such as nature of the data,
availability of labeled data, type of anomalies to be detected,
etc. Often, these factors are determined by the application domain in which the anomalies have to be detected.
Usually, in addition to the challenge of detecting
anomalies in a dataset, the analyzed data is also high-
dimensional. High-dimensional data, meaning data which
require more than three dimensions to be represented, are
difficult to analyze and interpret. Since the data in most
modern systems can be described by hundreds and even
thousands of parameters (features), then the dimensionality
of the data is very high and its processing becomes impractical.
“Curse of dimensionality” [13] is associated with high-dimensional data. This is due to the fact is that as the dimensionality of the input data space increases, it becomes exponentially more difficult to process and analyze the data. Furthermore, adding more dimensions can increase the noise, and hence the error and in certain situations, the number of observations is insufficient to produce satisfactory dimensionality reduction. The “curse of dimensionality” is a significant obstacle for high-dimensional data analysis, since a local neighborhood in high dimensions is no longer local. Therefore, high-dimensional data is incomprehensible to understand, to draw conclusions from or to find anomalies that deviate from their normal behavior.
Although anomaly detection identifies the anomalies in the system, it lacks the characterization of these deviations. This characterization is crucial since it provides a better understanding of the anomalies and it enables a more accurate classification of them. Anomaly characterization is a subject of recent researches. It aims at understanding the statistical, temporal or spatial behavior of the anomalies in order to characterize them and, as a result, provide a more accurate and sophisticated anomaly detection.
In this paper, we propose a novel method for anomaly detection and classification via anomaly characterization. For a given hemogram in the system, we characterize its anomalous behavior via non-linear differential diagnosis processes. Then, once its characterization profile, which is its unique differential metric, is constructed, we identify other anomalous hemograms that match this differential profile. Last, in case we deal with supervised anomaly detection, we use the labels of the matching hemograms to label and classify the given hemogram.
2. MATERIALS AND METHODS
The database used for this study is 22,000 hemograms generated by the Beckman-Coulter Gen-S (Brea, Ca) over a two month period in a 630 bed acute care facility in Brooklyn. All control samples, patient identifiers, and patients under 23 years old were stripped from the dataset. An independent source experienced in medicine reviewed all of the data. The differential diagnoses were outlined prior to beginning the study, and preliminary studies were done to determine the reference ranges for each predictor.
Systematic Inflammatory Response Syndrome (SIRS) is defined as a condition in which a patient displayed any two of the following abnormal vital signs [14]:
- Temperature < 36 ˚C (hypothermia) or Temperature > 38 ˚C (hyperthermia);
- Heart Rate > 90 beats/min;
- Respiratory Rate > 20 breath/min;
- Systolic Blood Pressure < 90 mm Hg;
- White blood cell count > 12,000 cells/mm3 or < 4,000
cells/ mm3.
It may be difficult to distinguish a moderate state of disease such as pneumonia with SIRS from the severe and progressive state of sepsis, septicemia or even septic shock. CRP [15], an acute phase protein, may reduce errors from using the standard clinical criteria, and is used in assessing
12 The Open Clinical Chemistry Journal, 2011, Volume 4 David et al.
children. Procalcitonin [16] has emerged as a biomarker of sepsis, but it would have a high cost for overuse, making the algorithm based on WBC and percent neutrophils a necessary first step. The most commonly used screening methods for the presence of iron deficiency in a population are the measurements of hemoglobin/hematocrit concen-tration [16]. Because iron deficiency is often the most common cause of anemia, the presence of microcytic anemia is also used as a screening tool for iron deficiency. It is assumed that a population with a high anemia prevalence is likely to also have a high prevalence of iron deficiency, if we remove those with chronic disease. A number of physiologic characteristics such as age, sex and stage of pregnancy influence hemoglobin concentration [16, 17]. Anemia was defined according to World Health Organization (WHO) criteria as a hemoglobin concentration below 12 g/dL in women and below 13 g/dL in men.
Our database organized to enable linking a given profile to known profiles. This is achieved by associating a patient to a peer group of patients having an overall similar profile, where the similar profile is obtained through a randomized search for an appropriate weighting of variables. Given the selection of a patients' peer group, we build a metric that measures the dissimilarity of the patient from its group. This is achieved through a local iterated statistical analysis in the peer group. We then use this metric to locate other patients with similar anomalous profiles, for each of whom we repeat the procedure described above. This leads to a network of patients with similar anomalous condition. Then, the classification of the patient is inferred from the medical known condition of some of the patients in the linked network.
Given a set of points (the database) and a newly arrived sample (point), we characterize the anomalous behavior of the newly arrived sample, according to the database. Then, we detect other points in the database that match this unique characterization. This collection of detected points defines the differential neighborhood of the newly arrived sample. We use the differential neighborhood in order to classify the newly arrived sample. This process of differential diagnosis is repeated for every newly arrived point.
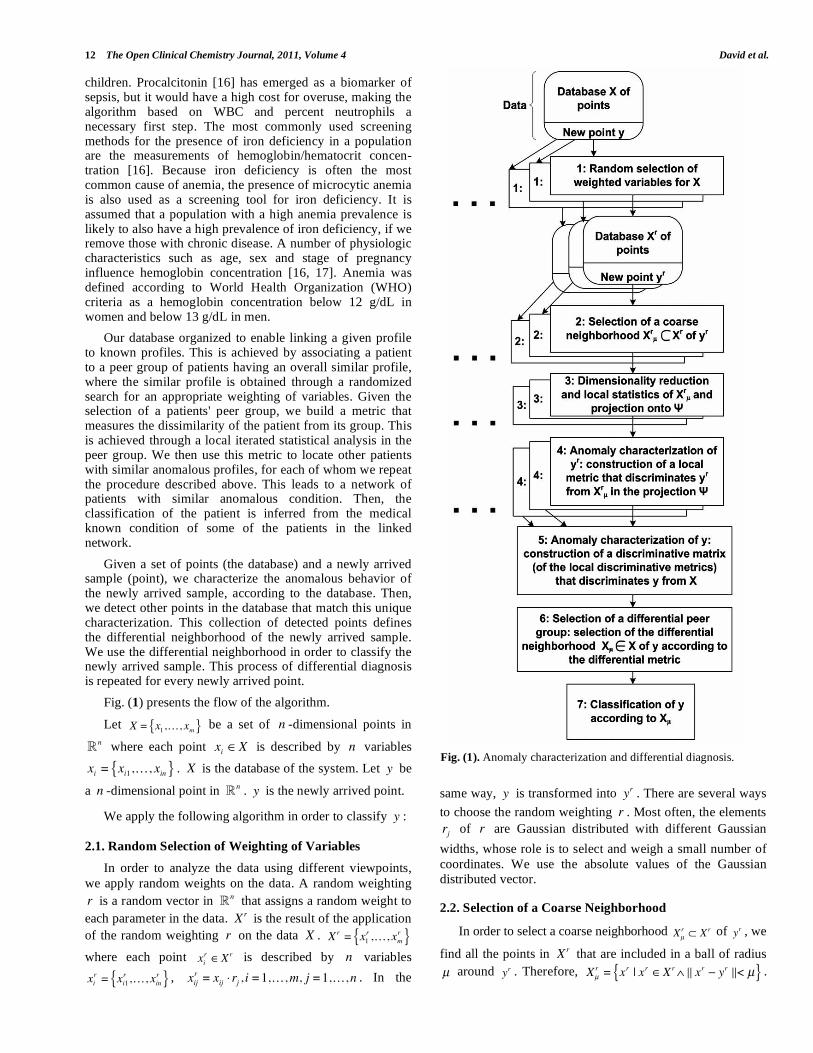
Fig. (1) presents the flow of the algorithm.
Let X = x1,…, xm{ } be a set of n -dimensional points in
n
where each point xi X is described by n variables
xi = xi1,…, xin{ } . X is the database of the system. Let y be
a n -dimensional point in n
. y is the newly arrived point.
We apply the following algorithm in order to classify y :
2.1. Random Selection of Weighting of Variables
In order to analyze the data using different viewpoints,
we apply random weights on the data. A random weighting
r is a random vector in n
that assigns a random weight to
each parameter in the data. Xr is the result of the application
of the random weighting r on the data X . Xr = x1
r ,…, xmr{ }
where each point xir X r is described by n variables
xir = xi1
r ,…, xinr{ } ,
xijr = xij rj , i =1,…,m, j =1,…,n . In the
same way, y is transformed into yr . There are several ways
to choose the random weighting r . Most often, the elements
rj of r are Gaussian distributed with different Gaussian
widths, whose role is to select and weigh a small number of
coordinates. We use the absolute values of the Gaussian
distributed vector.
2.2. Selection of a Coarse Neighborhood
In order to select a coarse neighborhood Xμ
r X r of yr , we
find all the points in Xr that are included in a ball of radius
μ around yr . Therefore, Xμ
r = xr | xr Xr xr yr < μ{ } .
Fig. (1). Anomaly characterization and differential diagnosis.
Generating Evidence Based Interpretation of Hematology Screens The Open Clinical Chemistry Journal, 2011, Volume 4 13
Xμ
r is the coarse neighborhood of yr according to the
viewpoint that was provided by the random weighting r .
2.3. Dimensionality Reduction and Local Statistics
We reduce the dimension of Xμ
r in order to find the most
significant directions of Xμ
r corresponding to yr . First, we
center Xμ
r according to yr .
X μ
r= x1
r,…, x
|Xμr |
r{ } ,
xijr= xij
r y jr , i =1,…, | Xμ
r |, j =1,…,n . Then, we compute
the Singular Value Decomposition (SVD) of the normalized
centered neighborhood. X μ
r
| Xμ
r |= U VT , where U are the
left singular vectors, the diagonal elements of are the
singular values and V are the right singular vectors. Since
X μ
r was centered according to yr , then the singular vectors
are the directions that correspond to yr . Observe that each
selection of r can introduce a different neighborhood and
therefore the SVD should be computed independently for
each such neighborhood since we cannot compute the SVD
of the data once and then multiply the singular values by the
current r .
We sort the singular values from larger to smaller and
then order V accordingly. We project the data X μ
r onto the
most significant right singular vectors V1,…,V{ } . is
determined according to the decay point of the spectrum
(where the singular values decay toward zero). Let be the
set of these projections:
= { 1,…,|Xμr|} , where
i = (xi
rV1,…, xi
rV ) ,
i =1,…, | X μ
r| and denotes the
inner product operator. Similarly, we project yr onto the
right singular vectors and denote this projection by y .
Last, we calculate the distance between the points in the
projection to y . We denote the function that transforms
the points in the coarse neighborhood into the distance in the
projection by f : Xμ
r , where f (xi
r ) = i = i y ,
xir Xμ
r and i =1,…, | Xμ
r | .
2.4. Local Discrimination
In this step, we try to discriminate yr from its coarse
neighborhood Xμ
r in the projection . A good
discrimination will significantly separate yr and some of its
very close neighbors (its peer group) from the rest of the
coarse neighborhood. A significant separation means that
there is a big gap between yr (and its peer group) and the
majority of its neighborhood. In this case, we consider the
random weighting r as discriminative and we use it in the
next steps in order to construct the differential metric. On the
other hand, if no significant gap is found, yr cannot be
separated from its neighborhood, the random weighting r is
not discriminative, and therefore we ignore it.
We sort the distances from smaller to larger and
denote the ordered distances by: = { 1,…, |Xμ
r |} , where
1 < 2 <… < |Xμ
r | . Then, we look for a significant jump in
the rate of change of . The existence of this spike implies
that there is a significant gap and r is discriminative.
Otherwise, yr is not separated from its neighborhood. If r
is discriminative, we denote by r the normalized radius of
the peer group of yr that is centered with yr . r introduces
a weight for the random weighting r . A small value of r
implies that the peer group of yr is very unique and
therefore r is more discriminative than when r has a big
value.
2.5. Construction of a Discriminative Matrix for
Anomaly Characterization
In the first step of this algorithm, we applied random
weighting on the data. Xμ
r is the selected coarse
neighborhood of yr that was provided by the random
weighting r . Different random weightings provide different
viewpoints of the data and as a result, different coarse
neighborhoods of yr are selected. In the fourth step of the
algorithm, we decided whether the random weighting r is
discriminative or not. The whole process (steps 1-4) depends
on the random weighting r . Therefore, steps 1-4 are
repeated several times using different random weightings to
search for the appropriate random weightings. Each random
weighting is classified as discriminative or not. In this step,
we fuse all the discriminative random weightings and
construct a discriminative matrix.
Let r1,…, rk{ } be the set of k discriminative random
weightings that were found. We build the discriminative
matrix R and denote the ith row of R by:
Ri (R1
i ,…,Rni ), i =1,…, k . We denote by
= 1,…, k{ }
their corresponding peer groups' radii. R and
characterize the anomalous profile of y .
2.6. Selection of the Differential Neighborhood
In this step, we select the differential neighborhood of y
that defines its differential peer group. First, we use the
differential matrix R of y and its corresponding radii to
calculate the distance between y to the points in X . Then
we discriminate y from X to find its differential peer group.
We denote the distances between y to the points
xi X, i =1,…,m by
i
1
k j=1
kxi y j
2 , where
xi y j2 =
p=1
n 1
j
(Rpj )2 (xip yp )
2.
14 The Open Clinical Chemistry Journal, 2011, Volume 4 David et al.
We sort the distances from smaller to larger and
denote the ordered distances by: = { 1,…, m} , where
1 < 2 <… < m . As described in step 4, we look for a
significant jump in the rate of change of . We use this
spike to discriminate y from X and to select its differential
peer group. We denote by Xμ X the differential
neighborhood of y , as discriminated by the spike, according
to the differential matrix R and the corresponding radii .
2.7. Classification
In case the dataset is labeled, we use the labels of Xμ in
order to classify y . Let L = {l1,…, lq} be a set of classes
(labels). For each point xi X , the corresponding label
vector ci is constructed: ci (ci1,…, ciq ) , where
cij = 1 if xi has the label l j0 otherwise.
, 1 j q
.
Each point can be associated to several classes, and
therefore have multiple labels. ci denotes the set of classes
that xi belongs to. In order to classify y according to Xμ ,
we build a corresponding label vector cy = (cy1,…, cyq ) ,
where cyj = xi Xμcij e
i , 1 j q . The classification of
y is the stochastic vector py = (py1,…, pyq ) , where
pyj =cyj
s=1
qcys
. py denotes the probability of y to belong to
each one of the classes {l1,…, lq} .
3. RESULTS
The reviewer labeled manually 4,900 hemograms that
were used as the database of the algorithm. 2,200 unlabeled
hemograms were used as the testing set. The algorithm
labeled each testing hemogram according to the labeled
database. The reviewer analyzed the results of the algorithm
regarding the testing set.
Table 1 shows the overall accuracy results. The overall
accuracy measures the accuracy of the results of the
classification as follows:
Table 1. Overall Accuracy Results
% of patients (hemograms)
Full agreement 95.70
Partial agreement 4.14
Disagreement 0.16
1. Full agreement: the algorithm identified all the labels
that were given by the reviewer to the patient;
2. Partial agreement: the algorithm identified some of
the labels that were given by the reviewer to the
patient;
3. Disagreement: the algorithm did not identify any of
the labels that were given by the reviewer to the
patient.
Table 2 shows the class accuracy results. The class accuracy measures the detection rate for each class of anomalies according to the labels that were given by the reviewer and the labels that were given by the algorithm.
DISCUSSION
This is the first application of anomaly detection and characterization to be applied to medical laboratory data, specifically the hemogram. Our results are quite remarkable as shown in the tables. Patients with iron deficiency anemia and normocytic anemia, patients with moderate and severe SIRS, and patients with thrombocytopenia are easily segmented. Those with microcytic indices who had thalassemia are readily identified using the ratio of the MCV to RBC count, but the sample is too sparse for inclusion in the prediction model. Even though the patients with SIRS had defining features, they are not homogeneous, as some have hemolytic anemia (normocytic) and/or thrombocytopenia, and there are a recognizable group of patients who have either a normal or a mild leukocytosis. They are recognized by the high percentage population of neutrophils. The childhood population and newborns would present issues of either lymphocyte population or neutropenia, quite unlike the adult population, not to mention the nucleated red cells that require a corrected leukocyte count. Although there were unsurprisingly more than a single diagnosis in a number of cases, such as, microcytic anemia with mild SIRS, the separation of combinatorial classes is not the purpose of this phase of the study.
The use of computational methods has increased in volume and complexity in the last decade. Much of this work is done with large databases for epidemiological studies. The most similar example, but different in intent and complexity is a data mining study predicting risk of mortality using the basic metabolic panel carried out using almost 280,000 adult patients seen at any Intermountain Healthcare facilty between 1999 and 2005 who had at least one basic metabolic panel (BMP), and subsequent follow-up at 30-days, 1-year, and 5-years with a mortality followup record. The researchers used a logistic regression model, and the model was validated [18]. The study uses a scaling of test results to be used in a logistic regression and further modeled using an ROC curve. The resulting score could be applied to predict for each patient. The BMP that includes the measures of glucose, electrolyte balance, and kidney function is performed on virtually all patients, like the CBC. While our study does not consider the binary question either dead or alive, the model of the study referred to is binary, and is parametric. Our study is beyond the bounds of a two class prediction, and it is nonparametric, important for reducing errors from nonlinearities. The artificial neural network is used specifically with the preference for a nonlinear discriminant solution, but also has limitations in the number
Generating Evidence Based Interpretation of Hematology Screens The Open Clinical Chemistry Journal, 2011, Volume 4 15
of outputs, which is not an issue with our proposed model and the class of structural equations models.
We are able to find a number of applications of anomaly detection in engineering problems, mainly fault tolerance [19-23]. An application in medical studies is work on blood oxygen saturation and heart rate in obstructive sleep apnea [24-26].
In order to have clear results, we selected the groups of sufficient size that the results would be valid. In the case of leukocytosis - elevation of neutrophils, lymphocytes, or indeterminate - we pooled severe and moderate SIRS, indicative of pneumonia, abdominal infection, or sepsis, into one pool, and kept mild SIRS, elevation to about 13,000, in another pool. The percent of neutrophils and lymphocytes is a criterion that would be needed as a next step, even though it is very useful. The ability for measuring accurately the amount of the subpopulation of immature neutrophilic series was technically limiting in the method used. The small size of the leukemia population and requirement for peripheral smear for final secondary analysis required that we not include that in the calculations. The requirement for a corrected neutrophil count on children because of immature nucleated red cells was sufficient reason for limiting the study to patients 23 and older.
This limited analysis of automated hematological results can be extended to the case of more complicated conditions than presented, and can be extended to a combination of chemistry, hematology, immunology, and other data, and is currently being compared with the findings of a large database of results from the Sysmex series hematology analyzer with measurement of immature granulocytes, and the manual differential. As this method is anticipated to be of practical value as a presentation of an expected assessment to the practicing physician (as in a dashboard of an airplane), and unanticipated benefit to the laboratory is a considerable reduction in necessary manual differentials in a highly productive laboratory, with possible future applications to communication of critical findings to medical staff.
REFERENCES
[1] Weinstein, R.A. Nosocomial infection update. Emerg. Infect Dis.,
1998, 4, 416-420.
[2] Klevens, R.M.; Edwards, JR; Richards, C.L. Estimating health care-associated infections and deaths in u.s. hospitals, 2002. Public
Health Rep., 2007, 122, 160-166. [3] Saint, S.; Savel, R.H.; Matthay, M.A. Enhancing the safety of
critically ill patients by reducing urinary and central venous catheter-related infections. Am. J. Respir. Crit. Care Med., 2002,
165, 1475-1479. [4] Singh, N.; Brennan, P.J.; Bell, M. Primum non nocere. Infect.
Control Hosp. Epidemiol., 2008, 29, S1-S2. [5] Adams, K.; Corrigan, J. Institute of medicine committee on
identifying priority areas for quality improvement. In: Priority Areas for National Action: Transforming Health Care Quality.
National Academies Press: Washington, DC, 2003. [6] NQF endorses measures to incrementally advance use of electronic
data for quality improvement. www.rtmagazine.com/press_release [7] Bernstein, L.H.; Russell, P.J.; Foster, W.D. Preliminary use of
linear discriminant function to predict success or failure of kidney transplant. Ann. Clin. Lab. Sci., 1982, 12, 60-67.
[8] Bernstein, L.H.; Tsokos, C.P.; Turner, J.C. Nonparametric detection scheme for myocardial infarction. J. Med. Systems, 1979,
2, 203-212. [9] Bernstein, L.H.; Good, I.J.; Holtzman, G.I.; Deaton, M.L.; Babb, J.
Diagnosis of myocardial infarction from two enzyme measurements of creatine kinase isoenzyme mb with use of
nonparametric probability estimation. Clin. Chem., 1989, 35, 444-447.
[10] Rudolph, R.A.; Bernstein, L.H.; Babb, J. Information-induction for the diagnosis of myocardial infarction. Clin. Chem., 1988, 34,
2031-2038. [11] Rypka, E.W. Truth table classification and identification. Space
Life Sci., 1971, 3, 135-156. [12] Bernstein, L.H.; Qamar, A.; McPherson, C.; Zarich, S.; Rudolph,
R. Diagnosis of myocardial infarction: integration of serum markers and clinical descriptors using information theory. Yale J.
Biol. Med., 1999, 72, 5-13. [13] Bellman, R.E. Adaptive Control Processes. Princeton University
Press: Princeton, NJ, 1961. [14] American college of chest physicians/society of critical care
medicine consensus conference: definitions for sepsis and organ failure and guidelines for the use of innovative therapies in sepsis.
Crit. Care Med, 1992, 20(6), 864-874. [15] Dupond, J.L.; de Wazieres, B.; Million, P.; Humbert, P.; Gibey, R.
Neutrophilic leukocytosis of systemic or bacterial origin: discriminative c-reactive protein? Rev. Med. Interne., 1990, 11,
289-292. [16] Simon, L.; Gauvin, F.; Amre, D.K.; Saint-Louis, P.; Lacroix, J.
World health organization (1994) indicators and strategies for iron deficiency and anemia programmes. In: Report of the
WHO/UNICEF/UNU Consultation, Geneva, Switzerland, 1993. [17] Yip, R.; Johnson, C.; Dallman, P.R. Age-related changes in
laboratory values used in the diagnosis of anemia and iron deficiency. Am. J. Clin. Nutr., 1984, 39, 427-436.
[18] May, H.T.; Horne, B.D.; Ronnow, B.S.; Renlund, D.G.; Muhlestein, J.B.; Lappe, D.L. Superior predictive ability for death
Table 2. Class Accuracy Results
Number of labels given by the
reviewer
Number of labels given by the
algorithm
% detection of the algorithm
Microcytic Anemia 545 543 99.63
Normocytic Anemia 508 498 98.03
Mild SIRS 79 58 73.42
Thrombocytopenia 629 626 99.52
Leukocytopenia 178 151 84.83
Moderate / Severe SIRS 151 146 96.69
Normal 44 41 93.18

16 The Open Clinical Chemistry Journal, 2011, Volume 4 David et al.
of a basic metabolic profile risk score. Am. Heart. J., 2009, 157,
946-954. [19] Majorczyk, F.; Totel, E.; Ludovic, M.; Saidane, A. Anomaly
detection with diagnosis in diversified systems using information flow graphs. In: Proc. of the IFIP TC-11 23rd International
Information Security Conference, IFIP 20th World Computer Congress, IFIP SEC 2008, Milan, Italy, 2008.
[20] Yang, L.; Liu, C.; Schopf, J.M.; Foster, I. Anomaly detection and diagnosis in grid environments. In: Proceedings of the 2007
ACM/IEEE conference on Supercomputing, 2007. [21] Budalakoti, S.; Srivistava, A.N.; Otey, M.E. Anomaly detection
and diagnosis algorithms for discrete symbol sequences with applications to airline safety. In: IEEE Transactions on Systems,
Man, and Cybernetics, Part C: Applications and Reviews, 2009, 39, 101-113.
[22] Maxion, R.A. Anomaly detection for diagnosis. In: Fault-Tolerant Computing, DTCS-20. 20th International Symposium, 1990, pp. 20-
27.
[23] Zhang, B.; Georgoulas, G.; Orchard, M.; Saxena, A. Rolling
element bearing feature extraction and anomaly detection based on vibration monitoring. In: Proc. 16th Mediterranean Conference on
Control and Automation, 2008, pp. 1792-1797. [24] Alvarez, D.; Hoernero, R.; Abasolo, D.; del Campo, F. Nonlinear
measurement of synchrony between blood oxygen saturation and heart rate from nocturnal pulse oxymetry in obstructive sleep
apnea. Physiol. Meas., 2009, 30(9), 967-982. [25] Alvarez, D.; Hornero, R.; Abasolo, D.; del Campo, F.; Zamarron,
C. Nonlinear characteristics of blood oxygen saturation from nocturnal oximetry for obstructive sleep apnea detection. Physiol.
Meas., 2006, 27(4), 399-412. [26] Zamarron, C.; Pichel, F.; Romero, P.V. Coherence between oxygen
saturation and heart rate obtained from pulse oximetric recordings in obstructive sleep apnea. Physiol. Meas., 2005, 26(5), 799-810.
Received: November 25, 2010 Revised: December 28, 2010 Accepted: January 05, 2011
© David et al.; Licensee Bentham Open.
This is an open access article licensed under the terms of the Creative Commons Attribution Non-Commercial License (http://creativecommons.org/licenses/
by-nc/3.0/) which permits unrestricted, non-commercial use, distribution and reproduction in any medium, provided the work is properly cited.
Recommended
![An Automated Draft Report Generator for Peripheral Blood ...€¦ · [3], for some red blood cell (RBC) abnormalities, interpretation of the parameters produced by hematology analyzers](https://img.pdfslide.net/doc/110x75/605c58b670abb5342f0335e0/an-automated-draft-report-generator-for-peripheral-blood-3-for-some-red-blood.jpg)