Getting Startedwith LabVIEWGetting Started with LabVIEW
November 2001 EditionPart Number 321527E-01
Worldwide Technical Support and Product Information
ni.com
National Instruments Corporate Headquarters
11500 North Mopac Expressway Austin, Texas 78759-3504 USA Tel: 512 683 0100
Worldwide Offices
Australia 03 9879 5166, Austria 0662 45 79 90 0, Belgium 02 757 00 20, Brazil 011 284 5011,Canada (Calgary) 403 274 9391, Canada (Montreal) 514 288 5722, Canada (Ottawa) 613 233 5949,Canada (Québec) 514 694 8521, Canada (Toronto) 905 785 0085, China (Shanghai) 021 6555 7838,China (ShenZhen) 0755 3904939, Czech Republic 02 2423 5774, Denmark 45 76 26 00, Finland 09 725 725 11,France 01 48 14 24 24, Germany 089 741 31 30, Greece 30 1 42 96 427, Hong Kong 2645 3186,India 91805275406, Israel 03 6120092, Italy 02 413091, Japan 03 5472 2970, Korea 02 596 7456,Malaysia 603 9596711, Mexico 001 800 010 0793, Netherlands 0348 433466, New Zealand 09 914 0488,Norway 32 27 73 00, Poland 0 22 528 94 06, Portugal 351 1 726 9011, Russia 095 2387139,Singapore 2265886, Slovenia 386 3 425 4200, South Africa 11 805 8197, Spain 91 640 0085,Sweden 08 587 895 00, Switzerland 056 200 51 51, Taiwan 02 2528 7227, United Kingdom 01635 523545
For further support information, see the Technical Support Resources appendix. To comment on thedocumentation, send e-mail to [email protected].
© 1997, 2001 National Instruments Corporation. All rights reserved.
Important Information
WarrantyThe media on which you receive National Instruments software are warranted not to fail to execute programming instructions, due to defectsin materials and workmanship, for a period of 90 days from date of shipment, as evidenced by receipts or other documentation. NationalInstruments will, at its option, repair or replace software media that do not execute programming instructions if National Instruments receivesnotice of such defects during the warranty period. National Instruments does not warrant that the operation of the software shall beuninterrupted or error free.
A Return Material Authorization (RMA) number must be obtained from the factory and clearly marked on the outside of the package beforeany equipment will be accepted for warranty work. National Instruments will pay the shipping costs of returning to the owner parts which arecovered by warranty.
National Instruments believes that the information in this document is accurate. The document has been carefully reviewed for technicalaccuracy. In the event that technical or typographical errors exist, National Instruments reserves the right to make changes to subsequenteditions of this document without prior notice to holders of this edition. The reader should consult National Instruments if errors are suspected.In no event shall National Instruments be liable for any damages arising out of or related to this document or the information contained in it.
EXCEPT AS SPECIFIED HEREIN, NATIONAL INSTRUMENTS MAKES NO WARRANTIES, EXPRESS OR IMPLIED, AND SPECIFICALLY DISCLAIMS ANY WARRANTY OF
MERCHANTABILITY OR FITNESS FOR A PARTICULAR PURPOSE. CUSTOMER’S RIGHT TO RECOVER DAMAGES CAUSED BY FAULT OR NEGLIGENCE ON THE PART OF
NATIONAL INSTRUMENTS SHALL BE LIMITED TO THE AMOUNT THERETOFORE PAID BY THE CUSTOMER. NATIONAL INSTRUMENTS WILL NOT BE LIABLE FOR
DAMAGES RESULTING FROM LOSS OF DATA, PROFITS, USE OF PRODUCTS, OR INCIDENTAL OR CONSEQUENTIAL DAMAGES, EVEN IF ADVISED OF THE POSSIBILITY
THEREOF. This limitation of the liability of National Instruments will apply regardless of the form of action, whether in contract or tort, includingnegligence. Any action against National Instruments must be brought within one year after the cause of action accrues. National Instrumentsshall not be liable for any delay in performance due to causes beyond its reasonable control. The warranty provided herein does not coverdamages, defects, malfunctions, or service failures caused by owner’s failure to follow the National Instruments installation, operation, ormaintenance instructions; owner’s modification of the product; owner’s abuse, misuse, or negligent acts; and power failure or surges, fire,flood, accident, actions of third parties, or other events outside reasonable control.
CopyrightUnder the copyright laws, this publication may not be reproduced or transmitted in any form, electronic or mechanical, including photocopying,recording, storing in an information retrieval system, or translating, in whole or in part, without the prior written consent of NationalInstruments Corporation.
TrademarksLabVIEW™, National Instruments™, NI-488™, NI-488.2™, ni.com™, NI-DAQ™, NI-FBUS™, and NI-VISA™ are trademarks ofNational Instruments Corporation.
Product and company names mentioned herein are trademarks or trade names of their respective companies.
PatentsThe product described in this manual may be protected by one or more U.S. patents, foreign patents, or pending applications. Refer toni.com/legal/patents for the most current list of patents covering this product.
The LabVIEW software is covered by one or more of the following Patents: United States Patent No(s): 4,901,221; 4,914,568; 5,291,587;5,301,301; 5,301,336; 5,475,851; 5,481,740; 5,481,741; 5,497,500; 5,504,917; 5,583,988; 5,610,828; 5,652,909; 5,732,277; 5,734,863;5,737,622; 5,764,546; 5,784,275; 5,821,934; 5,847,953; 5,905,649; 5,920,479; 5,974,254; 5,990,906; 6,064,812; 6,064,816; 6,102,965;6,138,270; D384051; D387750; D384050; D384052; European Patent No(s).: 0242131; Japanese Patent No(s).: 3,016,783; Canadian PatentNo(s).: 1285655
Various other software products may be included with this version of LabVIEW. If any software products listed below are included, they arecovered by various Patents as follows:
The LabVIEW Signal Processing Toolset is covered by one or more of the following Patents: U.S. Patent No(s).: 5,353,233; 6,108,609;European Patent No(s).: 0632899; Japanese Patent No(s).: 2,697,957
The LabVIEW Datalogging and Supervisory Control Module is covered by one or more of the following Patents: U.S. Patent No(s).: 5,966,532;6,053,951
LabVIEW Real Time is covered by one or more of the following Patents: U.S. Patent No(s).: 6,173,438
The LabVIEW PID Control Toolset is covered by one or more of the following Patents: U.S. Patent No(s).: 6,081,751
The IVI Driver Toolset is covered by one or more of the following Patents: U.S. Patent No(s).: 5,963,726; 6,085,156
The NI-VISA software is covered by one or more of the following Patents: U.S. Patent No(s).: 5,724,272; 5,710,727; 5,847,955; 5,640,572;5,771,388; 5,627,988; 5,717,614
The NI-DAQ software is covered by one or more of the following Patents: U.S. Patent No(s).: 5,619,702; 6,067,584; 6,096,094; 6,052,743;6,148,438; 5,926,775; 5,987,530; 6,073,205
The NI-488 or NI-488.2 (NI-GPIB) software is covered by one or more of the following Patents: U.S. Patent No(s).: 5,974,541; 5,964,892;5,958,028; 5,987,530; 6,073,205
The NI-FBUS software, including one or more of the NI-FBUS Configurator software or the NI-FBUS Monitor software, is covered by one ormore of the following Patents: U.S. Patent No(s).: 5,854,890; 5,796,721; 5,850,523; 5,971,581; 6,141,596; 6,076,952; 5,978,850
WARNING REGARDING USE OF NATIONAL INSTRUMENTS PRODUCTS(1) NATIONAL INSTRUMENTS PRODUCTS ARE NOT DESIGNED WITH COMPONENTS AND TESTING FOR A LEVEL OFRELIABILITY SUITABLE FOR USE IN OR IN CONNECTION WITH SURGICAL IMPLANTS OR AS CRITICAL COMPONENTS INANY LIFE SUPPORT SYSTEMS WHOSE FAILURE TO PERFORM CAN REASONABLY BE EXPECTED TO CAUSE SIGNIFICANTINJURY TO A HUMAN.
(2) IN ANY APPLICATION, INCLUDING THE ABOVE, RELIABILITY OF OPERATION OF THE SOFTWARE PRODUCTS CAN BEIMPAIRED BY ADVERSE FACTORS, INCLUDING BUT NOT LIMITED TO FLUCTUATIONS IN ELECTRICAL POWER SUPPLY,COMPUTER HARDWARE MALFUNCTIONS, COMPUTER OPERATING SYSTEM SOFTWARE FITNESS, FITNESS OF COMPILERSAND DEVELOPMENT SOFTWARE USED TO DEVELOP AN APPLICATION, INSTALLATION ERRORS, SOFTWARE ANDHARDWARE COMPATIBILITY PROBLEMS, MALFUNCTIONS OR FAILURES OF ELECTRONIC MONITORING OR CONTROLDEVICES, TRANSIENT FAILURES OF ELECTRONIC SYSTEMS (HARDWARE AND/OR SOFTWARE), UNANTICIPATED USES ORMISUSES, OR ERRORS ON THE PART OF THE USER OR APPLICATIONS DESIGNER (ADVERSE FACTORS SUCH AS THESE AREHEREAFTER COLLECTIVELY TERMED “SYSTEM FAILURES”). ANY APPLICATION WHERE A SYSTEM FAILURE WOULDCREATE A RISK OF HARM TO PROPERTY OR PERSONS (INCLUDING THE RISK OF BODILY INJURY AND DEATH) SHOULDNOT BE RELIANT SOLELY UPON ONE FORM OF ELECTRONIC SYSTEM DUE TO THE RISK OF SYSTEM FAILURE. TO AVOIDDAMAGE, INJURY, OR DEATH, THE USER OR APPLICATION DESIGNER MUST TAKE REASONABLY PRUDENT STEPS TOPROTECT AGAINST SYSTEM FAILURES, INCLUDING BUT NOT LIMITED TO BACK-UP OR SHUT DOWN MECHANISMS.BECAUSE EACH END-USER SYSTEM IS CUSTOMIZED AND DIFFERS FROM NATIONAL INSTRUMENTS' TESTINGPLATFORMS AND BECAUSE A USER OR APPLICATION DESIGNER MAY USE NATIONAL INSTRUMENTS PRODUCTS INCOMBINATION WITH OTHER PRODUCTS IN A MANNER NOT EVALUATED OR CONTEMPLATED BY NATIONALINSTRUMENTS, THE USER OR APPLICATION DESIGNER IS ULTIMATELY RESPONSIBLE FOR VERIFYING AND VALIDATINGTHE SUITABILITY OF NATIONAL INSTRUMENTS PRODUCTS WHENEVER NATIONAL INSTRUMENTS PRODUCTS AREINCORPORATED IN A SYSTEM OR APPLICATION, INCLUDING, WITHOUT LIMITATION, THE APPROPRIATE DESIGN,PROCESS AND SAFETY LEVEL OF SUCH SYSTEM OR APPLICATION.
Conventions
The following conventions are used in this manual:
» The » symbol leads you through nested menu items and dialog box optionsto a final action. The sequence File»Page Setup»Options directs you topull down the File menu, select the Page Setup item, and select Optionsfrom the last dialog box.
This icon denotes a tip, which alerts you to advisory information.
This icon denotes a note, which alerts you to important information.
bold Bold text denotes items that you must select or click on in the software,such as menu items and dialog box options. Bold text also denotes paletteand parameter names.
italic Italic text denotes variables, emphasis, a cross reference, or an introductionto a key concept. This font also denotes text that is a placeholder for a wordor value that you must supply.
monospace Text in this font denotes text or characters that you should enter from thekeyboard, sections of code, programming examples, and syntax examples.This font is also used for the proper names of disk drives, paths, directories,programs, subprograms, subroutines, device names, functions, operations,variables, filenames and extensions, and code excerpts.
Platform Text in this font denotes a specific platform and indicates that the textfollowing it applies only to that platform.
right-click (Macintosh) Press <Command>-click to perform the same action as aright-click.
© National Instruments Corporation vii Getting Started with LabVIEW
Contents
Chapter 1Introduction to LabVIEW
What Is LabVIEW? .......................................................................................................1-1Why Should I Use LabVIEW? ......................................................................................1-2How Does LabVIEW Work? .........................................................................................1-2
Front Panel.......................................................................................................1-3Block Diagram.................................................................................................1-3Palettes.............................................................................................................1-3
Tools Palette......................................................................................1-3Controls Palette .................................................................................1-4Functions Palette ...............................................................................1-5Navigating the Controls and Functions Palettes ...............................1-6
Data Flow ........................................................................................................1-6Where Do I Start? ..........................................................................................................1-7
LabVIEW Tutorial...........................................................................................1-7
Chapter 2Virtual Instruments
Search for Example VIs .................................................................................................2-1Build a Virtual Instrument .............................................................................................2-2
Create a User Interface ....................................................................................2-2Build the Block Diagram.................................................................................2-4Wire and Run the VI........................................................................................2-6Add Timing to the VI ......................................................................................2-8Add Analysis and File I/O to the VI................................................................2-9
Chapter 3Measurement
Instrument I/O................................................................................................................3-1Run the Demo Scope VI..................................................................................3-2
Data Acquisition ............................................................................................................3-2Use the DAQ Solution Wizard ........................................................................3-3
Configure Analog Input Channels ....................................................3-3Generate a Solution from the Solutions Gallery ...............................3-5
Add Analog Input to the VI.............................................................................3-6
Contents
Getting Started with LabVIEW viii ni.com
Chapter 4Debugging
Use Execution Highlighting .......................................................................................... 4-1Single-Step with Probes ................................................................................................ 4-1
Chapter 5Where to Go from Here
Online Help ................................................................................................................... 5-1National Instruments’ Commitment to You .................................................................. 5-2
Customer Education........................................................................................ 5-2Alliance Program ............................................................................................ 5-2
Appendix ASystem Requirements
Appendix BTechnical Support Resources
Glossary
© National Instruments Corporation 1-1 Getting Started with LabVIEW
1Introduction to LabVIEW
Refer to Appendix A, System Requirements, for more information aboutsystem configuration requirements. Refer to the LabVIEW Release Notesfor installation instructions.
What Is LabVIEW?LabVIEW is a graphical programming language that uses icons instead oflines of text to create applications. In contrast to text-based programminglanguages, where instructions determine program execution, LabVIEWuses dataflow programming, where the flow of data determines execution.
In LabVIEW, you build a user interface by using a set of tools and objects.The user interface is known as the front panel. You then add code usinggraphical representations of functions to control the front panel objects.The block diagram contains this code. In some ways, the block diagramresembles a flowchart.
You can purchase several add-on software toolsets for developingspecialized applications. All the toolsets integrate seamlessly in LabVIEW.Refer to the National Instruments Web site at ni.com for moreinformation about these toolsets.
LabVIEW is integrated fully for communication with hardware such asGPIB, VXI, PXI, RS-232, RS-485, and data acquisition control, vision, andmotion control devices. LabVIEW also has built-in features for connectingyour application to the Internet using the LabVIEW web server andsoftware standards such as TCP/IP networking and ActiveX.
Using LabVIEW, you can create 32-bit compiled applications that giveyou the fast execution speeds needed for custom data acquisition, test,measurement, and control solutions. You also can create stand-aloneexecutables and shared libraries, like DLLs, because LabVIEW is a true32-bit compiler.
LabVIEW contains comprehensive libraries for data collection, analysis,presentation, and storage. LabVIEW also includes traditional programdevelopment tools. You can set breakpoints, animate program execution,
Chapter 1 Introduction to LabVIEW
Getting Started with LabVIEW 1-2 ni.com
and single-step through the program to make debugging and developmenteasier.
LabVIEW also provides numerous mechanisms for connecting toexternal code or software through DLLs, shared libraries, ActiveX, andmore. In addition, numerous add-on tools are available for a variety ofapplication needs.
Why Should I Use LabVIEW?LabVIEW empowers you to build your own solutions for scientific andengineering systems. LabVIEW gives you the flexibility and performanceof a powerful programming language without the associated difficulty andcomplexity.
LabVIEW gives thousands of successful users a faster way to programinstrumentation, data acquisition, and control systems. By using LabVIEWto prototype, design, test, and implement your instrument systems, you canreduce system development time and increase productivity by a factorof 4 to 10.
LabVIEW also gives you the benefits of a large installed user base, yearsof product feedback, and powerful add-on tools. Finally, NationalInstruments technical support and Developer Zone ensure successfuldevelopment of your solutions.
How Does LabVIEW Work?LabVIEW programs are called virtual instruments, or VIs, becausetheir appearance and operation imitate physical instruments, such asoscilloscopes and multimeters. Every VI uses functions that manipulateinput from the user interface or other sources and display that informationor move it to other files or other computers.
A VI contains the following three components:
• Front panel—Serves as the user interface.
• Block diagram—Contains the graphical source code that defines thefunctionality of the VI.
• Icon and connector pane—Identifies the VI so that you can use theVI in another VI. A VI within another VI is called a subVI. A subVIcorresponds to a subroutine in text-based programming languages.
Chapter 1 Introduction to LabVIEW
© National Instruments Corporation 1-3 Getting Started with LabVIEW
Front PanelThe front panel is the user interface of the VI. You build the front panel withcontrols and indicators, which are the interactive input and output terminalsof the VI, respectively. Controls are knobs, pushbuttons, dials, and otherinput devices. Indicators are graphs, LEDs, and other displays. Controlssimulate instrument input devices and supply data to the block diagram ofthe VI. Indicators simulate instrument output devices and display data theblock diagram acquires or generates.
Block DiagramAfter you build the front panel, you add code using graphicalrepresentations of functions to control the front panel objects. The blockdiagram contains this graphical source code. Front panel objects appear asterminals on the block diagram.
Additionally, the block diagram contains functions and structures frombuilt-in LabVIEW VI libraries. Wires connect each of the nodes on theblock diagram, including control and indicator terminals, functions, andstructures.
PalettesLabVIEW palettes give you the options you need to create and edit the frontpanel and block diagram.
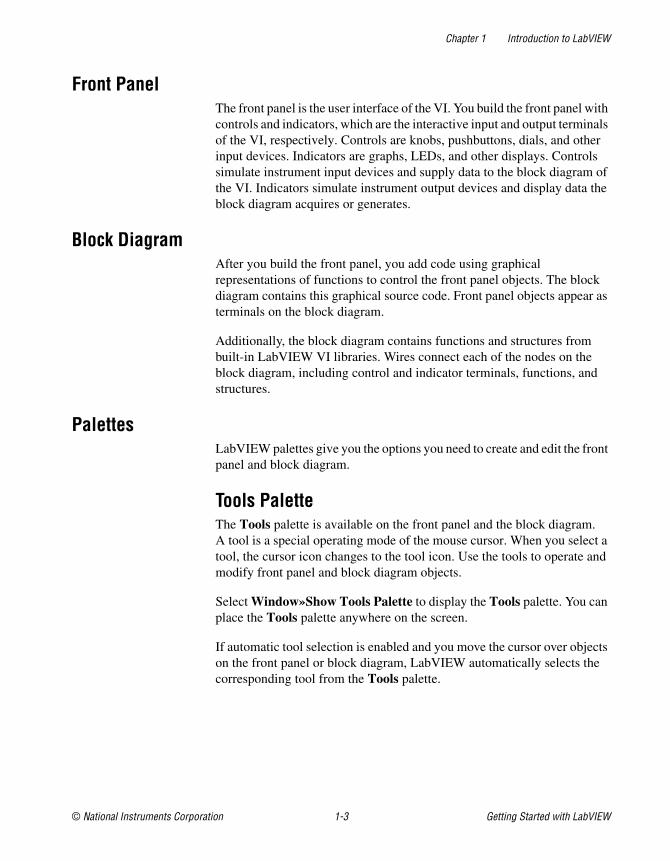
Tools PaletteThe Tools palette is available on the front panel and the block diagram.A tool is a special operating mode of the mouse cursor. When you select atool, the cursor icon changes to the tool icon. Use the tools to operate andmodify front panel and block diagram objects.
Select Window»Show Tools Palette to display the Tools palette. You canplace the Tools palette anywhere on the screen.
If automatic tool selection is enabled and you move the cursor over objectson the front panel or block diagram, LabVIEW automatically selects thecorresponding tool from the Tools palette.
Chapter 1 Introduction to LabVIEW
Getting Started with LabVIEW 1-4 ni.com
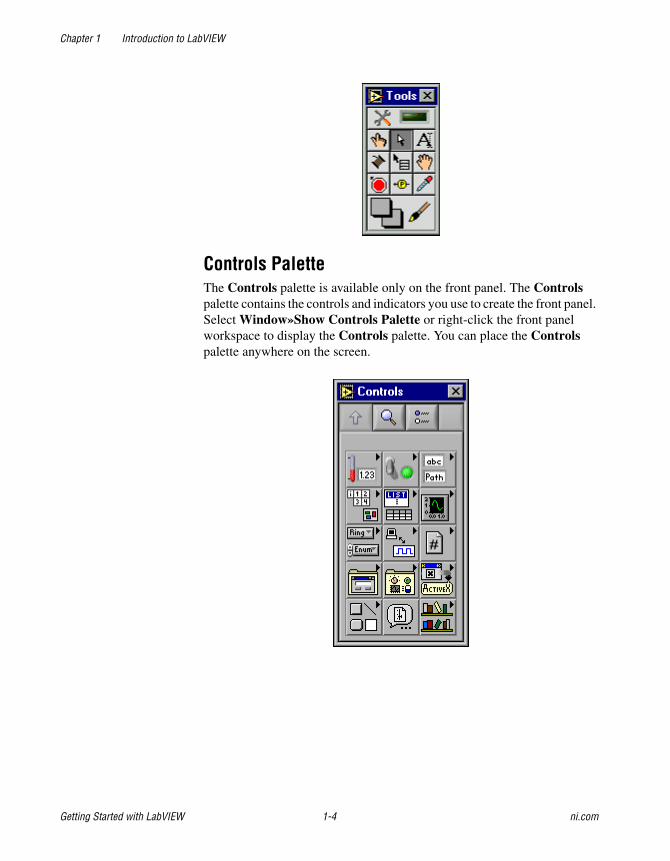
Controls PaletteThe Controls palette is available only on the front panel. The Controlspalette contains the controls and indicators you use to create the front panel.Select Window»Show Controls Palette or right-click the front panelworkspace to display the Controls palette. You can place the Controlspalette anywhere on the screen.
Chapter 1 Introduction to LabVIEW
© National Instruments Corporation 1-5 Getting Started with LabVIEW
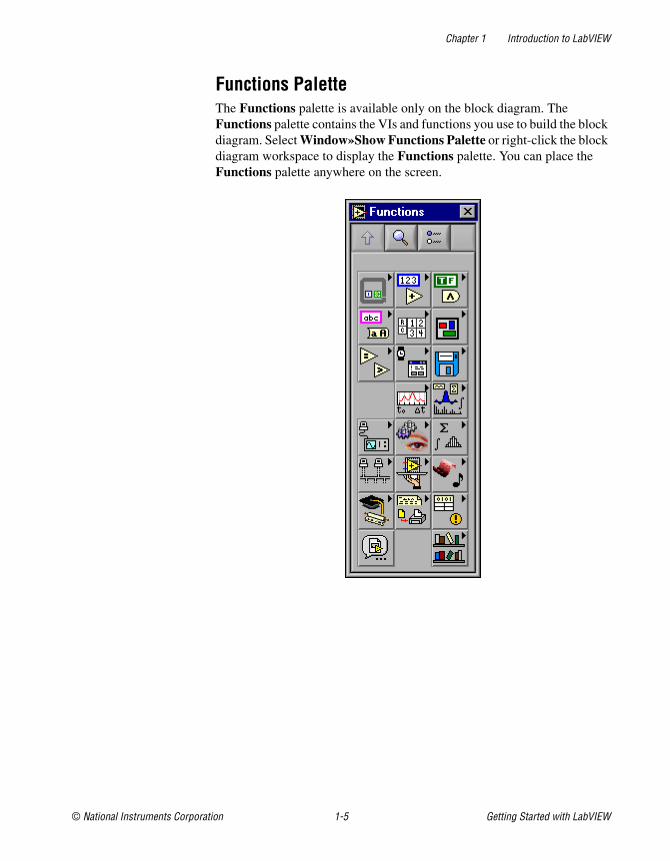
Functions PaletteThe Functions palette is available only on the block diagram. TheFunctions palette contains the VIs and functions you use to build the blockdiagram. Select Window»Show Functions Palette or right-click the blockdiagram workspace to display the Functions palette. You can place theFunctions palette anywhere on the screen.
Chapter 1 Introduction to LabVIEW
Getting Started with LabVIEW 1-6 ni.com
Navigating the Controls and Functions PalettesUse the navigation buttons on the Controls and Functions palettes tonavigate and search for controls, VIs, and functions. When you click asubpalette icon, the entire palette changes to the subpalette you selected.You also can right-click a VI icon on the palette and select Open VI fromthe shortcut menu to open the VI.
The Controls and Functions palettes contain the following navigationbuttons:
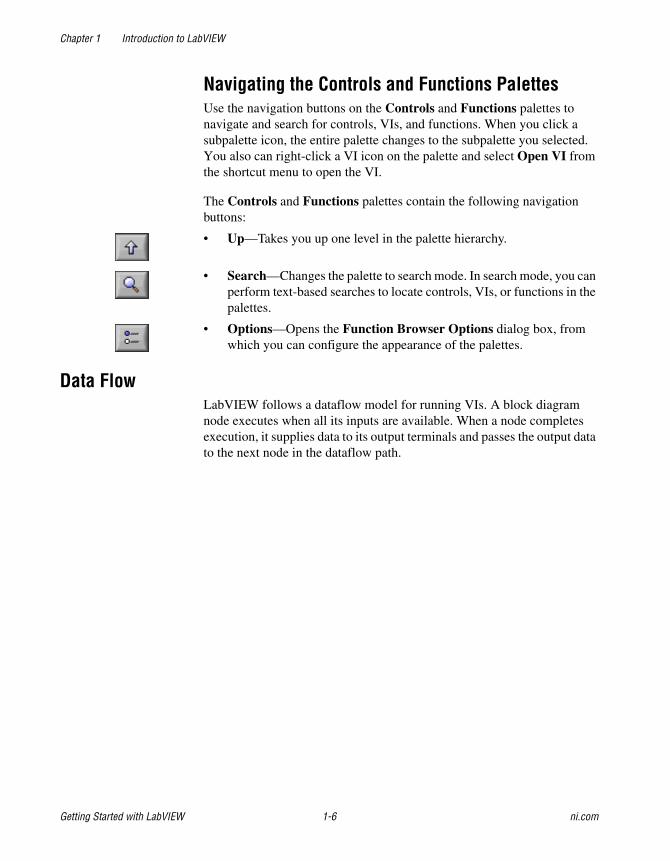
• Up—Takes you up one level in the palette hierarchy.
• Search—Changes the palette to search mode. In search mode, you canperform text-based searches to locate controls, VIs, or functions in thepalettes.
• Options—Opens the Function Browser Options dialog box, fromwhich you can configure the appearance of the palettes.
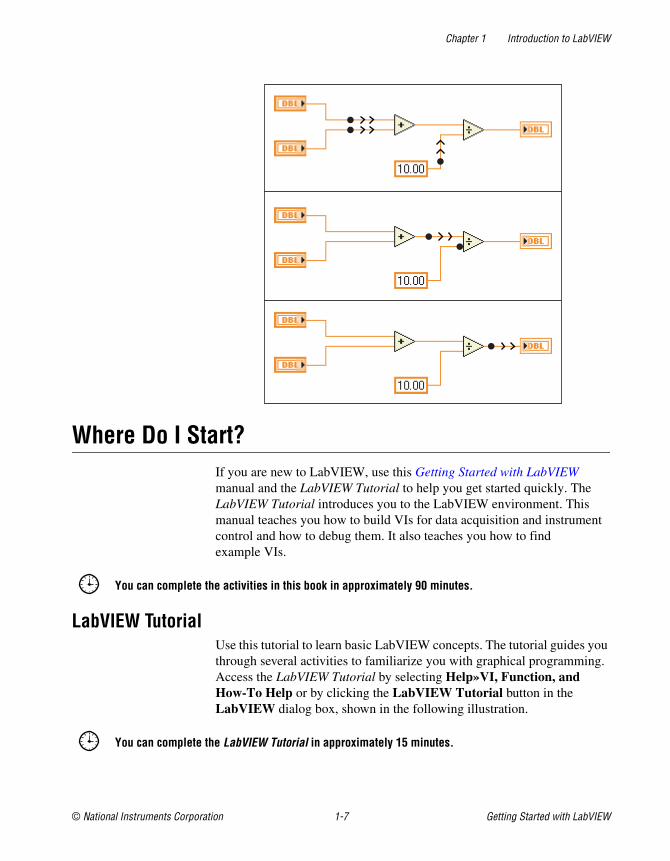
Data FlowLabVIEW follows a dataflow model for running VIs. A block diagramnode executes when all its inputs are available. When a node completesexecution, it supplies data to its output terminals and passes the output datato the next node in the dataflow path.
Chapter 1 Introduction to LabVIEW
© National Instruments Corporation 1-7 Getting Started with LabVIEW
Where Do I Start?If you are new to LabVIEW, use this Getting Started with LabVIEWmanual and the LabVIEW Tutorial to help you get started quickly. TheLabVIEW Tutorial introduces you to the LabVIEW environment. Thismanual teaches you how to build VIs for data acquisition and instrumentcontrol and how to debug them. It also teaches you how to findexample VIs.
You can complete the activities in this book in approximately 90 minutes.
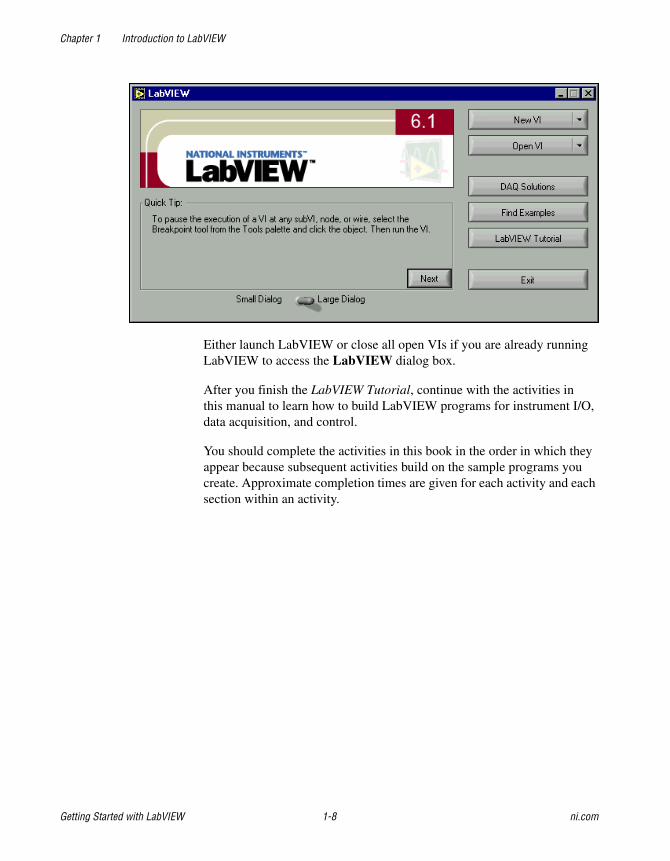
LabVIEW TutorialUse this tutorial to learn basic LabVIEW concepts. The tutorial guides youthrough several activities to familiarize you with graphical programming.Access the LabVIEW Tutorial by selecting Help»VI, Function, andHow-To Help or by clicking the LabVIEW Tutorial button in theLabVIEW dialog box, shown in the following illustration.
You can complete the LabVIEW Tutorial in approximately 15 minutes.
Chapter 1 Introduction to LabVIEW
Getting Started with LabVIEW 1-8 ni.com
Either launch LabVIEW or close all open VIs if you are already runningLabVIEW to access the LabVIEW dialog box.
After you finish the LabVIEW Tutorial, continue with the activities inthis manual to learn how to build LabVIEW programs for instrument I/O,data acquisition, and control.
You should complete the activities in this book in the order in which theyappear because subsequent activities build on the sample programs youcreate. Approximate completion times are given for each activity and eachsection within an activity.
© National Instruments Corporation 2-1 Getting Started with LabVIEW
2Virtual Instruments
This chapter teaches you step by step how to create an application inLabVIEW. It also teaches you how to find example VIs in LabVIEW.Complete the LabVIEW tutorial before starting the activities in thischapter.
You will learn to do the following:
• Create a new program in LabVIEW. The VI you build generates data,analyzes it, then writes it to a file.
• Find and run an example VI.
Search for Example VIsLabVIEW includes hundreds of example VIs you can use and incorporateinto your own VIs. You can modify an example to fit your application, oryou can copy and paste from one or more examples into your own VI.
You can complete this activity in approximately 5 minutes.
1. In the LabVIEW dialog box, click the Find Examples button todisplay the Find Examples dialog box. If you already opened a VI,select Help»Find Examples to display the Find Examplesdialog box.
2. On the Browse tab, navigate to the Industry Applications»Analysiscategory. You also can search by keyword on the Search tab.
3. Double-click Temperature System Demo to open this example VI.
4. Click the Run button, shown at left, on the front panel toolbar to seehow the VI runs.
5. Click the sliders, knobs, and other controls to see how they affect thedata.
6. Stop the program by moving the Acquisition switch to the off position.
7. Close the example and use the Find Examples dialog box to browseor search for other example VIs.
Chapter 2 Virtual Instruments
Getting Started with LabVIEW 2-2 ni.com
Refer to the Developer Zone on the National Instruments Web site atzone.ni.com for additional example VIs.
Build a Virtual InstrumentThis activity demonstrates how you can build a VI that plots, analyzes, andsaves data.
You can complete this activity in approximately 30 minutes.
Create a User InterfaceYou can create a graphical user interface on the front panel using controlsand indicators on the Controls palette.
You can complete this section in approximately 5 minutes.
1. Create a new VI by clicking the New VI button in the LabVIEWdialog box.
Either launch LabVIEW or close all open VIs if you are alreadyrunning LabVIEW to access the LabVIEW dialog box.
2. Select Window»Show Tools Palette to display the Tools palette.
3. If the Automatic Tool Selection LED in the Tools palette is not lit,click the Automatic Tool Selection button, shown at left, to enableautomatic tool selection.
4. Select Window»Show Controls Palette to display theControls palette.
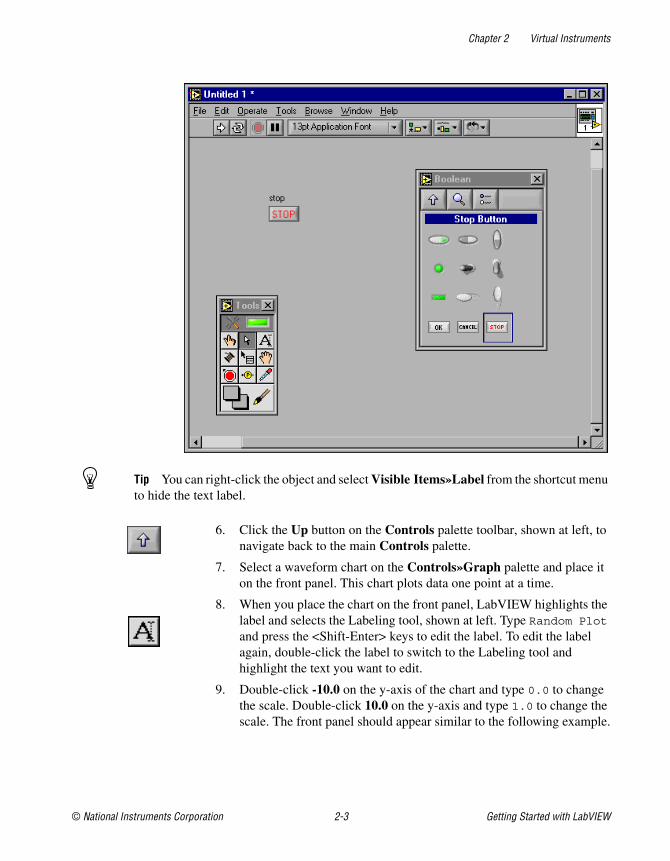
5. Select a stop button on the Controls»Boolean palette and place it onthe front panel, as shown in the following example.
Chapter 2 Virtual Instruments
© National Instruments Corporation 2-3 Getting Started with LabVIEW
Tip You can right-click the object and select Visible Items»Label from the shortcut menuto hide the text label.
6. Click the Up button on the Controls palette toolbar, shown at left, tonavigate back to the main Controls palette.
7. Select a waveform chart on the Controls»Graph palette and place iton the front panel. This chart plots data one point at a time.
8. When you place the chart on the front panel, LabVIEW highlights thelabel and selects the Labeling tool, shown at left. Type Random Plotand press the <Shift-Enter> keys to edit the label. To edit the labelagain, double-click the label to switch to the Labeling tool andhighlight the text you want to edit.
9. Double-click -10.0 on the y-axis of the chart and type 0.0 to changethe scale. Double-click 10.0 on the y-axis and type 1.0 to change thescale. The front panel should appear similar to the following example.
Chapter 2 Virtual Instruments
Getting Started with LabVIEW 2-4 ni.com
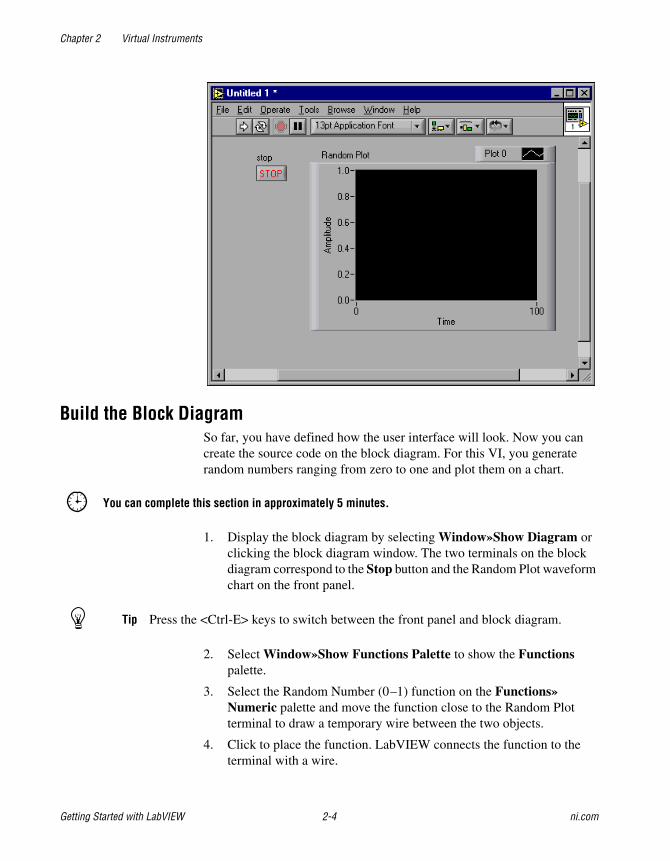
Build the Block DiagramSo far, you have defined how the user interface will look. Now you cancreate the source code on the block diagram. For this VI, you generaterandom numbers ranging from zero to one and plot them on a chart.
You can complete this section in approximately 5 minutes.
1. Display the block diagram by selecting Window»Show Diagram orclicking the block diagram window. The two terminals on the blockdiagram correspond to the Stop button and the Random Plot waveformchart on the front panel.
Tip Press the <Ctrl-E> keys to switch between the front panel and block diagram.
2. Select Window»Show Functions Palette to show the Functionspalette.
3. Select the Random Number (0–1) function on the Functions»Numeric palette and move the function close to the Random Plotterminal to draw a temporary wire between the two objects.
4. Click to place the function. LabVIEW connects the function to theterminal with a wire.
Chapter 2 Virtual Instruments
© National Instruments Corporation 2-5 Getting Started with LabVIEW
5. (Optional) Use the Positioning tool, shown at left, to rearrange orresize objects. Move the cursor over the center of an object to select thePositioning tool.
• To move an object, click the object and release the mouse buttonto select the object. A moving dashed outline called a marqueehighlights the object. Drag the object to move it.
• To resize an object, move the cursor over a corner of the object todisplay resizing handles. Move the Positioning tool over a resizinghandle to change the tool to the resizing cursor. Use the resizingcursor to drag the resizing handles until the dashed border outlinesthe size you want, and release the mouse button.
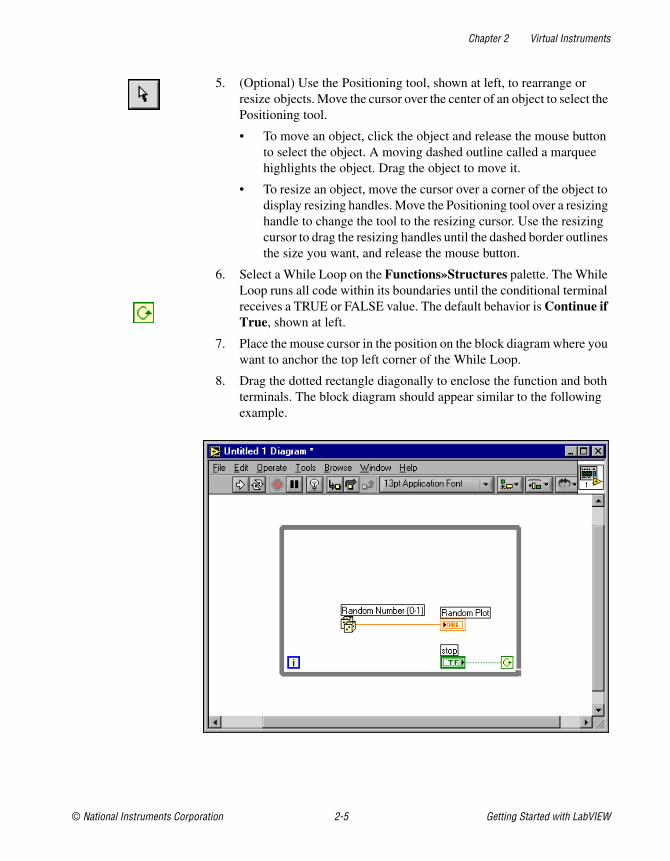
6. Select a While Loop on the Functions»Structures palette. The WhileLoop runs all code within its boundaries until the conditional terminalreceives a TRUE or FALSE value. The default behavior is Continue ifTrue, shown at left.
7. Place the mouse cursor in the position on the block diagram where youwant to anchor the top left corner of the While Loop.
8. Drag the dotted rectangle diagonally to enclose the function and bothterminals. The block diagram should appear similar to the followingexample.
Chapter 2 Virtual Instruments
Getting Started with LabVIEW 2-6 ni.com
Wire and Run the VIYou transfer data among block diagram objects through wires. Each wirehas a single data source, but you can wire it to many VIs and functions thatread the data. Wires are different colors, styles, and thicknesses, dependingon their data types. A broken wire appears as a dashed black line. When youfinish wiring this VI, you can run it from the front panel to see it plot datato the chart.
You can complete this section in approximately 5 minutes.
1. Complete the following steps to wire the Stop terminal to the WhileLoop conditional terminal, shown at left.
a. Move the cursor over the arrow on the Stop terminal. LabVIEWselects the Wiring tool, shown at left, and the terminal blinks.
Note If the Stop terminal is highlighted by a marquee, you must deselect the terminal byclicking any open space on the block diagram before you can wire the terminal.
b. Click the blinking terminal and move the cursor over theconditional terminal so it blinks.
c. Click the blinking conditional terminal to draw a wire between thetwo objects.
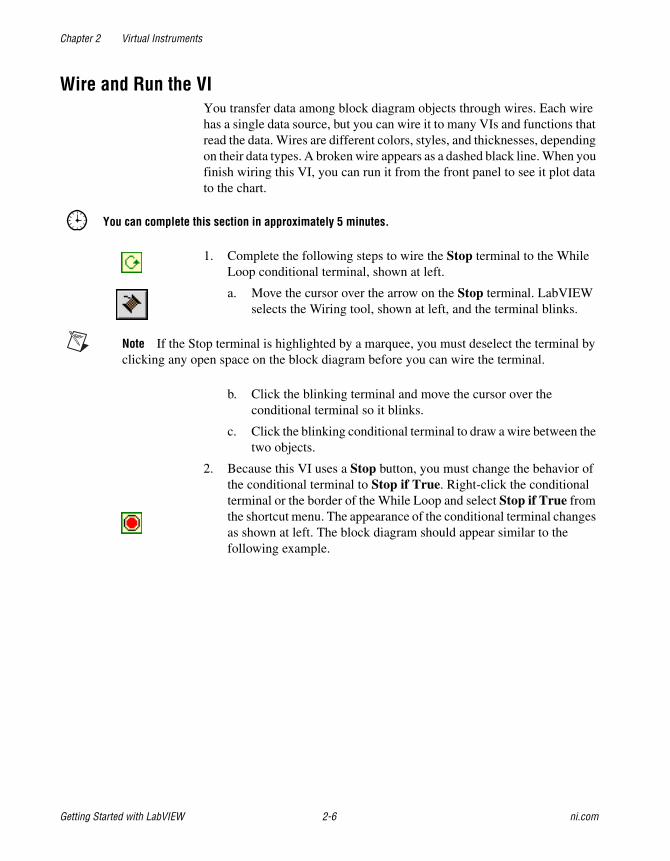
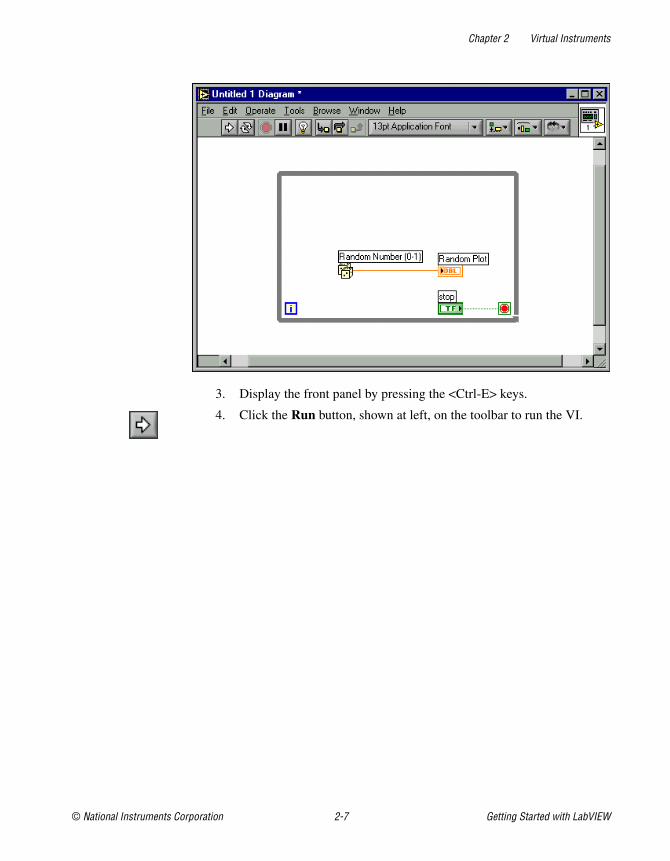
2. Because this VI uses a Stop button, you must change the behavior ofthe conditional terminal to Stop if True. Right-click the conditionalterminal or the border of the While Loop and select Stop if True fromthe shortcut menu. The appearance of the conditional terminal changesas shown at left. The block diagram should appear similar to thefollowing example.
Chapter 2 Virtual Instruments
© National Instruments Corporation 2-7 Getting Started with LabVIEW
3. Display the front panel by pressing the <Ctrl-E> keys.
4. Click the Run button, shown at left, on the toolbar to run the VI.
Chapter 2 Virtual Instruments
Getting Started with LabVIEW 2-8 ni.com
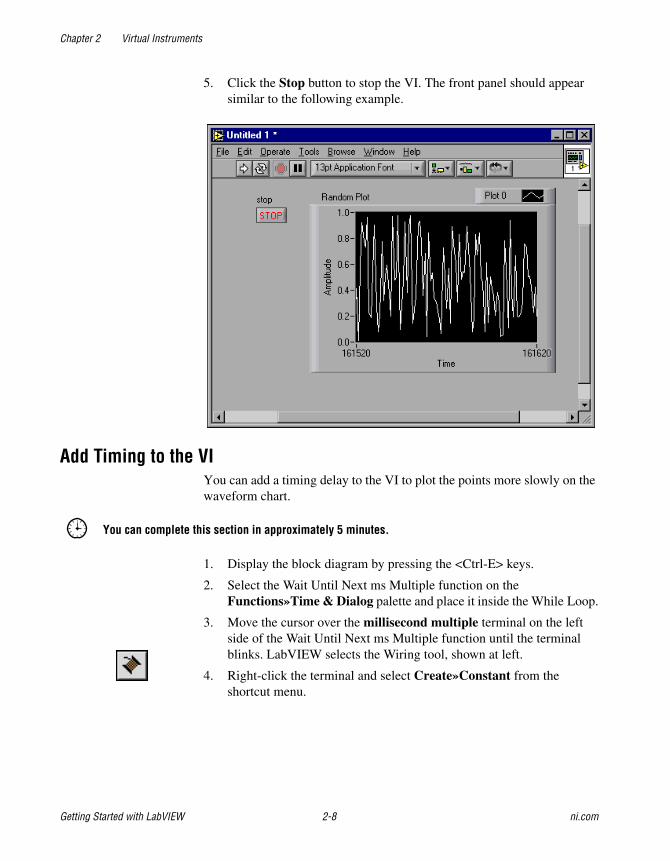
5. Click the Stop button to stop the VI. The front panel should appearsimilar to the following example.
Add Timing to the VIYou can add a timing delay to the VI to plot the points more slowly on thewaveform chart.
You can complete this section in approximately 5 minutes.
1. Display the block diagram by pressing the <Ctrl-E> keys.
2. Select the Wait Until Next ms Multiple function on theFunctions»Time & Dialog palette and place it inside the While Loop.
3. Move the cursor over the millisecond multiple terminal on the leftside of the Wait Until Next ms Multiple function until the terminalblinks. LabVIEW selects the Wiring tool, shown at left.
4. Right-click the terminal and select Create»Constant from theshortcut menu.
Chapter 2 Virtual Instruments
© National Instruments Corporation 2-9 Getting Started with LabVIEW
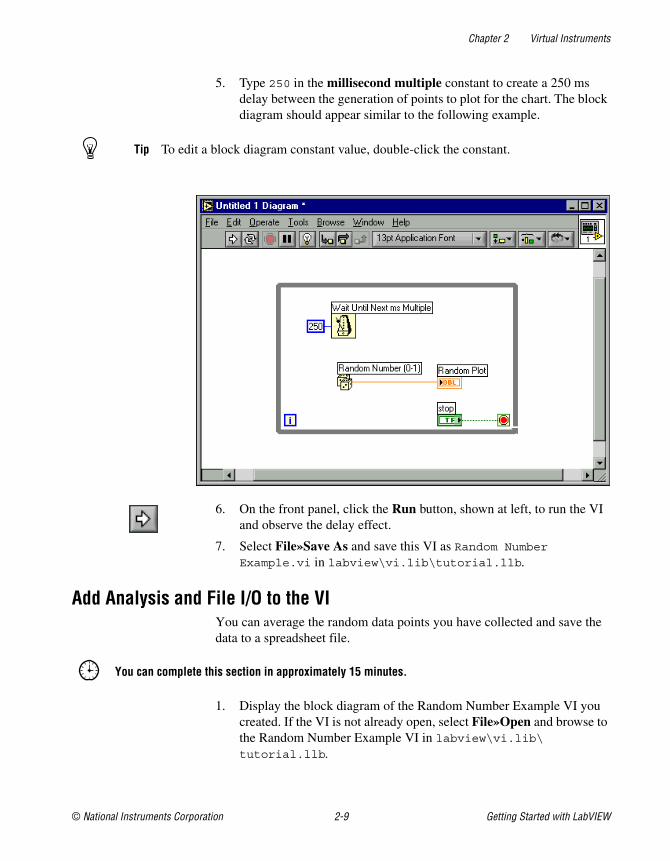
5. Type 250 in the millisecond multiple constant to create a 250 msdelay between the generation of points to plot for the chart. The blockdiagram should appear similar to the following example.
Tip To edit a block diagram constant value, double-click the constant.
6. On the front panel, click the Run button, shown at left, to run the VIand observe the delay effect.
7. Select File»Save As and save this VI as Random Number Example.vi in labview\vi.lib\tutorial.llb.
Add Analysis and File I/O to the VIYou can average the random data points you have collected and save thedata to a spreadsheet file.
You can complete this section in approximately 15 minutes.
1. Display the block diagram of the Random Number Example VI youcreated. If the VI is not already open, select File»Open and browse tothe Random Number Example VI in labview\vi.lib\
tutorial.llb.
Chapter 2 Virtual Instruments
Getting Started with LabVIEW 2-10 ni.com
2. Select the Add Array Elements function and the Divide function on theFunctions»Numeric palette and place them outside the While Loop.
3. Select the Array Size function on the Functions»Array palette andplace it outside the While Loop.
Note It is important to place the functions outside the While Loop because you want tocompute the data mean only after the While Loop collects all the data.
4. Wire the sum terminal on the right side of the Add Array Elementsfunction to the x terminal on the left side of the Divide function.
5. Wire the size(s) terminal on the right side of the Array Size function tothe y terminal on the left side of the Divide function.
6. Use the Wiring tool to right-click the x/y terminal on the right side ofthe Divide function and select Create»Indicator from the shortcutmenu to create a numeric indicator on the front panel to display themean of the random data.
7. Select the Write To Spreadsheet File VI on the Functions»File I/Opalette and place it outside the While Loop.
8. Complete the following steps to create a wire branch.
a. Move the cursor over the wire connecting the RandomNumber (0–1) function and the Random Plot indicator.
b. Press the <Ctrl> key to temporarily switch to the Wiring toolwhile you click the wire.
c. Click the Numeric Array input terminal of the Add ArrayElements function. LabVIEW draws a wire connecting theexisting wire and the Numeric Array input. A broken wireappears to indicate that you are trying to wire terminals ofdifferent data types. You will correct the broken wire in step 11.
Tip You also can right-click the existing wire and select Create Wire Branch from theshortcut menu.
9. Create another wire branch from the branch you created in the previousstep. Wire this new branch from the segment outside the loop to the 1Ddata input of the Write to Spreadsheet File VI. You use the 1D datainput because the While Loop creates a one-dimensional row of datafrom the generated random numbers. The wire appears broken, but youwill correct it in step 11.
10. Create another wire branch from the segment outside the loop to thearray input of the Array Size function.
Chapter 2 Virtual Instruments
© National Instruments Corporation 2-11 Getting Started with LabVIEW
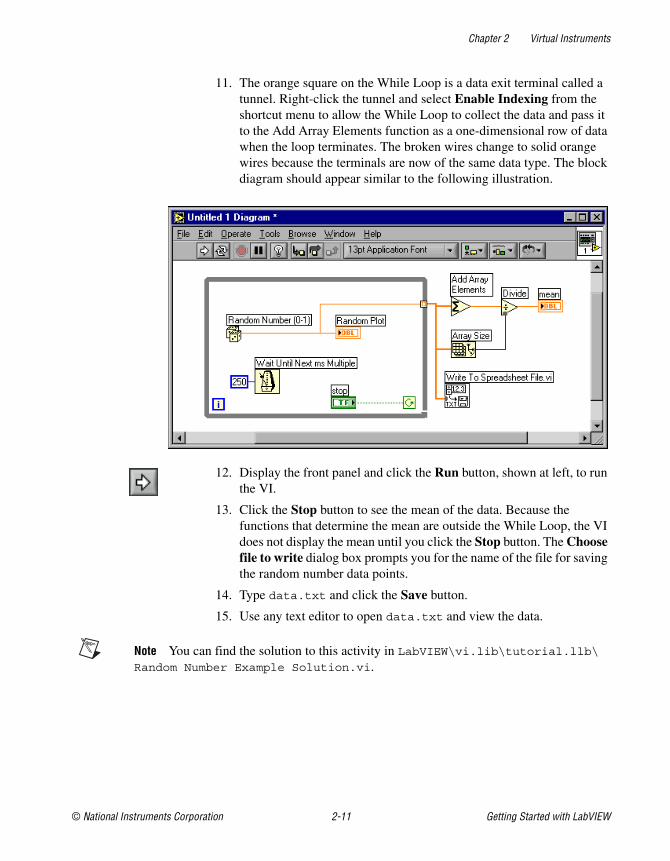
11. The orange square on the While Loop is a data exit terminal called atunnel. Right-click the tunnel and select Enable Indexing from theshortcut menu to allow the While Loop to collect the data and pass itto the Add Array Elements function as a one-dimensional row of datawhen the loop terminates. The broken wires change to solid orangewires because the terminals are now of the same data type. The blockdiagram should appear similar to the following illustration.
12. Display the front panel and click the Run button, shown at left, to runthe VI.
13. Click the Stop button to see the mean of the data. Because thefunctions that determine the mean are outside the While Loop, the VIdoes not display the mean until you click the Stop button. The Choosefile to write dialog box prompts you for the name of the file for savingthe random number data points.
14. Type data.txt and click the Save button.
15. Use any text editor to open data.txt and view the data.
Note You can find the solution to this activity in LabVIEW\vi.lib\tutorial.llb\
Random Number Example Solution.vi.
© National Instruments Corporation 3-1 Getting Started with LabVIEW
3Measurement
This chapter teaches you some basics on how to use LabVIEW toconfigure, communicate with, and acquire data from special purposeinstruments and general purpose data acquisition (DAQ) hardware.
Refer to the National Instruments Developer Zone, at zone.ni.com,which offers measurement and automation resources including examples,technical presentations, instrument drivers, and tutorial information. Also,refer to the LabVIEW Measurements Manual for more information abouthow to take and analyze measurements in LabVIEW.
Instrument I/OThis section introduces you to the basic concepts on how to use LabVIEWto acquire data from instruments controlled by GPIB, VXI, RS-232, andother hardware standards. This section also shows you how to run theDemo Scope VI if you do not have instrument I/O hardware installed.
LabVIEW communicates with most instruments through instrumentdrivers, which are libraries of VIs that control programmable instruments.LabVIEW instrument drivers simplify instrument control and reduce testdevelopment time by eliminating the need to learn the low-levelprogramming protocol for each instrument.
Instruments obey a set of commands to respond to remote control andrequests for data. When you use LabVIEW instrument drivers, you runintuitive, high-level command VIs, such as the Read DC Voltage VI for adigital multimeter or the Configure Time Axis VI for a digital oscilloscope.The driver VI you call automatically sends the appropriateinstrument-specific command strings to the instrument.
The foundation for LabVIEW drivers is the VISA (Virtual InstrumentSoftware Architecture) VI library, a single interface library for controllingGPIB, VXI, RS-232, and other types of instruments. Drivers using VISAare scalable across instrument I/O interfaces.
Chapter 3 Measurement
Getting Started with LabVIEW 3-2 ni.com
Refer to Part IV, Instrument Control in LabVIEW, of the LabVIEWMeasurements Manual for more information about instrument control,instrument drivers, and using VISA to communicate with instruments.
Run the Demo Scope VIIf you do not have instrument I/O hardware installed, run theDemo Scope VI. The Demo Scope VI is the demonstration equivalent ofa Getting Started VI for an actual instrument driver.
You can complete this activity in approximately 5 minutes.
1. Open the Demo Scope VI instrument driver in LabVIEW\vi.lib\
tutorial.llb.
2. Click on the Run button to acquire simulated data on one or twochannels on the oscilloscope. Change the Time Base andVolts/Division settings to see the effects.
3. Click the STOP button to stop the VI.
4. View the block diagram. Notice that Initialize is called first, followedby the commands to send to the instrument in the Application ExampleVI. The Close VI then closes communication with the instrument.When you program with LabVIEW drivers, follow this model toinitialize the instrument, then call the functions to control theinstrument, and finally close the instrument for communication.
Data AcquisitionThis section teaches you how to use LabVIEW with general purpose dataacquisition (DAQ) hardware. If you use only stand-alone instruments andcontrol them with GPIB, VXI, or serial standards, refer to theInstrument I/O section of this chapter.
Refer to Part II, DAQ Basics, of the LabVIEW Measurements Manual formore information about data acquisition in LabVIEW.
Note Data acquisition and the DAQ wizards are available on Windows andMacintosh only.
Chapter 3 Measurement
© National Instruments Corporation 3-3 Getting Started with LabVIEW
You will learn to do the following:
• Use the DAQ Solution Wizard to generate solutions for dataacquisition applications.
– Use the DAQ Channel Wizard to configure an analog inputchannel.
– Generate a solution from the Solutions Gallery.
• Add analog input to the VI you created in Chapter 2, VirtualInstruments.
Note Refer to your hardware manual or the NI-DAQ Help file for data acquisitionhardware installation and configuration instructions.
Use the DAQ Solution WizardIf you are using DAQ hardware, you must configure analog input, analogoutput, digital input, or digital output channels. You can launch the DAQChannel Wizard from the DAQ Solution Wizard to configure the channels.Then you can generate a DAQ solution from the Solutions Gallery.
On Windows, you access the DAQ Channel Wizard by selectingTools»Measurement & Automation Explorer and clicking DataNeighborhood. On Macintosh you can access the DAQ Channel Wizard byselecting Tools»Data Acquisition»DAQ Channel Wizard. The DAQChannel Wizard also can be accessed from the DAQ Solution Wizard.
You can complete this activity in approximately 15 minutes.
Configure Analog Input ChannelsThe DAQ Solution Wizard guides you through naming and configuringanalog and digital channels using the DAQ Channel Wizard. The DAQChannel Wizard helps you define the physical quantities you are measuringor generating on each DAQ hardware channel. It queries for informationabout the physical quantity being measured, the sensor or actuator beingused, and the associated DAQ hardware.
You can complete this section in approximately 5 minutes.
1. Click the DAQ Solutions button in the LabVIEW dialog box tolaunch the DAQ Solution Wizard and get started with analog inputquickly and easily.
Chapter 3 Measurement
Getting Started with LabVIEW 3-4 ni.com
Either launch LabVIEW or close all open VIs if you are alreadyrunning LabVIEW to access the LabVIEW dialog box.
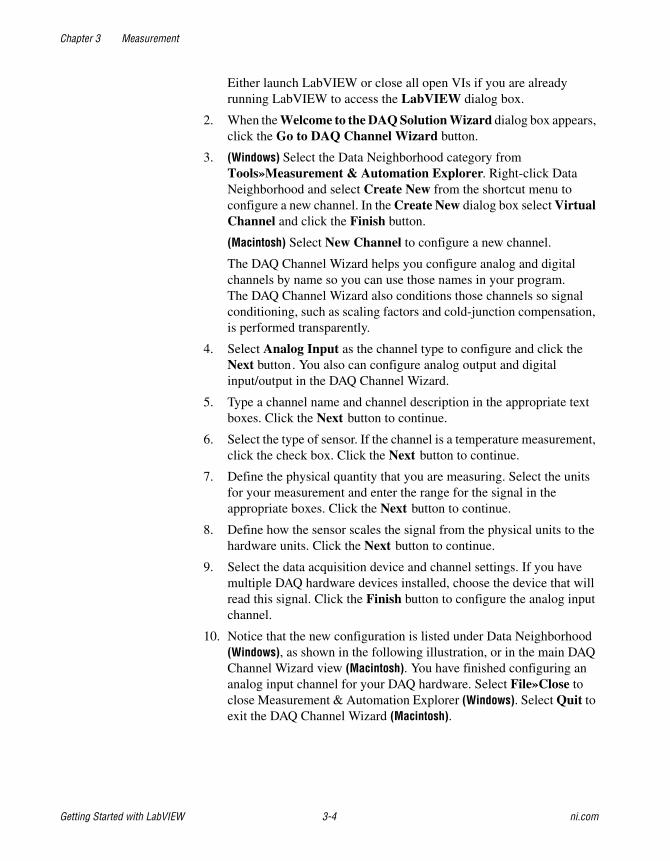
2. When the Welcome to the DAQ Solution Wizard dialog box appears,click the Go to DAQ Channel Wizard button.
3. (Windows) Select the Data Neighborhood category fromTools»Measurement & Automation Explorer. Right-click DataNeighborhood and select Create New from the shortcut menu toconfigure a new channel. In the Create New dialog box select VirtualChannel and click the Finish button.
(Macintosh) Select New Channel to configure a new channel.
The DAQ Channel Wizard helps you configure analog and digitalchannels by name so you can use those names in your program.The DAQ Channel Wizard also conditions those channels so signalconditioning, such as scaling factors and cold-junction compensation,is performed transparently.
4. Select Analog Input as the channel type to configure and click theNext button. You also can configure analog output and digitalinput/output in the DAQ Channel Wizard.
5. Type a channel name and channel description in the appropriate textboxes. Click the Next button to continue.
6. Select the type of sensor. If the channel is a temperature measurement,click the check box. Click the Next button to continue.
7. Define the physical quantity that you are measuring. Select the unitsfor your measurement and enter the range for the signal in theappropriate boxes. Click the Next button to continue.
8. Define how the sensor scales the signal from the physical units to thehardware units. Click the Next button to continue.
9. Select the data acquisition device and channel settings. If you havemultiple DAQ hardware devices installed, choose the device that willread this signal. Click the Finish button to configure the analog inputchannel.
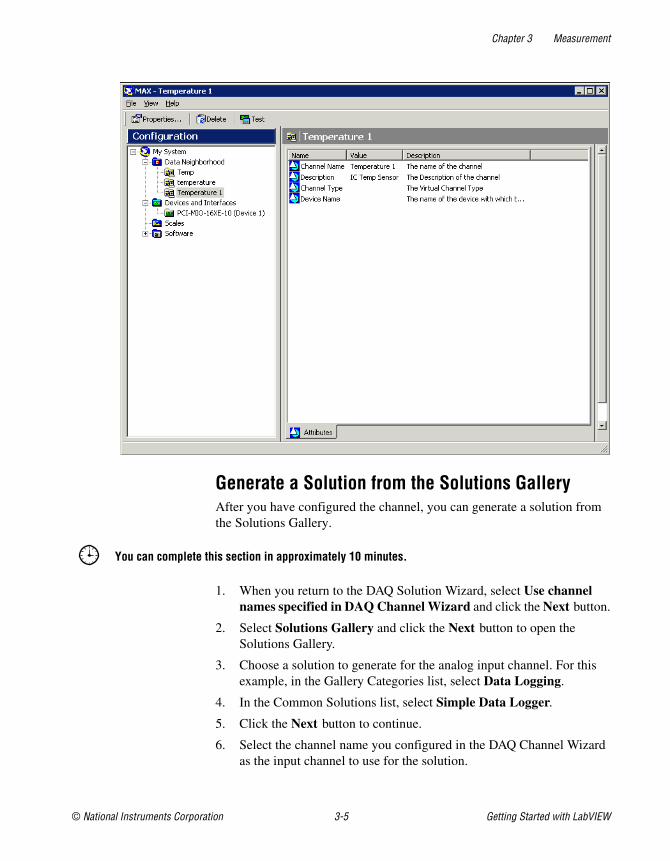
10. Notice that the new configuration is listed under Data Neighborhood(Windows), as shown in the following illustration, or in the main DAQChannel Wizard view (Macintosh). You have finished configuring ananalog input channel for your DAQ hardware. Select File»Close toclose Measurement & Automation Explorer (Windows). Select Quit toexit the DAQ Channel Wizard (Macintosh).
Chapter 3 Measurement
© National Instruments Corporation 3-5 Getting Started with LabVIEW
Generate a Solution from the Solutions GalleryAfter you have configured the channel, you can generate a solution fromthe Solutions Gallery.
You can complete this section in approximately 10 minutes.
1. When you return to the DAQ Solution Wizard, select Use channelnames specified in DAQ Channel Wizard and click the Next button.
2. Select Solutions Gallery and click the Next button to open theSolutions Gallery.
3. Choose a solution to generate for the analog input channel. For thisexample, in the Gallery Categories list, select Data Logging.
4. In the Common Solutions list, select Simple Data Logger.
5. Click the Next button to continue.
6. Select the channel name you configured in the DAQ Channel Wizardas the input channel to use for the solution.
Chapter 3 Measurement
Getting Started with LabVIEW 3-6 ni.com
7. Click the Open Solution button to generate the solution.
8. Click the Run button to take data from the configured analog inputchannel and log the data to a file. A file dialog box prompts you fora file name. Type data.txt and click the Save button.
9. Click the STOP button in the lower-right corner of the front panel tostop the VI. Use any text editor to view data.txt.
Tip You can customize the front panel and block diagram of the VI solution and save yourcustomized solutions.
10. Save any changes you want to keep and close this VI.
11. View the DAQ Solution Wizard window and click theBack buttonto browse other gallery categories and common solution VIs.
12. Click the Cancel button to exit the DAQ Solution Wizard.
Add Analog Input to the VIThe Random Number Example VI you created in Chapter 2, VirtualInstruments generates random numbers and plots them to a chart. Now youwill replace the random number generator with an analog input VI toacquire data from your DAQ device, plot it on a chart, analyze it, and writeit to a file.
You can complete this activity in approximately 5 minutes.
Note If you have not built the Random Number Example VI, you can find the solution VIin LabVIEW\vi.lib\tutorial.llb\Random Number Example Solution.vi.
1. Open the Random Number Example VI fromlabview\vi.lib\tutorial.llb.
2. View the block diagram. Right-click the Random Number function,and select Replace»Data Acquisition»Analog Input»AI Sample Channel to replace the Random Number function with theAI Sample Channel VI. Be sure to select the AI Sample Channel VIand not the AI Sample Channels VI. Note that the output has changedfrom a double-precision number to a waveform. This allows timinginformation to flow to the chart for display.
3. Use the Wiring tool to right-click the channel (0) input of the AISample Channel VI and select Create Constant from the shortcutmenu to specify the name of the channel from which you will acquiredata.
Chapter 3 Measurement
© National Instruments Corporation 3-7 Getting Started with LabVIEW
4. Select the name of the channel you already configured in theDAQ Channel Wizard from the pull-down menu on the constant.
5. View the front panel. Right-click the graph and selectY Scale»AutoScale Y from the shortcut menu.
6. Click the Run button to acquire and display data on the chart.
7. Click the Stop button to stop the VI.
8. In the file dialog box, enter a name such as data.txt and click theSave button to save the data to a spreadsheet file.
9. Save this VI as Acquire Data.vi inlabview\vi.lib\tutorial.llb.
Refer to the LabVIEW Measurements Manual for information aboutmultiple-point acquisition, waveform generation, digital I/O, andcounter/timer applications.
© National Instruments Corporation 4-1 Getting Started with LabVIEW
4Debugging
This chapter teaches you how to use some of the debugging techniquesavailable in LabVIEW.
Use Execution HighlightingExecution highlighting shows the movement of data on the block diagramfrom one node to another using bubbles that move along the wires.
You can complete this activity in approximately 5 minutes.
1. Open the Random Number Example VI you created earlier fromLabVIEW\vi.lib\tutorial.llb.
2. View the block diagram and click the Highlight Execution button onthe toolbar.
3. Run the VI from the block diagram window. The program executes inslow motion with moving bubbles to highlight the flow of execution.It also displays data as it becomes available in the VI.
4. Click the Abort button to stop the VI.
5. Click the Highlight Execution button again to turn off executionhighlighting.
Single-Step with ProbesYou can set breakpoints in a VI and single-step into, out of, and oversections of the block diagram. You also can insert probes to examine datavalues in detail during program execution. This example shows how toinsert probes and single-step through a VI to monitor data while the VIruns.
You can complete this activity in approximately 5 minutes.
1. Open the Random Number Example VI you created earlier fromLabVIEW\vi.lib\tutorial.llb.
Chapter 4 Debugging
Getting Started with LabVIEW 4-2 ni.com
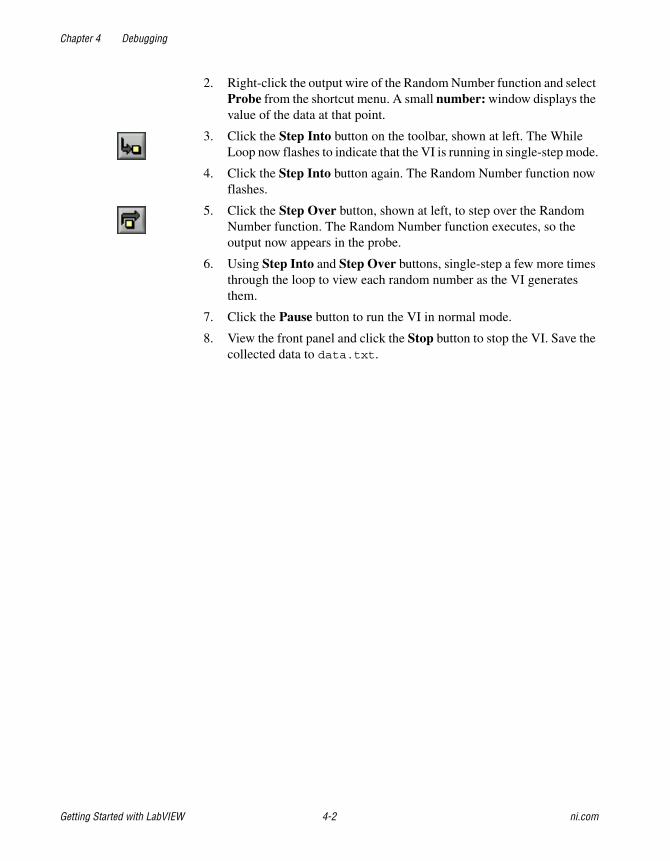
2. Right-click the output wire of the Random Number function and selectProbe from the shortcut menu. A small number: window displays thevalue of the data at that point.
3. Click the Step Into button on the toolbar, shown at left. The WhileLoop now flashes to indicate that the VI is running in single-step mode.
4. Click the Step Into button again. The Random Number function nowflashes.
5. Click the Step Over button, shown at left, to step over the RandomNumber function. The Random Number function executes, so theoutput now appears in the probe.
6. Using Step Into and Step Over buttons, single-step a few more timesthrough the loop to view each random number as the VI generatesthem.
7. Click the Pause button to run the VI in normal mode.
8. View the front panel and click the Stop button to stop the VI. Save thecollected data to data.txt.
© National Instruments Corporation 5-1 Getting Started with LabVIEW
5Where to Go from Here
This chapter describes how to use the LabVIEW Help and the additionalresources available to you.
Refer to the LabVIEW User Manual, the LabVIEW Measurements Manual,or the LabVIEW Help for more information about LabVIEW programming.
Note If you select the Complete install option, LabVIEW installs PDF versions of allLabVIEW manuals, which you can access by selecting Help»Search the LabVIEWBookshelf in LabVIEW. You must have Adobe Acrobat Reader 4.0 or later installed toview the PDFs. Refer to the Adobe Systems Incorporated Web site at www.adobe.com todownload Acrobat Reader.
Online HelpAll built-in LabVIEW VIs and functions include a complete description ofthe VI functionality and parameters. Access context-sensitive VI andfunction help by selecting Help»Show Context Help or pressing<Ctrl-H>.
When you place a VI on the block diagram and pass the mouse cursor overit, the VI description displays in the Context Help window. Click the lockbutton at the bottom of the Context Help window to lock the currentcontents of the window.
Access the LabVIEW Help file to search for particular topics by selectingHelp»VI, Function, and How-To Help. You also can right-click anybuilt-in VI or function on the block diagram and select Help from theshortcut menu.
Note (Macintosh and UNIX) National Instruments recommends that you use Netscape 6.0 orlater to view the LabVIEW Help.
Chapter 5 Where to Go from Here
Getting Started with LabVIEW 5-2 ni.com
National Instruments’ Commitment to YouLabVIEW represents a long-standing commitment by National Instrumentsto provide tools that simplify the development of instrumentation, dataacquisition, and control systems. When you choose LabVIEW as yourdevelopment environment, you join thousands of scientists and engineerswho are taking advantage of the power of graphical programming.
Customer EducationFor additional training, National Instruments offers interactive CDs,videos, books, and hands-on LabVIEW courses to help you masterLabVIEW quickly and develop successful applications.
Alliance ProgramThe Alliance Program is a network of third-party developers andconsultants who are experts in LabVIEW and other National Instrumentsproducts. The National Instruments Alliance Solutions directory listsadditional libraries and utilities developed by our Alliance members to helpyou use LabVIEW. In addition, the Alliance Solutions directory lists expertLabVIEW consultants who can help you develop custom applications.
© National Instruments Corporation A-1 Getting Started with LabVIEW
ASystem Requirements
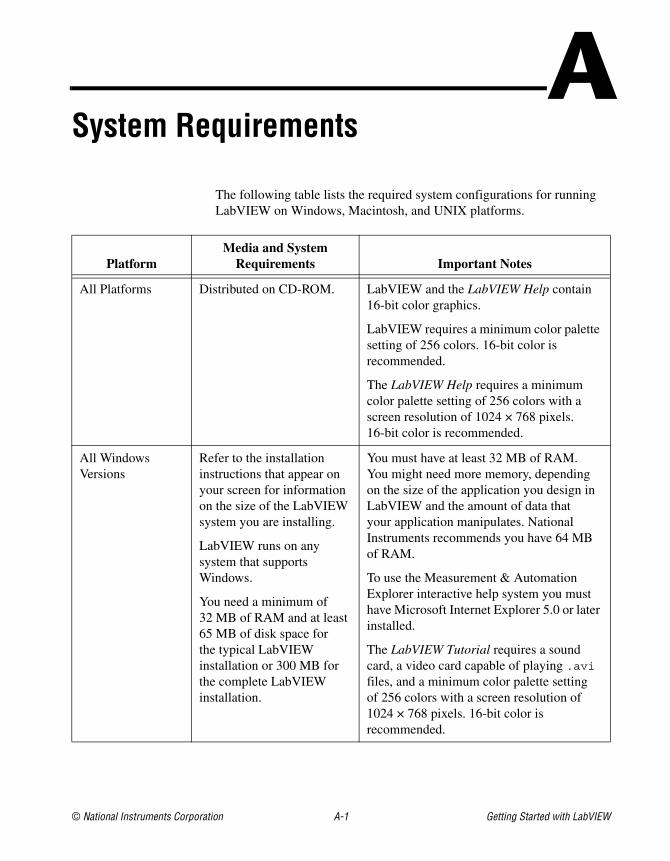
The following table lists the required system configurations for runningLabVIEW on Windows, Macintosh, and UNIX platforms.
PlatformMedia and System
Requirements Important Notes
All Platforms Distributed on CD-ROM. LabVIEW and the LabVIEW Help contain16-bit color graphics.
LabVIEW requires a minimum color palettesetting of 256 colors. 16-bit color isrecommended.
The LabVIEW Help requires a minimumcolor palette setting of 256 colors with ascreen resolution of 1024 × 768 pixels.16-bit color is recommended.
All WindowsVersions
Refer to the installationinstructions that appear onyour screen for informationon the size of the LabVIEWsystem you are installing.
LabVIEW runs on anysystem that supportsWindows.
You need a minimum of32 MB of RAM and at least65 MB of disk space forthe typical LabVIEWinstallation or 300 MB forthe complete LabVIEWinstallation.
You must have at least 32 MB of RAM.You might need more memory, dependingon the size of the application you design inLabVIEW and the amount of data thatyour application manipulates. NationalInstruments recommends you have 64 MBof RAM.
To use the Measurement & AutomationExplorer interactive help system you musthave Microsoft Internet Explorer 5.0 or laterinstalled.
The LabVIEW Tutorial requires a soundcard, a video card capable of playing .avi
files, and a minimum color palette settingof 256 colors with a screen resolution of1024 × 768 pixels. 16-bit color isrecommended.
Appendix A System Requirements
Getting Started with LabVIEW A-2 ni.com
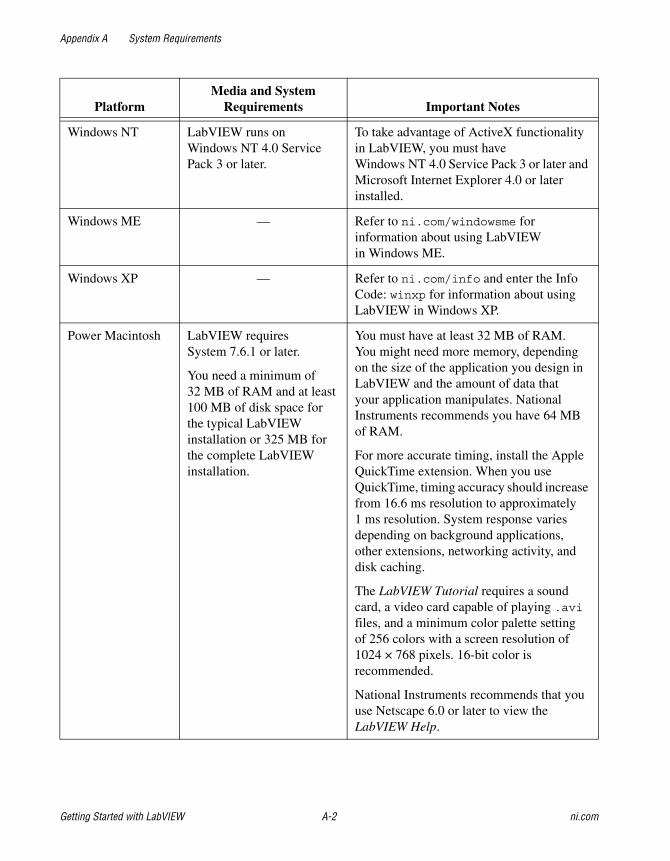
Windows NT LabVIEW runs onWindows NT 4.0 ServicePack 3 or later.
To take advantage of ActiveX functionalityin LabVIEW, you must haveWindows NT 4.0 Service Pack 3 or later andMicrosoft Internet Explorer 4.0 or laterinstalled.
Windows ME — Refer to ni.com/windowsme forinformation about using LabVIEWin Windows ME.
Windows XP — Refer to ni.com/info and enter the InfoCode: winxp for information about usingLabVIEW in Windows XP.
Power Macintosh LabVIEW requiresSystem 7.6.1 or later.
You need a minimum of32 MB of RAM and at least100 MB of disk space forthe typical LabVIEWinstallation or 325 MB forthe complete LabVIEWinstallation.
You must have at least 32 MB of RAM.You might need more memory, dependingon the size of the application you design inLabVIEW and the amount of data thatyour application manipulates. NationalInstruments recommends you have 64 MBof RAM.
For more accurate timing, install the AppleQuickTime extension. When you useQuickTime, timing accuracy should increasefrom 16.6 ms resolution to approximately1 ms resolution. System response variesdepending on background applications,other extensions, networking activity, anddisk caching.
The LabVIEW Tutorial requires a soundcard, a video card capable of playing .avi
files, and a minimum color palette settingof 256 colors with a screen resolution of1024 × 768 pixels. 16-bit color isrecommended.
National Instruments recommends that youuse Netscape 6.0 or later to view theLabVIEW Help.
PlatformMedia and System
Requirements Important Notes
Appendix A System Requirements
© National Instruments Corporation A-3 Getting Started with LabVIEW
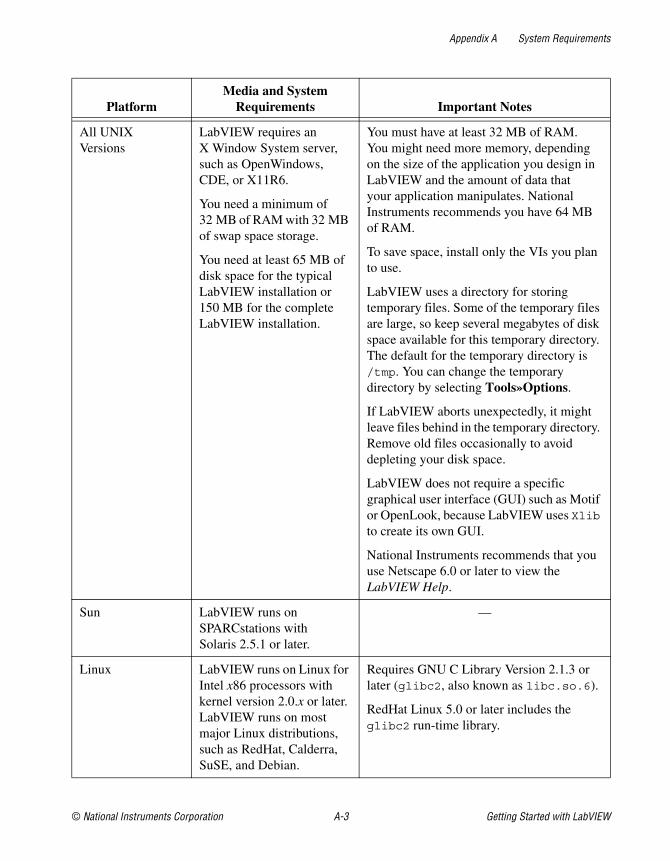
All UNIXVersions
LabVIEW requires anX Window System server,such as OpenWindows,CDE, or X11R6.
You need a minimum of32 MB of RAM with 32 MBof swap space storage.
You need at least 65 MB ofdisk space for the typicalLabVIEW installation or150 MB for the completeLabVIEW installation.
You must have at least 32 MB of RAM.You might need more memory, dependingon the size of the application you design inLabVIEW and the amount of data thatyour application manipulates. NationalInstruments recommends you have 64 MBof RAM.
To save space, install only the VIs you planto use.
LabVIEW uses a directory for storingtemporary files. Some of the temporary filesare large, so keep several megabytes of diskspace available for this temporary directory.The default for the temporary directory is/tmp. You can change the temporarydirectory by selecting Tools»Options.
If LabVIEW aborts unexpectedly, it mightleave files behind in the temporary directory.Remove old files occasionally to avoiddepleting your disk space.
LabVIEW does not require a specificgraphical user interface (GUI) such as Motifor OpenLook, because LabVIEW uses Xlibto create its own GUI.
National Instruments recommends that youuse Netscape 6.0 or later to view theLabVIEW Help.
Sun LabVIEW runs onSPARCstations withSolaris 2.5.1 or later.
—
Linux LabVIEW runs on Linux forIntel x86 processors withkernel version 2.0.x or later.LabVIEW runs on mostmajor Linux distributions,such as RedHat, Calderra,SuSE, and Debian.
Requires GNU C Library Version 2.1.3 orlater (glibc2, also known as libc.so.6).
RedHat Linux 5.0 or later includes theglibc2 run-time library.
PlatformMedia and System
Requirements Important Notes
© National Instruments Corporation B-1 Getting Started with LabVIEW
BTechnical Support Resources
Web SupportNational Instruments Web support is your first stop for help in solvinginstallation, configuration, and application problems and questions. Onlineproblem-solving and diagnostic resources include frequently askedquestions, knowledge bases, product-specific troubleshooting wizards,manuals, drivers, software updates, and more. Web support is availablethrough the Technical Support section of ni.com.
NI Developer ZoneThe NI Developer Zone at ni.com/zone is the essential resource forbuilding measurement and automation systems. At the NI Developer Zone,you can easily access the latest example programs, system configurators,tutorials, technical news, as well as a community of developers ready toshare their own techniques.
Customer EducationNational Instruments provides a number of alternatives to satisfy yourtraining needs, from self-paced tutorials, videos, and interactive CDs toinstructor-led hands-on courses at locations around the world. Visit theCustomer Education section of ni.com for online course schedules,syllabi, training centers, and class registration.
System IntegrationIf you have time constraints, limited in-house technical resources, or otherdilemmas, you may prefer to employ consulting or system integrationservices. You can rely on the expertise available through our worldwidenetwork of Alliance Program members. To find out more about ourAlliance system integration solutions, visit the System Integration sectionof ni.com.
Appendix B Technical Support Resources
Getting Started with LabVIEW B-2 ni.com
Worldwide SupportNational Instruments has offices located around the world to help addressyour support needs. You can access our branch office Web sites from theWorldwide Offices section of ni.com. Branch office Web sites provideup-to-date contact information, support phone numbers, e-mail addresses,and current events.
If you have searched the technical support resources on our Web site andstill cannot find the answers you need, contact your local office or NationalInstruments corporate. Phone numbers for our worldwide offices are listedat the front of this manual.
© National Instruments Corporation G-1 Getting Started with LabVIEW
Glossary
B
block diagram Pictorial description or representation of a program or algorithm. The blockdiagram, consists of executable icons called nodes and wires that carry databetween the nodes. The block diagram is the source code for the VI. Theblock diagram resides in the block diagram window of the VI.
C
conditional terminal Terminal of a While Loop that contains a Boolean value that determines ifthe VI performs another iteration.
connector pane Region in the upper right corner of a front panel or block diagram windowthat displays the VI terminal pattern. It defines the inputs and outputs youcan wire to a VI.
control Front panel object for entering data to a VI interactively or to a subVIprogrammatically, such as a knob, push button, or dial.
Controls palette Palette that contains front panel controls, indicators, and decorative objects.
D
DAQ Channel Wizard Utility that guides you through naming and configuring DAQ analog anddigital channels. Available in the Data Neighborhood of Measurement &Automation Explorer (Windows) or DAQ Channel Wizard (Macintosh).
DAQ Solution Wizard Utility that guides you through specifying your DAQ application, and itprovides a custom DAQ solution.
data flow Programming system that consists of executable nodes that execute onlywhen they receive all required input data and produce output automaticallywhen they execute. LabVIEW is a dataflow system.
Glossary
Getting Started with LabVIEW G-2 ni.com
E
Enable Indexing Option that allows you to build a set of data to be released at the terminationof a While Loop. With indexing disabled, a While Loop releases only thefinal data point generated within the loop.
execution highlighting Debugging technique that animates VI execution to illustrate the data flowin the VI.
F
front panel Interactive user interface of a VI. Front panel appearance imitates physicalinstruments, such as oscilloscopes and multimeters.
function Built-in execution element, comparable to an operator, function, orstatement in a text-based programming language.
Functions palette Palette that contains VIs, functions, block diagram structures, andconstants.
G
General PurposeInterface Bus
GPIB—synonymous with HP-IB. The standard bus used for controllingelectronic instruments with a computer. Also called IEEE 488 bus becauseit is defined by ANSI/IEEE Standards 488-1978, 488.1-1987, and488.2-1992.
I
icon Graphical representation of a node on a block diagram.
IEEE 488.2 Institute of Electrical and Electronic Engineers Standard 488.2-1987,which defines the GPIB.
indicator Front panel object that displays output, such as a graph or LED.
Glossary
© National Instruments Corporation G-3 Getting Started with LabVIEW
L
Labeling tool Tool to create labels and enter text into text windows.
LabVIEW Laboratory Virtual Instrument Engineering Workbench. LabVIEW is agraphical programming language that uses icons instead of lines of text tocreate programs.
M
MB Megabytes of memory. 1 MB is equal to 1,024 KB.
N
node Program execution element. Nodes are analogous to statements, operators,functions, and subroutines in text-based programming languages.On a block diagram, nodes include functions, structures, and subVIs.
O
Operating tool Tool to enter data into controls and operate them.
P
palette Display of icons that represent possible options.
Positioning tool Tool to move and resize objects.
probe Debugging feature for checking intermediate values in a VI.
PXI PCI eXtensions for Instrumentation. A modular, computer-basedinstrumentation platform.
R
RS-232 Recommended Standard 232, a serial interface bus standard.
RS-485 Recommended Standard 485, a serial interface bus standard.
Glossary
Getting Started with LabVIEW G-4 ni.com
S
shift register Optional mechanism in loop structures to pass the value of a variable fromone iteration of a loop to a subsequent iteration. Shift registers are similarto static variables in text-based programming languages.
Solutions Gallery Option within the DAQ Solution Wizard in which you can select fromnumerous categories of common DAQ applications.
structure Program control element, such as a Sequence Structure, Case structure,For Loop, or While Loop.
subpalette A palette contained in an icon of another palette.
subVI VI used in the block diagram of another VI. Comparable to a subroutine.
T
terminal Object or region on a node through which data pass.
tip strip Small yellow text banners that identify the terminal name and make it easierto identify terminals for wiring.
Tools palette Palette that contains tools you can use to edit and debug front panel andblock diagram objects.
tunnel Data entry or exit terminal on a structure.
V
VI See virtual instrument.
virtual instrument Program in LabVIEW that models the appearance and function of aphysical instrument.
VISA Single interface library for controlling GPIB, VXI, RS-232, and other typesof instruments.
VXI VME eXtensions for Instrumentation (bus).
Glossary
© National Instruments Corporation G-5 Getting Started with LabVIEW
W
waveform chart Indicator that plots data points at a certain rate.
While Loop Loop structure that repeats a section of code until a condition is met.
wire Data path between nodes.
wire branch Section of wire that contains all the wire segments from junction tojunction, terminal to junction, or terminal to terminal if there are nojunctions between.
wire junction Point where three or more wire segments join.
wire segment Single horizontal or vertical piece of wire.
Wiring tool Tool to define data paths between terminals.
Recommended