ISSN 1725-2237
Good practice guide on quiet areas
EEA Technical report No 4/2014


EEA Technical report No 4/2014
Good practice guide on quiet areas
Cover design: EEACover photo © Colin Nugent (Blessington Basin, Dublin's first official quiet area)Layout: EEA/Pia Schmidt
European Environment AgencyKongens Nytorv 61050 Copenhagen KDenmarkTel.: +45 33 36 71 00Fax: +45 33 36 71 99Web: eea.europa.euEnquiries: eea.europa.eu/enquiries
Legal noticeThe contents of this publication do not necessarily reflect the official opinions of the European Commission or other institutions of the European Union. Neither the European Environment Agency nor any person or company acting on behalf of the Agency is responsible for the use that may be made of the information contained in this report.
Copyright notice© European Environment Agency, 2014Reproduction is authorised, provided the source is acknowledged, save where otherwise stated.
Information about the European Union is available on the Internet. It can be accessed through the Europa server (www.europa.eu).
Luxembourg: Publications Office of the European Union, 2014
ISBN 978-92-9213-424-2ISSN 1725-2237doi:10.2800/12611
3
Contents
Good practice guide on quiet areas
Contents
Acknowledgements .................................................................................................... 4
Preface ....................................................................................................................... 5
1 Introduction .......................................................................................................... 6
2 Sound, noise and quiet .......................................................................................... 7
3 Definitions and selection criteria ........................................................................... 93.1 Definitions of quiet in the END ............................................................................ 93.2 Relation to current practice ................................................................................ 93.3 Reporting of data relating to quiet ....................................................................... 9
4 Health benefits of quiet areas .............................................................................. 12
5 Biodiversity effects .............................................................................................. 13
6 The economic value of quiet areas ....................................................................... 14
7 Review of current practice among Member States and competent authorities ........................................................................................................... 15
7.1 Overview of actions on quiet areas in Europe ...................................................... 15
8 Methods for identifying quiet areas ..................................................................... 228.1 Noise mapping ............................................................................................... 228.2 Measurement of sound-pressure levels .............................................................. 238.3 Evaluation of user/visitor experiences ................................................................ 248.4 Expert assessments ........................................................................................ 25
9 Research questions ............................................................................................. 26
10 Recommendations and conclusions ..................................................................... 27
Glossary ................................................................................................................... 28
References and further reading ................................................................................ 29
Annex 1 Current research into quiet areas ..............................................................31
Annex 2 Information relating to appreciation and disturbance in quiet areas .........33
Annex 3 A recommendation by EPoN to make reference to a report published by Defra in 2006 ........................................................................................36
Annex 4 Bibliography ..............................................................................................37
Annex 5 Extract from Good Practice Guide for Strategic Noise Mapping and the Production of Associated Data on Noise Exposure .....................................39
Annex 6 Proposed methodology to represent quiet areas suitability outside urban areas ...............................................................................................41
Good practice guide on quiet areas4
Acknowledgements
Acknowledgements
Authors (EEA Expert Panel on Noise)
Alan Bloomfield (United Kingdom), Anna Backman (Sweden), Brian McManus (Ireland), Colin Nugent (EEA), Gaetano Licitra (Italy), Guillaume Dutilleux (France) Luis Bento Coelho (Portugal), Marco Paviotti (Directorate-General Environment, European Commission), Martin van den Berg (the Netherlands) Núria Blanes (Spain), Paul de Vos (the Netherlands), Søren Rasmussen (Denmark), Stelios Kephalopoulos (Joint Research Centre, European Commission) Stephen Turner (United Kingdom) and Wolfgang Babisch (Germany).
Lead editors
Gaetano Licitra, Martin van den Berg and Paul de Vos.
Contributors
Balazs Gergely (Formerly of Directorate General Environment, European Commission), Henk Wolfert (DCMR, the Netherlands), Miriam Weber (DCMR, the Netherlands), Maria Barrachina and Miquel Sáinz de la Maza (ETC/ACM, Autonomous University of Barcelona).
Reviewers
Aphrodite Mourelateau, Martin Adams and Paul McAleavey (EEA).
5
Preface
Good practice guide on quiet areas
Preface
Noise pollution is a growing concern in Europe. Of particular importance is noise from transport and industrial sources, which are addressed by Directive 2002/49/EC relating to the assessment and management of environmental noise, otherwise known as the Environmental Noise Directive (END).
As well as actions to reduce human exposure to this noise, the END highlights the need to preserve environmental noise quality where it is good. It is these quiet areas that are the subject of this report by the EEA Expert Panel on Noise.
The EPoN is a working group that supports the European Environment Agency (EEA) and the European Commission to develop and implement effective noise policy for Europe.
The Panel aims to build upon results delivered by previous working groups, particularly those concerning the END. This good practice guide has been drawn up to help policymakers, competent authorities and any other interested parties understand and fulfil the requirements of the END. The guide makes recommendations based on examples of good practice in assessing and managing quiet areas in Europe.
This document is not an official position statement on behalf of the EEA or the European Commission. Only the text of the END is applicable in law at Community level. If, in any instance, suggestions contained in this good practice guide seem to be at variance with those of the Directive, then the text of the directive should be applied instead.
Members of the EPoN who helped prepare the document are Gaetano Licitra (Italy), Paul de Vos (the Netherlands) and Martin van den Berg (the Netherlands) as joint lead editors. Other contributing members of the EPoN are Wolfgang Babisch (Germany), Guillaume Dutilleux (France), Anna Backman (Sweden), Brian McManus (Ireland), Alan Bloomfield (United Kingdom), Núria Blanes (Spain), Luis Bento Coelho (Portugal), Stephen Turner (United Kingdom) and Søren Rasmussen (Denmark).
The Panel is chaired by Colin Nugent (EEA), and observer members from the European Commission include Marco Paviotti (Directorate-General for the Environment) and Stelios Kephalopoulos (Joint Research Centre).
Good practice guide on quiet areas6
Introduction
1 Introduction
Directive 2002/49/EC of the European Parliament and of the Council relating to the assessment and management of environment noise, more commonly known as the Environmental Noise Directive (END), has a clearly stated aim: to 'define a common approach intended to avoid, prevent or reduce on a prioritised basis the harmful effects, including annoyance, due to exposure to environmental noise'. Thus, the END acknowledges the need for preventing or reducing environmental noise levels that may negatively affect human health, including annoyance and sleep disturbance. In addition, it highlights the need to preserve 'environmental noise quality where it is good', as well as to preserve quiet areas. The foundation for preserving these quiet areas was laid through the Green Paper on Future Noise Policy (EC, 1996): 'They (the noise maps) make it easy to recognise the noise exposure and thereby identify areas where action is required and other quiet areas where exposure should not increase'.
The END's regulation of quiet areas is somewhat limited. Article 8 states that action plans for agglomerations with more than 250 000 inhabitants 'shall also aim to protect quiet areas against an increase in noise'. This is followed up by the requirement in Annex V to report on actions or measures that the competent authorities intend to take to preserve quiet areas. Actions may include land use planning, systems engineering for traffic,
traffic planning, and noise control of sources. The END does not specify any requirements regarding the protection of quiet areas in open country.
In the review report from the first round of END implementation (Milieu, 2010), many Member States spotlighted the absence of any guidance on quiet areas. This led to the issue being listed in the Commission's implementation report as one possibly requiring technical improvement (EC, 2011).
Furthermore, a report published by the European Parliament in 2012 made recommendations for the development of a more comprehensive noise strategy, wherein, the vague definition of quiet areas by the END was highlighted as leaving ample discretion for interpretation to Member States, which led to confusion and divergence in approach to the protection of quiet areas (EP, 2012).
The weak focus of the END on quiet areas has led to heightened activity in this field, especially in areas like soundscapes, the study of how people perceive the acoustic environment. Several Member States initiated or intensified their policies with respect to quiet areas. This means there is currently more knowledge and experience on the subject than there was at the time of publishing the Green Paper. The EEA EPoN has been able to collect, order and redistribute this experience for wider use.
7
Sound, noise and quiet
Good practice guide on quiet areas
2 Sound, noise and quiet
A common misunderstanding is the belief that absence of noise automatically implies total silence; this is the equivalent of believing that creating a vacuum is the solution for air pollution. Sounds are, however, an essential ingredient of human life. They are meaningful, and provide information about our surroundings — on the volume of a space, for instance, and on which activities occur in that space. The atmosphere is in constant movement, generating all kinds of sound itself and in its streaming around objects. Countless (natural) activities and objects have their characteristic sounds. Putting humans in a relatively soundless environment like a remote desert typically makes them feel very uncomfortable.
Following the definitions provided in Article 3 of the END, a quiet area is not one that is silent, but rather one that is undisturbed by unwanted or harmful outdoor sound created by human activities (i.e. environmental noise). Harmful sounds are those that negatively affect human health; they include annoyance and sleep disturbance. In other words, quiet areas can be understood in terms of absence of sound that interferes with activities. Communication in all its subtle (orientation, signals of impending danger) or direct (speech, warning signals) forms will of course be disturbed by noise; processes like thinking, reading, writing, sleeping and learning are also known to be disturbed by noise (e.g. Stansfeld et al., 2005; and WHO, 2000, 2011).
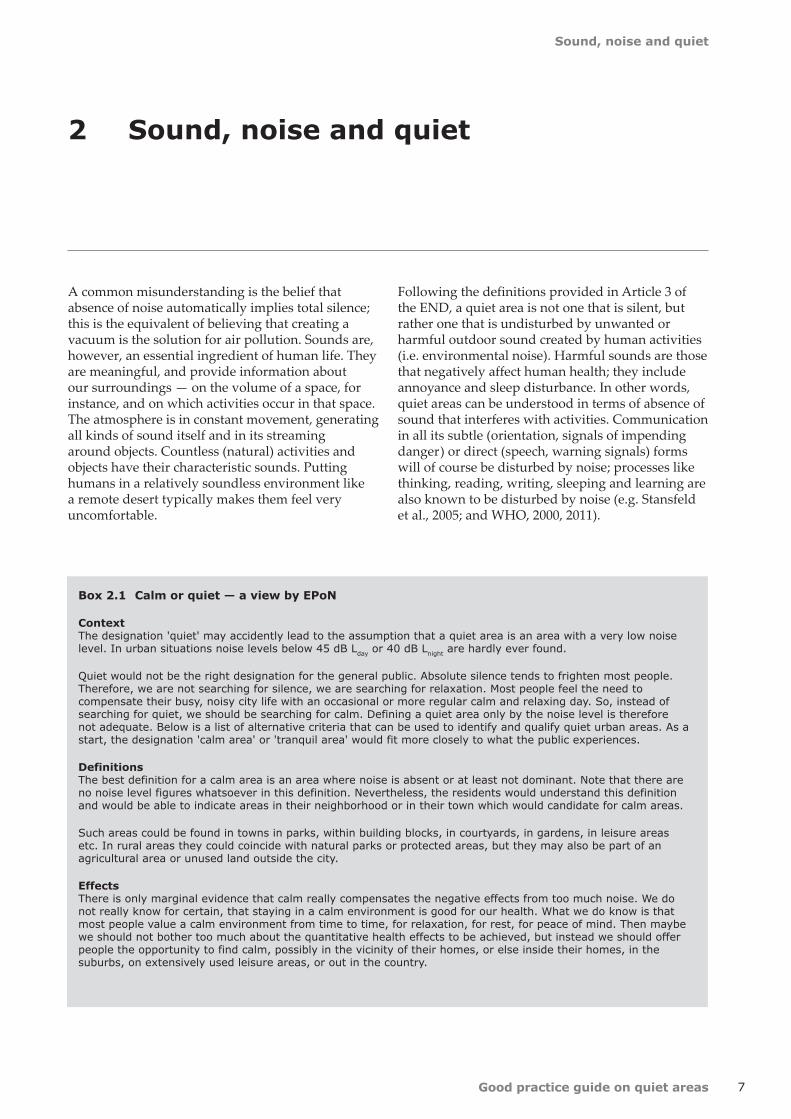
Box 2.1 Calm or quiet — a view by EPoN
ContextThe designation 'quiet' may accidently lead to the assumption that a quiet area is an area with a very low noise level. In urban situations noise levels below 45 dB Lday or 40 dB Lnight are hardly ever found.
Quiet would not be the right designation for the general public. Absolute silence tends to frighten most people. Therefore, we are not searching for silence, we are searching for relaxation. Most people feel the need to compensate their busy, noisy city life with an occasional or more regular calm and relaxing day. So, instead of searching for quiet, we should be searching for calm. Defining a quiet area only by the noise level is therefore not adequate. Below is a list of alternative criteria that can be used to identify and qualify quiet urban areas. As a start, the designation 'calm area' or 'tranquil area' would fit more closely to what the public experiences.
DefinitionsThe best definition for a calm area is an area where noise is absent or at least not dominant. Note that there are no noise level figures whatsoever in this definition. Nevertheless, the residents would understand this definition and would be able to indicate areas in their neighborhood or in their town which would candidate for calm areas.
Such areas could be found in towns in parks, within building blocks, in courtyards, in gardens, in leisure areas etc. In rural areas they could coincide with natural parks or protected areas, but they may also be part of an agricultural area or unused land outside the city.
EffectsThere is only marginal evidence that calm really compensates the negative effects from too much noise. We do not really know for certain, that staying in a calm environment is good for our health. What we do know is that most people value a calm environment from time to time, for relaxation, for rest, for peace of mind. Then maybe we should not bother too much about the quantitative health effects to be achieved, but instead we should offer people the opportunity to find calm, possibly in the vicinity of their homes, or else inside their homes, in the suburbs, on extensively used leisure areas, or out in the country.
Sound, noise and quiet
8 Good practice guide on quiet areas
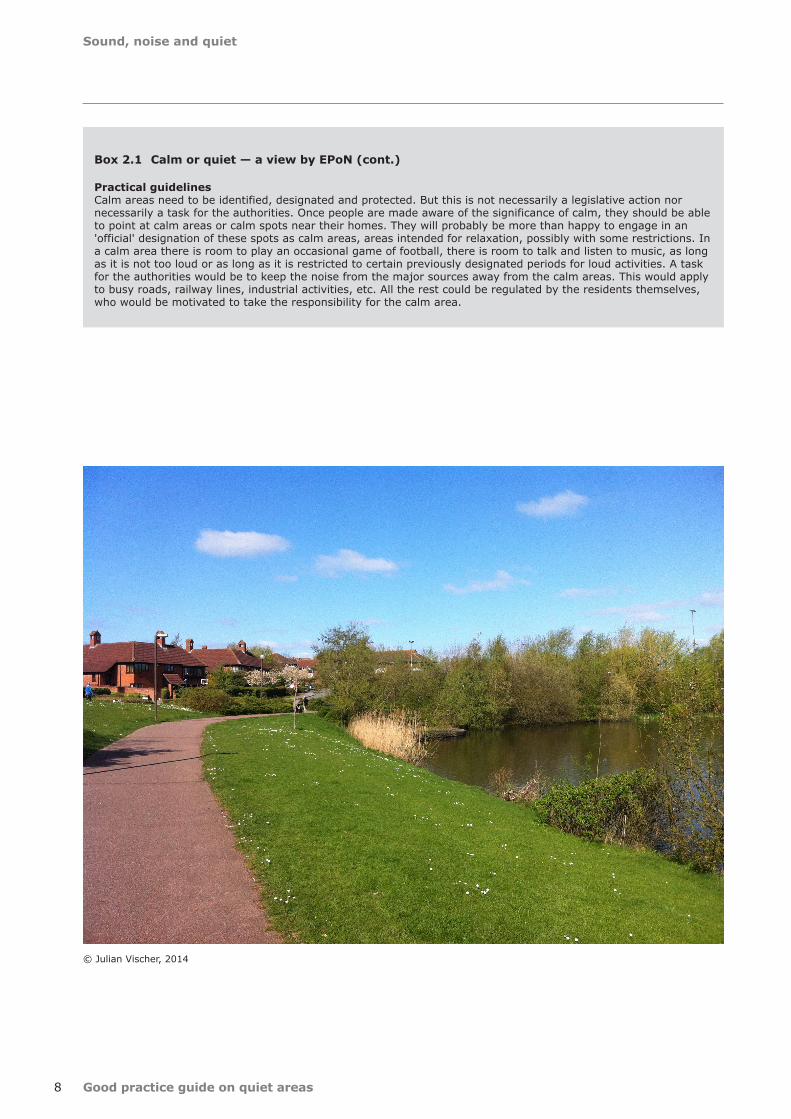
Box 2.1 Calm or quiet — a view by EPoN (cont.)
Practical guidelinesCalm areas need to be identified, designated and protected. But this is not necessarily a legislative action nor necessarily a task for the authorities. Once people are made aware of the significance of calm, they should be able to point at calm areas or calm spots near their homes. They will probably be more than happy to engage in an 'official' designation of these spots as calm areas, areas intended for relaxation, possibly with some restrictions. In a calm area there is room to play an occasional game of football, there is room to talk and listen to music, as long as it is not too loud or as long as it is restricted to certain previously designated periods for loud activities. A task for the authorities would be to keep the noise from the major sources away from the calm areas. This would apply to busy roads, railway lines, industrial activities, etc. All the rest could be regulated by the residents themselves, who would be motivated to take the responsibility for the calm area.
© Julian Vischer, 2014
9
Definitions and selection criteria
Good practice guide on quiet areas
3 Definitions and selection criteria
The END defines quiet areas both inside and outside agglomerations, and also defines quiet façades.
3.1 Definitions of quiet in the END
• A quiet area in an agglomeration shall mean an area, delimited by a competent authority, for instance, which is not exposed to a value of Lden (1) or another appropriate noise indicator greater than a certain value set by the Member State, from any noise source.
• A quiet area in open country shall mean an area, delimited by a competent authority, that is undisturbed by noise from traffic, industry or recreational activities.
• A quiet façade is the façade of a dwelling at which the value of Lden 4 metres (m) above the ground and 2 m in front of the façade, for the noise emitted from a specific source, is more than 20 decibels (dB) lower than at the façade having the highest value of Lden.
The first two definitions are operational. The first aims to define a 'quiet area' based on its physical qualities, whereas the second is more directed towards its effect or disturbance. The definition of a quiet façade borders quite literally on the definition of a quiet area in agglomerations: connect a number of quiet façades and a quiet area is the natural result (and vice versa).
3.2 Relation to current practice
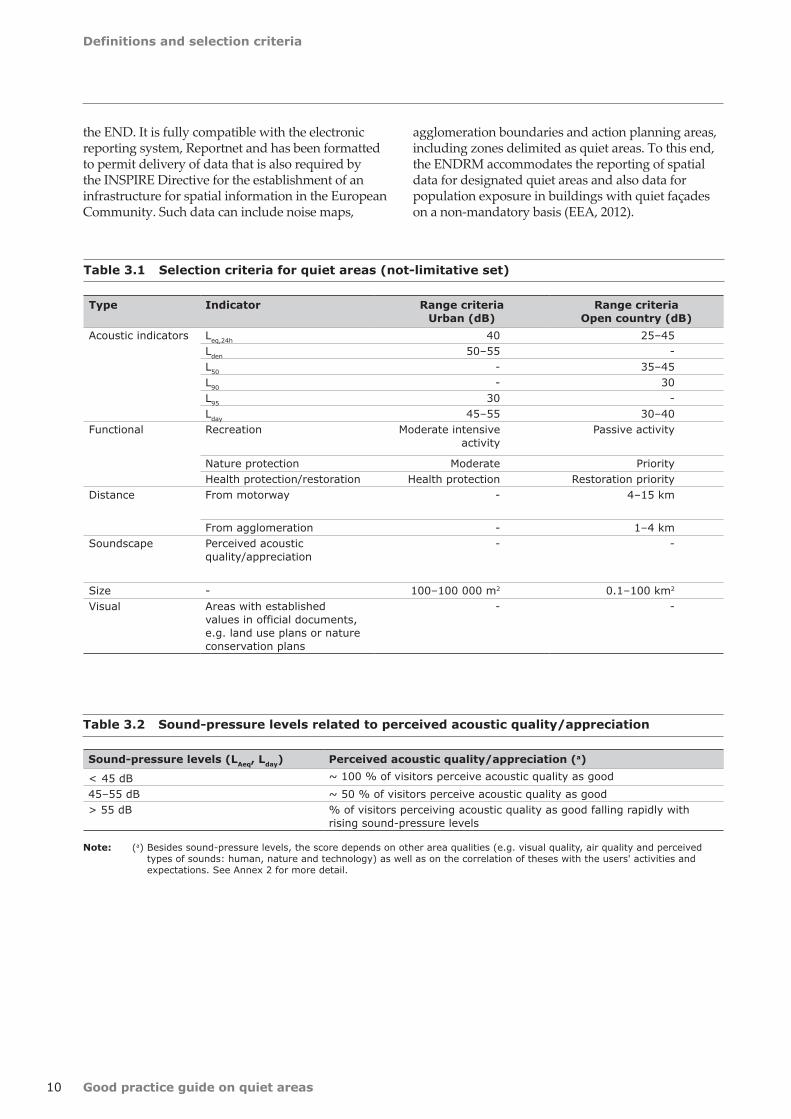
An examination of current practices shows that approaches, methods and indicators used for the identification of quiet areas vary widely, as do the physical and effect-oriented definitions or selection criteria (see Table 3.1).
Many of these criteria can be and are used in combination, often at separate steps of a particular
(1) Lden: day, evening, night sound level.
process. For example, one may first apply a course selection on the basis of functional and acoustic criteria, and then apply the other criteria on the resulting areas.
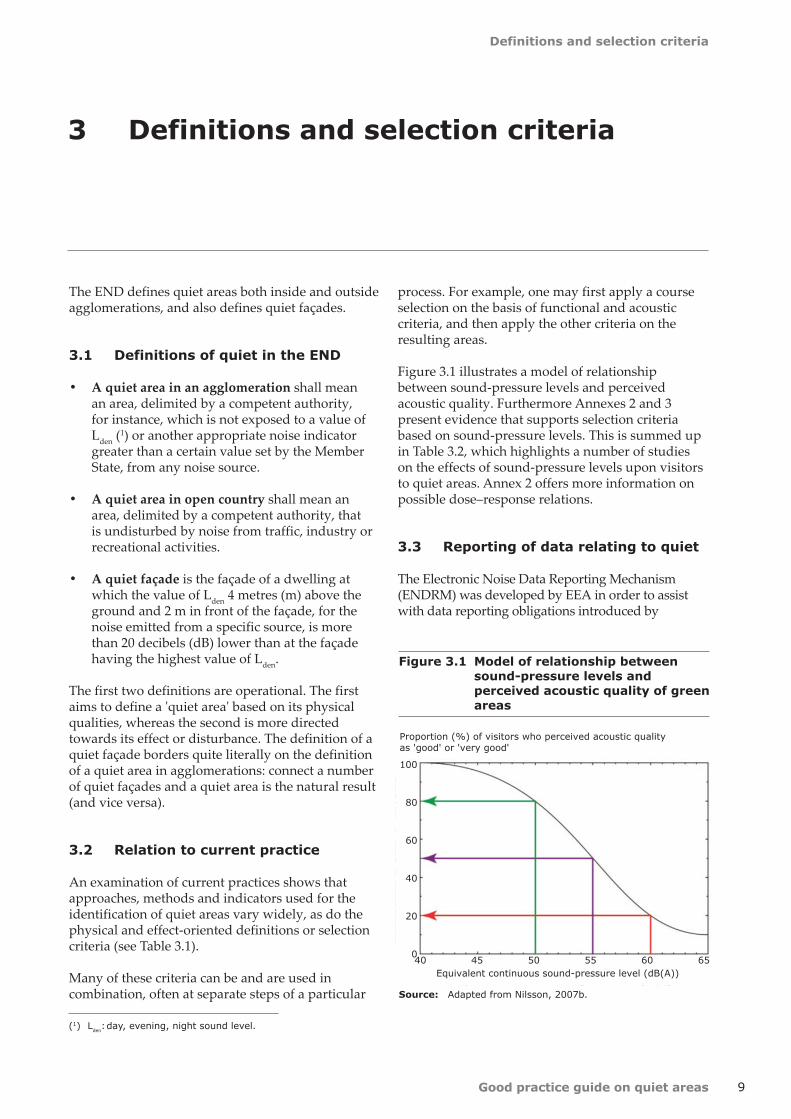
Figure 3.1 illustrates a model of relationship between sound-pressure levels and perceived acoustic quality. Furthermore Annexes 2 and 3 present evidence that supports selection criteria based on sound-pressure levels. This is summed up in Table 3.2, which highlights a number of studies on the effects of sound-pressure levels upon visitors to quiet areas. Annex 2 offers more information on possible dose–response relations.
3.3 Reporting of data relating to quiet
The Electronic Noise Data Reporting Mechanism (ENDRM) was developed by EEA in order to assist with data reporting obligations introduced by
Figure 3.1 Model of relationship between sound-pressure levels and perceived acoustic quality of green areas
Source: Adapted from Nilsson, 2007b.
Proportion (%) of visitors who perceived acoustic quality as 'good' or 'very good'
100
80
60
40
20
040 45 50 55 60 65Equivalent continuous sound-pressure level (dB(A))
Definitions and selection criteria
10 Good practice guide on quiet areas
the END. It is fully compatible with the electronic reporting system, Reportnet and has been formatted to permit delivery of data that is also required by the INSPIRE Directive for the establishment of an infrastructure for spatial information in the European Community. Such data can include noise maps,
Table 3.2 Sound-pressure levels related to perceived acoustic quality/appreciation
Sound-pressure levels (LAeq, Lday) Perceived acoustic quality/appreciation (a)
< 45 dB ~ 100 % of visitors perceive acoustic quality as good45–55 dB ~ 50 % of visitors perceive acoustic quality as good> 55 dB % of visitors perceiving acoustic quality as good falling rapidly with
rising sound-pressure levels
Note: (a) Besides sound-pressure levels, the score depends on other area qualities (e.g. visual quality, air quality and perceived types of sounds: human, nature and technology) as well as on the correlation of theses with the users' activities and expectations. See Annex 2 for more detail.
agglomeration boundaries and action planning areas, including zones delimited as quiet areas. To this end, the ENDRM accommodates the reporting of spatial data for designated quiet areas and also data for population exposure in buildings with quiet façades on a non-mandatory basis (EEA, 2012).
Type Indicator Range criteriaUrban (dB)
Range criteriaOpen country (dB)
Acoustic indicators Leq,24h 40 25–45Lden 50–55 -L50 - 35–45L90 - 30L95 30 -Lday 45–55 30–40
Functional Recreation Moderate intensive activity
Passive activity
Nature protection Moderate PriorityHealth protection/restoration Health protection Restoration priority
Distance From motorway - 4–15 km
From agglomeration - 1–4 kmSoundscape Perceived acoustic
quality/appreciation- -
Size - 100–100 000 m2 0.1–100 km2
Visual Areas with established values in official documents, e.g. land use plans or nature conservation plans
- -
Table 3.1 Selection criteria for quiet areas (not-limitative set)
Definitions and selection criteria
11Good practice guide on quiet areas
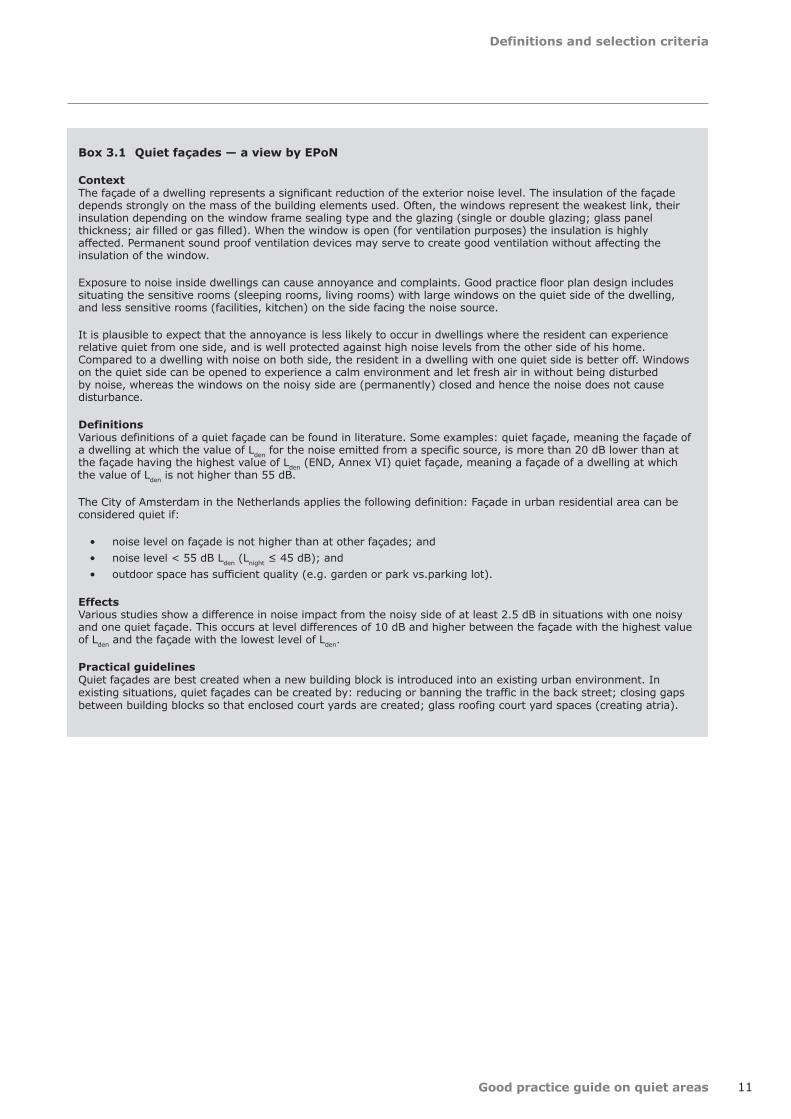
Box 3.1 Quiet façades — a view by EPoN
ContextThe façade of a dwelling represents a significant reduction of the exterior noise level. The insulation of the façade depends strongly on the mass of the building elements used. Often, the windows represent the weakest link, their insulation depending on the window frame sealing type and the glazing (single or double glazing; glass panel thickness; air filled or gas filled). When the window is open (for ventilation purposes) the insulation is highly affected. Permanent sound proof ventilation devices may serve to create good ventilation without affecting the insulation of the window.
Exposure to noise inside dwellings can cause annoyance and complaints. Good practice floor plan design includes situating the sensitive rooms (sleeping rooms, living rooms) with large windows on the quiet side of the dwelling, and less sensitive rooms (facilities, kitchen) on the side facing the noise source.
It is plausible to expect that the annoyance is less likely to occur in dwellings where the resident can experience relative quiet from one side, and is well protected against high noise levels from the other side of his home. Compared to a dwelling with noise on both side, the resident in a dwelling with one quiet side is better off. Windows on the quiet side can be opened to experience a calm environment and let fresh air in without being disturbed by noise, whereas the windows on the noisy side are (permanently) closed and hence the noise does not cause disturbance.
DefinitionsVarious definitions of a quiet façade can be found in literature. Some examples: quiet façade, meaning the façade of a dwelling at which the value of Lden for the noise emitted from a specific source, is more than 20 dB lower than at the façade having the highest value of Lden (END, Annex VI) quiet façade, meaning a façade of a dwelling at which the value of Lden is not higher than 55 dB.
The City of Amsterdam in the Netherlands applies the following definition: Façade in urban residential area can be considered quiet if:
• noise level on façade is not higher than at other façades; and• noise level < 55 dB Lden (Lnight ≤ 45 dB); and• outdoor space has sufficient quality (e.g. garden or park vs.parking lot).
EffectsVarious studies show a difference in noise impact from the noisy side of at least 2.5 dB in situations with one noisy and one quiet façade. This occurs at level differences of 10 dB and higher between the façade with the highest value of Lden and the façade with the lowest level of Lden.
Practical guidelinesQuiet façades are best created when a new building block is introduced into an existing urban environment. In existing situations, quiet façades can be created by: reducing or banning the traffic in the back street; closing gaps between building blocks so that enclosed court yards are created; glass roofing court yard spaces (creating atria).
Good practice guide on quiet areas12
Health benefits of quiet areas
People living in quiet areas do not suffer the negative health effects which befall those exposed to the average sound-pressure levels in an agglomeration; quiet areas also benefit the health and well-being of regular visitors.
For example, there is some evidence for annoyance and restoration, as indicated below.
• Access to the quiet side of a residence (i.e. LAeq,24h < 45 dB) reduces annoyance. Also, nearby quiet zones in noisy areas seem to reduce annoyance. In fact, mere access to nearby green areas seems to improve well-being (Öhrström, et al., 2006; Gidlöf-Gunnarsson and Öhrström, 2007).
• People recover faster in natural surroundings, an effect that seems applicable to quietness and natural sounds as well (Kaplan, 1995; Ulrich, 1984; Alvarsson et al., 2010).
• Among residents in Amsterdam, 75 % indicate that quiet around the house is important, and 50 % state that quiet in the neighbourhood is important (van den Berg, 2008).
4 Health benefits of quiet areas
• In the Netherlands, 46 % of the population consider their neighbourhood to be 'not quiet'. Half of the population visit quiet places in the neighbourhood daily or weekly (van den Berg, 2008).
• In the United Kingdom, 91 % of the population believe that existing areas of quiet must be protected. In London, the corresponding figure is 62 % (NSCA, 2007).
With respect to the general health impacts of environmental noise and the application of the latest scientific evidence to action plans, reference should be made to the Good practice guide on noise exposure and potential health effects. This was prepared by EPoN in 2010 and is available via the EEA website (see http://www.eea.europa.eu/publications/good-practice-guide-on-noise).
13
Biodiversity effects
Good practice guide on quiet areas
It is worth considering biodiversity issues when identifying and implementing quiet areas. Indeed, a symbiotic interaction is expected between the two subjects. Biodiversity benefits quiet areas, as nature sounds are generally valued positively by visitors to a place, and they may serve as indicators of a low level of traffic disturbances.
Quiet areas also benefit biodiversity for several reasons, from the general perspective of limiting biodiversity loss. One of the major causes of biodiversity loss is habitat destruction and fragmentation. Quiet areas should be selected bearing in mind the contribution to green infrastructure, whenever possible.
5 Biodiversity effects
Another significant cause of wildlife mortality is collision with vehicles. Large-surface quiet areas may offer a safer place to live in this respect.
Finally, and this point refers back to the original focus on noise control, many species rely on acoustic communication, and there is evidence that anthropogenic noise adversely affects wildlife (their species richness, reproductive success and population size), and also widely affects their behaviour. Here again, a quiet area could offer a refuge to some species, provided it is life-supporting, e.g. that it adequately provides local food,water resources and places to shelter.
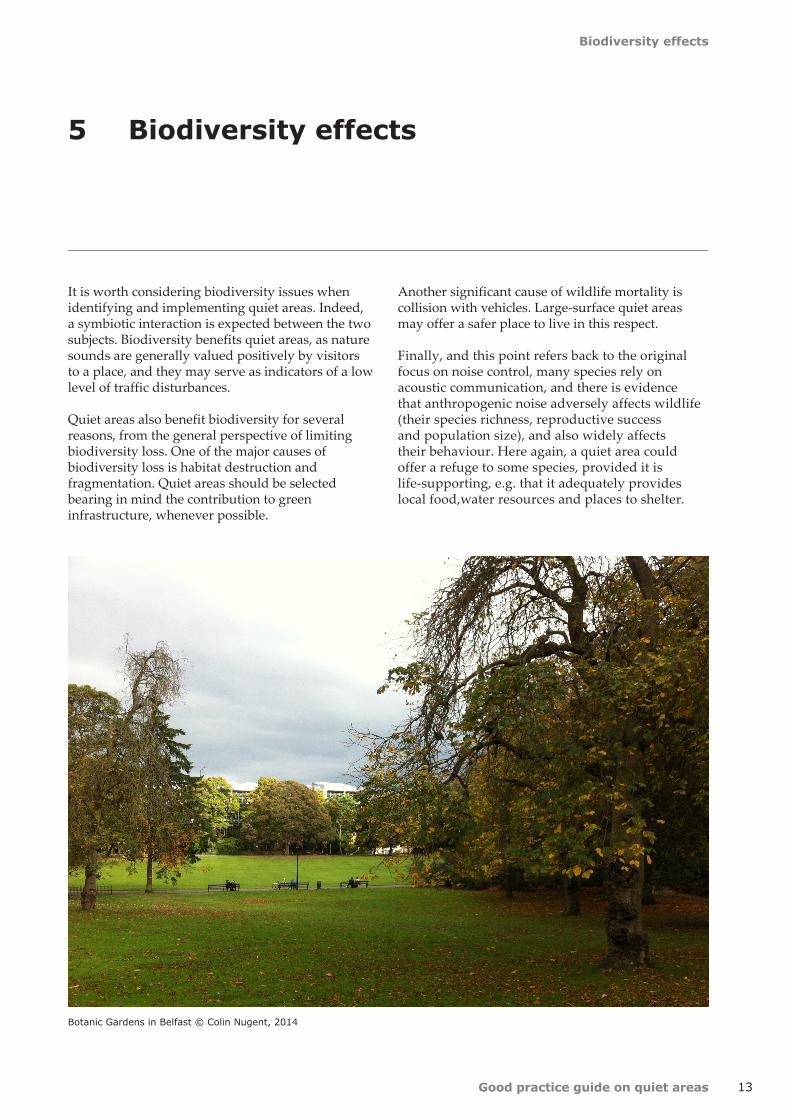
Botanic Gardens in Belfast © Colin Nugent, 2014
Good practice guide on quiet areas14
The economic value of quiet areas
Benefits of quiet areas in agglomerations can be estimated via the increase of property values. The direct effect of lower sound-pressure levels is estimated to be ~ 0.5 %/dB (RIVM, 2007). The indirect consequences of having a quiet area in a neighbourhood are harder to estimate.
According to the WHO report on Burden of Disease from Environmental Noise (2011):
• at least one million healthy life years are lost every year in western Europe due to noise from road traffic alone;
• it is the second-worst environmental cause of ill health, next to ultra-fine particulate matter (PM2.5).
In the report from the Commission to the European Parliament and the Council: on the implementation of the Environmental Noise Directive in accordance with Article 11 of Directive 2002/49/EC, the social costs of rail and road traffic,noise across the EU was estimated as amounting to EUR 40 billion per year,
6 The economic value of quiet areas
of which 90 % is related to passenger cars and goods vehicles. EC, 2011, available at: http://eur-lex.europa.eu/LexUriServ/LexUriServ.do?uri=CELEX:52011DC0321:EN:NOT.
The Swedish Transport Administration estimates that the social cost for noise in Sweden is SEK 20 billion (~ EUR 2 billion). Of this, approximately 80 % corresponds to reduced value of properties located in noisy areas. The remaining 20 % corresponds to the cost to society owing to health effects of noise.
In the United Kingdom, the Intergovernmental Group on Costs and Benefits noise subject group and Department for Environment, Food and Rural Affairs (Defra, 2008) reported that the health impact of noise could be costing the economy as much as GBP 2 billion to 3 billion per year. Subsequently, Defra published a report in 2011 which indicated that protection of quiet areas in the major cities of England could be valued at as much as GBP 1.4 billion per year to the economy (Defra, 2011).
15
Review of current practice among Member States and competent authorities
Good practice guide on quiet areas
A significant number of competent authorities have made a conscious effort to promote or protect quiet areas. However, as previously stated, approaches vary owing to cultural differences including language and the difficulty of translating 'quiet area' into other languages. Despite the currently limited experience on quiet areas, much can be learned from these efforts.
7.1 Overview of actions on quiet areas in Europe
The following section offers an overview of various ongoing actions to address quiet areas across Europe. This is both within the context of agglomerations, and also across more rural areas of open country. Specific END-derived action plan work is included, as are research papers commissioned to identify possible solutions to the definition, delineation and protection of quiet areas. The list of projects is by way of example only, and is not exhaustive.
When analysing the fascinating array of approaches to identifying quiet areas, one must applaud the ingenuity of the policymakers and experts concerned. Every possible definition of 'quiet area' seems to have been explored.
Sound-pressure levels play an important role in almost all schemes, but there are exceptions, indicating that sound-pressure level is not the only important factor in identifying quiet areas. Member States with the most developed soundscape approaches (Belgium, the Netherlands, Sweden and the United Kingdom) acknowledge that acoustic quality also relates to how an area is perceived by people, including the balance between wanted and unwanted sound and the area's recreational value, or how appropriate the sounds present are to the area and its use. This calls for new kinds of indicators, as well as new methods for identification or measurement of perceived acoustic quality/appreciation of quiet areas. This is because there are few evaluation studies, and it is not possible to determine which of the current approaches works
7 Review of current practice among Member States and competent authorities
best — something that underlines the need for further research into this area.
The more complex methods (in Belgium and Sweden, for instance) require more data and may be problematic when trying to control the sound-pressure levels once the quiet area is operational. Nevertheless, it must be stressed that the definition of quiet areas in an agglomeration presupposes that sound-pressure levels of noise sources may be measured in isolation from other kinds of sounds, like wanted sounds of humans and nature. In urban agglomerations, however, wanted sound may be as loud as unwanted sound. An example is how people in an urban park sit by a fountain, because it masks the background sound of road traffic.
Most of the currently used sound-level meters do not have the capacity to separate the sound-pressure levels of noise sources from the sound-pressure levels of wanted sounds. Consequently, detailed measurement of sound-pressure levels of noise sources in a quiet area of an agglomeration may be practically impossible. The solution is to rely entirely on calculated sound-pressure levels based on noise mapping, which is not at all the same as actual in situ measurement. This supports the observation that there is a need for new approaches towards measuring the acoustic quality of quiet areas, which move beyond sound-pressure levels. Soundscape is one such new approach.
The simpler approaches, for instance applying only Lden, can be effective for quiet areas in open country, because there, loud sounds are more likely to originate from sources like traffic, industry or recreational activities. Thus, if sound-pressure levels are below a certain level, e.g. < 40 dB on a calm day, the area is probably free of such sources. The Dutch regions laid down special regulations whereby regional inspectors have the power to restrict noisy activities before they occur or once they are perceived. This may be applied to a motor-sport event, for instance, but such a mechanism seems to be missing, or is not made explicit, in terms of END-related action plans.
Review of current practice among Member States and competent authorities
16 Good practice guide on quiet areas
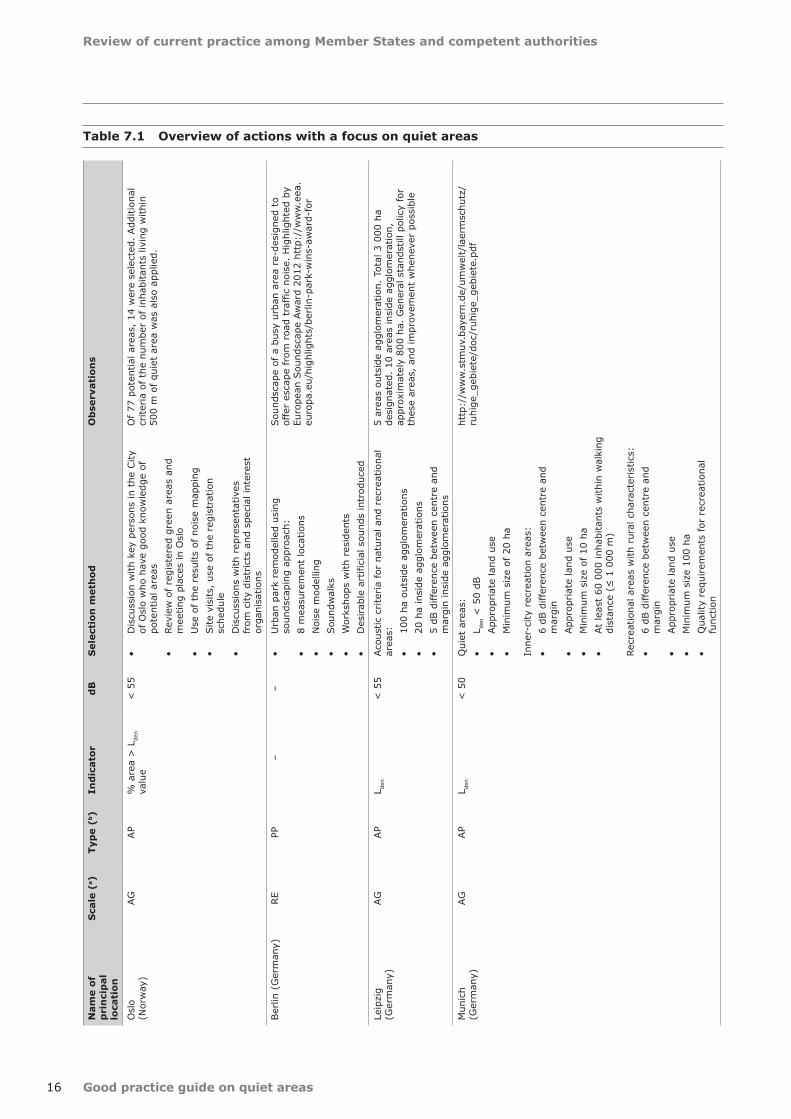
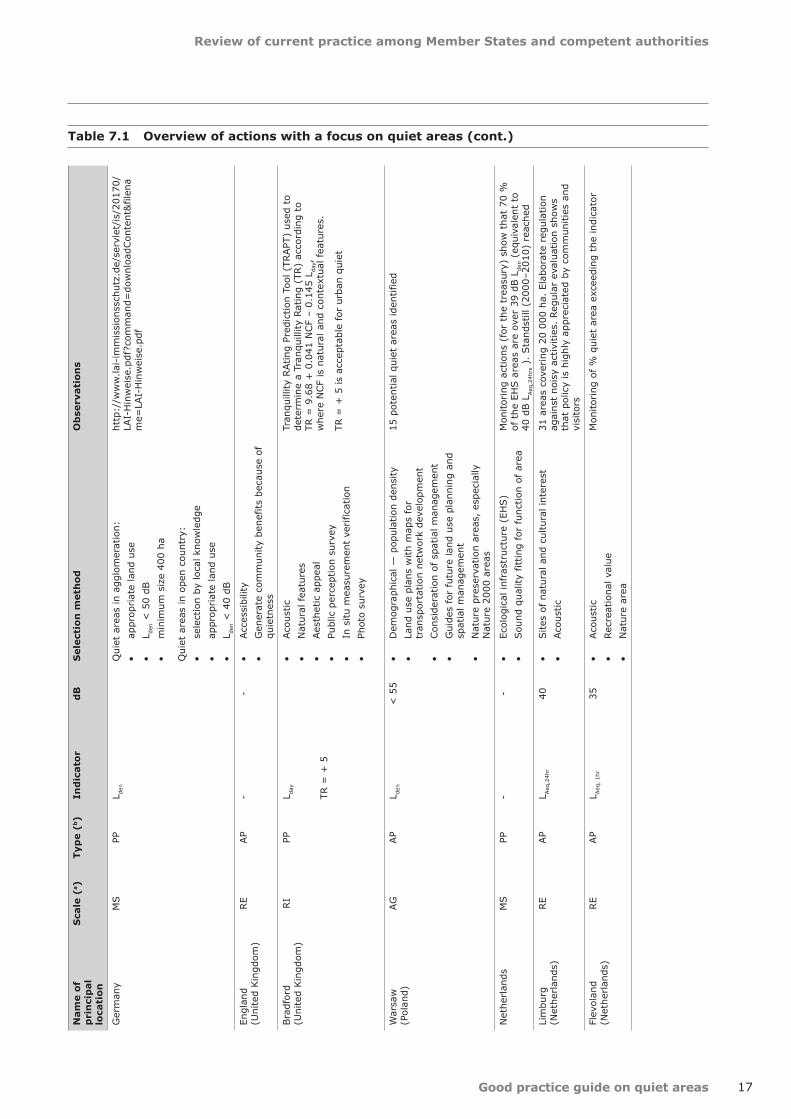
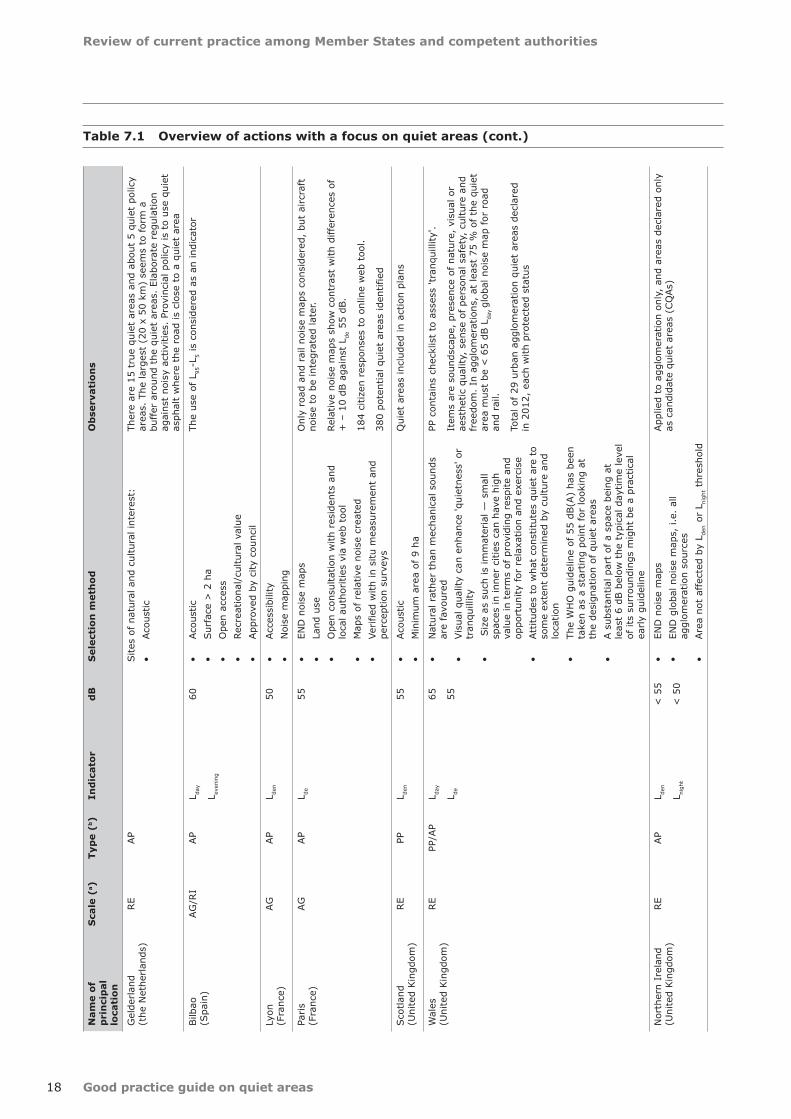
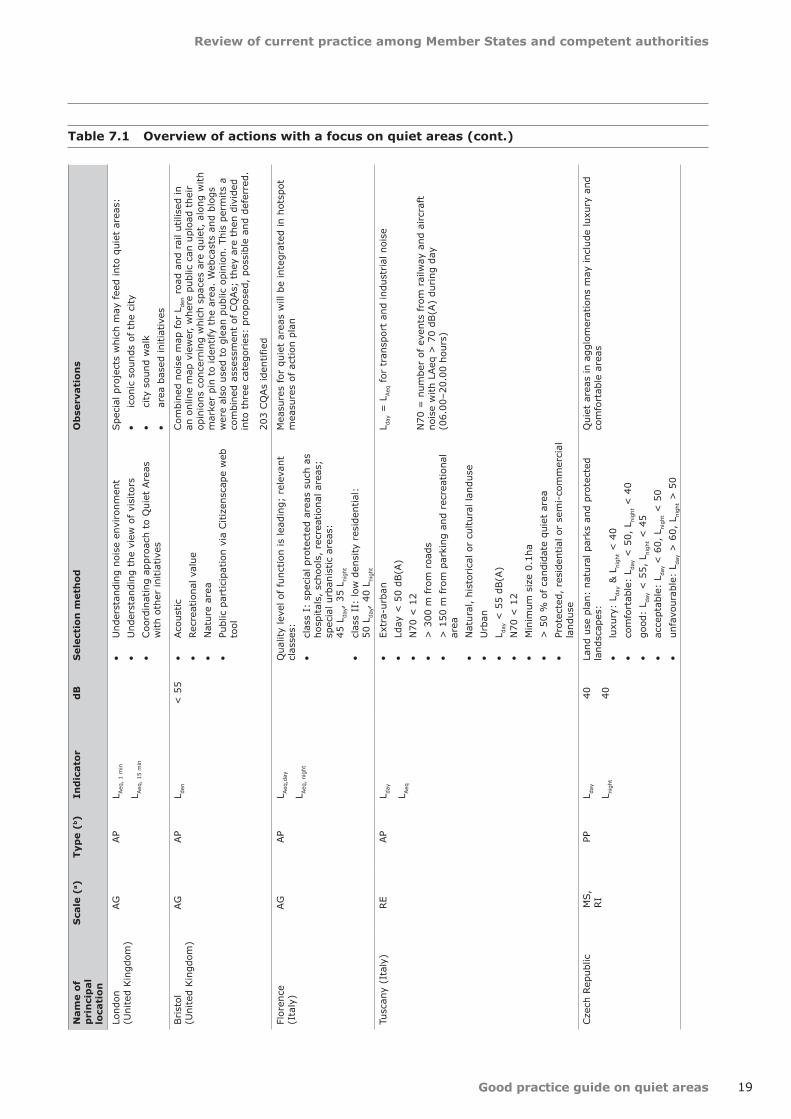
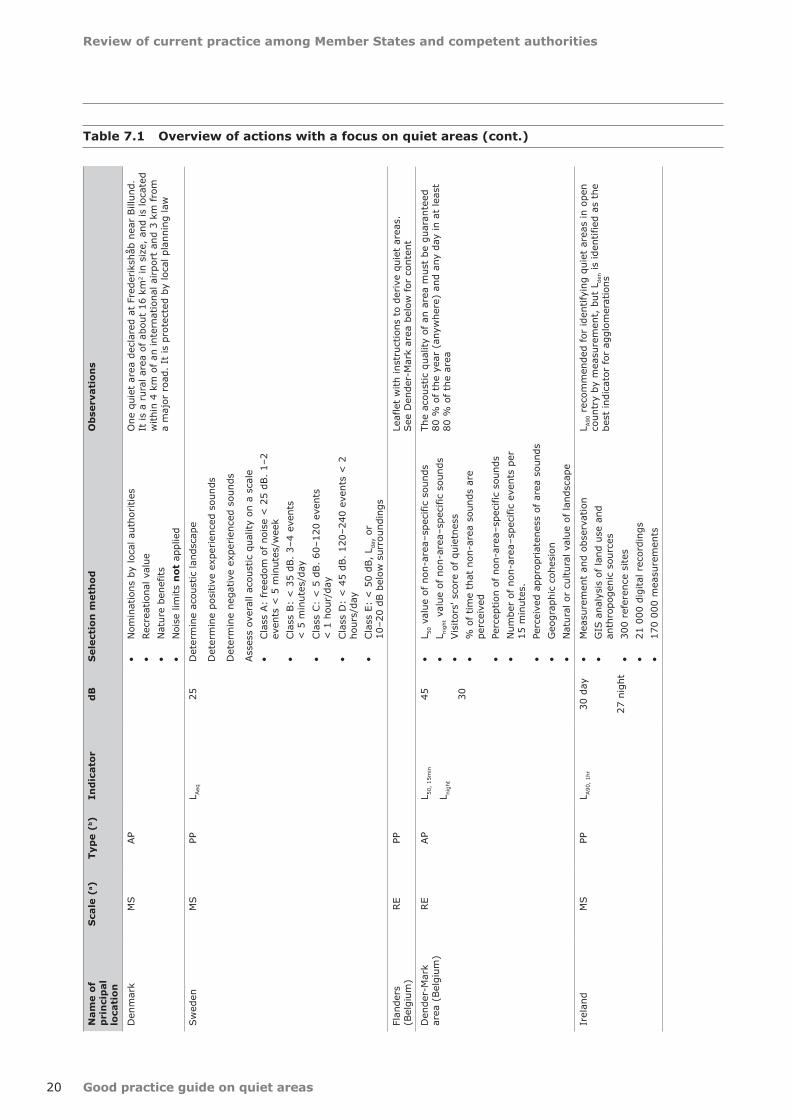
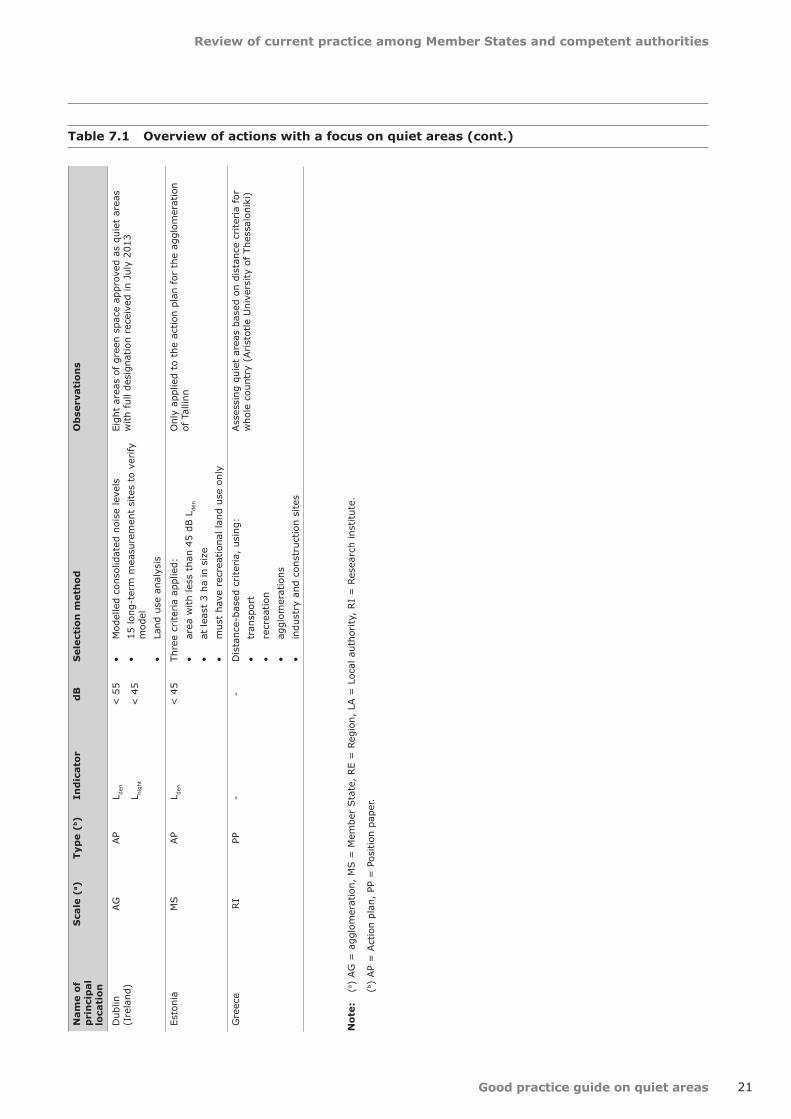
Table 7.1 Overview of actions with a focus on quiet areas
Nam
e of
p
rin
cip
al
loca
tion
Sca
le (
a )Ty
pe
(b)
Ind
icat
ord
BS
elec
tion
met
hod
Ob
serv
atio
ns
Osl
o
(Nor
way
)AG
AP
% a
rea
> L
den
valu
e<
55
• D
iscu
ssio
n w
ith k
ey p
erso
ns in
the
City
of
Osl
o w
ho h
ave
good
kno
wle
dge
of
pote
ntia
l are
as•
Revi
ew o
f re
gist
ered
gre
en a
reas
and
m
eetin
g pl
aces
in O
slo
• U
se o
f th
e re
sults
of no
ise
map
ping
• Site
vis
its,
use
of t
he r
egis
trat
ion
sche
dule
• D
iscu
ssio
ns w
ith r
epre
sent
ativ
es
from
city
dis
tric
ts a
nd s
peci
al in
tere
st
orga
nisa
tions
Of 77
pot
entia
l are
as,
14 w
ere
sele
cted
. Add
ition
al
crite
ria
of t
he n
umbe
r of
inha
bita
nts
livin
g w
ithin
50
0 m
of qu
iet
area
was
als
o ap
plie
d.
Ber
lin (
Ger
man
y)RE
PP–
–•
Urb
an p
ark
rem
odel
led
usin
g so
unds
capi
ng a
ppro
ach:
• 8
mea
sure
men
t lo
catio
ns•
Noi
se m
odel
ling
• Sou
ndw
alks
• W
orks
hops
with
res
iden
ts•
Des
irab
le a
rtifi
cial
sou
nds
intr
oduc
ed
Sou
ndsc
ape
of a
bus
y ur
ban
area
re-
desi
gned
to
offe
r es
cape
fro
m r
oad
traf
fic n
oise
. H
ighl
ight
ed b
y Eu
rope
an S
ound
scap
e Aw
ard
2012
htt
p://
ww
w.e
ea.
euro
pa.e
u/hi
ghlig
hts/
berlin
-par
k-w
ins-
awar
d-fo
r
Leip
zig
(Ger
man
y)AG
AP
L den
< 5
5Aco
ustic
crite
ria
for
natu
ral a
nd r
ecre
atio
nal
area
s:•
100
ha o
utsi
de a
gglo
mer
atio
ns•
20 h
a in
side
agg
lom
erat
ions
• 5
dB d
iffer
ence
bet
wee
n ce
ntre
and
m
argi
n in
side
agg
lom
erat
ions
5 ar
eas
outs
ide
aggl
omer
atio
n. T
otal
3 0
00 h
a de
sign
ated
. 10
are
as in
side
agg
lom
erat
ion,
ap
prox
imat
ely
800
ha.
Gen
eral
sta
ndst
ill p
olic
y fo
r th
ese
area
s, a
nd im
prov
emen
t w
hene
ver
poss
ible
Mun
ich
(Ger
man
y)AG
AP
L den
< 5
0Q
uiet
are
as:
• L d
en <
50
dB•
App
ropr
iate
land
use
• M
inim
um s
ize
of 2
0 ha
Inne
r-ci
ty r
ecre
atio
n ar
eas:
• 6
dB d
iffer
ence
bet
wee
n ce
ntre
and
m
argi
n•
App
ropr
iate
land
use
• M
inim
um s
ize
of 1
0 ha
• At
leas
t 60
000
inha
bita
nts
with
in w
alki
ng
dist
ance
(≤
1 0
00 m
)
Recr
eatio
nal a
reas
with
rur
al c
hara
cter
istic
s:•
6 dB
diff
eren
ce b
etw
een
cent
re a
nd
mar
gin
• App
ropr
iate
land
use
• M
inim
um s
ize
100
ha•
Qua
lity
requ
irem
ents
for
rec
reat
iona
l fu
nctio
n
http
://w
ww
.stm
uv.b
ayer
n.de
/um
wel
t/la
erm
schu
tz/
ruhi
ge_g
ebie
te/d
oc/r
uhig
e_ge
biet
e.pd
f
Review of current practice among Member States and competent authorities
17Good practice guide on quiet areas
Nam
e of
p
rin
cip
al
loca
tion
Sca
le (
a )Ty
pe
(b)
Ind
icat
ord
BS
elec
tion
met
hod
Ob
serv
atio
ns
Ger
man
yM
SPP
L den
Qui
et a
reas
in a
gglo
mer
atio
n:•
appr
opriat
e la
nd u
se•
L den
< 5
0 dB
• m
inim
um s
ize
400
ha
Qui
et a
reas
in o
pen
coun
try:
• se
lect
ion
by lo
cal k
now
ledg
e•
appr
opriat
e la
nd u
se•
L den
< 4
0 dB
http
://w
ww
.lai-
imm
issi
onss
chut
z.de
/ser
vlet
/is/
2017
0/LA
I-H
inw
eise
?com
man
d=do
wnl
oadC
onte
nt&
filen
am
e=LA
I-H
inw
eise
Engl
and
(Uni
ted
Kin
gdom
)RE
AP
--
• Acc
essi
bilit
y•
Gen
erat
e co
mm
unity
ben
efits
bec
ause
of
quie
tnes
s
Bra
dfor
d
(Uni
ted
Kin
gdom
)RI
PPL d
ay
TR =
+ 5
• Aco
ustic
• N
atur
al fea
ture
s•
Aes
thet
ic a
ppea
l•
Publ
ic p
erce
ptio
n su
rvey
• In
situ
mea
sure
men
t ve
rific
atio
n•
Phot
o su
rvey
Tran
quill
ity R
Atin
g Pr
edic
tion
Tool
(TR
APT
) us
ed t
o de
term
ine
a Tr
anqu
illity
Rat
ing
(TR)
acco
rdin
g to
TR
= 9
.68
+ 0
.041
NCF
– 0.
145
L day,
whe
re N
CF
is n
atur
al a
nd c
onte
xtua
l fea
ture
s.
TR =
+ 5
is a
ccep
tabl
e fo
r ur
ban
quie
t
War
saw
(P
olan
d)AG
AP
L den
< 5
5•
Dem
ogra
phic
al —
pop
ulat
ion
dens
ity•
Land
use
pla
ns w
ith m
aps
for
tran
spor
tatio
n ne
twor
k de
velo
pmen
t•
Con
side
ratio
n of
spa
tial m
anag
emen
t•
Gui
des
for
futu
re la
nd u
se p
lann
ing
and
spat
ial m
anag
emen
t•
Nat
ure
pres
erva
tion
area
s, e
spec
ially
N
atur
e 20
00 a
reas
15 p
oten
tial q
uiet
are
as id
entif
ied
Net
herlan
dsM
SPP
--
• Ec
olog
ical
infr
astr
uctu
re (
EHS)
• Sou
nd q
ualit
y fit
ting
for
func
tion
of a
rea
Mon
itoring
act
ions
(fo
r th
e tr
easu
ry)
show
tha
t 70
%
of t
he E
HS a
reas
are
ove
r 39
dB L
den
(equ
ival
ent
to
40 d
B L
Aeq
,24h
rs )
. Sta
ndst
ill (
2000
–201
0) r
each
ed
Lim
burg
(N
ethe
rlan
ds)
RE
AP
L Aeq
,24h
r40
• Site
s of
nat
ural
and
cul
tura
l int
eres
t•
Aco
ustic
31 a
reas
cov
erin
g 20
000
ha.
Ela
bora
te r
egul
atio
n ag
ains
t no
isy
activ
ities
. Re
gula
r ev
alua
tion
show
s th
at p
olic
y is
hig
hly
appr
ecia
ted
by c
omm
uniti
es a
nd
visi
tors
Flev
olan
d (N
ethe
rlan
ds)
RE
AP
L Aeq
, 1h
r35
•
Aco
ustic
• Re
crea
tiona
l val
ue•
Nat
ure
area
Mon
itoring
of %
qui
et a
rea
exce
edin
g th
e in
dica
tor
Table 7.1 Overview of actions with a focus on quiet areas (cont.)
Review of current practice among Member States and competent authorities
18 Good practice guide on quiet areas
Nam
e of
p
rin
cip
al
loca
tion
Sca
le (
a )Ty
pe
(b)
Ind
icat
ord
BS
elec
tion
met
hod
Ob
serv
atio
ns
Gel
derlan
d (t
he N
ethe
rlan
ds)
RE
AP
Site
s of
nat
ural
and
cul
tura
l int
eres
t:•
Aco
ustic
Ther
e ar
e 15
tru
e qu
iet
area
s an
d ab
out
5 qu
iet
polic
y ar
eas.
The
larg
est
(20
x 50
km
) se
ems
to for
m a
bu
ffer
aro
und
the
quie
t ar
eas.
Ela
bora
te r
egul
atio
n ag
ains
t no
isy
activ
ities
. Pr
ovin
cial
pol
icy
is t
o us
e qu
iet
asph
alt
whe
re t
he r
oad
is c
lose
to
a qu
iet
area
Bilb
ao
(Spa
in)
AG
/RI
AP
L day
L eve
ning
60•
Aco
ustic
• Sur
face
> 2
ha
• O
pen
acce
ss•
Recr
eatio
nal/
cultu
ral v
alue
• App
rove
d by
city
cou
ncil
The
use
of L
95-L
5 is
con
side
red
as a
n in
dica
tor
Lyon
(F
ranc
e)AG
AP
L den
50•
Acc
essi
bilit
y•
Noi
se m
appi
ng
Paris
(F
ranc
e)AG
AP
L de
55•
END
noi
se m
aps
• La
nd u
se•
Ope
n co
nsul
tatio
n w
ith r
esid
ents
and
lo
cal a
utho
ritie
s vi
a w
eb t
ool
• M
aps
of r
elat
ive
nois
e cr
eate
d•
Verifie
d w
ith in
situ
mea
sure
men
t an
d pe
rcep
tion
surv
eys
Onl
y ro
ad a
nd r
ail n
oise
map
s co
nsid
ered
, bu
t ai
rcra
ft
nois
e to
be
inte
grat
ed la
ter.
Rela
tive
nois
e m
aps
show
con
tras
t w
ith d
iffer
ence
s of
+
– 1
0 dB
aga
inst
Lde
55
dB.
184
citiz
en r
espo
nses
to
onlin
e w
eb t
ool.
380
pote
ntia
l qui
et a
reas
iden
tifie
d
Sco
tland
(U
nite
d Kin
gdom
)RE
PPL d
en55
• Aco
ustic
• M
inim
um a
rea
of 9
ha
Qui
et a
reas
incl
uded
in a
ctio
n pl
ans
Wal
es
(Uni
ted
Kin
gdom
)RE
PP/A
PL d
ay
L de
65 55
• N
atur
al r
athe
r th
an m
echa
nica
l sou
nds
are
favo
ured
• Vis
ual q
ualit
y ca
n en
hanc
e 'q
uiet
ness
' or
tran
quill
ity•
Siz
e as
suc
h is
imm
ater
ial —
sm
all
spac
es in
inne
r ci
ties
can
have
hig
h va
lue
in t
erm
s of
pro
vidi
ng r
espi
te a
nd
oppo
rtun
ity for
rel
axat
ion
and
exer
cise
• At
titud
es t
o w
hat
cons
titut
es q
uiet
are
to
som
e ex
tent
det
erm
ined
by
cultu
re a
nd
loca
tion
• Th
e W
HO
gui
delin
e of
55
dB(A
) ha
s be
en
take
n as
a s
tart
ing
poin
t fo
r lo
okin
g at
th
e de
sign
atio
n of
qui
et a
reas
• A s
ubst
antia
l par
t of
a s
pace
bei
ng a
t le
ast
6 dB
bel
ow t
he t
ypic
al d
aytim
e le
vel
of it
s su
rrou
ndin
gs m
ight
be
a pr
actic
al
early
guid
elin
e
PP c
onta
ins
chec
klis
t to
ass
ess
'tran
quill
ity'.
Item
s ar
e so
unds
cape
, pr
esen
ce o
f na
ture
, vi
sual
or
aest
hetic
qua
lity,
sen
se o
f pe
rson
al s
afet
y, c
ultu
re a
nd
free
dom
. In
agg
lom
erat
ions
, at
leas
t 75
% o
f th
e qu
iet
area
mus
t be
< 6
5 dB
Lda
y gl
obal
noi
se m
ap for
roa
d an
d ra
il.
Tota
l of 29
urb
an a
gglo
mer
atio
n qu
iet
area
s de
clar
ed
in 2
012,
eac
h w
ith p
rote
cted
sta
tus
Nor
ther
n Ir
elan
d (U
nite
d Kin
gdom
)RE
AP
L den
L nig
ht
< 5
5
< 5
0
• EN
D n
oise
map
s•
END
glo
bal n
oise
map
s, i.
e. a
ll ag
glom
erat
ion
sour
ces
• Are
a no
t af
fect
ed b
y L d
en o
r L n
ight t
hres
hold
App
lied
to a
gglo
mer
atio
n on
ly,
and
area
s de
clar
ed o
nly
as c
andi
date
qui
et a
reas
(CQ
As)
Table 7.1 Overview of actions with a focus on quiet areas (cont.)
Review of current practice among Member States and competent authorities
19Good practice guide on quiet areas
Nam
e of
p
rin
cip
al
loca
tion
Sca
le (
a )Ty
pe
(b)
Ind
icat
ord
BS
elec
tion
met
hod
Ob
serv
atio
ns
Lond
on
(Uni
ted
Kin
gdom
)AG
AP
L Aeq
, 1
min
L Aeq
, 15
min
• U
nder
stan
ding
noi
se e
nviron
men
t•
Und
erst
andi
ng t
he v
iew
of vi
sito
rs•
Coo
rdin
atin
g ap
proa
ch t
o Q
uiet
Are
as
with
oth
er in
itiat
ives
Spe
cial
pro
ject
s w
hich
may
fee
d in
to q
uiet
are
as:
• ic
onic
sou
nds
of t
he c
ity•
city
sou
nd w
alk
• ar
ea b
ased
initi
ativ
es
Brist
ol
(Uni
ted
Kin
gdom
)AG
AP
L den
< 5
5•
Aco
ustic
• Re
crea
tiona
l val
ue•
Nat
ure
area
• Pu
blic
par
ticip
atio
n vi
a Citi
zens
cape
web
to
ol
Com
bine
d no
ise
map
for
Lde
n ro
ad a
nd r
ail u
tilis
ed in
an
onl
ine
map
vie
wer
, w
here
pub
lic c
an u
ploa
d th
eir
opin
ions
con
cern
ing
whi
ch s
pace
s ar
e qu
iet,
alo
ng w
ith
mar
ker
pin
to id
entif
y th
e ar
ea.
Web
cast
s an
d bl
ogs
wer
e al
so u
sed
to g
lean
pub
lic o
pini
on.
This
per
mits
a
com
bine
d as
sess
men
t of
CQ
As;
the
y ar
e th
en d
ivid
ed
into
thr
ee c
ateg
orie
s: p
ropo
sed,
pos
sibl
e an
d de
ferr
ed.
203
CQ
As
iden
tifie
d
Flor
ence
(I
taly
)AG
AP
L Aeq
,day
L Aeq
, ni
ght
Qua
lity
leve
l of fu
nctio
n is
lead
ing;
rel
evan
t cl
asse
s:•
clas
s I:
spe
cial
pro
tect
ed a
reas
suc
h as
ho
spita
ls,
scho
ols,
rec
reat
iona
l are
as;
spec
ial u
rban
istic
are
as:
45
Lda
y, 35
Lni
ght
• cl
ass
II:
low
den
sity
res
iden
tial:
50
Lda
y, 40
Lni
ght
Mea
sure
s fo
r qu
iet
area
s w
ill b
e in
tegr
ated
in h
otsp
ot
mea
sure
s of
act
ion
plan
Tusc
any
(Ita
ly)
RE
AP
L day
L Aeq
• Ex
tra-
urba
n•
Lday
< 5
0 dB
(A)
• N
70 <
12
• >
300
m fro
m r
oads
• >
150
m fro
m p
arki
ng a
nd r
ecre
atio
nal
area
• N
atur
al,
hist
oric
al o
r cu
ltura
l lan
duse
• U
rban
• L d
ay <
55
dB(A
)•
N70
< 1
2•
Min
imum
siz
e 0.
1ha
• >
50
% o
f ca
ndid
ate
quie
t ar
ea•
Prot
ecte
d, r
esid
entia
l or
sem
i-co
mm
erci
al
land
use
L day =
LAeq
for
tra
nspo
rt a
nd in
dust
rial
noi
se
N70
= n
umbe
r of
eve
nts
from
rai
lway
and
aircr
aft
nois
e w
ith L
Aeq
> 7
0 dB
(A)
during
day
(0
6.00
–20.
00 h
ours
)
Cze
ch R
epub
licM
S,
RI
PPL d
ay
L nig
ht
40 40
Land
use
pla
n: n
atur
al p
arks
and
pro
tect
ed
land
scap
es:
• lu
xury
: L d
ay &
Lni
ght <
40
• co
mfo
rtab
le:
L day <
50,
Lni
ght <
40
• go
od:
L day <
55,
Lni
ght <
45
• ac
cept
able
: L d
ay <
60,
Lni
ght <
50
• un
favo
urab
le:
L day >
60,
Lni
ght >
50
Qui
et a
reas
in a
gglo
mer
atio
ns m
ay in
clud
e lu
xury
and
co
mfo
rtab
le a
reas
Table 7.1 Overview of actions with a focus on quiet areas (cont.)
Review of current practice among Member States and competent authorities
20 Good practice guide on quiet areas
Nam
e of
p
rin
cip
al
loca
tion
Sca
le (
a )Ty
pe
(b)
Ind
icat
ord
BS
elec
tion
met
hod
Ob
serv
atio
ns
Den
mar
kM
SAP
• N
omin
atio
ns b
y lo
cal a
utho
ritie
s•
Recr
eatio
nal v
alue
• N
atur
e be
nefit
s•
Noi
se li
mits
not
app
lied
One
qui
et a
rea
decl
ared
at
Fred
erik
shåb
nea
r Bill
und.
It
is a
rur
al a
rea
of a
bout
16
km2
in s
ize,
and
is lo
cate
d w
ithin
4 k
m o
f an
inte
rnat
iona
l airpo
rt a
nd 3
km
fro
m
a m
ajor
roa
d. I
t is
pro
tect
ed b
y lo
cal p
lann
ing
law
Swed
enM
SPP
L Aeq
25D
eter
min
e ac
oust
ic la
ndsc
ape
Det
erm
ine
posi
tive
expe
rien
ced
soun
ds
Det
erm
ine
nega
tive
expe
rien
ced
soun
ds
Ass
ess
over
all a
cous
tic q
ualit
y on
a s
cale
• Cla
ss A
: fr
eedo
m o
f no
ise
< 2
5 dB
. 1–
2 ev
ents
< 5
min
utes
/wee
k•
Cla
ss B
: <
35
dB.
3–4
even
ts
< 5
min
utes
/day
• Cla
ss C
: <
5 d
B. 6
0–12
0 ev
ents
<
1 h
our/
day
• Cla
ss D
: <
45
dB.
120–
240
even
ts <
2
hour
s/da
y•
Cla
ss E
: <
50
dB,
L day o
r
10–2
0 dB
bel
ow s
urro
undi
ngs
Flan
ders
(B
elgi
um)
RE
PPLe
afle
t w
ith in
stru
ctio
ns t
o de
rive
qui
et a
reas
.
See
Den
der-
Mar
k ar
ea b
elow
for
con
tent
Den
der-
Mar
k ar
ea (
Bel
gium
)RE
AP
L 50,
15m
in
L nig
ht
45 30
• L 5
0 va
lue
of n
on-a
rea–
spec
ific
soun
ds•
L nig
ht v
alue
of no
n-ar
ea–s
peci
fic s
ound
s•
Vis
itors
' sco
re o
f qu
ietn
ess
• %
of tim
e th
at n
on-a
rea
soun
ds a
re
perc
eive
d•
Perc
eptio
n of
non
-are
a–sp
ecifi
c so
unds
• N
umbe
r of
non
-are
a–sp
ecifi
c ev
ents
per
15
min
utes
.•
Perc
eive
d ap
prop
riat
enes
s of
are
a so
unds
• G
eogr
aphi
c co
hesi
on•
Nat
ural
or
cultu
ral v
alue
of la
ndsc
ape
The
acou
stic
qua
lity
of a
n ar
ea m
ust
be g
uara
ntee
d 80
% o
f th
e ye
ar (
anyw
here
) an
d an
y da
y in
at
leas
t 80
% o
f th
e ar
ea
Irel
and
MS
PPL A
90,
1hr
30 d
ay
27 n
ight
• M
easu
rem
ent
and
obse
rvat
ion
• G
IS a
naly
sis
of la
nd u
se a
nd
anth
ropo
geni
c so
urce
s•
300
refe
renc
e si
tes
• 21
000
dig
ital r
ecor
ding
s•
170
000
mea
sure
men
ts
L A90
rec
omm
ende
d fo
r id
entif
ying
qui
et a
reas
in o
pen
coun
try
by m
easu
rem
ent,
but
Lde
n is
iden
tifie
d as
the
be
st in
dica
tor
for
aggl
omer
atio
ns
Table 7.1 Overview of actions with a focus on quiet areas (cont.)
Review of current practice among Member States and competent authorities
21Good practice guide on quiet areas
Not
e:
(a)
AG
= a
gglo
mer
atio
n, M
S =
Mem
ber
Sta
te,
RE
= R
egio
n, L
A =
Loc
al a
utho
rity
, RI
= R
esea
rch
inst
itute
.
(b)
AP
= A
ctio
n pl
an,
PP =
Pos
ition
pap
er.
Nam
e of
p
rin
cip
al
loca
tion
Sca
le (
a )Ty
pe
(b)
Ind
icat
ord
BS
elec
tion
met
hod
Ob
serv
atio
ns
Dub
lin
(Ire
land
)AG
AP
L den
L nig
ht
< 5
5
< 4
5
• M
odel
led
cons
olid
ated
noi
se le
vels
• 15
long
-ter
m m
easu
rem
ent
site
s to
ver
ify
mod
el•
Land
use
ana
lysi
s
Eigh
t ar
eas
of g
reen
spa
ce a
ppro
ved
as q
uiet
are
as
with
ful
l des
igna
tion
rece
ived
in J
uly
2013
Esto
nia
MS
AP
L den
< 4
5Th
ree
crite
ria
appl
ied:
• ar
ea w
ith le
ss t
han
45 d
B L
den
• at
leas
t 3
ha in
siz
e•
mus
t ha
ve r
ecre
atio
nal l
and
use
only
Onl
y ap
plie
d to
the
act
ion
plan
for
the
agg
lom
erat
ion
of T
allin
n
Gre
ece
RI
PP-
-D
ista
nce-
base
d cr
iteria,
usi
ng:
• tr
ansp
ort
• re
crea
tion
• ag
glom
erat
ions
• in
dust
ry a
nd c
onst
ruct
ion
site
s
Ass
essi
ng q
uiet
are
as b
ased
on
dist
ance
crite
ria
for
who
le c
ount
ry (
Arist
otle
Uni
vers
ity o
f Th
essa
loni
ki)
Table 7.1 Overview of actions with a focus on quiet areas (cont.)
Good practice guide on quiet areas22
Methods for identifying quiet areas
8 Methods for identifying quiet areas
Member States mainly use four complementary methods for identifying quiet areas: (1) noise mapping by modelling and calculations, (2) actual measurements of sound-pressure levels in situ, (3) evaluation of user/visitor experiences (i.e. the soundscape approach), and (4) expert assessments. The benefits and limitations of these methods are examined below.
8.1 Noise mapping
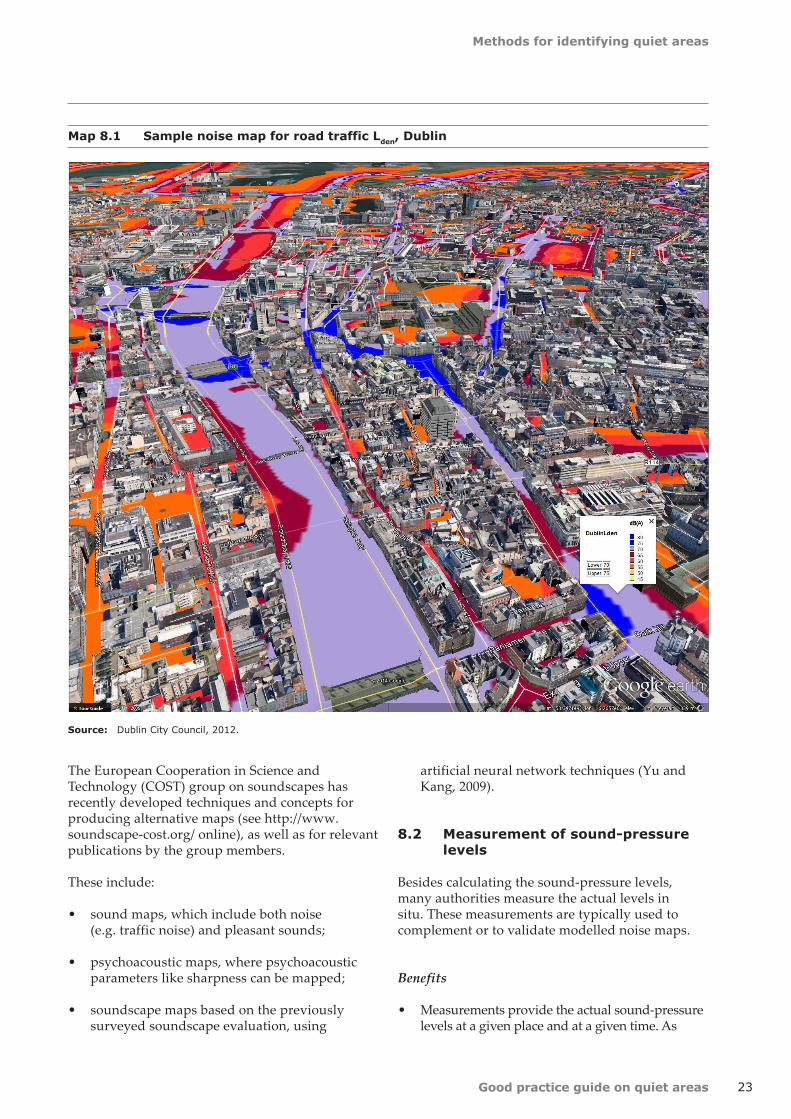
As stated in the introduction, the idea of preserving quiet areas originates in the development of noise maps. Such maps can be used to identify areas that are not exposed to calculated sound-pressure levels from environmental noise above a given magnitude. A common European method for assessing noise is under development (Kephalopoulos et al., 2012).
Benefits
• Noise maps provide an easily interpreted visual presentation of the distribution of calculated sound-pressure levels from given noise sources, such as traffic or industry, in a given region, and for a defined period.
• Calculations of sound-pressure levels are more cost-efficient than actual measurements, particularly if a large area is to be mapped. This is due to the necessity of having many measurement or receiver points and lengthy measurement periods in order to obtain representative long term average noise levels.
• Noise maps present calculated sound-pressure levels from environmental noise, separated from other sources. Note that the definitions of 'quiet area' in the END presuppose that this distinction is possible in practice.
• Noise maps are particularly useful when planning a new area. At the planning stage, actual measurements are not possible, because
noise sources like roads and vehicles do not yet exist in the area.
Limitations
• Noise maps are based on mathematical models of environmental noise emission and propagation outdoors, under given and restricted conditions. Deviations from the given criteria result in calculated sound-pressure levels that may not correspond to reality. Examples of factors that may influence the results are topography, weather, buildings or other physical barriers, as well as façade and surface material. With this in mind, modelled noise maps should be validated by actual measurements.
• Noise maps are typically based on one noise source at a time (road traffic, railway traffic, aircraft or industry). It is important to calculate the net effect of sound-pressure levels from multiple and simultaneous noise sources, to prevent the sound-pressure levels from being underestimated, e.g Article 3 (r) of the END regarding global assessment.
• Noise maps do not include pleasant or preferred sounds, like wind in trees, purling water or birdsong.
• Noise maps identify quiet areas based on calculated sound-pressure levels. One must keep in mind that an area which is undisturbed by environmental noise, for example a marshland, may not necessarily be valuable to human health when considering aspects other than environmental noise.
• Noise maps typically present calculated A-weighted sound-pressure levels. These values do not provide an accurate representation of how people perceive the acoustic environment, not even with regard to loudness (e.g. Nilsson, 2007a, 2007b). Sound provides a great deal more information to human beings than simply the magnitude of a pressure wave.
Methods for identifying quiet areas
23Good practice guide on quiet areas
Map 8.1 Sample noise map for road traffic Lden, Dublin
The European Cooperation in Science and Technology (COST) group on soundscapes has recently developed techniques and concepts for producing alternative maps (see http://www.soundscape-cost.org/ online), as well as for relevant publications by the group members.
These include:
• sound maps, which include both noise (e.g. traffic noise) and pleasant sounds;
• psychoacoustic maps, where psychoacoustic parameters like sharpness can be mapped;
• soundscape maps based on the previously surveyed soundscape evaluation, using
artificial neural network techniques (Yu and Kang, 2009).
8.2 Measurement of sound-pressure levels
Besides calculating the sound-pressure levels, many authorities measure the actual levels in situ. These measurements are typically used to complement or to validate modelled noise maps.
Benefits
• Measurements provide the actual sound-pressure levels at a given place and at a given time. As
Source: Dublin City Council, 2012.
Methods for identifying quiet areas
24 Good practice guide on quiet areas
such, they may well be a better reflection of reality than models and calculations. Moreover, under conditions prohibiting application of calculation models, e.g. a lack of reliable model input data, this is the only method by which to obtain accurate sound-pressure-level data. In many instances, the calculation models could not accurately predict the sound-pressure levels in courtyards enclosed by buildings. As noise mapping evolves, further limitations may be discovered.
Limitations
• Measuring sound-pressure levels is a potentially labour-intensive and costly process, particularly if a large area is being mapped, using many measurement points. In addition, applying standards, such as ISO 1996, require long term averages so that representative values are obtained, making the measurement procedure very time consuming.
• Presently, most of the measurements cannot distinguish sound-pressure levels from different sources, nor measure environmental noise separately. This is particularly important for quiet areas. The actual measurement is a mixture of sound-pressure levels from various sources, including the sounds of the place: sounds of people, wind in vegetation and flowing water — and environmental noise. This means that there is a risk of a mismatch between calculated and actual sound-pressure levels, and that measurements cannot be used to validate the calculated levels of environmental noise in a quiet area. It should be noted that the definitions of 'quiet areas' in the END presuppose that it is possible to distinguish environmental noise from other sources.
• Measurements are typically based on A-weighted sound-pressure levels. These values do not provide an accurate representation of how people perceive the acoustic environment, not even with regard to loudness (e.g. Nilsson, 2007a, 2007b). Sound provides a lot more information to human beings than magnitude.
COST members have also developed techniques and basic concepts for the automatic identification of sound types, using data of real-time measurements in situ, or recording. This could be linked to city sensor projects, with a grid of microphones across an area. Quiet areas can be better evaluated by identifying the types of sounds,
with measured sound levels (see http://www.soundscape-cost.org).
8.3 Evaluation of user/visitor experiences
The purpose of preserving quiet areas is to protect human health. This includes protecting people from noise annoyance and sleep disturbance, psychological factors that cannot be measured with physical measuring instruments. Thus, it is essential to understand how people perceive quiet areas. This insight, in combination with the limitations of calculated and measured sound-pressure levels, particularly with regard to quiet areas, has fuelled interest in soundscape studies. The launch of the European Soundscape Award, sponsored by the EEA, underlines the progress and importance of the soundscape approach in Europe.
Benefits
• Only an evaluation of user/visitor experiences can provide insight into how people perceive a quiet area. Such studies may include, but are not limited to, the perception of how dominant different sound sources are, the perceived acoustic quality or appreciation, tranquillity, annoyance, what sounds are appropriate to the place, and the recreational value and actual use of the area.
• In contrast to present sound-level meters, human beings can distinguish the intensity of sounds from different sources like technology, humans and nature. Such measurements have repeatedly been proved to be a stronger predictor of perceived acoustic quality in an area than A-weighted sound-pressure levels (e.g. Nilsson, 2007a and 2007b).
• Perceived acoustic quality is not limited to the acoustic environment per se, but is also influenced by the visual quality of an area. A lush and green environment may increase perceived acoustic quality and reduce annoyance, even though greenery has a limited influence on sound-pressure levels. Physical measuring instruments cannot capture such psychological effects.
Limitations
• Evaluation of user/visitor experiences is typically conducted by questionnaire surveys in situ. This
Methods for identifying quiet areas
25Good practice guide on quiet areas
is a weather-dependent method, in the sense that it is hard to conduct surveys when the weather is bad (rainy, windy or cold). Moreover, people are reluctant to visit quiet areas in bad weather conditions, and there is no point in conducting user/visitor surveys when there are no visitors.
• Like measurements of sound-pressure levels, evaluating user/visitor experiences is a time-consuming, labour-intensive and costly process. They need time for preparation and for development of appropriate questionnaires. Typically they require a relatively large number of staff, and time to collect the questionnaires. They also depend on visitors' willingness to participate in the survey. After data collection, the data must be processed, something demanding both time and skill.
• Evaluating user/visitor experiences calls for expertise in behavioural science in order to develop appropriate questionnaires. The quality of the data depends on the developers' skills and experience in the field, particularly of soundscape and environmental psychology.
• There are no standardised methods for evaluation of user/visitor experiences of quiet areas to date. Such standards, in the form of a standardised questionnaire, for instance, would make this method more accessible to non-experts.
ISO Working Group 54 is currently working on the minimum criteria for soundscape research and reporting. Working Group 2 of the COST Action has compared various survey methods, and has also identified a number of issues to be evaluated.
8.4 Expert assessments
As stated above, identification of quiet areas by sound-pressure levels is limited — an area which is undisturbed by environmental noise may not necessarily be valuable to human health, when considering aspects other than that of environmental noise. For this reason, it is important to include additional criteria to that of sound-pressure levels. Such criteria may include land use plans, cultural heritage, ecological values, social and recreational values, and accessibility. Assessment of such criteria typically requires expertise.
Benefits
• Expert assessments of a potential quiet area contribute with valuable insights on aspects of the area other than sound-pressure levels. Experts may include urban planners, landscape architects, sociologists, biologists, psychologists and antiquarians as well as acousticians.
• Involving experts who contribute with different points of views early in the process helps to achieve an appropriate outcome faster than exclusively applying a limited set of criteria like sound-pressure–level data from noise mapping.
Limitations
• Skilled experts are in short supply.
• Like sound-pressure–level data, expert assessments do not provide information on how users/visitors experience a quiet area.
Good practice guide on quiet areas26
Research questions
Research on quiet areas is notably difficult to carry out. Essentially, this is because searching for the effect of the absence of stimuli may be considered as a direct contradiction in itself.
This review of the state of the art concerning approaches to quiet areas in different EEA member countries highlights the need for in-depth research in this field. Specifically, further research will also call for the following:
1. Systematic and accumulated data on the relationship between quiet areas, and health and well-being, including annoyance, sleep disturbance, restoration and quality of life.
2. Data on perceived acoustic quality/appreciation of quiet areas, including data on dose–response relationships of perceived acoustic quality/appreciation and sound-pressure levels (levels in the quiet area, as well as in the surroundings).
3. Consideration of whether global noise assessments for multiple sources, rather than single source models, are more appropriate for identifying quiet areas in high density urban agglomerations.
4. Further development of indicators and measurements of human appreciation of quiet areas and perceived acoustic quality.
5. Knowledge of factors other than sound that may affect perceived acoustic quality/appreciation of quiet areas.
9 Research questions
6. Knowledge of the influence on health and well-being, including annoyance, sleep disturbance, restoration and quality of life, of the number and nature of events, including further exploration of the Swedish approach highlighted in Chapter 7.
7. Awareness of the differences in use of quiet areas in agglomerations and in rural areas, e.g. consideration of whether it is short or long term, degree of accessibility and who the different users are. In particular, are residential areas appropriate, if acoustic quality is high and beneficial to health?
8. Knowledge of the relationship between activities in quiet areas and the appropriateness of different kinds of sounds: what sounds enable and what sounds interfere with the activities? What activities and sounds are appropriate to a quiet area?
9. Practical methods to establish tranquillity as well as enhance the visual and social attractiveness of quiet areas.
10. Economic value (reduced social costs) related to quiet areas.
11. Benefits of quiet areas for biodiversity, including ecosystem services.
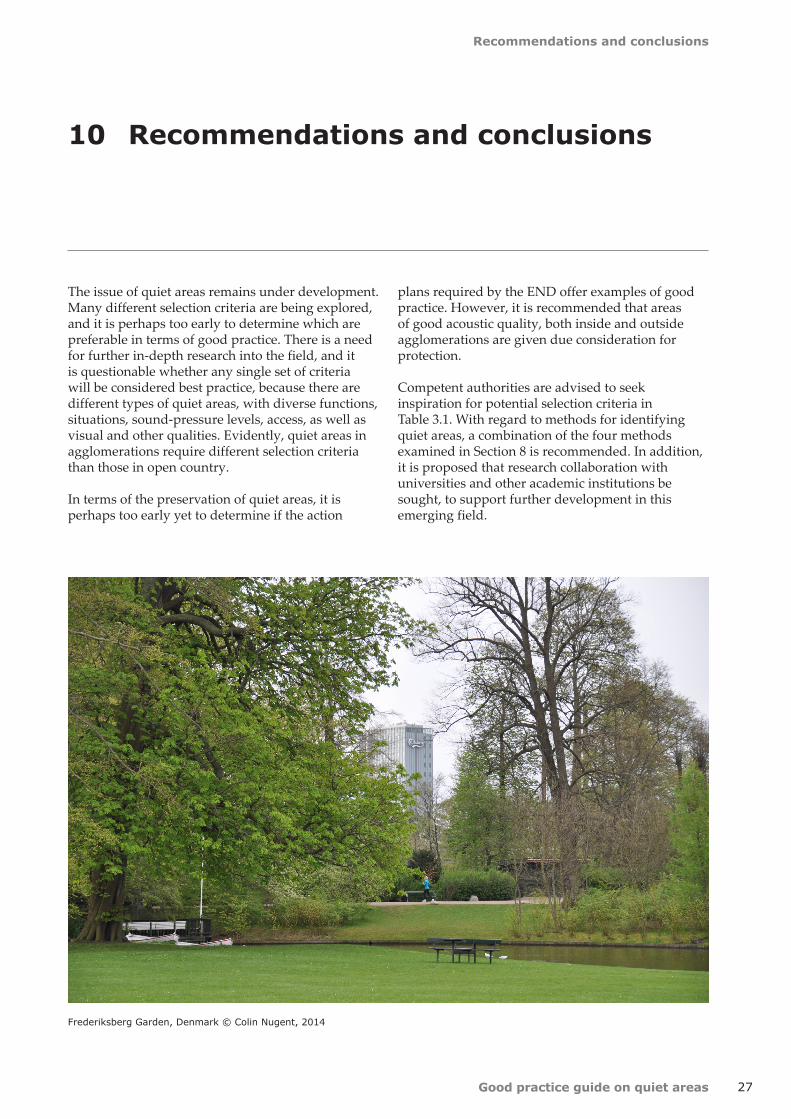
27
Recommendations and conclusions
Good practice guide on quiet areas
The issue of quiet areas remains under development. Many different selection criteria are being explored, and it is perhaps too early to determine which are preferable in terms of good practice. There is a need for further in-depth research into the field, and it is questionable whether any single set of criteria will be considered best practice, because there are different types of quiet areas, with diverse functions, situations, sound-pressure levels, access, as well as visual and other qualities. Evidently, quiet areas in agglomerations require different selection criteria than those in open country.
In terms of the preservation of quiet areas, it is perhaps too early yet to determine if the action
10 Recommendations and conclusions
plans required by the END offer examples of good practice. However, it is recommended that areas of good acoustic quality, both inside and outside agglomerations are given due consideration for protection.
Competent authorities are advised to seek inspiration for potential selection criteria in Table 3.1. With regard to methods for identifying quiet areas, a combination of the four methods examined in Section 8 is recommended. In addition, it is proposed that research collaboration with universities and other academic institutions be sought, to support further development in this emerging field.
Frederiksberg Garden, Denmark © Colin Nugent, 2014
Good practice guide on quiet areas28
Glossary
Glossary
dB Decibel
dB(A) Decibel (A-weighted to account for human hearing parameters)
DG Env Directorate General — Environment, European Commission
EC European Commission
EEA European Environment Agency
END Environmental Noise Directive
ENDRM Electronic Noise Data Reporting Mechanism
EP European Parliament
EPoN Expert Panel on Noise
ETC SIA European Topic Centre on Spatial Information and Analysis
EU European Union
JRC Joint Research Centre, European Commission
LA A-weighted sound level indicator (often denoted as level exceeded for a % of the measurement time, e.g. LA90)
LAeq Equivalent continuous A-weighted sound level (reference time may also be shown, e.g. LAeq, 24hr)
Lday Level for day period
Lde Level for day and evening period
Lden Noise indicator for day, evening and night as defined by END
Levening Level for evening period
Lnight Noise indicator for night time as defined by END
MS Member State
QA Quiet Area
QSI Quietness Suitability Index
SPL Sound-pressure level
WHO World Health Organization
29
References
Good practice guide on quiet areas
Alvarsson, J.J., Wiens, S. and Nilsson, M.E., 2010, 'Stress recovery during exposure to nature sound and environmental noise', International Journal of Environmental Research and Public Health, (7) 1 036–1 046.
Axelsson, Ö., 2012, 'The ISO 12913 series on soundscape: An update', Acoustics 2012 Hong Kong, The Hong Kong Institute of Acoustics, Paper 805, Hong Kong.
Axelsson, Ö. (Ed.), 2011, Designing Soundscape for Sustainable Urban Development, Stockholm.
Barber, Jesse R., Crooks Kevin R. and Fristrup, Kurt M., 'The cost of chronic noise exposure for terrestrial organisms', Trends in ecology and evolution, 25(3):180–189, 2009. http://www.cfc.umt.edu/CESU/Reports/NPS/CSU/2008/08_10Crooks_NSP_wildlife%20acoustics_09rpt.pdf.
Bristow, A.L., 2010, Valuing Noise Nuisance , Inter-Noise 2010, Noise and Sustainability, Plenary Lecture, Lisbon.
Brown, A.L. and Muhar, A., 2004, 'An approach to the acoustic design of outdoor space', Journal of Environmental Planning and Management, 47(6) 827–842.
Brown, A.L., 2006, 'Thinking about "Quiet Areas": Sounds we want and sounds we do not want'. In Quiet Areas and Health, Publication 2006/12, Health Council of the Netherlands, The Hague.
Defra, 2008, An Economic Valuation of Noise Pollution — developing a tool for policy appraisal, first report of the Interdepartmental Group on Costs and Benefits, Noise Subject Group, http://archive.defra.gov.uk/environment/quality/noise/igcb/documents/igcb-first-report.pdf.
Defra, 2011, The Economic Value of Quiet Areas, Final report prepared by URS/Scott Wilson.
Dutilleux, Guillaume , Anthropogenic outdoor sound and wildlife: it’s not just bioacoustics! In
References
SFA/IOA, editor, Proceedings Acoustics 2012, pages 2301–2306, Nantes, France, 4 2012. SFA/IOA. http://hal.archives-ouvertes.fr/docs/00/81/07/95/PDF/hal-00810795.pdf.
EC, 1996, Future Noise Policy, European Commission Green Paper (COM(1996) 540 final of 4 November 1996).
EC, 2002, Directive 2002/49/EC of the European Parliament and of the Council of 25 June 2002 relating to the assessment and management of environmental noise (OJL, 18.7.2012, p. 12).
EC, 2011, Report from the Commission to the European Parliament and the Council 'on the Implementation of the Environmental Noise Directive in accordance with Article 11 of Directive 2002/49/EC' (COM(2011) 321 final of 1 June 2011).
EEA, 2010, Good practice guide on noise exposure and potential health effects, http://www.eea.europa.eu/publications/good-practice-guide-on-noise.
EEA, 2012, Electronic Noise Data Reporting Mechanism — A handbook for delivery of data in accordance with Directive 2002/49/EC, http://www.eea.europa.eu/publications/noise-handbook.
Gidlöf-Gunnarsson, A. and Öhrström, E., 2007, 'Noise and well-being in urban residential environments: The potential role of perceived availability to nearby green areas', Landscape and Urban Planning, (83) 115–126.
Kaplan, S., 1995, 'The restorative benefits of nature: Toward an integrative framework. Journal of Environmental Psychology', (15) 169–182.
Kephalopoulos, S., Paviotti, M., and Anfosso-Lédée, F., 2012, Common Noise Assessment Methods in Europe (CNOSSOS-EU), Publications Office of the European Union, Luxembourg.
Milieu, 2010, Final Report on Task 1, Review of the Implementation of Directive 2002/49/EC on Environmental Noise, Milieu Ltd, Brussels.
References
30 Good practice guide on quiet areas
Nilsson, M.E., 2007a, 'A-weighted sound pressure level as an indicator of short-term loudness or annoyance of road-traffic sound', Journal of Sound and Vibration, (302) 197–207.
Nilsson, M.E., 2007b, 'Soundscape quality in urban open spaces', Inter-Noise 2007, Noise Control Engineering, Paper IN07-115, Istanbul.
NSCA , 2007, Noise Policy Briefing — Quiet Areas http://www.environmental-protection.org.uk/assets/library/documents/Quiet_Areas_Briefing.pdf.
Öhrström, E., Skånberg, A., Svensson, H. and Gidlöf-Gunnarsson, A., 2006, 'Effects of road traffic noise ant the benefit of access to quietness', Journal of Sound and Vibration, (295) 40–59.
RIVM, 2007, Benefits of Noise Measures, (Jabben, J. Potma, C. Lutter, S.).
SNM, 2003, Indicatoren van stilte in De Wieden/De Weerribben, NP Utrechtse Heuvelrug en de Zak van Zuid-Beveland, CP. Lanting G.P. van den Berg, Uitgavenummer: NWU-114 Aantal blz: 74 + 8, Stichting Natuur en Milieu, the Netherlands.
Stansfeld, S.A., Berglund, B., Clark, C., Lopez-Barrio, I., Fischer, P., Öhrström, E., Haines, M.M.,
Head, J., Hygge, S., van Kamp, I. and Berry, B.F., 2005, 'Aircraft and road traffic noise and children's cognition and health: a cross-national study', Lancet, (365) 1 942–1 949.
Ulrich, R.S., 1984, 'View through a window may influence recovery from surgery', Science, (224) 420–421.
van den Berg, M., 2008, 'Quiet places in Amsterdam', proceedings of Internoise 2008.
WHO, 2000, Guidelines for Community Noise, World Health Organization, Geneva.
WHO, 2011, Burden of Disease from Environmental Noise: Quantification of Healthy Life Years Lost in Europe, World Health Organization, Regional Office for Europe, Copenhagen.
Yang, W. & Kang, J., 2005, 'Acoustic comfort evaluation in urban open public spaces', Appl. Acoust., 66, 211–229.
Yu, L. and Kang, J., 2009, 'Modelling subjective evaluation of soundscape quality in urban open spaces: An artificial neural network approach', Journal of the Acoustical Society of America, 126(3), 1 163–1 174.
31
Annex 1
Good practice guide on quiet areas
Annex 1 Current research into quiet areas
QSIDE (http://www.qside.eu)
Current methods for assessing urban traffic noise and its effects on people are focused on the most exposed façades, and are less suitable for quiet façades and quiet urban areas. The QSIDE project (LIFE09 ENV/NL/000423) will provide a calculation model suitable for quiet façades and quiet urban areas.
The QSIDE model consists of two submodels:
• an acoustic model for calculating noise levels at quiet façades and in quiet urban areas;
• a human-response model for calculating the beneficial effects of quiet façades and areas.
The QSIDE project will make it possible to quantify the positive effects of quiet façades and quiet urban areas. To facilitate and promote their implementation, it will produce a practical document with guidelines for EU cities, based on both QSIDE results and practical experiences in Amsterdam, Gothenburg, and other European cities.
CityHush (http://www.cityhush.org)
'Acoustically green road vehicles and cityareas' (CityHush) is a three-year research project co-funded by the European Commission under the Seventh Framework Programme (FP7). The CityHush project will support city administrations in the production and implementation of noise action plans according to Directive EC 2002/49.
Q-zones are a major concept in the CityHush project. A Q-zone is an area where a low level of traffic noise is maintained by allowing only low-noise vehicles to enter. Work Package 1 aims to identify the boundary conditions required to obtain Q-zones, and to do so in a real setting. Identification of the boundary conditions requires simulations of traffic management with respect to the introduction of new vehicle technology (like electrically propelled
vehicles) and policies to encourage the usage of this technology (like noise charges).
As traffic and other conditions may differ between European cities, five test sites reflecting different traffic conditions in Europe will be subject to simulations.
HUSH (http://www.hush-project.eu/en/index.html)
'Harmonization of urban noise reduction strategies for homogeneous action plans' (HUSH) is co-funded by the European Commission, under the LIFE+ 2008 programme (LIFE08 ENV/IT/000386).
Project goals include identifying strategies for interventions in Florence, including quiet areas, to realise case studies in the urban environment (EUR 400 000 is available for two pilot interventions to be realised in the second year of the project). Particular attention will be paid to the perception and definition of noise disturbance by citizens, especially in more sensitive contexts such as schools and hospitals. The specific strategic intervention for noise reduction in the city will be designed, and then will be subject both to acoustic testing effectiveness and to checks on citizen satisfaction.
Hosannah (http://www.greener-cities.eu)
'Holistic and sustainable abatement of noise by optimized combinations of natural and artificial means' (Hosanna) is a collaborative three-year project under Theme 7 of FP7, Sustainable Surface Transport. Initiated in November 2009, it will produce a toolbox for the reduction of road and rail traffic noise in the outdoor environment.
The project focuses on noise abatement along the propagation path, dealing with greening of buildings and use of vegetation on other urban and rural surfaces, innovative barriers including recycled materials, and treatments of the ground and the road surface. The research will permit a better
Annex 1
32 Good practice guide on quiet areas
description of quite façades of buildings through the development of specific algorithms and the analysis of perception.
Listen (http://tii.se/projects/Listen)
'Auralization of urban soundscapes' (Listen) is financed by the Visualisation programme run by the Knowledge Foundation, the Foundation for Strategic Research, Vinnova, Vårdalstiftelsen and the Invest in Sweden Agency.
The goal of the project is to build a demonstrator of a software system for simulation and auralisation of the sound environment of a restricted urban area. The purpose of the demonstrator is to show that it is possible to listen to an urban soundscape, even from the planning stage. The main objective for Listen is to develop a user-motivated 3D-software demonstrator of urban soundscapes, by which architectural and noise-control solutions for improving urban soundscapes can be auralised at the planning stage. Various solutions for soundscape improvement may thus be evaluated by simply listening to their effect on the perceived soundscape.
The demonstrator will illustrate the potential and feasibility of soundscape auralisation, by
demonstrating the application for three scenarios in a typical urban environment:
1. outdoor soundscapes at traffic noise exposed side of apartment building;
2. indoor soundscapes in apartment room exposed to traffic noise;
3. outdoor soundscapes at the shielded side ('quiet side') of apartment building.
All scenarios will include the perceptual effects of noise barriers of various materials and geometries.
Quadmap (http://www.quadmap.eu)
'Quiet areas definition and management in action plans' (Quadmap) is a LIFE+ project focused on quiet urban areas. The project aims to deliver a method and guidelines for the identification, delineation, characterisation, improvement and management of quiet areas in urban areas, as described in the END.
The project will also explore the definition of a quiet urban area, and its meaning and added value for the city and its citizens in terms of health, social safety and lowering stress levels.
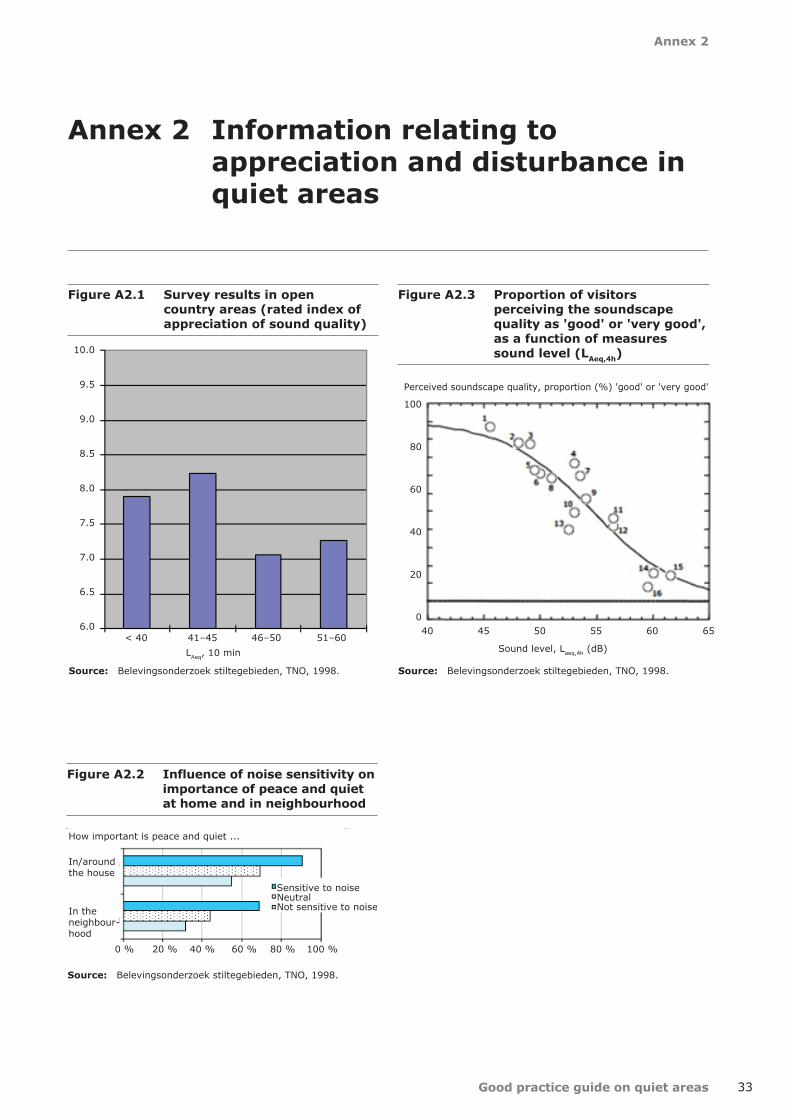
33
Annex 2
Good practice guide on quiet areas
Annex 2 Information relating to appreciation and disturbance in quiet areas
Figure A2.1 Survey results in open country areas (rated index of appreciation of sound quality)
Source: Belevingsonderzoek stiltegebieden, TNO, 1998. Source: Belevingsonderzoek stiltegebieden, TNO, 1998.
Source: Belevingsonderzoek stiltegebieden, TNO, 1998.
Figure A2.2 Influence of noise sensitivity on importance of peace and quiet at home and in neighbourhood
Figure A2.3 Proportion of visitors perceiving the soundscape quality as 'good' or 'very good', as a function of measures sound level (LAeq,4h)
10.0
9.5
9.0
8.5
8.0
7.5
7.0
6.5
6.0< 40 41–45 46–50 51–60
LAeq, 10 min
In/aroundthe house
In the neighbour-hood
How important is peace and quiet ...
0 % 20 % 40 % 60 % 80 % 100 %
Sensitive to noiseNeutralNot sensitive to noise
100
80
60
40
20
040 45 50 55 60 65
Sound level, Laeq,4h (dB)
Perceived soundscape quality, proportion (%) 'good' or 'very good'
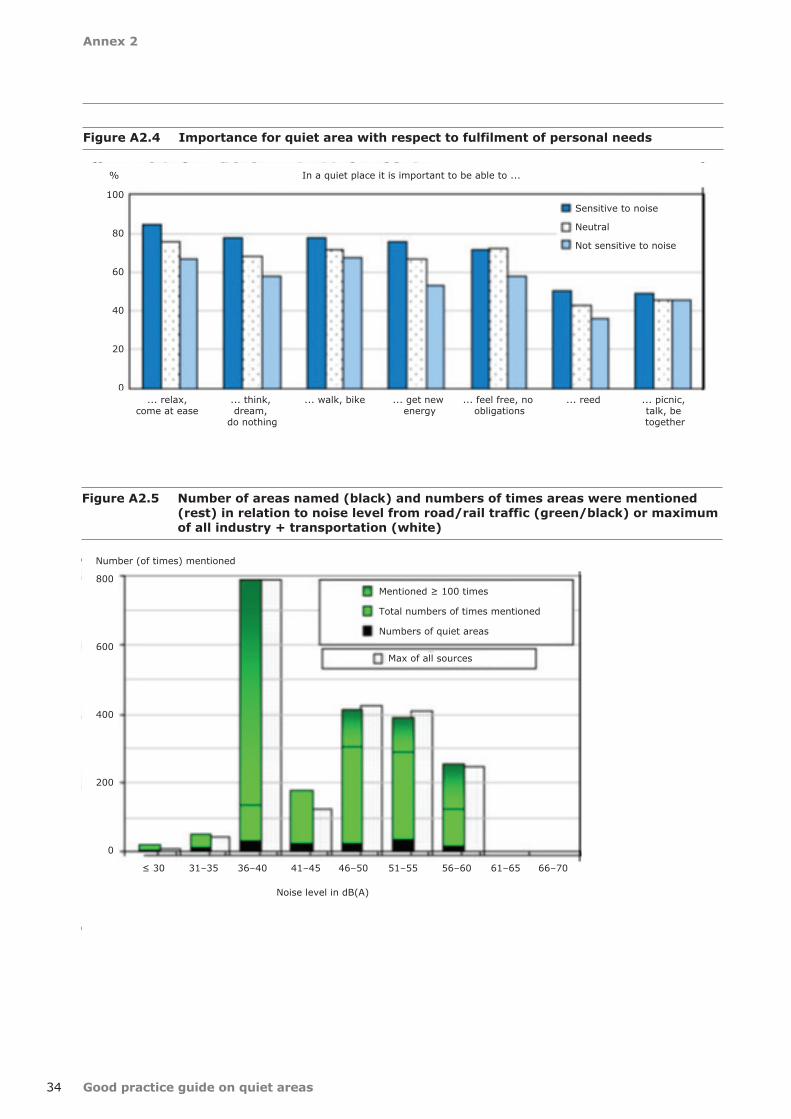
Annex 2
34 Good practice guide on quiet areas
Figure A2.4 Importance for quiet area with respect to fulfilment of personal needs
Figure A2.5 Number of areas named (black) and numbers of times areas were mentioned (rest) in relation to noise level from road/rail traffic (green/black) or maximum of all industry + transportation (white)
In a quiet place it is important to be able to ...%
100
80
60
40
20
0
Sensitive to noise
Neutral
Not sensitive to noise
... relax,come at ease
... think, dream,
do nothing
... walk, bike ... get new energy
... feel free, no obligations
... reed ... picnic, talk, be together
Number (of times) mentioned
Noise level in dB(A)
Mentioned ≥ 100 times
Total numbers of times mentioned
Numbers of quiet areas
Max of all sources
≤ 30 31–35 36–40 41–45 46–50 51–55 56–60 61–65 66–70
800
600
400
200
0
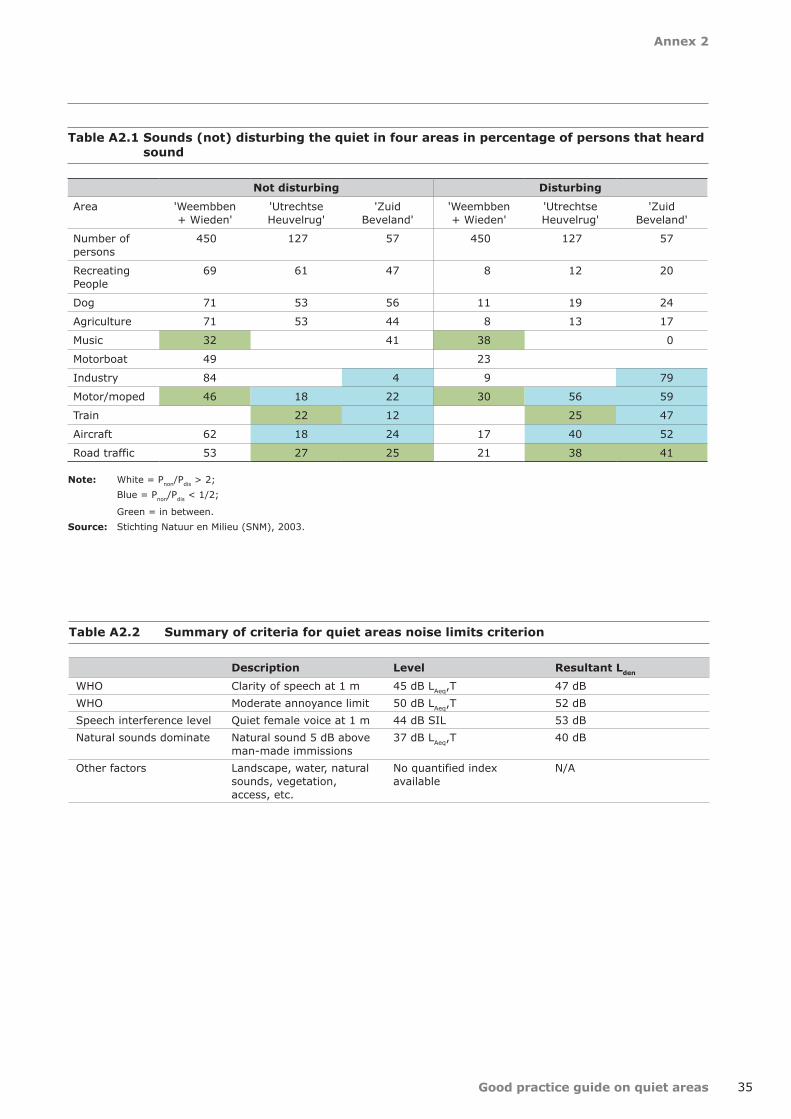
Annex 2
35Good practice guide on quiet areas
Not disturbing Disturbing
Area 'Weembben + Wieden'
'Utrechtse Heuvelrug'
'Zuid Beveland'
'Weembben + Wieden'
'Utrechtse Heuvelrug'
'Zuid Beveland'
Number of persons
450 127 57 450 127 57
Recreating People
69 61 47 8 12 20
Dog 71 53 56 11 19 24
Agriculture 71 53 44 8 13 17
Music 32 41 38 0
Motorboat 49 23
Industry 84 4 9 79
Motor/moped 46 18 22 30 56 59
Train 22 12 25 47
Aircraft 62 18 24 17 40 52
Road traffic 53 27 25 21 38 41
Note: White = Pnon/Pdis > 2; Blue = Pnon/Pdis < 1/2;
Green = in between.Source: Stichting Natuur en Milieu (SNM), 2003.
Table A2.1 Sounds (not) disturbing the quiet in four areas in percentage of persons that heard sound
Table A2.2 Summary of criteria for quiet areas noise limits criterion
Description Level Resultant Lden
WHO Clarity of speech at 1 m 45 dB LAeq,T 47 dBWHO Moderate annoyance limit 50 dB LAeq,T 52 dBSpeech interference level Quiet female voice at 1 m 44 dB SIL 53 dBNatural sounds dominate Natural sound 5 dB above
man-made immissions37 dB LAeq,T 40 dB
Other factors Landscape, water, natural sounds, vegetation, access, etc.
No quantified index available
N/A
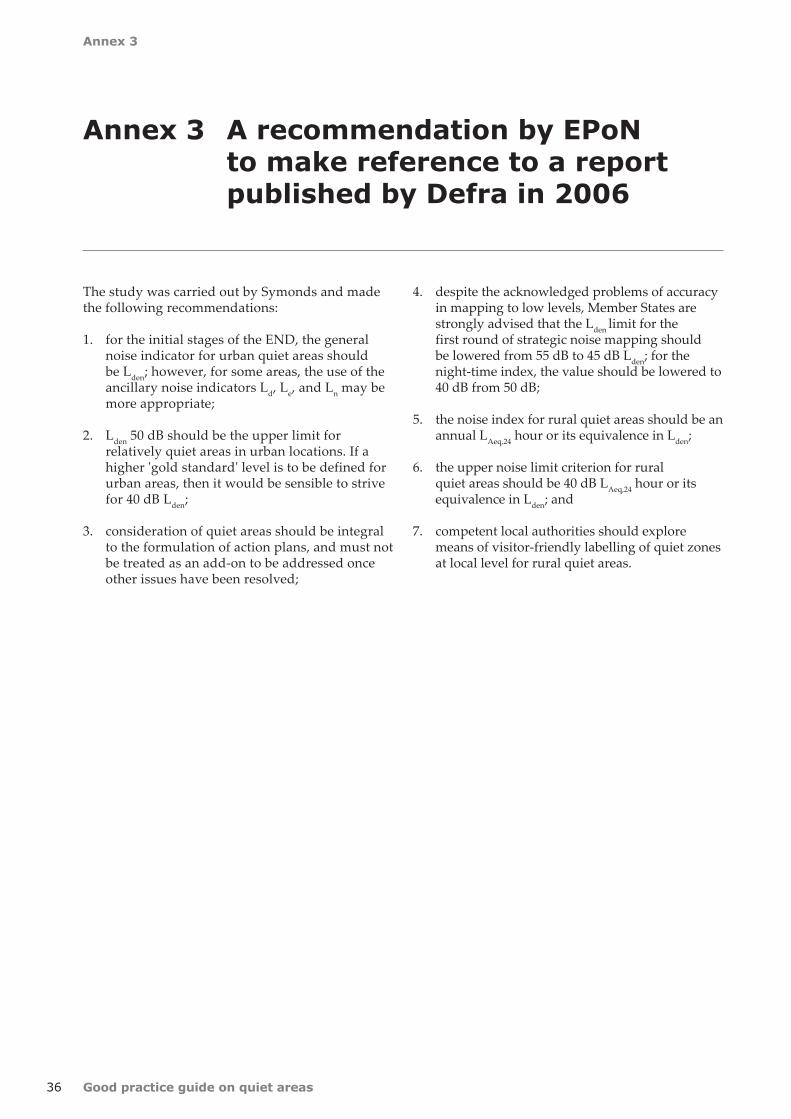
Good practice guide on quiet areas36
Annex 3
The study was carried out by Symonds and made the following recommendations:
1. for the initial stages of the END, the general noise indicator for urban quiet areas should be Lden; however, for some areas, the use of the ancillary noise indicators Ld, Le, and Ln may be more appropriate;
2. Lden 50 dB should be the upper limit for relatively quiet areas in urban locations. If a higher 'gold standard' level is to be defined for urban areas, then it would be sensible to strive for 40 dB Lden;
3. consideration of quiet areas should be integral to the formulation of action plans, and must not be treated as an add-on to be addressed once other issues have been resolved;
Annex 3 A recommendation by EPoN to make reference to a report published by Defra in 2006
4. despite the acknowledged problems of accuracy in mapping to low levels, Member States are strongly advised that the Lden limit for the first round of strategic noise mapping should be lowered from 55 dB to 45 dB Lden; for the night-time index, the value should be lowered to 40 dB from 50 dB;
5. the noise index for rural quiet areas should be an annual LAeq,24 hour or its equivalence in Lden;
6. the upper noise limit criterion for rural quiet areas should be 40 dB LAeq,24 hour or its equivalence in Lden; and
7. competent local authorities should explore means of visitor-friendly labelling of quiet zones at local level for rural quiet areas.
37
Annex 4
Good practice guide on quiet areas
• Position Paper Good Practice Guide for Strategic Noise Mapping and the Production of Associated Data on Noise Exposure Version 2. 13 January 2006.
• Definition, Identification and Preservation of Urban & Rural Quiet Areas- Symonds July 2003, http://circa.europa.eu/Public/irc/env/noisedir/library?l=/quietsareas/finalsreports3s10s2003pd/_EN_1.0_&a=d.
• Research into Quiet Areas: Recommendations for identification P A Morgan, P G Abbott, G R Watts, C A Burke and C Harmer, 2006, http://randd.defra.gov.uk/Document.aspx?Document=NO01109_4629_FRP.doc.
• Report from the Commission to the European Parliament and the Council on the implementation of the Environmental Noise Directive in accordance with Article 11 of Directive 2002/49/EC, http://eur-lex.europa.eu/LexUriServ/LexUriServ.do?uri=COM:2011:0321:FIN:EN:PDF.
• Final Report on Task 3 Impact Assessment and Proposal of Action Plan- Milieu May 2010, http://www.milieu.be/final_reports/end_task_3_final_report.pdf.
• Acoustic quality in natural and cultural environments- Proposal for metrics, indicators and auditing methods 18 December 2002. Swedish Working group of authorities concerned with noise.
• Research into the Practical and Policy Applications of Soundscape Concepts and Techniques in Urban Areas (NANR 200) October 2009. University of Salford. http://randd.defra.gov.uk/Document.aspx?Document=NO0217_8424_FRP.pdf.
• Developing an Intrusion Map of England - Prepared for CPRE by Land Use Consultants August 2007, http://www.cpre.org.uk/resources/countryside/tranquil-places/item/download/303.
Annex 4 Bibliography
• NSCA (now EPUK) Noise Policy Briefing — Quiet Areas, July 2007, http://www.environmental-protection.org.uk/assets/library/documents/Quiet_Areas_Briefing.pdf.
• Environmental RTDI Programme 2000–2006 ENVIRONMENTAL QUALITY OBJECTIVES
• Noise in Quiet Areas (2000-MS-14-M1) Synthesis Report Prepared for the Environmental Protection Agency by SWS Environmental Services, SWS Group, http://www.epa.ie/downloads/pubs/research/land/epa_noise_in_quiet_areas_ertdi17_synthesis.pdf.
• SINTEF A6631 - Unrestricted Report: Background noise levels in Europe Truls Gjestland SINTEF ICT, http://www.easa.eu.int/rulemaking/docs/research/Background_noise_report.pdf.
• Soundscape, Quiet Areas & Health – a national and local challenge Brighton Soundscape Workshop, Colin Grimwood April 2011, http://www.soundscape-cost.org/documents/Brighton_2011/COST_Brighton_Quiet_areas_policies_Grimwood.pdf.
• Designing Soundscape for Sustainable Urban Development. Östen Axelsson Conference Editor. September 30 – October 1, 2010 Stockholm, Sweden, http://www.soundscape-conference.eu.
• Is Quiet the New Loud? Developing a Framework for Valuing Quiet Areas Liz Clarke IAIA, Puebla, 1 June 2011, http://www.iaia.org/conferences/iaia11/proceedings/presentations/The%20Value%20of%20Quiet%20(IAIA_v1).pdf.
• Implementation of environmental noise action plans in Wales Procedure for the designation of quiet areas in agglomerations. Welsh Government 2011, http://wales.gov.uk/docs/desh/publications/110523noisequietareasen.pdf.
• The Natural Choice: securing the value of nature HM Government June 2011, http://www.
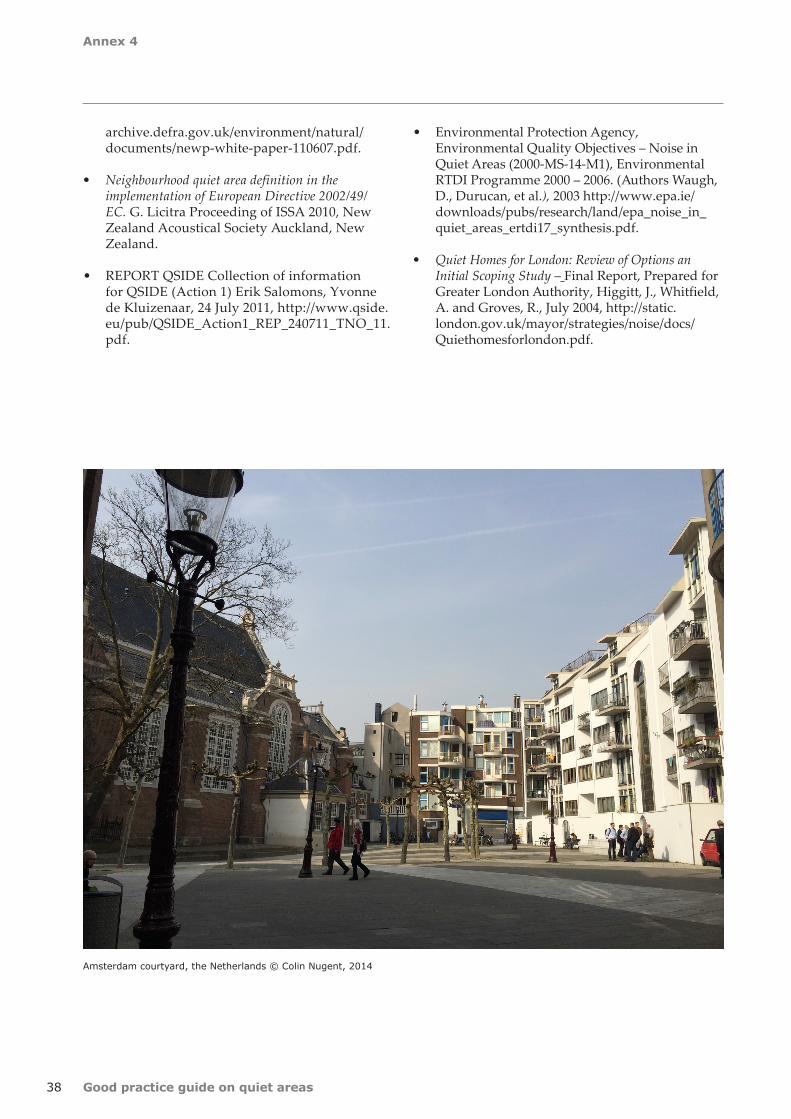
Annex 4
38 Good practice guide on quiet areas
archive.defra.gov.uk/environment/natural/documents/newp-white-paper-110607.pdf.
• Neighbourhood quiet area definition in the implementation of European Directive 2002/49/EC. G. Licitra Proceeding of ISSA 2010, New Zealand Acoustical Society Auckland, New Zealand.
• REPORT QSIDE Collection of information for QSIDE (Action 1) Erik Salomons, Yvonne de Kluizenaar, 24 July 2011, http://www.qside.eu/pub/QSIDE_Action1_REP_240711_TNO_11.pdf.
• Environmental Protection Agency, Environmental Quality Objectives – Noise in Quiet Areas (2000-MS-14-M1), Environmental RTDI Programme 2000 – 2006. (Authors Waugh, D., Durucan, et al.), 2003 http://www.epa.ie/downloads/pubs/research/land/epa_noise_in_quiet_areas_ertdi17_synthesis.pdf.
• Quiet Homes for London: Review of Options an Initial Scoping Study – Final Report, Prepared for Greater London Authority, Higgitt, J., Whitfield, A. and Groves, R., July 2004, http://static.london.gov.uk/mayor/strategies/noise/docs/Quiethomesforlondon.pdf.
Amsterdam courtyard, the Netherlands © Colin Nugent, 2014
39
Annex 5
Good practice guide on quiet areas
2.48 Quiet areas in an agglomeration
Formal END definitions
Article 3(l)
A 'quiet area in an agglomeration' shall mean an area, delimited by the competent authority, for instance, which is not exposed to a value of Lden or of another appropriate noise indicator greater than a certain value set by the Member State, from any noise source.
Discussion
In agglomerations, it is suggested that 'quiet' could be described by a value of Lden (or by another appropriate noise indicator), which must be defined by the Member State. This would be more or less a quantitative acoustical definition.
It is generally accepted that in agglomerations, quiet areas can only be relatively quiet because of the presence of major noise sources and noise that are caused by normal human activity in such densely populated areas. Once these 'relatively quiet' areas have been identified, the END requires that, in agglomerations with populations of more than 250 000, action plans to protect these areas be drawn up (this was to be completed by no later than 18 July 2008).
It is also generally accepted that noise mapping can be used to identify these areas. However, the END gives no advice on how to do this, other than that offered in Article 3(l), which merely identifies Lden as a possible indicator, without suggesting limits. There appears to be no strong evidence for the use of a different indicator to Lden and no evidence concerning appropriate levels for relatively quiet areas in any indicator.
Annex 5 Extract from Good Practice Guide for Strategic Noise Mapping and the Production of Associated Data on Noise Exposure (2)
In addition, in agglomerations, the Lden in relatively quiet areas will often be dominated by the weighted night-time noise and may thus be a misleading indicator. Consequently, the Lden may not be an appropriate indicator for setting targets for protecting or enhancing the quietness of such areas through action plans. For action plans, it may be appropriate to set standards in terms of Ld (3) and Le (4). In some areas, the use of a short-term indicator to deal with transient noises may also be appropriate in the development of effective action plans. For further information, see the EC-sponsored study that was carried out on the definition, identification and preservation of urban and rural quiet areas (Ref. 16).
WG-AEN recommendations
Whilst it recognises that a quiet area in an agglomeration could be delimited by an indicator such as Lden, the EU Working Group on the Assessment of Environmental Noise (WG-AEN) recommends that other criteria be used when needed. In addition, the use of absolute levels, in any indicator, may not be appropriate for the delimiting of such areas. A relative approach may be more suitable, such as that recommended in the END (Annex VI (1.5)) for the identification of quiet façades.
Although it is true that a quiet area in an agglomeration could be a private garden or a large private estate, for example, it is recommended that special emphasis be placed on recreational areas normally accessible to the general public, areas which can provide respite from the high noise levels often experienced in busy urban environments.
It is strongly recommended that the protection of quiet areas be made an integral part of the
(2) Version 2, 13 January 2006 (former EEA Working Group on the Assessment of Exposure to Noise, WG-AEN).(3) Daytime noise level.(4) Evening noise level.
Annex 5
40 Good practice guide on quiet areas
development of action plans for agglomerations, rather than be treated merely as an 'add-on' to be addressed once other issues have been resolved.
2.49 Quiet areas in open country
Formal END definitions
Article 3(m)
A 'quiet area in open country' shall mean an area, delimited by the competent authority, that is undisturbed by noise from traffic, industry or recreational activities.
Discussion
When a competent authority opts to delimit a quiet area in the open country, 'quiet' is considered to be 'undisturbed by noise from traffic, industry or recreational activities'. This is more or less a qualitative acoustical definition and consequently, the WG-AEN does not propose the use of formal criteria at present.
It should also be noted that the END does not require the acquisition of data on recreational
noise, which can be quite significant in the open country.
Furthermore, in the open country, there is no requirement to acquire data on industrial noise and on non-major roads, railways and airports. The EC is required by the END to submit to the European Parliament and the Council a report on the implementation of the END, which may include proposals regarding the protection of quiet areas in the open country. This was to be completed by no later than 18 July 2009.
WG-AEN recommendations
In the interim period prior to the EC reports on END implementation in 2009, the WG-AEN recommends that Member States use the EC-sponsored study on the definition, identification and preservation of urban and rural quiet areas (Ref. 16) as their starting point for defining quiet areas in rural environments.
Further research into quiet areas (in both urban and rural contexts) needs to be undertaken at European level. The WG-AEN has made relevant recommendations.
41
Annex 6
Good practice guide on quiet areas
Annex 6 Proposed methodology to represent quiet areas suitability outside urban areas
In order to help the EEA assess potential quiet areas in Europe, the European Topic Centre for Spatial Information and Analysis (ETC/SIA) utilised data reported in accordance with the END as well as data related to other criteria that inform this process.
The resulting methodology was tabled during a dedicated break-out session at the Eionet meeting of the National Reference Centres for Noise on 26 and 27 September 2013. The methodology is summarised below.
Objectives
Determine a quietness suitability index (QSI) outside urban areas at national level, to be derived at European level in the upcoming stage. Such index is based on the Member States' mapping results being delivered to the EC and EEA according to Environmental Noise Directive (END) specifications. Databases covering the whole European territory should then be used to derive the European map and figures, as END only covers the European territory partially.
In Annex VI of the END, the 55 and 65 dB noise contours are requested to be provided to the EC for major roads, major railways and major airports. In the case of agglomerations, this information could also be provided but on voluntary basis.
Given the fact that one of the main objectives of the END is 'to preserve environmental noise quality where it is good', it makes sense to develop this quietness' suitability analysis inside agglomerations and outside agglomerations.
Nevertheless, the presented index will be based on 'quiet areas in open country' defined in the END as 'an area, delimited by the competent authority, that is undisturbed by noise from traffic, industry or recreational activities', due to the fact that several exercises for delimitation and protection of quiet areas inside agglomerations have been already developed at country level.
Assumptions
The use of information delivered by EEA member countries under the END specifications, as well as national database would provide results with higher resolution.
The methodology proposed could, in an upcoming stage, be generalised to other countries not providing the requested END data sources to have a complete European picture.
All the areas being included in the noise contour maps above 55 dB Lden has been considered 'noisy' areas for the analysis undertaken. Below this noise level, a decreasing gradient on decibels is being assumed: more distance to noise sources implies more quietness.
Data sources
• END: Major roads, major railways and major airports noise contour maps;
• END: Location of major roads and major railways and major airports;
• Urban Morphological Zones;
• E-PRTR register: industries location and attributes
• Corine Land Cover and Land Use data 2006 (CLC) (100 x 100 meters grid);
• GEOSTAT: Urban-Rural typology (1 000 x 1 000 meters grid);
• GISCO: roads, rails and airports infrastructure;
• Natura 2000 sites (2009) to undertake a further analysis on protected areas.
All raster analyses are performed using a pixel size of 100 x 100 metres.
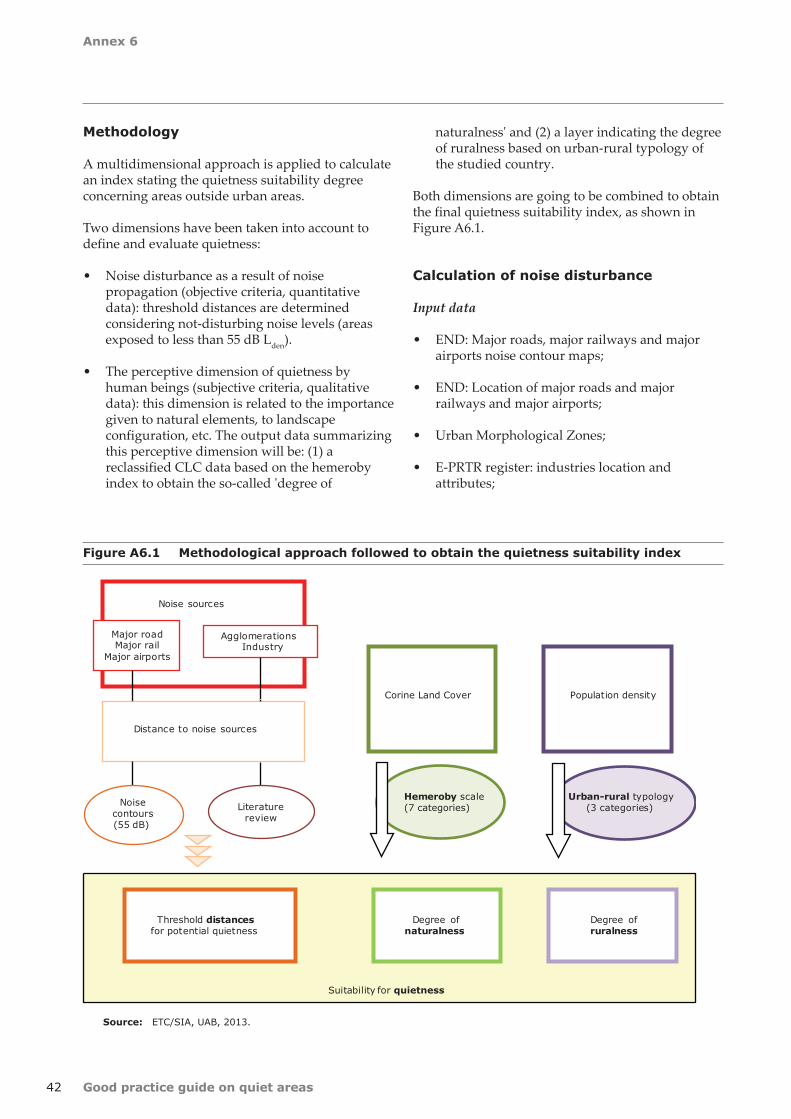
Annex 6
42 Good practice guide on quiet areas
Figure A6.1 Methodological approach followed to obtain the quietness suitability index
Methodology
A multidimensional approach is applied to calculate an index stating the quietness suitability degree concerning areas outside urban areas.
Two dimensions have been taken into account to define and evaluate quietness:
• Noise disturbance as a result of noise propagation (objective criteria, quantitative data): threshold distances are determined considering not-disturbing noise levels (areas exposed to less than 55 dB Lden).
• The perceptive dimension of quietness by human beings (subjective criteria, qualitative data): this dimension is related to the importance given to natural elements, to landscape configuration, etc. The output data summarizing this perceptive dimension will be: (1) a reclassified CLC data based on the hemeroby index to obtain the so-called 'degree of
Source: ETC/SIA, UAB, 2013.
Distance to noise sources
Noise sources
Major roadMajor rail
Major airports
AgglomerationsIndustry
Noisecontours(55 dB)
Literaturereview
Corine Land Cover
Hemeroby scale(7 categories)
Population density
Urban-rural typology(3 categories)
Degree ofnaturalness
Degree ofruralness
Threshold distancesfor potential quietness
Suitability for quietness
naturalness' and (2) a layer indicating the degree of ruralness based on urban-rural typology of the studied country.
Both dimensions are going to be combined to obtain the final quietness suitability index, as shown in Figure A6.1.
Calculation of noise disturbance
Input data
• END: Major roads, major railways and major airports noise contour maps;
• END: Location of major roads and major railways and major airports;
• Urban Morphological Zones;
• E-PRTR register: industries location and attributes;
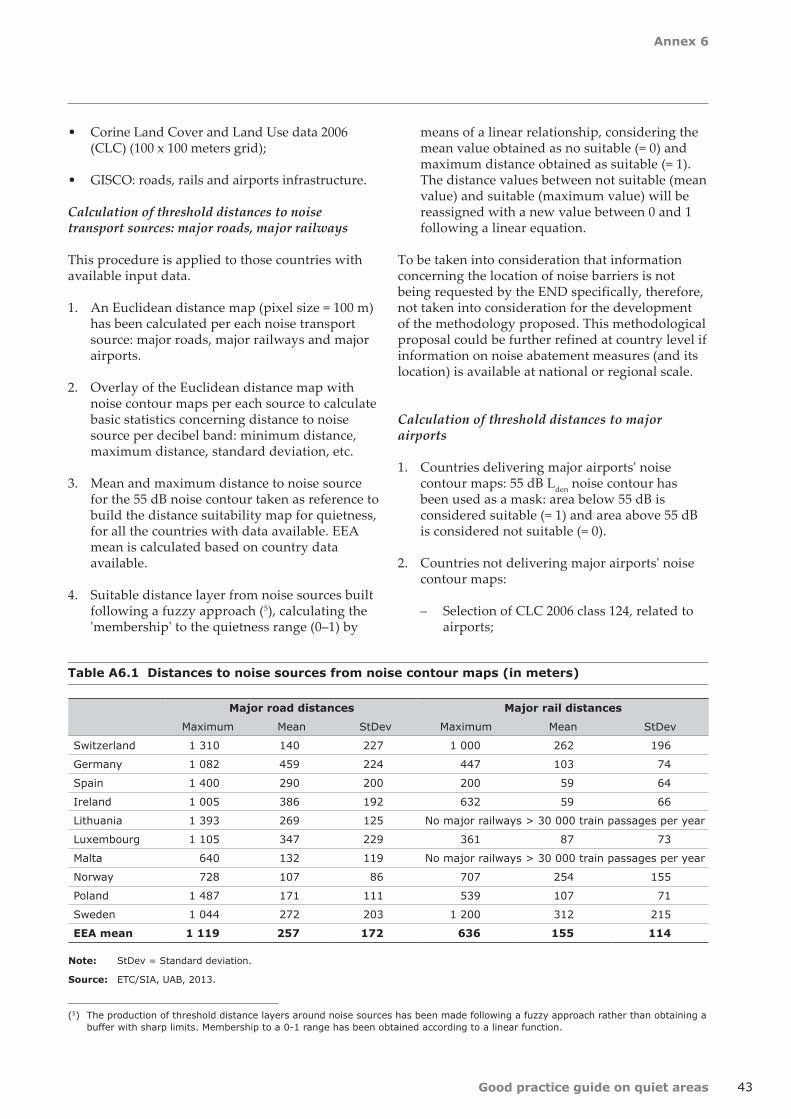
Annex 6
43Good practice guide on quiet areas
• Corine Land Cover and Land Use data 2006 (CLC) (100 x 100 meters grid);
• GISCO: roads, rails and airports infrastructure.
Calculation of threshold distances to noise transport sources: major roads, major railways
This procedure is applied to those countries with available input data.
1. An Euclidean distance map (pixel size = 100 m) has been calculated per each noise transport source: major roads, major railways and major airports.
2. Overlay of the Euclidean distance map with noise contour maps per each source to calculate basic statistics concerning distance to noise source per decibel band: minimum distance, maximum distance, standard deviation, etc.
3. Mean and maximum distance to noise source for the 55 dB noise contour taken as reference to build the distance suitability map for quietness, for all the countries with data available. EEA mean is calculated based on country data available.
4. Suitable distance layer from noise sources built following a fuzzy approach (5), calculating the 'membership' to the quietness range (0–1) by
Note: StDev = Standard deviation.
Source: ETC/SIA, UAB, 2013.
Table A6.1 Distances to noise sources from noise contour maps (in meters)
Major road distances Major rail distances
Maximum Mean StDev Maximum Mean StDev
Switzerland 1 310 140 227 1 000 262 196
Germany 1 082 459 224 447 103 74
Spain 1 400 290 200 200 59 64
Ireland 1 005 386 192 632 59 66
Lithuania 1 393 269 125 No major railways > 30 000 train passages per year
Luxembourg 1 105 347 229 361 87 73
Malta 640 132 119 No major railways > 30 000 train passages per year
Norway 728 107 86 707 254 155
Poland 1 487 171 111 539 107 71
Sweden 1 044 272 203 1 200 312 215
EEA mean 1 119 257 172 636 155 114
means of a linear relationship, considering the mean value obtained as no suitable (= 0) and maximum distance obtained as suitable (= 1). The distance values between not suitable (mean value) and suitable (maximum value) will be reassigned with a new value between 0 and 1 following a linear equation.
To be taken into consideration that information concerning the location of noise barriers is not being requested by the END specifically, therefore, not taken into consideration for the development of the methodology proposed. This methodological proposal could be further refined at country level if information on noise abatement measures (and its location) is available at national or regional scale.
Calculation of threshold distances to major airports
1. Countries delivering major airports' noise contour maps: 55 dB Lden noise contour has been used as a mask: area below 55 dB is considered suitable (= 1) and area above 55 dB is considered not suitable (= 0).
2. Countries not delivering major airports' noise contour maps:
– Selection of CLC 2006 class 124, related to airports;
(5) The production of threshold distance layers around noise sources has been made following a fuzzy approach rather than obtaining a buffer with sharp limits. Membership to a 0-1 range has been obtained according to a linear function.
Annex 6
44 Good practice guide on quiet areas
– Distinction between those considered major airports by the END and the rest of airports by overlaying both data sources;
– Buffer of 1500 metres applied to polygons considered as major airports and buffer of 900 metres applied to the rest of CLC class 124 polygons (distances applied extracted from literature: Votsi et al., 2012);
– Buffers used as a mask: areas in the buffered area considered not suitable (= 0) and areas outside the buffered area considered suitable (= 1).
Calculation of threshold distances to industrial noise sources
1. In the case of industrial sites, noise contour maps are only available for industrial areas located inside agglomerations, and therefore, not useful for this analysis, reason why E-PRTR database and CLC 2006 have been used.
2. Selection of CLC 2006 classes labelled as industry, mine, dump and construction sites.
3. Euclidean distance map calculated from the georeferenced E-PRTR database and from CLC polygons selected (pixel size = 100 m)
4. Threshold distance values to establish the fuzzy membership to the quieteness index based on literature (Votsi et al., 2012). Distance values below 500 meters will be considered not suitable (= 0) and distance values above 1 100 meters will be considered suitable as potentially quiet (= 1). Values between 500 and 1 100 meters will be reassigned with a new value between 0 and 1 following a linear equation.
Calculation of threshold distances to agglomerations
1. In the case of urban agglomerations, the urban morphological zones (UMZ) (6) with more than 100 000 inhabitants have been chosen as input data. END urban agglomerations have been discarded due to the great variation of delineations reported by the different EEA member countries, ranging from administrative delineations until detailed urban polygons.
(6) http://www.eea.europa.eu/data-and-maps/data/urban-morphological-zones-2006.
Instead, UMZ based on CLC database, are available and harmonised for all Europe.
2. Euclidean distance map calculated based on the UMZ polygons
3. Threshold distance values to establish the fuzzy membership to the quieteness index based on literature (Votsi et al., 2012) . Distance values below 1000 meters will be considered not suitable (= 0) and distance values above 1 500 meters will be considered suitable as potentially quiet (= 1). Values between 1 000 and 1 500 meters will be reassigned with a new value between 0 and 1 following a linear equation.
Result: final threshold distances layer
Once threshold distance layers have been obtained separately, they are merged together by multiplying them. The output layer will range between 0 and 1.
Calculation of noise perception
The notion of quietness has a multidimensional character. Quietness is not only defined according to objective criteria (noise levels), measured by quantitative data, but also by a subjective component linked to perception. In this way, and beyond noise exposure, quietness is related to a series of elements which are perceived as positive and which are usually related to human cultural construction of naturalness.
Subjective references to quietness are largely referred to in literature (Waugh et al., 2003; MacFarlane et al., 2004; Botteldooren and De Coensel, 2006). They are linked to environmental and socio-cultural factors: low population density, low intensity agriculture, environmental quality, landscape quality (i.e. non visual intrusion of transport infrastructures, culturally valued landscapes, 'natural' landscapes). Public consultations have showed the subjective nature of quietness, as independent on each person. However, there is a common element which arises continuously: quietness as related to nature (green elements, water, animals and wildlife, remoteness, panoramic views, weather, etc.) (Rendel, 2005; Pheasant et al. 2006; Cordeau and Gourlot, 2006).
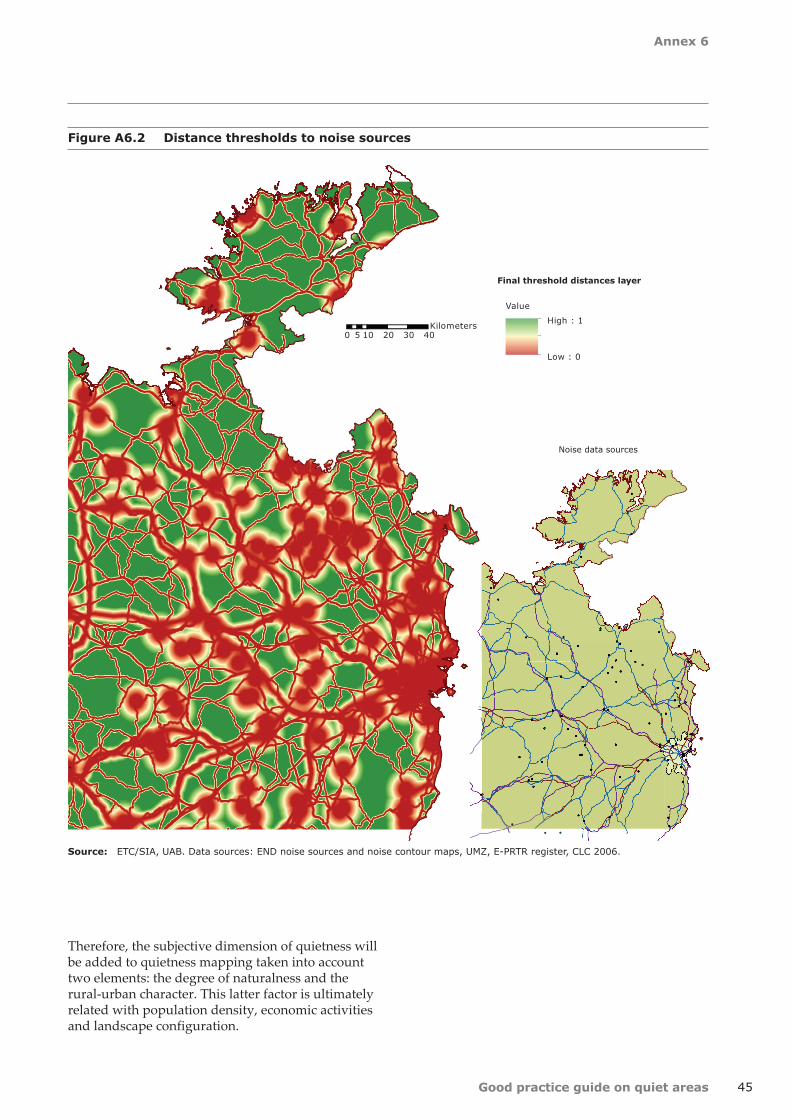
Annex 6
45Good practice guide on quiet areas
Figure A6.2 Distance thresholds to noise sources
Source: ETC/SIA, UAB. Data sources: END noise sources and noise contour maps, UMZ, E-PRTR register, CLC 2006.
0 10 20 30 405Kilometers
MULT_FuzzM_StatMaxMRoadRailAir_Ind_CLIP
Value
High : 1
Low : 0
Final threshold distances layer
Noise data sources
Therefore, the subjective dimension of quietness will be added to quietness mapping taken into account two elements: the degree of naturalness and the rural-urban character. This latter factor is ultimately related with population density, economic activities and landscape configuration.
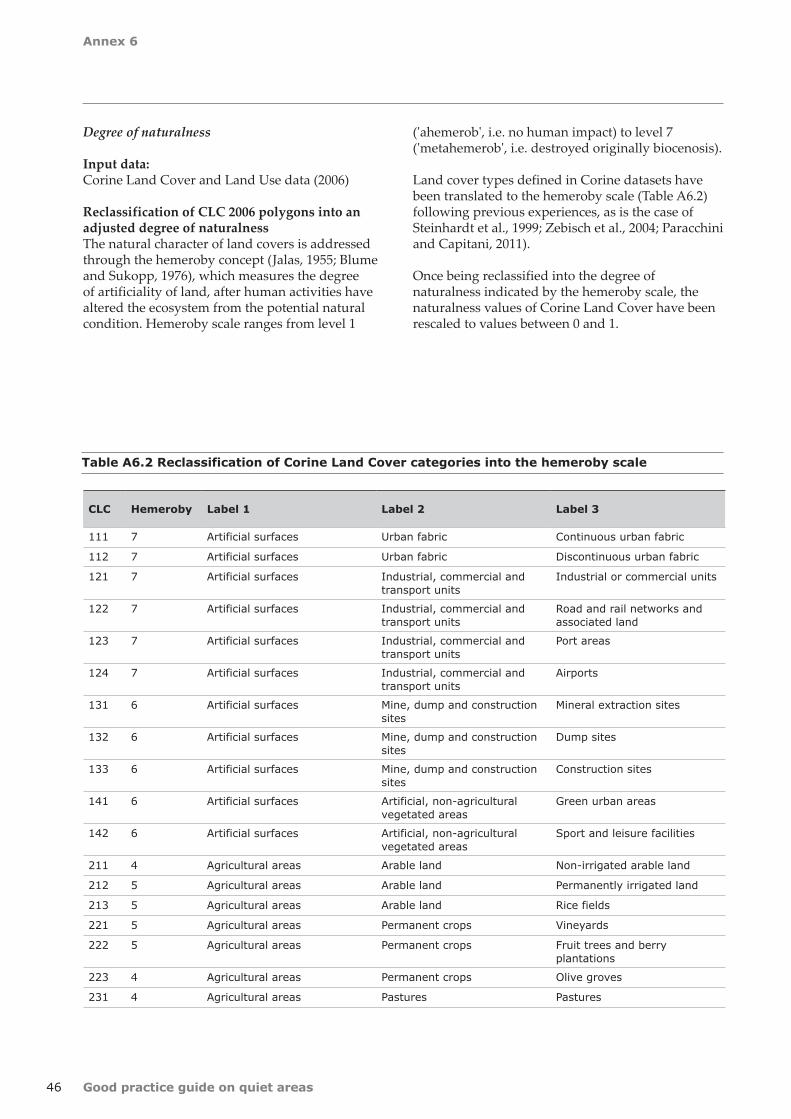
Annex 6
46 Good practice guide on quiet areas
CLC Hemeroby Label 1 Label 2 Label 3
111 7 Artificial surfaces Urban fabric Continuous urban fabric
112 7 Artificial surfaces Urban fabric Discontinuous urban fabric
121 7 Artificial surfaces Industrial, commercial and transport units
Industrial or commercial units
122 7 Artificial surfaces Industrial, commercial and transport units
Road and rail networks and associated land
123 7 Artificial surfaces Industrial, commercial and transport units
Port areas
124 7 Artificial surfaces Industrial, commercial and transport units
Airports
131 6 Artificial surfaces Mine, dump and construction sites
Mineral extraction sites
132 6 Artificial surfaces Mine, dump and construction sites
Dump sites
133 6 Artificial surfaces Mine, dump and construction sites
Construction sites
141 6 Artificial surfaces Artificial, non-agricultural vegetated areas
Green urban areas
142 6 Artificial surfaces Artificial, non-agricultural vegetated areas
Sport and leisure facilities
211 4 Agricultural areas Arable land Non-irrigated arable land
212 5 Agricultural areas Arable land Permanently irrigated land
213 5 Agricultural areas Arable land Rice fields
221 5 Agricultural areas Permanent crops Vineyards
222 5 Agricultural areas Permanent crops Fruit trees and berry plantations
223 4 Agricultural areas Permanent crops Olive groves
231 4 Agricultural areas Pastures Pastures
Table A6.2 Reclassification of Corine Land Cover categories into the hemeroby scale
Degree of naturalness
Input data: Corine Land Cover and Land Use data (2006)
Reclassification of CLC 2006 polygons into an adjusted degree of naturalness The natural character of land covers is addressed through the hemeroby concept (Jalas, 1955; Blume and Sukopp, 1976), which measures the degree of artificiality of land, after human activities have altered the ecosystem from the potential natural condition. Hemeroby scale ranges from level 1
('ahemerob', i.e. no human impact) to level 7 ('metahemerob', i.e. destroyed originally biocenosis).
Land cover types defined in Corine datasets have been translated to the hemeroby scale (Table A6.2) following previous experiences, as is the case of Steinhardt et al., 1999; Zebisch et al., 2004; Paracchini and Capitani, 2011).
Once being reclassified into the degree of naturalness indicated by the hemeroby scale, the naturalness values of Corine Land Cover have been rescaled to values between 0 and 1.
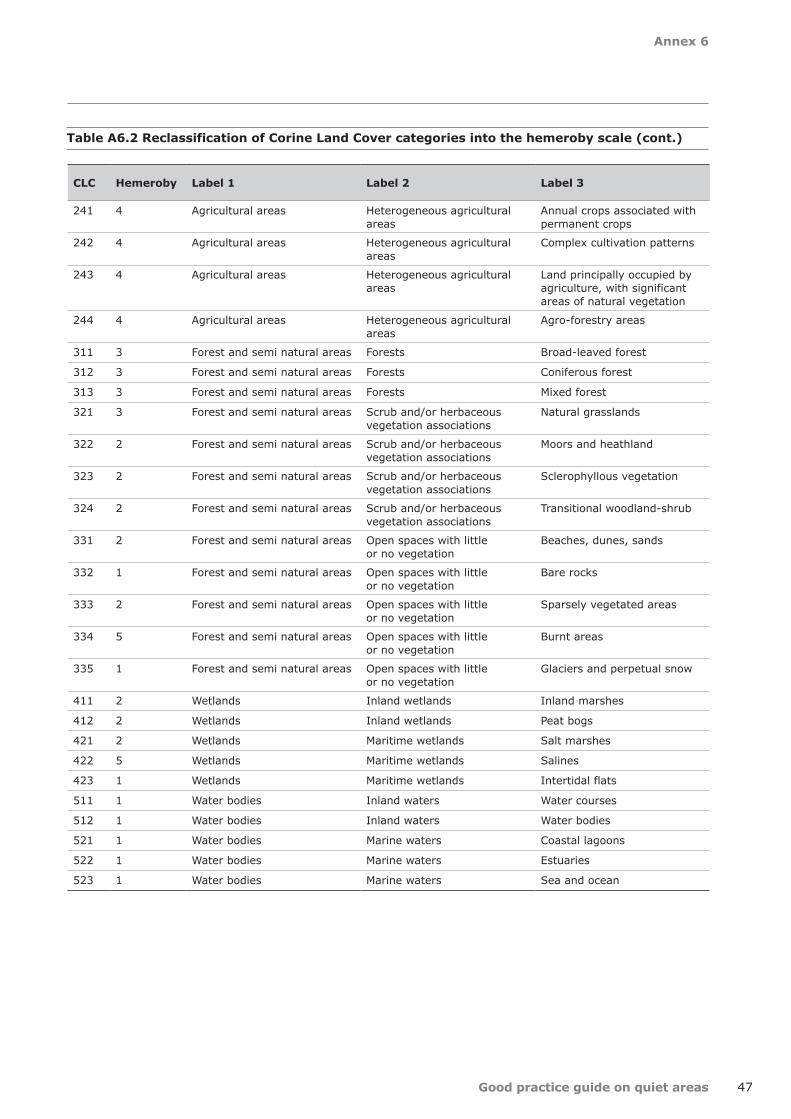
Annex 6
47Good practice guide on quiet areas
CLC Hemeroby Label 1 Label 2 Label 3
241 4 Agricultural areas Heterogeneous agricultural areas
Annual crops associated with permanent crops
242 4 Agricultural areas Heterogeneous agricultural areas
Complex cultivation patterns
243 4 Agricultural areas Heterogeneous agricultural areas
Land principally occupied by agriculture, with significant areas of natural vegetation
244 4 Agricultural areas Heterogeneous agricultural areas
Agro-forestry areas
311 3 Forest and semi natural areas Forests Broad-leaved forest
312 3 Forest and semi natural areas Forests Coniferous forest
313 3 Forest and semi natural areas Forests Mixed forest
321 3 Forest and semi natural areas Scrub and/or herbaceous vegetation associations
Natural grasslands
322 2 Forest and semi natural areas Scrub and/or herbaceous vegetation associations
Moors and heathland
323 2 Forest and semi natural areas Scrub and/or herbaceous vegetation associations
Sclerophyllous vegetation
324 2 Forest and semi natural areas Scrub and/or herbaceous vegetation associations
Transitional woodland-shrub
331 2 Forest and semi natural areas Open spaces with little or no vegetation
Beaches, dunes, sands
332 1 Forest and semi natural areas Open spaces with little or no vegetation
Bare rocks
333 2 Forest and semi natural areas Open spaces with little or no vegetation
Sparsely vegetated areas
334 5 Forest and semi natural areas Open spaces with little or no vegetation
Burnt areas
335 1 Forest and semi natural areas Open spaces with little or no vegetation
Glaciers and perpetual snow
411 2 Wetlands Inland wetlands Inland marshes
412 2 Wetlands Inland wetlands Peat bogs
421 2 Wetlands Maritime wetlands Salt marshes
422 5 Wetlands Maritime wetlands Salines
423 1 Wetlands Maritime wetlands Intertidal flats
511 1 Water bodies Inland waters Water courses
512 1 Water bodies Inland waters Water bodies
521 1 Water bodies Marine waters Coastal lagoons
522 1 Water bodies Marine waters Estuaries
523 1 Water bodies Marine waters Sea and ocean
Table A6.2 Reclassification of Corine Land Cover categories into the hemeroby scale (cont.)
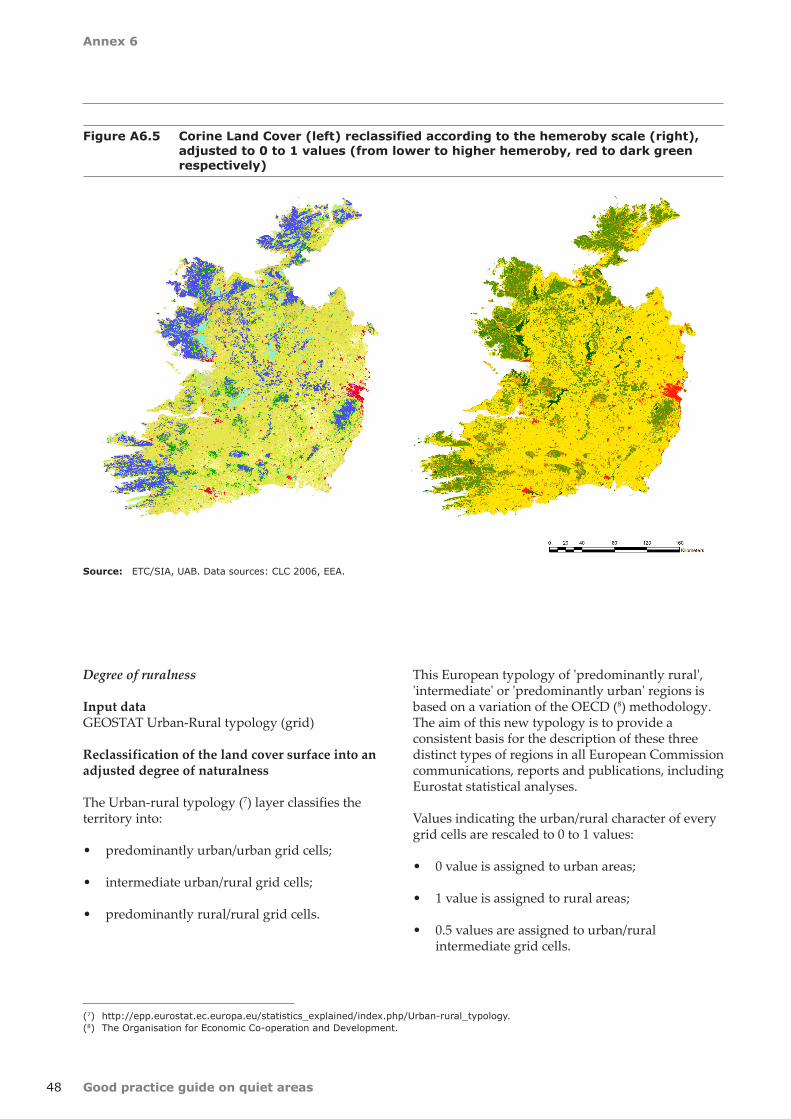
Annex 6
48 Good practice guide on quiet areas
Figure A6.5 Corine Land Cover (left) reclassified according to the hemeroby scale (right), adjusted to 0 to 1 values (from lower to higher hemeroby, red to dark green respectively)
Source: ETC/SIA, UAB. Data sources: CLC 2006, EEA.
Degree of ruralness
Input data GEOSTAT Urban-Rural typology (grid)
Reclassification of the land cover surface into an adjusted degree of naturalness
The Urban-rural typology (7) layer classifies the territory into:
• predominantly urban/urban grid cells;
• intermediate urban/rural grid cells;
• predominantly rural/rural grid cells.
(7) http://epp.eurostat.ec.europa.eu/statistics_explained/index.php/Urban-rural_typology.(8) The Organisation for Economic Co-operation and Development.
This European typology of 'predominantly rural', 'intermediate' or 'predominantly urban' regions is based on a variation of the OECD (8) methodology. The aim of this new typology is to provide a consistent basis for the description of these three distinct types of regions in all European Commission communications, reports and publications, including Eurostat statistical analyses.
Values indicating the urban/rural character of every grid cells are rescaled to 0 to 1 values:
• 0 value is assigned to urban areas;
• 1 value is assigned to rural areas;
• 0.5 values are assigned to urban/rural intermediate grid cells.
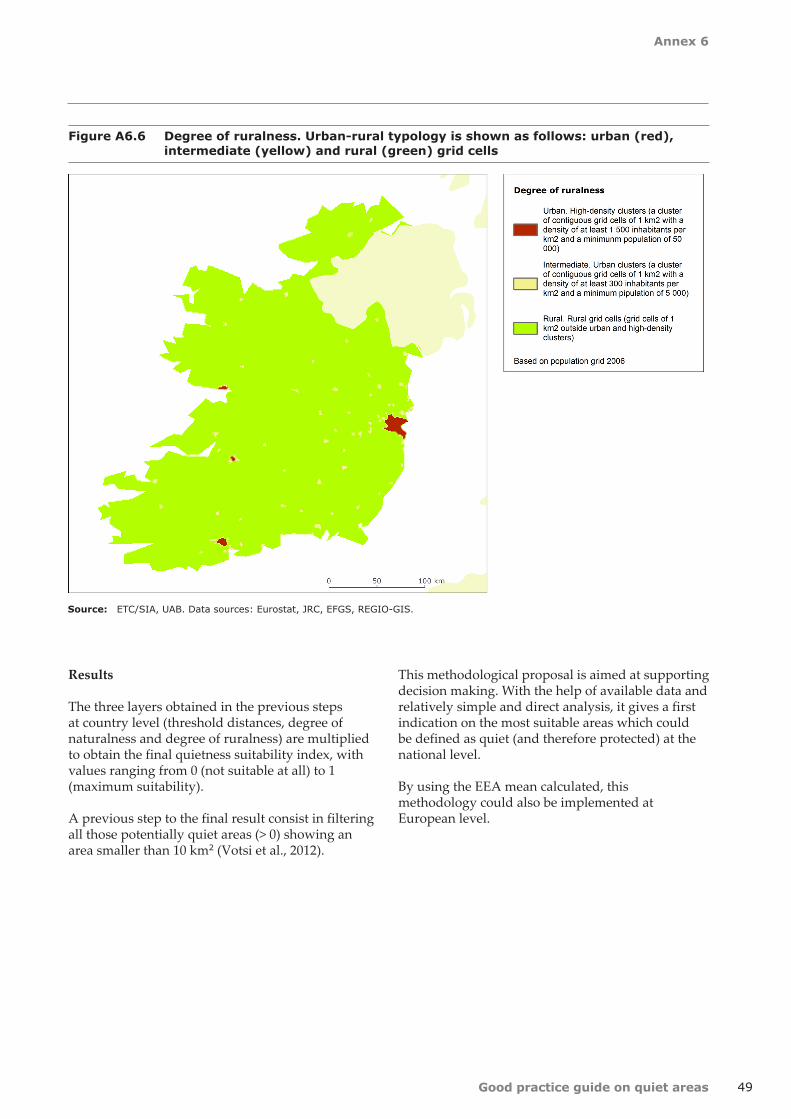
Annex 6
49Good practice guide on quiet areas
Figure A6.6 Degree of ruralness. Urban-rural typology is shown as follows: urban (red), intermediate (yellow) and rural (green) grid cells
Source: ETC/SIA, UAB. Data sources: Eurostat, JRC, EFGS, REGIO-GIS.
Results
The three layers obtained in the previous steps at country level (threshold distances, degree of naturalness and degree of ruralness) are multiplied to obtain the final quietness suitability index, with values ranging from 0 (not suitable at all) to 1 (maximum suitability).
A previous step to the final result consist in filtering all those potentially quiet areas (> 0) showing an area smaller than 10 km2 (Votsi et al., 2012).
This methodological proposal is aimed at supporting decision making. With the help of available data and relatively simple and direct analysis, it gives a first indication on the most suitable areas which could be defined as quiet (and therefore protected) at the national level.
By using the EEA mean calculated, this methodology could also be implemented at European level.
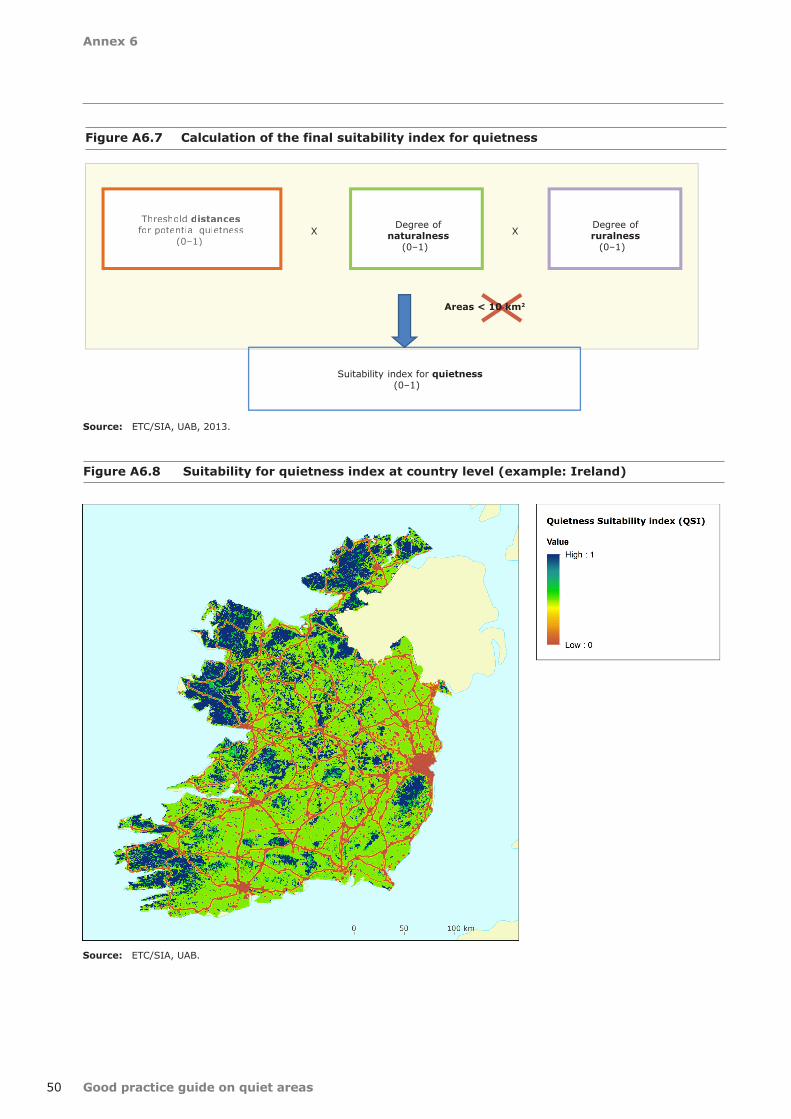
Annex 6
50 Good practice guide on quiet areas
Figure A6.7 Calculation of the final suitability index for quietness
Figure A6.8 Suitability for quietness index at country level (example: Ireland)
Source: ETC/SIA, UAB, 2013.
Degree ofnaturalness
(0–1)
Degree ofruralness
(0–1)
Threshold distancesfor potential quietness
(0–1)
Suitability index for quietness (0–1)
X X
Areas < 10 km2
Source: ETC/SIA, UAB.
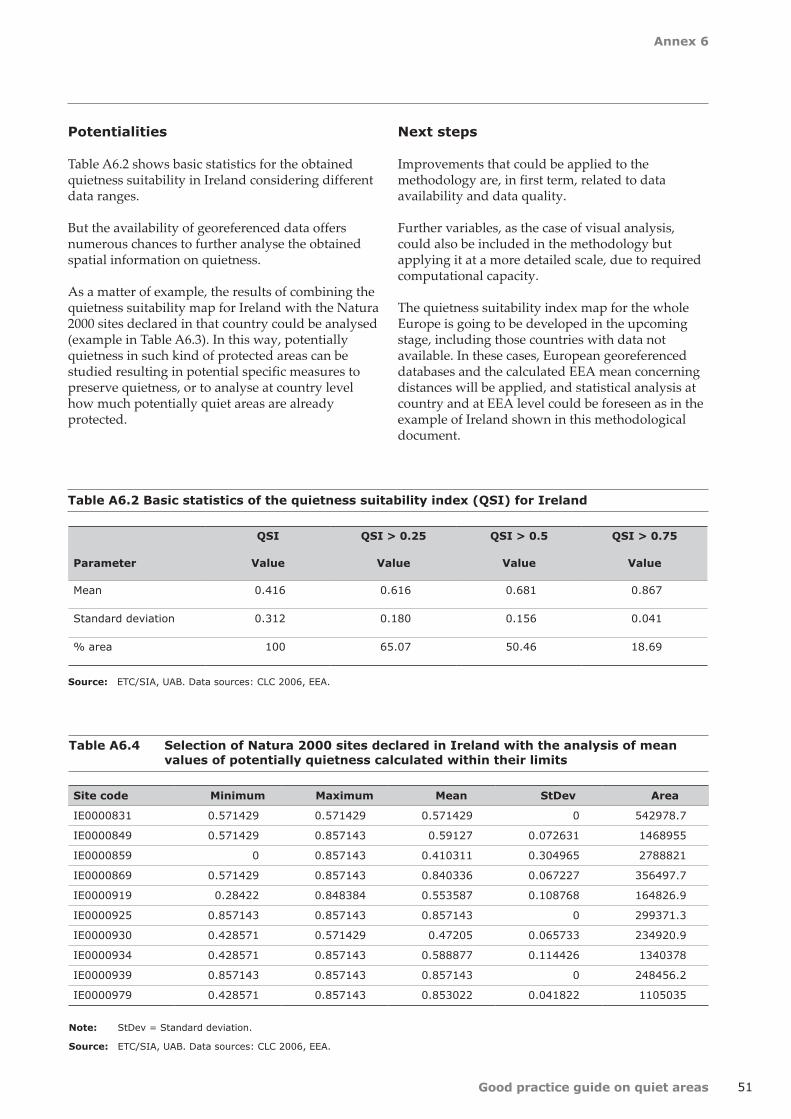
Annex 6
51Good practice guide on quiet areas
Table A6.2 Basic statistics of the quietness suitability index (QSI) for Ireland
Source: ETC/SIA, UAB. Data sources: CLC 2006, EEA.
QSI QSI > 0.25 QSI > 0.5 QSI > 0.75
Parameter Value Value Value Value
Mean 0.416 0.616 0.681 0.867
Standard deviation 0.312 0.180 0.156 0.041
% area 100 65.07 50.46 18.69
Table A6.4 Selection of Natura 2000 sites declared in Ireland with the analysis of mean values of potentially quietness calculated within their limits
Site code Minimum Maximum Mean StDev Area
IE0000831 0.571429 0.571429 0.571429 0 542978.7
IE0000849 0.571429 0.857143 0.59127 0.072631 1468955
IE0000859 0 0.857143 0.410311 0.304965 2788821
IE0000869 0.571429 0.857143 0.840336 0.067227 356497.7
IE0000919 0.28422 0.848384 0.553587 0.108768 164826.9
IE0000925 0.857143 0.857143 0.857143 0 299371.3
IE0000930 0.428571 0.571429 0.47205 0.065733 234920.9
IE0000934 0.428571 0.857143 0.588877 0.114426 1340378
IE0000939 0.857143 0.857143 0.857143 0 248456.2
IE0000979 0.428571 0.857143 0.853022 0.041822 1105035
Note: StDev = Standard deviation.
Source: ETC/SIA, UAB. Data sources: CLC 2006, EEA.
Potentialities
Table A6.2 shows basic statistics for the obtained quietness suitability in Ireland considering different data ranges.
But the availability of georeferenced data offers numerous chances to further analyse the obtained spatial information on quietness.
As a matter of example, the results of combining the quietness suitability map for Ireland with the Natura 2000 sites declared in that country could be analysed (example in Table A6.3). In this way, potentially quietness in such kind of protected areas can be studied resulting in potential specific measures to preserve quietness, or to analyse at country level how much potentially quiet areas are already protected.
Next steps
Improvements that could be applied to the methodology are, in first term, related to data availability and data quality.
Further variables, as the case of visual analysis, could also be included in the methodology but applying it at a more detailed scale, due to required computational capacity.
The quietness suitability index map for the whole Europe is going to be developed in the upcoming stage, including those countries with data not available. In these cases, European georeferenced databases and the calculated EEA mean concerning distances will be applied, and statistical analysis at country and at EEA level could be foreseen as in the example of Ireland shown in this methodological document.
Annex 6
52 Good practice guide on quiet areas
References
Blume, H.P.; Sukopp, H., 1976, 'Ökologische Bedeutung anthropogener Bodenveränderungen', Schriftenreihe für Vegetationskunde, 10, 75–89.
Botteldooren, D.; De Coensel, B., 2006, 'Quality assessment of quiet areas: a multi-criteria approach', Euronoise 2006 (Tampere, Finland), Ghent University, 6 p.
Cordeau, E.; Gourlot, N., 2006, Zones de calme et aménagement. Etude exploratoire sur la notion de « zone de calme ». Les enseignements pour l'Ile-de-France, Institut d'Aménagement et d'Urbanisme de la Région Ile-de-France (IAURIF), 163 p.
Jalas, J., 1955, 'Hemerobe und hemerochore Pflanzenarten. Ein terminologischer Reformversuch', Acta Societatia Pro Fauna et Flora Fennica, 72, 1–15.
MacFarlane, R.; Haggett, C.; Fuller, D.; Dunsford, H.; Carlisle, B., 2004, Tranquility mapping: developing a robust methodology for planning support. Report to the Campaign to Protect Rural England, Countryside Agency, North East Assembly, Northumberland Strategic Partnership, Northumberland National Park Authority and Durham County Council, Centre for Environmental & Spatial Analysis, Northumbria University, 190 p.
Paracchini, M.L.; Capitani, C., 2011, Implementation of e EU-wide indicator for the rural-agrarian landscape. EUR 25114 EN– Joint Research Centre – Institute for Environment and Sustainability. Publications Office of the European Union, Luxemburg. 89 p.
Pheasant, R., Barrett, B., Horoshenkov, K., Watts, G., 2006, The Importance of visual and acoustic factors in determining tranquillity for use in landscape management and planning. Thirteenth International Congress on Sound and Vibration (ICSV), Vienna, Austria.
Rendel, S. (ASH Consulting), 2005, Chilterns Tranquillity Study. Report on the Participatory Appraisal Consultations in the Chilterns Area of Outstanding Natural Beauty. Campaign to Protect Rural England, Countryside Agency, United Kingdom, 37 p.
Steinhardt, U., Herzog, F., Lausch, A., Müller, E., Lehmann, S., 1999, 'The hemeroby index for landscape monitoring and evaluation', in Pykh, Y.A.; Hyatt D.E.; Lenz, R.J.M. (Eds.), Environmental Indices—Systems Analysis Approach, EOLSS Publ. Oxford, pp. 237–254.
Votsi, N.P., Drakou, E.G., Mazaris, A.D., Kallimanis, A.S., Pantis, J.D., 2012, 'Distance-based assessment of open country Quiet Areas in Greece', Landscape and Urban Planning, 104, 279–288.
Waugh, D.; Durucan, S.; Korre, A.; Hetherington, O.; O'Reilly, B., 2003, Environmental Quality Objectives. Noise in Quiet Areas. Synthesis Report 2000-MS-14-M1. Environmental Protection Agency (EPA), 25 p.
Zebischm M.; Wechsung, F.; Kenneweg, H., 2004, 'Landscape response functions for biodiversity—assessing the impact of land-use changes at the county level', Landscape and Urban Planning, 67, 157–172.
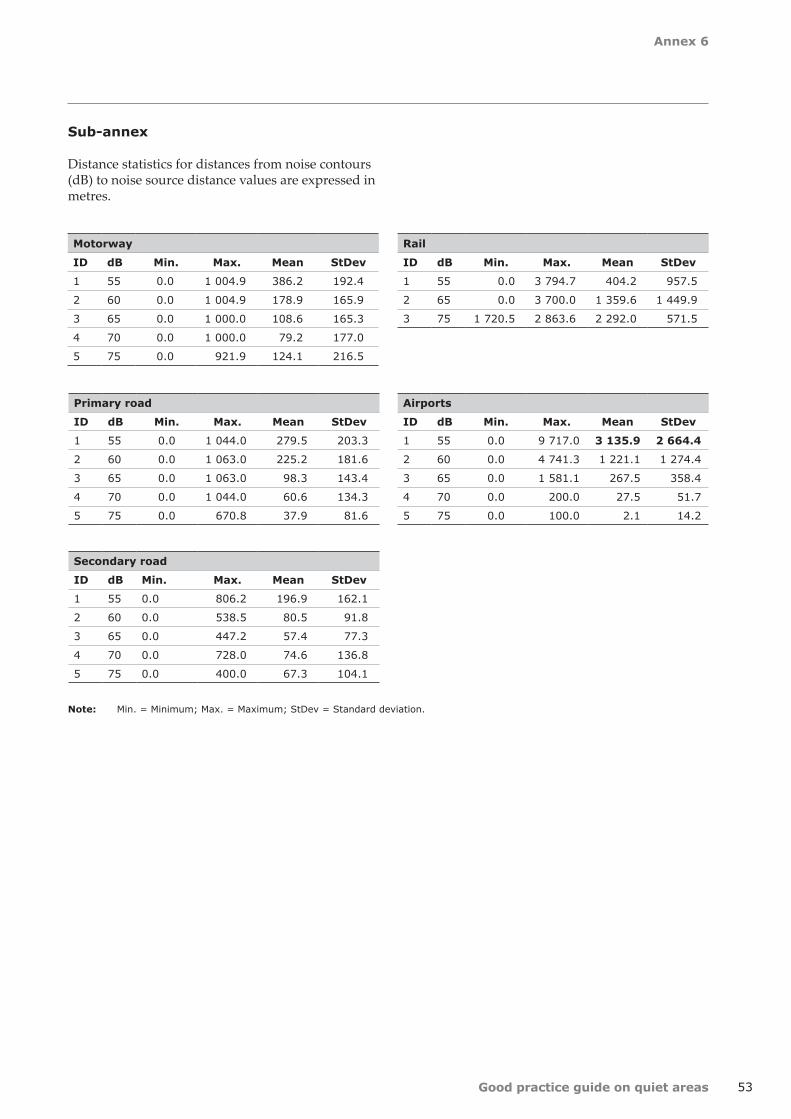
Annex 6
53Good practice guide on quiet areas
Sub-annex
Distance statistics for distances from noise contours (dB) to noise source distance values are expressed in metres.
Motorway
ID dB Min. Max. Mean StDev
1 55 0.0 1 004.9 386.2 192.4
2 60 0.0 1 004.9 178.9 165.9
3 65 0.0 1 000.0 108.6 165.3
4 70 0.0 1 000.0 79.2 177.0
5 75 0.0 921.9 124.1 216.5
Primary road
ID dB Min. Max. Mean StDev
1 55 0.0 1 044.0 279.5 203.3
2 60 0.0 1 063.0 225.2 181.6
3 65 0.0 1 063.0 98.3 143.4
4 70 0.0 1 044.0 60.6 134.3
5 75 0.0 670.8 37.9 81.6
Secondary road
ID dB Min. Max. Mean StDev
1 55 0.0 806.2 196.9 162.1
2 60 0.0 538.5 80.5 91.8
3 65 0.0 447.2 57.4 77.3
4 70 0.0 728.0 74.6 136.8
5 75 0.0 400.0 67.3 104.1
Rail
ID dB Min. Max. Mean StDev
1 55 0.0 3 794.7 404.2 957.5
2 65 0.0 3 700.0 1 359.6 1 449.9
3 75 1 720.5 2 863.6 2 292.0 571.5
Airports
ID dB Min. Max. Mean StDev
1 55 0.0 9 717.0 3 135.9 2 664.4
2 60 0.0 4 741.3 1 221.1 1 274.4
3 65 0.0 1 581.1 267.5 358.4
4 70 0.0 200.0 27.5 51.7
5 75 0.0 100.0 2.1 14.2
Note: Min. = Minimum; Max. = Maximum; StDev = Standard deviation.

European Environment Agency
Good practice guide on quiet areas
2014 — 53 pp. — 21 x 29.7 cm
ISBN 978-92-9213-424-2doi:10.2800/12611
HOW TO OBTAIN EU PUBLICATIONS
Free publications:• via EU Bookshop (http://bookshop.europa.eu);• at the European Union's representations or delegations. You can obtain their
contact details on the Internet (http://ec.europa.eu) or by sending a fax to +352 2929-42758.
Priced publications:• via EU Bookshop (http://bookshop.europa.eu).
Priced subscriptions (e.g. annual series of the Official Journal of the European Union and reports of cases before the Court of Justice of the European Union):• via one of the sales agents of the Publications Office of the European Union
(http://publications.europa.eu/others/agents/index_en.htm).

European Environment AgencyKongens Nytorv 61050 Copenhagen KDenmark
Tel.: +45 33 36 71 00Fax: +45 33 36 71 99
Web: eea.europa.euEnquiries: eea.europa.eu/enquiries
TH-A
K-14-004-EN-N
doi:10.2800/12611
Recommended