1 2006 NEW YORK-NEW JERSEY HARBOR WATER QUALITY REPORT
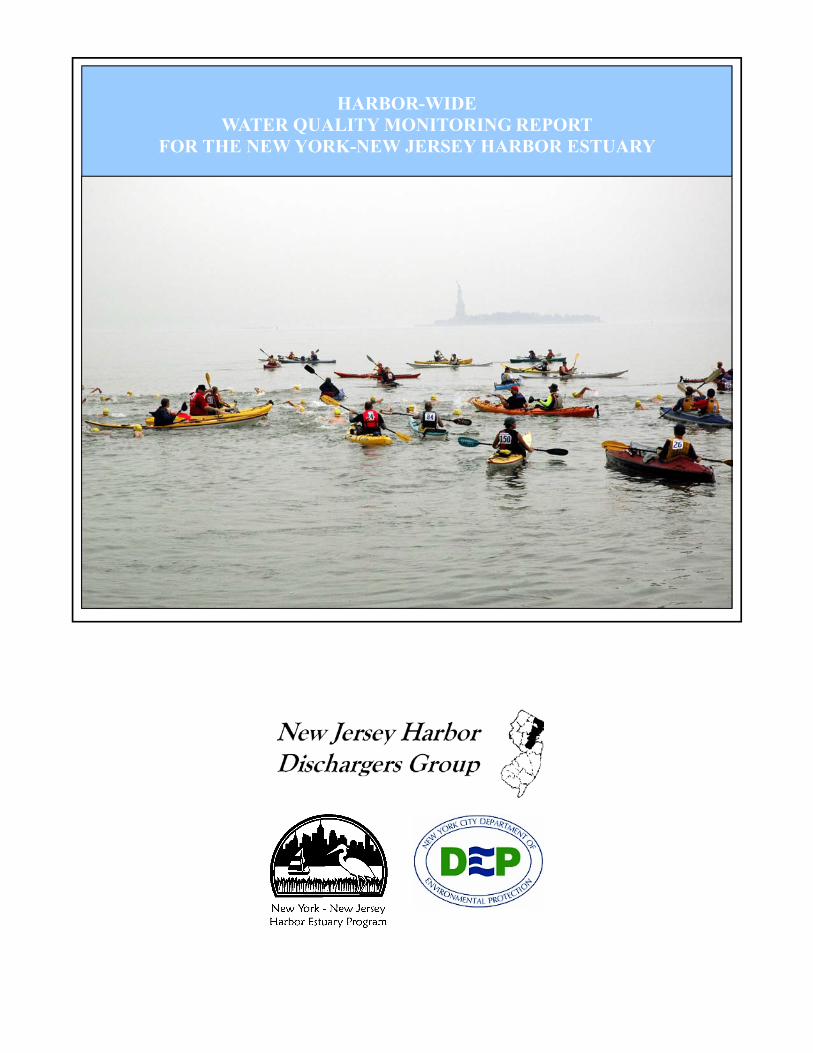
HARBOR-WIDE
WATER QUALITY MONITORING REPORT FOR THE NEW YORK-NEW JERSEY HARBOR ESTUARY

2 2006 NEW YORK-NEW JERSEY HARBOR WATER QUALITY REPORT
1 2006 NEW YORK-NEW JERSEY HARBOR WATER QUALITY REPORT
HARBOR-WIDE WATER QUALITY MONITORING REPORT
FOR THE NEW YORK-NEW JERSEY HARBOR ESTUARY
2 2006 NEW YORK-NEW JERSEY HARBOR WATER QUALITY REPORT
ACKNOWLEDGEMENTS
Many organizations and individuals contributed to this effort, both financially and with their time. The New York-New Jersey Harbor Estuary Program (HEP) identified the need for a Harbor-wide water quality monitoring and reporting effort that would enhance existing monitoring efforts. The Interstate Environmental Commission (IEC) formed an interagency adhoc committee to plan the sampling effort in New Jersey waters that would complement the sampling in New York waters that is currently being undertaken by the City of New York. Organizations represented on the adhoc committee included New Jersey Department of Environmental Protection (NJDEP), New York State Department of Environmental Conservation (NYDEC), New York City Department of Environmental Protection (NYCDEP), US Environmental Protection Agency (EPA), Interstate Environmental Commission, National Park Service (NPS), New Jersey Harbor Dischargers Group (NJHDG), Passaic Valley Sewerage Commissioners (PVSC), and the US Army Corps of Engineers. NYCDEP and NJHDG generated the data that is presented in this report. HEP was responsible for the overall coordination and funding for preparing this report. The report was prepared by the Great Lakes Environmental Center (GLEC), with administrative services provided by the New England Interstate Water Pollution Control Commission (NEIWPCC). Graphics were provided by GLEC, NYCDEP, and HydroQual Inc. Photographs were provided by One More Cast Charters, the Manhattan Island Foundation, New Jersey Marine Sciences Consortium and New York-New Jersey Baykeeper. The NJHDG is a consortium of 10 wastewater utilities representing 12 publicly owned treatment works (POTWs) that discharge into the New Jersey portion of the New York/New Jersey Harbor. The 10 wastewater treatment utilities in northern New Jersey include the Middlesex County Utilities Authority (MCUA); the Linden Roselle Sewerage Authority (LRSA); the Rahway Valley Sewerage Authority (RVSA); the Joint Meeting of Essex and Union Counties (Joint Meeting); the Passaic Valley Sewerage Commissioners (PVSC); the Bergen County Utilities Authority (BCUA); the North Bergen Municipal Utilities Authority (NBMUA); the North Hudson Sewerage Authority (NHSA); the Secaucus Municipal Utilities Authority (SMUA); and the Edgewater Municipal Utilities Authority (EMUA). The NJHDG member organizations were responsible for collecting the samples from the New Jersey waters, and for analyzing the collected samples. The coordinators of the sampling and analytical programs for NJHDG and NYCDEP were Ashley Pengitore (PVSC) and Beau Ranheim (NYCDEP), respectively. The NJHDG Harbor Monitoring Program included the participation of Thomas Pietrykoski, Prudence Moon-Banks (PVSC), the PVSC River Restoration Department; Vinny Makfinsky and David Vieira (Joint Meeting); Guy Abramowitz and Alberto Escobar (NBMUA); Ed Kochick and John Hruska (RVSA); Steve Bronowich (SMUA); and Wale Adewunmi (MCUA). PVSC, MCUA and BCUA Laboratories performed most of the chemical analyses for New Jersey waters. The analyses for New York City waters were performed by NYCDEP laboratory. NJHDG data files are stored at PVSC (contact Ashley Pengitore), and NYCDEP data files are stored at NYCDEP (contact: Beau Ranheim).
3 2006 NEW YORK-NEW JERSEY HARBOR WATER QUALITY REPORT
TABLE OF CONTENTS
EXECUTIVE SUMMARY................................................................................................................................ 4 INTRODUCTION ............................................................................................................................................ 6 SURVEY REGIONS AND 2004-2006 SURVEY SITES ............................................................................. 7 MEASURED WATER QUALITY PARAMETERS....................................................................................... 8 CURRENT WATERBODY CLASSIFICATIONS IN NEW JERSEY WATERS ................................................. 9 WATERBODY CLASSIFICATIONS AND STANDARDS—NEW JERSEY ................................................... 10 CURRENT WATERBODY CLASSIFICATIONS IN NEW YORK WATERS ................................................. 11 WATERBODY CLASSIFICATIONS AND STANDARDS—NEW YORK ..................................................... 12 FACTORS THAT AFFECT WATER QUALITY IN THE HARBOR ............................................................. 13 POTWs ................................................................................................................................ 13 CSOs/SWOs ........................................................................................................................ 13 Non-Point Sources of Pollution ........................................................................................... 15 A PROGRAM TO EVALUATE AND IMPROVE WATER QUALITY IN THE HARBOR ................................ 16 HARBOR-WIDE WATER QUALITY TRENDS.............................................................................................. 17 HARBOR-WIDE BACTERIA ................................................................................................................ 17 HARBOR-WIDE DISSOLVED OXYGEN................................................................................................ 19 2006 REGIONAL SUMMARIES.................................................................................................................... 22 JAMAICA BAY ................................................................................................................................... 22 Bacteria................................................................................................................................ 22 Dissolved Oxygen ............................................................................................................... 24 EAST RIVER—WESTERN LONG ISLAND SOUND ............................................................................... 25 Bacteria................................................................................................................................ 25 Dissolved Oxygen ............................................................................................................... 27 RARITAN RIVER BAY—LOWER NEW YORK BAY............................................................................. 28 Bacteria................................................................................................................................ 28 Dissolved Oxygen ............................................................................................................... 30 HUDSON RIVER—UPPER NEW YORK BAY ....................................................................................... 31 Bacteria................................................................................................................................ 31 Dissolved Oxygen ............................................................................................................... 33 NEWARK BAY AND TRIBUTARIES ..................................................................................................... 34 Bacteria................................................................................................................................ 34 Dissolved Oxygen ............................................................................................................... 36 ARTHUR KILL AND KILL VAN KULL................................................................................................. 37 Bacteria................................................................................................................................ 37 Dissolved Oxygen ............................................................................................................... 39
4 2006 NEW YORK-NEW JERSEY HARBOR WATER QUALITY REPORT
EXECUTIVE SUMMARY
This report was developed under the auspices of the New York-New Jersey Harbor Estuary Program (HEP), and is the collaborative effort of many partners. HEP envisions this to be the first in an annual series of water quality trend assessments for the New York-New Jersey Harbor Estuary. Long term monitoring programs, such as that of the City of New York, have documented dramatic improvements in water quality since implementation of the Clean Water Act began in the 1970s. With significant new investments in wastewater treatment and combined sewer infrastructure, it is prudent to monitor the influence of these projects on ambient water quality, and to expand the monitoring to include all of the Harbor waters. In conjunction with the monitoring and reporting contained within these pages, an assessment of pollutant load reductions that may be needed to further improve water quality in areas of the Harbor is also being undertaken under the auspices of HEP. This Water Quality Report is the first where the data from New York (collected by the New York City Department of Environmental Protection (NYCDEP)) and the data from New Jersey (collected by the New Jersey Harbor Discharges Group (NJHDG)) have been combined and analyzed together. A continued collaboration over time will offer broader insights of the quality of the water in the NY/NJ Harbor. The data analyzed for this report includes fecal coliform, Enterococcus, and dissolved oxygen. Fecal Coliform bacteria are indicators of human and other warm blooded animal wastes in surface waters, and of the possible presence of pathogenic bacteria. The trends for fecal coliform levels based on summer geometric means in the New York area of the Harbor have continued to show impressive declines between 1985 and 2006. The addition of NJHDG data in this report shows that fecal coliform levels in the New Jersey area (western) waters of the Harbor are generally higher than in the New York (eastern) waters. Overall, the fecal coliform numbers in most of the Harbor regions have either
decreased over the time period from 2004 to 2006, or have slightly increased in those cases where tributary data were incorporated in regions which previously did not include tributary data. The exception is the Newark Bay region where, since there are only three years of data, calculating an accurate trend is not yet possible. Note that fecal coliform Water Quality Standards are based on a 30 day geometric mean of five or more samples, rather than seasonal geometric means, and by a percentage of the data as compared to a target value. For all parameters presented in this report, data is collected, at most, weekly in the Harbor Regions. Therefore, direct comparisons to the actual standards is not possible. Seasonal geometric means are used in this report as a basis for understanding long term trends. Enterococcus bacteria are also indicators of pathogenic organisms from untreated human and animal wastes. The trends for the summer geometric means for Enterococcus in the Harbor show that Enterococcus bacteria numbers continue to be low and stable. Improvement is shown in some regions where individual sampling site maximum values have decreased between the years 2004 and 2006. Note that Enterococcus values are from NYCDEP data only; NJHDG initiated Enterococcus sampling in 2007. As with fecal coliform standards, Enterococcus Water Quality Standards are based on a 30 day geometric mean of five or more samples; and also on a single sample maximum. Therefore, comparison against the actual standards is not possible, but seasonal geometric means reflect long term trends. Enterococci are thought to have a greater correlation with swimming-associated gastrointestinal illness in both marine and fresh waters than other bacterial indicator organisms, and are more likely to survive for longer periods of time in saltwater. Dissolved oxygen is essential for all forms of aquatic life. The amount of oxygen that is dissolved in the water column dictates both the abundance and types of aquatic life that can survive and reproduce in a water body. Dissolved oxygen levels throughout the Harbor continued an upward trend
5 2006 NEW YORK-NEW JERSEY HARBOR WATER QUALITY REPORT
EXECUTIVE SUMMARY
from 1970 to 2006. Based on seasonal averages, the Harbor generally is well oxygenated. Low dissolved oxygen continues to be a problem in bottom waters in the Western Long Island Sound and in Grassy Bay within Jamaica Bay. In addition, the recent data from NJHDG show low dissolved oxygen in portions of the Hackensack River in both surface and bottom waters. Note that dissolved oxygen Water Quality Standards are based either on daily averages or individual sampling events, rather than seasonal averages. Seasonal averages are used in this report as the basis for illustrating long term trends.
The water quality standard values for these parameters vary between the NY and NJ State standards and also between waterbody classifications. Additionally, there have been changes to the standards from 2004 to 2006, the time frame in which these data were collected. For the sake of consistency we compared all of the data to “Best Use” Standards. These classifications and standards are for reference use only, and are not intended to indicate compliance status or to set policy.
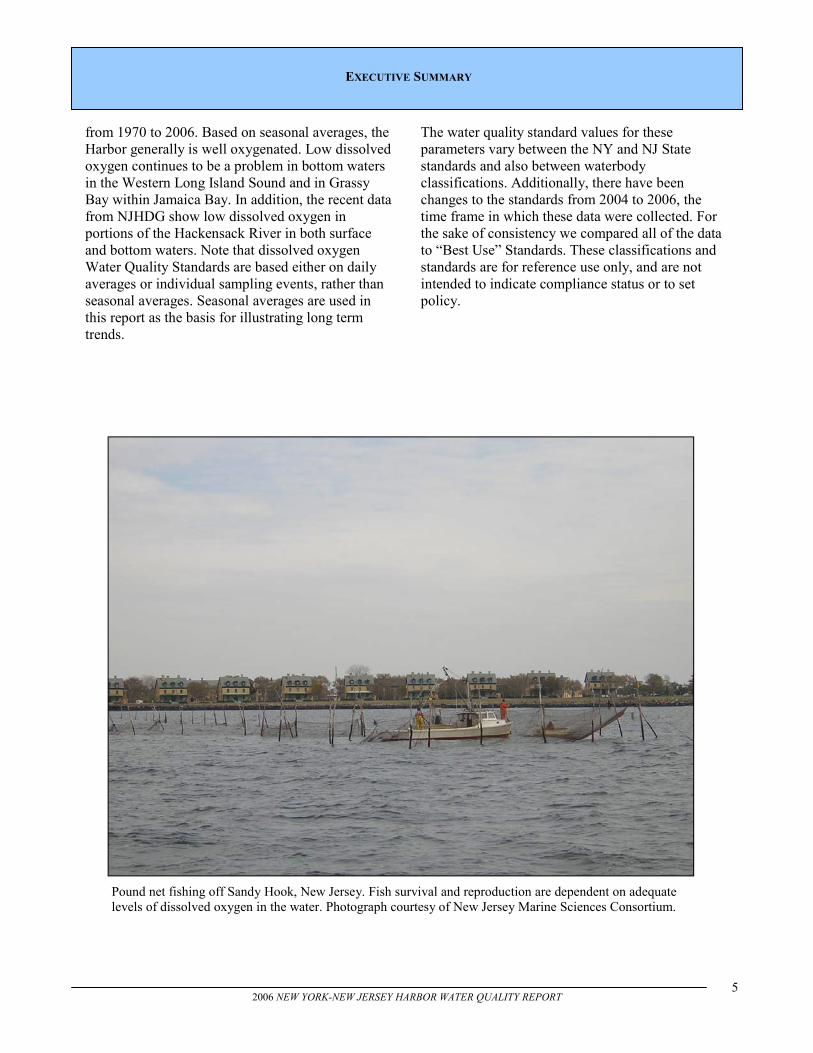
Pound net fishing off Sandy Hook, New Jersey. Fish survival and reproduction are dependent on adequate levels of dissolved oxygen in the water. Photograph courtesy of New Jersey Marine Sciences Consortium.
6 2006 NEW YORK-NEW JERSEY HARBOR WATER QUALITY REPORT
INTRODUCTION
The NY-NJ Harbor Estuary is a bi-state water-body of great importance to the well-being and economy of the 14 million people that live in close proximity to the Harbor. As the population of the region grew over the past two hundred years, the water quality of the estuary which surrounds the region began to suffer. Though great improvements in water quality resulted from the passage and implementation of the federal Clean Water Act in the 1970s, documentation of water quality trends were lacking for portions of the Harbor. Fortunately, the City of New York has been col-lecting water quality information for the New York portion of the New York/New Jersey Harbor (the Harbor) for nearly 100 years. Over that time period the monitoring program in New York has been expanded and refined to reflect the City’s commitment to monitoring and improving water quality in the Harbor and the associated tributaries. In 1992 the New Jersey Harbor Dischargers Group was formed by the sewerage authorities which are responsible for the Publicly Owned Treatment Works (POTWs) discharging into the New Jersey portion of the Harbor and tributaries to the Harbor. The Group was formed to provide a unified voice from the POTW community in the arena of water quality improvement and regulatory development for the New Jersey portion of the Harbor. After a series of meetings coordinated by HEP and the IEC, the Group developed a long-term water quality monitoring program in 2003 for the New Jersey waters of the Harbor that was consistent with the City of New York’s monitoring approach. Sampling was initiated in late 2003, and the Group plans to continue the program for the foreseeable future. The parameters that are being monitored by New York City and NJHDG include fecal coliform bacteria, Enterococcus bacteria, dissolved oxygen (DO), temperature, salinity, pH, total suspended solids, carbonaceous biological oxygen demand (CBOD), dissolved organic carbon, nitrogen and phosphorus compounds, transparency (Secchi depth) and chlorophyll-a. All of these parameters have important implications regarding the overall water quality of the Harbor and the associated tributaries. This report is focused on three of those parameters: fecal coliform bacteria, Enterococcus bacteria and DO. These parameters are being featured in this report because the bacterial indicators have the most
direct impact on the recreational uses of the Harbor waters, whereas adequate DO is critical to the survival, growth and reproduction of fish and other aquatic life. The purpose of this report is to present the bacterial and DO information for the Harbor as a whole, and for the principal geographic Regions of the Harbor. It is the intention of the New York-New Jersey Harbor Estuary Program (HEP) Office, and all its partners to produce a series of integrated (New York and New Jersey) water quality reports for the Harbor and its tributaries. Because this is the first of a series of anticipated reports involving data generated by NJHDG, in certain areas of the Harbor there are limited trend data to report. However, as more data are accumulated, it will be possible to evaluate and report water quality trends over multi-year time frames throughout the Harbor. The water use classifications and standards for interstate and shared waters vary. To provide a standardized view of the water quality data, comparisons are made to the highest potential use across the Regions (on trend graphs); and each of the potential standards (in the text). The water quality standard values for these parameters vary between the NY and NJ state standards and also between waterbody classifications. Additionally, there have been changes to the standards from 2004 to 2006, the time frame these data were collected. Prior to October 2006, waters classified as SE1 and FW2 had water quality standards based on fecal coliform concentrations. The current standards for these waterbody classes are based on different bacteria as indicator organisms (Enterococcus for SE1 waters, and E. coli for FW2 waters). NJHDG has not yet implemented testing for E. coli. For the sake of consistency we compared all of the data to “Best Use” Standards (fecal coliform: 30-day geometric mean ≤200 CFU/100mL; Enterococci: 30-day geometric mean ≤35 CFU/100ml; dissolved oxygen: DO ≥/= 5.0 mg/L). These classifications and standards are for reference use only, and are not intended to indicate compliance status or to set policy.
7 2006 NEW YORK-NEW JERSEY HARBOR WATER QUALITY REPORT
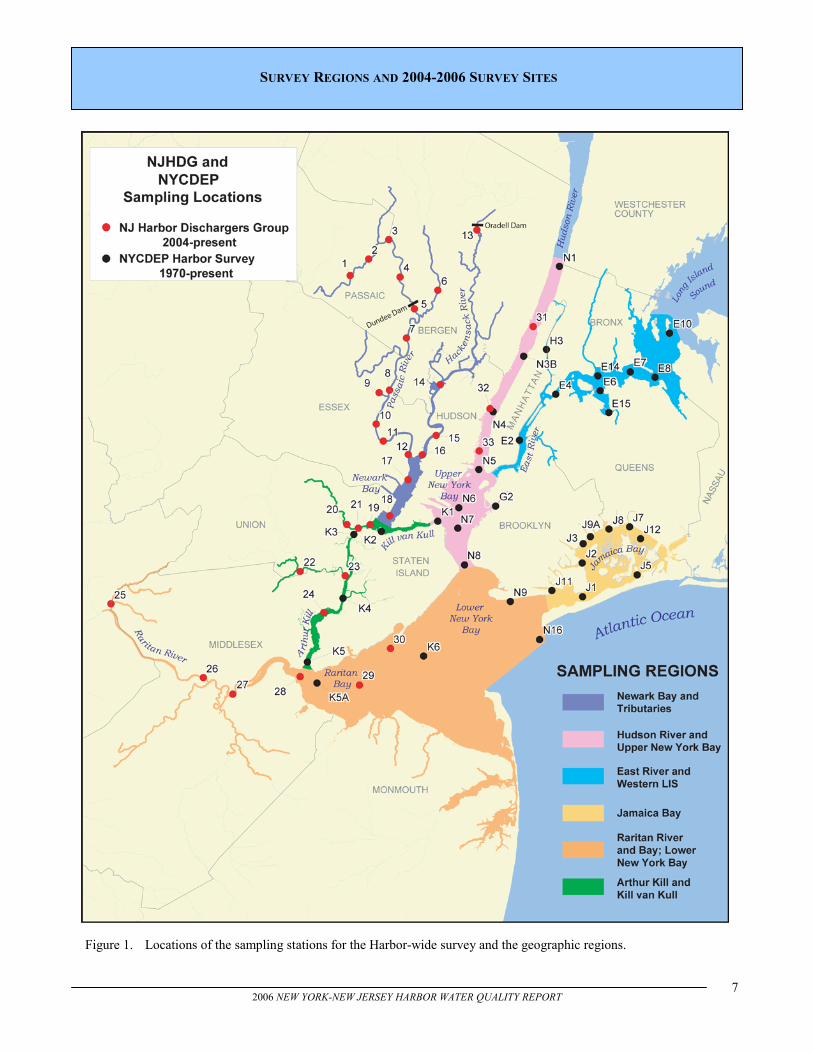
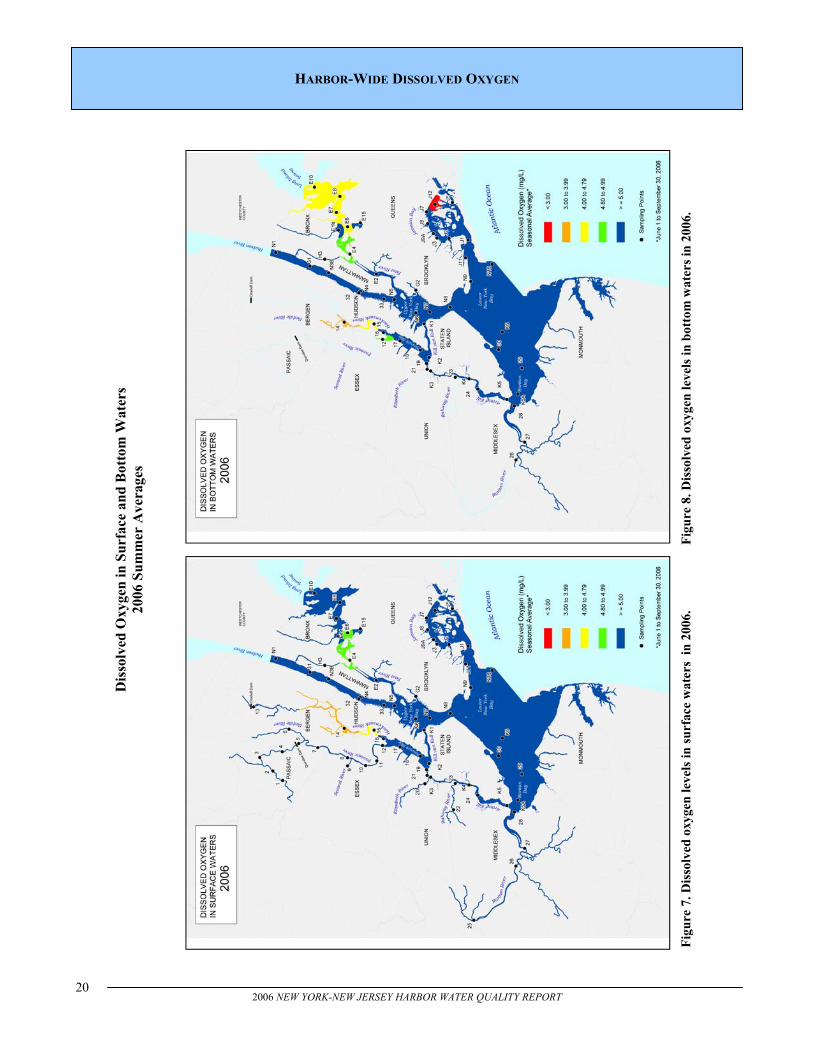
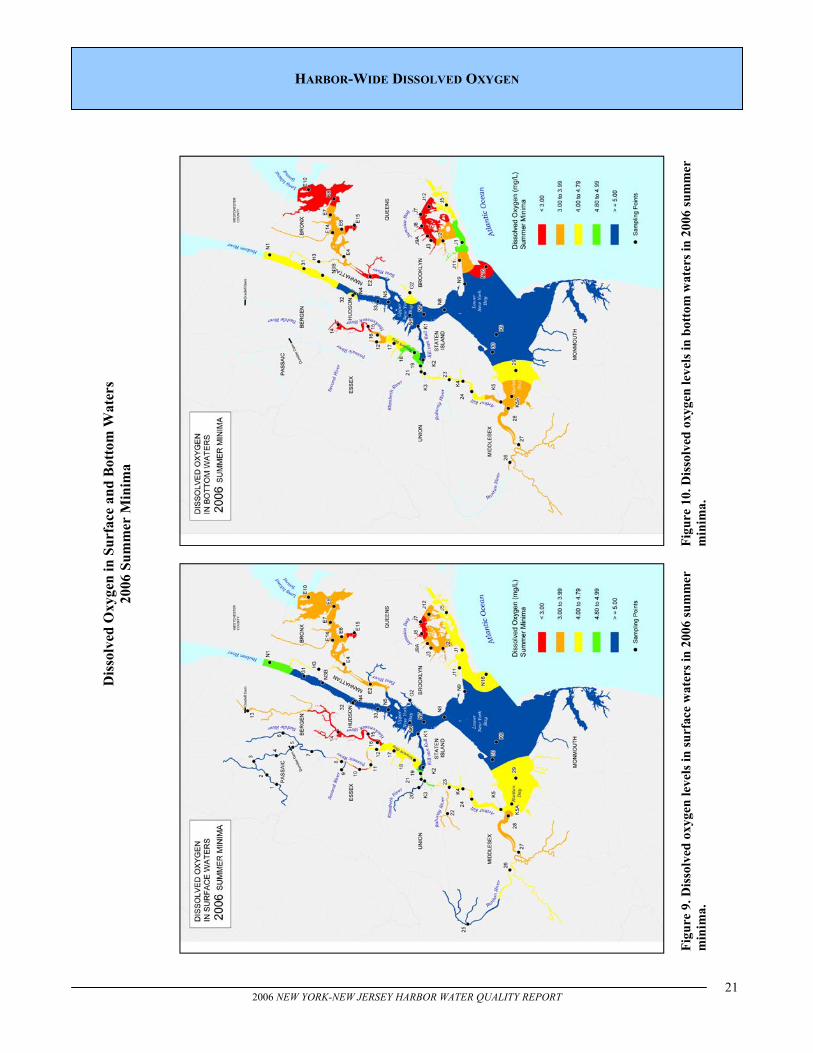
Figure 1. Locations of the sampling stations for the Harbor-wide survey and the geographic regions.
SURVEY REGIONS AND 2004-2006 SURVEY SITES
8 2006 NEW YORK-NEW JERSEY HARBOR WATER QUALITY REPORT
While many water quality parameters are important to accurately understand the overall condition of the Harbor and associated biota, this report is focusing on the parameters that are measured by the Harbor-wide survey. These parameters, dissolved oxygen, fecal coliform bacteria, and Enterococcus bacteria, are important to the health of biota living in the estuary, as well as to human use of the estuary for activities such as shellfishing and swimming. Other programs, such as the Contaminant Assessment and Reduction Project (CARP) and the Regional Monitoring and Assessment Program (REMAP) have collected information on toxic contaminants, which is presented elsewhere. As noted in Figures 2 and 3, the specific water quality standards vary throughout the Harbor according to how the states classify those waters. For example, those areas designated for shellfishing and bathing have the most stringent standards, whereas areas designated for fish survival have the least stringent. See Tables 1 and 2 for more detail. Dissolved Oxygen (DO)—Dissolved oxygen is essential for all forms of aquatic life. The amount of oxygen that is dissolved in the water column dictates both the abundance and types of aquatic life that can survive and reproduce in a water body. It is important to recognize that in most inshore marine waters (like the Harbor), the concentration of DO varies according to the time of day, tidal cycle, season and depth. Thus, each of these factors influence DO concentrations and the presence (or absence) and abundance of individual species. For the above reasons, the range of DO concentrations in a water body is commonly considered to be one of the key parameters that define the quality of a waterbody, and the species that reside in and pass through the waterbody. Fecal Coliform Bacteria—Fecal coliform bacteria are indicators of human and other animal wastes in surface waters, and the possible presence of pathogenic (disease-producing) bacteria.
Enterococcus Bacteria—Enterococcus bacteria are also indicators of pathogenic organisms from untreated sewage. Enterococcus bacteria are commonly found in the feces of humans and other warm-blooded animals. Although some strains are ubiquitous and not related to fecal pollution, their presence in water is an indication of fecal pollution and the possible presence of enteric pathogens. Enterococcus bacteria are much like coliform bacteria, but are thought to have a greater correlation with swimming-associated illnesses and are more likely to survive in highly saline waters. The Enterococcus bacteria data in this report reflect only data gathered by NYCDEP. NJHDG began certified testing of Enterococcus samples in 2007. Sampling—Sampling locations were identified using latitude and longitude coordinates. Grab samples were taken approximately once per week during the summer season. The bacterial standards are based on five samples in a 30 day period. One sample weekly, as is the case here, is not sufficient to make true comparisons between the data and the standards. These parameters may show variation in the water column. Shallow/flowing waters are usually well mixed. Still/deep waters usually have poorly mixed layers. For this reason samples were taken at both surface and bottom levels in the deeper regions, and at mid-depth in shallower waters . Deep water sites were accessed by boat, and water samples were collected one meter from the substrate (bottom samples) and one meter below the surface (surface samples). Shallow-water sites were sampled at mid-depth from the middle of the river channel and were accessed from bridges. Tidal conditions were not noted during sampling. For any further details reference the NJHDG Quality Assurance Project Plan.
MEASURED WATER QUALITY PARAMETERS
9 2006 NEW YORK-NEW JERSEY HARBOR WATER QUALITY REPORT
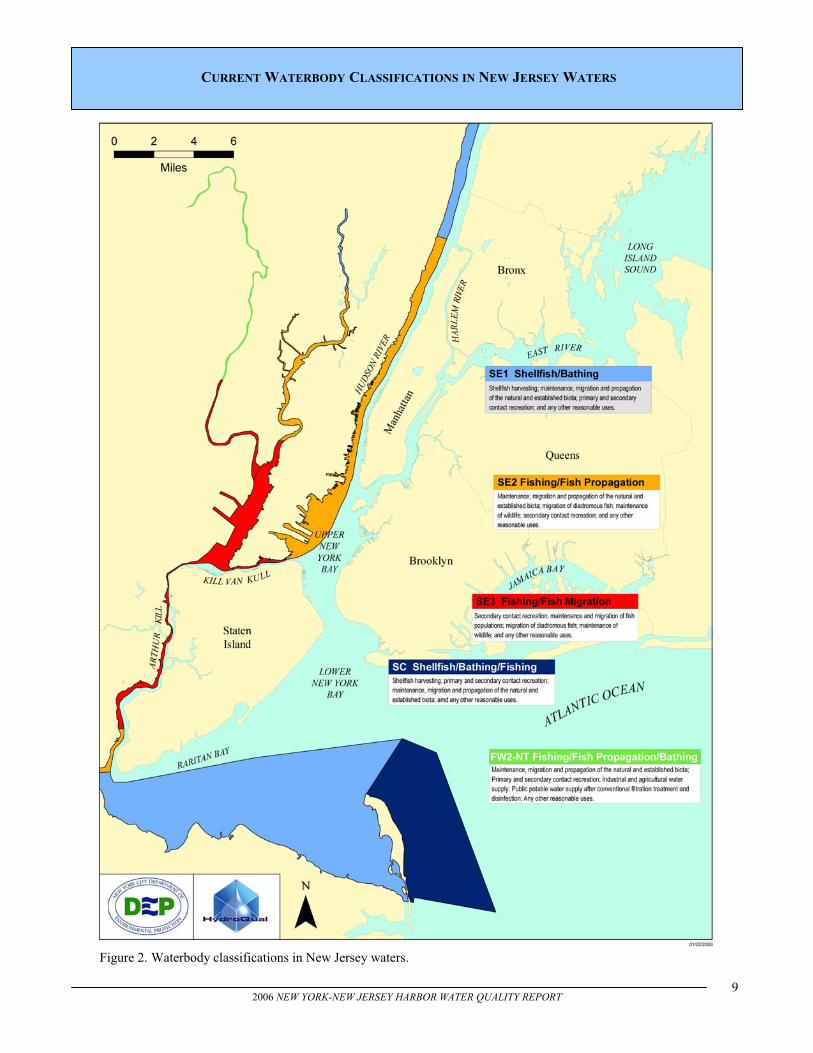
Figure 2. Waterbody classifications in New Jersey waters.
CURRENT WATERBODY CLASSIFICATIONS IN NEW JERSEY WATERS
10 2006 NEW YORK-NEW JERSEY HARBOR WATER QUALITY REPORT
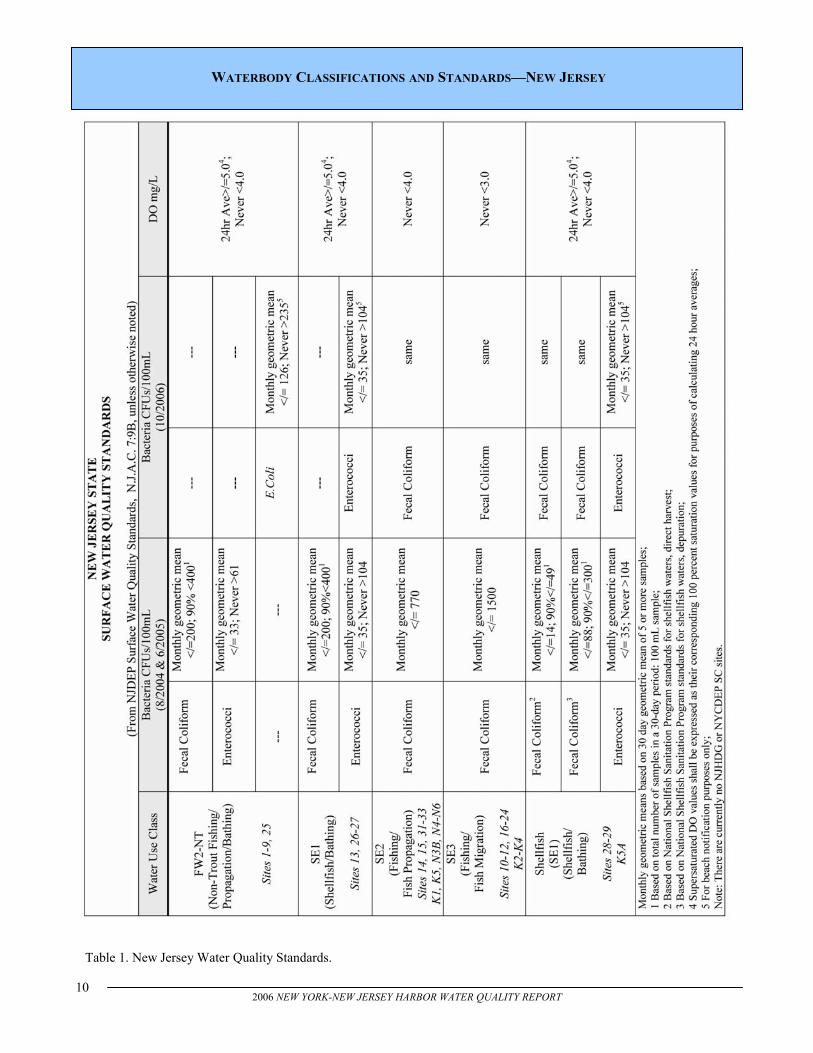
WATERBODY CLASSIFICATIONS AND STANDARDS—NEW JERSEY
Table 1. New Jersey Water Quality Standards.
11 2006 NEW YORK-NEW JERSEY HARBOR WATER QUALITY REPORT
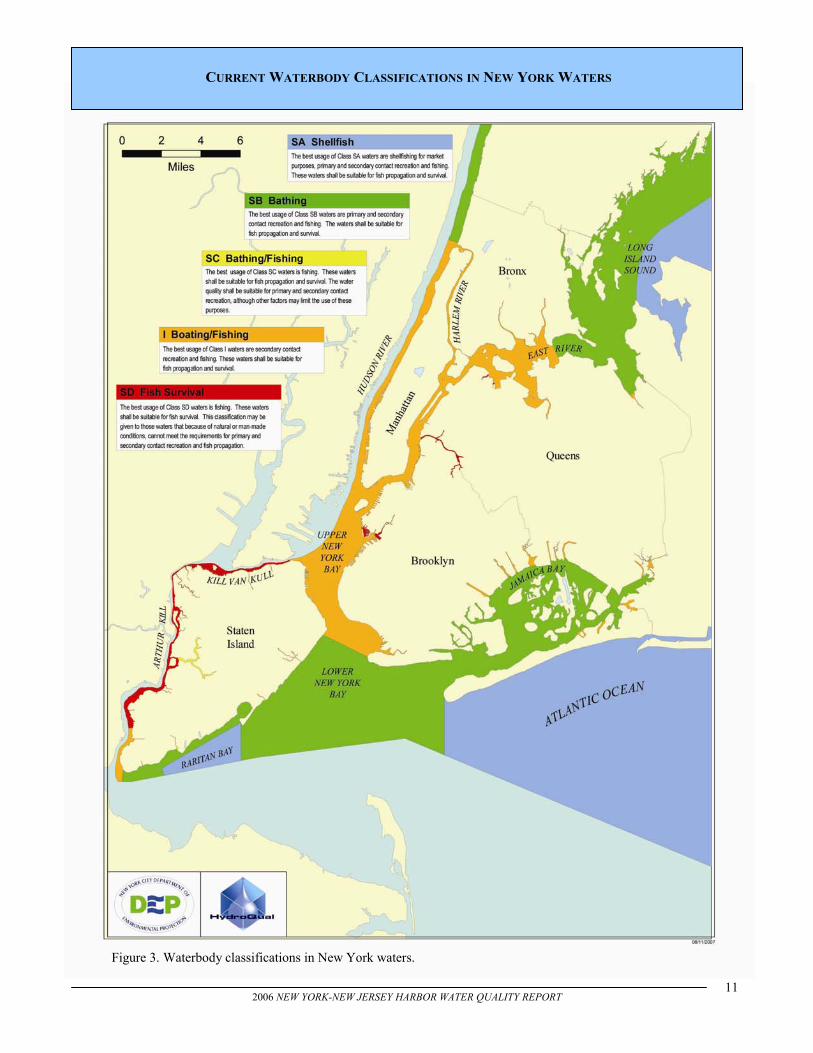
CURRENT WATERBODY CLASSIFICATIONS IN NEW YORK WATERS
Figure 3. Waterbody classifications in New York waters.
12 2006 NEW YORK-NEW JERSEY HARBOR WATER QUALITY REPORT
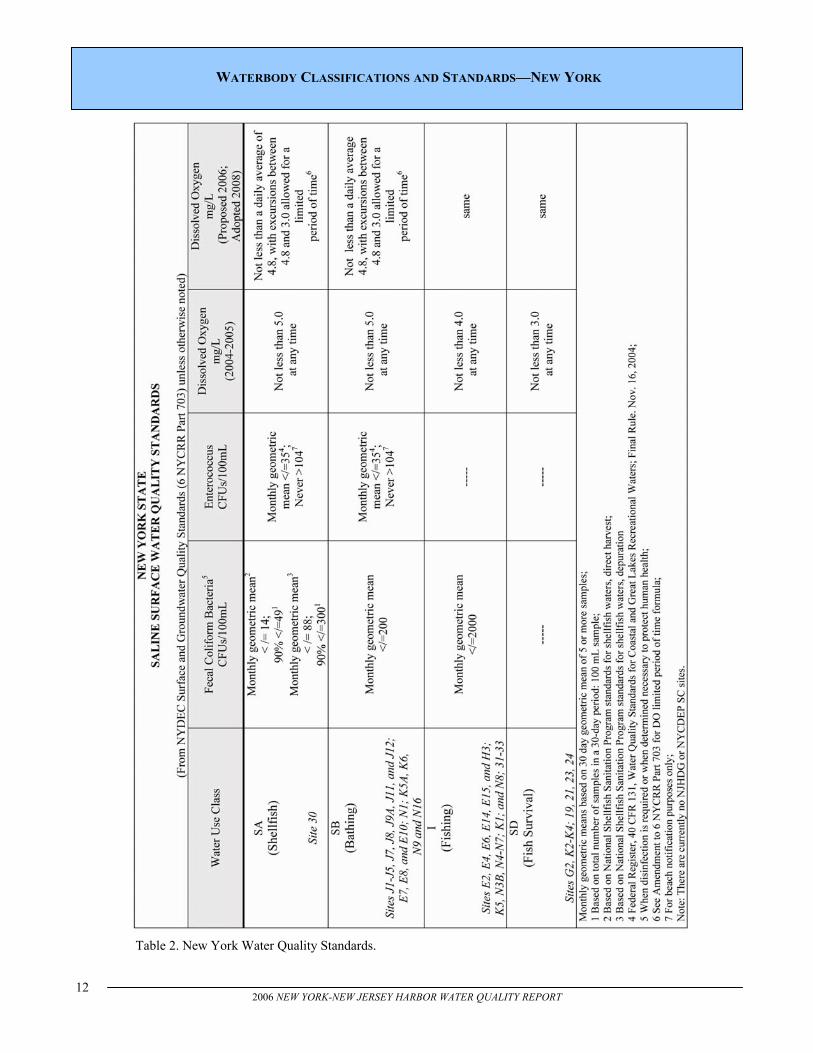
WATERBODY CLASSIFICATIONS AND STANDARDS—NEW YORK
Table 2. New York Water Quality Standards.
13 2006 NEW YORK-NEW JERSEY HARBOR WATER QUALITY REPORT
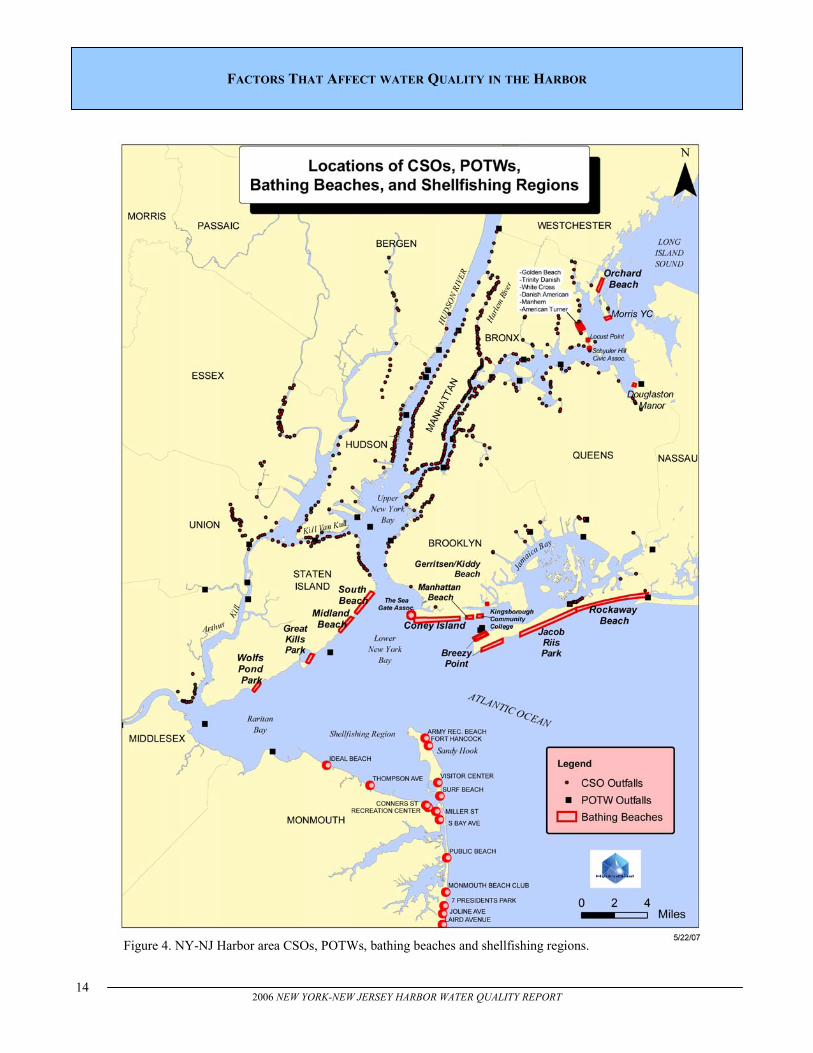
The most commonly recognized point source discharges to the Harbor are the wastewater treatment plants or Publicly Owned Treatment Works (POTWs), 14 of which are in New York City, and 12 of which are in New Jersey. In addition to POTW point source discharges to the Harbor, there are combined sewer overflow (CSO) discharge pipes and stormwater outfalls (SWOs) discharges (discussed below). See Figure 4. New York City’s 14 POTWs treat the industrial, commercial and residential sewage from the City. The infrastructure includes over 6,000 miles of collection system pipes, 130,000 catch basins, and 5,000 seepage basins. The total amount of sewage treated is over 1,000 million gallons per day (MGD). In contrast to New York where there is a single municipal authority responsible for the
POTWs, there are 12 New Jersey POTWs discharging to the Harbor, collectively treating 500 MGD of residential and industrial/commercial sewage from 175 separate communities in the vicinity of the Harbor. All of the wastewater treated by each of these New York and New Jersey POTWs receives both primary and secondary treatment. Primary treatment refers to the removal of coarse material by screening and settling, while secondary treatment refers to the biological and chemical removal of organic matter, followed by final clarification. Finally the wastewater is disinfected with chlorine to remove pathogenic bacteria before being discharged to the Harbor.
POINT SOURCES OF POLLUTION
CSOS/SWOS
There are two basic types of sewer systems that are used to accommodate wet weather flows: combined sewer systems and separate sewer systems. In the case of combined sewer systems, rainfall and/or snowmelt combined with sanitary flows may exceed the capacity of either the sewer pipes or the POTWs (or both). In order to prevent flooding in streets and houses and operational problems at the treatment plants, combined sewer systems are designed to release the excess wet weather flows to the Harbor waters through CSOs.
In both New York and New Jersey, programs are in place to reduce the abundance of floatable materials discharged from CSOs. In New York City, 70-80 percent of the sewer system was built as a combined system. Among the NJHDG members, the PVSC, BCUA, North Bergen and MCUA systems were designed as either entirely or partially combined sewer systems.
FACTORS THAT AFFECT WATER QUALITY IN THE HARBOR
POTWs
14 2006 NEW YORK-NEW JERSEY HARBOR WATER QUALITY REPORT
FACTORS THAT AFFECT WATER QUALITY IN THE HARBOR
Figure 4. NY-NJ Harbor area CSOs, POTWs, bathing beaches and shellfishing regions.
15 2006 NEW YORK-NEW JERSEY HARBOR WATER QUALITY REPORT
Non-point source pollutants enter the Harbor via diffuse sources (other than discharge pipes) during rainfall and snowmelt events. Residential and commercial properties, roadways and parking lots, agricultural operations, faulty septic systems, construction sites and direct deposition from the atmosphere are all examples of the broad source category referred to as non-point source pollution. Fine and coarse grained sediments, fertilizers, pathogens (bacteria and viruses), salt, oils and grease, high molecular weight organic compounds and heavy metals are widely-recognized as non-point source pollutants.
Many of the pollutants that enter the Harbor as non-point source pollutants originally are transported to the watershed of the Harbor via atmospheric deposition (both wet and dry). Some of these pollutants are from Regional sources, while others are deposited as a consequence of long-range transport.
In contrast to combined sewer systems, separate sewer systems are designed to address wet weather flows by segregating the sanitary and wet weather flows. Thus, when it is raining and/or snow is melting, the stormwater flows are collected in a series of separate sewer lines (which are the responsibility of the municipalities), and discharged directly to the waters of the Harbor through SWOs. Therefore, the sanitary flows to the POTWs remain largely unaffected (except for infiltration) during wet weather events. The entirely separate sewer systems in New Jersey include Linden-Roselle, Rahway Valley, Joint Meeting, North Hudson, Edgewater, Secaucus and West New York. CSO and SWO discharges contain a substantial portion of stormwater, and can convey large quantities of floatable materials into the Harbor waters. Floatable debris, which can contribute to beach closures, can also interfere with navigation, have a negative affect on the well being of wildlife, and is aesthetically undesirable. All New Jersey
CSO permittees must capture and remove solids/floatables which cannot pass through a one-half inch bar screen. In the NY/NJ Harbor Estuary Complex, 83% of New Jersey’s CSOs have long-term CSO solids/floatable control measures constructed and operational. To help measure the effectiveness of the multiple control programs and to target improvements to priority waterbodies, New York City is implementing a Harbor-wide floatables monitoring program, which complements the City’s longstanding street litter cleanliness rating system to track landside debris. Finally, the City conducts multiple public education programs and clean up programs that address floatables control. Both CSOs and SWOs contribute to increased pathogen concentrations in the Harbor during and after wet weather events. The States of both New York and New Jersey have programs in place to decrease the impacts of CSOs on water quality throughout the Harbor.
NON-POINT SOURCES OF POLLUTION
FACTORS THAT AFFECT WATER QUALITY IN THE HARBOR
16 2006 NEW YORK-NEW JERSEY HARBOR WATER QUALITY REPORT
A PROGRAM TO EVALUATE AND IMPROVE WATER QUALITY IN THE HARBOR
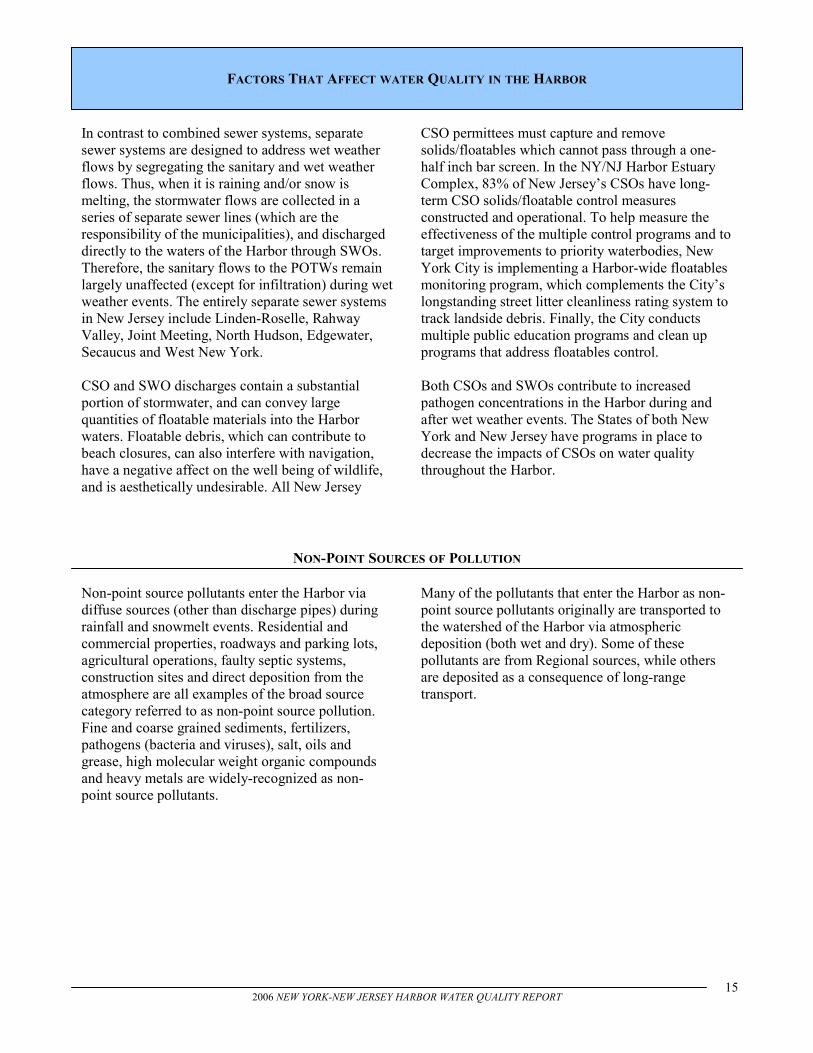
The New York/New Jersey Harbor Estuary Program (HEP), EPA Region II, and the States of New Jersey and New York, are in the process of implementing a comprehensive program to assess and improve water quality throughout the Harbor. The program is a component of a national effort to comply with the “fishable/swimmable” goal of the federal Clean Water Act. In an effort to achieve that goal, EPA, the states, dischargers and other stakeholders, under the auspices of HEP, are in the process of developing “total maximum daily loads” (TMDLs) for pathogens (bacteria), oxygen-demanding substances (nutrients and organic matter) and toxics. This process is being coordinated through multi-stakeholder work groups for pathogens, nutrients, and toxics. In order to develop the total maximum daily loads for the various substances, a series of computer-based water quality models has been developed. These predictive water quality models, which are state-of-the-art mathematical models, take into consideration the existing water and sediment quality characteristics, as well as the current and
anticipated future point and non-point source discharges to the Harbor to determine the types and magnitudes of pollutant load reductions that will be required to achieve state water quality standards. Currently the Pathogens, Nutrients and Toxics Work Groups are evaluating the model products, and will ultimately be responsible for determining the pollutant load reduction goals that will be implemented through the New York and New Jersey National Pollutant Discharge Elimination System (NPDES) permitting programs. The TMDL development process is scheduled to be completed by the end of 2008, and corresponding NPDES permit provisions will be developed by the states soon thereafter. The data in this report is not currently used in modeling. At this time, it is only being used to assess long-term water quality trends.
Oyster restoration in the Navesink River, NJ. Good water quality is key to healthy shellfish populations. Photo courtesy of New York-New Jersey Baykeeper.
17 2006 NEW YORK-NEW JERSEY HARBOR WATER QUALITY REPORT
HARBOR-WIDE WATER QUALITY TRENDS
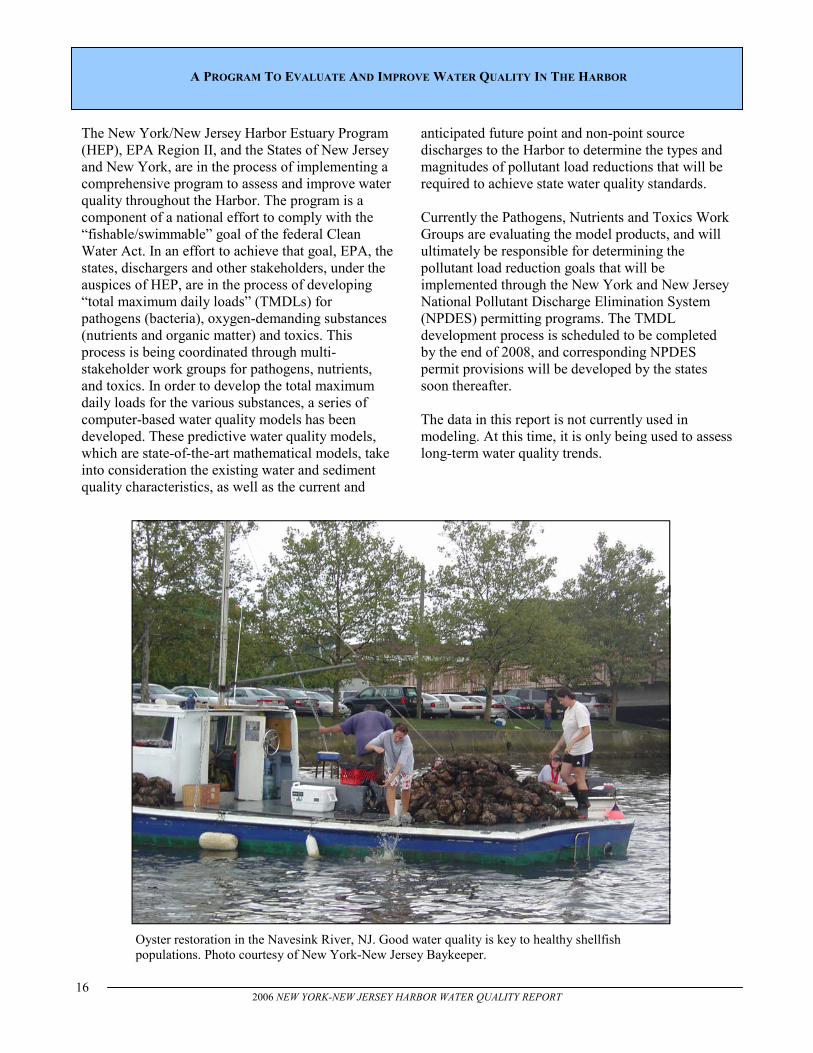
Geometric means of fecal coliform samples collected during summer months improved dramatically between 1985 (Figure 5) and 2006 (Figure 6) for the New York area of the Harbor (see maps below). As shown in the Harbor-wide 2006 fecal coliform map, the New Jersey area (western waters) of the Harbor generally has somewhat higher bacteria levels than is the case for the New York (eastern) waters, particularly in the tributaries. Since there are only 2004-2006 data for the New Jersey portion of the Harbor, it is not feasible to evaluate historical
trends in the New Jersey waters. However, the NJHDG water quality monitoring program is ongoing, and future data will provide for long term trend analyses of water quality for the entire NY/NJ Harbor. It is interesting to note that the two sites with the highest fecal coliform concentrations (Second River and Saddle River) are in areas with separate sewer systems, and therefore are not under the influence of wet weather discharges from combined sewer overflows.
Figure 5. Map of Harbor-wide Fecal Coliform 19851
Figure 6. Map of Harbor-wide Fecal Coliform 20061
HARBOR-WIDE BACTERIA
1The 1985 data is from NYDEP only; 2006 data is combined from both NYDEP and NJHDG. Figures 5 and 6 represent surface sampling data.
18 2006 NEW YORK-NEW JERSEY HARBOR WATER QUALITY REPORT
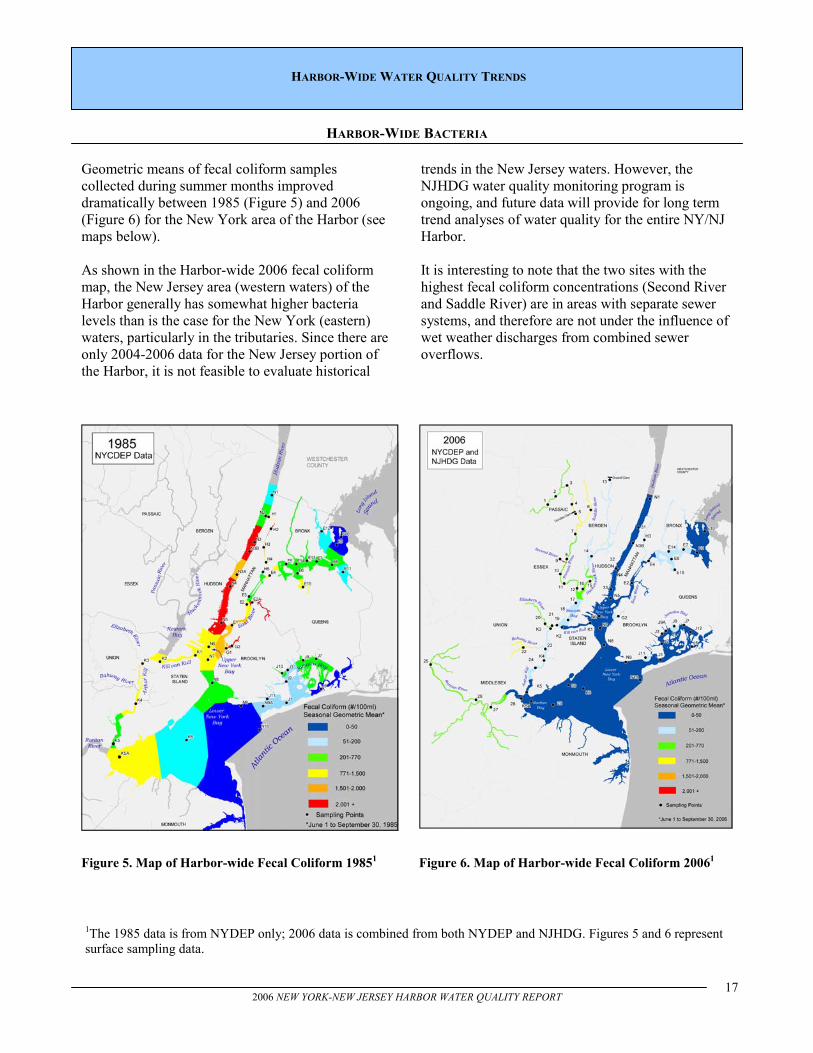
The average 2004 through 2006 Harbor-wide bacterial results (from both NYCDEP and NJHDG) were low in relation to most of the water quality standards, and showed modest fluctuations from year-to-year. The bacteria results, reported in colony forming units (CFUs), are the geometric means of the summer season data (June 1 through September 30). Samples were grab samples taken approximately one sample weekly throughout the season. In exploring temperature and precipitation trends in the Harbor area, no reason is apparent at this time for the higher fecal coliform concentrations that occurred in 2006. See Table 3 below.
Harbor-wide Fecal Coliform, Enterococcus Bacteria, and Precipitation 2004 2005 2006
Fecal Coliform (CFUs/100mL)1 107 48 106
Enterococcus Bacteria (CFUs/100mL)2 6 3 6
Harbor Annual Precipitation (inches)3 32.8 36.9 59.4 1Combined NYCDEP and NJHDG data; 2 NYCDEP data; 3PVSC precipitation data
HARBOR-WIDE BACTERIA
Table 3. Comparison data for bacteria and precipitation.
Swimming in the Hudson River off Manhattan. Primary contact recreation, such as swimming, relies on good water quality, especially low levels of bacteria. Photo courtesy of the Manhattan Island Foundation.
19 2006 NEW YORK-NEW JERSEY HARBOR WATER QUALITY REPORT
HARBOR-WIDE DISSOLVED OXYGEN
Table 4. Comparison data for surface and bottom DO for 2004, 2005 and 2006 summer seasons.
Harbor-wide* Surface and Bottom Dissolved Oxygen 2004 2005 2006 DO Surface (mg/L) 6.43 6.42 6.77 DO Bottom (mg/L) 5.50 5.58 5.88 *Combined NYCDEP and NJHDG data; arithmetic means from Jun 1 – Sept 30
Dissolved oxygen levels in the Harbor were reasonably consistent throughout the 2004 - 2006 monitoring period. Areas of lowest DO in the Harbor were observed in the Upper East River/Western Long Island Sound Region, Jamaica Bay, and the Hackensack River, a tributary to Newark Bay. Grab samples were taken approximately one sample weekly throughout the summer season (June 1 through September 30). Figures 7 and 8 show 2006 average summer levels for surface and bottom dissolved oxygen. Figures 9 and 10 show surface and bottom dissolved oxygen summer minima levels for 2006.
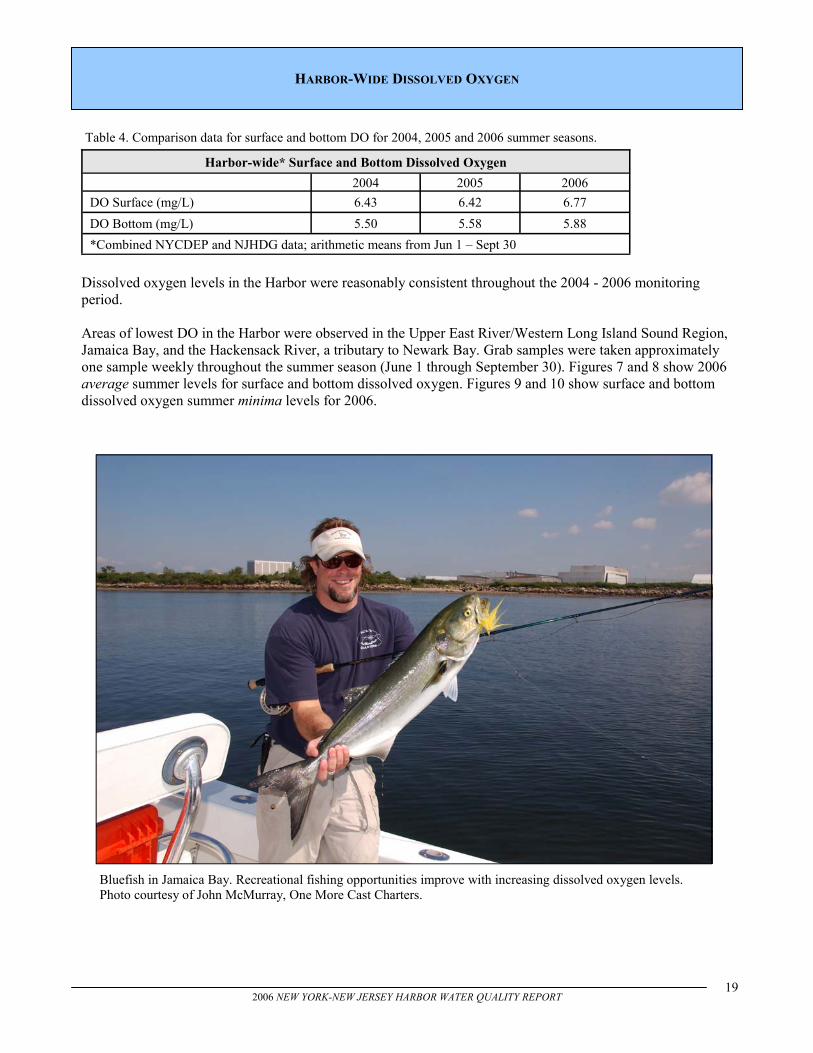
Bluefish in Jamaica Bay. Recreational fishing opportunities improve with increasing dissolved oxygen levels. Photo courtesy of John McMurray, One More Cast Charters.
20 2006 NEW YORK-NEW JERSEY HARBOR WATER QUALITY REPORT
Dis
solv
ed O
xyge
n in
Sur
face
and
Bot
tom
Wat
ers
2006
Sum
mer
Ave
rage
s
HARBOR-WIDE DISSOLVED OXYGEN
Figu
re 7
. Dis
solv
ed o
xyge
n le
vels
in su
rfac
e w
ater
s in
200
6.
Fi
gure
8. D
isso
lved
oxy
gen
leve
ls in
bot
tom
wat
ers i
n 20
06.
21 2006 NEW YORK-NEW JERSEY HARBOR WATER QUALITY REPORT
Dis
solv
ed O
xyge
n in
Sur
face
and
Bot
tom
Wat
ers
2006
Sum
mer
Min
ima
HARBOR-WIDE DISSOLVED OXYGEN
Figu
re 9
. Dis
solv
ed o
xyge
n le
vels
in su
rfac
e w
ater
s in
2006
sum
mer
m
inim
a.
Figu
re 1
0. D
isso
lved
oxy
gen
leve
ls in
bot
tom
wat
ers i
n 20
06 su
mm
er
min
ima.
22 2006 NEW YORK-NEW JERSEY HARBOR WATER QUALITY REPORT
The maps and graphs in this section of the report represent a combination of NJHDG and NYCDEP data, except for Enterococcus bacteria, where only NYCDEP data are presented (NJHDG initiated Enterococcus sampling in 2007).
Jamaica Bay is located at the southwestern end of Long Island. This urban, estuarine embayment and national park consists primarily of tidal wetlands, upland areas and approximately 20 square miles of open waters. The Bay and its drainage area are almost entirely within the boroughs of Brooklyn and Queens, except for a small area at the eastern end that is in Nassau County. Jamaica Bay joins the New York Harbor to the west via the Rockaway Inlet at the tip of Breezy Point. The Bay includes the Rockaway Peninsula, which forms the southern limit of the Bay, and separates Jamaica Bay from the Atlantic Ocean.
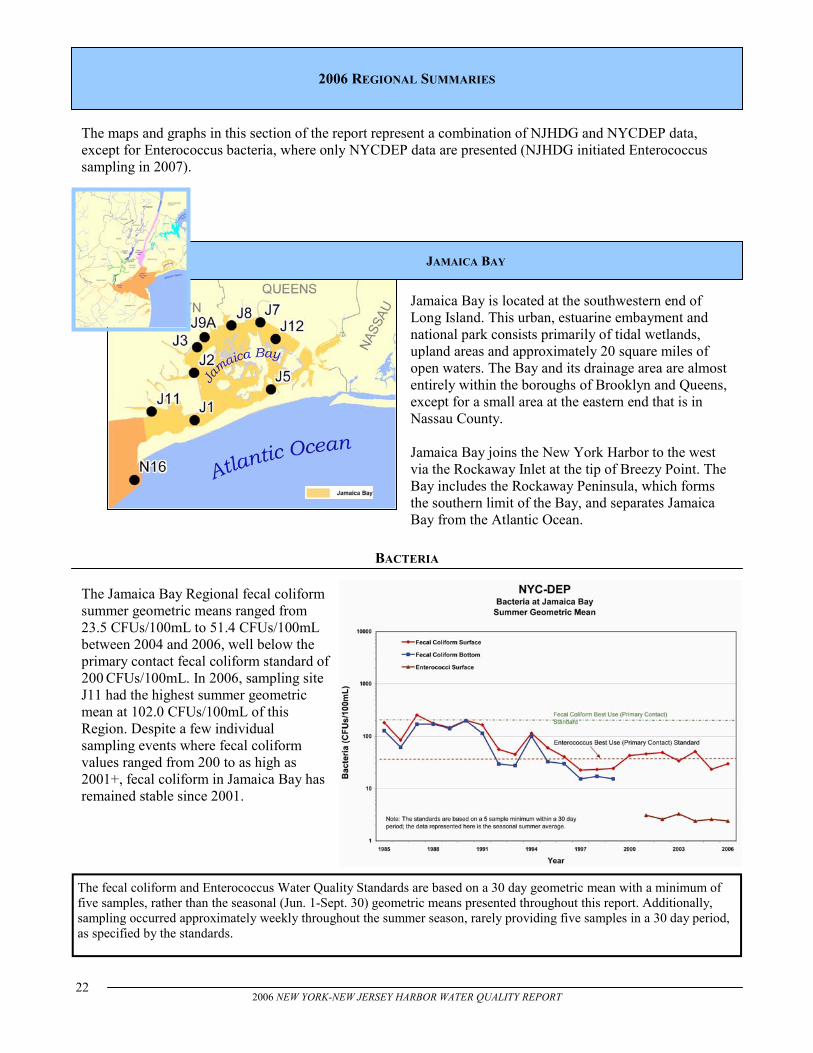
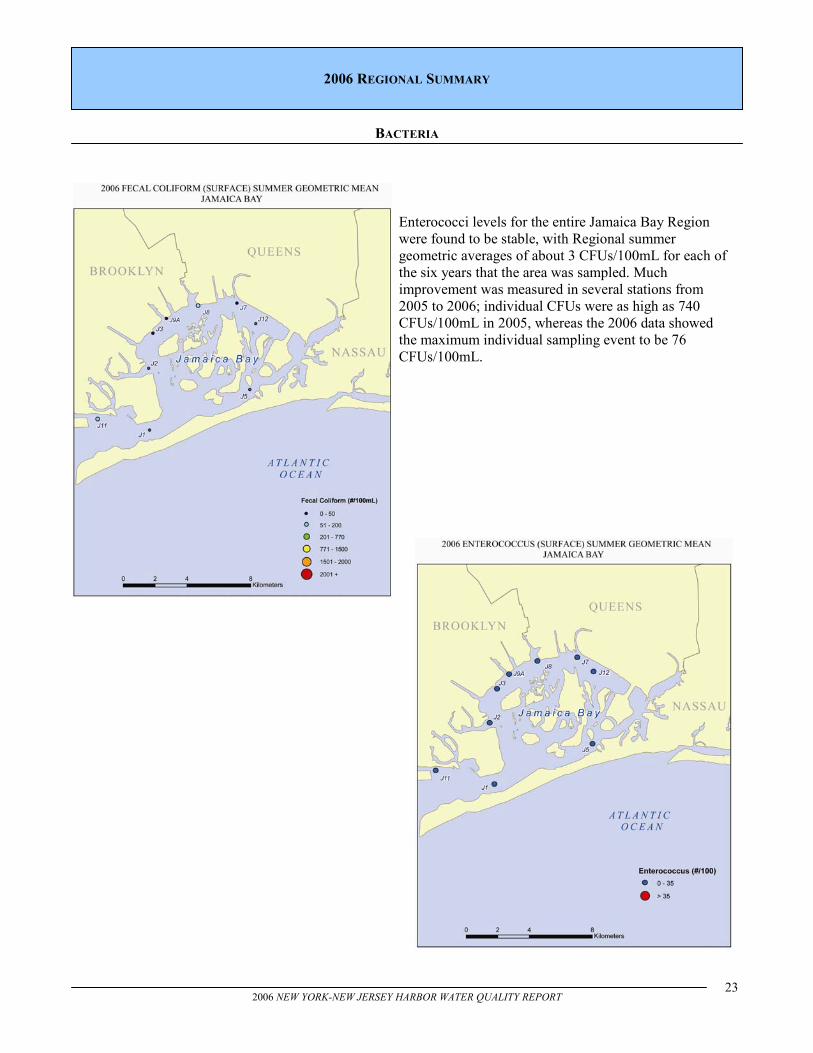
The Jamaica Bay Regional fecal coliform summer geometric means ranged from 23.5 CFUs/100mL to 51.4 CFUs/100mL between 2004 and 2006, well below the primary contact fecal coliform standard of 200 CFUs/100mL. In 2006, sampling site J11 had the highest summer geometric mean at 102.0 CFUs/100mL of this Region. Despite a few individual sampling events where fecal coliform values ranged from 200 to as high as 2001+, fecal coliform in Jamaica Bay has remained stable since 2001.
BACTERIA
2006 REGIONAL SUMMARIES
The fecal coliform and Enterococcus Water Quality Standards are based on a 30 day geometric mean with a minimum of five samples, rather than the seasonal (Jun. 1-Sept. 30) geometric means presented throughout this report. Additionally, sampling occurred approximately weekly throughout the summer season, rarely providing five samples in a 30 day period, as specified by the standards.
JAMAICA BAY
23 2006 NEW YORK-NEW JERSEY HARBOR WATER QUALITY REPORT
BACTERIA
Enterococci levels for the entire Jamaica Bay Region were found to be stable, with Regional summer geometric averages of about 3 CFUs/100mL for each of the six years that the area was sampled. Much improvement was measured in several stations from 2005 to 2006; individual CFUs were as high as 740 CFUs/100mL in 2005, whereas the 2006 data showed the maximum individual sampling event to be 76 CFUs/100mL.
2006 REGIONAL SUMMARY
24 2006 NEW YORK-NEW JERSEY HARBOR WATER QUALITY REPORT
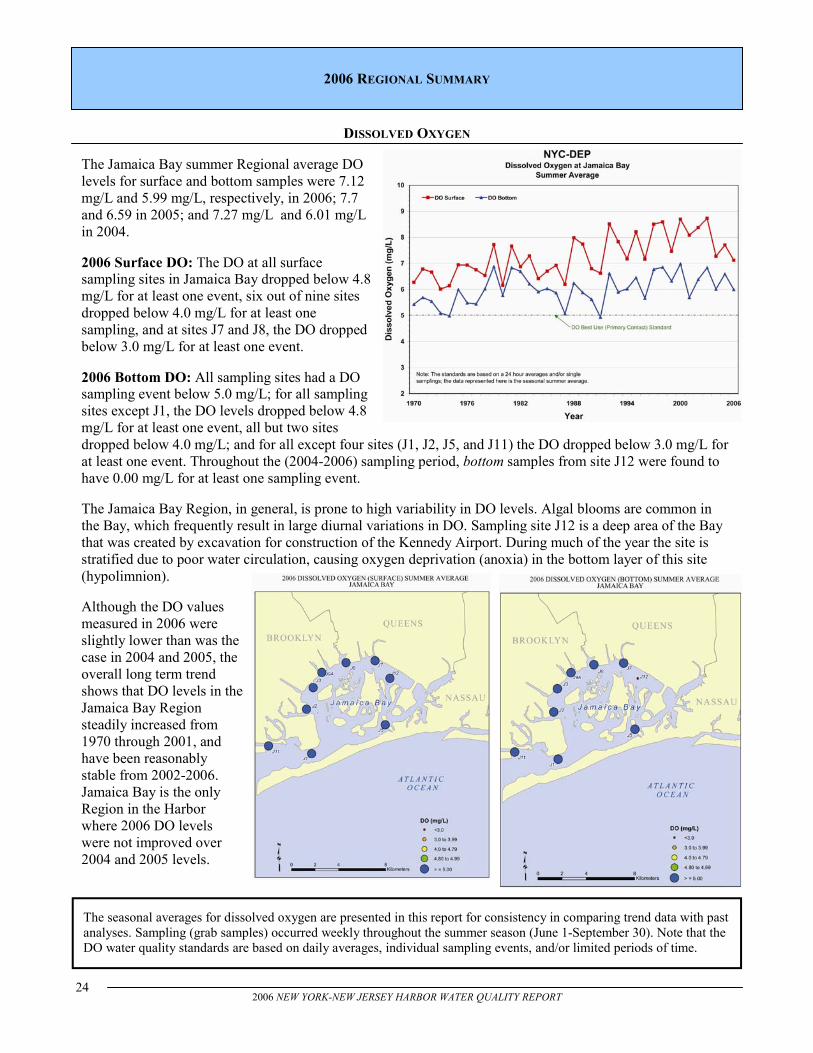
The Jamaica Bay summer Regional average DO levels for surface and bottom samples were 7.12 mg/L and 5.99 mg/L, respectively, in 2006; 7.7 and 6.59 in 2005; and 7.27 mg/L and 6.01 mg/L in 2004. 2006 Surface DO: The DO at all surface sampling sites in Jamaica Bay dropped below 4.8 mg/L for at least one event, six out of nine sites dropped below 4.0 mg/L for at least one sampling, and at sites J7 and J8, the DO dropped below 3.0 mg/L for at least one event. 2006 Bottom DO: All sampling sites had a DO sampling event below 5.0 mg/L; for all sampling sites except J1, the DO levels dropped below 4.8 mg/L for at least one event, all but two sites dropped below 4.0 mg/L; and for all except four sites (J1, J2, J5, and J11) the DO dropped below 3.0 mg/L for at least one event. Throughout the (2004-2006) sampling period, bottom samples from site J12 were found to have 0.00 mg/L for at least one sampling event. The Jamaica Bay Region, in general, is prone to high variability in DO levels. Algal blooms are common in the Bay, which frequently result in large diurnal variations in DO. Sampling site J12 is a deep area of the Bay that was created by excavation for construction of the Kennedy Airport. During much of the year the site is stratified due to poor water circulation, causing oxygen deprivation (anoxia) in the bottom layer of this site (hypolimnion). Although the DO values measured in 2006 were slightly lower than was the case in 2004 and 2005, the overall long term trend shows that DO levels in the Jamaica Bay Region steadily increased from 1970 through 2001, and have been reasonably stable from 2002-2006. Jamaica Bay is the only Region in the Harbor where 2006 DO levels were not improved over 2004 and 2005 levels.
DISSOLVED OXYGEN
The seasonal averages for dissolved oxygen are presented in this report for consistency in comparing trend data with past analyses. Sampling (grab samples) occurred weekly throughout the summer season (June 1-September 30). Note that the DO water quality standards are based on daily averages, individual sampling events, and/or limited periods of time.
2006 REGIONAL SUMMARY
25 2006 NEW YORK-NEW JERSEY HARBOR WATER QUALITY REPORT
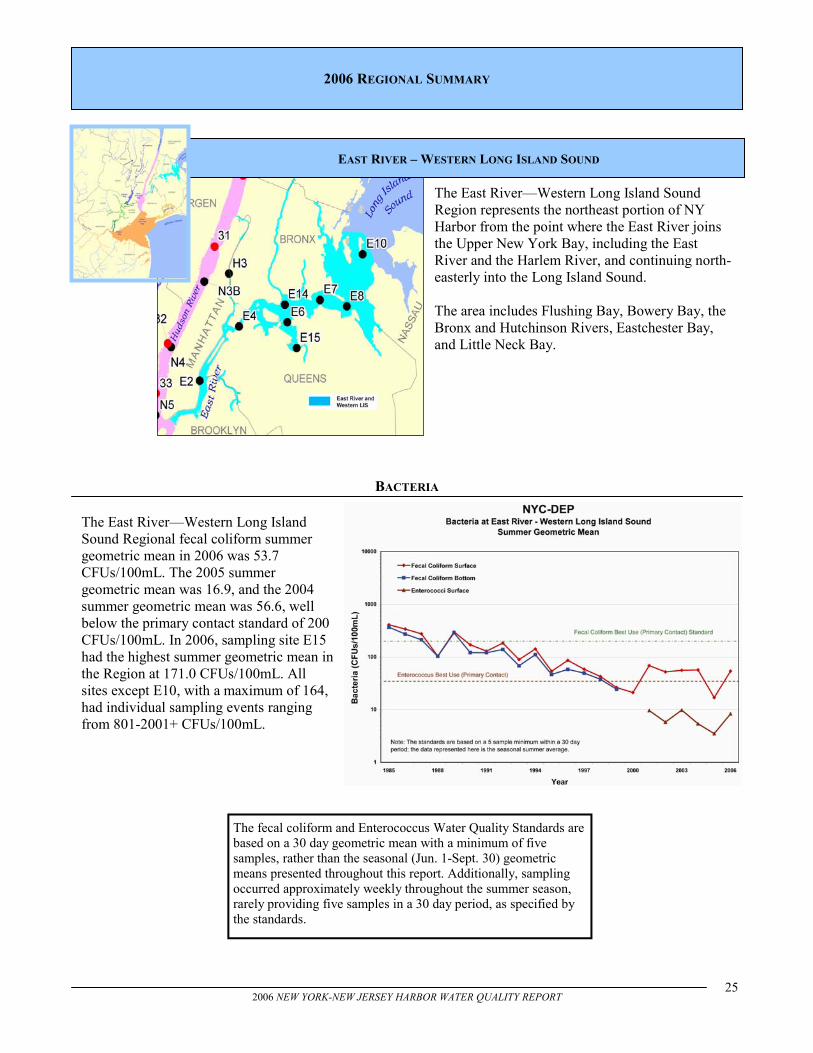
EAST RIVER – WESTERN LONG ISLAND SOUND
The East River—Western Long Island Sound Region represents the northeast portion of NY Harbor from the point where the East River joins the Upper New York Bay, including the East River and the Harlem River, and continuing north-easterly into the Long Island Sound. The area includes Flushing Bay, Bowery Bay, the Bronx and Hutchinson Rivers, Eastchester Bay, and Little Neck Bay.
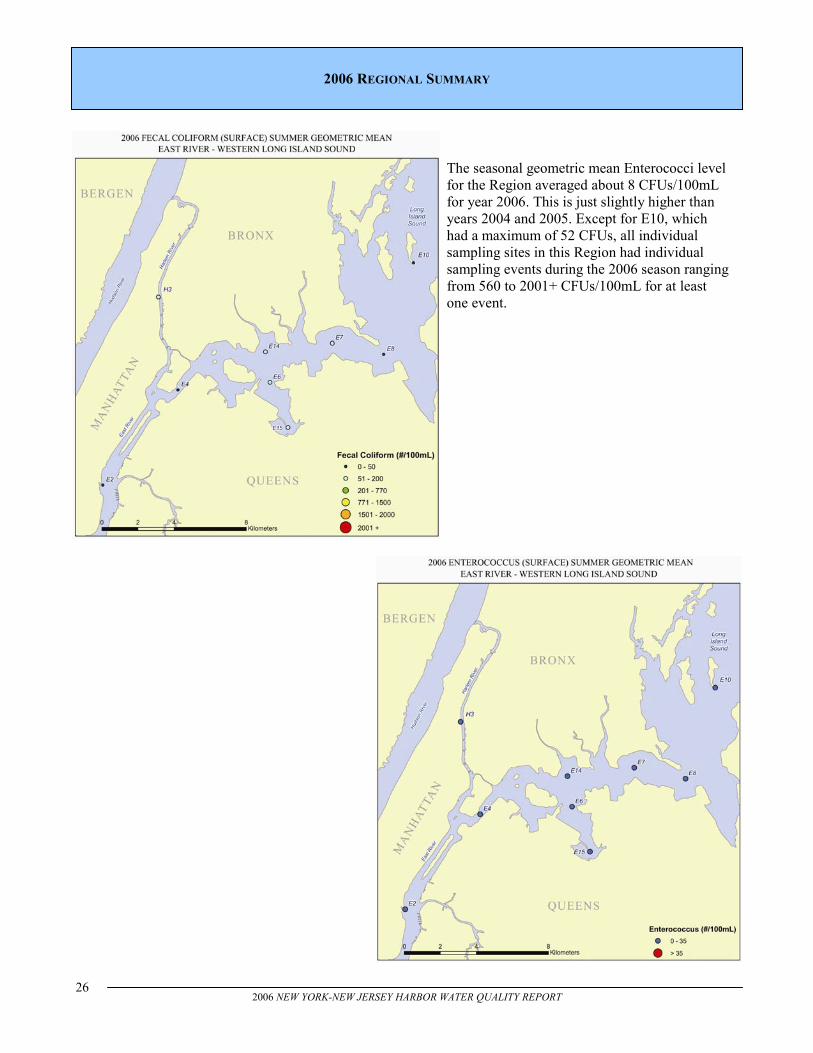
The East River—Western Long Island Sound Regional fecal coliform summer geometric mean in 2006 was 53.7 CFUs/100mL. The 2005 summer geometric mean was 16.9, and the 2004 summer geometric mean was 56.6, well below the primary contact standard of 200 CFUs/100mL. In 2006, sampling site E15 had the highest summer geometric mean in the Region at 171.0 CFUs/100mL. All sites except E10, with a maximum of 164, had individual sampling events ranging from 801-2001+ CFUs/100mL.
BACTERIA
2006 REGIONAL SUMMARY
The fecal coliform and Enterococcus Water Quality Standards are based on a 30 day geometric mean with a minimum of five samples, rather than the seasonal (Jun. 1-Sept. 30) geometric means presented throughout this report. Additionally, sampling occurred approximately weekly throughout the summer season, rarely providing five samples in a 30 day period, as specified by the standards.
26 2006 NEW YORK-NEW JERSEY HARBOR WATER QUALITY REPORT
The seasonal geometric mean Enterococci level for the Region averaged about 8 CFUs/100mL for year 2006. This is just slightly higher than years 2004 and 2005. Except for E10, which had a maximum of 52 CFUs, all individual sampling sites in this Region had individual sampling events during the 2006 season ranging from 560 to 2001+ CFUs/100mL for at least one event.
2006 REGIONAL SUMMARY
27 2006 NEW YORK-NEW JERSEY HARBOR WATER QUALITY REPORT
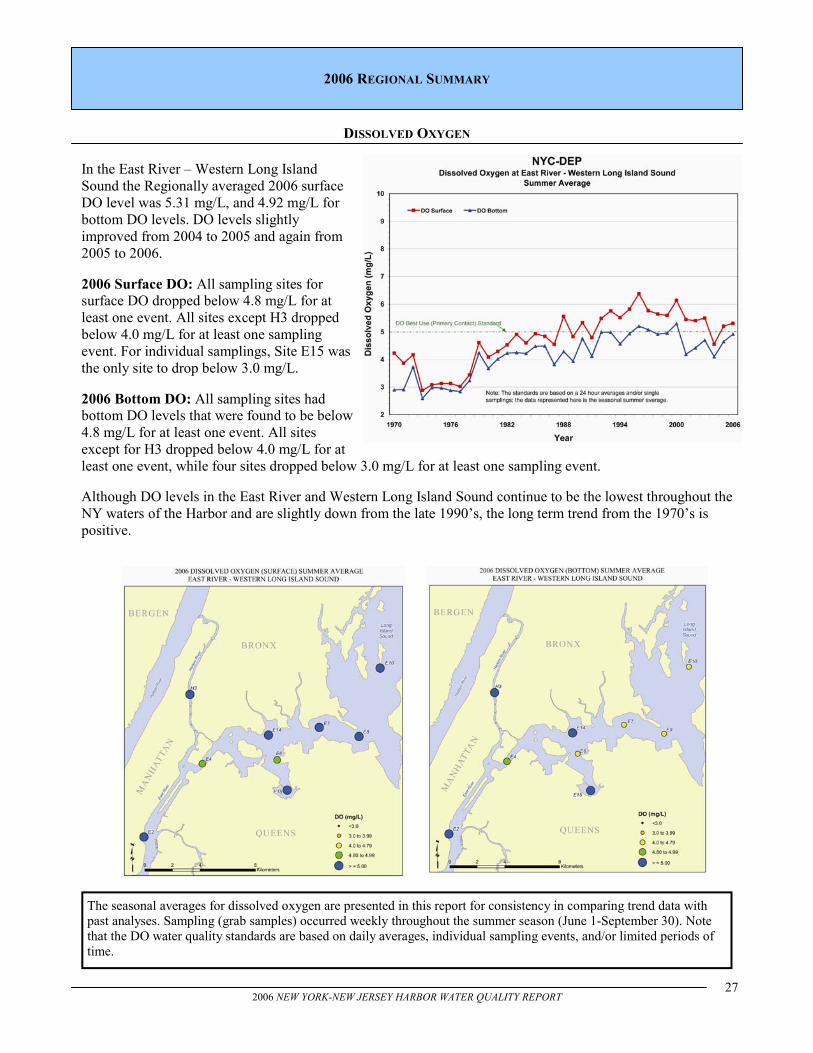
In the East River – Western Long Island Sound the Regionally averaged 2006 surface DO level was 5.31 mg/L, and 4.92 mg/L for bottom DO levels. DO levels slightly improved from 2004 to 2005 and again from 2005 to 2006. 2006 Surface DO: All sampling sites for surface DO dropped below 4.8 mg/L for at least one event. All sites except H3 dropped below 4.0 mg/L for at least one sampling event. For individual samplings, Site E15 was the only site to drop below 3.0 mg/L. 2006 Bottom DO: All sampling sites had bottom DO levels that were found to be below 4.8 mg/L for at least one event. All sites except for H3 dropped below 4.0 mg/L for at least one event, while four sites dropped below 3.0 mg/L for at least one sampling event. Although DO levels in the East River and Western Long Island Sound continue to be the lowest throughout the NY waters of the Harbor and are slightly down from the late 1990’s, the long term trend from the 1970’s is positive.
DISSOLVED OXYGEN
2006 REGIONAL SUMMARY
The seasonal averages for dissolved oxygen are presented in this report for consistency in comparing trend data with past analyses. Sampling (grab samples) occurred weekly throughout the summer season (June 1-September 30). Note that the DO water quality standards are based on daily averages, individual sampling events, and/or limited periods of time.
28 2006 NEW YORK-NEW JERSEY HARBOR WATER QUALITY REPORT
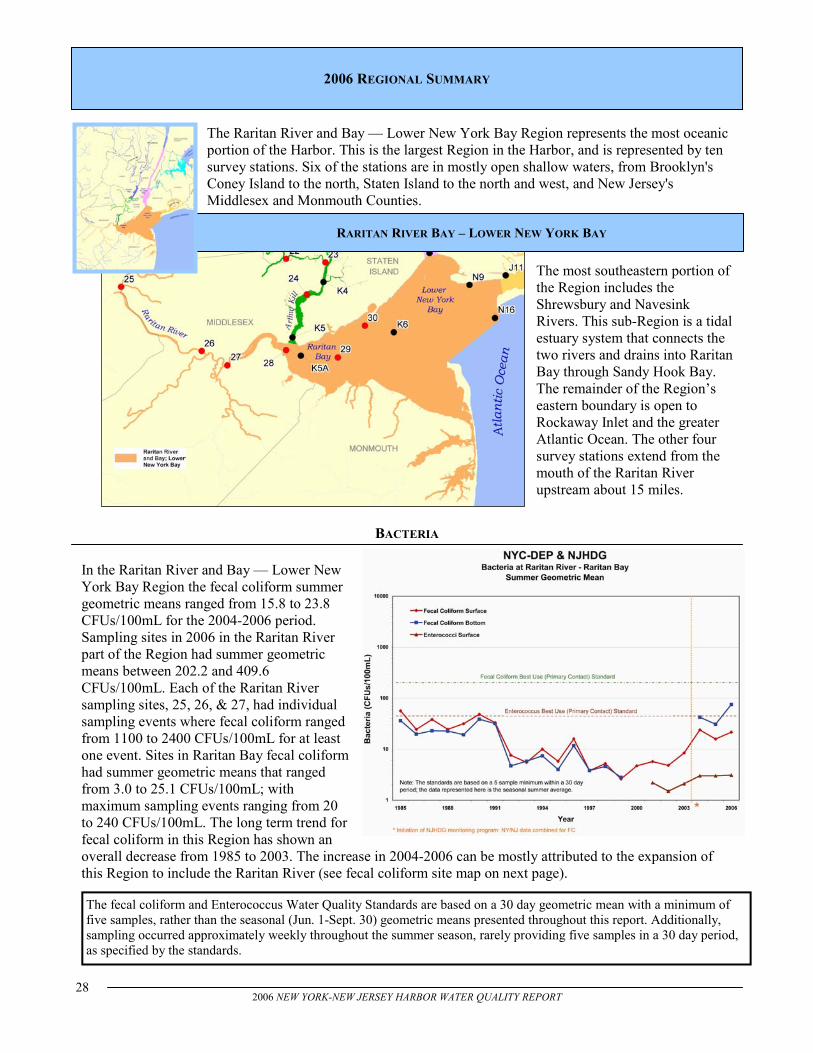
The Raritan River and Bay — Lower New York Bay Region represents the most oceanic portion of the Harbor. This is the largest Region in the Harbor, and is represented by ten survey stations. Six of the stations are in mostly open shallow waters, from Brooklyn's Coney Island to the north, Staten Island to the north and west, and New Jersey's Middlesex and Monmouth Counties.
The most southeastern portion of the Region includes the Shrewsbury and Navesink Rivers. This sub-Region is a tidal estuary system that connects the two rivers and drains into Raritan Bay through Sandy Hook Bay. The remainder of the Region’s eastern boundary is open to Rockaway Inlet and the greater Atlantic Ocean. The other four survey stations extend from the mouth of the Raritan River upstream about 15 miles.
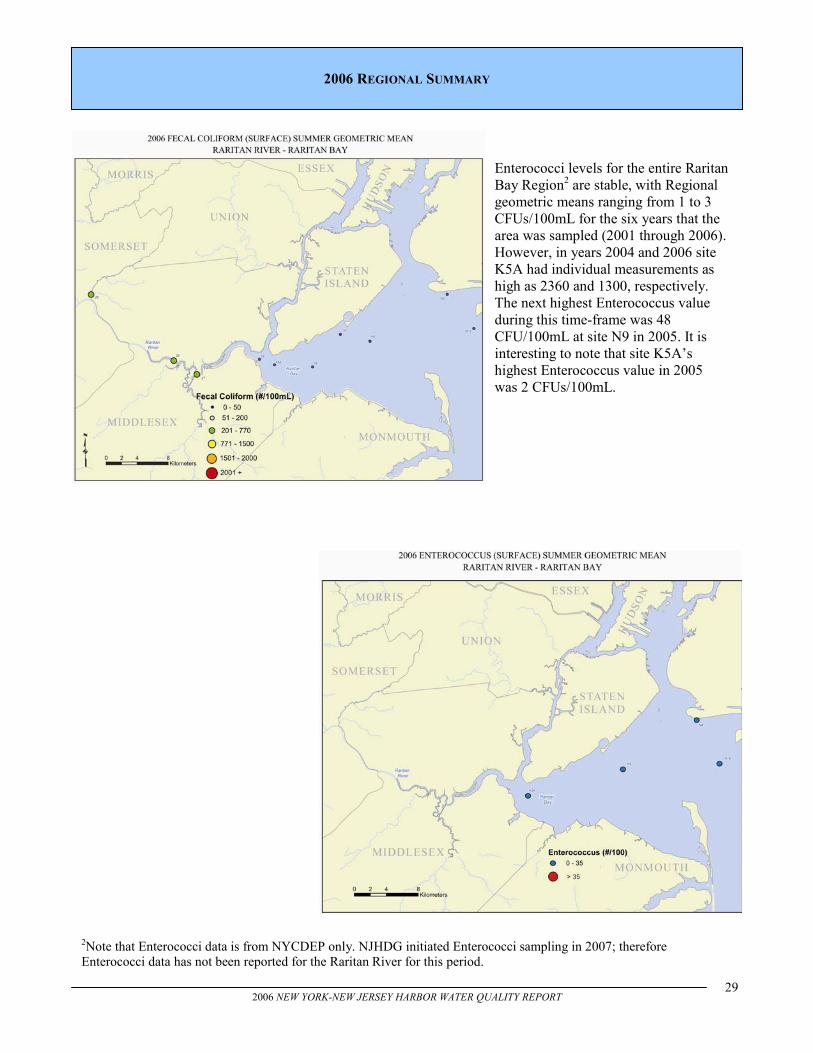
In the Raritan River and Bay — Lower New York Bay Region the fecal coliform summer geometric means ranged from 15.8 to 23.8 CFUs/100mL for the 2004-2006 period. Sampling sites in 2006 in the Raritan River part of the Region had summer geometric means between 202.2 and 409.6 CFUs/100mL. Each of the Raritan River sampling sites, 25, 26, & 27, had individual sampling events where fecal coliform ranged from 1100 to 2400 CFUs/100mL for at least one event. Sites in Raritan Bay fecal coliform had summer geometric means that ranged from 3.0 to 25.1 CFUs/100mL; with maximum sampling events ranging from 20 to 240 CFUs/100mL. The long term trend for fecal coliform in this Region has shown an overall decrease from 1985 to 2003. The increase in 2004-2006 can be mostly attributed to the expansion of this Region to include the Raritan River (see fecal coliform site map on next page).
BACTERIA
RARITAN RIVER BAY – LOWER NEW YORK BAY
2006 REGIONAL SUMMARY
The fecal coliform and Enterococcus Water Quality Standards are based on a 30 day geometric mean with a minimum of five samples, rather than the seasonal (Jun. 1-Sept. 30) geometric means presented throughout this report. Additionally, sampling occurred approximately weekly throughout the summer season, rarely providing five samples in a 30 day period, as specified by the standards.
29 2006 NEW YORK-NEW JERSEY HARBOR WATER QUALITY REPORT
Enterococci levels for the entire Raritan Bay Region2 are stable, with Regional geometric means ranging from 1 to 3 CFUs/100mL for the six years that the area was sampled (2001 through 2006). However, in years 2004 and 2006 site K5A had individual measurements as high as 2360 and 1300, respectively. The next highest Enterococcus value during this time-frame was 48 CFU/100mL at site N9 in 2005. It is interesting to note that site K5A’s highest Enterococcus value in 2005 was 2 CFUs/100mL.
2Note that Enterococci data is from NYCDEP only. NJHDG initiated Enterococci sampling in 2007; therefore Enterococci data has not been reported for the Raritan River for this period.
2006 REGIONAL SUMMARY
30 2006 NEW YORK-NEW JERSEY HARBOR WATER QUALITY REPORT
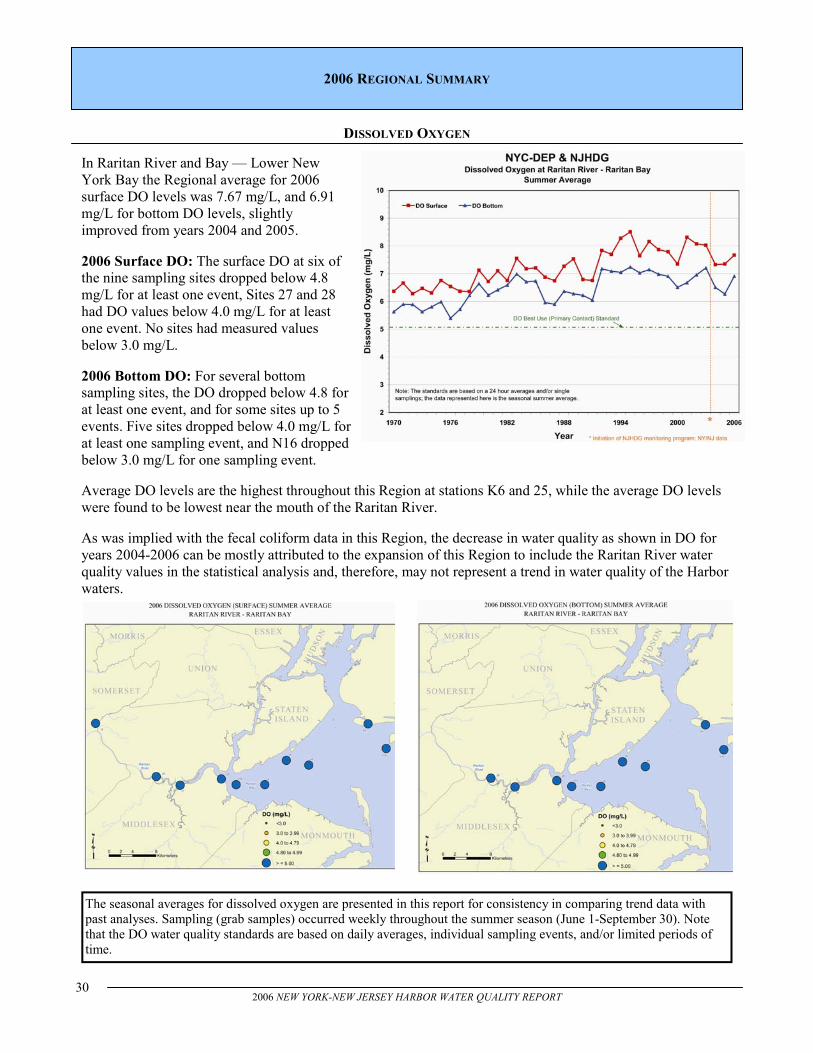
In Raritan River and Bay — Lower New York Bay the Regional average for 2006 surface DO levels was 7.67 mg/L, and 6.91 mg/L for bottom DO levels, slightly improved from years 2004 and 2005. 2006 Surface DO: The surface DO at six of the nine sampling sites dropped below 4.8 mg/L for at least one event, Sites 27 and 28 had DO values below 4.0 mg/L for at least one event. No sites had measured values below 3.0 mg/L. 2006 Bottom DO: For several bottom sampling sites, the DO dropped below 4.8 for at least one event, and for some sites up to 5 events. Five sites dropped below 4.0 mg/L for at least one sampling event, and N16 dropped below 3.0 mg/L for one sampling event. Average DO levels are the highest throughout this Region at stations K6 and 25, while the average DO levels were found to be lowest near the mouth of the Raritan River. As was implied with the fecal coliform data in this Region, the decrease in water quality as shown in DO for years 2004-2006 can be mostly attributed to the expansion of this Region to include the Raritan River water quality values in the statistical analysis and, therefore, may not represent a trend in water quality of the Harbor waters.
DISSOLVED OXYGEN
2006 REGIONAL SUMMARY
The seasonal averages for dissolved oxygen are presented in this report for consistency in comparing trend data with past analyses. Sampling (grab samples) occurred weekly throughout the summer season (June 1-September 30). Note that the DO water quality standards are based on daily averages, individual sampling events, and/or limited periods of time.
31 2006 NEW YORK-NEW JERSEY HARBOR WATER QUALITY REPORT
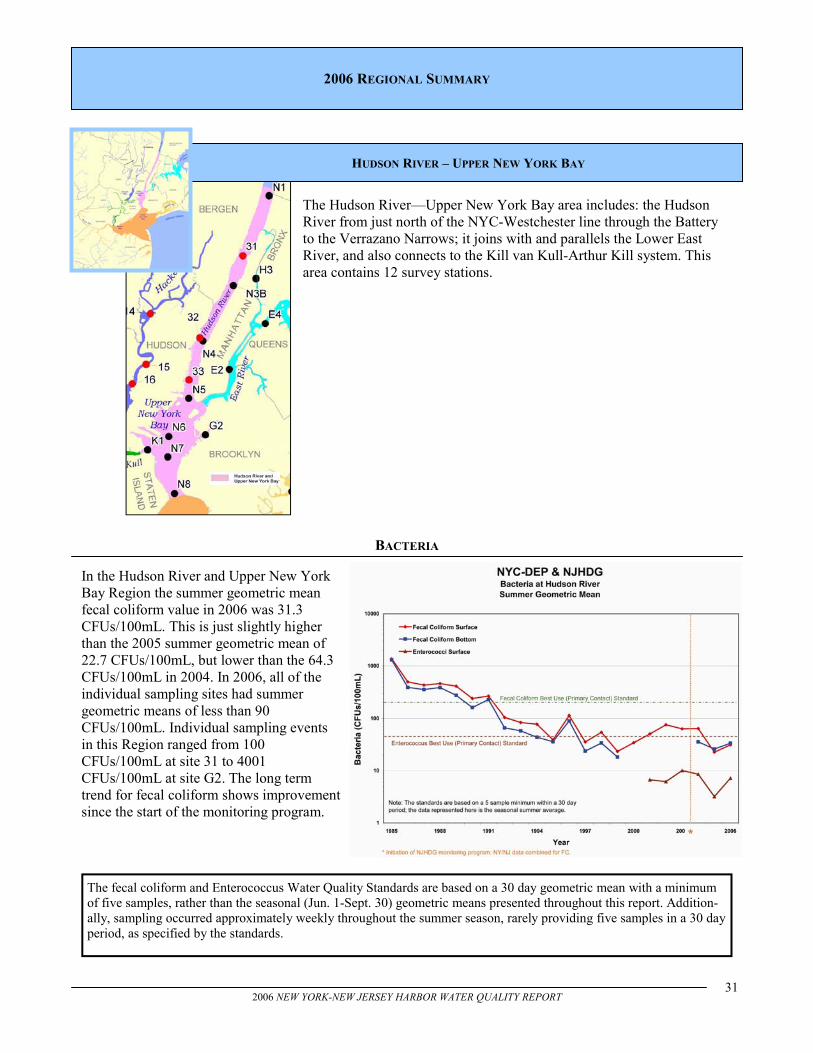
The Hudson River—Upper New York Bay area includes: the Hudson River from just north of the NYC-Westchester line through the Battery to the Verrazano Narrows; it joins with and parallels the Lower East River, and also connects to the Kill van Kull-Arthur Kill system. This area contains 12 survey stations.
In the Hudson River and Upper New York Bay Region the summer geometric mean fecal coliform value in 2006 was 31.3 CFUs/100mL. This is just slightly higher than the 2005 summer geometric mean of 22.7 CFUs/100mL, but lower than the 64.3 CFUs/100mL in 2004. In 2006, all of the individual sampling sites had summer geometric means of less than 90 CFUs/100mL. Individual sampling events in this Region ranged from 100 CFUs/100mL at site 31 to 4001 CFUs/100mL at site G2. The long term trend for fecal coliform shows improvement since the start of the monitoring program.
BACTERIA
2006 REGIONAL SUMMARY
The fecal coliform and Enterococcus Water Quality Standards are based on a 30 day geometric mean with a minimum of five samples, rather than the seasonal (Jun. 1-Sept. 30) geometric means presented throughout this report. Addition-ally, sampling occurred approximately weekly throughout the summer season, rarely providing five samples in a 30 day period, as specified by the standards.
HUDSON RIVER – UPPER NEW YORK BAY
32 2006 NEW YORK-NEW JERSEY HARBOR WATER QUALITY REPORT
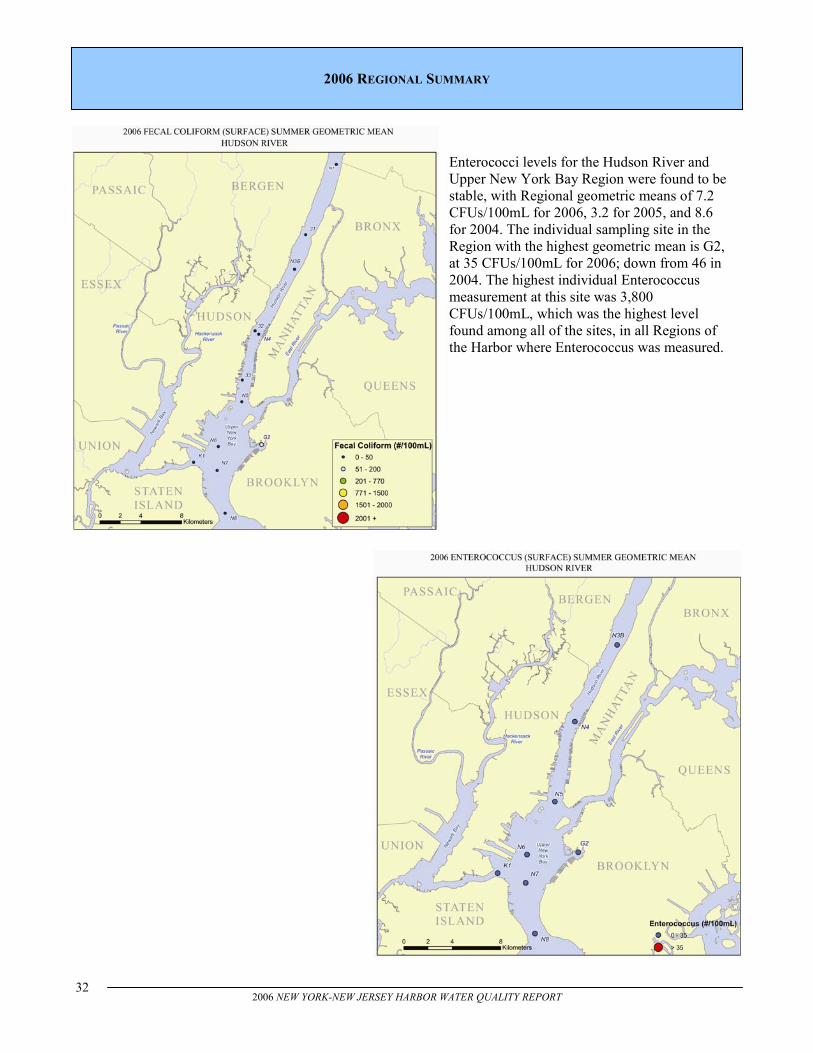
Enterococci levels for the Hudson River and Upper New York Bay Region were found to be stable, with Regional geometric means of 7.2 CFUs/100mL for 2006, 3.2 for 2005, and 8.6 for 2004. The individual sampling site in the Region with the highest geometric mean is G2, at 35 CFUs/100mL for 2006; down from 46 in 2004. The highest individual Enterococcus measurement at this site was 3,800 CFUs/100mL, which was the highest level found among all of the sites, in all Regions of the Harbor where Enterococcus was measured.
2006 REGIONAL SUMMARY
33 2006 NEW YORK-NEW JERSEY HARBOR WATER QUALITY REPORT
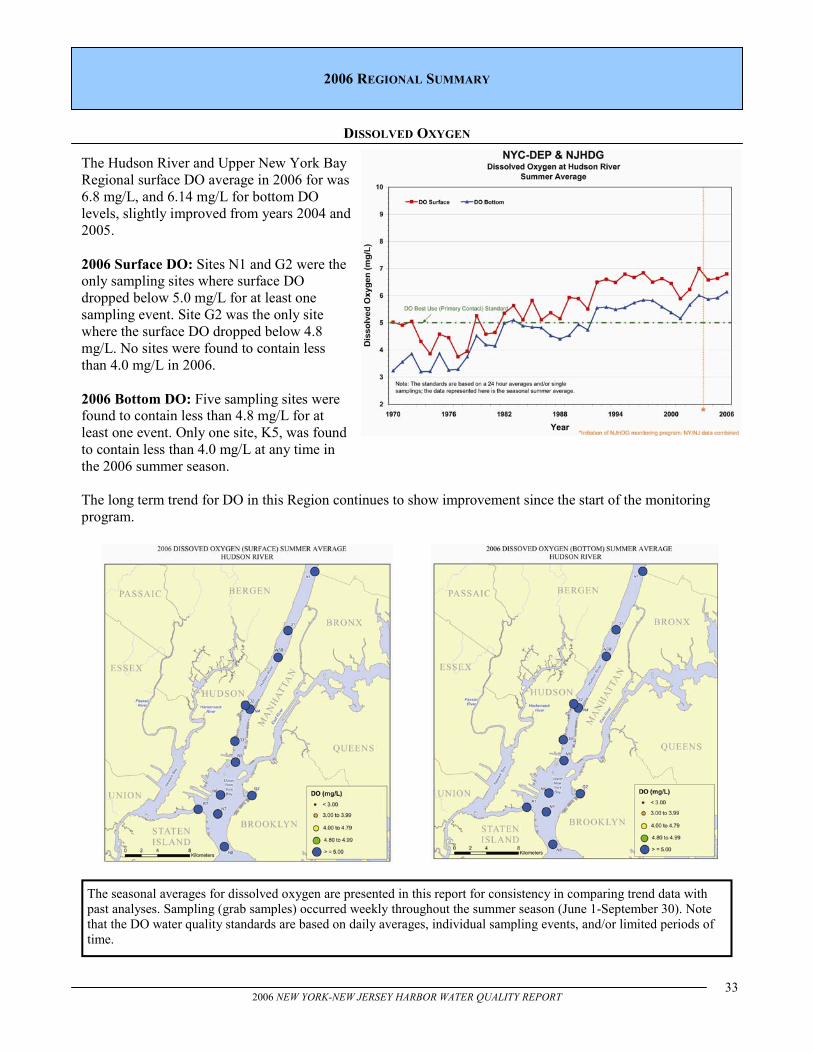
The Hudson River and Upper New York Bay Regional surface DO average in 2006 for was 6.8 mg/L, and 6.14 mg/L for bottom DO levels, slightly improved from years 2004 and 2005. 2006 Surface DO: Sites N1 and G2 were the only sampling sites where surface DO dropped below 5.0 mg/L for at least one sampling event. Site G2 was the only site where the surface DO dropped below 4.8 mg/L. No sites were found to contain less than 4.0 mg/L in 2006. 2006 Bottom DO: Five sampling sites were found to contain less than 4.8 mg/L for at least one event. Only one site, K5, was found to contain less than 4.0 mg/L at any time in the 2006 summer season. The long term trend for DO in this Region continues to show improvement since the start of the monitoring program.
DISSOLVED OXYGEN
2006 REGIONAL SUMMARY
The seasonal averages for dissolved oxygen are presented in this report for consistency in comparing trend data with past analyses. Sampling (grab samples) occurred weekly throughout the summer season (June 1-September 30). Note that the DO water quality standards are based on daily averages, individual sampling events, and/or limited periods of time.
34 2006 NEW YORK-NEW JERSEY HARBOR WATER QUALITY REPORT
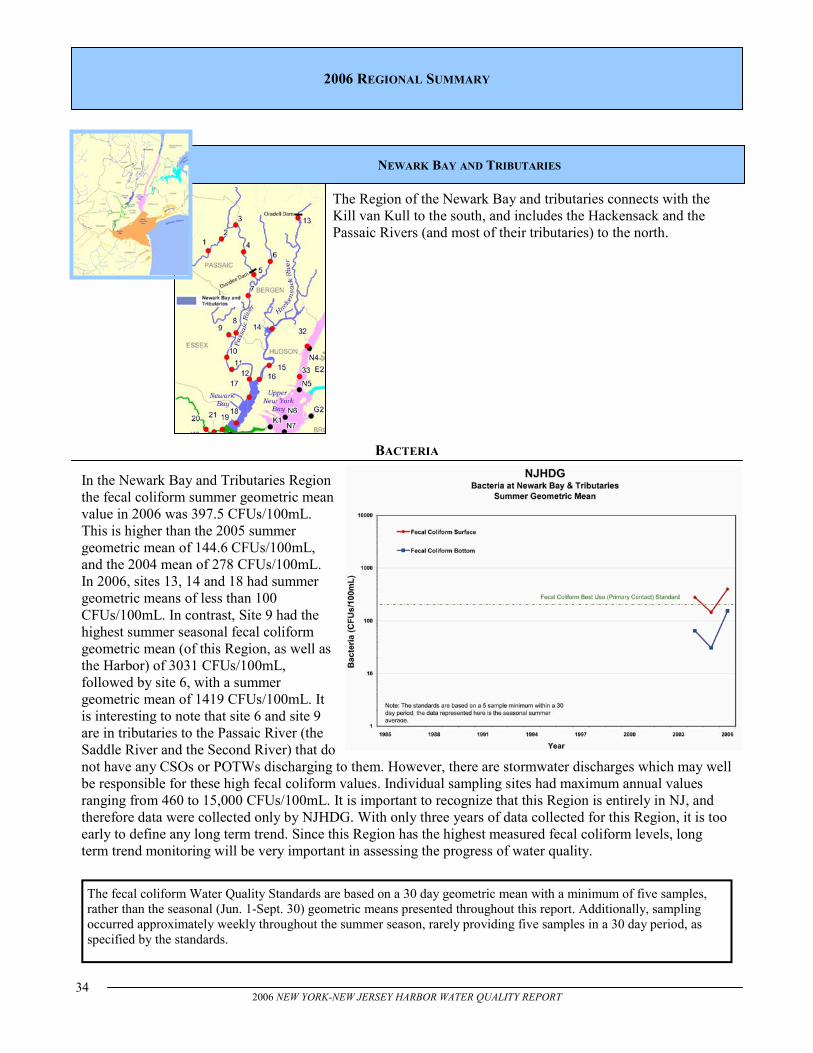
The Region of the Newark Bay and tributaries connects with the Kill van Kull to the south, and includes the Hackensack and the Passaic Rivers (and most of their tributaries) to the north.
BACTERIA
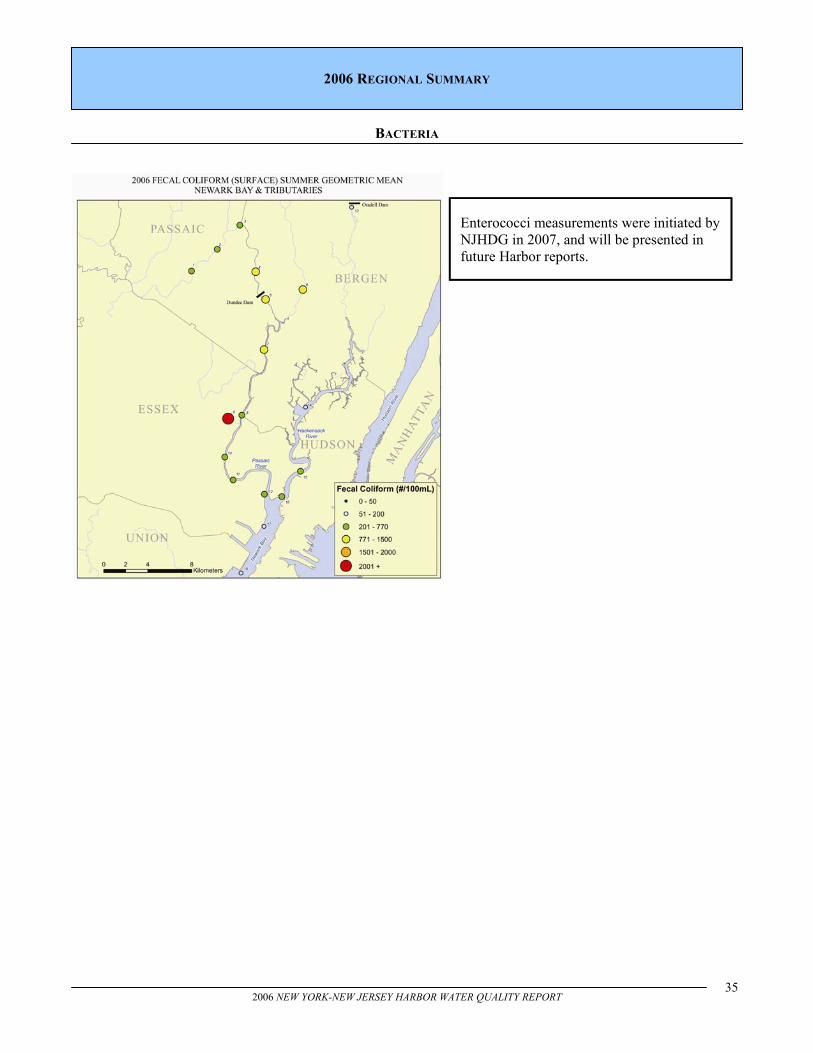
In the Newark Bay and Tributaries Region the fecal coliform summer geometric mean value in 2006 was 397.5 CFUs/100mL. This is higher than the 2005 summer geometric mean of 144.6 CFUs/100mL, and the 2004 mean of 278 CFUs/100mL. In 2006, sites 13, 14 and 18 had summer geometric means of less than 100 CFUs/100mL. In contrast, Site 9 had the highest summer seasonal fecal coliform geometric mean (of this Region, as well as the Harbor) of 3031 CFUs/100mL, followed by site 6, with a summer geometric mean of 1419 CFUs/100mL. It is interesting to note that site 6 and site 9 are in tributaries to the Passaic River (the Saddle River and the Second River) that do not have any CSOs or POTWs discharging to them. However, there are stormwater discharges which may well be responsible for these high fecal coliform values. Individual sampling sites had maximum annual values ranging from 460 to 15,000 CFUs/100mL. It is important to recognize that this Region is entirely in NJ, and therefore data were collected only by NJHDG. With only three years of data collected for this Region, it is too early to define any long term trend. Since this Region has the highest measured fecal coliform levels, long term trend monitoring will be very important in assessing the progress of water quality.
2006 REGIONAL SUMMARY
The fecal coliform Water Quality Standards are based on a 30 day geometric mean with a minimum of five samples, rather than the seasonal (Jun. 1-Sept. 30) geometric means presented throughout this report. Additionally, sampling occurred approximately weekly throughout the summer season, rarely providing five samples in a 30 day period, as specified by the standards.
NEWARK BAY AND TRIBUTARIES
35 2006 NEW YORK-NEW JERSEY HARBOR WATER QUALITY REPORT
BACTERIA
Enterococci measurements were initiated by NJHDG in 2007, and will be presented in future Harbor reports.
2006 REGIONAL SUMMARY
36 2006 NEW YORK-NEW JERSEY HARBOR WATER QUALITY REPORT
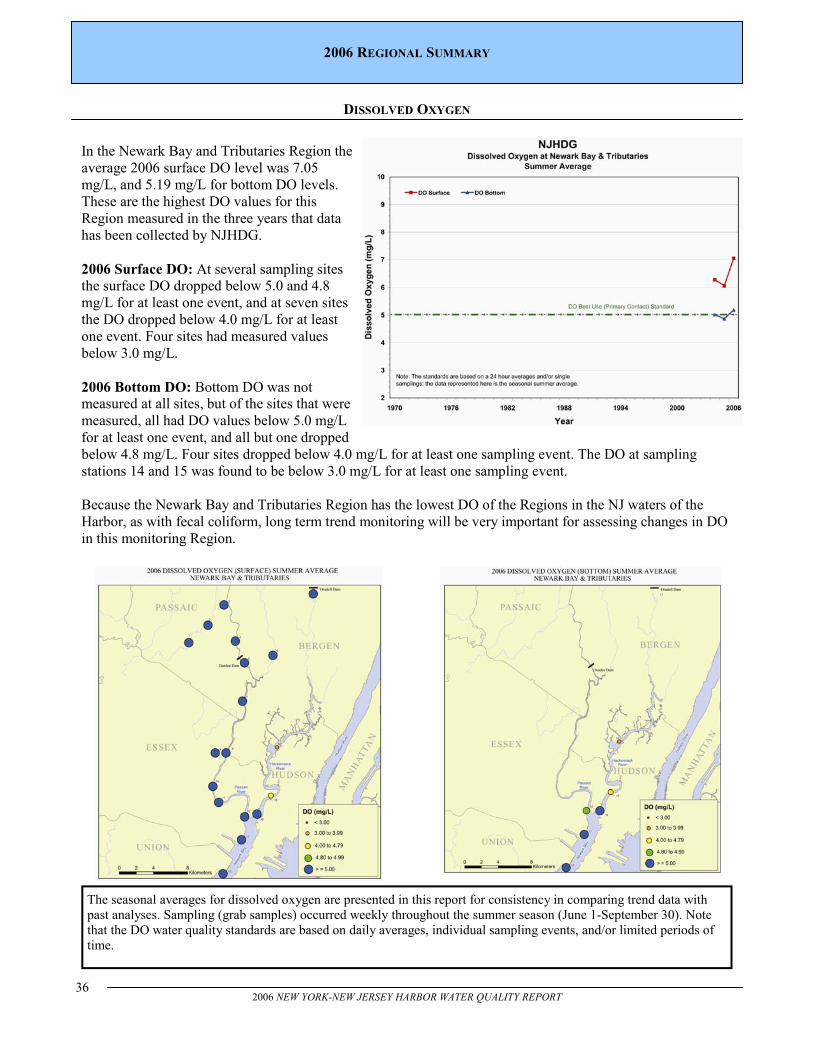
In the Newark Bay and Tributaries Region the average 2006 surface DO level was 7.05 mg/L, and 5.19 mg/L for bottom DO levels. These are the highest DO values for this Region measured in the three years that data has been collected by NJHDG. 2006 Surface DO: At several sampling sites the surface DO dropped below 5.0 and 4.8 mg/L for at least one event, and at seven sites the DO dropped below 4.0 mg/L for at least one event. Four sites had measured values below 3.0 mg/L. 2006 Bottom DO: Bottom DO was not measured at all sites, but of the sites that were measured, all had DO values below 5.0 mg/L for at least one event, and all but one dropped below 4.8 mg/L. Four sites dropped below 4.0 mg/L for at least one sampling event. The DO at sampling stations 14 and 15 was found to be below 3.0 mg/L for at least one sampling event. Because the Newark Bay and Tributaries Region has the lowest DO of the Regions in the NJ waters of the Harbor, as with fecal coliform, long term trend monitoring will be very important for assessing changes in DO in this monitoring Region.
DISSOLVED OXYGEN
2006 REGIONAL SUMMARY
The seasonal averages for dissolved oxygen are presented in this report for consistency in comparing trend data with past analyses. Sampling (grab samples) occurred weekly throughout the summer season (June 1-September 30). Note that the DO water quality standards are based on daily averages, individual sampling events, and/or limited periods of time.
37 2006 NEW YORK-NEW JERSEY HARBOR WATER QUALITY REPORT
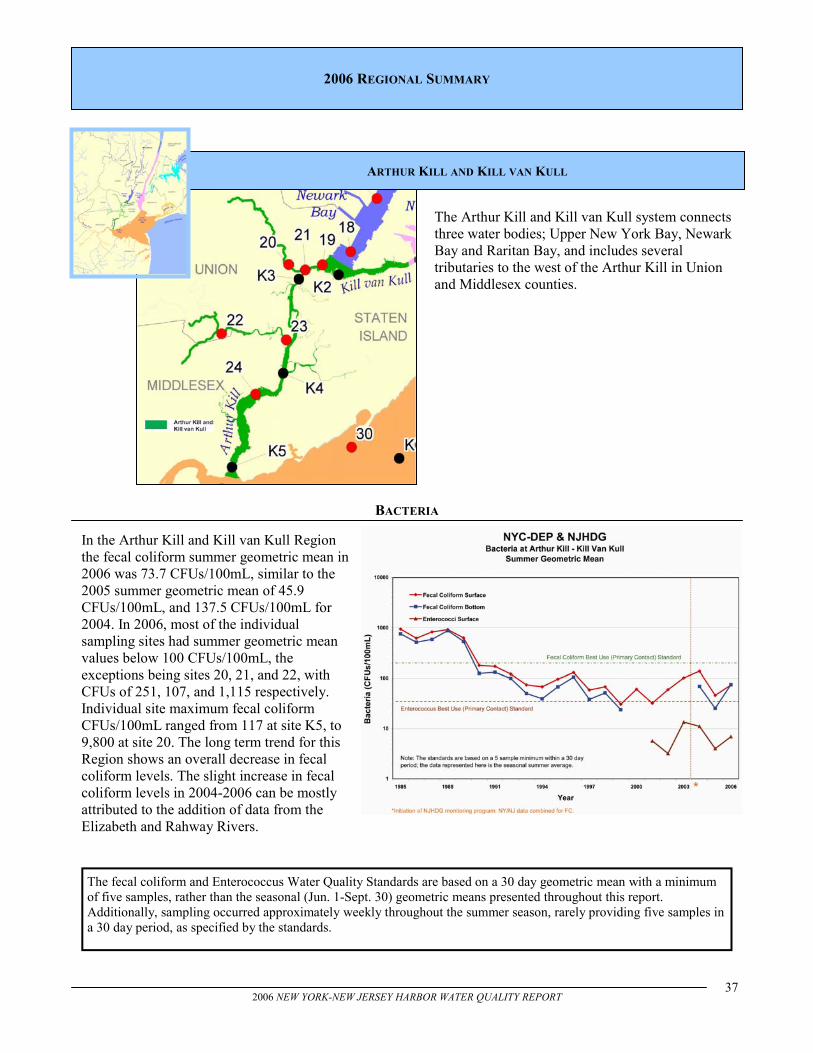
The Arthur Kill and Kill van Kull system connects three water bodies; Upper New York Bay, Newark Bay and Raritan Bay, and includes several tributaries to the west of the Arthur Kill in Union and Middlesex counties.
In the Arthur Kill and Kill van Kull Region the fecal coliform summer geometric mean in 2006 was 73.7 CFUs/100mL, similar to the 2005 summer geometric mean of 45.9 CFUs/100mL, and 137.5 CFUs/100mL for 2004. In 2006, most of the individual sampling sites had summer geometric mean values below 100 CFUs/100mL, the exceptions being sites 20, 21, and 22, with CFUs of 251, 107, and 1,115 respectively. Individual site maximum fecal coliform CFUs/100mL ranged from 117 at site K5, to 9,800 at site 20. The long term trend for this Region shows an overall decrease in fecal coliform levels. The slight increase in fecal coliform levels in 2004-2006 can be mostly attributed to the addition of data from the Elizabeth and Rahway Rivers.
BACTERIA
2006 REGIONAL SUMMARY
ARTHUR KILL AND KILL VAN KULL
The fecal coliform and Enterococcus Water Quality Standards are based on a 30 day geometric mean with a minimum of five samples, rather than the seasonal (Jun. 1-Sept. 30) geometric means presented throughout this report. Additionally, sampling occurred approximately weekly throughout the summer season, rarely providing five samples in a 30 day period, as specified by the standards.
38 2006 NEW YORK-NEW JERSEY HARBOR WATER QUALITY REPORT
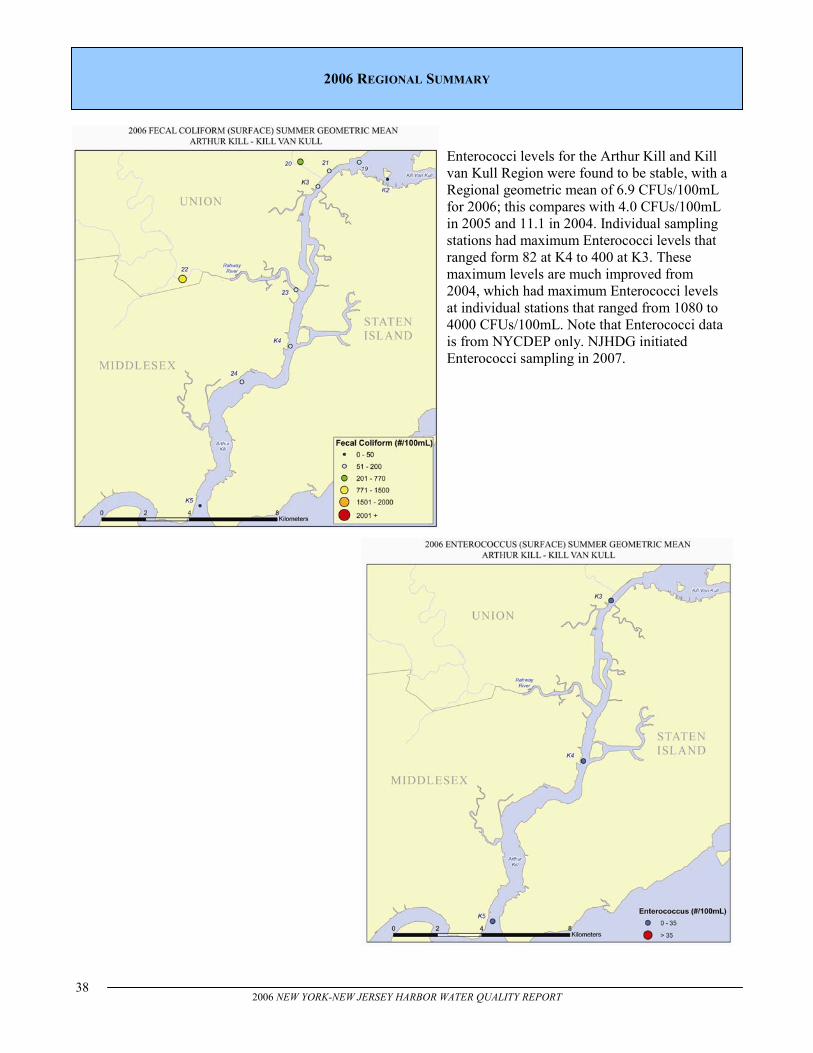
Enterococci levels for the Arthur Kill and Kill van Kull Region were found to be stable, with a Regional geometric mean of 6.9 CFUs/100mL for 2006; this compares with 4.0 CFUs/100mL in 2005 and 11.1 in 2004. Individual sampling stations had maximum Enterococci levels that ranged form 82 at K4 to 400 at K3. These maximum levels are much improved from 2004, which had maximum Enterococci levels at individual stations that ranged from 1080 to 4000 CFUs/100mL. Note that Enterococci data is from NYCDEP only. NJHDG initiated Enterococci sampling in 2007.
2006 REGIONAL SUMMARY
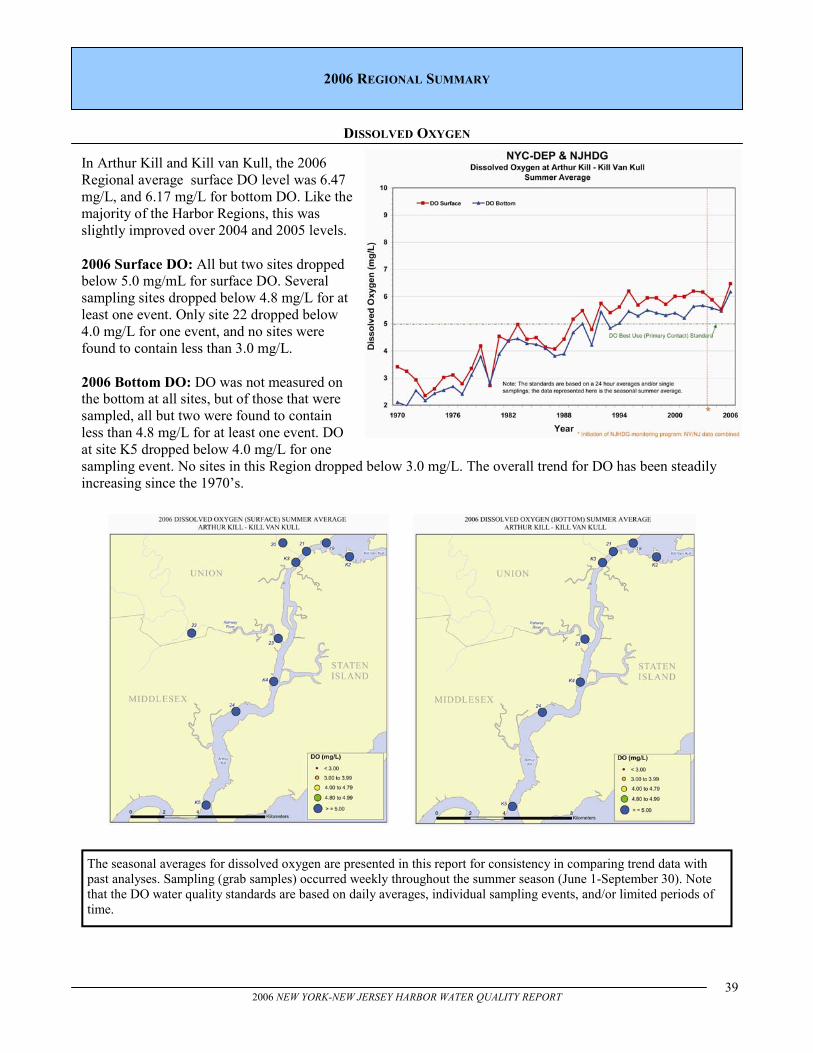
39 2006 NEW YORK-NEW JERSEY HARBOR WATER QUALITY REPORT
DISSOLVED OXYGEN
In Arthur Kill and Kill van Kull, the 2006 Regional average surface DO level was 6.47 mg/L, and 6.17 mg/L for bottom DO. Like the majority of the Harbor Regions, this was slightly improved over 2004 and 2005 levels. 2006 Surface DO: All but two sites dropped below 5.0 mg/mL for surface DO. Several sampling sites dropped below 4.8 mg/L for at least one event. Only site 22 dropped below 4.0 mg/L for one event, and no sites were found to contain less than 3.0 mg/L. 2006 Bottom DO: DO was not measured on the bottom at all sites, but of those that were sampled, all but two were found to contain less than 4.8 mg/L for at least one event. DO at site K5 dropped below 4.0 mg/L for one sampling event. No sites in this Region dropped below 3.0 mg/L. The overall trend for DO has been steadily increasing since the 1970’s.
2006 REGIONAL SUMMARY
The seasonal averages for dissolved oxygen are presented in this report for consistency in comparing trend data with past analyses. Sampling (grab samples) occurred weekly throughout the summer season (June 1-September 30). Note that the DO water quality standards are based on daily averages, individual sampling events, and/or limited periods of time.

40 2006 NEW YORK-NEW JERSEY HARBOR WATER QUALITY REPORT

41 2006 NEW YORK-NEW JERSEY HARBOR WATER QUALITY REPORT

42 2006 NEW YORK-NEW JERSEY HARBOR WATER QUALITY REPORT
New York - New Jersey Harbor Estuary Program Office U.S. Environmental Protection Agency
290 Broadway, 24th Floor New York, NY 10007 www.harborestuary.org
Recommended