ICES WKARMAC2 REPORT 2018
ECOSYSTEM OBSERVATION STEERING GROUP
ICES CM 2018/EOSG:32
REF. ACOM, SCICOM & WGBIOP
Report of the Workshop on Age
Estimation of Atlantic Mackerel
(scomber scombrus) (WKARMAC2)
22–26 October 2018
San Sebastian, Spain
International Council for the Exploration of the Sea
Conseil International pour l’Exploration de la Mer
H. C. Andersens Boulevard 44–46
DK-1553 Copenhagen V
Denmark
Telephone (+45) 33 38 67 00
Telefax (+45) 33 93 42 15
www.ices.dk
Recommended format for purposes of citation:
ICES. 2019. Report of the Workshop on Age Estimation of Atlantic Mackerel (scomber
scombrus) (WKARMAC2), 22–26 October 2018, San Sebastian, Spain. ICES CM
2018/EOSG:32 . 96 pp.
The material in this report may be reused using the recommended citation. ICES may
only grant usage rights of information, data, images, graphs, etc. of which it has own-
ership. For other third-party material cited in this report, you must contact the origi-
nal copyright holder for permission. For citation of datasets or use of data to be
included in other databases, please refer to the latest ICES data policy on the ICES
website. All extracts must be acknowledged. For other reproduction requests please
contact the General Secretary.
This document is the product of an Expert Group under the auspices of the Interna-
tional Council for the Exploration of the Sea and does not necessarily represent the
view of the Council.
© 2018 International Council for the Exploration of the Sea
ICES WKARMAC2 REPORT 2018 | i
Contents
Executive summary ................................................................................................................ 1
1 Terms of reference ......................................................................................................... 2
2 Agenda and participation ............................................................................................. 3
3 Update on known changes to the biology of mackerel .......................................... 4
4 Review information on age estimations, otolith exchanges, workshops
and validation work (ToR a) ........................................................................................ 6
4.1 Exchanges and Workshops ................................................................................. 6
4.2 Validation work .................................................................................................... 8
5 Resolve interpretation differences between readers and laboratories;
most recent exchange and workshop exercise (ToR b) ........................................... 9
5.1 Pre-workshop exercise ......................................................................................... 9
5.2 Workshop exercise: WKARMAC2 calibration exercise ................................. 11
5.2.1 Material and methods ........................................................................... 12
5.2.2 Results ..................................................................................................... 13
5.2.3 Conclusions and evaluation of the exercise ....................................... 15
5.3 Small exchange with Norwegian otoliths. A little experiment..................... 16
5.3.1 Introduction ............................................................................................ 16
5.3.2 Material and methods ........................................................................... 16
5.3.3 Results ..................................................................................................... 18
5.3.4 Conclusions and recommendations .................................................... 19
5.4 Recommended actions for resolving interpretation differences
between readers .................................................................................................. 20
6 Resume of the studies of the formation of the growth zones in otoliths
of different distribution areas presented during the workshop ......................... 21
7 Compilation of an agreed manual for age estimation of mackerel (part
of ToR e) ........................................................................................................................ 25
7.1 Introduction ......................................................................................................... 25
7.2 Methods and preparation .................................................................................. 25
7.3 Agreed criteria for ageing mackerel ................................................................. 29
7.3.1 Viewing the otoliths .............................................................................. 29
7.3.2 Age determination criteria .................................................................... 30
7.3.3 Other available information ................................................................. 32
7.3.4 Otolith interpretation ............................................................................ 32
7.3.5 False or Split Rings ................................................................................ 32
7.3.6 Factors affecting annual ring formation ............................................. 33
8 Collation of a set of agreed age otoliths (part of ToR e) ....................................... 34
ii | ICES WKARMAC2 REPORT 2018
9 Recommendations for further cooperation, exchanges, workshops and
other actions in relation to the age estimation of Mackerel (part of ToR
e) ...................................................................................................................................... 35
9.1 General recommendations ................................................................................ 35
9.1.1 Manual..................................................................................................... 35
9.1.2 Standardised reading within laboratories (section taken
from last workshop report, WKARMAC 2010). ................................ 35
9.1.3 Quality control between labs. ............................................................... 37
9.1.4 Regular workshops ................................................................................ 37
10 References ..................................................................................................................... 38
Annex 1: Agenda ................................................................................................................... 40
Annex 2: List of participants............................................................................................... 43
Annex 3: Recommendations ............................................................................................... 44
Annex 4: Contributions to the Workshop. Presentations and Working
Documents. ................................................................................................................... 45
Annex 5: Figures and Tables of the WKARMAC2 calibration exercise. .................... 46
Annex 6: Figures and tables of the Small exchange with Norwegian otoliths.
......................................................................................................................................... 64
Annex 7: Report of the Pre-WKARMAC2 exercise (Scomber scombrus). ................... 65
ICES WKARMAC2 REPORT 2018 | 1
Executive summary
A Workshop on Age Reading of Atlantic mackerel (Scomber scombrus) otoliths were recom-
mended by WGBIOP 2015 to be carried out in 2016-2017. Due to the difficulty of finding a chair
time passed and the workshop was recommended again by WGBIOP 2017 to be carried out in
2018. This workshop (chaired by Jens Ulleweit, Germany, and Rosario Navarro, Spain), was
held in San Sebastian (Spain) on 22–26 October 2018. 12 European countries took part in this
workshop (Portugal, Spain, The Netherlands, Germany, Denmark, Norway, UK, Ireland, Faroe
Islands, Iceland, Greenland and Greece), with a total of 23 participants from 14 laboratories.
Most ICES Divisions of Northeast Atlantic mackerel distribution were analysed, as well as a bit
of the Mediterranean Sea.
The workshop achieved quite a lot in terms of ironing out, through on-screen discussion of
difficult and/or old otoliths and calibration, some of the differences in age interpretation be-
tween readers. Last workshop (WKARMAC 2010) ageing guidelines were revised and the mod-
ifications agreed between the participants. The participants agreed to employ the revised
ageing guidelines in their age estimations.
The overall result of the workshop exercise shows an improvement in the agreement between
readers (66.8% agreement, 31.4% CV), and especially Expert readers (73.2% agreement, 16.4%
CV), regarding the exercise carried out before the workshop, which shows the usefulness of the
on-screen discussion of difficult otoliths previous to the workshop exercise. However, the
agreement between readers for otoliths with older ages (from age 6) continues to be very low
(40-58% all readers; 53-71% Experts).
Both exchanges, the one previous to the workshop and the one carried out during the work-
shop, were performed via SmartDots, the web application developed by ICES to facilitate the
setup of Exchanges, Workshops and Training. As this is a new application, for most readers
this was the first time using the program but once all readers became familiar with the use of
the tool it proved to be very useful. The exclusive use of images has the disadvantage that the
readers find more difficult to identify the nature of the otolith edge, which in some cases, can
make the age interpretation more difficult. In addition, the use of a standardized reading line
for all readers in each otolith image, even though it makes the comparison between readings
easier, sometimes this complicate marking the annuli on the otolith when there are better
growth rings observed in another area of the otolith. However, the use of images allows a better
comparison between the readers’ estimations and a better identification of the problems in lo-
cating false rings, as well as to speed up the process. The use of SmartDots was especially useful
for a posterior discussion on screen of the most significant otoliths during the workshop.
In addition, a Small exchange with Norwegian otoliths from tag-recaptured experiments was
carried out during the workshop with the results being discussed after completion. Images of
these otoliths were also discussed during the workshop, which proved to be very interesting
due to the importance of these otoliths of known age.
An update of the known changes of mackerel biology was presented during the workshop, as
well as a study of the seasonal formation of growth rings in mackerel otoliths from ICES Div.
8c and 9a, which showed a temporal delay in opaque-zone formation with age.
An image collection of agreed age otoliths will be found in the workshop ICES SharePoint and
the Age Forum site. Such otolith collection includes the otoliths with > 80% agreement between
Expert readers from the WKARMAC2 calibration exercise. In addition, the images of the oto-
liths from the Small exchange with Norwegian otoliths from the tag-recapture experiments will
also be included in the reference otolith collection.
2 | ICES WKARMAC2 REPORT 2018
1 Terms of reference
A Workshop on Age Estimation of Atlantic Mackerel (scomber scombrus) (WKARMAC2),
chaired by Jens Ulleweit, Germany and Maria Rosario Navarro, Spain, was established and
taken place on 22– 26 October 2018 in San Sebastian, Spain to:
a ) Review information and results on age estimations and recent otolith exchanges,
follow up on the previous workshop in 2010 (WKARMAC) and validate the work
done so far.
b ) Summarize the ageing protocols currently in use and improve them where possible.
c ) Address the low agreement between age readers of this species, particularly in fish
over the age of 6 years, with group exercises and reading sample sets.
d ) Create a reference collection of agreed age otoliths.
e ) Address the generic ToRs adopted for workshops on age calibration (see ʹWGBIOP
guidelines for workshops on age calibrationʹ).
WKARMAC2 will report by 8 December 2018 for attention to ACOM, SCICOM and WGBIOP.
ICES WKARMAC2 REPORT 2018 | 3
2 Agenda and participation
The workshop agenda is presented in Annex 1.
A total of 23 participants (Figure 2.1) attended the present Workshop from 14 laboratories of 12
European countries. The list of participants is presented in Annex 2.
Figure 2.1. WKARMAC2 participants, from left to right at the back: Vasiliki Papantoniou, Charo Navarro,
Poul Vestergaard, Selene Hoey, Mererte Kvalsund, Jens Ulleweit, Ørjan Sørensen, Jens Arni Thomassen,
Camilla Wentzel, Maria Jarnum, Andreia Silva, Tim Huijer, Eilert Hermansen, André Dijkman, Athanasios
Spetsiotis; from left to right in front: Iñaki Rico, Naiara Serrano, Gudrun Finnbogadóttir, Gitta Hemken,
Gertrud Delfs, Michelle Inglis, Kate Downes and Deirdre Lynch.
Only 11 WKARMAC2 participants took also part in the Small Scale Otolith Exchange in 2014.
Seven of them also attended last workshop (WKARMAC) in 2010. There has been a change of
mackerel readers since then. 16 WKARMAC2 participants also performed the otolith exchange
carried out a few weeks before the workshop. Two more readers, Jane Mills (Marine Lab, Scot-
land, UK) and Delfina Morais (IPMA,Portugal) could not attend the workshop but participated
in the workshop calibration exercise from their labs.
4 | ICES WKARMAC2 REPORT 2018
3 Update on known changes to the biology of mackerel
A summary of the biology of mackerel is given in the last workshop report (ICES WKARMAC
2010). During the 2018 workshop a presentation was given on the biology of mackerel with
special emphasis on the changes in distribution in stock sizes during the last decade.
Mackerel is a species of commercial importance and also a game fish. A pelagic, ocean and
coastal dwelling species, it has a depth range of 0 ‒ 1000 m. Occurring between 25°N – 70°N
and 77°W – 42°E, the mackerel is considered a temperate fish species that inhabits the eastern
Atlantic, southwestern Baltic Sea, Mediterranean and Black seas, and the western Atlantic from
Labrador to Cape Lookout (North Carolina). Mackerel are abundant in cold and temperate
shelf areas, but not found in water colder than 6°C (Nottestad et al. 2015). The species forms
large schools close to the surface with densities up to 9 fish/m³. They overwinter in deeper
waters, but move closer to shore in spring, when water temperatures range between 11 °C and
14 °C (Froese & Pauly, 2018; Muus et al., 1997; Muus and Nielsen, 1999). Mackerel do not have
a swimbladder and can therefore quickly change depth without suffering from pressure differ-
ences.
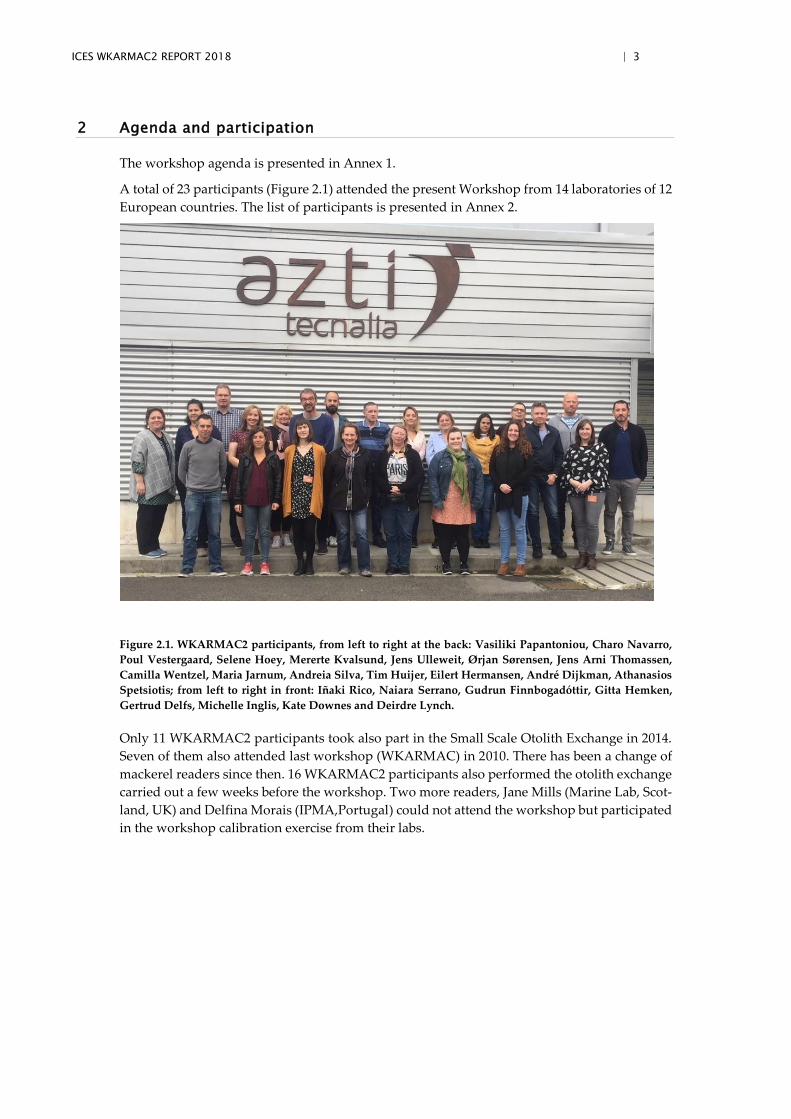
Its reported maximum size is 70cm (Navarro et al., 2012), the maximum weight 3-4kg. Picture
3.1 shows a 56 cm mackerel with a weight of 2.1kg and an estimated age of 18 years caught in
ICES area 6a. Mackerel mature at around the end of age 3 and at a length of ca. 30 cm.
Picture 3.1: 56cm mackerel caught in ICES area 6a
Mackerel is considered to be a determinate batch spawner meaning that all eggs to be spawned
are present as oocytes in the female ovary prior to spawning. Spawning occurs near the surface
mostly in a temperature range between 10.5 – 13.5°C (Ibaibariaga et al. 2007), the minimum
temperature for spawning is 8.5°C (ICES 2018a). Mackerel are producing 1000 – 1400 eggs/g
body weight (ICES 2017b) or 200.000–450.000 eggs/female in total. Egg diameter is around 1.2
mm diameter and the eggs have an oil globule. Depending on the water temperature, larvae
hatch within 6 days. Both, eggs and larvae are pelagic. Mackerel show a very fast growth within
the 1st year reaching 22 cm at the end of the year in which they were born, age group 0 (Vil-
lamor et al., 2004a).
Mackerel exhibit diurnal feeding activity. The diet of the adults consists of zooplankton and
small fish, juveniles mostly feed on copepods, euphausiids, crustacean larvae, and other zoo-
plankton (Olaso et al., 2005; Cabral et al., 2002). The availability of copepods of the genus
Calanus seems to be crucial for first-year survival (Jansen 2016). Mackerel itself are preyed
upon by sharks (porbeagle shark, spiny dogfish), cod, large pelagics like bluefin tuna and
ICES WKARMAC2 REPORT 2018 | 5
swordfish as well as whales (harbour porpoise, orca) and seals. Known parasites on mackerel
include monogenean, trematodes and nematodes (e.g. Anisakis simples) (Abaunza et al., 1995).
Mackerel is a temperate fish species which inhabits the Eastern Atlantic, the SW Baltic Sea, the
Mediterranean and Black Sea as well as the Western Atlantic from Labrador to Cape Lookout.
ICES currently uses the term “Northeast Atlantic mackerel” to define the mackerel present in
the area extending from ICES Division 9a in the south to Division 2a in the north, including
mackerel in the North Sea and Division 3a. Within this area mackerel is divided into three
spawning components according to the main spawning areas:
Western spawning component (ICES areas 6, 7, 5, 8abde)
Southern spawning component (ICES areas 8c, 9a)
North Sea component (ICES areas 4, 3a)
Post-spawning, mackerel migrate from their spawning to feeding grounds and a prespawning
migration with halts (=overwintering). Juveniles do not migrate as fast as adults (Uriarte et al.
2001). Larger and older fish reach furthest to the North and West during the feeding migrations
in summer.
Recent studies show for the North Sea spawning component, which was highly abundant in
the 1950s/60s but diminished in the 1970s, that these shifts might also be due to decreasing
temperatures in the North Sea and not only related to overfishing (Jansen 2013).
For the western and southern spawning component, spawning commences in February off the
Iberian Peninsula and continues in the Bay of Biscay, the Celtic Sea, Porcupine Bank and West
Scotland. Spawning continues until July when it ends in the northern areas. However, these
migrations patterns are not static but changing through time. This applies to times of peak
spawning within the year as well as with regards to the area of spawning, feeding and over-
wintering. (ICES 2017a,b, ICES 2018a,b).
In recent times, spawning has dramatically increased northwest of Scotland and is widely
spread into the open ocean, westerly off Rockall. Parts of the mackerel stock are also following
new post-spawning and feeding migrations (paths along the Southern coast of Iceland to
Greenlandic waters). The feeding grounds in the Nordic Sea are far more widely spread into
Western and Northern regions than a decade ago. All these changes are discussed in relation
to temperature changes (Bruge et al. 2016, Berge et al. 2015, Brunel et al. 2017), prey availability
(Pacariz et al. 2016, Berge et al. 2015, Brunel et al. 2017) and stock size meaning density-depend-
ent mechanism (Pacariz et al. 2016). Additional information on mackerel distribution shifts can
be found in the report of the ICES workshop on Fish Distribution Shifts (ICES 2017a). In Aegean
Sea, spawning season begins at the end of Spring-early summer.
These changes in migration patterns are mirrored by the development of the commercial
catches over time. Since 2007, the importance of the traditional fishing grounds has declined
and an expansion of mackerel fisheries in Faroese, Icelandic and Greenlandic waters has taken
place. However, the spawning-stock biomass of mackerel which has increased in the late 2000s
to a maximum in 2011 is presently decreasing. The stock is estimated to be below the biological
reference point MSY Btrigger in 2018, for the first time since 2007 (ICES 2018b).
6 | ICES WKARMAC2 REPORT 2018
4 Review information on age estimations, otolith exchanges, workshops
and validation work (ToR a)
The frequency of workshops and exchanges on age reading of mackerel in the past is far from
impressive. The first reported workshop on mackerel ageing was held in Lowestoft in 1987 and
following that only two workshops has been held (in 1995 in Spain and 2010 in Lowestoft).
Exchanges were carried out in 2002, 2008 and 2014 respectively. All previous workshops and
exchanges have had an outcome stating the overall agreement to be somewhat low but fair, but
also skewed towards having a higher agreement on the younger ages. All workshops discussed
and made an effort to standardize age reading methods by preparing a manual and a reference
collection of agreed age otoliths.
4.1 Exchanges and Workshops
The first exchange and workshop held in 1986 and 1987 respectively, had as the first priority to
assess the agreement level on the older mackerel, as the assessment working group on mackerel
at the time wanted to review the applied plus-group (11+). The participants read through two
collections of otoliths, one consisting of otoliths covering all age groups and one holding par-
ticularly older individuals for comparison.
The workshop had access to a small number of known-age otoliths which proved very valuable
in ironing out discrepancies in the interpretation of the appearance of the edge (opaque/trans-
lucent) and timing of the age-structures. This appeared to be area specific within the same sea-
son.
The overall agreement was calculated using a different method than what has been used in
later workshops; however, the agreement percentage was in the better range (0.3 in a range of
0.0 being perfect agreement and 0.83 being total disagreement). Of particular interest was that
the agreement on the set of otoliths comprised of older individuals did not differ significantly
from the agreement on the ‘normal’ set of otoliths. The conclusion of the workshop was thus
that the age estimation of older individuals was not associated with a higher variation between
readers than age reading of younger individuals and the workshop concluded that the plus-
group in the assessment could be expanded to be 15+.
The second workshop, held a decade later, in 1995 (ICES 1995) had as objectives to evaluate a
preceding exchange (Villamor and Meixide, 1995), discuss and standardize age reading meth-
ods by preparing a manual and a reference collection and give advice on which age groups
valid age reading could be achieved. The participants worked with extensive material, no less
than 6 sets of otoliths were read prior to and during the workshop, differing in various ways
concerning the area and age-range of the otolith set.
Similar to the workshop in 1987, the readers had access to a number of known-age otoliths from
a Norwegian tag-release program, and again this set of otoliths proved very valuable in dis-
cussions and aided in the creation of age reading criteria for mackerel.
The readers participating in the workshop reached an overall agreement of around 70%, de-
pending upon the sample. The sampling area significantly influenced the degree of agreement
and contrary to the findings in the workshop in 1987; the older fish had a tendency to be un-
derestimated compared to modal age. For the known-age set; the agreement was 76%.
In conclusion; the age-reading technique was validated up to age 8 (as bias was observed in the
ages of older fish). The workshop recommended the plus-group for the assessment of mackerel
to be 12+. The workshop concluded that an appropriate measure of precision would be 2.00 for
2stdev from the modal and assigned age.
ICES WKARMAC2 REPORT 2018 | 7
A small-scale exchange of mackerel otoliths was completed in 2002. The objectives of the ex-
change were to monitor the precision of age readings, following the protocols established by
EFAN (FAIR concerted action PL96/1304,) and to collate a reference database of otolith images
from the exchange material. Only 6 institutes participated in the exchange and thus the scale
was somewhat smaller than other exchanges.
The conclusion from the exchange was that the precision drops significantly after age 4, and
although two institutes did show an improvement in precision from the previous workshop in
1995, the remaining readers showed little improvement. The project concluded that further ex-
changes and workshops on mackerel were highly warranted.
After the exchange of 2002, veteran readers departed and new readers were recruited. A new
exchange in 2008 was carried out to ensure consensus between these new readers. Overall
agreement was 67.6%, overall CV was 23.8% and relative bias in age determination by individ-
ual experts ranged between -0.59 and +0.45. There were 12 otoliths with complete agreement
on age between the 15 experts. These otoliths tended to be among the youngest individuals.
The large discrepancies between age determinations highlighted the need to hold a workshop.
This workshop was held in 2010 (ICES 2010). The objectives were to assess the level of agree-
ment between readers and labs, to analyse the differences in age reading interpretation of oto-
lith spatial patterns, to explore the usage of metric measurements of otolith structures as a
solution to minimize divergence in age estimation, and for the first time to test image-based
reading and OMAP as a new tool for aging workshops. 100 otolith images (ICES div. 4 and 7),
sampled by IMARES and photographed by DTU-AQUA were used. The readers aged the oto-
liths by marking winter rings on the digital images viewed in OMAP v.1.3 (Jansen, 2010 871/id).
The exercise was run twice, one a few days before the workshop (part I) and one during the
workshop (part II). Overall agreement was low (25%), substantially lower than the exchange of
2008 (67.6%). This may be due to several factors, the most important being that this study did
not take into account neither the experience level, nor continuity of the participants in mackerel
age estimation. Also, the rather low % agreement could be a result of poor image quality and
the unfamiliarity, by the majority of readers, to age mackerel otoliths exclusively using images.
The poor level of agreement between readers obtained in the exchange carried out during the
workshop and the need to put into practice the new set of age determination criteria that were
established at the workshop highlighted the need for another exchange post-workshop. The
exchange had a short timescale and was completed shortly after the workshop (December
2010). A total of 11 institutes took part in the exchange. The software used to analyse the results
was the ORACLE (Otolith Reading Age Comparisons) spreadsheet, developed by Cefas from
the Etink et al (2000) “Age Comparison Worksheet”. 248 otolith images from 5 ICES divisions
(2a, 5b, 4, 7f and 8) were used in the exchange. The results were better than the pre-workshop
exchange. Overall agreement was 78.1%. Agreement rates with the modal age ranged from
71.7% to 85.1%. The bias scores showed a range from -0.30 to +0.22, with an overall bias of +0.01.
The last exchange between European mackerel otolith reading institutes took place in 2014
(Ulleweit, 2014). A set of 164 images of mackerel otoliths were selected and uploaded for ana-
lysing using the WebGR application. 16 mackerel age readers participated in the exchange.
Overall agreement was 68.2%. Good agreements were reached for age 1 and 2 (93 and 92%,
resp.), for age 3 and 4 agreements were between 74 and 76%, agreement for age 5 is 61% and
for age 6 and 7 57%. Only very low agreement was found for the older ages 8 to 14 (between
47% for age 8 and 31% for age 13).
Two additional analyses were performed: Analysis only done with the expert group showed a
higher overall agreement of 75.5%, analysis referring to experts and intermediate (14 readers)
8 | ICES WKARMAC2 REPORT 2018
showed an overall agreement of 70.4%, still slightly higher than the agreement between all
readers.
Overall conclusion was that there was certainly room for improvement both in terms of con-
sistency and agreement between readers. More effort needed to put into the age determination
for older mackerel.
4.2 Validation work
The existing material of such work is rather limited, particularly related to the actual yearly age
structures of mackerel otoliths.
Captive rearing
This method validates both absolute age and periodicity of growth structures (Campana, 2001).
The deposition of daily growth rings in larvae, post-larvae and juveniles of mackerel was vali-
dated by Migoya (1989) and D’Amouset et al. (1990) in several areas in Northwest Atlantic, and
by Mendiola and Álvarez (2008) in Northeast Atlantic. Migoya (1989) and Mendiola and Alva-
rez (2008) incubated mackerel eggs in the laboratory and showed that the deposit of the first
increment in the otolith occurred on the hatching day and that the increments were formed
daily. In addition, D’Amours et al. (1990) performed a validation experiment on mackerel juve-
niles in captivity, marking their otoliths with a fluorescent substance and showing that the in-
crements were deposited on a daily basis. These studies give the potential for validating the
first years of growth, making standards (L1, etc.) and ruling out double structures in the first
years of life. Knowing that the microstructure is daily, it may be possible through analysis of
the combined transparency and width of the daily rings on the edge of juveniles over the season
to validate the formation of the first and potentially following 2-3 age structures.
Marginal Increment Analysis
The Marginal Increment Analysis (MIA) is the most commonly used of the validation methods,
and it is used for validating the periodicity of growth increment formation (Campana, 2001).
Two types of studies are possible, one that uses quality data and other that uses quantitative
data (Panfili et al., 2002). Only a qualitative analysis in mackerel otoliths has been performed
by Gordo and Martins (1982) off the Portugal Coast. During the workshop a study of the sea-
sonal formation of growth rings in otoliths of NEA mackerel in ICES Div. 8c and 9a (Villamor
et al., presentation to WKARMAC2 2018) was presented (see section 6).
Mark-Recapture experiments
The Norwegian Mark-Recaptured experiments have provided otoliths which are potentially
the golden stones and could iron out many subjective assumptions related to the age estimation
of mackerel from this area (and potentially other areas). During the current workshop otoliths
from the Norwegian Mark-Recapture experiments were available and used for an exercise.
These otoliths are from mackerel which were tagged between 20–28cm and recaptured after a
known number of years. Results of the exercise are given in section 5 of this report.
ICES WKARMAC2 REPORT 2018 | 9
5 Resolve interpretation differences between readers and laboratories;
most recent exchange and workshop exercise (ToR b)
5.1 Pre-workshop exercise
An otolith exchange was carried out a few weeks before the workshop took place. As the last
exchange was performed four years before (2014), a number of otolith readers had been re-
placed by new ones and this exchange would provide more accurate information about the
level of agreement of current readers before the workshop. Also, this exchange would provide
otolith images with the participants’ readings to be discussed during the workshop as the pro-
gram used in last exchange, WebGR, is no longer available, not even for the otolith reading
discussion.
The exchange was carried out via SmartDots (http://www.ices.dk/marine-
data/tools/Pages/smartdots.aspx), the web application developed by ICES to facilitate the setup
of Exchanges, Workshops and Training events. A total of 135 otolith images from the main
areas of mackerel distribution were included in the exchange. Following the recommendations
of WKMACQI (Workshop on Mackerel biological parameter Quality Indicators) (ICES 2018c),
it was attempted that the spatial and temporal coverage, as well as the length and age range,
of the mackerel otoliths of the exchange corresponded with the coverage in the assessment,
(ICES Div. 2a, 4bc, 5ab, 7bjd, 8bc, 9a, 14b). Otolith images from areas 2b, 4a, 6a and 6b were also
requested to the laboratories that work with otoliths of these areas but were not provided on
time.
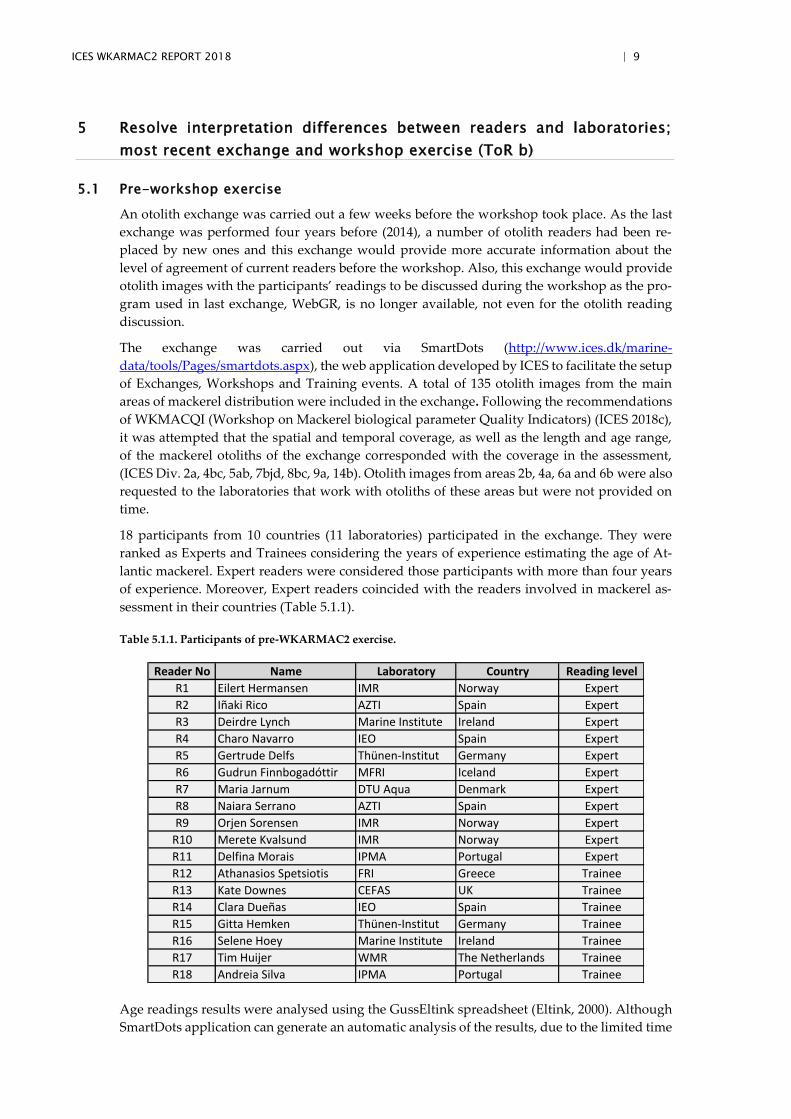
18 participants from 10 countries (11 laboratories) participated in the exchange. They were
ranked as Experts and Trainees considering the years of experience estimating the age of At-
lantic mackerel. Expert readers were considered those participants with more than four years
of experience. Moreover, Expert readers coincided with the readers involved in mackerel as-
sessment in their countries (Table 5.1.1).
Table 5.1.1. Participants of pre-WKARMAC2 exercise.
Age readings results were analysed using the GussEltink spreadsheet (Eltink, 2000). Although
SmartDots application can generate an automatic analysis of the results, due to the limited time
Reader No Name Laboratory Country Reading level
R1 Eilert Hermansen IMR Norway Expert
R2 Iñaki Rico AZTI Spain Expert
R3 Deirdre Lynch Marine Institute Ireland Expert
R4 Charo Navarro IEO Spain Expert
R5 Gertrude Delfs Thünen-Institut Germany Expert
R6 Gudrun Finnbogadóttir MFRI Iceland Expert
R7 Maria Jarnum DTU Aqua Denmark Expert
R8 Naiara Serrano AZTI Spain Expert
R9 Orjen Sorensen IMR Norway Expert
R10 Merete Kvalsund IMR Norway Expert
R11 Delfina Morais IPMA Portugal Expert
R12 Athanasios Spetsiotis FRI Greece Trainee
R13 Kate Downes CEFAS UK Trainee
R14 Clara Dueñas IEO Spain Trainee
R15 Gitta Hemken Thünen-Institut Germany Trainee
R16 Selene Hoey Marine Institute Ireland Trainee
R17 Tim Huijer WMR The Netherlands Trainee
R18 Andreia Silva IPMA Portugal Trainee
10 | ICES WKARMAC2 REPORT 2018
available to obtain the results before the workshop and that the application still has some lim-
itations when selecting the options of the analysis, it was decided to use the Eltink spreadsheet
for the analysis instead.
In addition to estimating the age of the otoliths included in the exchange, readers were asked
to assign the quality to each reading according to the “3 points grading system” (AQ1, AQ2,
AQ3) recommended by WKNARC (ICES, 2011). Readings with AQ3 were not taken into ac-
count in the analyses. Analyses were performed for the total of areas and all readers and Expert
and Trainee readers separately. Additional analyses were performed by each of the four areas
of mackerel distribution: Southern component (ICES div. 9a, 8c), Western component (ICES
div. 8b, 7bjd), North Sea component (ICES div. 4bc) and Northern distribution (ICES div. 2a,
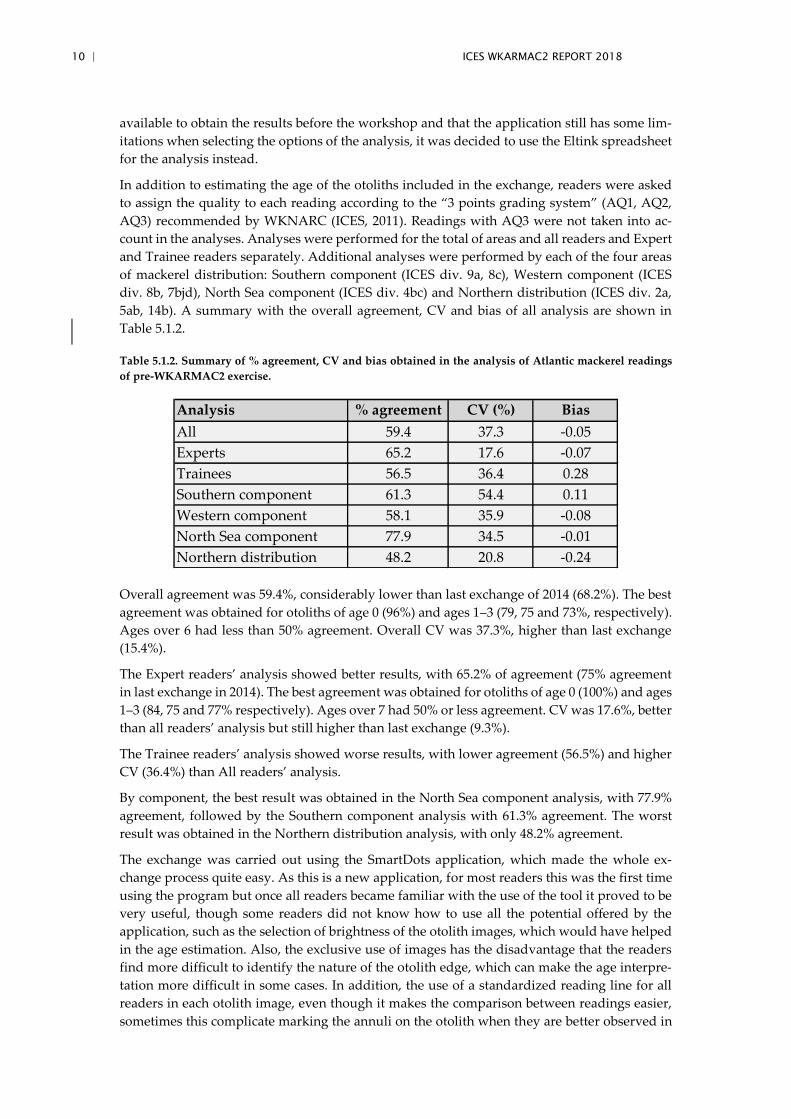
5ab, 14b). A summary with the overall agreement, CV and bias of all analysis are shown in
Table 5.1.2.
Table 5.1.2. Summary of % agreement, CV and bias obtained in the analysis of Atlantic mackerel readings
of pre-WKARMAC2 exercise.
Overall agreement was 59.4%, considerably lower than last exchange of 2014 (68.2%). The best
agreement was obtained for otoliths of age 0 (96%) and ages 1–3 (79, 75 and 73%, respectively).
Ages over 6 had less than 50% agreement. Overall CV was 37.3%, higher than last exchange
(15.4%).
The Expert readers’ analysis showed better results, with 65.2% of agreement (75% agreement
in last exchange in 2014). The best agreement was obtained for otoliths of age 0 (100%) and ages
1–3 (84, 75 and 77% respectively). Ages over 7 had 50% or less agreement. CV was 17.6%, better
than all readers’ analysis but still higher than last exchange (9.3%).
The Trainee readers’ analysis showed worse results, with lower agreement (56.5%) and higher
CV (36.4%) than All readers’ analysis.
By component, the best result was obtained in the North Sea component analysis, with 77.9%
agreement, followed by the Southern component analysis with 61.3% agreement. The worst
result was obtained in the Northern distribution analysis, with only 48.2% agreement.
The exchange was carried out using the SmartDots application, which made the whole ex-
change process quite easy. As this is a new application, for most readers this was the first time
using the program but once all readers became familiar with the use of the tool it proved to be
very useful, though some readers did not know how to use all the potential offered by the
application, such as the selection of brightness of the otolith images, which would have helped
in the age estimation. Also, the exclusive use of images has the disadvantage that the readers
find more difficult to identify the nature of the otolith edge, which can make the age interpre-
tation more difficult in some cases. In addition, the use of a standardized reading line for all
readers in each otolith image, even though it makes the comparison between readings easier,
sometimes this complicate marking the annuli on the otolith when they are better observed in
Analysis % agreement CV (%) Bias
All 59.4 37.3 -0.05
Experts 65.2 17.6 -0.07
Trainees 56.5 36.4 0.28
Southern component 61.3 54.4 0.11
Western component 58.1 35.9 -0.08
North Sea component 77.9 34.5 -0.01
Northern distribution 48.2 20.8 -0.24
ICES WKARMAC2 REPORT 2018 | 11
another area of the otolith. However, the use of images allows a better comparison between the
readers’ estimations and a better identification of the problems in locating false rings, as well
as speeding up the process. The use of SmartDots is especially useful for a posterior discussion
on screen of the most significant otoliths during the workshop.
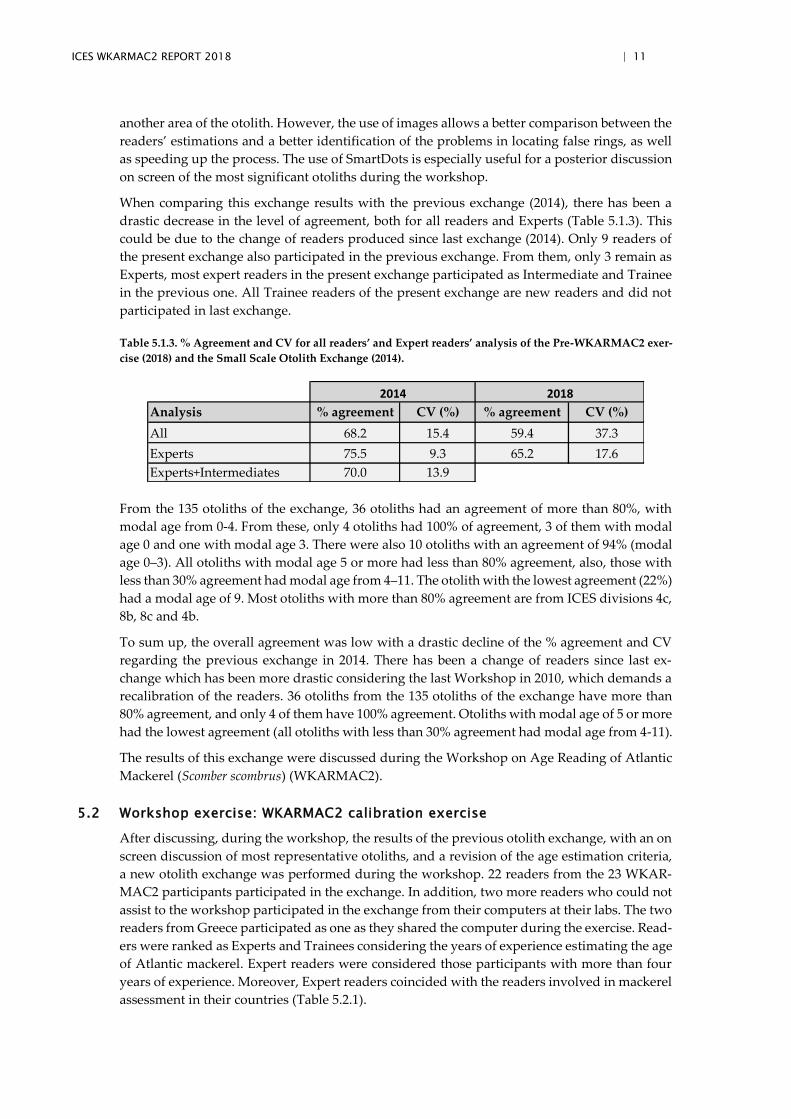
When comparing this exchange results with the previous exchange (2014), there has been a
drastic decrease in the level of agreement, both for all readers and Experts (Table 5.1.3). This
could be due to the change of readers produced since last exchange (2014). Only 9 readers of
the present exchange also participated in the previous exchange. From them, only 3 remain as
Experts, most expert readers in the present exchange participated as Intermediate and Trainee
in the previous one. All Trainee readers of the present exchange are new readers and did not
participated in last exchange.
Table 5.1.3. % Agreement and CV for all readers’ and Expert readers’ analysis of the Pre-WKARMAC2 exer-
cise (2018) and the Small Scale Otolith Exchange (2014).
From the 135 otoliths of the exchange, 36 otoliths had an agreement of more than 80%, with
modal age from 0-4. From these, only 4 otoliths had 100% of agreement, 3 of them with modal
age 0 and one with modal age 3. There were also 10 otoliths with an agreement of 94% (modal
age 0–3). All otoliths with modal age 5 or more had less than 80% agreement, also, those with
less than 30% agreement had modal age from 4–11. The otolith with the lowest agreement (22%)
had a modal age of 9. Most otoliths with more than 80% agreement are from ICES divisions 4c,
8b, 8c and 4b.
To sum up, the overall agreement was low with a drastic decline of the % agreement and CV
regarding the previous exchange in 2014. There has been a change of readers since last ex-
change which has been more drastic considering the last Workshop in 2010, which demands a
recalibration of the readers. 36 otoliths from the 135 otoliths of the exchange have more than
80% agreement, and only 4 of them have 100% agreement. Otoliths with modal age of 5 or more
had the lowest agreement (all otoliths with less than 30% agreement had modal age from 4-11).
The results of this exchange were discussed during the Workshop on Age Reading of Atlantic
Mackerel (Scomber scombrus) (WKARMAC2).
5.2 Workshop exercise: WKARMAC2 calibration exercise
After discussing, during the workshop, the results of the previous otolith exchange, with an on
screen discussion of most representative otoliths, and a revision of the age estimation criteria,
a new otolith exchange was performed during the workshop. 22 readers from the 23 WKAR-
MAC2 participants participated in the exchange. In addition, two more readers who could not
assist to the workshop participated in the exchange from their computers at their labs. The two
readers from Greece participated as one as they shared the computer during the exercise. Read-
ers were ranked as Experts and Trainees considering the years of experience estimating the age
of Atlantic mackerel. Expert readers were considered those participants with more than four
years of experience. Moreover, Expert readers coincided with the readers involved in mackerel
assessment in their countries (Table 5.2.1).
Analysis % agreement CV (%) % agreement CV (%)
All 68.2 15.4 59.4 37.3
Experts 75.5 9.3 65.2 17.6
Experts+Intermediates 70.0 13.9
2014 2018
12 | ICES WKARMAC2 REPORT 2018
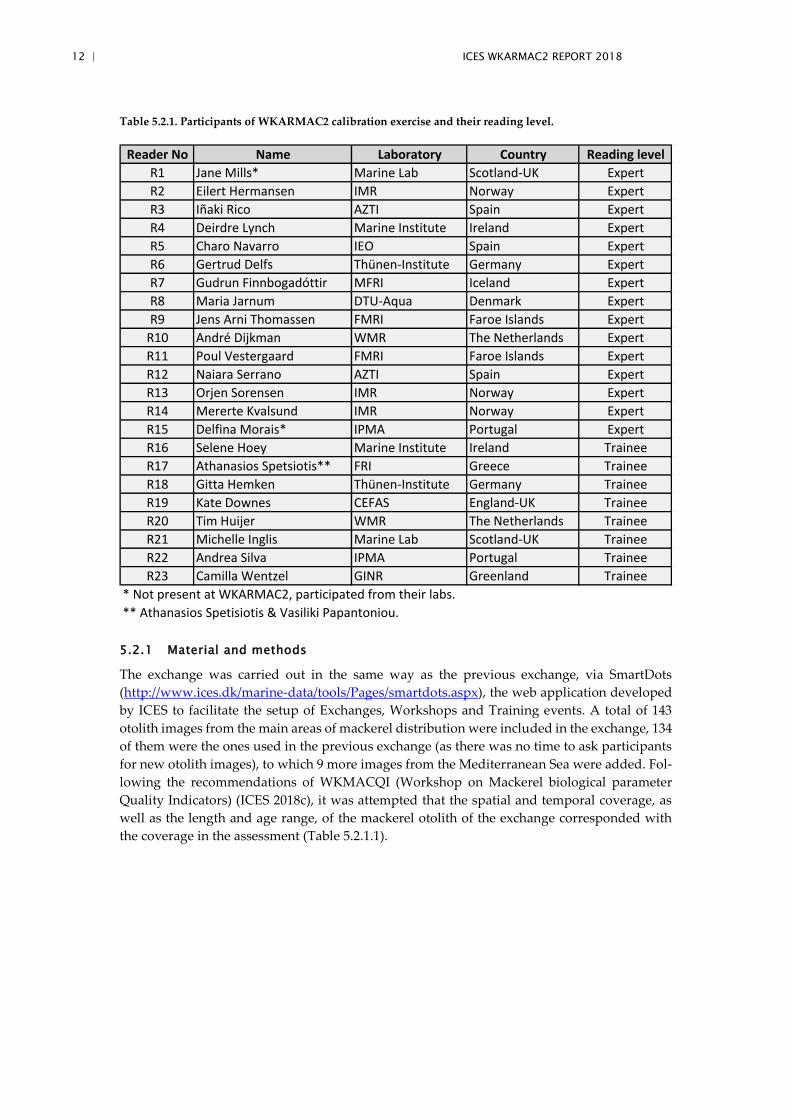
Table 5.2.1. Participants of WKARMAC2 calibration exercise and their reading level.
5.2.1 Material and methods
The exchange was carried out in the same way as the previous exchange, via SmartDots
(http://www.ices.dk/marine-data/tools/Pages/smartdots.aspx), the web application developed
by ICES to facilitate the setup of Exchanges, Workshops and Training events. A total of 143
otolith images from the main areas of mackerel distribution were included in the exchange, 134
of them were the ones used in the previous exchange (as there was no time to ask participants
for new otolith images), to which 9 more images from the Mediterranean Sea were added. Fol-
lowing the recommendations of WKMACQI (Workshop on Mackerel biological parameter
Quality Indicators) (ICES 2018c), it was attempted that the spatial and temporal coverage, as
well as the length and age range, of the mackerel otolith of the exchange corresponded with
the coverage in the assessment (Table 5.2.1.1).
Reader No Name Laboratory Country Reading level
R1 Jane Mills* Marine Lab Scotland-UK Expert
R2 Eilert Hermansen IMR Norway Expert
R3 Iñaki Rico AZTI Spain Expert
R4 Deirdre Lynch Marine Institute Ireland Expert
R5 Charo Navarro IEO Spain Expert
R6 Gertrud Delfs Thünen-Institute Germany Expert
R7 Gudrun Finnbogadóttir MFRI Iceland Expert
R8 Maria Jarnum DTU-Aqua Denmark Expert
R9 Jens Arni Thomassen FMRI Faroe Islands Expert
R10 André Dijkman WMR The Netherlands Expert
R11 Poul Vestergaard FMRI Faroe Islands Expert
R12 Naiara Serrano AZTI Spain Expert
R13 Orjen Sorensen IMR Norway Expert
R14 Mererte Kvalsund IMR Norway Expert
R15 Delfina Morais* IPMA Portugal Expert
R16 Selene Hoey Marine Institute Ireland Trainee
R17 Athanasios Spetsiotis** FRI Greece Trainee
R18 Gitta Hemken Thünen-Institute Germany Trainee
R19 Kate Downes CEFAS England-UK Trainee
R20 Tim Huijer WMR The Netherlands Trainee
R21 Michelle Inglis Marine Lab Scotland-UK Trainee
R22 Andrea Silva IPMA Portugal Trainee
R23 Camilla Wentzel GINR Greenland Trainee
* Not present at WKARMAC2, participated from their labs.
** Athanasios Spetisiotis & Vasiliki Papantoniou.
ICES WKARMAC2 REPORT 2018 | 13
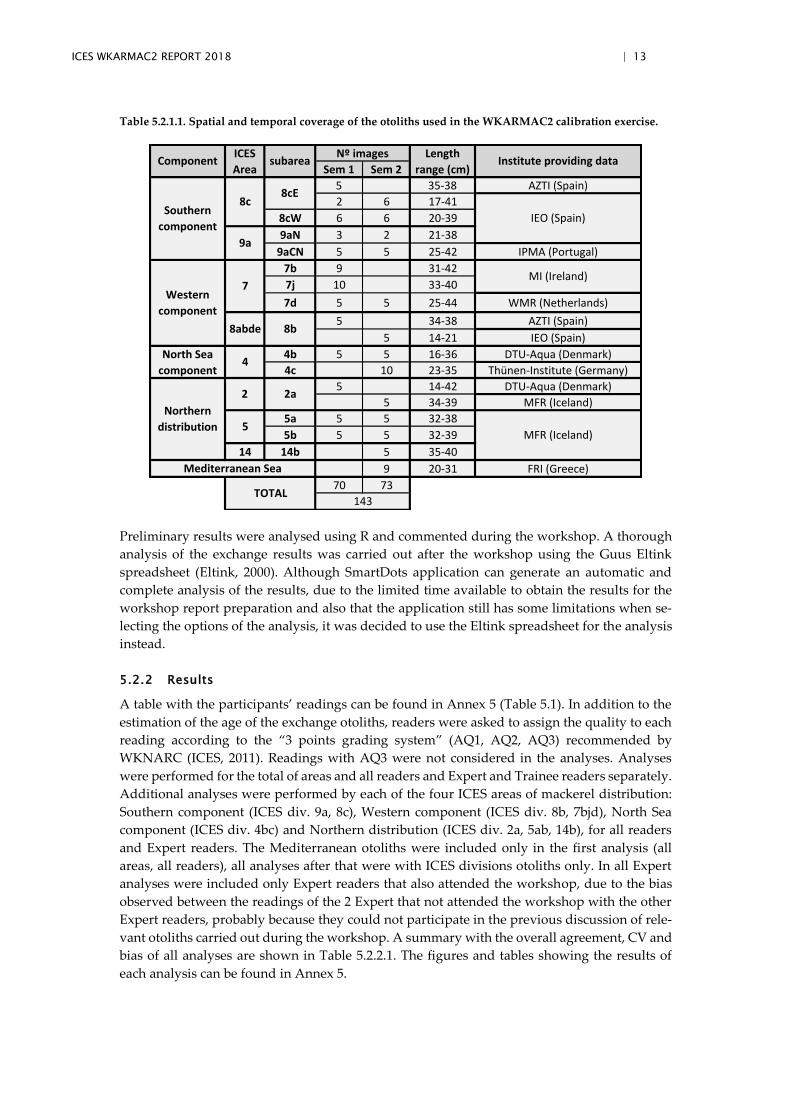
Table 5.2.1.1. Spatial and temporal coverage of the otoliths used in the WKARMAC2 calibration exercise.
Preliminary results were analysed using R and commented during the workshop. A thorough
analysis of the exchange results was carried out after the workshop using the Guus Eltink
spreadsheet (Eltink, 2000). Although SmartDots application can generate an automatic and
complete analysis of the results, due to the limited time available to obtain the results for the
workshop report preparation and also that the application still has some limitations when se-
lecting the options of the analysis, it was decided to use the Eltink spreadsheet for the analysis
instead.
5.2.2 Results
A table with the participants’ readings can be found in Annex 5 (Table 5.1). In addition to the
estimation of the age of the exchange otoliths, readers were asked to assign the quality to each
reading according to the “3 points grading system” (AQ1, AQ2, AQ3) recommended by
WKNARC (ICES, 2011). Readings with AQ3 were not considered in the analyses. Analyses
were performed for the total of areas and all readers and Expert and Trainee readers separately.
Additional analyses were performed by each of the four ICES areas of mackerel distribution:
Southern component (ICES div. 9a, 8c), Western component (ICES div. 8b, 7bjd), North Sea
component (ICES div. 4bc) and Northern distribution (ICES div. 2a, 5ab, 14b), for all readers
and Expert readers. The Mediterranean otoliths were included only in the first analysis (all
areas, all readers), all analyses after that were with ICES divisions otoliths only. In all Expert
analyses were included only Expert readers that also attended the workshop, due to the bias
observed between the readings of the 2 Expert that not attended the workshop with the other
Expert readers, probably because they could not participate in the previous discussion of rele-
vant otoliths carried out during the workshop. A summary with the overall agreement, CV and
bias of all analyses are shown in Table 5.2.2.1. The figures and tables showing the results of
each analysis can be found in Annex 5.
Sem 1 Sem 2
5 35-38 AZTI (Spain)
2 6 17-41
8cW 6 6 20-39
9aN 3 2 21-38
9aCN 5 5 25-42 IPMA (Portugal)
7b 9 31-42
7j 10 33-40
7d 5 5 25-44 WMR (Netherlands)
5 34-38 AZTI (Spain)
5 14-21 IEO (Spain)
4b 5 5 16-36 DTU-Aqua (Denmark)
4c 10 23-35 Thünen-Institute (Germany)
5 14-42 DTU-Aqua (Denmark)
5 34-39 MFR (Iceland)
5a 5 5 32-38
5b 5 5 32-39
14 14b 5 35-40
9 20-31 FRI (Greece)
70 73
Institute providing data
Southern
component
8c8cE
IEO (Spain)
9a
ComponentICES
Areasubarea
Nº images Length
range (cm)
MI (Ireland)
TOTAL
Northern
distribution
2 2a
5MFR (Iceland)
143
8abde 8b
Western
component
North Sea
component4
7
Mediterranean Sea
14 | ICES WKARMAC2 REPORT 2018
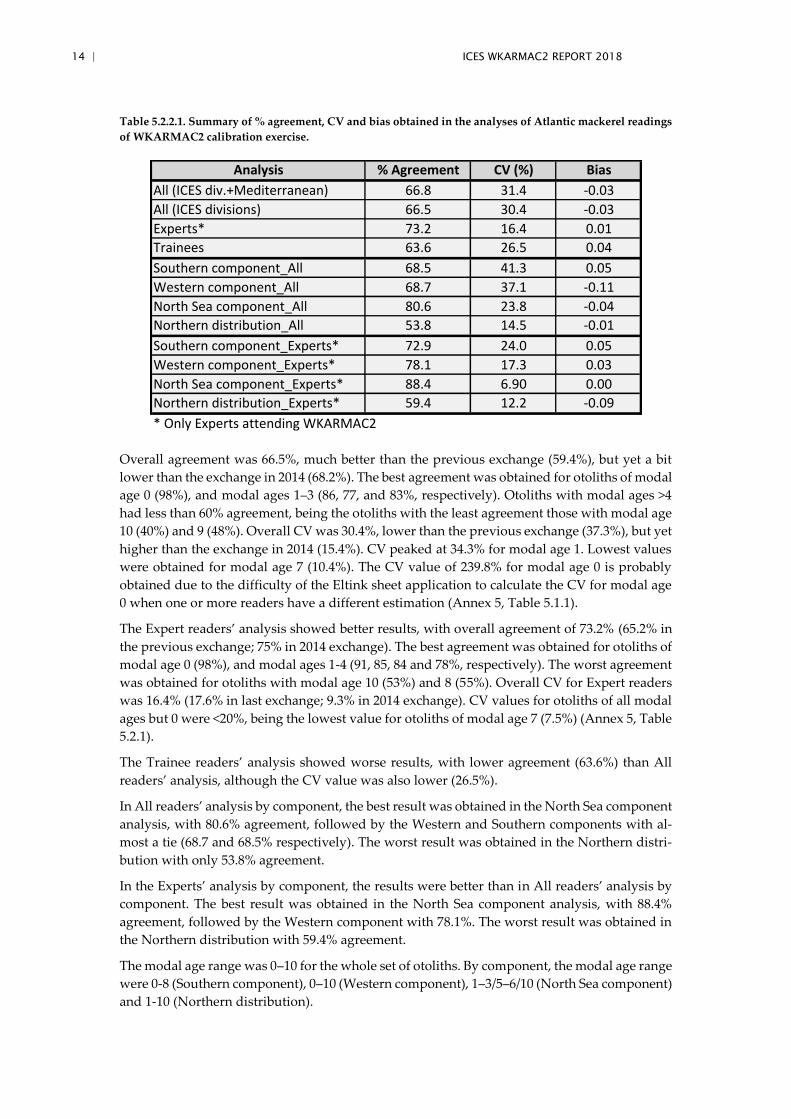
Table 5.2.2.1. Summary of % agreement, CV and bias obtained in the analyses of Atlantic mackerel readings
of WKARMAC2 calibration exercise.
Overall agreement was 66.5%, much better than the previous exchange (59.4%), but yet a bit
lower than the exchange in 2014 (68.2%). The best agreement was obtained for otoliths of modal
age 0 (98%), and modal ages 1–3 (86, 77, and 83%, respectively). Otoliths with modal ages >4
had less than 60% agreement, being the otoliths with the least agreement those with modal age
10 (40%) and 9 (48%). Overall CV was 30.4%, lower than the previous exchange (37.3%), but yet
higher than the exchange in 2014 (15.4%). CV peaked at 34.3% for modal age 1. Lowest values
were obtained for modal age 7 (10.4%). The CV value of 239.8% for modal age 0 is probably
obtained due to the difficulty of the Eltink sheet application to calculate the CV for modal age
0 when one or more readers have a different estimation (Annex 5, Table 5.1.1).
The Expert readers’ analysis showed better results, with overall agreement of 73.2% (65.2% in
the previous exchange; 75% in 2014 exchange). The best agreement was obtained for otoliths of
modal age 0 (98%), and modal ages 1-4 (91, 85, 84 and 78%, respectively). The worst agreement
was obtained for otoliths with modal age 10 (53%) and 8 (55%). Overall CV for Expert readers
was 16.4% (17.6% in last exchange; 9.3% in 2014 exchange). CV values for otoliths of all modal
ages but 0 were <20%, being the lowest value for otoliths of modal age 7 (7.5%) (Annex 5, Table
5.2.1).
The Trainee readers’ analysis showed worse results, with lower agreement (63.6%) than All
readers’ analysis, although the CV value was also lower (26.5%).
In All readers’ analysis by component, the best result was obtained in the North Sea component
analysis, with 80.6% agreement, followed by the Western and Southern components with al-
most a tie (68.7 and 68.5% respectively). The worst result was obtained in the Northern distri-
bution with only 53.8% agreement.
In the Experts’ analysis by component, the results were better than in All readers’ analysis by
component. The best result was obtained in the North Sea component analysis, with 88.4%
agreement, followed by the Western component with 78.1%. The worst result was obtained in
the Northern distribution with 59.4% agreement.
The modal age range was 0–10 for the whole set of otoliths. By component, the modal age range
were 0-8 (Southern component), 0–10 (Western component), 1–3/5–6/10 (North Sea component)
and 1-10 (Northern distribution).
Analysis % Agreement CV (%) Bias
All (ICES div.+Mediterranean) 66.8 31.4 -0.03
All (ICES divisions) 66.5 30.4 -0.03
Experts* 73.2 16.4 0.01
Trainees 63.6 26.5 0.04
Southern component_All 68.5 41.3 0.05
Western component_All 68.7 37.1 -0.11
North Sea component_All 80.6 23.8 -0.04
Northern distribution_All 53.8 14.5 -0.01
Southern component_Experts* 72.9 24.0 0.05
Western component_Experts* 78.1 17.3 0.03
North Sea component_Experts* 88.4 6.90 0.00
Northern distribution_Experts* 59.4 12.2 -0.09
* Only Experts attending WKARMAC2
ICES WKARMAC2 REPORT 2018 | 15
The results of the inter-reader bias test and reader against modal age bias test are shown in
Table 5.1.2 (Annex 5). Only readers 2, 5, 8, 9, 17, 19 and 20 showed no bias against the modal
age (in all readers’ analysis). Reader 15 showed bias with all the other readers. Also, readers 1,
4, 6 and 22 showed bias with most readers. Readers 8, 19 and 21 had better results in the inter-
reader bias test. By component, the best results of the inter-reader bias test and reader against
modal bias test were obtained for the North Sea component, with almost no bias between read-
ers, especially between Expert readers (Annex 5, Table 5.4.3.2), followed by the Western com-
ponent, where reader 15 stands out showing bias with all the other readers, while the other
readers practically showed no bias between them (Annex 5, Table 5.4.2.2) and Southern com-
ponent, with readers 4 and 15 showing bias with most readers and also readers 6, 11, 22 and 23
showing bias with some other readers (Annex 5, Table 5.4.1.2). Worst results were obtained for
the Northern distribution with more bias between readers (Annex 5, Table 5.4.4.2).
Figure 5.1.2 (Annex 5) shows age bias plots with the mean age recorded and the standard de-
viation of each age reader an all readers combined plotted against the modal age. Reader 1
showed underestimation according to the modal age, which was more pronounced for Reader
15. Readers 4, 6, 16, 22 and 23 showed underestimations in older ages regarding the modal age.
Readers 8 and 20 also showed less prominent underestimation in older ages. Readers 19 and
20 showed light overestimation in younger ages followed by light underestimation in older
ages regarding the modal age; this pattern was more pronounced for reader 17. Readers 10, 13,
14 and 18 showed light overestimation in all ages regarding the modal age, which was more
pronounced for reader 11. The rest of the readers showed a more accurate estimation according
the modal age. As the overall agreement between readers is lower with older ages, the standard
deviations are also mostly higher for the older ages for all readers combined (Annex 5, Figure
5.1.1). Similar trends are shown for Experts and Trainees separately (Annex 5, Figures 5.2.1,
5.2.2, 5.3.1 and 5.3.2).
5.2.3 Conclusions and evaluation of the exercise
The exercise was carried out using the SmartDots application, which made the whole exchange
process quite easy. This was the second time using this application for most readers, who were
more familiar with it. However, some of the problems showed in the pre-WKARMAC2 exercise
persisted in the present exercise, mainly the position of the reading line, as sometimes the an-
nuli would be better observed in other areas of the otoliths and the difficulty of observing the
nature of the edge in the images. However, once again, the use of images allowed a better com-
parison between the readers’ estimations and a better identification of the problems in locating
false rings, as well as to speed up the process. Also, the use of SmartDots was especially useful
for a posterior on screen discussion of the most significant otoliths during the workshop.
Average percentage of agreement (66.8%) and CV (31.4%) for all components and readers were
much better than the pre-WKARMAC2 exercise (59.4% agreement and 37.3% CV), but still
slightly lower than the previous exchange in 2014 (68.2% and 15.4%, respectively). The results
of the Expert readers were much better than the results of all reads (73.2% agreement, 16.4%
CV), but once again, still slightly worse than the previous exchange in 2014 (75.5% agreement,
9.3% CV); whereas the results of the Trainee readers were slightly worse than the results of all
readers (63.6% agreement, 26.5% CV). But in general, there was a good improvement in the
results regarding the pre-WKARMAC2 exercise (Table 5.2.3.1).
16 | ICES WKARMAC2 REPORT 2018
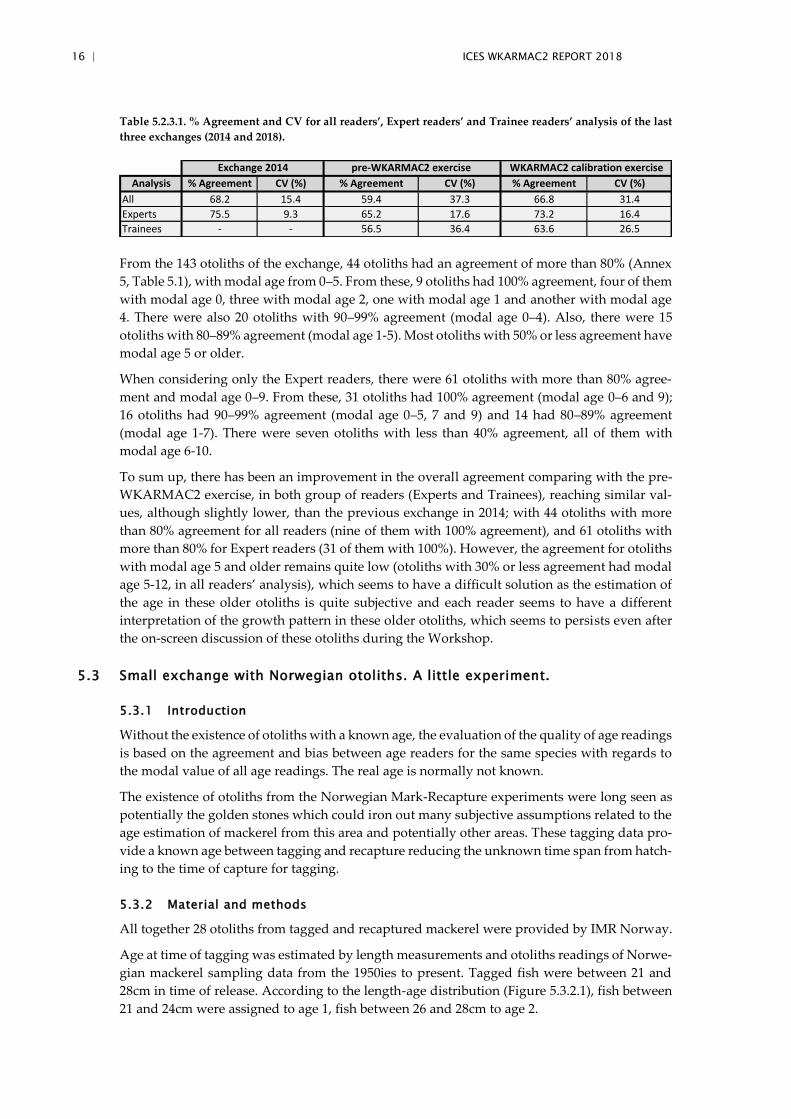
Table 5.2.3.1. % Agreement and CV for all readers’, Expert readers’ and Trainee readers’ analysis of the last
three exchanges (2014 and 2018).
From the 143 otoliths of the exchange, 44 otoliths had an agreement of more than 80% (Annex
5, Table 5.1), with modal age from 0–5. From these, 9 otoliths had 100% agreement, four of them
with modal age 0, three with modal age 2, one with modal age 1 and another with modal age
4. There were also 20 otoliths with 90–99% agreement (modal age 0–4). Also, there were 15
otoliths with 80–89% agreement (modal age 1-5). Most otoliths with 50% or less agreement have
modal age 5 or older.
When considering only the Expert readers, there were 61 otoliths with more than 80% agree-
ment and modal age 0–9. From these, 31 otoliths had 100% agreement (modal age 0–6 and 9);
16 otoliths had 90–99% agreement (modal age 0–5, 7 and 9) and 14 had 80–89% agreement
(modal age 1-7). There were seven otoliths with less than 40% agreement, all of them with
modal age 6-10.
To sum up, there has been an improvement in the overall agreement comparing with the pre-
WKARMAC2 exercise, in both group of readers (Experts and Trainees), reaching similar val-
ues, although slightly lower, than the previous exchange in 2014; with 44 otoliths with more
than 80% agreement for all readers (nine of them with 100% agreement), and 61 otoliths with
more than 80% for Expert readers (31 of them with 100%). However, the agreement for otoliths
with modal age 5 and older remains quite low (otoliths with 30% or less agreement had modal
age 5-12, in all readers’ analysis), which seems to have a difficult solution as the estimation of
the age in these older otoliths is quite subjective and each reader seems to have a different
interpretation of the growth pattern in these older otoliths, which seems to persists even after
the on-screen discussion of these otoliths during the Workshop.
5.3 Small exchange with Norwegian otoliths. A little experiment.
5.3.1 Introduction
Without the existence of otoliths with a known age, the evaluation of the quality of age readings
is based on the agreement and bias between age readers for the same species with regards to
the modal value of all age readings. The real age is normally not known.
The existence of otoliths from the Norwegian Mark-Recapture experiments were long seen as
potentially the golden stones which could iron out many subjective assumptions related to the
age estimation of mackerel from this area and potentially other areas. These tagging data pro-
vide a known age between tagging and recapture reducing the unknown time span from hatch-
ing to the time of capture for tagging.
5.3.2 Material and methods
All together 28 otoliths from tagged and recaptured mackerel were provided by IMR Norway.
Age at time of tagging was estimated by length measurements and otoliths readings of Norwe-
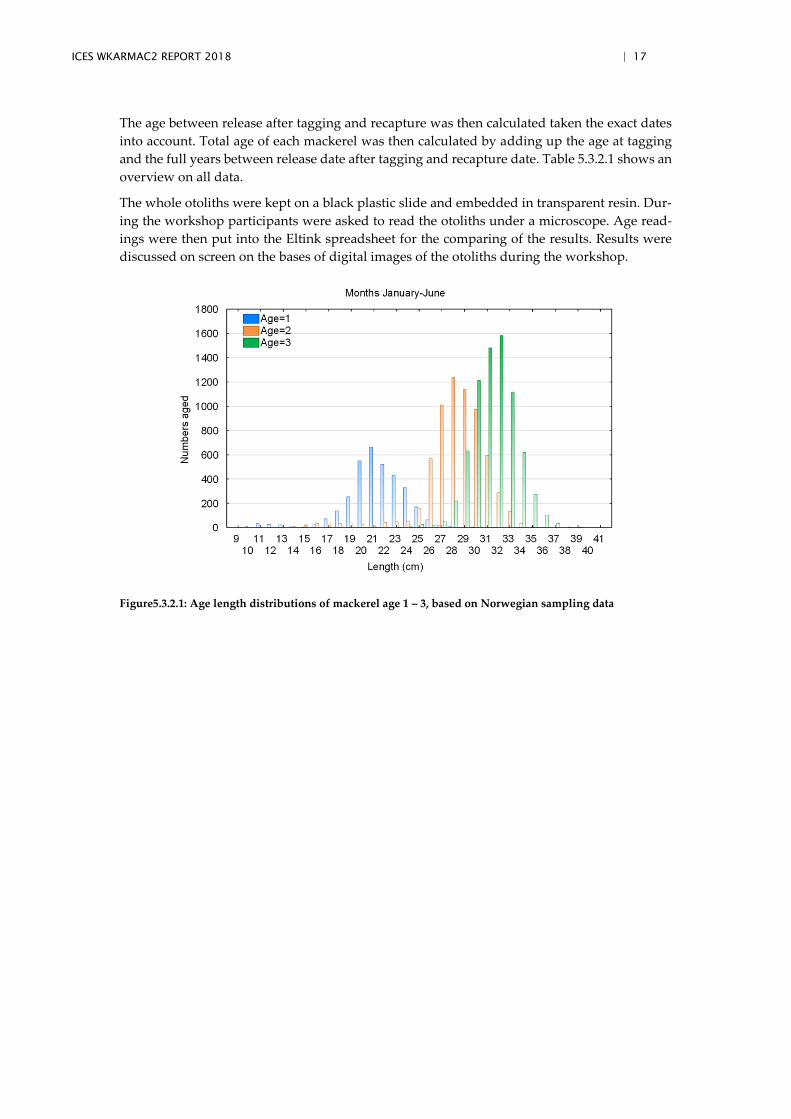
gian mackerel sampling data from the 1950ies to present. Tagged fish were between 21 and
28cm in time of release. According to the length-age distribution (Figure 5.3.2.1), fish between
21 and 24cm were assigned to age 1, fish between 26 and 28cm to age 2.
Analysis % Agreement CV (%) % Agreement CV (%) % Agreement CV (%)
All 68.2 15.4 59.4 37.3 66.8 31.4
Experts 75.5 9.3 65.2 17.6 73.2 16.4
Trainees - - 56.5 36.4 63.6 26.5
Exchange 2014 pre-WKARMAC2 exercise WKARMAC2 calibration exercise
ICES WKARMAC2 REPORT 2018 | 17
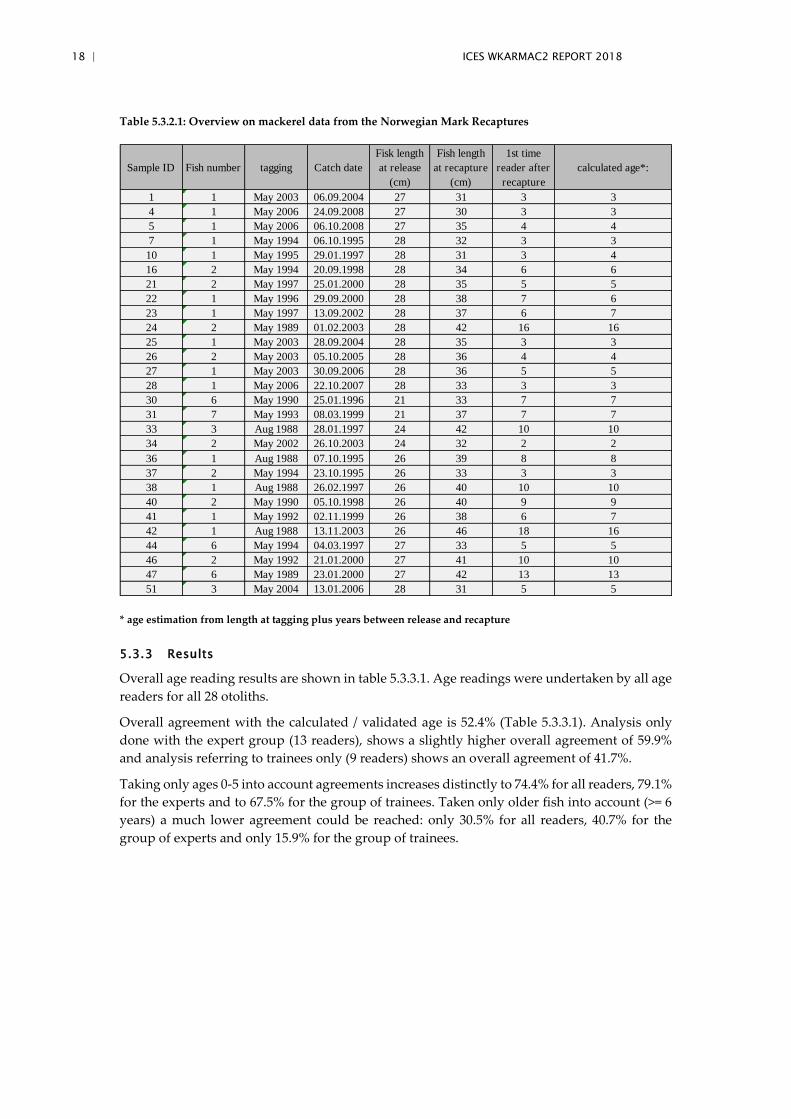
The age between release after tagging and recapture was then calculated taken the exact dates
into account. Total age of each mackerel was then calculated by adding up the age at tagging
and the full years between release date after tagging and recapture date. Table 5.3.2.1 shows an
overview on all data.
The whole otoliths were kept on a black plastic slide and embedded in transparent resin. Dur-
ing the workshop participants were asked to read the otoliths under a microscope. Age read-
ings were then put into the Eltink spreadsheet for the comparing of the results. Results were
discussed on screen on the bases of digital images of the otoliths during the workshop.
Figure5.3.2.1: Age length distributions of mackerel age 1 – 3, based on Norwegian sampling data
18 | ICES WKARMAC2 REPORT 2018
Table 5.3.2.1: Overview on mackerel data from the Norwegian Mark Recaptures
* age estimation from length at tagging plus years between release and recapture
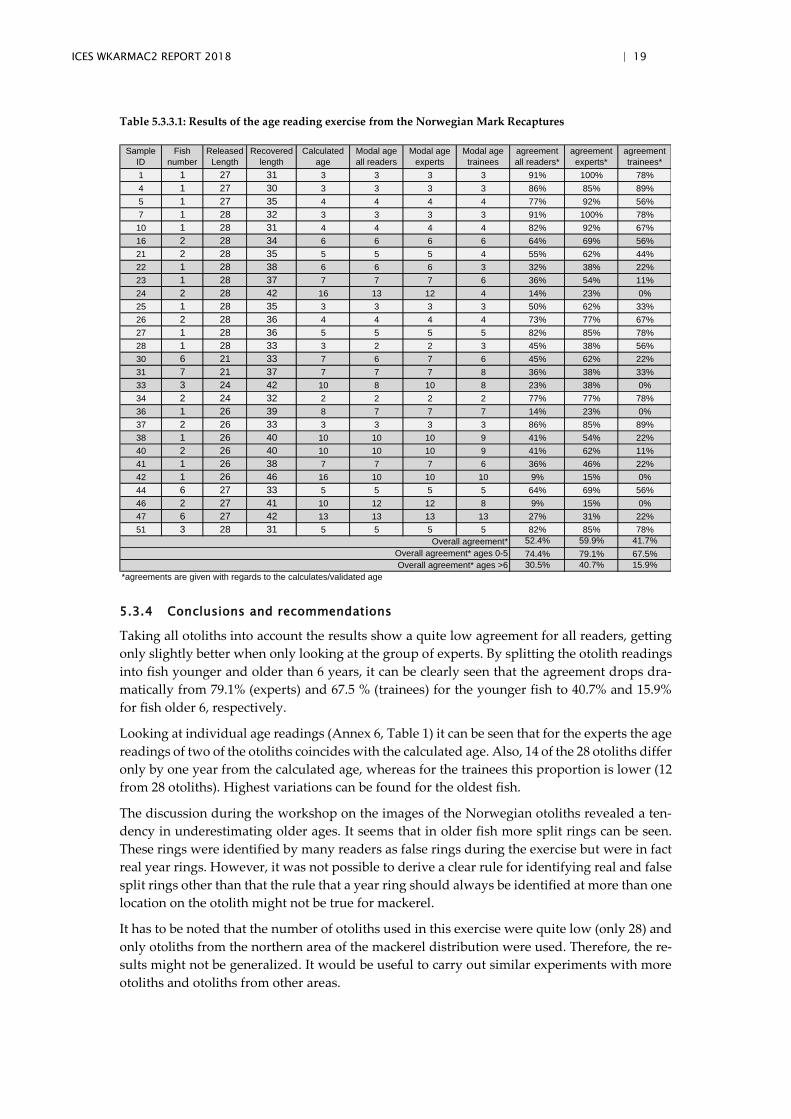
5.3.3 Results
Overall age reading results are shown in table 5.3.3.1. Age readings were undertaken by all age
readers for all 28 otoliths.
Overall agreement with the calculated / validated age is 52.4% (Table 5.3.3.1). Analysis only
done with the expert group (13 readers), shows a slightly higher overall agreement of 59.9%
and analysis referring to trainees only (9 readers) shows an overall agreement of 41.7%.
Taking only ages 0-5 into account agreements increases distinctly to 74.4% for all readers, 79.1%
for the experts and to 67.5% for the group of trainees. Taken only older fish into account (>= 6
years) a much lower agreement could be reached: only 30.5% for all readers, 40.7% for the
group of experts and only 15.9% for the group of trainees.
Sample ID Fish number tagging Catch date
Fisk length
at release
(cm)
Fish length
at recapture
(cm)
1st time
reader after
recapture
calculated age*:
1 1 May 2003 06.09.2004 27 31 3 3
4 1 May 2006 24.09.2008 27 30 3 3
5 1 May 2006 06.10.2008 27 35 4 4
7 1 May 1994 06.10.1995 28 32 3 3
10 1 May 1995 29.01.1997 28 31 3 4
16 2 May 1994 20.09.1998 28 34 6 6
21 2 May 1997 25.01.2000 28 35 5 5
22 1 May 1996 29.09.2000 28 38 7 6
23 1 May 1997 13.09.2002 28 37 6 7
24 2 May 1989 01.02.2003 28 42 16 16
25 1 May 2003 28.09.2004 28 35 3 3
26 2 May 2003 05.10.2005 28 36 4 4
27 1 May 2003 30.09.2006 28 36 5 5
28 1 May 2006 22.10.2007 28 33 3 3
30 6 May 1990 25.01.1996 21 33 7 7
31 7 May 1993 08.03.1999 21 37 7 7
33 3 Aug 1988 28.01.1997 24 42 10 10
34 2 May 2002 26.10.2003 24 32 2 2
36 1 Aug 1988 07.10.1995 26 39 8 8
37 2 May 1994 23.10.1995 26 33 3 3
38 1 Aug 1988 26.02.1997 26 40 10 10
40 2 May 1990 05.10.1998 26 40 9 9
41 1 May 1992 02.11.1999 26 38 6 7
42 1 Aug 1988 13.11.2003 26 46 18 16
44 6 May 1994 04.03.1997 27 33 5 5
46 2 May 1992 21.01.2000 27 41 10 10
47 6 May 1989 23.01.2000 27 42 13 13
51 3 May 2004 13.01.2006 28 31 5 5
ICES WKARMAC2 REPORT 2018 | 19
Table 5.3.3.1: Results of the age reading exercise from the Norwegian Mark Recaptures
5.3.4 Conclusions and recommendations
Taking all otoliths into account the results show a quite low agreement for all readers, getting
only slightly better when only looking at the group of experts. By splitting the otolith readings
into fish younger and older than 6 years, it can be clearly seen that the agreement drops dra-
matically from 79.1% (experts) and 67.5 % (trainees) for the younger fish to 40.7% and 15.9%
for fish older 6, respectively.
Looking at individual age readings (Annex 6, Table 1) it can be seen that for the experts the age
readings of two of the otoliths coincides with the calculated age. Also, 14 of the 28 otoliths differ
only by one year from the calculated age, whereas for the trainees this proportion is lower (12
from 28 otoliths). Highest variations can be found for the oldest fish.
The discussion during the workshop on the images of the Norwegian otoliths revealed a ten-
dency in underestimating older ages. It seems that in older fish more split rings can be seen.
These rings were identified by many readers as false rings during the exercise but were in fact
real year rings. However, it was not possible to derive a clear rule for identifying real and false
split rings other than that the rule that a year ring should always be identified at more than one
location on the otolith might not be true for mackerel.
It has to be noted that the number of otoliths used in this exercise were quite low (only 28) and
only otoliths from the northern area of the mackerel distribution were used. Therefore, the re-
sults might not be generalized. It would be useful to carry out similar experiments with more
otoliths and otoliths from other areas.
1 1 27 31 3 3 3 3 91% 100% 78%
4 1 27 30 3 3 3 3 86% 85% 89%
5 1 27 35 4 4 4 4 77% 92% 56%
7 1 28 32 3 3 3 3 91% 100% 78%
10 1 28 31 4 4 4 4 82% 92% 67%
16 2 28 34 6 6 6 6 64% 69% 56%
21 2 28 35 5 5 5 4 55% 62% 44%
22 1 28 38 6 6 6 3 32% 38% 22%
23 1 28 37 7 7 7 6 36% 54% 11%
24 2 28 42 16 13 12 4 14% 23% 0%
25 1 28 35 3 3 3 3 50% 62% 33%
26 2 28 36 4 4 4 4 73% 77% 67%
27 1 28 36 5 5 5 5 82% 85% 78%
28 1 28 33 3 2 2 3 45% 38% 56%
30 6 21 33 7 6 7 6 45% 62% 22%
31 7 21 37 7 7 7 8 36% 38% 33%
33 3 24 42 10 8 10 8 23% 38% 0%
34 2 24 32 2 2 2 2 77% 77% 78%
36 1 26 39 8 7 7 7 14% 23% 0%
37 2 26 33 3 3 3 3 86% 85% 89%
38 1 26 40 10 10 10 9 41% 54% 22%
40 2 26 40 10 10 10 9 41% 62% 11%
41 1 26 38 7 7 7 6 36% 46% 22%
42 1 26 46 16 10 10 10 9% 15% 0%
44 6 27 33 5 5 5 5 64% 69% 56%
46 2 27 41 10 12 12 8 9% 15% 0%
47 6 27 42 13 13 13 13 27% 31% 22%
51 3 28 31 5 5 5 5 82% 85% 78%
52.4% 59.9% 41.7%
74.4% 79.1% 67.5%
30.5% 40.7% 15.9%
*agreements are given with regards to the calculates/validated age
agreement
all readers*
agreement
experts*
agreement
trainees*
Overall agreement*
Overall agreement* ages 0-5
Overall agreement* ages >6
Released
Length
Recovered
length
Calculated
age
Modal age
all readers
Modal age
experts
Modal age
trainees
Sample
ID
Fish
number
20 | ICES WKARMAC2 REPORT 2018
5.4 Recommended actions for resolving interpretation differences between read-
ers
As these last otolith exchanges show, there is good agreement between readers for the age es-
timation of otoliths up to 5 years old, especially between Expert readers, whose estimations are
used in mackerel assessments. However, the agreement between readers, even Experts, for the
age estimation of otoliths over 5 years old remain very low, which has been observed during
all previous workshops and exchanges.
One of the recommended actions for trying to improve this low agreement for older ages is the
assistance of the readers to the workshops, especially those whose age estimations are used in
mackerel assessments, where the different interpretation between readers can be discussed to-
gether, on-screen with images of especially difficult and/or old otoliths. The improvement
reached in the level of agreement between readers in the calibration exercise carried out during
the workshop seems to support this recommendation.
Another recommended action of great importance is to continue carrying out tag-recapture
experiments. The information obtained from these experiments as well as the realization of
calibration exercise between readers such as the one carried out during the workshop, is of
great value in order to validate the age estimation in this species. The information obtained
from older otoliths with this kind of experiment would be of great importance in order to help
in a more accurate interpretation of older ages in mackerel otoliths.
ICES WKARMAC2 REPORT 2018 | 21
6 Resume of the studies of the formation of the growth zones in otoliths
of different distribution areas presented during the workshop
Study of seasonal formation of growth rings in the otoliths of the NEA Mackerel (Scomber
scombrus) in ICES Divisions 8c and 9a North. By: Villamor, B.; Navarro, MR.; Hernández, C.;
Dueñas-Liaño, C.; Antolínez, A. Presentation to WKARMAC2, San Sebastian, Spain, 22-26 Oc-
tober 2018.
One of the recommendations of the last workshop on age determination of NEA mackerel,
WKARMAC (ICES, 2010) was to study the formation of the growth zones in otoliths of the
different distribution areas, since the appearance of the otolith edge in a given area and season
appears to have changed in recent years, causing the majority of the disagreements between
the readers of mackerel otoliths. Attention should be paid to the younger individuals and the
appearance of the edge over the season depending on the area.
The periodic formation of growth zones in otoliths has been extensively applied worldwide in
age determination of fish. The formation of the opaque or hyaline zones has been attributed to
various factors, such as seasonal temperature cycles, light conditions, fish feeding and repro-
ductive cycles (Beckman and Wilson, 1995). In the case of NEA mackerel there is only one study
in the literature, about the nature of the edge in the waters of Portugal (Gordo and Martins,
1982).
A work was presented at WKARMAC2 where the periodic formation of the growth zones in
the otoliths of the Southern Component of NEA mackerel (ICES Divisions 8c and 9a North)
was analyzed. As a preliminary step to find out seasonality in the formation of rings, the edge
of the otolith was monitored and the possible relationship between the formation of rings and
the temperature of the environment was discussed, as well as other biological parameters of
the species as the condition factor (CF) and the gonad somatic index (GSI).
Nature of the otolith edge
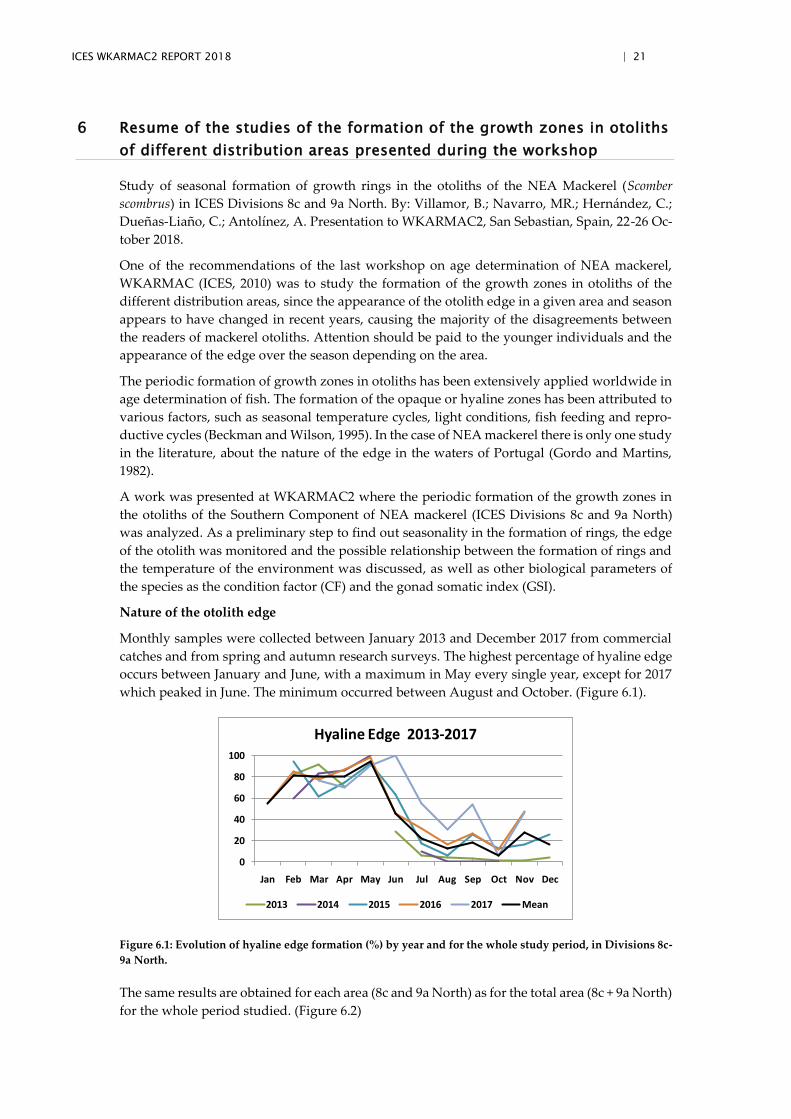
Monthly samples were collected between January 2013 and December 2017 from commercial
catches and from spring and autumn research surveys. The highest percentage of hyaline edge
occurs between January and June, with a maximum in May every single year, except for 2017
which peaked in June. The minimum occurred between August and October. (Figure 6.1).
Figure 6.1: Evolution of hyaline edge formation (%) by year and for the whole study period, in Divisions 8c-
9a North.
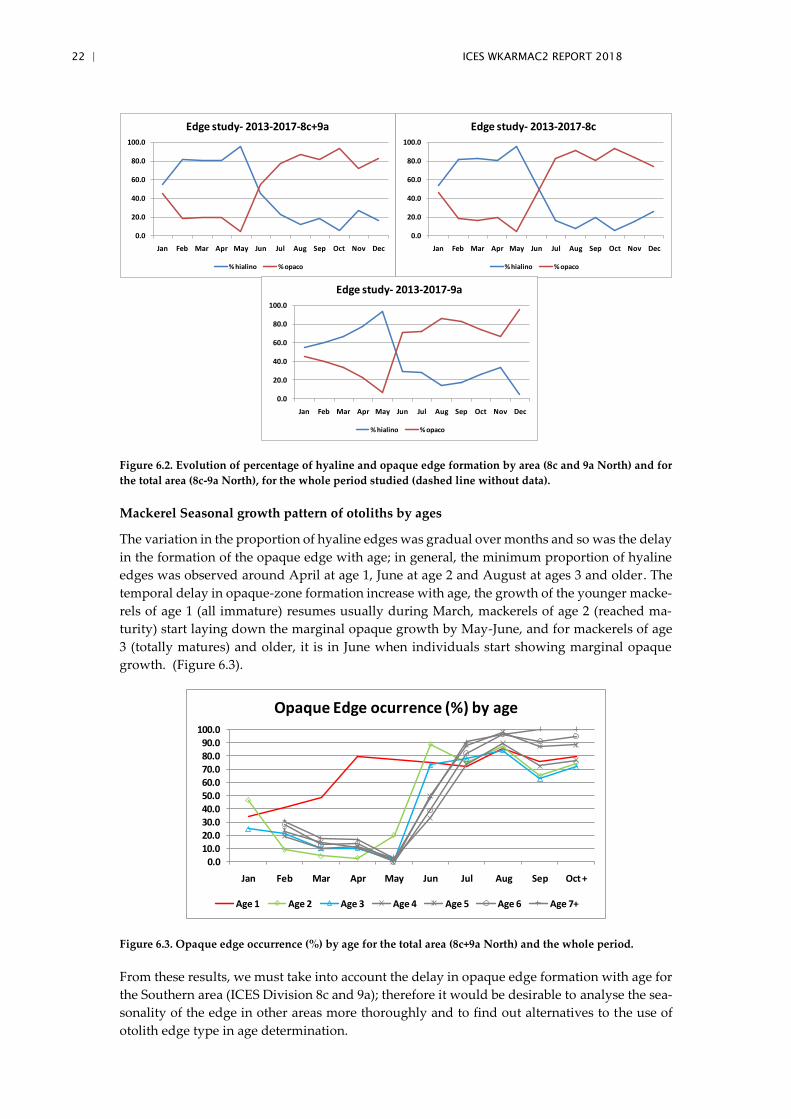
The same results are obtained for each area (8c and 9a North) as for the total area (8c + 9a North)
for the whole period studied. (Figure 6.2)
0
20
40
60
80
100
Jan Feb Mar Apr May Jun Jul Aug Sep Oct Nov Dec
Hyaline Edge 2013-2017
2013 2014 2015 2016 2017 Mean
22 | ICES WKARMAC2 REPORT 2018
Figure 6.2. Evolution of percentage of hyaline and opaque edge formation by area (8c and 9a North) and for
the total area (8c-9a North), for the whole period studied (dashed line without data).
Mackerel Seasonal growth pattern of otoliths by ages
The variation in the proportion of hyaline edges was gradual over months and so was the delay
in the formation of the opaque edge with age; in general, the minimum proportion of hyaline
edges was observed around April at age 1, June at age 2 and August at ages 3 and older. The
temporal delay in opaque-zone formation increase with age, the growth of the younger macke-
rels of age 1 (all immature) resumes usually during March, mackerels of age 2 (reached ma-
turity) start laying down the marginal opaque growth by May-June, and for mackerels of age
3 (totally matures) and older, it is in June when individuals start showing marginal opaque
growth. (Figure 6.3).
Figure 6.3. Opaque edge occurrence (%) by age for the total area (8c+9a North) and the whole period.
From these results, we must take into account the delay in opaque edge formation with age for
the Southern area (ICES Division 8c and 9a); therefore it would be desirable to analyse the sea-
sonality of the edge in other areas more thoroughly and to find out alternatives to the use of
otolith edge type in age determination.
0.0
20.0
40.0
60.0
80.0
100.0
Jan Feb Mar Apr May Jun Jul Aug Sep Oct Nov Dec
Edge study- 2013-2017-8c+9a
% hialino % opaco
0.0
20.0
40.0
60.0
80.0
100.0
Jan Feb Mar Apr May Jun Jul Aug Sep Oct Nov Dec
Edge study- 2013-2017-8c
% hialino % opaco
0.0
20.0
40.0
60.0
80.0
100.0
Jan Feb Mar Apr May Jun Jul Aug Sep Oct Nov Dec
Edge study- 2013-2017-9a
% hialino % opaco
0.010.020.030.040.050.060.070.080.090.0
100.0
Jan Feb Mar Apr May Jun Jul Aug Sep Oct +
Opaque Edge ocurrence (%) by age
Age 1 Age 2 Age 3 Age 4 Age 5 Age 6 Age 7+
ICES WKARMAC2 REPORT 2018 | 23
Edge relationships with Temperature, GSI and CF
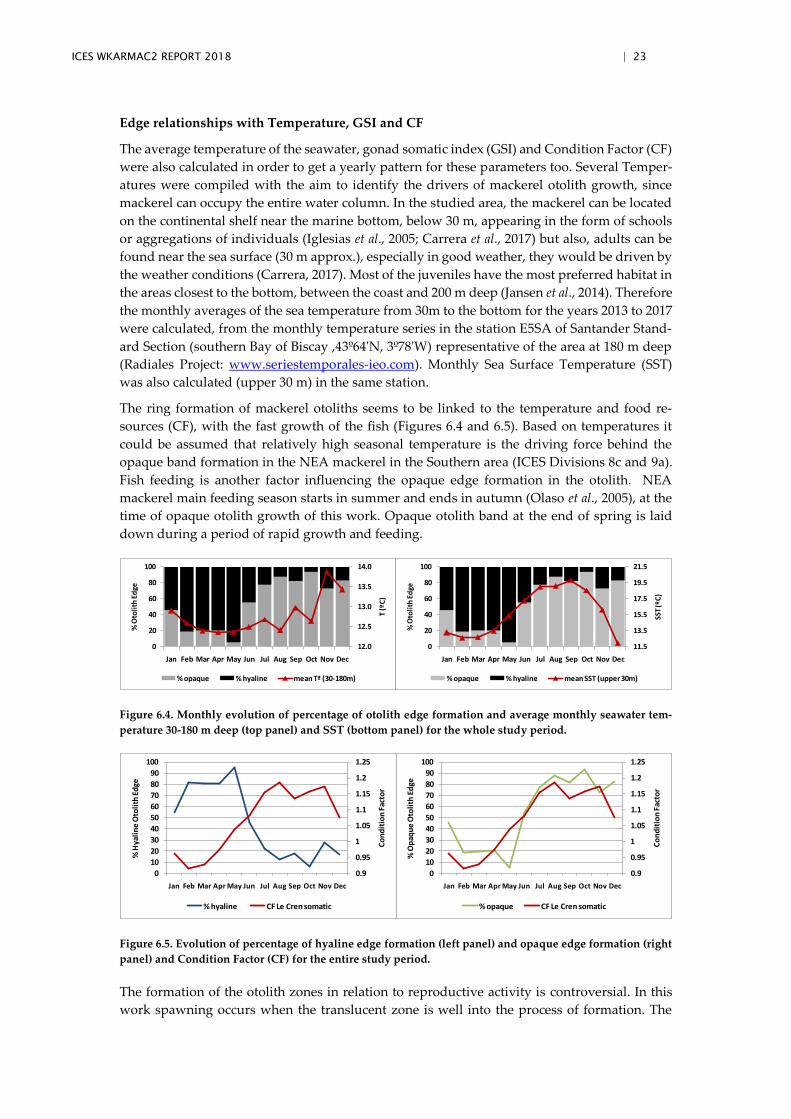
The average temperature of the seawater, gonad somatic index (GSI) and Condition Factor (CF)
were also calculated in order to get a yearly pattern for these parameters too. Several Temper-
atures were compiled with the aim to identify the drivers of mackerel otolith growth, since
mackerel can occupy the entire water column. In the studied area, the mackerel can be located
on the continental shelf near the marine bottom, below 30 m, appearing in the form of schools
or aggregations of individuals (Iglesias et al., 2005; Carrera et al., 2017) but also, adults can be
found near the sea surface (30 m approx.), especially in good weather, they would be driven by
the weather conditions (Carrera, 2017). Most of the juveniles have the most preferred habitat in
the areas closest to the bottom, between the coast and 200 m deep (Jansen et al., 2014). Therefore
the monthly averages of the sea temperature from 30m to the bottom for the years 2013 to 2017
were calculated, from the monthly temperature series in the station E5SA of Santander Stand-
ard Section (southern Bay of Biscay ,43º64'N, 3º78'W) representative of the area at 180 m deep
(Radiales Project: www.seriestemporales-ieo.com). Monthly Sea Surface Temperature (SST)
was also calculated (upper 30 m) in the same station.
The ring formation of mackerel otoliths seems to be linked to the temperature and food re-
sources (CF), with the fast growth of the fish (Figures 6.4 and 6.5). Based on temperatures it
could be assumed that relatively high seasonal temperature is the driving force behind the
opaque band formation in the NEA mackerel in the Southern area (ICES Divisions 8c and 9a).
Fish feeding is another factor influencing the opaque edge formation in the otolith. NEA
mackerel main feeding season starts in summer and ends in autumn (Olaso et al., 2005), at the
time of opaque otolith growth of this work. Opaque otolith band at the end of spring is laid
down during a period of rapid growth and feeding.
Figure 6.4. Monthly evolution of percentage of otolith edge formation and average monthly seawater tem-
perature 30-180 m deep (top panel) and SST (bottom panel) for the whole study period.
Figure 6.5. Evolution of percentage of hyaline edge formation (left panel) and opaque edge formation (right
panel) and Condition Factor (CF) for the entire study period.
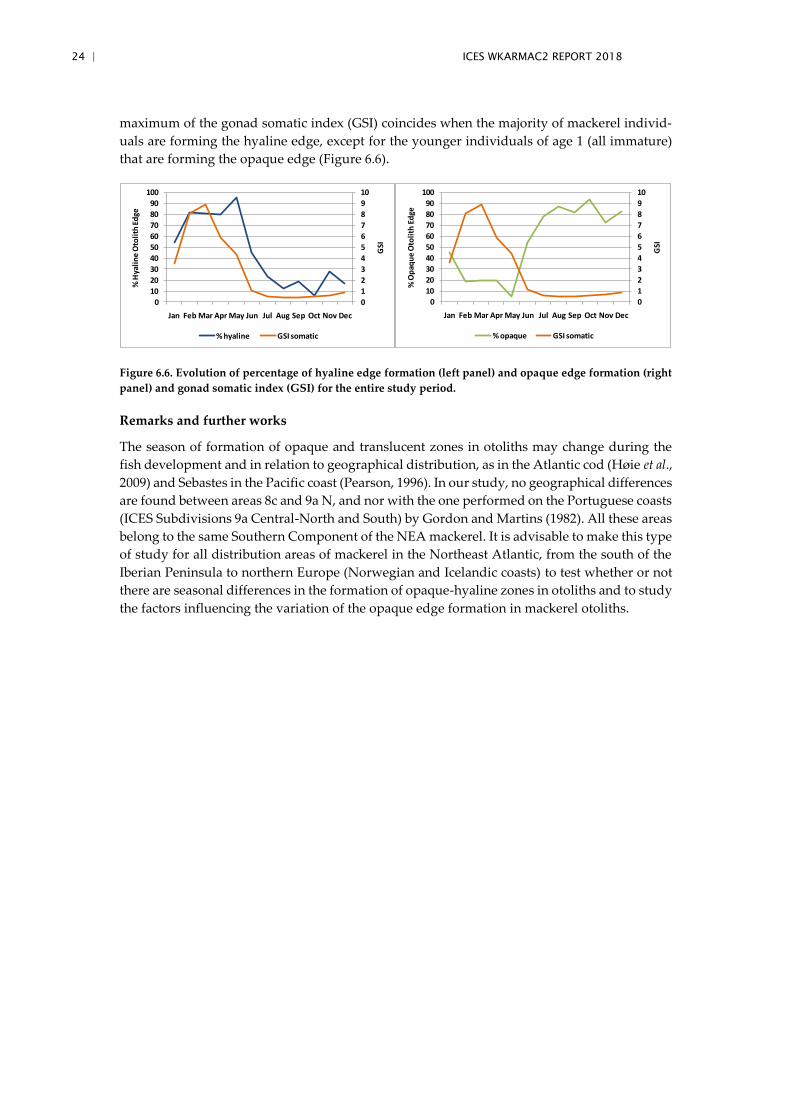
The formation of the otolith zones in relation to reproductive activity is controversial. In this
work spawning occurs when the translucent zone is well into the process of formation. The
12.0
12.5
13.0
13.5
14.0
0
20
40
60
80
100
Jan Feb Mar Apr May Jun Jul Aug Sep Oct Nov Dec
T (º
C)
% O
toli
th E
dge
% opaque % hyaline mean Tª (30-180m)
11.5
13.5
15.5
17.5
19.5
21.5
0
20
40
60
80
100
Jan Feb Mar Apr May Jun Jul Aug Sep Oct Nov DecSS
T (º
C)
% O
toli
th E
dge
% opaque % hyaline mean SST (upper 30m)
0.9
0.95
1
1.05
1.1
1.15
1.2
1.25
0
10
20
30
40
50
60
70
80
90
100
Jan Feb Mar Apr May Jun Jul Aug Sep Oct Nov Dec
Co
nd
itio
n F
acto
r
% O
paq
ue
Oto
lith
Ed
ge
% opaque CF Le Cren somatic
0.9
0.95
1
1.05
1.1
1.15
1.2
1.25
0
10
20
30
40
50
60
70
80
90
100
Jan Feb Mar Apr May Jun Jul Aug Sep Oct Nov Dec
Co
nd
itio
n F
acto
r
% H
yali
ne
Oto
lith
Ed
ge
% hyaline CF Le Cren somatic
24 | ICES WKARMAC2 REPORT 2018
maximum of the gonad somatic index (GSI) coincides when the majority of mackerel individ-
uals are forming the hyaline edge, except for the younger individuals of age 1 (all immature)
that are forming the opaque edge (Figure 6.6).
Figure 6.6. Evolution of percentage of hyaline edge formation (left panel) and opaque edge formation (right
panel) and gonad somatic index (GSI) for the entire study period.
Remarks and further works
The season of formation of opaque and translucent zones in otoliths may change during the
fish development and in relation to geographical distribution, as in the Atlantic cod (Høie et al.,
2009) and Sebastes in the Pacific coast (Pearson, 1996). In our study, no geographical differences
are found between areas 8c and 9a N, and nor with the one performed on the Portuguese coasts
(ICES Subdivisions 9a Central-North and South) by Gordon and Martins (1982). All these areas
belong to the same Southern Component of the NEA mackerel. It is advisable to make this type
of study for all distribution areas of mackerel in the Northeast Atlantic, from the south of the
Iberian Peninsula to northern Europe (Norwegian and Icelandic coasts) to test whether or not
there are seasonal differences in the formation of opaque-hyaline zones in otoliths and to study
the factors influencing the variation of the opaque edge formation in mackerel otoliths.
0
1
2
3
4
5
6
7
8
9
10
0
10
20
30
40
50
60
70
80
90
100
Jan Feb Mar Apr May Jun Jul Aug Sep Oct Nov Dec
GSI
% H
yali
ne
Oto
lith
Ed
ge
% hyaline GSI somatic
0
1
2
3
4
5
6
7
8
9
10
0
10
20
30
40
50
60
70
80
90
100
Jan Feb Mar Apr May Jun Jul Aug Sep Oct Nov Dec
GSI
% O
paq
ue
Oto
lith
Ed
ge
% opaque GSI somatic
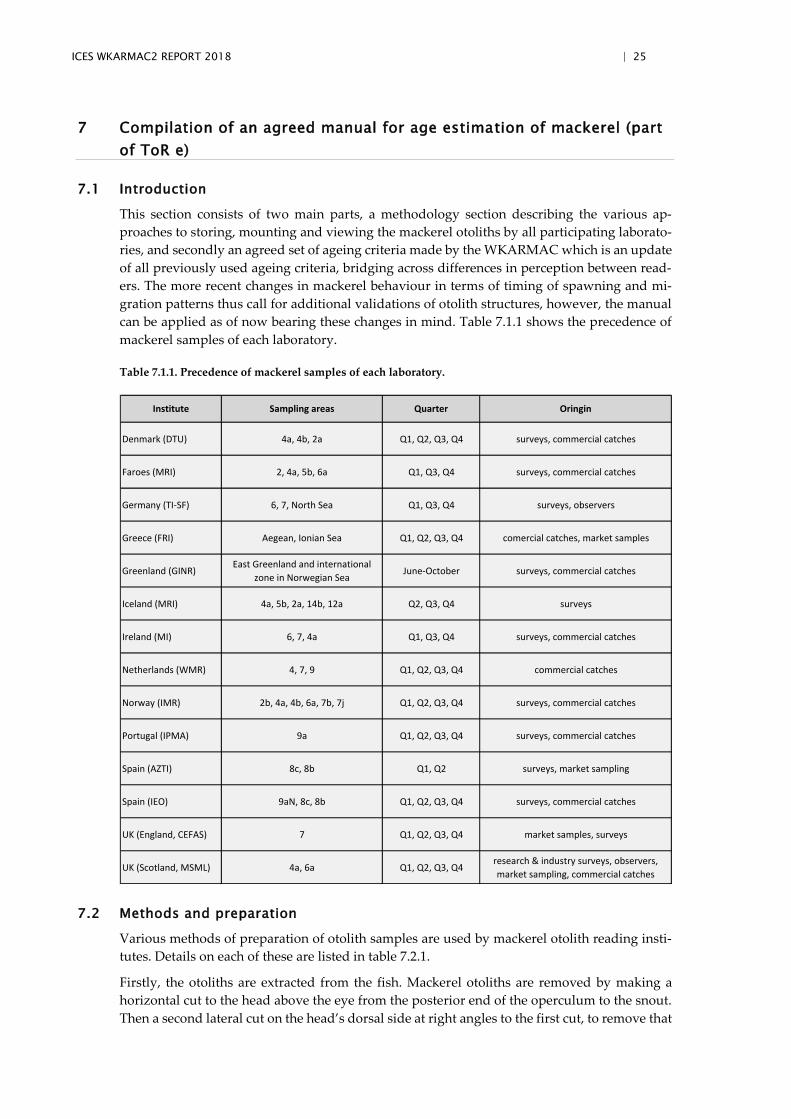
ICES WKARMAC2 REPORT 2018 | 25
7 Compilation of an agreed manual for age estimation of mackerel (part
of ToR e)
7.1 Introduction
This section consists of two main parts, a methodology section describing the various ap-
proaches to storing, mounting and viewing the mackerel otoliths by all participating laborato-
ries, and secondly an agreed set of ageing criteria made by the WKARMAC which is an update
of all previously used ageing criteria, bridging across differences in perception between read-
ers. The more recent changes in mackerel behaviour in terms of timing of spawning and mi-
gration patterns thus call for additional validations of otolith structures, however, the manual
can be applied as of now bearing these changes in mind. Table 7.1.1 shows the precedence of
mackerel samples of each laboratory.
Table 7.1.1. Precedence of mackerel samples of each laboratory.
7.2 Methods and preparation
Various methods of preparation of otolith samples are used by mackerel otolith reading insti-
tutes. Details on each of these are listed in table 7.2.1.
Firstly, the otoliths are extracted from the fish. Mackerel otoliths are removed by making a
horizontal cut to the head above the eye from the posterior end of the operculum to the snout.
Then a second lateral cut on the head’s dorsal side at right angles to the first cut, to remove that
Denmark (DTU) 4a, 4b, 2a Q1, Q2, Q3, Q4 surveys, commercial catches
Faroes (MRI) 2, 4a, 5b, 6a Q1, Q3, Q4 surveys, commercial catches
Germany (TI-SF) 6, 7, North Sea Q1, Q3, Q4 surveys, observers
Greece (FRI) Aegean, Ionian Sea Q1, Q2, Q3, Q4 comercial catches, market samples
Greenland (GINR)East Greenland and international
zone in Norwegian SeaJune-October surveys, commercial catches
Iceland (MRI) 4a, 5b, 2a, 14b, 12a Q2, Q3, Q4 surveys
Ireland (MI) 6, 7, 4a Q1, Q3, Q4 surveys, commercial catches
Netherlands (WMR) 4, 7, 9 Q1, Q2, Q3, Q4 commercial catches
Norway (IMR) 2b, 4a, 4b, 6a, 7b, 7j Q1, Q2, Q3, Q4 surveys, commercial catches
Portugal (IPMA) 9a Q1, Q2, Q3, Q4 surveys, commercial catches
Spain (AZTI) 8c, 8b Q1, Q2 surveys, market sampling
Spain (IEO) 9aN, 8c, 8b Q1, Q2, Q3, Q4 surveys, commercial catches
UK (England, CEFAS) 7 Q1, Q2, Q3, Q4 market samples, surveys
UK (Scotland, MSML) 4a, 6a Q1, Q2, Q3, Q4research & industry surveys, observers,
market sampling, commercial catches
Institute Sampling areas Quarter Oringin
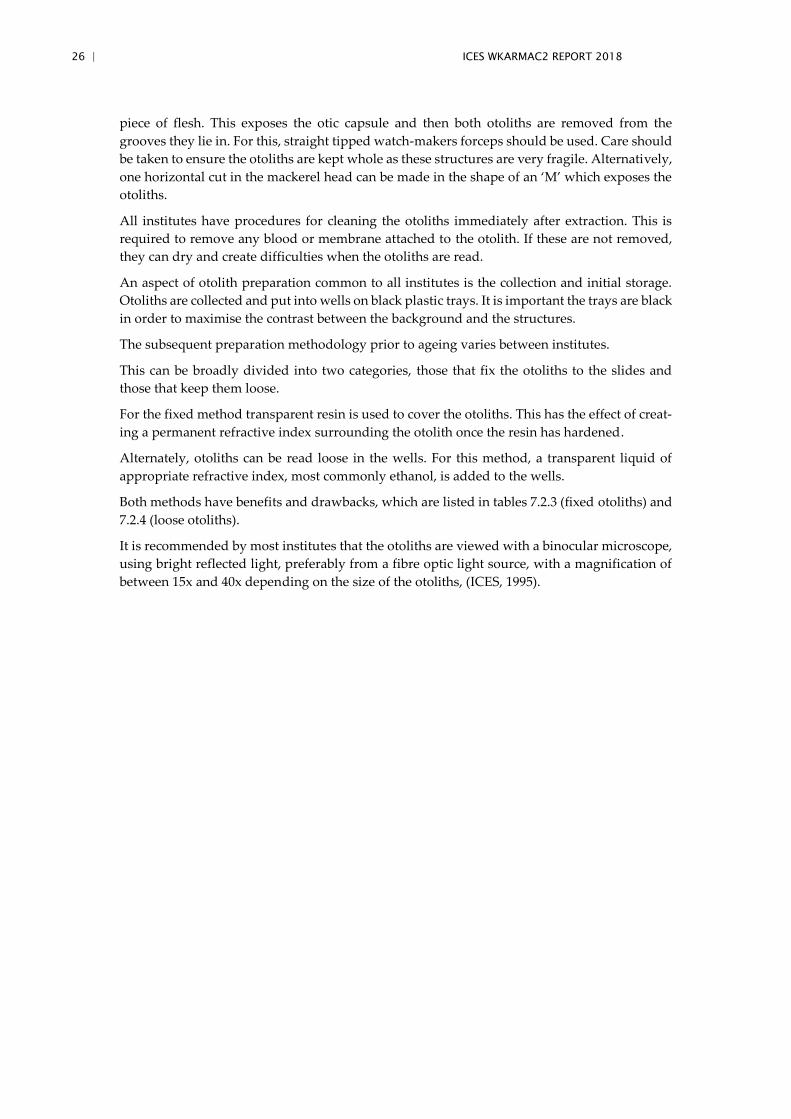
26 | ICES WKARMAC2 REPORT 2018
piece of flesh. This exposes the otic capsule and then both otoliths are removed from the
grooves they lie in. For this, straight tipped watch-makers forceps should be used. Care should
be taken to ensure the otoliths are kept whole as these structures are very fragile. Alternatively,
one horizontal cut in the mackerel head can be made in the shape of an ‘M’ which exposes the
otoliths.
All institutes have procedures for cleaning the otoliths immediately after extraction. This is
required to remove any blood or membrane attached to the otolith. If these are not removed,
they can dry and create difficulties when the otoliths are read.
An aspect of otolith preparation common to all institutes is the collection and initial storage.
Otoliths are collected and put into wells on black plastic trays. It is important the trays are black
in order to maximise the contrast between the background and the structures.
The subsequent preparation methodology prior to ageing varies between institutes.
This can be broadly divided into two categories, those that fix the otoliths to the slides and
those that keep them loose.
For the fixed method transparent resin is used to cover the otoliths. This has the effect of creat-
ing a permanent refractive index surrounding the otolith once the resin has hardened.
Alternately, otoliths can be read loose in the wells. For this method, a transparent liquid of
appropriate refractive index, most commonly ethanol, is added to the wells.
Both methods have benefits and drawbacks, which are listed in tables 7.2.3 (fixed otoliths) and
7.2.4 (loose otoliths).
It is recommended by most institutes that the otoliths are viewed with a binocular microscope,
using bright reflected light, preferably from a fibre optic light source, with a magnification of
between 15x and 40x depending on the size of the otoliths, (ICES, 1995).
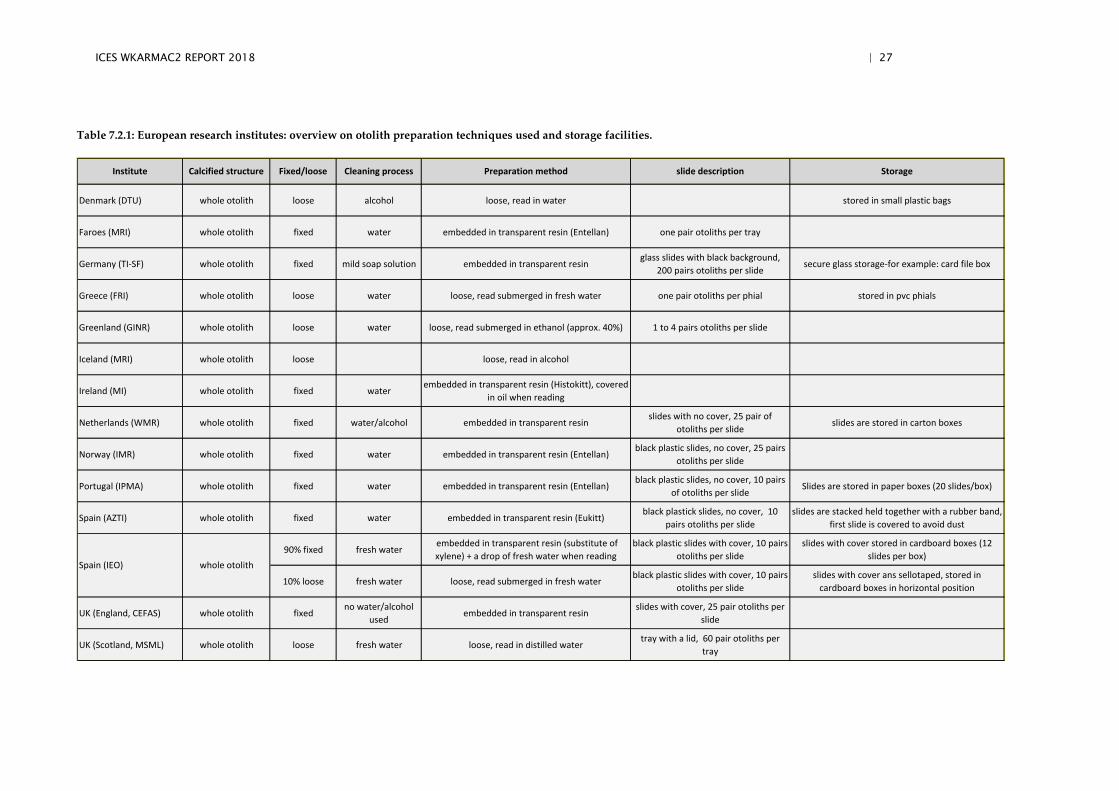
ICES WKARMAC2 REPORT 2018 | 27
Table 7.2.1: European research institutes: overview on otolith preparation techniques used and storage facilities.
Denmark (DTU) whole otolith loose alcohol loose, read in water stored in small plastic bags
Faroes (MRI) whole otolith fixed water embedded in transparent resin (Entellan) one pair otoliths per tray
Germany (TI-SF) whole otolith fixed mild soap solution embedded in transparent resinglass slides with black background,
200 pairs otoliths per slidesecure glass storage-for example: card file box
Greece (FRI) whole otolith loose water loose, read submerged in fresh water one pair otoliths per phial stored in pvc phials
Greenland (GINR) whole otolith loose water loose, read submerged in ethanol (approx. 40%) 1 to 4 pairs otoliths per slide
Iceland (MRI) whole otolith loose loose, read in alcohol
Ireland (MI) whole otolith fixed waterembedded in transparent resin (Histokitt), covered
in oil when reading
Netherlands (WMR) whole otolith fixed water/alcohol embedded in transparent resinslides with no cover, 25 pair of
otoliths per slide slides are stored in carton boxes
Norway (IMR) whole otolith fixed water embedded in transparent resin (Entellan)black plastic slides, no cover, 25 pairs
otoliths per slide
Portugal (IPMA) whole otolith fixed water embedded in transparent resin (Entellan)black plastic slides, no cover, 10 pairs
of otoliths per slideSlides are stored in paper boxes (20 slides/box)
Spain (AZTI) whole otolith fixed water embedded in transparent resin (Eukitt)black plastick slides, no cover, 10
pairs otoliths per slide
slides are stacked held together with a rubber band,
first slide is covered to avoid dust
90% fixed fresh water embedded in transparent resin (substitute of
xylene) + a drop of fresh water when reading
black plastic slides with cover, 10 pairs
otoliths per slide
slides with cover stored in cardboard boxes (12
slides per box)
10% loose fresh water loose, read submerged in fresh waterblack plastic slides with cover, 10 pairs
otoliths per slide
slides with cover ans sellotaped, stored in
cardboard boxes in horizontal position
UK (England, CEFAS) whole otolith fixedno water/alcohol
usedembedded in transparent resin
slides with cover, 25 pair otoliths per
slide
UK (Scotland, MSML) whole otolith loose fresh water loose, read in distilled watertray with a lid, 60 pair otoliths per
tray
Spain (IEO) whole otolith
Fixed/loose Cleaning process Preparation method slide description StorageInstitute Calcified structure
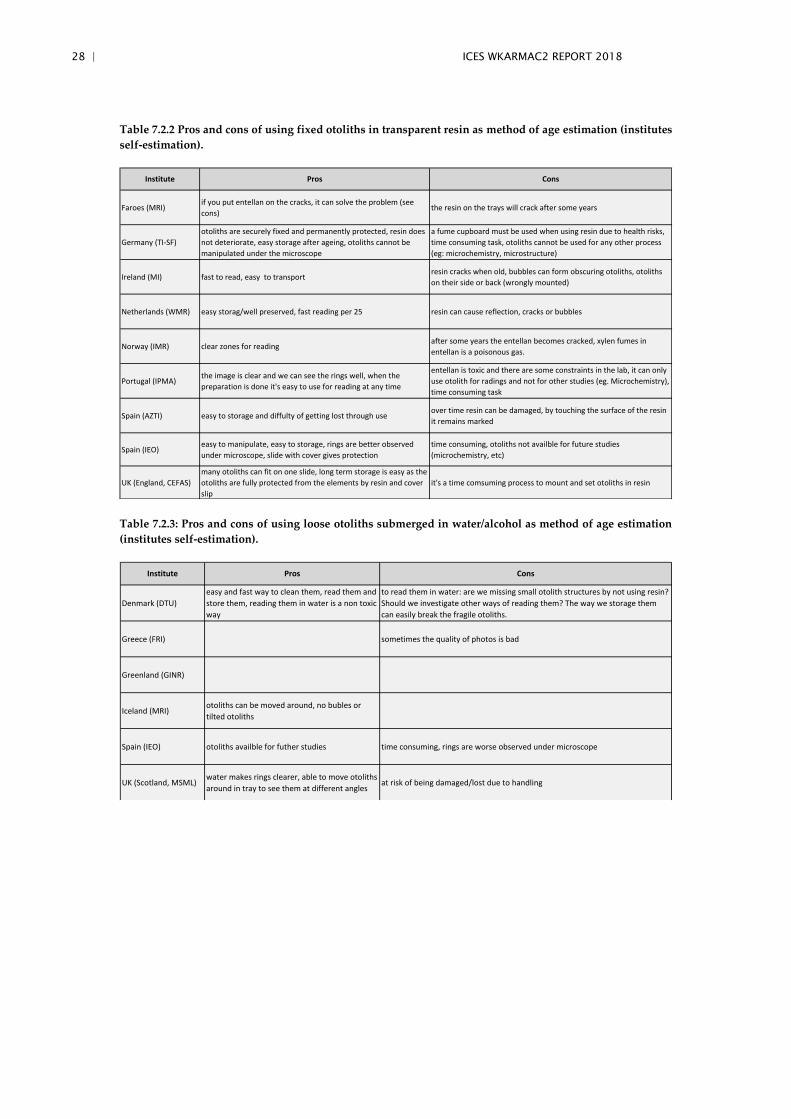
28 | ICES WKARMAC2 REPORT 2018
Table 7.2.2 Pros and cons of using fixed otoliths in transparent resin as method of age estimation (institutes
self-estimation).
Table 7.2.3: Pros and cons of using loose otoliths submerged in water/alcohol as method of age estimation
(institutes self-estimation).
Faroes (MRI)if you put entellan on the cracks, it can solve the problem (see
cons)the resin on the trays will crack after some years
Germany (TI-SF)
otoliths are securely fixed and permanently protected, resin does
not deteriorate, easy storage after ageing, otoliths cannot be
manipulated under the microscope
a fume cupboard must be used when using resin due to health risks,
time consuming task, otoliths cannot be used for any other process
(eg: microchemistry, microstructure)
Ireland (MI) fast to read, easy to transportresin cracks when old, bubbles can form obscuring otoliths, otoliths
on their side or back (wrongly mounted)
Netherlands (WMR) easy storag/well preserved, fast reading per 25 resin can cause reflection, cracks or bubbles
Norway (IMR) clear zones for readingafter some years the entellan becomes cracked, xylen fumes in
entellan is a poisonous gas.
Portugal (IPMA)the image is clear and we can see the rings well, when the
preparation is done it's easy to use for reading at any time
entellan is toxic and there are some constraints in the lab, it can only
use otolith for radings and not for other studies (eg. Microchemistry),
time consuming task
Spain (AZTI) easy to storage and diffulty of getting lost through useover time resin can be damaged, by touching the surface of the resin
it remains marked
Spain (IEO)easy to manipulate, easy to storage, rings are better observed
under microscope, slide with cover gives protection
time consuming, otoliths not availble for future studies
(microchemistry, etc)
UK (England, CEFAS)
many otoliths can fit on one slide, long term storage is easy as the
otoliths are fully protected from the elements by resin and cover
slip
it's a time comsuming process to mount and set otoliths in resin
Institute Pros Cons
Denmark (DTU)
easy and fast way to clean them, read them and
store them, reading them in water is a non toxic
way
to read them in water: are we missing small otolith structures by not using resin?
Should we investigate other ways of reading them? The way we storage them
can easily break the fragile otoliths.
Greece (FRI) sometimes the quality of photos is bad
Greenland (GINR)
Iceland (MRI)otoliths can be moved around, no bubles or
tilted otoliths
Spain (IEO) otoliths availble for futher studies time consuming, rings are worse observed under microscope
UK (Scotland, MSML)water makes rings clearer, able to move otoliths
around in tray to see them at different anglesat risk of being damaged/lost due to handling
ConsInstitute Pros
ICES WKARMAC2 REPORT 2018 | 29
7.3 Agreed criteria for ageing mackerel
7.3.1 Viewing the otoliths
There are two ways of reading mackerel otoliths. The most commonly used is using a binocular
microscope, with a reflected light source and a magnification of between x15 and x40, depend-
ing on the age of the mackerel. Alternatively, the age can be estimated reading digital images
(section 7.3.1.1).
7.3.1.1 Age estimation applying digital images
Reading digital images and reading directly onto the images using an image analysis system is
an alternative to reading the otoliths under a binocular microscope. Applying this method, the
preservation of both reference materials (digitised images of otoliths) and the interpretations
of the age structures (annotations done by the reader) can benefit.
It must be borne in mind that a digitised image does not hold the same ‘information’ for the
human eye and the computer. The reader would obviously prefer the best possible image mir-
roring what is seen in the microscope (i.e. showing all structures of the otolith) whereas the
computer just records an image as a matrix of numbers. The latter does allow a wide span of
post-processing, e.g. improving image quality, extracting structures, making measurements,
etc.
Holding all otoliths in an image database first and foremost preserves all collected material as
the pictures do not deteriorate like biological material (scales, otoliths), thus all information
shown in the pictures are kept for good. The images facilitate a number of things:
- Re-estimation of the age (repeatability of the reader)
- Sharing otoliths with other readers
- Storing information about the readings (traceability)
- Quantitative measurements (growth curves, back calculation, statistical processing,
etc.)
- Potential improvements of the original image to make the structures more visible
The quality of the digital image obviously must be as good as possible, thus attention should
be paid to light setting, magnification, etc. It is highly recommended that the quality of both
the microscope and the camera used is as good as possible. The pixel capacity and the light
sensitivity of the camera are also important factors to consider.
Making sure the image is of the highest quality implies several things:
- Good preparation of the sample (each species has its own specific method).
- Special attention should be paid to the background and the light, the goal is to have
a strong contrast between the opaque and translucent zones (avoid overexposed im-
ages).
- The digitised image must be as close as possible to the image you have under the
microscope.
- The images must be calibrated (using a micrometre as a reference) with the maxi-
mum of precision.
- All images should be stored in a database that is linked to the biometric data for
each otolith sample.
When making age estimations directly on the digitised image, the age structures should be
marked applying simple image analysis software. This facilitates a few post-processing
measures, as e.g. achieving average distances between rings, comparison of the growth curve
30 | ICES WKARMAC2 REPORT 2018
of a specific otolith with the overall growth curve for the otoliths of a particular sample/quar-
ter/etc. It also makes back-calculation of length and additional statistical analysis possible.
The system, by which otoliths are read directly from digitised images and not using a micro-
scope, was fully implemented at Ifremer, France. Here the otolith reader estimates the age of
an individual twice, annotates the age structures on the image and checks the entire sample for
outliers after finishing the reading exercise. The length of the individual fish is unknown to the
reader while doing the age estimation. This information is used as a post-process check using
the age-length keys produced for each sample. This technique has been tested by the French
institutes where readings performed with ‘live’ otoliths under a microscope were compared
with readings performed directly on digitised images. The percentage of agreement for all spe-
cies was more than 98%, testing on less complicated otoliths as plaice. However, if trained
properly and having a suitable set-up in terms of camera, etc., this technique may be as solid
as the more traditional age reading process.
At present only Belgium has also adopted this system and the Netherlands are intending to do
so (pers. com. Loes Bolle). In the Netherlands this will be a phased transition. At the moment
only herring age reading is based on images analysis alone but from next year more species
will be included.
7.3.2 Age determination criteria
It is essential that all otoliths readers are aware of the age determination criteria that should be
applied before age determination is attempted (ICES, 1994). The age determination criteria for
mackerel are as follows:
1 ) The date of birth is assumed to be 1st January and the fish is assigned to a year class
on this basis. In Mediterranean waters the date of birth is assumed to be the 1st July.
Therefore, the date of capture of the sample should always be available.
2 ) One opaque zone and one translucent (hyaline) zone constitutes one year of growth
(annulus).
3 ) The timing of the formation of the opaque zone on the edge of the otolith is heavily
dependent on the area from which the sample was taken. When allocating the fish
to a year class therefore, the area of capture should also be known.
4 ) The summer increment (opaque zone) should be continuous around the otolith (the
“ring” should be visible in at least two areas; however, especially in old specimens
it might only be visible at the rostrum).
5 ) The relative widths of each ring should progressively be smaller as the otolith grows.
Although conditions affecting the life history of the fish can create unexpected rela-
tive width proportions between annuli.
6 ) For mackerel caught in the 1st and 2nd quarter of the year, all winter rings and the
translucent (hyaline) edge are counted. The translucent (hyaline) edge is always
counted as one winter ring, even if nothing or very little is visible. However, as the
study of seasonal formation of growth rings in the otoliths of the NEA Mackerel in
ICES div. 8c and 9a reveals, the proportion of hyaline edges varies gradually over
months and so is the delay in the formation of the opaque edge with age (see Section
6). According with this study, 50% of otoliths with opaque edge in one-year-old
specimens occur at the end of March, whereas for two-years-old this occurs at the
end of May and so on (Figure 6.3). This new opaque ring is usually thin, so is usually
easily identified. Therefore, in young fish from ICES div. 8c-9a, this new ring is not
counted (Figure 7.3.2.1). Thus, the area of capture is very important in this quarter
and similar studies should be carried out in the other areas. For otoliths caught from
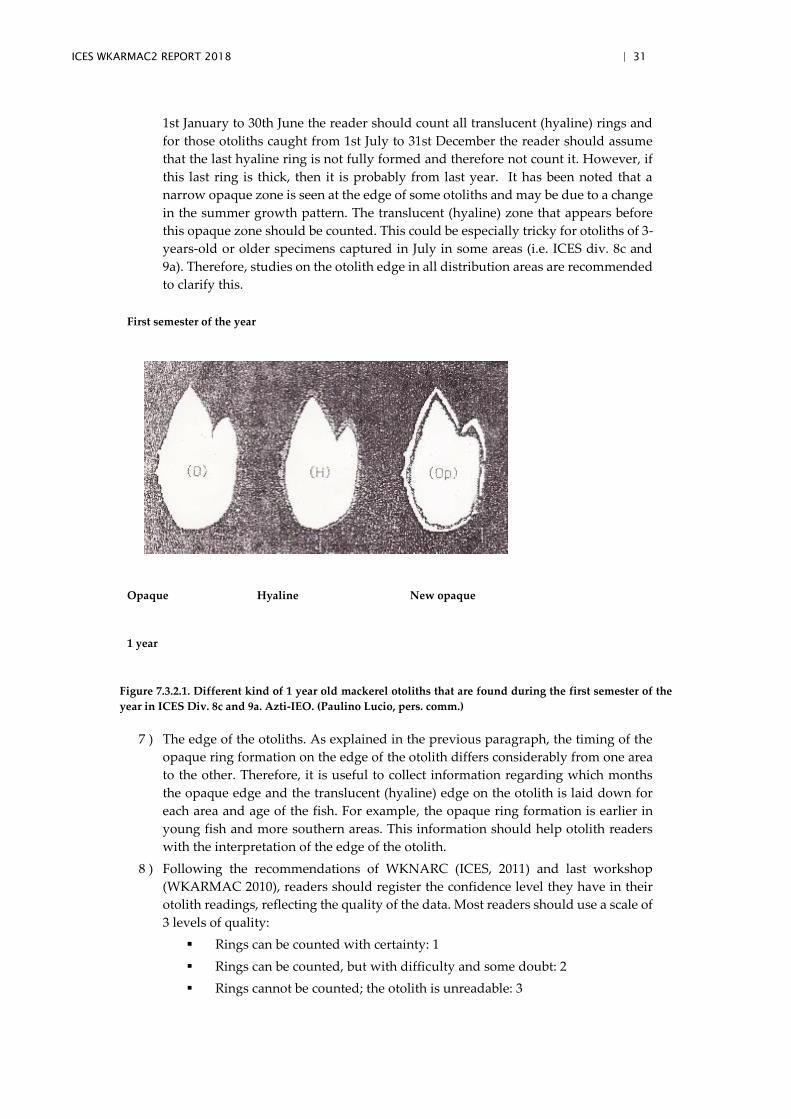
ICES WKARMAC2 REPORT 2018 | 31
1st January to 30th June the reader should count all translucent (hyaline) rings and
for those otoliths caught from 1st July to 31st December the reader should assume
that the last hyaline ring is not fully formed and therefore not count it. However, if
this last ring is thick, then it is probably from last year. It has been noted that a
narrow opaque zone is seen at the edge of some otoliths and may be due to a change
in the summer growth pattern. The translucent (hyaline) zone that appears before
this opaque zone should be counted. This could be especially tricky for otoliths of 3-
years-old or older specimens captured in July in some areas (i.e. ICES div. 8c and
9a). Therefore, studies on the otolith edge in all distribution areas are recommended
to clarify this.
First semester of the year
Opaque Hyaline New opaque
1 year
Figure 7.3.2.1. Different kind of 1 year old mackerel otoliths that are found during the first semester of the
year in ICES Div. 8c and 9a. Azti-IEO. (Paulino Lucio, pers. comm.)
7 ) The edge of the otoliths. As explained in the previous paragraph, the timing of the
opaque ring formation on the edge of the otolith differs considerably from one area
to the other. Therefore, it is useful to collect information regarding which months
the opaque edge and the translucent (hyaline) edge on the otolith is laid down for
each area and age of the fish. For example, the opaque ring formation is earlier in
young fish and more southern areas. This information should help otolith readers
with the interpretation of the edge of the otolith.
8 ) Following the recommendations of WKNARC (ICES, 2011) and last workshop
(WKARMAC 2010), readers should register the confidence level they have in their
otolith readings, reflecting the quality of the data. Most readers should use a scale of
3 levels of quality:
Rings can be counted with certainty: 1
Rings can be counted, but with difficulty and some doubt: 2
Rings cannot be counted; the otolith is unreadable: 3
32 | ICES WKARMAC2 REPORT 2018
However, Cefas uses a 4-level key: G (Good), M (Moderate), P (Poor) and 99 (Unreadable). This
system is detailed in their accreditation under ISO 17025 and therefore cannot be changed. For
the purposes of mapping the 4-level key to the 3-level key, M and P are analogous to level 2.
7.3.3 Other available information
Other information may be available about the fish including length and maturity. There is a
school of thought that believes that length information may influence the decision of the reader
when assigning an age. While this may be true, sometimes knowing the fish length can help in
the age interpretation in older and/or difficult otoliths. Anyway, any experienced otolith reader
will know the approximate length of the fish purely from the features of the otolith. Also, it
could be an advantage to have the length available when reading samples of otoliths that are
mounted together in large numbers. It is often possible to identify whether otoliths have been
mixed up during sampling or preparation. Therefore, even if it is recommended to estimate the
age of the otolith without knowing the fish length, it would be helpful if this information is
available when reading difficult otoliths or in case of doubt.
7.3.4 Otolith interpretation
It is always preferable to have the pair of whole otoliths available when trying to interpret the
ring structure. Mackerel otoliths can vary in appearance and therefore it is important to remem-
ber that there is no one “correct” position where to count rings. Ideally, the translucent (hya-
line) rings should be counted and usually the preferred areas include the rostrums and the
posterior regions. As many locations as possible on the otoliths should be examined where the
ring structure is clear, and the annual rings are visible. This usually involves counting at the
rostrum and the posterior region until the reader is satisfied that consistent interpretation has
been achieved. However, it is sometimes possible that other areas of the otolith are readable,
e.g. the anti-rostrum, and interpretation of appropriate parts of the otolith should be consid-
ered, especially if one of the otoliths is broken, missing or crystalline.
Conflicting ages may be achieved if several parts of the otoliths are examined (usually in older
fish). If this happens, the oldest age is probably the correct one, as examination of tagged fish
otoliths of known minimum age has demonstrated that the highest age is more consistent with
the information on the history of fish (ICES, 1987). Therefore, if in doubt about the interpreta-
tion of the rings assign the fish to the highest age but take the length of the fish into account.
7.3.5 False or Split Rings
It is always difficult to define the appearance of false or split rings on otoliths for any species.
Usually these are properly identified only after much experience has been gained for a species.
False or split rings are usually considered to be those rings that are not as well defined as annual
rings. The reason for the deposition of false or split rings is not certain, but they might be caused
by aberrant temperature, feeding or spawning conditions, stress or disease. One way to identify
false rings is the observation of the ring growth pattern. Usually the annuli width decreases
with the age and the presence of rings that not follow this pattern indicates that that ring is
false. Once again, this can be difficult for older otoliths and the identification of false rings
mostly depends on the experience of the reader.
ICES WKARMAC2 REPORT 2018 | 33
7.3.6 Factors affecting annual ring formation
7.3.6.1 Formation of the first winter ring
Mackerel spawn from January to April in (Division 9a), from February to May in southern Bis-
cay (Division 8c), March to July in the Celtic Sea and to the west of Ireland, from June to August
in the North Sea (Divisions 4b and 3a) (Section 3). Therefore, the amount of time available for
growth and the formation of the opaque zone in the first year will vary within and between
areas. It is therefore reasonable to expect a large amount of variation in the length of the L1
(first year growth on the otolith) and this should be borne in mind when interpreting the first
opaque and translucent zones. In addition to the variation in L1 between areas, it is also been
demonstrated that there is considerable variation in the L1 between years for the Celtic Sea and
the North Sea (Dawson, 1991). The reader, therefore, when interpreting the ring structure
should be aware of sources of variation that may affect the nature of annual ring formation in
the first year.
7.3.6.2 Age at maturity
The majority of mackerel otoliths that have been examined show a change in the pattern of ring
formation that is presumably associated with the onset of maturity. Usually, growth slows
down when the fish diverts much of its energy into gonad maturation. The resultant effect on
the otolith is that for juvenile fish a large amount of opaque growth is produced between much
narrower translucent rings. After maturity, growth slows down and both the opaque and the
translucent rings become narrower and therefore closer together.
The above description is only a guide to the pattern of ring formation and obviously there is
much variation in the age at maturity within an area as well as between areas. It is also possible
that this change in the pattern of ring formation associated with maturity is not present. Some-
times otoliths may be observed to have very regular, clearly defined ring formation with only
a linear decline in growth rate.
7.3.6.3 Reduced growth in very old fish
In most young and middle-aged fish, the growth pattern is well defined on the otolith with
clear contrasting opaque and hyaline zones. However, in old fish, growth often slows down to
such an extent that the opaque and translucent (hyaline) zones become confused and more
difficult to distinguish. That portion of the otolith will have a greyish appearance. When this
type of ring formation is observed, the reader usually finds that the translucent (hyaline) rings
are very closed together and difficult to identify. However, usually each narrow translucent
(hyaline) ring and opaque ring represents one year’s growth.

34 | ICES WKARMAC2 REPORT 2018
8 Collation of a set of agreed age otoliths (part of ToR e)
An otolith reference collection will be available for all mackerel readers at the workshop ICES
SharePoint and the Age Forum site. This collection will include those otoliths images with >80%
agreement between Expert readers. Also, this reference collection will include the images of the
otoliths used during the Small exchange with Norwegian otoliths carried out during the work-
shop.
ICES WKARMAC2 REPORT 2018 | 35
9 Recommendations for further cooperation, exchanges, workshops and
other actions in relation to the age estimation of Mackerel (part of ToR
e)
9.1 General recommendations
The workshop achieved quite a lot in terms of ironing out, through discussion and calibration,
some of the major problems in ageing mackerel otoliths. The group reached agreement in the
interpretation of many difficult otoliths discussed during the workshop. Also, the group re-
vised and completed the ageing protocol/guidelines approved in last workshop with the aim
to employ these guidelines to eliminate some of the problems with e.g. split rings in the otolith
structures. The group strongly recommends that all ageing laboratories processing mackerel
should include the guidelines revised during the workshop in their ageing manuals. If possible,
the ICES system should facilitate the distribution of these guidelines to all relevant laboratories.
For the sake of continuity, it is highly recommended that new readers are trained by experi-
enced readers prior to delivering data to the assessment on mackerel. The workshop exercise
clearly showed a difference in the level of agreements between experienced readers and those
with less or none experience. Also, it is strongly recommended that all readers whose estima-
tions are used in mackerel assessment attend these workshops on age estimation of mackerel,
as it is through the discussion of different interpretations of the age of difficult and/or old oto-
liths that most agreements are reached.
During last workshop it became apparent that the various life-history traits for the mackerel
have changed recently and that knowledge of this is highly important for the age readers. In
addition, all age readers would benefit from more information on the formation of otolith struc-
tures in mackerel, especially the formation of split rings and the seasonally dependent appear-
ance of the otolith edge. Thus, the group recommends the inclusion of such studies on otolith
formation in general for mackerel.
Below are some general recommendations by the group for further action.
9.1.1 Manual
The age reading manual produced during last workshop (WKARMAC, 2010) and updated at
this workshop should be maintained and further developed in the future.
9.1.2 Standardised reading within laboratories (section taken from last workshop
report, WKARMAC 2010).
It is essential that otolith readers, whether fully trained or otherwise, have their work quality
controlled. There are two main reasons for this. The first is that by conducting quality control,
extremely valuable evidence of the precision of an age determination programme can be ob-
tained. It is vital that the ages assigned to otoliths that are used in assessments are assigned the
“best” age, given the methods at our disposal. As the actual age of the fish is unknown, age
determination experts need to ensure the age provided is as close to the actual age as possible
and that the ages given are repeatable if the determinations are redone. By having two experts
independently ageing the otoliths, we can give assurances about the reliability of the data.
Secondly, even the most experienced readers are capable of drifting away from their training
over time and another reader looking at a sample of their reading to check consistency will
ensure no drift occurs. This effort to ensure consistency of interpretation is further enhanced
with the use of reference collections. The quality controller (QC) will be a very experienced
reader in the species and probably the stock concerned. In this way, the effectiveness of the age
determination programme to produce consistent results can be assessed and assured.
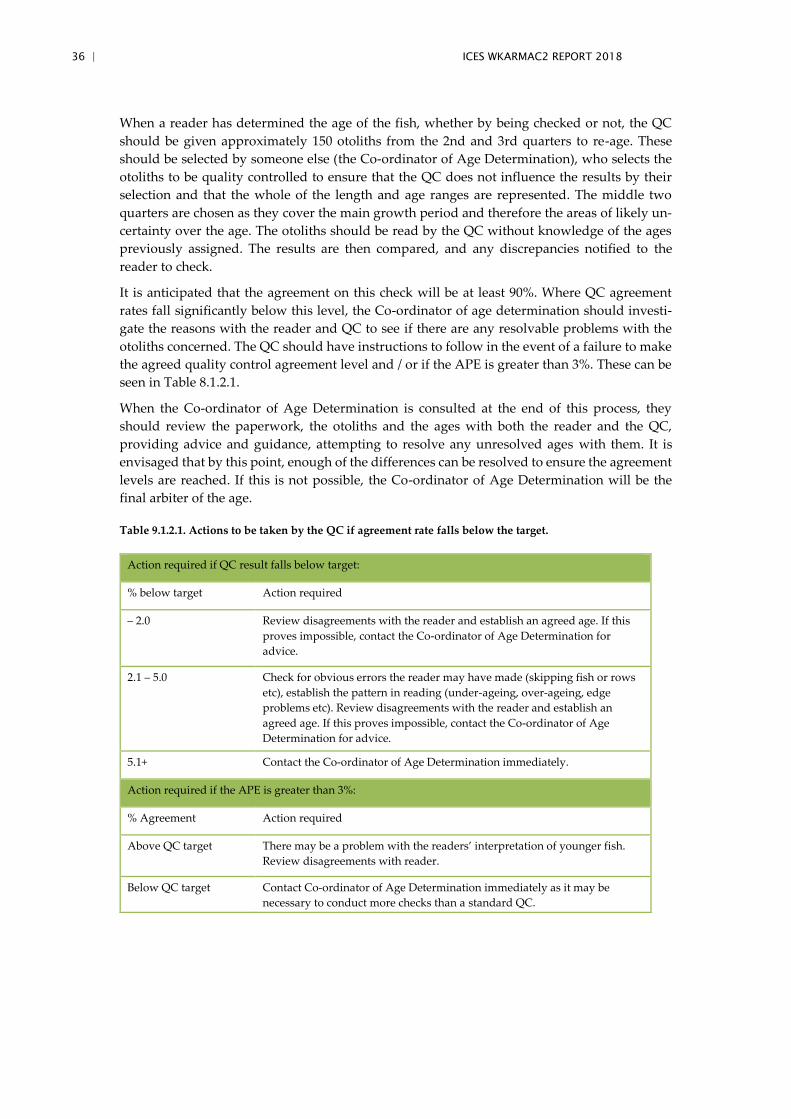
36 | ICES WKARMAC2 REPORT 2018
When a reader has determined the age of the fish, whether by being checked or not, the QC
should be given approximately 150 otoliths from the 2nd and 3rd quarters to re-age. These
should be selected by someone else (the Co-ordinator of Age Determination), who selects the
otoliths to be quality controlled to ensure that the QC does not influence the results by their
selection and that the whole of the length and age ranges are represented. The middle two
quarters are chosen as they cover the main growth period and therefore the areas of likely un-
certainty over the age. The otoliths should be read by the QC without knowledge of the ages
previously assigned. The results are then compared, and any discrepancies notified to the
reader to check.
It is anticipated that the agreement on this check will be at least 90%. Where QC agreement
rates fall significantly below this level, the Co-ordinator of age determination should investi-
gate the reasons with the reader and QC to see if there are any resolvable problems with the
otoliths concerned. The QC should have instructions to follow in the event of a failure to make
the agreed quality control agreement level and / or if the APE is greater than 3%. These can be
seen in Table 8.1.2.1.
When the Co-ordinator of Age Determination is consulted at the end of this process, they
should review the paperwork, the otoliths and the ages with both the reader and the QC,
providing advice and guidance, attempting to resolve any unresolved ages with them. It is
envisaged that by this point, enough of the differences can be resolved to ensure the agreement
levels are reached. If this is not possible, the Co-ordinator of Age Determination will be the
final arbiter of the age.
Table 9.1.2.1. Actions to be taken by the QC if agreement rate falls below the target.
Action required if QC result falls below target:
% below target Action required
– 2.0 Review disagreements with the reader and establish an agreed age. If this
proves impossible, contact the Co-ordinator of Age Determination for
advice.
2.1 – 5.0 Check for obvious errors the reader may have made (skipping fish or rows
etc), establish the pattern in reading (under-ageing, over-ageing, edge
problems etc). Review disagreements with the reader and establish an
agreed age. If this proves impossible, contact the Co-ordinator of Age
Determination for advice.
5.1+ Contact the Co-ordinator of Age Determination immediately.
Action required if the APE is greater than 3%:
% Agreement Action required
Above QC target There may be a problem with the readers’ interpretation of younger fish.
Review disagreements with reader.
Below QC target Contact Co-ordinator of Age Determination immediately as it may be
necessary to conduct more checks than a standard QC.
ICES WKARMAC2 REPORT 2018 | 37
9.1.3 Quality control between labs.
Quality control of age estimations between national laboratories can be achieved in at least two
ways;
The standard exchange programme and workshops under the ICES programme.
Readers read a set of otoliths and are compared with a modal age. This provides a
snapshot of the agreement between readers, both expert and trainees, for the year in
which the exchange or workshop takes place. It is particularly useful as many labor-
atories can take part and results compared. It can be used to confirm the validity of
a laboratory’s ageing criteria and interpretation or show problems. Exchanges and
workshops can be expensive, slow to organise and therefore results are slow in ar-
riving. However, the use of otolith images at otolith exchanges during the last years
has accelerated the process.
A small-scale, ad hoc exchange or workshop between two or more laboratories look-
ing at a specific stock or substock of the species, incorporating just those countries
that have a direct interest in the stock. This type of approach is particularly useful to
ensure that ages submitted to the stock assessment process are comparable. This
type of exchange or workshop is inexpensive and can be done quickly to address the
issues.
9.1.4 Regular workshops
The past frequency of workshops has been approximately decadal, which certainly does not
cover the requirement for intra laboratory quality control of the age estimation of mackerel.
Several factors need to be considered when deciding upon the frequency of workshops; there
is the constant changing in behaviour of mackerel, which heavily influence the otolith mor-
phology and thus the patterns to interpret. Also, there is a flow of age readers through the
laboratories, which need to be considered. It should be ensured that all labs do have at least
one age reader acquainted with the agreed guidelines for age estimations of mackerel. Addi-
tionally, there is always a need to update the flow of information between age readers, data
collectors and end-users. Thus, during the last workshop (WKARMAC 2010) it was recom-
mended the inclusion of both assessment experts and age readers in future workshops. It has
proved very valuable for previous workshops, WKARMAC (2010) and WKARMAC2 (2018), to
have a co-chair with experience in mackerel assessment present at the workshops during dis-
cussions of results and their potential consequences.
Also, it is recommended that the readers whose age estimations are included in mackerel as-
sessment attend the workshops in age estimation of mackerel.
As a recommendation from WKARMAC2 participants, it would be good that during the next
workshop exercise the otoliths would be also available in situ, so the readers can observe them
under the binocular microscope, in conjunction with the image analysis.
38 | ICES WKARMAC2 REPORT 2018
10 References
Abaunza, P.; Villamor, B.; Pérez, J.R. 1995. Infestation by larvae of Anisakis simplex (Nematoda, Ascaridata)
in horse mackerel, Trachurus trachurus, and Atlantic mackerel, Scomber scombrus, in ICES Divivions
VIIIb, VIIIc and IXa (N-NW of Spain). Scientia Marina 59, 223-233.
Beckman, D.W., Wilson, C.A., 1995. Seasonal timing of opaque zone formation in fish otoliths. In: Secor,
D.H., Dean, J.M., Campana, S.E. (Eds.), Recent Developments in Fish Otolith Research. University of
South Carolina Press, Columbia, pp. 27–44.
Berge, J., Heggland, K., Lønne, O. J., Cottier, F., Hop, H., Gabrielsen, G. W., Nøttestad, L., and Misund, O.
A. 2015. First records of Atlantic mackerel (Scomber scombrus) from the Svalbard Archipelago, Nor-
way, with possible explanations for the extension of its distribution. Arctic, 68: 54–61.
Bruge, A., Alvarez, P., Fontán, A., Cotano, U., & Chust, G. (2016). Thermal niche tracking and future dis-
tribution of Atlantic mackerel spawning in response to ocean warming. Frontiers in Marine Science,
3(86), 1–13
Brunel T, van Damme CJG, Samson M, Dickey-Collas M. 2017. Quantifying the influence of geography
and environment on the northeast Atlantic mackerel spawning distribution. Fisheries Oceanography.
27(2):159-173. Available from: 10.1111/fog.12242
Cabral, H.N.; Murta, A.G. 2002. The diet of blue whiting, hake, horse mackerel and mackerel off Portugal.
Journal of Applied Ichthyology, 18 (2002), 14-23.
Campana, S.E. 2001. Accuracy, precision and quality control in age determination, including a review of
the use and abuse of age validation methods. Journal of fish Biology (2001) 59, 197-242.
Carrera, P. 2017. Pelagic ecosystem acoustic-trawl survey PELACUS 0317 results on mackerel, horse
mackerel, blue whiting and boar fish abundance estimates. WD to WGWIDE 2017 (ICES CM
2017/ACOM: 18. http://hdl.handle.net/10508/11315
Dawson, Wendy A. 1991. Otolith measurement as a method of identifying factors effecting first-years
growth and stock separation of mackerel (Scomber scombrus L.). J. Cons. Int. Explor. Mer., 47: 303-
317.
D’Amours, D.; Landry, J.G.; Lambert, T.C.. 1990. Growth of Juvenile (0-Group) Atlantic Mackerel
(Scombrus) in the Gulf of St. Lawrence. Canadian Journal of Fisheries and Aquatic Sciences, 19990,
47(11): 2212-2218.
Eltink, A.T.G.W. 2000. Age Reading Comparisons (MS Excel Workbook version 1.0 October 2000).
http://www.efan.no.
FISHBASE (last accessed: 13 october 2007). Scomber Scombrus. http://www.fishbase.org/Summary/spe-
ciesSummary.php?ID=118&genusname=Scomber&speciesname=scombrus.
Gordo, L.S., Marins, M.M.B., and Jorge, I.M. 1982. Preliminary study on the age and growth of Mackerel
(Scomber scombrus L.) in the ICES Subarea IX. ICES C.M. 1982/H:16.
Høie, H., R.S. Millner, S. McCully, K.H. Nedreaas, G.M. Pilling, J. Skadal. 2009. Latitudinal differences in
the timing of otolith growth: A comparison between the Barents Sea and southern North Sea. Fisher-
ies Research 96: 319–322ICES, 1987. Report of the Mackerel Age Determination Workshop, Lowestoft,
1-6 June 1987.
Ibaibarriaga, L., Irigoien, X., Santos, M., Motos, L., Fives, J. M., Franco, C., Lago de Lanzós, A., Acevedo,
S., Bernal, M., Bez, N., Eltink, G., Farinha, A., Hammer, C., Iversen, S. A., Milligan, S. P., and Reid, D.
G. (2007). Egg and larval distributions of seven fish species in north-east Atlantic waters. Fisheries
Oceanography 16(3): 284–293.
ICES, 1987. Report of the Mackerel Age Determination Workshop, Lowestoft, 1-6 June, 1987.
ICES, 1994. Report of the Workshop on Sampling Strategies for Age and Maturity. ICES C.M. 1994\D:1,
67pp.
ICES, 1995. Report of the Workshop on Mackerel Otolith Reading. ICES CM 1995/H:1,45pp.
ICES WKARMAC2 REPORT 2018 | 39
ICES, 2010. Report of the Workshop on Age Reading of Mackerel, 1-4 November 2010, Lowestoft, UK.
ICES CM 2010/ACOM: 46. 66 pp. ICES, 2011. Report of the Workshop of National Age Readings
Coordinators (WKNARC), 5-9 September 2011, Boulogne-sur-Mer, France. ICES CM 2011/ACOM:45.
ICES, 2017a. Report of the Working Group on Fish Distribution Shifts (WKFISHDISH), 22–25 November
2016, ICES HQ, Copenhagen, Denmark. ICES CM 2016/ACOM: 55. 197 pp.
ICES, 2017b. Final Report of the Working Group on Mackerel and Horse Mackerel Egg Surveys.
WGMEGS Report 2017 24-28 April 2017. Vigo, Spain. ICES CM 2017/SSGIEOM: 18. 134 pp.
ICES, 2018a. Report of the Working Group on Mackerel and Horse Mackerel Egg Surveys (WGMEGS), 9
- 13 April 2018, Marine Institute, Dublin, Ireland. ICES CM 2018/EOSG: 17 70 pp.
ICES, 2018b. Report of the Working Group on Widely Distributed Stocks (WGWIDE), 28 August- 3 Sep-
tember 2018, Torshavn, Faroe Islands. ICES CM 2018/ACOM: 23. 488 pp.
ICES, 2018c. Report of the Workshop on Mackerel biological parameter Quality Indicators (WKMACQI).
ICES CM 2018/EOSG 34.
Iglesias, M., J. Miquel, B. Villamor, C. Porteiro and P. Carrera. 2005. Spanish Acoustic surveys in Divsion
VIIIc and Sub-division IXa North: Results on Mackerel from 2001 to 2005. Working Document to
Working Group Mackerel, Horse Mackerel, Sardine and Anchovy (ICES CM 2006/Assess: 06). Jansen,
T., K. Kristensen, J. van der Kooij, S. Post, A. Campbell, K. R. Utne, P. Carrera, J.A. Jacobsen, A.
Gudmundssdottir, B. A. Roel. 2014. Nursery areas and recruitment variation of Northeast Atlantic
mackerel (Scomber scombrus). ICES Journal of Marine Science, doi: 10.1093/icesjms/fsu186.
Mendiola, D and Álvarez, P. 2008. Validation of daily increments in the otolith microstructure of North-
east Atlantic mackerel fish larvae. Fisheries Research 89 (2008): 300-304
Migoya,, M.C. 1989. Etude de la croissance des larves de maquereau bleu (Scomber scombrus) dans le Golfe
du St. Laurent, a partir de l’examen de la microstructure des otoliths. PhD Thesis. Univeristy of Que-
bec (Canada).
Muus, B.J., and Nielsen, J.G. 1999. Sea fish. Scandinavian Fishing Year Book, Hedehusene, Denmark, p.
340.
Muus, B.J., Nielsen, J.G., Dahlstrom, P., and Nyström, B.O. 1997. Zeevissen van Noord- en West-Europa.
Schuyt & Co Uitgevers en Importeurs BV, Haarlem.Neja, 1995
Navarro, M.R.; Villamor, B.; Myklevoll, S.; Gil, J.; Abaunza, P.; Canoura, J. 2012. Maximum size of Atlantic
mackerel (Scomber scombrus) and Atlantic chub mackerel (Scomber colias) in the Northeast Atlantic.
Cybium 2012, 36(2): 406-408.
Olaso, I., J.L. Gutiérrez, B. Villamor, P. Carrera, L. Valdés and P. Abaunza, 2005. . 2005. Seasonal changes
in the north-eastern Atlantic mackerel diet (Scomber scombrus) in the north of Spain (ICES Division
VIIIc). J. Mar. Biol. Ass. UK, 85(2): 415-418.Overholtz, 1989;
Pacariz, S. V., Hátún, H., Jacobsen, J. A., Johnson, C., Eliasen, S., and Rey, F. 2016. Nutrient-driven pole-
ward expansion of the Northeast Atlantic mackerel (Scomber scombrus) stock: A new hypothesis.
Elementa: Science of the Anthropocene, 4:105: 13 p.
Panfili, J.; Pontual, H. (de); Troadec, H.; Wright, P.J. (eds), 2002. Manual of fish sclerochronology. Brest,
France: Ifremer-IRD coedition, 464 pp.
Pearson, D.N., 1996. Timing of hyaline-zone formation as related to sex, location, and year of capture in
otoliths of the widow rockfish Sebastes entomelas. Fish. Bull. 94, 190–197.
Ulleweit, J. 2014. Report of the Small Scale Otolith Exchange for North East Atlantic Mackerel (Scomber
scombrus) 2014. December 2013-April 2014, Thünen Institute of Sea Fisheries, Hamburg (Germany).
Villamor, B. & M. Meixide. 1995. Results of the Mackerel (Scomber scombrus, L.) otolith exchange pro-
gramme in 1994. ICES CM 1995/H: 12, 31 p.

40 | ICES WKARMAC2 REPORT 2018
Annex 1: Agenda
Meeting agenda
Monday, October 22nd, 2018
10.00 – 10.30 Start of the meeting; Introduction round; Presentation of the agenda; Lo-
cal and network arrangements; Brief overview of ToRs
10.30 – 11.15
Review information on age determination, otolith exchanges and valida-
tion techniques of this species done so far (ToR a);
Summary of the different techniques of chub mackerel otoliths prepara-
tion by laboratory.
11.15 – 11.30 Coffee break
11.30 – 12.00 Presentation of the biology of mackerel (ToR a);
Study of the otolith edge development (ToR a)
12.00 – 13.00
Presentation and discussion of the otolith exchanges results (Small ex-
change 2014 and pre-WKARMAC2 exercise), comparison of precision
against modal age and bias; evaluation of levels of agreement among
readers and laboratories (ToRs a and b)
13.00 – 14.30 Lunch break
14.30 – 15.45
Recap on the agreed manual for age estimation of mackerel; Identifica-
tion of problems and difficulties in age estimation of mackerel, including
on screen discussion of relevant otolith readings from exchanges (ToRs
b and c)
15.45 – 16.00 Coffee break
16.00 – 17.30
Identification of problems and difficulties in age estimation of mackerel,
including on screen discussion of relevant otolith readings from ex-
changes (ToRs b and e)
Tuesday, October 23rd, 2018
09.00 – 11.00
Identification of problems and difficulties in age estimation of chub
mackerel, including on-screen discussion of relevant otolith readings
from each area (ToRs b and e )
11.00 – 11.15 Coffee break
11.15 – 13.00
Identification of problems and difficulties in age estimation of chub
mackerel, including on-screen discussion of relevant otolith readings
from each area (ToRs b and e )
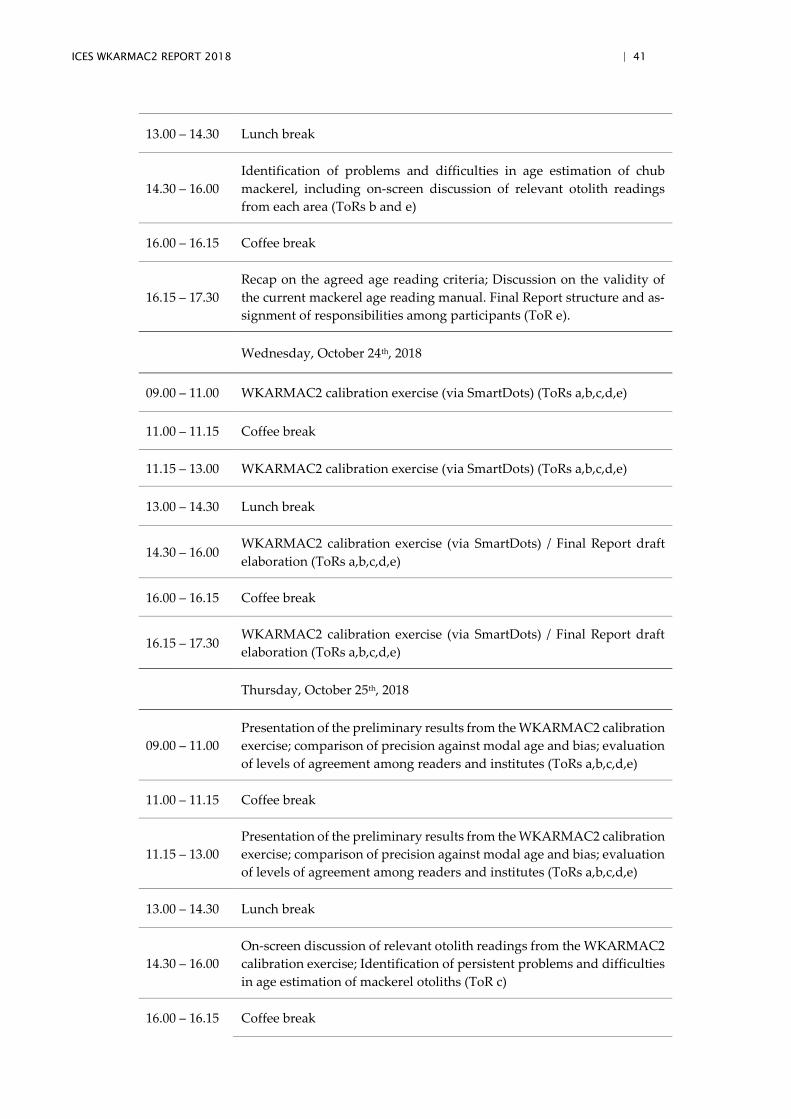
ICES WKARMAC2 REPORT 2018 | 41
13.00 – 14.30 Lunch break
14.30 – 16.00
Identification of problems and difficulties in age estimation of chub
mackerel, including on-screen discussion of relevant otolith readings
from each area (ToRs b and e)
16.00 – 16.15 Coffee break
16.15 – 17.30
Recap on the agreed age reading criteria; Discussion on the validity of
the current mackerel age reading manual. Final Report structure and as-
signment of responsibilities among participants (ToR e).
Wednesday, October 24th, 2018
09.00 – 11.00 WKARMAC2 calibration exercise (via SmartDots) (ToRs a,b,c,d,e)
11.00 – 11.15 Coffee break
11.15 – 13.00 WKARMAC2 calibration exercise (via SmartDots) (ToRs a,b,c,d,e)
13.00 – 14.30 Lunch break
14.30 – 16.00 WKARMAC2 calibration exercise (via SmartDots) / Final Report draft
elaboration (ToRs a,b,c,d,e)
16.00 – 16.15 Coffee break
16.15 – 17.30 WKARMAC2 calibration exercise (via SmartDots) / Final Report draft
elaboration (ToRs a,b,c,d,e)
Thursday, October 25th, 2018
09.00 – 11.00
Presentation of the preliminary results from the WKARMAC2 calibration
exercise; comparison of precision against modal age and bias; evaluation
of levels of agreement among readers and institutes (ToRs a,b,c,d,e)
11.00 – 11.15 Coffee break
11.15 – 13.00
Presentation of the preliminary results from the WKARMAC2 calibration
exercise; comparison of precision against modal age and bias; evaluation
of levels of agreement among readers and institutes (ToRs a,b,c,d,e)
13.00 – 14.30 Lunch break
14.30 – 16.00
On-screen discussion of relevant otolith readings from the WKARMAC2
calibration exercise; Identification of persistent problems and difficulties
in age estimation of mackerel otoliths (ToR c)
16.00 – 16.15 Coffee break

42 | ICES WKARMAC2 REPORT 2018
16.15 – 17.30
On-screen discussion of relevant otolith readings from the WKARMAC2
calibration exercise; Identification of persistent problems and difficulties
in age estimation of mackerel otoliths (ToR c); Creation of a reference col-
lection (ToR d)
Friday, October 26th, 2018
09.00 – 11.00 Creation of a reference collection (ToR d) / Recommendations based on
the Workshop results
11.00 – 11.15 Coffee break
11.15 – 13.00 Recommendations based on the Workshop results / Planning of future
activities for enhancing quality in mackerel age determination
13.00 End of meeting
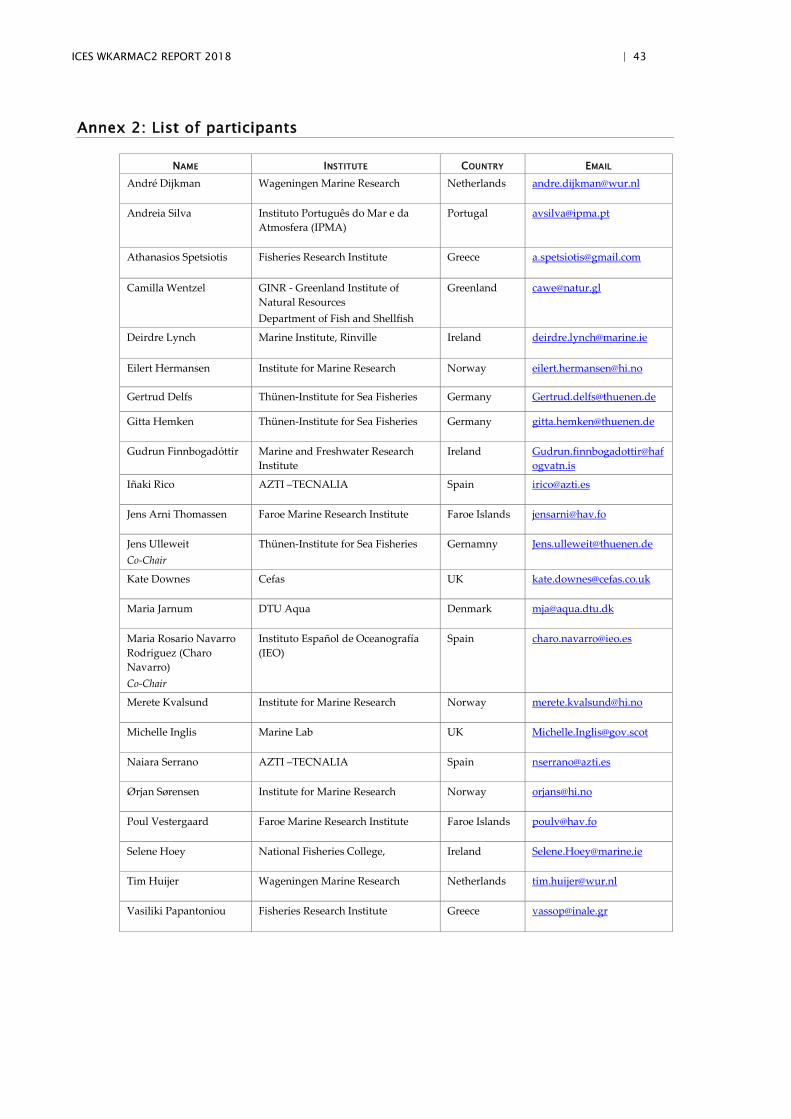
ICES WKARMAC2 REPORT 2018 | 43
Annex 2: List of participants
NAME INSTITUTE COUNTRY EMAIL
André Dijkman Wageningen Marine Research Netherlands [email protected]
Andreia Silva Instituto Português do Mar e da
Atmosfera (IPMA)
Portugal [email protected]
Athanasios Spetsiotis Fisheries Research Institute Greece [email protected]
Camilla Wentzel
GINR - Greenland Institute of
Natural Resources
Department of Fish and Shellfish
Greenland [email protected]
Deirdre Lynch Marine Institute, Rinville Ireland [email protected]
Eilert Hermansen Institute for Marine Research Norway [email protected]
Gertrud Delfs Thünen-Institute for Sea Fisheries Germany [email protected]
Gitta Hemken Thünen-Institute for Sea Fisheries Germany [email protected]
Gudrun Finnbogadóttir Marine and Freshwater Research
Institute
Ireland Gudrun.finnbogadottir@haf
ogvatn.is
Iñaki Rico AZTI –TECNALIA Spain [email protected]
Jens Arni Thomassen Faroe Marine Research Institute Faroe Islands [email protected]
Jens Ulleweit
Co-Chair
Thünen-Institute for Sea Fisheries Gernamny [email protected]
Kate Downes Cefas UK [email protected]
Maria Jarnum DTU Aqua Denmark [email protected]
Maria Rosario Navarro
Rodriguez (Charo
Navarro)
Co-Chair
Instituto Español de Oceanografía
(IEO)
Spain [email protected]
Merete Kvalsund Institute for Marine Research Norway [email protected]
Michelle Inglis Marine Lab UK [email protected]
Naiara Serrano AZTI –TECNALIA Spain [email protected]
Ørjan Sørensen Institute for Marine Research Norway [email protected]
Poul Vestergaard Faroe Marine Research Institute Faroe Islands [email protected]
Selene Hoey National Fisheries College, Ireland [email protected]
Tim Huijer Wageningen Marine Research Netherlands [email protected]
Vasiliki Papantoniou Fisheries Research Institute Greece [email protected]
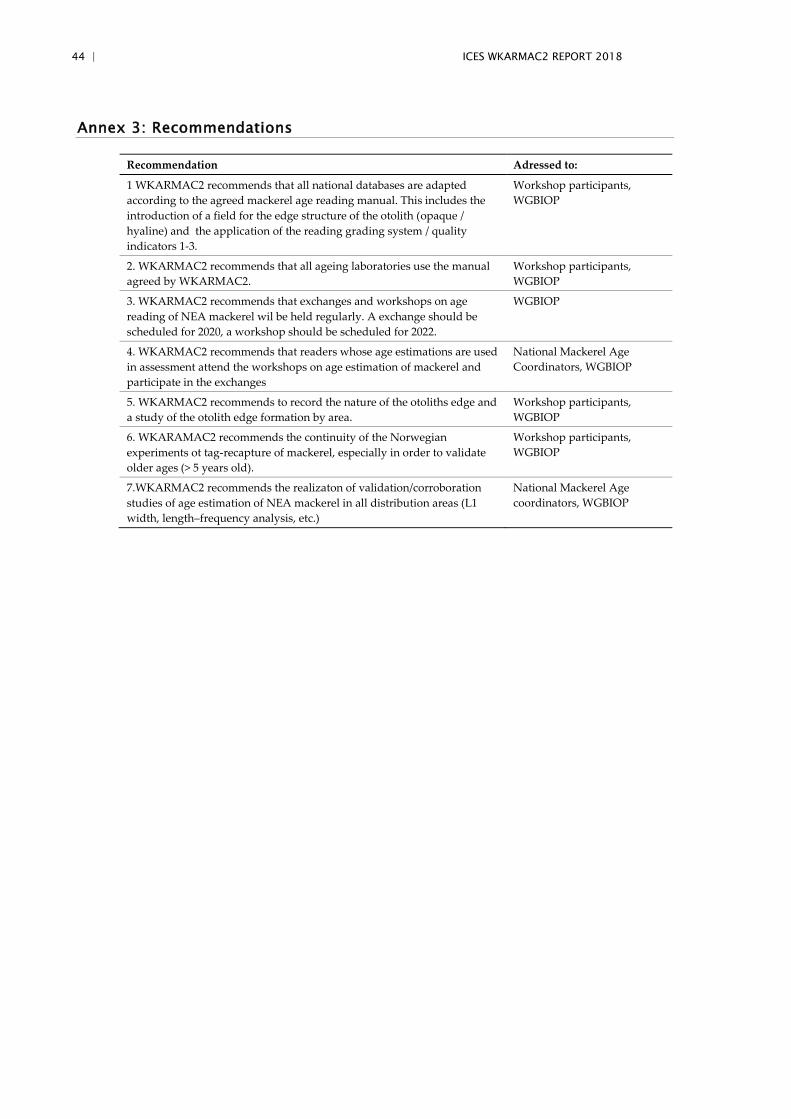
44 | ICES WKARMAC2 REPORT 2018
Annex 3: Recommendations
Recommendation Adressed to: 1 WKARMAC2 recommends that all national databases are adapted
according to the agreed mackerel age reading manual. This includes the
introduction of a field for the edge structure of the otolith (opaque /
hyaline) and the application of the reading grading system / quality
indicators 1-3.
Workshop participants,
WGBIOP
2. WKARMAC2 recommends that all ageing laboratories use the manual
agreed by WKARMAC2.
Workshop participants,
WGBIOP
3. WKARMAC2 recommends that exchanges and workshops on age
reading of NEA mackerel wil be held regularly. A exchange should be
scheduled for 2020, a workshop should be scheduled for 2022.
WGBIOP
4. WKARMAC2 recommends that readers whose age estimations are used
in assessment attend the workshops on age estimation of mackerel and
participate in the exchanges
National Mackerel Age
Coordinators, WGBIOP
5. WKARMAC2 recommends to record the nature of the otoliths edge and
a study of the otolith edge formation by area.
Workshop participants,
WGBIOP
6. WKARAMAC2 recommends the continuity of the Norwegian
experiments ot tag-recapture of mackerel, especially in order to validate
older ages (> 5 years old).
Workshop participants,
WGBIOP
7.WKARMAC2 recommends the realizaton of validation/corroboration
studies of age estimation of NEA mackerel in all distribution areas (L1
width, length–frequency analysis, etc.)
National Mackerel Age
coordinators, WGBIOP
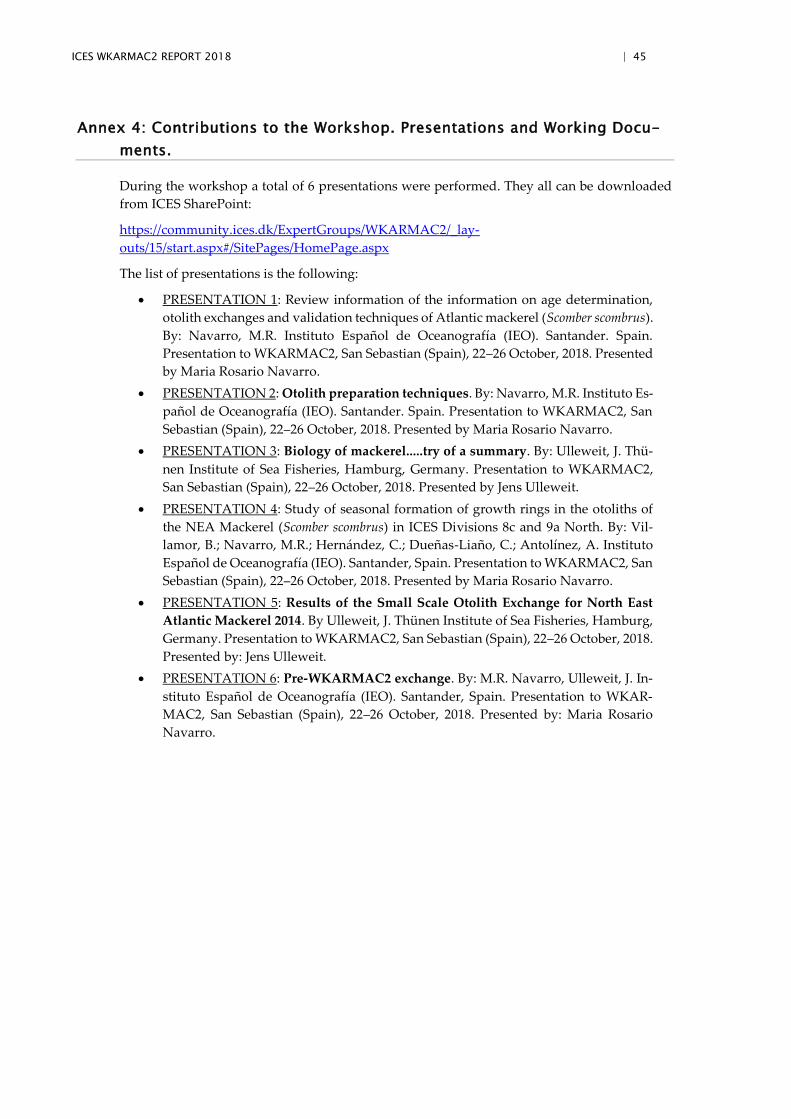
ICES WKARMAC2 REPORT 2018 | 45
Annex 4: Contributions to the Workshop. Presentations and Working Docu-
ments.
During the workshop a total of 6 presentations were performed. They all can be downloaded
from ICES SharePoint:
https://community.ices.dk/ExpertGroups/WKARMAC2/_lay-
outs/15/start.aspx#/SitePages/HomePage.aspx
The list of presentations is the following:
PRESENTATION 1: Review information of the information on age determination,
otolith exchanges and validation techniques of Atlantic mackerel (Scomber scombrus).
By: Navarro, M.R. Instituto Español de Oceanografía (IEO). Santander. Spain.
Presentation to WKARMAC2, San Sebastian (Spain), 22–26 October, 2018. Presented
by Maria Rosario Navarro.
PRESENTATION 2: Otolith preparation techniques. By: Navarro, M.R. Instituto Es-
pañol de Oceanografía (IEO). Santander. Spain. Presentation to WKARMAC2, San
Sebastian (Spain), 22–26 October, 2018. Presented by Maria Rosario Navarro.
PRESENTATION 3: Biology of mackerel.....try of a summary. By: Ulleweit, J. Thü-
nen Institute of Sea Fisheries, Hamburg, Germany. Presentation to WKARMAC2,
San Sebastian (Spain), 22–26 October, 2018. Presented by Jens Ulleweit.
PRESENTATION 4: Study of seasonal formation of growth rings in the otoliths of
the NEA Mackerel (Scomber scombrus) in ICES Divisions 8c and 9a North. By: Vil-
lamor, B.; Navarro, M.R.; Hernández, C.; Dueñas-Liaño, C.; Antolínez, A. Instituto
Español de Oceanografía (IEO). Santander, Spain. Presentation to WKARMAC2, San
Sebastian (Spain), 22–26 October, 2018. Presented by Maria Rosario Navarro.
PRESENTATION 5: Results of the Small Scale Otolith Exchange for North East
Atlantic Mackerel 2014. By Ulleweit, J. Thünen Institute of Sea Fisheries, Hamburg,
Germany. Presentation to WKARMAC2, San Sebastian (Spain), 22–26 October, 2018.
Presented by: Jens Ulleweit.
PRESENTATION 6: Pre-WKARMAC2 exchange. By: M.R. Navarro, Ulleweit, J. In-
stituto Español de Oceanografía (IEO). Santander, Spain. Presentation to WKAR-
MAC2, San Sebastian (Spain), 22–26 October, 2018. Presented by: Maria Rosario
Navarro.
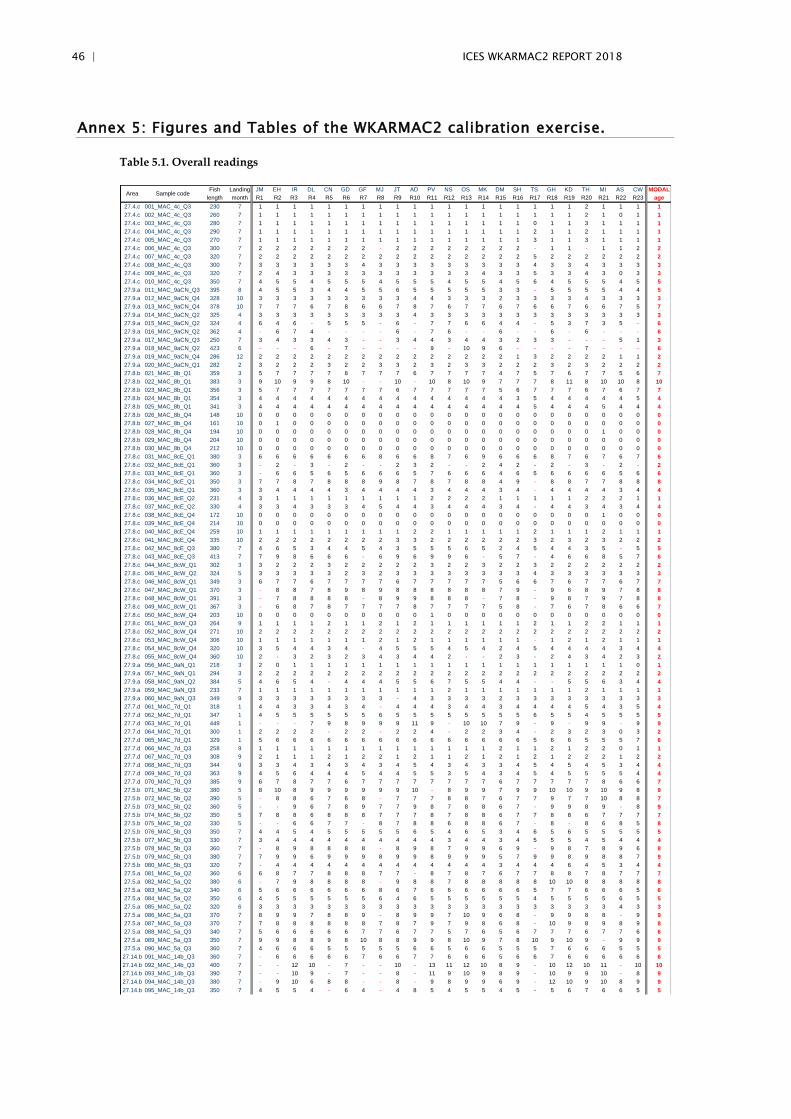
46 | ICES WKARMAC2 REPORT 2018
Annex 5: Figures and Tables of the WKARMAC2 calibration exercise.
Table 5.1. Overall readings
Fish Landing JM EH IR DL CN GD GF MJ JT AD PV NS OS MK DM SH TS GH KD TH MI AS CW MODAL
length month R1 R2 R3 R4 R5 R6 R7 R8 R9 R10 R11 R12 R13 R14 R15 R16 R17 R18 R19 R20 R21 R22 R23 age
27.4.c 001_MAC_4c_Q3 230 7 1 1 1 1 1 1 1 1 1 1 1 1 1 1 1 1 1 1 1 2 1 1 1 1
27.4.c 002_MAC_4c_Q3 260 7 1 1 1 1 1 1 1 1 1 1 1 1 1 1 1 1 1 1 1 2 1 0 1 1
27.4.c 003_MAC_4c_Q3 280 7 1 1 1 1 1 1 1 1 1 1 1 1 1 1 1 1 0 1 1 3 1 1 1 1
27.4.c 004_MAC_4c_Q3 290 7 1 1 1 1 1 1 1 1 1 1 1 1 1 1 1 1 2 1 1 2 1 1 1 1
27.4.c 005_MAC_4c_Q3 270 7 1 1 1 1 1 1 1 1 1 1 1 1 1 1 1 1 3 1 1 3 1 1 1 1
27.4.c 006_MAC_4c_Q3 300 7 2 2 2 2 2 2 2 - 2 2 2 2 2 2 2 2 - 1 1 - 1 1 2 2
27.4.c 007_MAC_4c_Q3 320 7 2 2 2 2 2 2 2 2 2 2 2 2 2 2 2 2 5 2 2 2 2 2 2 2
27.4.c 008_MAC_4c_Q3 300 7 3 3 3 3 3 3 4 3 3 3 3 3 3 3 3 3 4 3 3 4 3 3 3 3
27.4.c 009_MAC_4c_Q3 320 7 2 4 3 3 3 3 3 3 3 3 3 3 3 4 3 3 5 3 3 4 3 0 3 3
27.4.c 010_MAC_4c_Q3 350 7 4 5 5 4 5 5 5 4 5 5 5 4 5 5 4 5 6 4 5 5 5 4 5 5
27.9.a 011_MAC_9aCN_Q3 395 8 4 5 5 3 4 4 5 5 6 5 5 5 5 5 3 3 - 5 5 5 5 4 4 5
27.9.a 012_MAC_9aCN_Q4 328 10 3 3 3 3 3 3 3 3 3 4 4 3 3 3 2 3 3 3 3 4 3 3 3 3
27.9.a 013_MAC_9aCN_Q4 378 10 7 7 7 6 7 8 6 6 7 8 7 6 7 7 6 7 6 6 7 6 6 7 5 7
27.9.a 014_MAC_9aCN_Q2 325 4 3 3 3 3 3 3 3 3 3 4 3 3 3 3 3 3 3 3 3 3 3 3 3 3
27.9.a 015_MAC_9aCN_Q2 324 4 6 4 6 - 5 5 5 - 6 - 7 7 6 6 4 4 - 5 3 7 3 5 - 6
27.9.a 016_MAC_9aCN_Q2 362 4 - 6 7 4 - - - - 6 - 7 6 - - 6 - - 6 - 6 - - - 6
27.9.a 017_MAC_9aCN_Q3 250 7 3 4 3 3 4 3 - - 3 4 4 3 4 4 3 2 3 3 - - - 5 1 3
27.9.a 018_MAC_9aCN_Q2 423 6 - - - 6 - 7 - - - - 9 - 10 9 6 - - - - 7 - - - 6
27.9.a 019_MAC_9aCN_Q4 286 12 2 2 2 2 2 2 2 2 2 2 2 2 2 2 2 1 3 2 2 2 2 1 1 2
27.9.a 020_MAC_9aCN_Q1 282 2 3 2 2 2 3 2 2 3 3 2 3 2 3 3 2 2 2 3 2 3 2 2 2 2
27.8.b 021_MAC_8b_Q1 359 3 5 7 7 7 7 8 7 7 7 6 7 7 7 7 4 7 5 7 6 7 7 5 6 7
27.8.b 022_MAC_8b_Q1 383 3 9 10 9 9 8 10 - - 10 - 10 8 10 9 7 7 7 8 11 8 10 10 8 10
27.8.b 023_MAC_8b_Q1 356 3 5 7 7 7 7 7 7 7 6 7 7 7 7 7 5 6 7 7 7 6 7 6 7 7
27.8.b 024_MAC_8b_Q1 354 3 4 4 4 4 4 4 4 4 4 4 4 4 4 4 4 3 5 4 4 4 4 4 5 4
27.8.b 025_MAC_8b_Q1 341 3 4 4 4 4 4 4 4 4 4 4 4 4 4 4 4 4 5 4 4 4 5 4 4 4
27.8.b 026_MAC_8b_Q4 148 10 0 0 0 0 0 0 0 0 0 0 0 0 0 0 0 0 0 0 0 0 0 0 0 0
27.8.b 027_MAC_8b_Q4 161 10 0 1 0 0 0 0 0 0 0 0 0 0 0 0 0 0 0 0 0 0 0 0 0 0
27.8.b 028_MAC_8b_Q4 194 10 0 0 0 0 0 0 0 0 0 0 0 0 0 0 0 0 0 0 0 0 1 0 0 0
27.8.b 029_MAC_8b_Q4 204 10 0 0 0 0 0 0 0 0 0 0 0 0 0 0 0 0 0 0 0 0 0 0 0 0
27.8.b 030_MAC_8b_Q4 212 10 0 0 0 0 0 0 0 0 0 0 0 0 0 0 0 0 0 0 0 0 0 0 0 0
27.8.c 031_MAC_8cE_Q1 380 3 6 6 6 6 6 6 6 8 6 6 8 7 6 9 6 6 6 8 7 6 7 6 7 6
27.8.c 032_MAC_8cE_Q1 360 3 - 2 - 3 - 2 - - 2 3 2 - - 2 4 2 - 2 - 3 - 2 - 2
27.8.c 033_MAC_8cE_Q1 360 3 - 6 6 5 6 5 6 6 6 5 7 6 6 6 4 6 5 6 6 6 6 5 6 6
27.8.c 034_MAC_8cE_Q1 350 3 7 7 8 7 8 8 8 9 8 7 8 7 8 8 4 9 - 8 8 7 7 8 8 8
27.8.c 035_MAC_8cE_Q1 360 3 3 4 4 4 4 3 4 4 4 4 3 4 4 4 3 4 - 4 4 4 4 3 4 4
27.8.c 036_MAC_8cE_Q2 231 4 3 1 1 1 1 1 1 1 1 1 2 2 2 2 1 1 1 1 1 2 2 2 1 1
27.8.c 037_MAC_8cE_Q2 330 4 3 3 4 3 3 3 4 5 4 4 3 4 4 4 3 4 - 4 4 3 4 3 4 4
27.8.c 038_MAC_8cE_Q4 172 10 0 0 0 0 0 0 0 0 0 0 0 0 0 0 0 0 0 0 0 0 1 0 0 0
27.8.c 039_MAC_8cE_Q4 214 10 0 0 0 0 0 0 0 0 0 0 0 0 0 0 0 0 0 0 0 0 0 0 0 0
27.8.c 040_MAC_8cE_Q4 259 10 1 1 1 1 1 1 1 1 1 2 2 1 1 1 1 1 2 1 1 1 2 1 1 1
27.8.c 041_MAC_8cE_Q4 335 10 2 2 2 2 2 2 2 2 3 3 2 2 2 2 2 2 3 2 3 2 3 2 2 2
27.8.c 042_MAC_8cE_Q3 380 7 4 6 5 3 4 4 5 4 3 5 5 5 6 5 2 4 5 4 4 3 5 - 5 5
27.8.c 043_MAC_8cE_Q3 413 7 7 9 8 6 6 6 - 6 9 6 9 9 6 - 5 7 - 4 6 6 8 5 7 6
27.8.c 044_MAC_8cW_Q1 302 3 3 2 2 2 3 2 2 2 2 2 3 2 2 3 2 2 3 2 2 2 2 2 2 2
27.8.c 045_MAC_8cW_Q2 324 5 3 3 3 3 3 2 3 2 3 3 3 3 3 3 3 3 4 3 3 3 3 3 3 3
27.8.c 046_MAC_8cW_Q1 349 3 6 7 7 6 7 7 7 7 6 7 7 7 7 7 5 6 6 7 6 7 7 6 7 7
27.8.c 047_MAC_8cW_Q1 370 3 - 8 8 7 8 9 8 9 8 8 8 8 8 8 7 9 - 9 6 8 9 7 8 8
27.8.c 048_MAC_8cW_Q1 391 3 - 7 8 8 8 8 - 8 9 9 8 8 8 - 7 8 - 9 8 7 9 7 8 8
27.8.c 049_MAC_8cW_Q1 367 3 - 6 8 7 8 7 7 7 7 8 7 7 7 7 5 8 - 7 6 7 8 6 6 7
27.8.c 050_MAC_8cW_Q4 203 10 0 0 0 0 0 0 0 0 0 0 1 0 0 0 0 0 0 0 0 0 0 0 0 0
27.8.c 051_MAC_8cW_Q3 264 9 1 1 1 1 2 1 1 2 1 2 1 1 1 1 1 1 2 1 1 2 2 1 1 1
27.8.c 052_MAC_8cW_Q4 271 10 2 2 2 2 2 2 2 2 2 2 2 2 2 2 2 2 2 2 2 2 2 2 2 2
27.8.c 053_MAC_8cW_Q4 306 10 1 1 1 1 1 1 1 2 1 2 1 1 1 1 1 1 - 1 2 1 2 1 1 1
27.8.c 054_MAC_8cW_Q4 320 10 3 5 4 4 3 4 - 4 5 5 5 4 5 4 2 4 5 4 4 4 4 3 4 4
27.8.c 055_MAC_8cW_Q4 360 10 2 - 3 2 3 2 3 4 3 4 4 2 - - 2 3 - 2 4 3 4 2 3 2
27.9.a 056_MAC_9aN_Q1 218 3 2 0 1 1 1 1 1 1 1 1 1 1 1 1 1 1 1 1 1 1 1 1 0 1
27.9.a 057_MAC_9aN_Q1 294 3 2 2 2 2 2 2 2 2 2 2 2 2 2 2 2 2 2 2 2 2 2 2 2 2
27.9.a 058_MAC_9aN_Q2 384 5 4 6 5 4 - 4 4 4 5 5 6 7 5 5 4 4 - - 5 5 6 3 4 4
27.9.a 059_MAC_9aN_Q3 233 7 1 1 1 1 1 1 1 1 1 1 1 2 1 1 1 1 1 1 1 2 1 1 1 1
27.9.a 060_MAC_9aN_Q3 349 9 3 3 3 3 3 3 3 3 - 4 3 3 3 3 2 3 3 3 3 3 3 3 3 3
27.7.d 061_MAC_7d_Q1 318 1 4 4 3 3 4 3 4 - 4 4 4 3 4 4 3 4 4 4 4 5 4 3 5 4
27.7.d 062_MAC_7d_Q1 347 1 4 5 5 5 5 5 5 6 5 5 5 5 5 5 5 5 6 5 5 4 5 5 5 5
27.7.d 063_MAC_7d_Q1 449 1 - - - 7 9 8 9 9 9 11 9 - 10 10 7 9 - 9 - 9 9 - 9 9
27.7.d 064_MAC_7d_Q1 300 1 2 2 2 2 - 2 2 - 2 2 4 - 2 2 3 4 - 2 3 2 3 0 3 2
27.7.d 065_MAC_7d_Q1 329 1 5 6 6 6 6 6 6 6 6 6 6 6 6 6 6 6 5 6 6 5 5 5 7 6
27.7.d 066_MAC_7d_Q3 258 9 1 1 1 1 1 1 1 1 1 1 1 1 1 1 2 1 1 2 1 2 2 0 1 1
27.7.d 067_MAC_7d_Q3 308 9 2 1 1 1 2 1 2 2 1 2 1 1 2 1 2 1 2 1 2 2 2 1 2 2
27.7.d 068_MAC_7d_Q3 344 9 3 3 4 3 4 3 4 3 4 5 4 3 4 3 3 4 5 4 5 4 5 3 4 4
27.7.d 069_MAC_7d_Q3 363 9 4 5 6 4 4 4 5 4 4 5 5 3 5 4 3 4 5 4 5 5 5 5 4 4
27.7.d 070_MAC_7d_Q3 385 9 6 7 8 7 7 6 7 7 7 7 7 7 7 7 6 7 7 7 7 7 8 6 6 7
27.5.b 071_MAC_5b_Q2 380 5 8 10 8 9 9 9 9 9 9 10 - 8 9 9 7 9 9 10 10 9 10 9 8 9
27.5.b 072_MAC_5b_Q2 390 5 - 8 8 6 7 6 8 - 7 7 7 8 8 7 6 7 7 9 7 7 10 8 8 7
27.5.b 073_MAC_5b_Q2 360 5 - - 9 6 7 8 9 7 7 9 8 7 8 8 6 7 - 9 9 8 9 - 8 9
27.5.b 074_MAC_5b_Q2 350 5 7 8 8 6 8 8 8 7 7 7 8 7 8 8 6 7 7 8 8 6 7 7 7 7
27.5.b 075_MAC_5b_Q2 330 5 - - 6 6 7 7 - 8 7 8 8 6 8 8 6 7 - 8 - 8 6 8 5 8
27.5.b 076_MAC_5b_Q3 350 7 4 4 5 4 5 5 5 5 5 6 5 4 6 5 3 4 6 5 6 5 5 5 5 5
27.5.b 077_MAC_5b_Q3 330 7 3 4 4 4 4 4 4 4 4 4 4 3 4 4 3 4 5 5 5 4 5 4 4 4
27.5.b 078_MAC_5b_Q3 360 7 - 8 9 8 8 8 8 - 8 9 8 7 9 9 6 9 - 9 8 7 8 9 6 8
27.5.b 079_MAC_5b_Q3 380 7 7 9 9 6 9 9 9 8 9 9 8 9 9 9 5 7 9 9 8 9 8 8 7 9
27.5.b 080_MAC_5b_Q3 320 7 - 4 4 4 4 4 4 4 4 4 4 4 4 4 3 4 4 4 6 4 5 3 4 4
27.5.a 081_MAC_5a_Q2 360 6 6 8 7 7 8 8 8 7 7 - 8 7 8 7 6 7 7 8 8 7 8 7 7 7
27.5.a 082_MAC_5a_Q2 380 6 - 7 9 8 8 8 8 - 9 8 8 7 8 8 8 8 8 10 10 8 8 8 8 8
27.5.a 083_MAC_5a_Q2 340 6 5 6 6 6 6 6 6 8 6 7 6 6 6 6 6 6 5 7 7 6 6 6 5 6
27.5.a 084_MAC_5a_Q2 350 6 4 5 5 5 5 5 5 6 4 6 5 5 5 5 5 5 4 5 5 5 5 6 5 5
27.5.a 085_MAC_5a_Q2 320 6 3 3 3 3 3 3 3 3 3 3 3 3 3 3 3 3 3 3 3 3 3 4 3 3
27.5.a 086_MAC_5a_Q3 370 7 8 9 9 7 8 8 9 - 8 9 9 7 10 9 6 8 - 9 9 8 8 - 9 9
27.5.a 087_MAC_5a_Q3 370 7 7 8 8 8 8 8 8 7 8 7 9 7 9 8 6 8 - 10 9 8 9 8 9 8
27.5.a 088_MAC_5a_Q3 340 7 5 6 6 6 6 6 7 7 6 7 7 5 7 6 5 6 7 7 7 6 7 7 6 6
27.5.a 089_MAC_5a_Q3 350 7 9 9 8 8 9 8 10 8 8 9 9 8 10 9 7 8 10 9 10 9 - 9 9 9
27.5.a 090_MAC_5a_Q3 360 7 4 6 6 6 5 5 5 5 5 6 6 5 6 6 5 5 5 7 6 6 6 5 5 5
27.14.b 091_MAC_14b_Q3 360 7 - 6 6 6 6 6 7 6 6 7 7 6 6 6 5 6 6 7 6 6 6 6 6 6
27.14.b 092_MAC_14b_Q3 400 7 - - 12 10 - 7 - - 10 - 13 11 12 10 8 9 - 10 12 10 11 - 10 10
27.14.b 093_MAC_14b_Q3 390 7 - - 10 9 - 7 - - 8 - 11 9 10 9 8 9 - 10 9 9 10 - 8 9
27.14.b 094_MAC_14b_Q3 380 7 - 9 10 6 8 8 - - 8 - 9 8 9 9 6 9 - 12 10 9 10 8 9 9
27.14.b 095_MAC_14b_Q3 350 7 4 5 5 4 - 6 4 - 4 8 5 4 5 5 4 5 - 5 6 7 6 6 5 5
Area Sample code
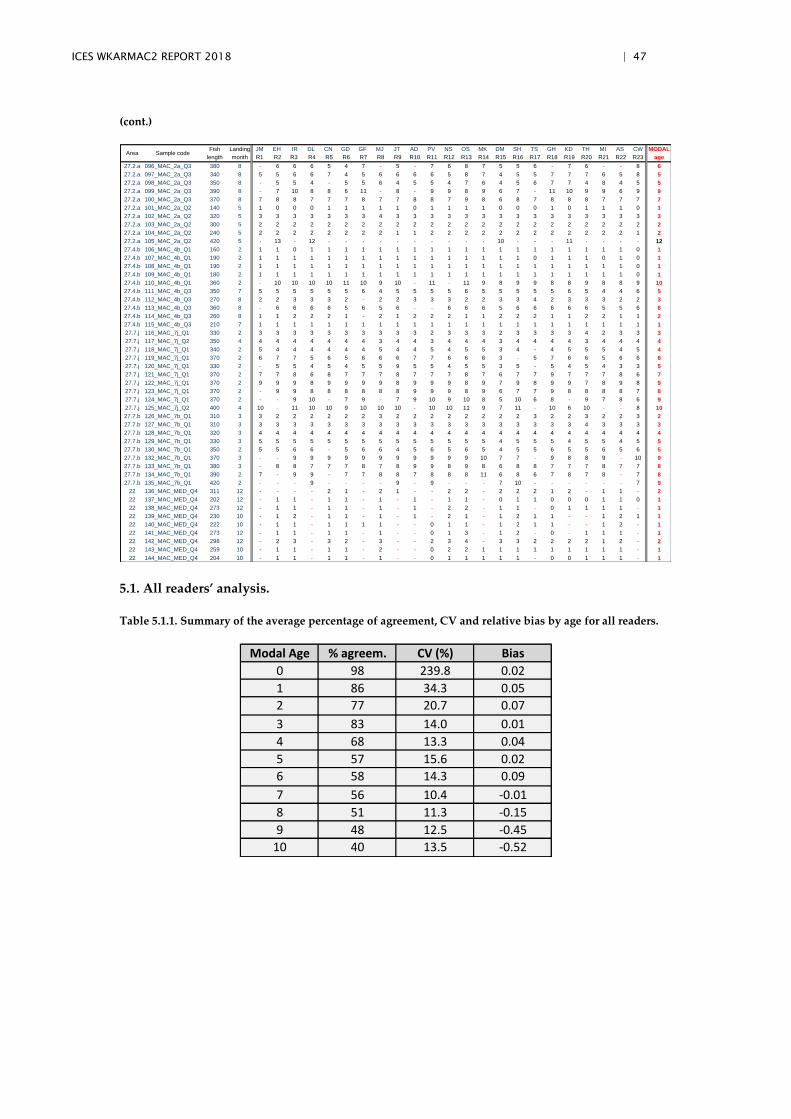
ICES WKARMAC2 REPORT 2018 | 47
(cont.)
5.1. All readers’ analysis.
Table 5.1.1. Summary of the average percentage of agreement, CV and relative bias by age for all readers.
Fish Landing JM EH IR DL CN GD GF MJ JT AD PV NS OS MK DM SH TS GH KD TH MI AS CW MODAL
length month R1 R2 R3 R4 R5 R6 R7 R8 R9 R10 R11 R12 R13 R14 R15 R16 R17 R18 R19 R20 R21 R22 R23 age
27.2.a 096_MAC_2a_Q3 380 8 - 6 6 6 5 4 7 - 5 - 7 6 8 7 5 5 6 - 7 6 - - 8 6
27.2.a 097_MAC_2a_Q3 340 8 5 5 6 6 7 4 5 6 6 6 6 5 8 7 4 5 5 7 7 7 6 5 8 5
27.2.a 098_MAC_2a_Q3 350 8 - 5 5 4 - 5 5 6 4 5 5 4 7 6 4 5 6 7 7 4 8 4 5 5
27.2.a 099_MAC_2a_Q3 390 8 - 7 10 8 8 6 11 - 8 - 9 9 8 9 6 7 - 11 10 9 9 6 9 9
27.2.a 100_MAC_2a_Q3 370 8 7 8 8 7 7 7 8 7 7 8 8 7 9 8 6 8 7 8 8 8 7 7 7 7
27.2.a 101_MAC_2a_Q2 140 5 1 0 0 0 1 1 1 1 1 0 1 1 1 1 0 0 0 1 0 1 1 1 0 1
27.2.a 102_MAC_2a_Q2 320 5 3 3 3 3 3 3 3 4 3 3 3 3 3 3 3 3 3 3 3 3 3 3 3 3
27.2.a 103_MAC_2a_Q2 300 5 2 2 2 2 2 2 2 2 2 2 2 2 2 2 2 2 2 2 2 2 2 2 2 2
27.2.a 104_MAC_2a_Q2 240 5 2 2 2 2 2 2 2 2 1 1 2 2 2 2 2 2 2 2 2 2 2 2 1 2
27.2.a 105_MAC_2a_Q2 420 5 - 13 - 12 - - - - - - - - - - 10 - - - 11 - - - - 12
27.4.b 106_MAC_4b_Q1 160 2 1 1 0 1 1 1 1 1 1 1 1 1 1 1 1 1 1 1 1 1 1 1 0 1
27.4.b 107_MAC_4b_Q1 190 2 1 1 1 1 1 1 1 1 1 1 1 1 1 1 1 1 0 1 1 1 0 1 0 1
27.4.b 108_MAC_4b_Q1 190 2 1 1 1 1 1 1 1 1 1 1 1 1 1 1 1 1 1 1 1 1 1 1 0 1
27.4.b 109_MAC_4b_Q1 180 2 1 1 1 1 1 1 1 1 1 1 1 1 1 1 1 1 1 1 1 1 1 1 0 1
27.4.b 110_MAC_4b_Q1 360 2 - 10 10 10 10 11 10 9 10 - 11 - 11 9 8 9 9 8 8 9 8 8 9 10
27.4.b 111_MAC_4b_Q3 350 7 5 5 5 5 5 5 6 4 5 5 5 5 6 5 5 5 5 5 6 5 4 4 6 5
27.4.b 112_MAC_4b_Q3 270 8 2 2 3 3 3 2 - 2 2 3 3 3 2 2 3 3 4 2 3 3 3 2 2 3
27.4.b 113_MAC_4b_Q3 360 8 - 6 6 6 6 5 6 5 6 - - 6 6 6 5 6 6 6 6 6 5 5 6 6
27.4.b 114_MAC_4b_Q3 260 8 1 1 2 2 2 1 - 2 1 2 2 2 1 1 2 2 2 1 1 2 2 1 1 2
27.4.b 115_MAC_4b_Q3 210 7 1 1 1 1 1 1 1 1 1 1 1 1 1 1 1 1 1 1 1 1 1 1 1 1
27.7.j 116_MAC_7j_Q1 330 2 3 3 3 3 3 3 3 3 3 3 2 3 3 3 2 3 3 3 3 4 2 3 3 3
27.7.j 117_MAC_7j_Q2 350 4 4 4 4 4 4 4 4 3 4 4 3 4 4 4 3 4 4 4 4 3 4 4 4 4
27.7.j 118_MAC_7j_Q1 340 2 5 4 4 4 4 4 4 5 4 4 5 4 5 5 3 4 - 4 5 5 5 4 5 4
27.7.j 119_MAC_7j_Q1 370 2 6 7 7 5 6 5 6 6 6 7 7 6 6 6 3 - 5 7 6 6 5 6 6 6
27.7.j 120_MAC_7j_Q1 330 2 - 5 5 4 5 4 5 5 9 5 5 4 5 5 3 5 - 5 4 5 4 3 3 5
27.7.j 121_MAC_7j_Q1 370 2 7 7 8 6 8 7 7 7 8 7 7 7 8 7 6 7 7 9 7 7 7 8 6 7
27.7.j 122_MAC_7j_Q1 370 2 9 9 9 8 9 9 9 9 8 9 9 9 8 9 7 9 8 9 9 7 8 9 8 9
27.7.j 123_MAC_7j_Q1 370 2 - 9 9 8 8 8 8 8 8 9 9 9 8 9 6 7 7 9 8 8 8 8 7 8
27.7.j 124_MAC_7j_Q1 370 2 - - 9 10 - 7 9 - 7 9 10 9 10 8 5 10 6 8 - 9 7 8 6 9
27.7.j 125_MAC_7j_Q2 400 4 10 - 11 10 10 9 10 10 10 - 10 10 11 9 7 11 - 10 6 10 - - 8 10
27.7.b 126_MAC_7b_Q1 310 3 3 2 2 2 2 2 2 3 2 2 2 2 2 2 2 2 3 2 2 3 2 2 3 2
27.7.b 127_MAC_7b_Q1 310 3 3 3 3 3 3 3 3 3 3 3 3 3 3 3 3 3 3 3 3 4 3 3 3 3
27.7.b 128_MAC_7b_Q1 320 3 4 4 4 4 4 4 4 4 4 4 4 4 4 4 4 4 4 4 4 4 4 4 4 4
27.7.b 129_MAC_7b_Q1 330 3 5 5 5 5 5 5 5 5 5 5 5 5 5 5 4 5 5 5 4 5 5 4 5 5
27.7.b 130_MAC_7b_Q1 350 2 5 5 6 6 - 5 6 6 4 5 6 5 6 5 4 5 5 6 5 5 6 5 6 5
27.7.b 132_MAC_7b_Q1 370 3 - - 9 9 9 9 9 9 9 9 9 9 9 10 7 7 - 9 8 8 9 - 10 9
27.7.b 133_MAC_7b_Q1 380 3 - 8 8 7 7 7 8 7 8 9 9 8 9 8 6 8 8 7 7 7 8 7 7 8
27.7.b 134_MAC_7b_Q1 390 2 7 - 9 9 - 7 7 8 8 7 8 8 8 11 6 8 6 7 8 7 8 - 7 8
27.7.b 135_MAC_7b_Q1 420 2 - - - 9 - - - - 9 - 9 - - - 7 10 - - - - - - 7 9
22 136_MAC_MED_Q4 311 12 - - - - 2 1 - 2 1 - - 2 2 - 2 2 2 1 2 - 1 1 - 2
22 137_MAC_MED_Q4 202 12 - 1 1 - 1 1 - 1 - 1 - 1 1 - 0 1 1 0 0 0 1 1 0 1
22 138_MAC_MED_Q4 273 12 - 1 1 - 1 1 - 1 - 1 - 2 2 - 1 1 - 0 1 1 1 1 - 1
22 139_MAC_MED_Q4 230 10 - 1 2 - 1 1 - 1 - 1 - 2 1 - 1 2 1 1 - - 1 2 1 1
22 140_MAC_MED_Q4 222 10 - 1 1 - 1 1 1 1 - - 0 1 1 - 1 2 1 1 - - 1 2 - 1
22 141_MAC_MED_Q4 273 12 - 1 1 - 1 1 - 1 - - 0 1 3 - 1 2 - 0 - 1 1 1 - 1
22 142_MAC_MED_Q4 298 12 - 2 3 - 3 2 - 3 - - 2 3 4 - 3 3 2 2 2 2 1 2 - 2
22 143_MAC_MED_Q4 259 10 - 1 1 - 1 1 - 2 - - 0 2 2 1 1 1 1 1 1 1 1 1 - 1
22 144_MAC_MED_Q4 204 10 - 1 1 - 1 1 - 1 - - 0 1 1 1 1 1 - 0 0 1 1 1 - 1
Area Sample code
Modal Age % agreem. CV (%) Bias
0 98 239.8 0.02
1 86 34.3 0.05
2 77 20.7 0.07
3 83 14.0 0.01
4 68 13.3 0.04
5 57 15.6 0.02
6 58 14.3 0.09
7 56 10.4 -0.01
8 51 11.3 -0.15
9 48 12.5 -0.45
10 40 13.5 -0.52
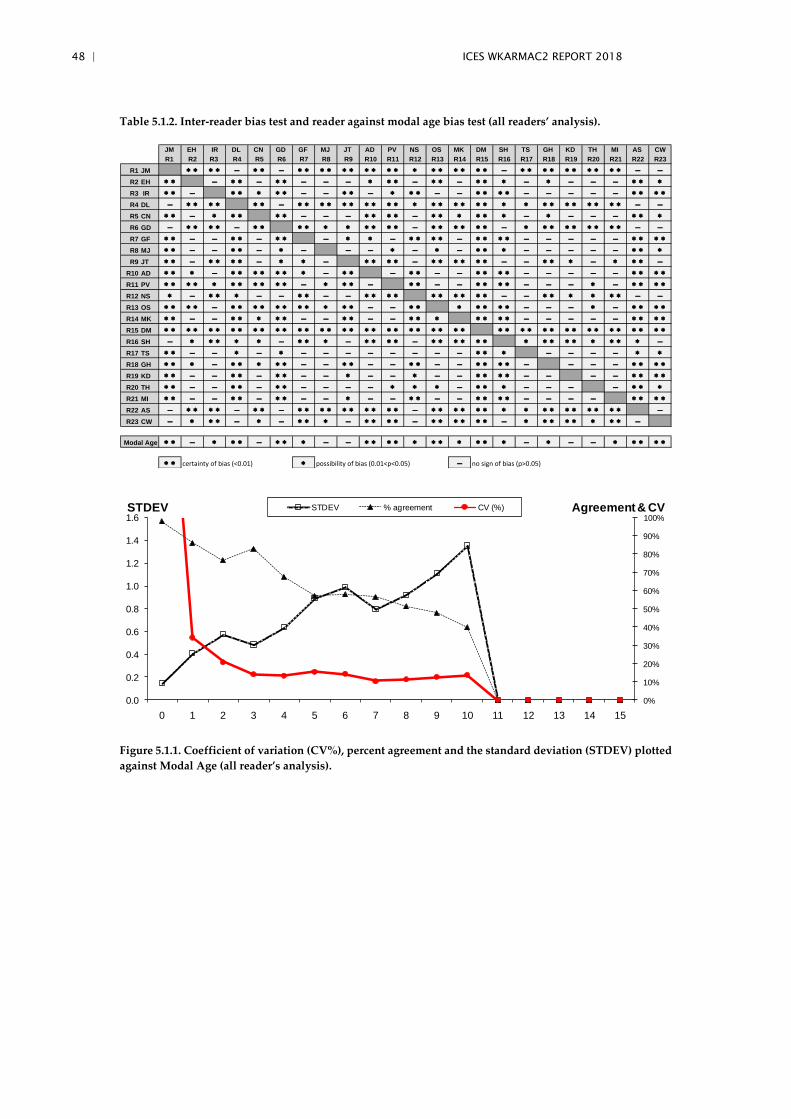
48 | ICES WKARMAC2 REPORT 2018
Table 5.1.2. Inter-reader bias test and reader against modal age bias test (all readers’ analysis).
Figure 5.1.1. Coefficient of variation (CV%), percent agreement and the standard deviation (STDEV) plotted
against Modal Age (all reader’s analysis).
JM EH IR DL CN GD GF MJ JT AD PV NS OS MK DM SH TS GH KD TH MI AS CW
R1 R2 R3 R4 R5 R6 R7 R8 R9 R10 R11 R12 R13 R14 R15 R16 R17 R18 R19 R20 R21 R22 R23
R1 JM * * * * - * * - * * * * * * * * * * * * * * * * * - * * * * * * * * * * - -
R2 EH * * - * * - * * - - - * * * - * * - * * * - * - - - * * *
R3 IR * * - * * * * * - - * * - * * * - - * * * * - - - - - * * * *
R4 DL - * * * * * * - * * * * * * * * * * * * * * * * * * * * * * * * * * * - -
R5 CN * * - * * * * * - - - * * * * - * * * * * * - * - - - * * *
R6 GD - * * * * - * * * * * * * * * * - * * * * * * - * * * * * * * * * - -
R7 GF * * - - * * - * * - * * - * * * * - * * * * - - - - - * * * *
R8 MJ * * - - * * - * - - - * - * - * * * - - - - - * * *
R9 JT * * - * * * * - * * - * * * * - * * * * * * - - * * * - * * * -
R10 AD * * * - * * * * * * * - * * - * * - - * * * * - - - - - * * * *
R11 PV * * * * * * * * * * * - * * * - * * - - * * * * - - - * - * * * *
R12 NS * - * * * - - * * - - * * * * * * * * * * - - * * * * * * - -
R13 OS * * * * - * * * * * * * * * * * - - * * * * * * * - - - * - * * * *
R14 MK * * - - * * * * * - - * * - - * * * * * * * - - - - - * * * *
R15 DM * * * * * * * * * * * * * * * * * * * * * * * * * * * * * * * * * * * * * * * * * * * *
R16 SH - * * * * * - * * * - * * * * - * * * * * * * * * * * * * * * -
R17 TS * * - - * - * - - - - - - - - * * * - - - - * *
R18 GH * * * - * * * * * - - * * - - * * - - * * * * - - - - * * * *
R19 KD * * - - * * - * * - - * - - * - - * * * * - - - - * * * *
R20 TH * * - - * * - * * - - - - * * * - * * * - - - - * * *
R21 MI * * - - * * - * * - - * - - * * - - * * * * - - - - * * * *
R22 AS - * * * * - * * - * * * * * * * * * * - * * * * * * * * * * * * * * * * -
R23 CW - * * * - * - * * * - * * * * - * * * * * * - * * * * * * * * -
* * - * * * - * * * - - * * * * * * * * * * * - * - - * * * * *
* * certainty of bias (<0.01) * possibility of bias (0.01<p<0.05) - no sign of bias (p>0.05)
Modal Age
0%
10%
20%
30%
40%
50%
60%
70%
80%
90%
100%
0.0
0.2
0.4
0.6
0.8
1.0
1.2
1.4
1.6
0 1 2 3 4 5 6 7 8 9 10 11 12 13 14 15
STDEV % agreement CV (%)STDEV Agreement & CV
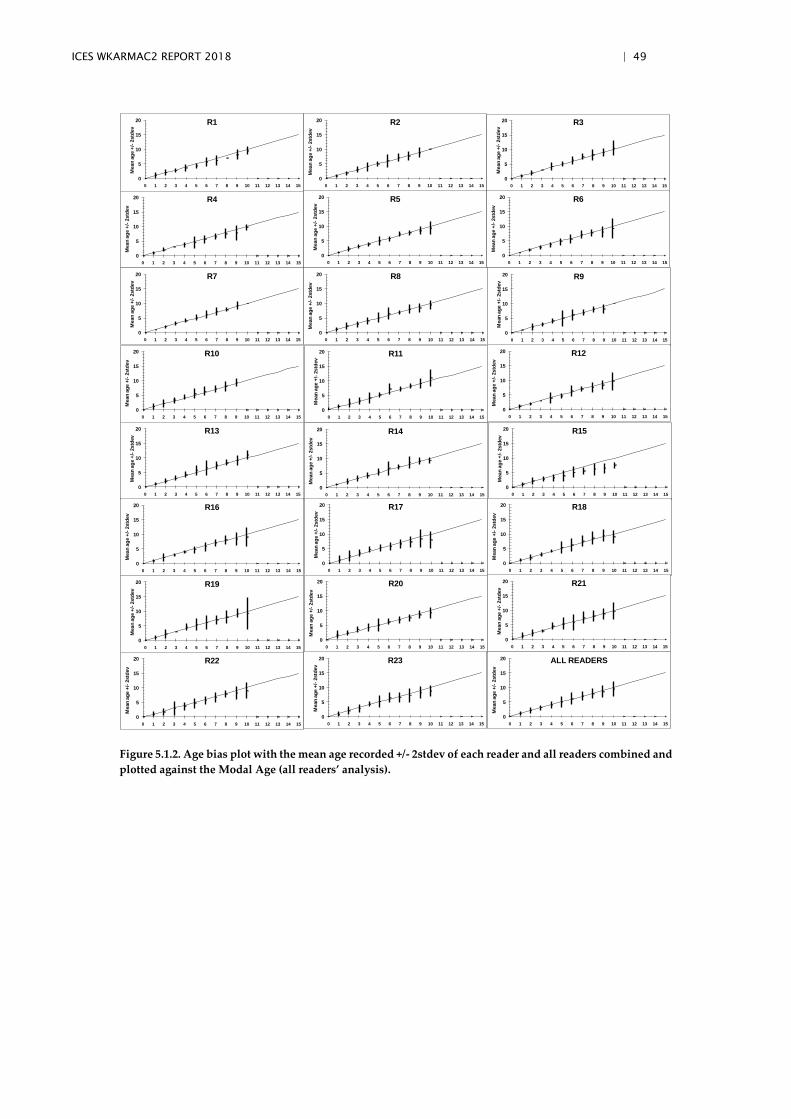
ICES WKARMAC2 REPORT 2018 | 49
Figure 5.1.2. Age bias plot with the mean age recorded +/- 2stdev of each reader and all readers combined and
plotted against the Modal Age (all readers’ analysis).
0
5
10
15
20
0 1 2 3 4 5 6 7 8 9 10 11 12 13 14 15
Mean
ag
e +
/-2std
ev
R1
0
5
10
15
20
0 1 2 3 4 5 6 7 8 9 10 11 12 13 14 15
Mean
ag
e +
/-2std
ev
R2
0
5
10
15
20
0 1 2 3 4 5 6 7 8 9 10 11 12 13 14 15
Mean
ag
e +
/-2std
ev
R3
0
5
10
15
20
0 1 2 3 4 5 6 7 8 9 10 11 12 13 14 15
Mean
ag
e +
/-2std
ev
R4
0
5
10
15
20
0 1 2 3 4 5 6 7 8 9 10 11 12 13 14 15
Mean
ag
e +
/-2std
ev
R5
0
5
10
15
20
0 1 2 3 4 5 6 7 8 9 10 11 12 13 14 15
Mean
ag
e +
/-2std
ev
R6
0
5
10
15
20
0 1 2 3 4 5 6 7 8 9 10 11 12 13 14 15
Mean
ag
e +
/-2std
ev
R7
0
5
10
15
20
0 1 2 3 4 5 6 7 8 9 10 11 12 13 14 15
Mean
ag
e +
/-2std
ev
R8
0
5
10
15
20
0 1 2 3 4 5 6 7 8 9 10 11 12 13 14 15
Mean
ag
e +
/-2std
ev
R9
0
5
10
15
20
0 1 2 3 4 5 6 7 8 9 10 11 12 13 14 15
Mean
ag
e +
/-2std
ev
R10
0
5
10
15
20
0 1 2 3 4 5 6 7 8 9 10 11 12 13 14 15
Mean
ag
e +
/-2std
ev
R11
0
5
10
15
20
0 1 2 3 4 5 6 7 8 9 10 11 12 13 14 15
Mean
ag
e +
/-2std
ev
R12
0
5
10
15
20
0 1 2 3 4 5 6 7 8 9 10 11 12 13 14 15
Mean
ag
e +
/-2std
ev
R13
0
5
10
15
20
0 1 2 3 4 5 6 7 8 9 10 11 12 13 14 15
Mean
ag
e +
/-2std
ev
R14
0
5
10
15
20
0 1 2 3 4 5 6 7 8 9 10 11 12 13 14 15M
ean
ag
e +
/-2std
ev
R15
0
5
10
15
20
0 1 2 3 4 5 6 7 8 9 10 11 12 13 14 15
Mean
ag
e +
/-2std
ev
R16
0
5
10
15
20
0 1 2 3 4 5 6 7 8 9 10 11 12 13 14 15
Mean
ag
e +
/-2std
ev
R17
0
5
10
15
20
0 1 2 3 4 5 6 7 8 9 10 11 12 13 14 15
Mean
ag
e +
/-2std
ev
R18
0
5
10
15
20
0 1 2 3 4 5 6 7 8 9 10 11 12 13 14 15
Mean
ag
e +
/-2std
ev
R19
0
5
10
15
20
0 1 2 3 4 5 6 7 8 9 10 11 12 13 14 15
Mean
ag
e +
/-2std
ev
R20
0
5
10
15
20
0 1 2 3 4 5 6 7 8 9 10 11 12 13 14 15
Mean
ag
e +
/-2std
ev
R21
0
5
10
15
20
0 1 2 3 4 5 6 7 8 9 10 11 12 13 14 15
Mean
ag
e +
/-2std
ev
R22
0
5
10
15
20
0 1 2 3 4 5 6 7 8 9 10 11 12 13 14 15
Mean
ag
e +
/-2std
ev
R23
0
5
10
15
20
0 1 2 3 4 5 6 7 8 9 10 11 12 13 14 15
Mean
ag
e +
/-2std
ev
ALL READERS
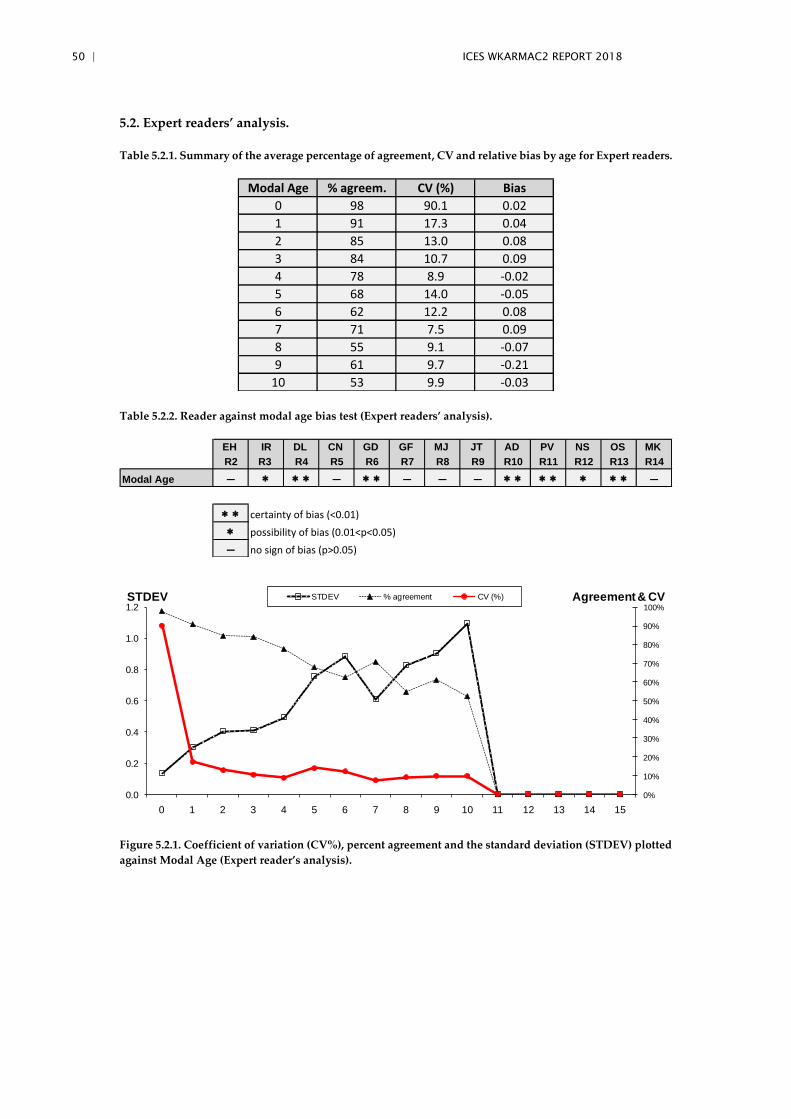
50 | ICES WKARMAC2 REPORT 2018
5.2. Expert readers’ analysis.
Table 5.2.1. Summary of the average percentage of agreement, CV and relative bias by age for Expert readers.
Table 5.2.2. Reader against modal age bias test (Expert readers’ analysis).
Figure 5.2.1. Coefficient of variation (CV%), percent agreement and the standard deviation (STDEV) plotted
against Modal Age (Expert reader’s analysis).
Modal Age % agreem. CV (%) Bias
0 98 90.1 0.02
1 91 17.3 0.04
2 85 13.0 0.08
3 84 10.7 0.09
4 78 8.9 -0.02
5 68 14.0 -0.05
6 62 12.2 0.08
7 71 7.5 0.09
8 55 9.1 -0.07
9 61 9.7 -0.21
10 53 9.9 -0.03
EH IR DL CN GD GF MJ JT AD PV NS OS MK
R2 R3 R4 R5 R6 R7 R8 R9 R10 R11 R12 R13 R14
- * * * - * * - - - * * * * * * * -
* * certainty of bias (<0.01)
* possibility of bias (0.01<p<0.05)
- no sign of bias (p>0.05)
Modal Age
0%
10%
20%
30%
40%
50%
60%
70%
80%
90%
100%
0.0
0.2
0.4
0.6
0.8
1.0
1.2
0 1 2 3 4 5 6 7 8 9 10 11 12 13 14 15
STDEV % agreement CV (%)STDEV Agreement & CV
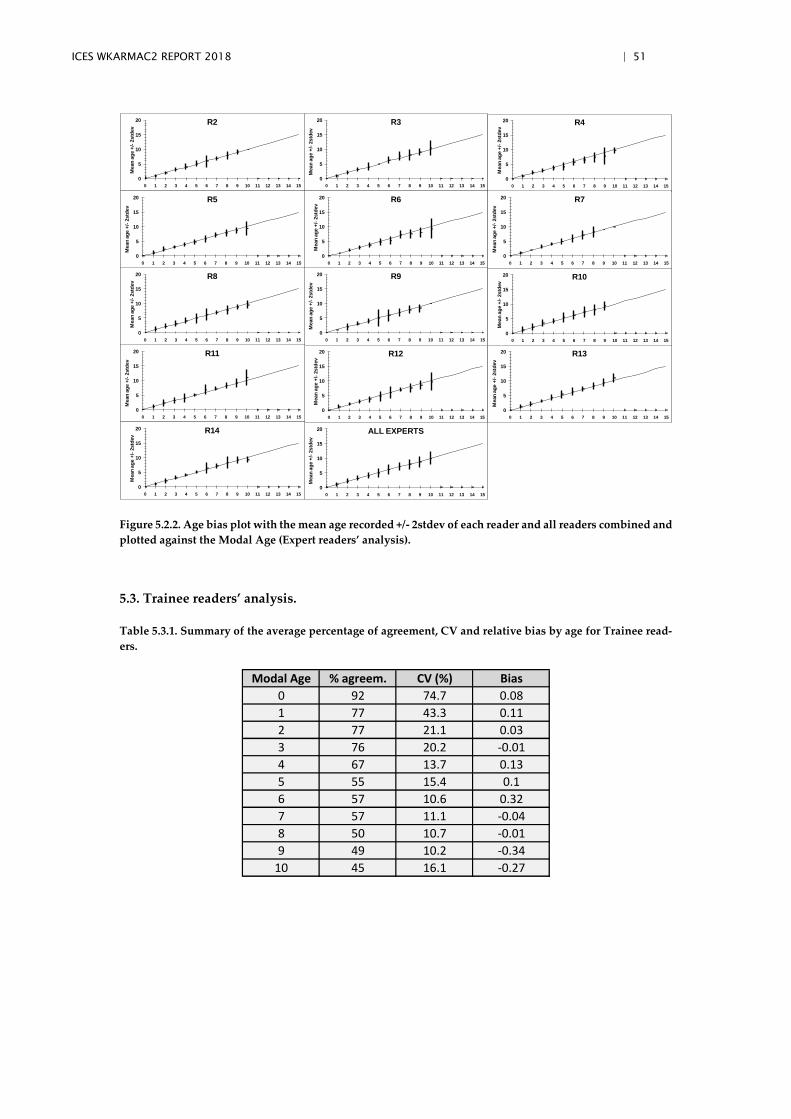
ICES WKARMAC2 REPORT 2018 | 51
Figure 5.2.2. Age bias plot with the mean age recorded +/- 2stdev of each reader and all readers combined and
plotted against the Modal Age (Expert readers’ analysis).
5.3. Trainee readers’ analysis.
Table 5.3.1. Summary of the average percentage of agreement, CV and relative bias by age for Trainee read-
ers.
0
5
10
15
20
0 1 2 3 4 5 6 7 8 9 10 11 12 13 14 15
Mean
ag
e +
/-2std
ev
R2
0
5
10
15
20
0 1 2 3 4 5 6 7 8 9 10 11 12 13 14 15
Mean
ag
e +
/-2std
ev
R3
0
5
10
15
20
0 1 2 3 4 5 6 7 8 9 10 11 12 13 14 15
Mean
ag
e +
/-2std
ev
R4
0
5
10
15
20
0 1 2 3 4 5 6 7 8 9 10 11 12 13 14 15
Mean
ag
e +
/-2std
ev
R5
0
5
10
15
20
0 1 2 3 4 5 6 7 8 9 10 11 12 13 14 15
Mean
ag
e +
/-2std
ev
R6
0
5
10
15
20
0 1 2 3 4 5 6 7 8 9 10 11 12 13 14 15
Mean
ag
e +
/-2std
ev
R7
0
5
10
15
20
0 1 2 3 4 5 6 7 8 9 10 11 12 13 14 15
Mean
ag
e +
/-2std
ev
R8
0
5
10
15
20
0 1 2 3 4 5 6 7 8 9 10 11 12 13 14 15
Mean
ag
e +
/-2std
ev
R9
0
5
10
15
20
0 1 2 3 4 5 6 7 8 9 10 11 12 13 14 15
Mean
ag
e +
/-2std
ev
R10
0
5
10
15
20
0 1 2 3 4 5 6 7 8 9 10 11 12 13 14 15
Mean
ag
e +
/-2std
ev
R11
0
5
10
15
20
0 1 2 3 4 5 6 7 8 9 10 11 12 13 14 15
Mean
ag
e +
/-2std
ev
R12
0
5
10
15
20
0 1 2 3 4 5 6 7 8 9 10 11 12 13 14 15
Mean
ag
e +
/-2std
ev
R13
0
5
10
15
20
0 1 2 3 4 5 6 7 8 9 10 11 12 13 14 15
Mean
ag
e +
/-2std
ev
R14
0
5
10
15
20
0 1 2 3 4 5 6 7 8 9 10 11 12 13 14 15
Mean
ag
e +
/-2std
ev
ALL EXPERTS
Modal Age % agreem. CV (%) Bias
0 92 74.7 0.08
1 77 43.3 0.11
2 77 21.1 0.03
3 76 20.2 -0.01
4 67 13.7 0.13
5 55 15.4 0.1
6 57 10.6 0.32
7 57 11.1 -0.04
8 50 10.7 -0.01
9 49 10.2 -0.34
10 45 16.1 -0.27
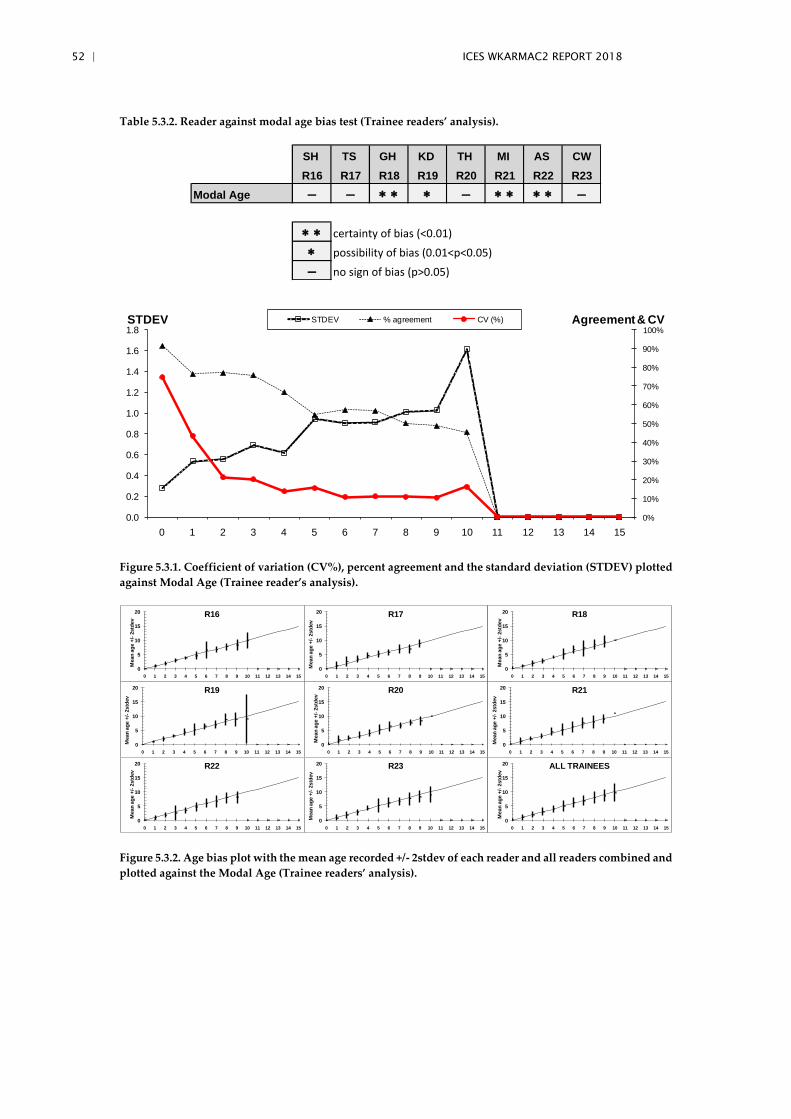
52 | ICES WKARMAC2 REPORT 2018
Table 5.3.2. Reader against modal age bias test (Trainee readers’ analysis).
Figure 5.3.1. Coefficient of variation (CV%), percent agreement and the standard deviation (STDEV) plotted
against Modal Age (Trainee reader’s analysis).
Figure 5.3.2. Age bias plot with the mean age recorded +/- 2stdev of each reader and all readers combined and
plotted against the Modal Age (Trainee readers’ analysis).
SH TS GH KD TH MI AS CW
R16 R17 R18 R19 R20 R21 R22 R23
- - * * * - * * * * -
* * certainty of bias (<0.01)
* possibility of bias (0.01<p<0.05)
- no sign of bias (p>0.05)
Modal Age
0%
10%
20%
30%
40%
50%
60%
70%
80%
90%
100%
0.0
0.2
0.4
0.6
0.8
1.0
1.2
1.4
1.6
1.8
0 1 2 3 4 5 6 7 8 9 10 11 12 13 14 15
STDEV % agreement CV (%)STDEV Agreement & CV
0
5
10
15
20
0 1 2 3 4 5 6 7 8 9 10 11 12 13 14 15
Mean
ag
e +
/-2std
ev
R16
0
5
10
15
20
0 1 2 3 4 5 6 7 8 9 10 11 12 13 14 15
Mean
ag
e +
/-2std
ev
R17
0
5
10
15
20
0 1 2 3 4 5 6 7 8 9 10 11 12 13 14 15
Mean
ag
e +
/-2std
ev
R18
0
5
10
15
20
0 1 2 3 4 5 6 7 8 9 10 11 12 13 14 15
Mean
ag
e +
/-2std
ev
R19
0
5
10
15
20
0 1 2 3 4 5 6 7 8 9 10 11 12 13 14 15
Mean
ag
e +
/-2std
ev
R20
0
5
10
15
20
0 1 2 3 4 5 6 7 8 9 10 11 12 13 14 15
Mean
ag
e +
/-2std
ev
R21
0
5
10
15
20
0 1 2 3 4 5 6 7 8 9 10 11 12 13 14 15
Mean
ag
e +
/-2std
ev
R22
0
5
10
15
20
0 1 2 3 4 5 6 7 8 9 10 11 12 13 14 15
Mean
ag
e +
/-2std
ev
R23
0
5
10
15
20
0 1 2 3 4 5 6 7 8 9 10 11 12 13 14 15
Mean
ag
e +
/-2std
ev
ALL TRAINEES
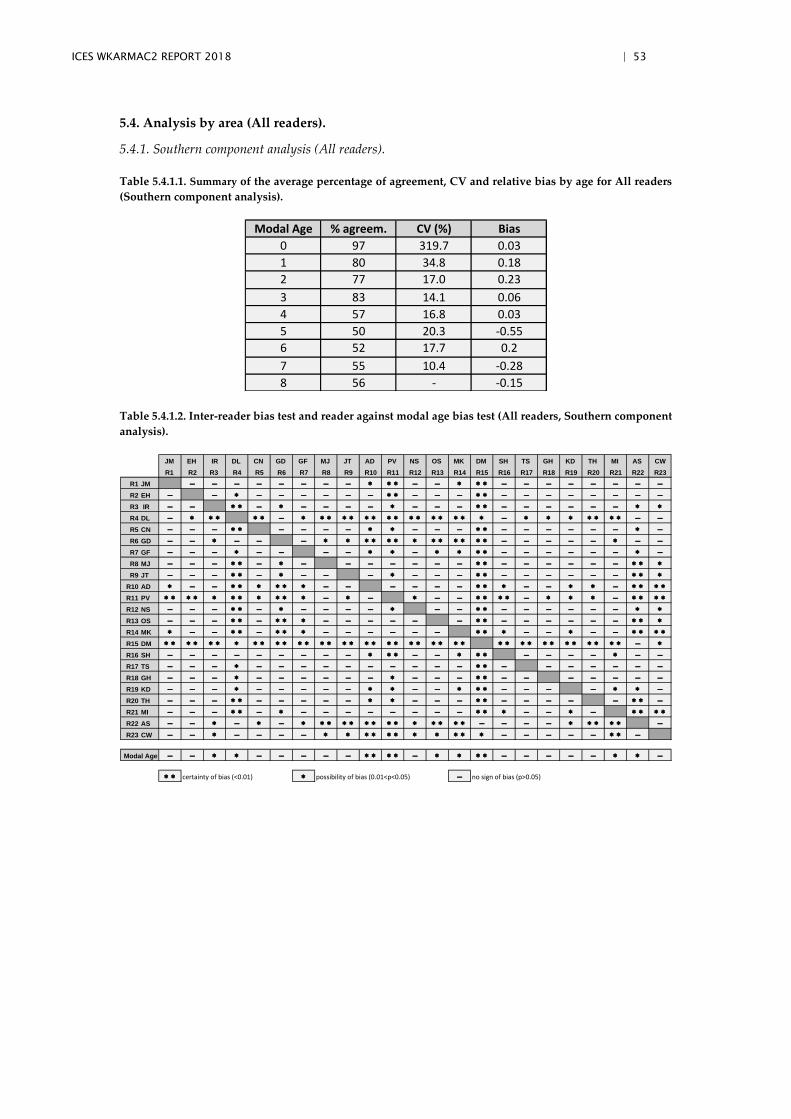
ICES WKARMAC2 REPORT 2018 | 53
5.4. Analysis by area (All readers).
5.4.1. Southern component analysis (All readers).
Table 5.4.1.1. Summary of the average percentage of agreement, CV and relative bias by age for All readers
(Southern component analysis).
Table 5.4.1.2. Inter-reader bias test and reader against modal age bias test (All readers, Southern component
analysis).
Modal Age % agreem. CV (%) Bias
0 97 319.7 0.03
1 80 34.8 0.18
2 77 17.0 0.23
3 83 14.1 0.06
4 57 16.8 0.03
5 50 20.3 -0.55
6 52 17.7 0.2
7 55 10.4 -0.28
8 56 - -0.15
JM EH IR DL CN GD GF MJ JT AD PV NS OS MK DM SH TS GH KD TH MI AS CW
R1 R2 R3 R4 R5 R6 R7 R8 R9 R10 R11 R12 R13 R14 R15 R16 R17 R18 R19 R20 R21 R22 R23
R1 JM - - - - - - - - * * * - - * * * - - - - - - - -
R2 EH - - * - - - - - - * * - - - * * - - - - - - - -
R3 IR - - * * - * - - - - * - - - * * - - - - - - * *
R4 DL - * * * * * - * * * * * * * * * * * * * * * * - * * * * * * * - -
R5 CN - - - * * - - - - * * - - - * * - - - - - - * -
R6 GD - - * - - - * * * * * * * * * * * * * - - - - - * - -
R7 GF - - - * - - - - * * - * * * * - - - - - - * -
R8 MJ - - - * * - * - - - - - - - * * - - - - - - * * *
R9 JT - - - * * - * - - - * - - - * * - - - - - - * * *
R10 AD * - - * * * * * * - - - - - - * * * - - * * - * * * *
R11 PV * * * * * * * * * * * - * - * - - * * * * - * * * - * * * *
R12 NS - - - * * - * - - - - * - - * * - - - - - - * *
R13 OS - - - * * - * * * - - - - - - * * - - - - - - * * *
R14 MK * - - * * - * * * - - - - - - * * * - - * - - * * * *
R15 DM * * * * * * * * * * * * * * * * * * * * * * * * * * * * * * * * * * * * * * * - *
R16 SH - - - - - - - - - * * * - - * * * - - - - * - -
R17 TS - - - * - - - - - - - - - - * * - - - - - - -
R18 GH - - - * - - - - - - * - - - * * - - - - - - -
R19 KD - - - * - - - - - * * - - * * * - - - - * * -
R20 TH - - - * * - - - - - * * - - - * * - - - - - * * -
R21 MI - - - * * - * - - - - - - - - * * * - - * - * * * *
R22 AS - - * - * - * * * * * * * * * * * * * * - - - - * * * * * -
R23 CW - - * - - - - * * * * * * * * * * * - - - - - * * -
- - * * - - - - - * * * * - * * * * - - - - - * * -
* * certainty of bias (<0.01) * possibility of bias (0.01<p<0.05) - no sign of bias (p>0.05)
Modal Age
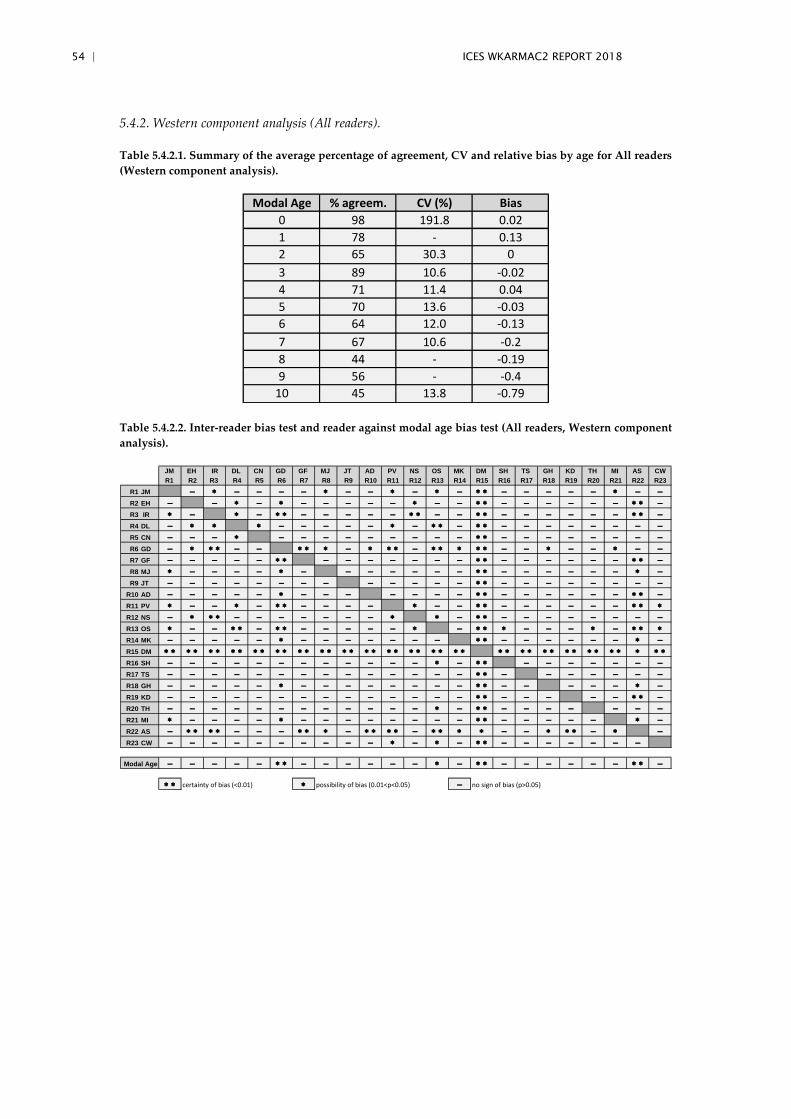
54 | ICES WKARMAC2 REPORT 2018
5.4.2. Western component analysis (All readers).
Table 5.4.2.1. Summary of the average percentage of agreement, CV and relative bias by age for All readers
(Western component analysis).
Table 5.4.2.2. Inter-reader bias test and reader against modal age bias test (All readers, Western component
analysis).
Modal Age % agreem. CV (%) Bias
0 98 191.8 0.02
1 78 - 0.13
2 65 30.3 0
3 89 10.6 -0.02
4 71 11.4 0.04
5 70 13.6 -0.03
6 64 12.0 -0.13
7 67 10.6 -0.2
8 44 - -0.19
9 56 - -0.4
10 45 13.8 -0.79
JM EH IR DL CN GD GF MJ JT AD PV NS OS MK DM SH TS GH KD TH MI AS CW
R1 R2 R3 R4 R5 R6 R7 R8 R9 R10 R11 R12 R13 R14 R15 R16 R17 R18 R19 R20 R21 R22 R23
R1 JM - * - - - - * - - * - * - * * - - - - - * - -
R2 EH - - * - * - - - - - * - - * * - - - - - - * * -
R3 IR * - * - * * - - - - - * * - - * * - - - - - - * * -
R4 DL - * * * - - - - - * - * * - * * - - - - - - - -
R5 CN - - - * - - - - - - - - - * * - - - - - - - -
R6 GD - * * * - - * * * - * * * - * * * * * - - * - - * - -
R7 GF - - - - - * * - - - - - - - * * - - - - - - * * -
R8 MJ * - - - - * - - - - - - - * * - - - - - - * -
R9 JT - - - - - - - - - - - - - * * - - - - - - - -
R10 AD - - - - - * - - - - - - - * * - - - - - - * * -
R11 PV * - - * - * * - - - - * - - * * - - - - - - * * *
R12 NS - * * * - - - - - - - * * - * * - - - - - - - -
R13 OS * - - * * - * * - - - - - * - * * * - - - * - * * *
R14 MK - - - - - * - - - - - - - * * - - - - - - * -
R15 DM * * * * * * * * * * * * * * * * * * * * * * * * * * * * * * * * * * * * * * * * * * *
R16 SH - - - - - - - - - - - - * - * * - - - - - - -
R17 TS - - - - - - - - - - - - - - * * - - - - - - -
R18 GH - - - - - * - - - - - - - - * * - - - - - * -
R19 KD - - - - - - - - - - - - - - * * - - - - - * * -
R20 TH - - - - - - - - - - - - * - * * - - - - - - -
R21 MI * - - - - * - - - - - - - - * * - - - - - * -
R22 AS - * * * * - - - * * * - * * * * - * * * * - - * * * - * -
R23 CW - - - - - - - - - - * - * - * * - - - - - - -
- - - - - * * - - - - - - * - * * - - - - - - * * -
* * certainty of bias (<0.01) * possibility of bias (0.01<p<0.05) - no sign of bias (p>0.05)
Modal Age
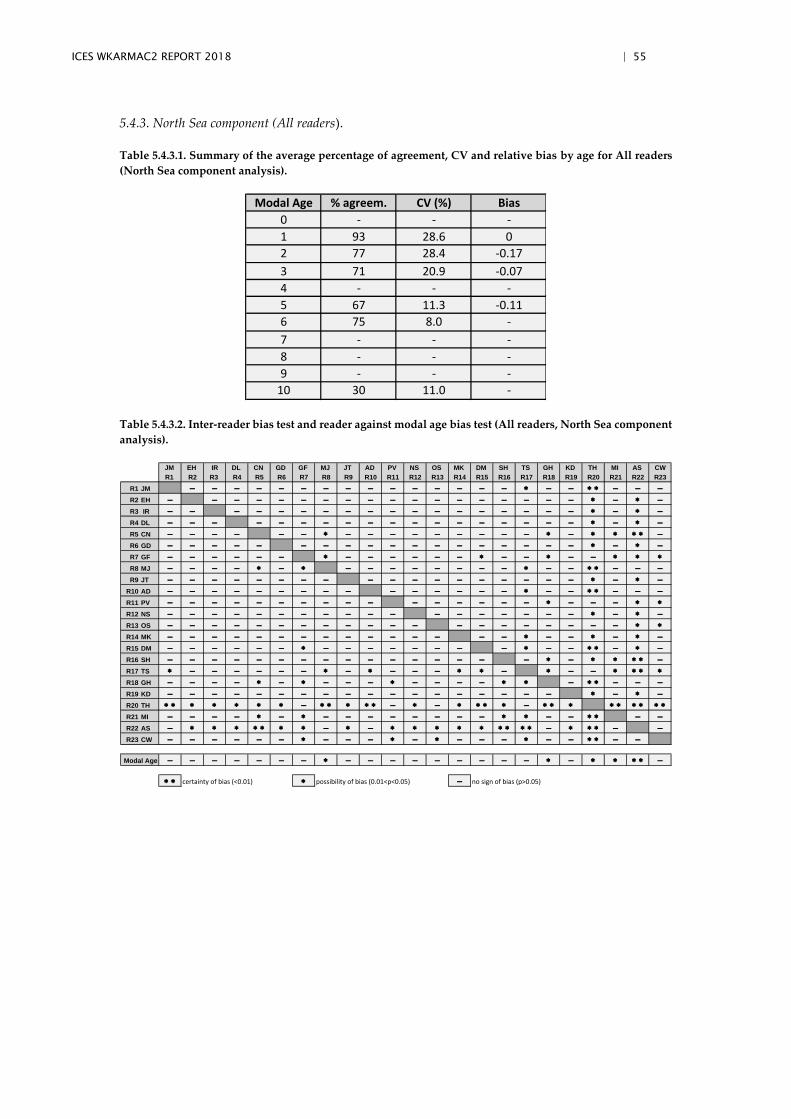
ICES WKARMAC2 REPORT 2018 | 55
5.4.3. North Sea component (All readers).
Table 5.4.3.1. Summary of the average percentage of agreement, CV and relative bias by age for All readers
(North Sea component analysis).
Table 5.4.3.2. Inter-reader bias test and reader against modal age bias test (All readers, North Sea component
analysis).
Modal Age % agreem. CV (%) Bias
0 - - -
1 93 28.6 0
2 77 28.4 -0.17
3 71 20.9 -0.07
4 - - -
5 67 11.3 -0.11
6 75 8.0 -
7 - - -
8 - - -
9 - - -
10 30 11.0 -
JM EH IR DL CN GD GF MJ JT AD PV NS OS MK DM SH TS GH KD TH MI AS CW
R1 R2 R3 R4 R5 R6 R7 R8 R9 R10 R11 R12 R13 R14 R15 R16 R17 R18 R19 R20 R21 R22 R23
R1 JM - - - - - - - - - - - - - - - * - - * * - - -
R2 EH - - - - - - - - - - - - - - - - - - * - * -
R3 IR - - - - - - - - - - - - - - - - - - * - * -
R4 DL - - - - - - - - - - - - - - - - - - * - * -
R5 CN - - - - - - * - - - - - - - - - * - * * * * -
R6 GD - - - - - - - - - - - - - - - - - - * - * -
R7 GF - - - - - - * - - - - - - * - - * - - * * *
R8 MJ - - - - * - * - - - - - - - - * - - * * - - -
R9 JT - - - - - - - - - - - - - - - - - - * - * -
R10 AD - - - - - - - - - - - - - - - * - - * * - - -
R11 PV - - - - - - - - - - - - - - - - * - - - * *
R12 NS - - - - - - - - - - - - - - - - - - * - * -
R13 OS - - - - - - - - - - - - - - - - - - - - * *
R14 MK - - - - - - - - - - - - - - - * - - * - * -
R15 DM - - - - - - * - - - - - - - - * - - * * - * -
R16 SH - - - - - - - - - - - - - - - - * - * * * * -
R17 TS * - - - - - - * - * - - - * * - * - - * * * *
R18 GH - - - - * - * - - - * - - - - * * - * * - - -
R19 KD - - - - - - - - - - - - - - - - - - * - * -
R20 TH * * * * * * * - * * * * * - * - * * * * - * * * * * * * * *
R21 MI - - - - * - * - - - - - - - - * * - - * * - -
R22 AS - * * * * * * * - * - * * * * * * * * * - * * * - -
R23 CW - - - - - - * - - - * - * - - - * - - * * - -
- - - - - - - * - - - - - - - - - * - * * * * -
* * certainty of bias (<0.01) * possibility of bias (0.01<p<0.05) - no sign of bias (p>0.05)
Modal Age
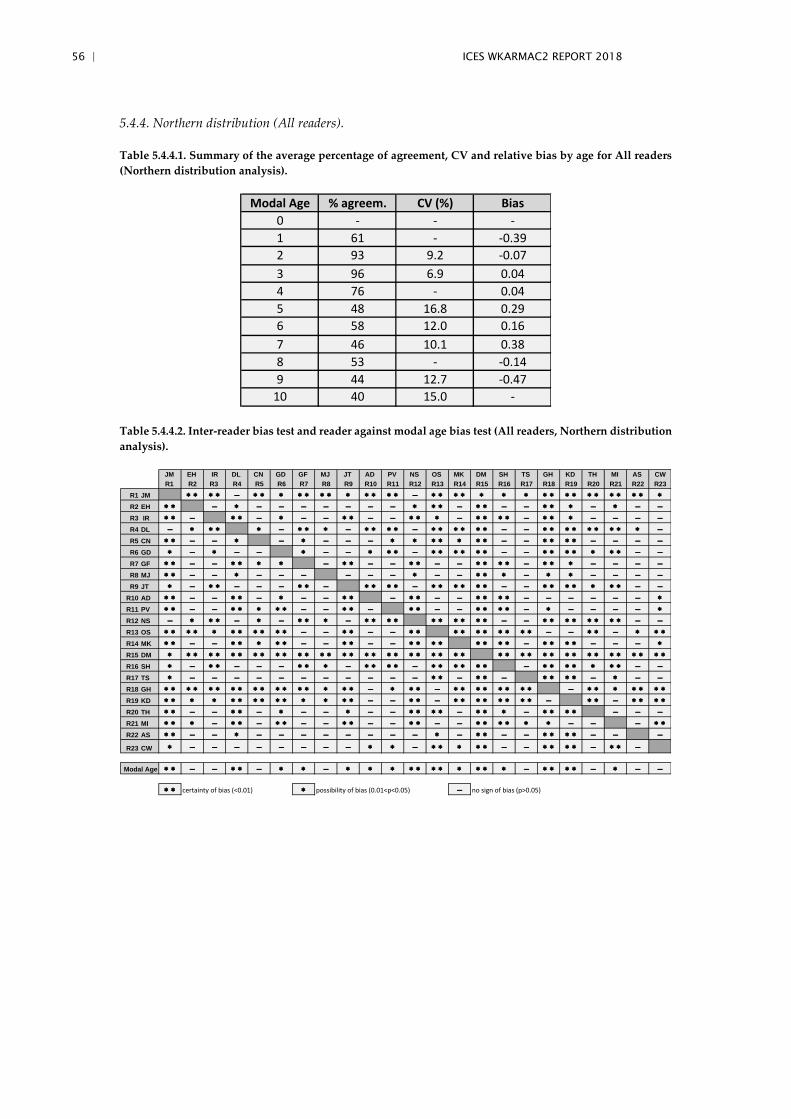
56 | ICES WKARMAC2 REPORT 2018
5.4.4. Northern distribution (All readers).
Table 5.4.4.1. Summary of the average percentage of agreement, CV and relative bias by age for All readers
(Northern distribution analysis).
Table 5.4.4.2. Inter-reader bias test and reader against modal age bias test (All readers, Northern distribution
analysis).
Modal Age % agreem. CV (%) Bias
0 - - -
1 61 - -0.39
2 93 9.2 -0.07
3 96 6.9 0.04
4 76 - 0.04
5 48 16.8 0.29
6 58 12.0 0.16
7 46 10.1 0.38
8 53 - -0.14
9 44 12.7 -0.47
10 40 15.0 -
JM EH IR DL CN GD GF MJ JT AD PV NS OS MK DM SH TS GH KD TH MI AS CW
R1 R2 R3 R4 R5 R6 R7 R8 R9 R10 R11 R12 R13 R14 R15 R16 R17 R18 R19 R20 R21 R22 R23
R1 JM * * * * - * * * * * * * * * * * * - * * * * * * * * * * * * * * * * * *
R2 EH * * - * - - - - - - - * * * - * * - - * * * - * - -
R3 IR * * - * * - * - - * * - - * * * - * * * * - * * * - - - -
R4 DL - * * * * - * * * - * * * * - * * * * * * - - * * * * * * * * * -
R5 CN * * - - * - * - - - * * * * * * * - - * * * * - - - -
R6 GD * - * - - * - - * * * - * * * * * * - - * * * * * * * - -
R7 GF * * - - * * * * - * * - - * * - - * * * * - * * * - - - -
R8 MJ * * - - * - - - - - - * - - * * * - * * - - - -
R9 JT * - * * - - - * * - * * * * - * * * * * * - - * * * * * * * - -
R10 AD * * - - * * - * - - * * - * * - - * * * * - - - - - - *
R11 PV * * - - * * * * * - - * * - * * - - * * * * - * - - - - *
R12 NS - * * * - * - * * * - * * * * * * * * * * - - * * * * * * * * - -
R13 OS * * * * * * * * * * * - - * * - - * * * * * * * * * * - - * * - * * *
R14 MK * * - - * * * * * - - * * - - * * * * * * * * - * * * * - - - *
R15 DM * * * * * * * * * * * * * * * * * * * * * * * * * * * * * * * * * * * * * * * * * * *
R16 SH * - * * - - - * * * - * * * * - * * * * * * - * * * * * * * - -
R17 TS * - - - - - - - - - - - * * - * * - * * * * - * - -
R18 GH * * * * * * * * * * * * * * * * * - * * * - * * * * * * * * - * * * * * * *
R19 KD * * * * * * * * * * * * * * - - * * - * * * * * * * * - * * - * * * *
R20 TH * * - - * * - * - - * - - * * * * - * * * - * * * * - - -
R21 MI * * * - * * - * * - - * * - - * * - - * * * * * * - - - * *
R22 AS * * - - * - - - - - - - - * - * * - - * * * * - - -
R23 CW * - - - - - - - - * * - * * * * * - - * * * * - * * -
* * - - * * - * * - * * * * * * * * * * * - * * * * - * - -
* * certainty of bias (<0.01) * possibility of bias (0.01<p<0.05) - no sign of bias (p>0.05)
Modal Age
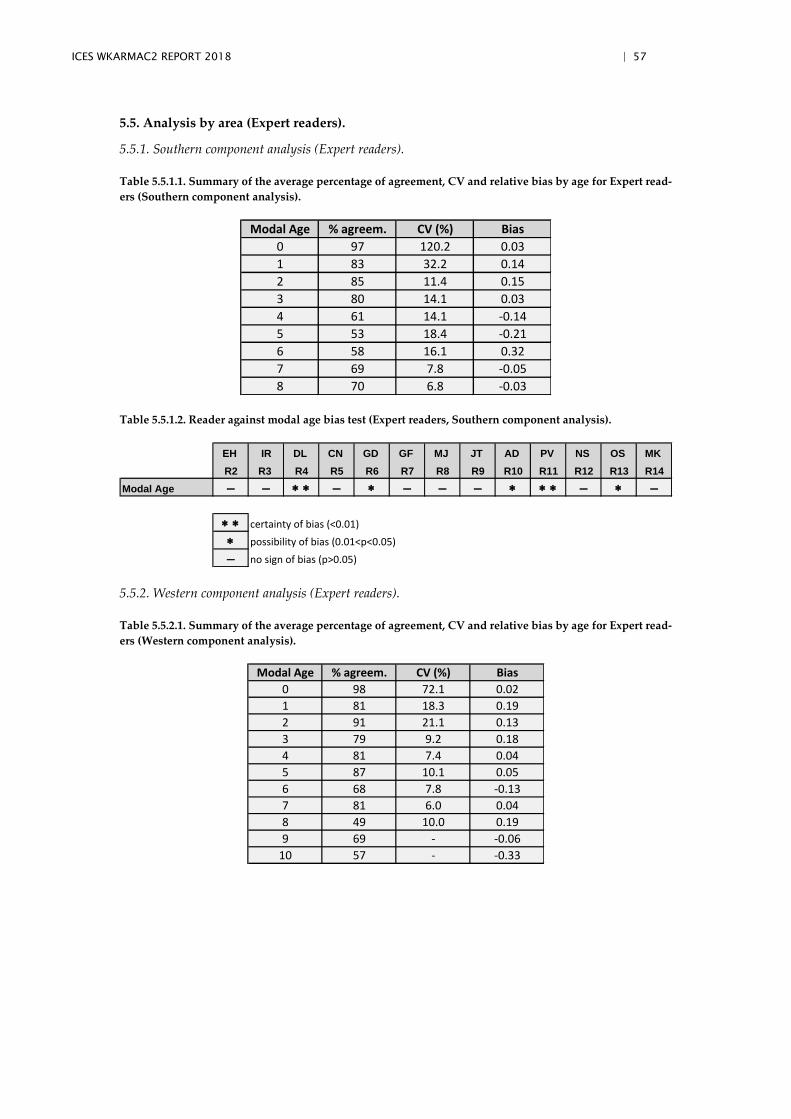
ICES WKARMAC2 REPORT 2018 | 57
5.5. Analysis by area (Expert readers).
5.5.1. Southern component analysis (Expert readers).
Table 5.5.1.1. Summary of the average percentage of agreement, CV and relative bias by age for Expert read-
ers (Southern component analysis).
Table 5.5.1.2. Reader against modal age bias test (Expert readers, Southern component analysis).
5.5.2. Western component analysis (Expert readers).
Table 5.5.2.1. Summary of the average percentage of agreement, CV and relative bias by age for Expert read-
ers (Western component analysis).
Modal Age % agreem. CV (%) Bias
0 97 120.2 0.03
1 83 32.2 0.14
2 85 11.4 0.15
3 80 14.1 0.03
4 61 14.1 -0.14
5 53 18.4 -0.21
6 58 16.1 0.32
7 69 7.8 -0.05
8 70 6.8 -0.03
EH IR DL CN GD GF MJ JT AD PV NS OS MK
R2 R3 R4 R5 R6 R7 R8 R9 R10 R11 R12 R13 R14
- - * * - * - - - * * * - * -
* * certainty of bias (<0.01)
* possibility of bias (0.01<p<0.05)
- no sign of bias (p>0.05)
Modal Age
Modal Age % agreem. CV (%) Bias
0 98 72.1 0.02
1 81 18.3 0.19
2 91 21.1 0.13
3 79 9.2 0.18
4 81 7.4 0.04
5 87 10.1 0.05
6 68 7.8 -0.13
7 81 6.0 0.04
8 49 10.0 0.19
9 69 - -0.06
10 57 - -0.33
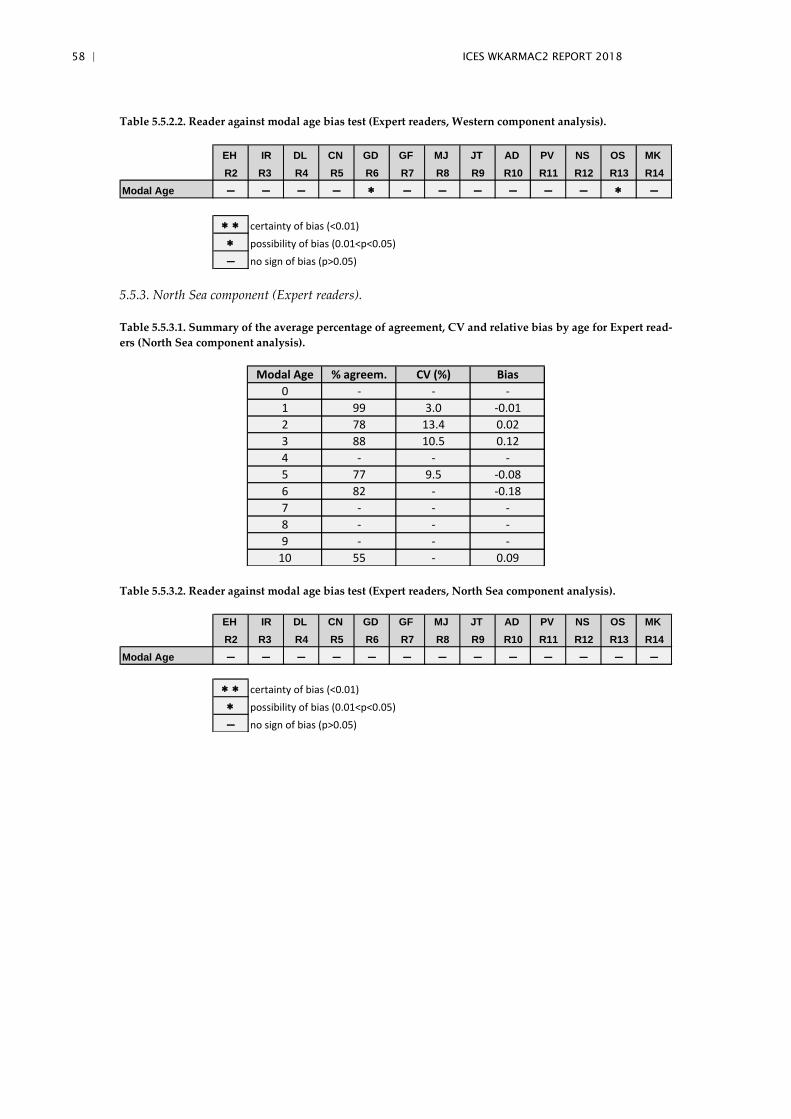
58 | ICES WKARMAC2 REPORT 2018
Table 5.5.2.2. Reader against modal age bias test (Expert readers, Western component analysis).
5.5.3. North Sea component (Expert readers).
Table 5.5.3.1. Summary of the average percentage of agreement, CV and relative bias by age for Expert read-
ers (North Sea component analysis).
Table 5.5.3.2. Reader against modal age bias test (Expert readers, North Sea component analysis).
EH IR DL CN GD GF MJ JT AD PV NS OS MK
R2 R3 R4 R5 R6 R7 R8 R9 R10 R11 R12 R13 R14
- - - - * - - - - - - * -
* * certainty of bias (<0.01)
* possibility of bias (0.01<p<0.05)
- no sign of bias (p>0.05)
Modal Age
Modal Age % agreem. CV (%) Bias
0 - - -
1 99 3.0 -0.01
2 78 13.4 0.02
3 88 10.5 0.12
4 - - -
5 77 9.5 -0.08
6 82 - -0.18
7 - - -
8 - - -
9 - - -
10 55 - 0.09
EH IR DL CN GD GF MJ JT AD PV NS OS MK
R2 R3 R4 R5 R6 R7 R8 R9 R10 R11 R12 R13 R14
- - - - - - - - - - - - -
* * certainty of bias (<0.01)
* possibility of bias (0.01<p<0.05)
- no sign of bias (p>0.05)
Modal Age
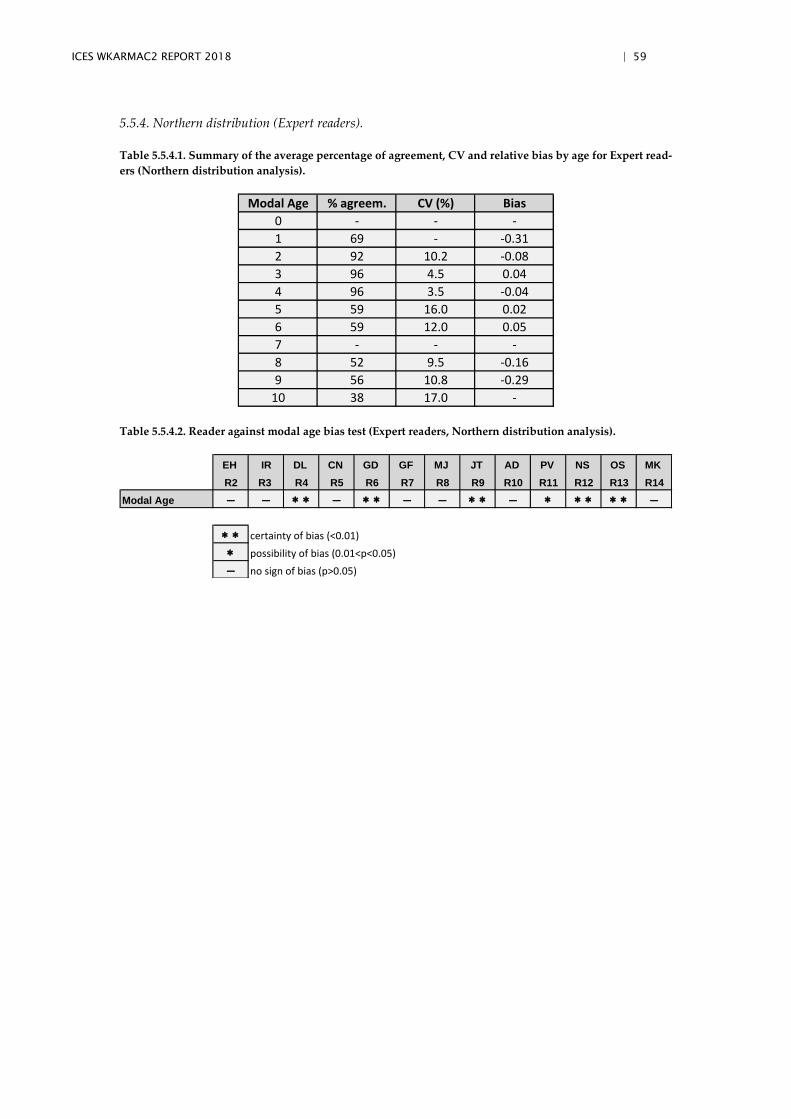
ICES WKARMAC2 REPORT 2018 | 59
5.5.4. Northern distribution (Expert readers).
Table 5.5.4.1. Summary of the average percentage of agreement, CV and relative bias by age for Expert read-
ers (Northern distribution analysis).
Table 5.5.4.2. Reader against modal age bias test (Expert readers, Northern distribution analysis).
Modal Age % agreem. CV (%) Bias
0 - - -
1 69 - -0.31
2 92 10.2 -0.08
3 96 4.5 0.04
4 96 3.5 -0.04
5 59 16.0 0.02
6 59 12.0 0.05
7 - - -
8 52 9.5 -0.16
9 56 10.8 -0.29
10 38 17.0 -
EH IR DL CN GD GF MJ JT AD PV NS OS MK
R2 R3 R4 R5 R6 R7 R8 R9 R10 R11 R12 R13 R14
- - * * - * * - - * * - * * * * * -
* * certainty of bias (<0.01)
* possibility of bias (0.01<p<0.05)
- no sign of bias (p>0.05)
Modal Age
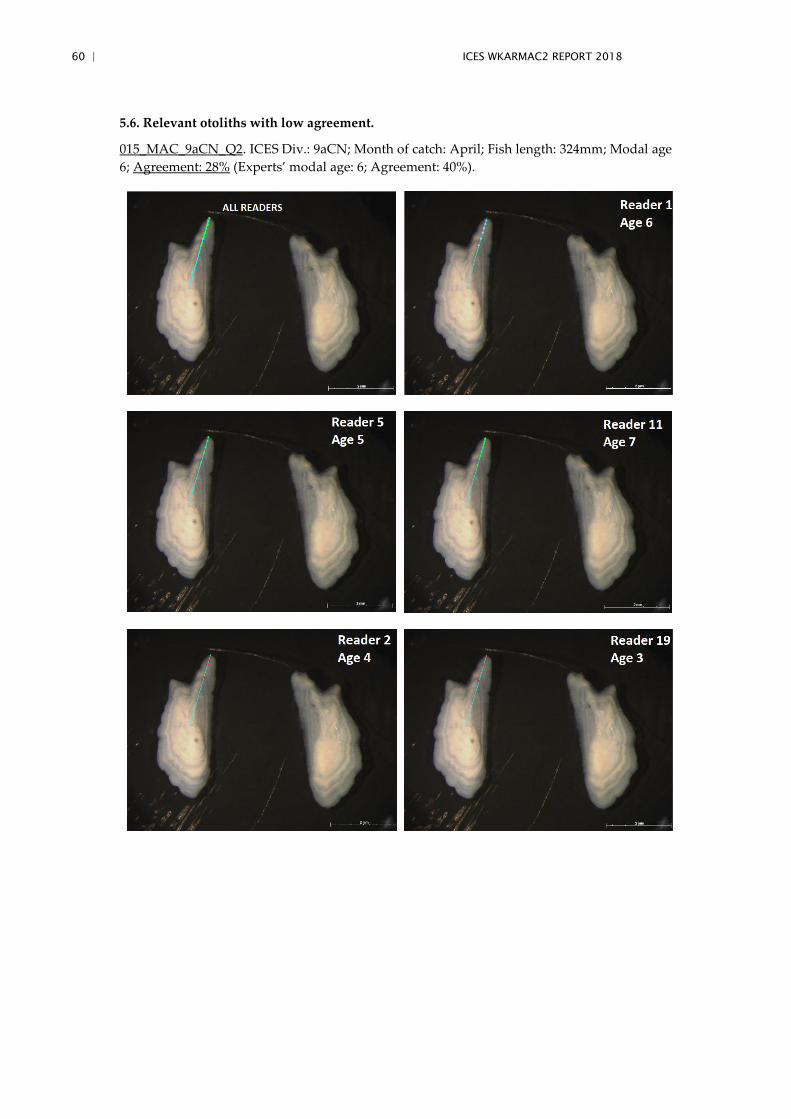
60 | ICES WKARMAC2 REPORT 2018
5.6. Relevant otoliths with low agreement.
015_MAC_9aCN_Q2. ICES Div.: 9aCN; Month of catch: April; Fish length: 324mm; Modal age
6; Agreement: 28% (Experts’ modal age: 6; Agreement: 40%).
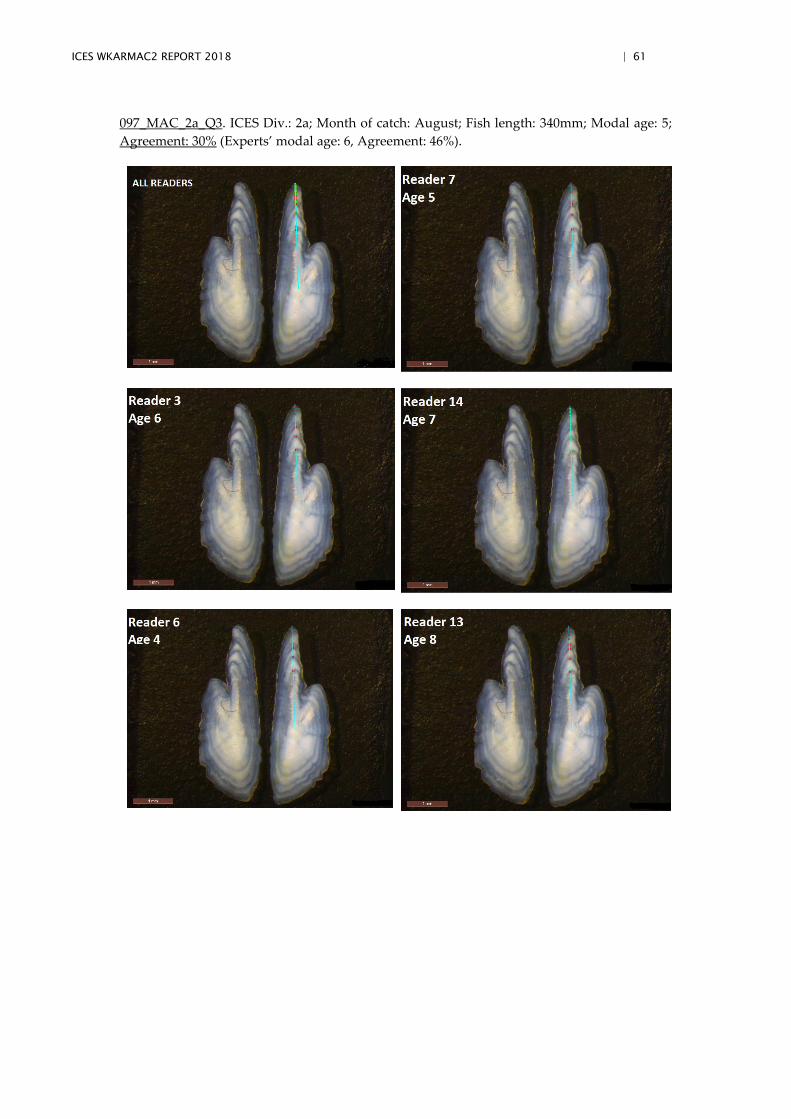
ICES WKARMAC2 REPORT 2018 | 61
097_MAC_2a_Q3. ICES Div.: 2a; Month of catch: August; Fish length: 340mm; Modal age: 5;
Agreement: 30% (Experts’ modal age: 6, Agreement: 46%).
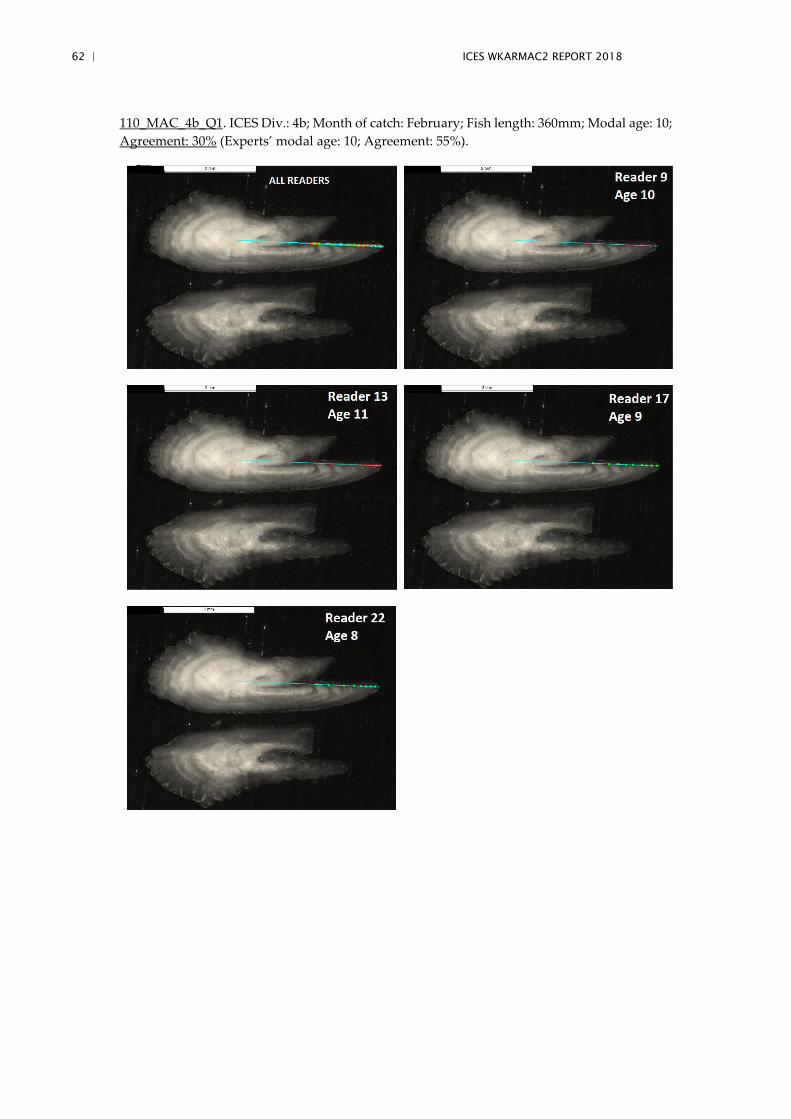
62 | ICES WKARMAC2 REPORT 2018
110_MAC_4b_Q1. ICES Div.: 4b; Month of catch: February; Fish length: 360mm; Modal age: 10;
Agreement: 30% (Experts’ modal age: 10; Agreement: 55%).
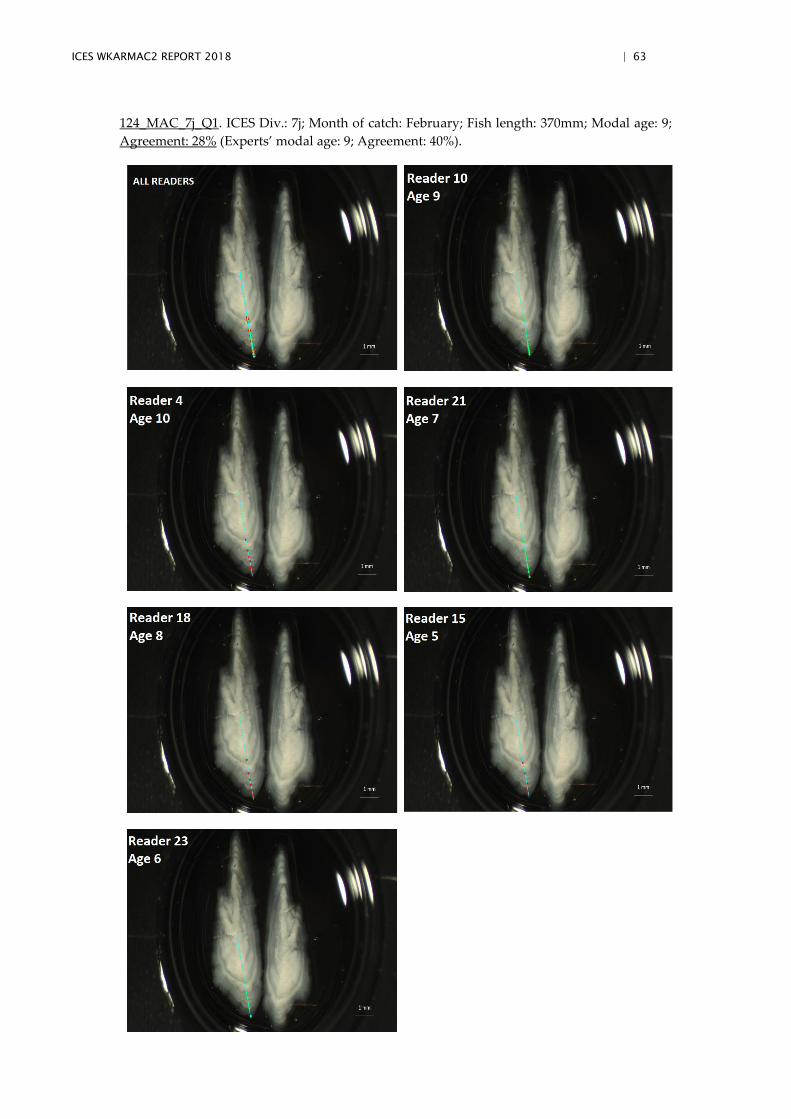
ICES WKARMAC2 REPORT 2018 | 63
124_MAC_7j_Q1. ICES Div.: 7j; Month of catch: February; Fish length: 370mm; Modal age: 9;
Agreement: 28% (Experts’ modal age: 9; Agreement: 40%).
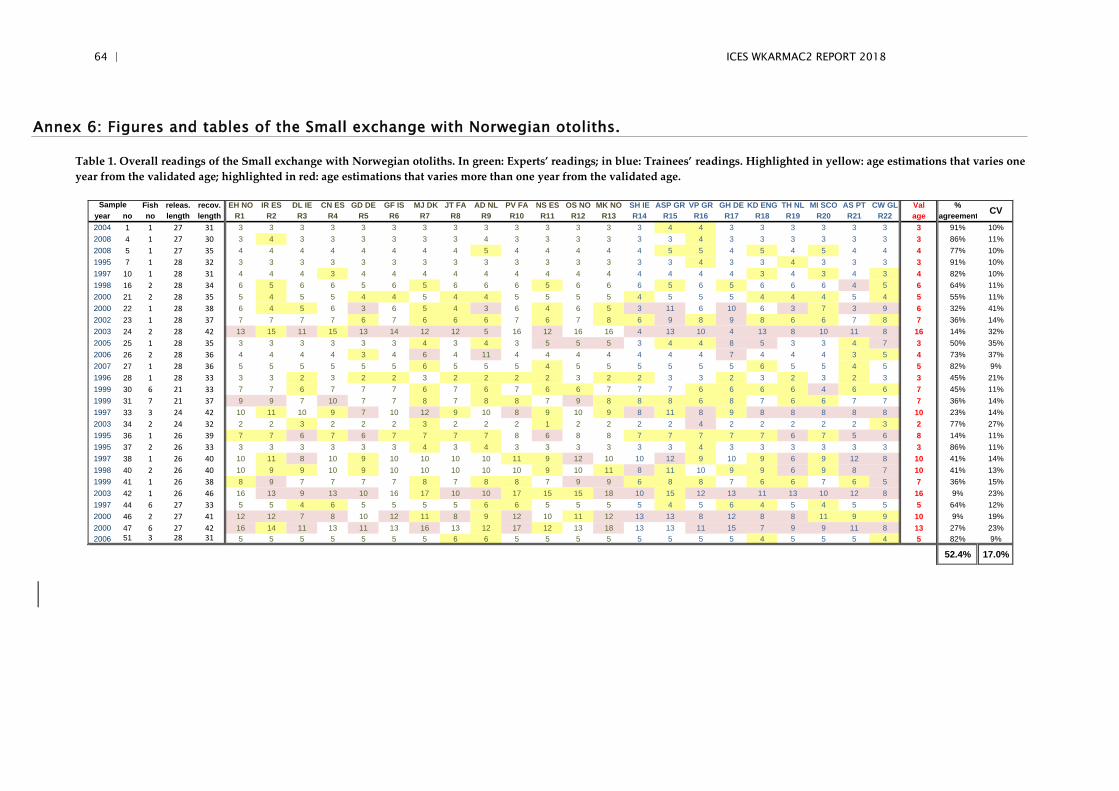
64 | ICES WKARMAC2 REPORT 2018
Annex 6: Figures and tables of the Small exchange with Norwegian otoliths.
Table 1. Overall readings of the Small exchange with Norwegian otoliths. In green: Experts’ readings; in blue: Trainees’ readings. Highlighted in yellow: age estimations that varies one
year from the validated age; highlighted in red: age estimations that varies more than one year from the validated age.
Fish releas. recov. EH NO IR ES DL IE CN ES GD DE GF IS MJ DK JT FA AD NL PV FA NS ES OS NO MK NO SH IE ASP GR VP GR GH DE KD ENG TH NL MI SCO AS PT CW GL Val %
year no no length length R1 R2 R3 R4 R5 R6 R7 R8 R9 R10 R11 R12 R13 R14 R15 R16 R17 R18 R19 R20 R21 R22 age agreement
2004 1 1 27 31 3 3 3 3 3 3 3 3 3 3 3 3 3 3 4 4 3 3 3 3 3 3 3 91% 10%
2008 4 1 27 30 3 4 3 3 3 3 3 3 4 3 3 3 3 3 3 4 3 3 3 3 3 3 3 86% 11%
2008 5 1 27 35 4 4 4 4 4 4 4 4 5 4 4 4 4 4 5 5 4 5 4 5 4 4 4 77% 10%
1995 7 1 28 32 3 3 3 3 3 3 3 3 3 3 3 3 3 3 3 4 3 3 4 3 3 3 3 91% 10%
1997 10 1 28 31 4 4 4 3 4 4 4 4 4 4 4 4 4 4 4 4 4 3 4 3 4 3 4 82% 10%
1998 16 2 28 34 6 5 6 6 5 6 5 6 6 6 5 6 6 6 5 6 5 6 6 6 4 5 6 64% 11%
2000 21 2 28 35 5 4 5 5 4 4 5 4 4 5 5 5 5 4 5 5 5 4 4 4 5 4 5 55% 11%
2000 22 1 28 38 6 4 5 6 3 6 5 4 3 6 4 6 5 3 11 6 10 6 3 7 3 9 6 32% 41%
2002 23 1 28 37 7 7 7 7 6 7 6 6 6 7 6 7 8 6 9 8 9 8 6 6 7 8 7 36% 14%
2003 24 2 28 42 13 15 11 15 13 14 12 12 5 16 12 16 16 4 13 10 4 13 8 10 11 8 16 14% 32%
2005 25 1 28 35 3 3 3 3 3 3 4 3 4 3 5 5 5 3 4 4 8 5 3 3 4 7 3 50% 35%
2006 26 2 28 36 4 4 4 4 3 4 6 4 11 4 4 4 4 4 4 4 7 4 4 4 3 5 4 73% 37%
2007 27 1 28 36 5 5 5 5 5 5 6 5 5 5 4 5 5 5 5 5 5 6 5 5 4 5 5 82% 9%
1996 28 1 28 33 3 3 2 3 2 2 3 2 2 2 2 3 2 2 3 3 2 3 2 3 2 3 3 45% 21%
1999 30 6 21 33 7 7 6 7 7 7 6 7 6 7 6 6 7 7 7 6 6 6 6 4 6 6 7 45% 11%
1999 31 7 21 37 9 9 7 10 7 7 8 7 8 8 7 9 8 8 8 6 8 7 6 6 7 7 7 36% 14%
1997 33 3 24 42 10 11 10 9 7 10 12 9 10 8 9 10 9 8 11 8 9 8 8 8 8 8 10 23% 14%
2003 34 2 24 32 2 2 3 2 2 2 3 2 2 2 1 2 2 2 2 4 2 2 2 2 2 3 2 77% 27%
1995 36 1 26 39 7 7 6 7 6 7 7 7 7 8 6 8 8 7 7 7 7 7 6 7 5 6 8 14% 11%
1995 37 2 26 33 3 3 3 3 3 3 4 3 4 3 3 3 3 3 3 4 3 3 3 3 3 3 3 86% 11%
1997 38 1 26 40 10 11 8 10 9 10 10 10 10 11 9 12 10 10 12 9 10 9 6 9 12 8 10 41% 14%
1998 40 2 26 40 10 9 9 10 9 10 10 10 10 10 9 10 11 8 11 10 9 9 6 9 8 7 10 41% 13%
1999 41 1 26 38 8 9 7 7 7 7 8 7 8 8 7 9 9 6 8 8 7 6 6 7 6 5 7 36% 15%
2003 42 1 26 46 16 13 9 13 10 16 17 10 10 17 15 15 18 10 15 12 13 11 13 10 12 8 16 9% 23%
1997 44 6 27 33 5 5 4 6 5 5 5 5 6 6 5 5 5 5 4 5 6 4 5 4 5 5 5 64% 12%
2000 46 2 27 41 12 12 7 8 10 12 11 8 9 12 10 11 12 13 13 8 12 8 8 11 9 9 10 9% 19%
2000 47 6 27 42 16 14 11 13 11 13 16 13 12 17 12 13 18 13 13 11 15 7 9 9 11 8 13 27% 23%
2006 51 3 28 31 5 5 5 5 5 5 5 6 6 5 5 5 5 5 5 5 5 4 5 5 5 4 5 82% 9%
SampleCV
52.4% 17.0%
ICES WKARMAC2 REPORT 2018 | 65
65
Annex 7: Report of the Pre-WKARMAC2 exercise (Scomber scombrus).
Pre-WKARMAC2 exercise of Scomber scombrus otoliths. Coordinated by María Rosario
Navarro and Jens Ulleweit. 3–18 October 2018.
1. Introduction
Atlantic mackerel (Scomber scombrus) is a pelagic species of high commercial im-
portance in European waters. Age estimation of mackerel otoliths is an important fac-
tor in mackerel assessment and carried out by several laboratories throughout Europe
using internationally agreed ageing criteria.
A Workshop on Age Reading of Atlantic mackerel (Scomber scombrus) otoliths was rec-
ommended by WGBIOP 2015 (ICES 2015) to be carried out in 2016-2017. It was not
possible to enlist a chair for the workshop in this timeframe and so the workshop was
recommended again by WGBIOP 2017 (ICES 2016) to be carried out in 2018.
The last exchange was completed in 2014, and several otolith readers had been replaced
by new readers during that time. Therefore, it was decided to carry out a new otolith
exchange a few weeks before the workshop. This exchange would provide more accu-
rate information about the level of agreement of current readers. Additionally, the ex-
change would provide otolith images with the participants’ readings to be discussed
during the workshop as the program used in last exchange, WebGR, is no longer avail-
able, not even for the otolith reading discussion.
2. Material and Methods.
The exchange was carried out via SmartDots (http://www.ices.dk/marine-
data/tools/Pages/smartdots.aspx), the web application developed by ICES to facilitate
the setup of Exchanges, Workshops and Training events. A total of 135 otolith images
from the main areas of mackerel distribution were included in the exchange. Following
the recommendations of WKMACQI (Workshop on Mackerel biological parameter
Quality Indicators) (ICES 2018), it was attempted that the spatial and temporal cover-
age, as well as the length and age range, of the mackerel otoliths of the exchange cor-
responded with the coverage in the assessment (Table 2.1).
Table 2.1. Spatial and temporal coverage of the otoliths used in the pre-WKARMAC2 exercise.
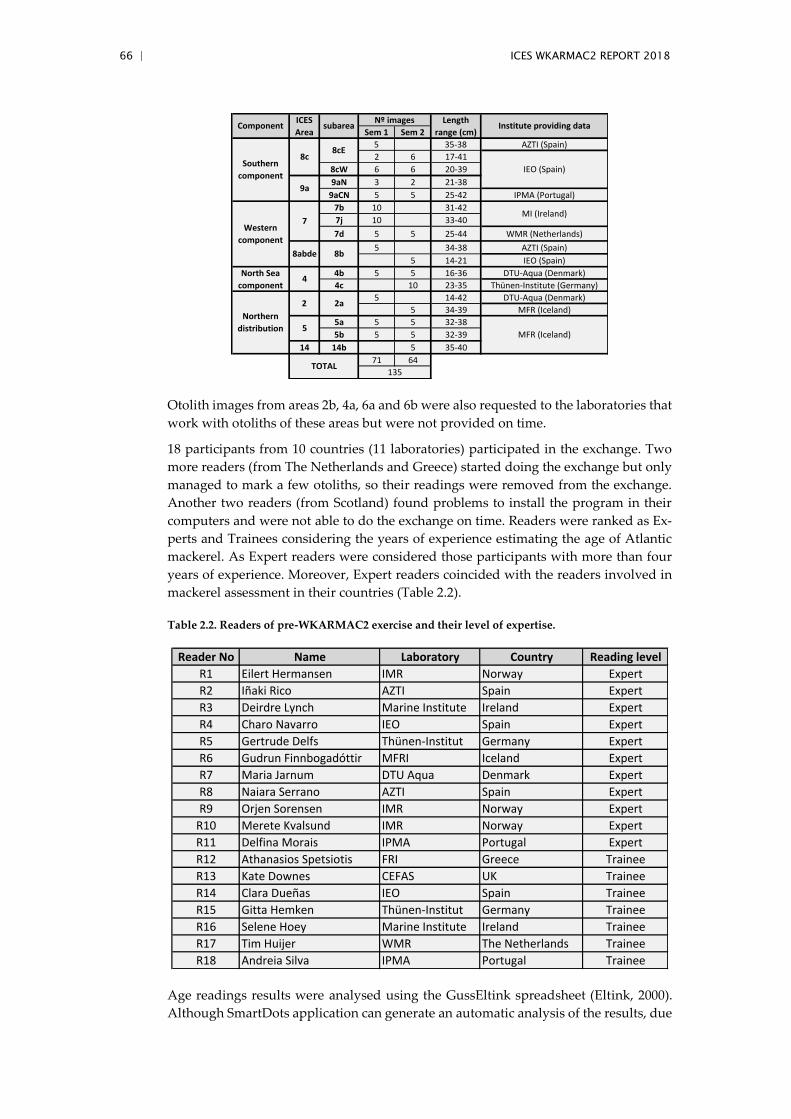
66 | ICES WKARMAC2 REPORT 2018
Otolith images from areas 2b, 4a, 6a and 6b were also requested to the laboratories that
work with otoliths of these areas but were not provided on time.
18 participants from 10 countries (11 laboratories) participated in the exchange. Two
more readers (from The Netherlands and Greece) started doing the exchange but only
managed to mark a few otoliths, so their readings were removed from the exchange.
Another two readers (from Scotland) found problems to install the program in their
computers and were not able to do the exchange on time. Readers were ranked as Ex-
perts and Trainees considering the years of experience estimating the age of Atlantic
mackerel. As Expert readers were considered those participants with more than four
years of experience. Moreover, Expert readers coincided with the readers involved in
mackerel assessment in their countries (Table 2.2).
Table 2.2. Readers of pre-WKARMAC2 exercise and their level of expertise.
Age readings results were analysed using the GussEltink spreadsheet (Eltink, 2000).
Although SmartDots application can generate an automatic analysis of the results, due
Sem 1 Sem 2
5 35-38 AZTI (Spain)
2 6 17-41
8cW 6 6 20-39
9aN 3 2 21-38
9aCN 5 5 25-42 IPMA (Portugal)
7b 10 31-42
7j 10 33-40
7d 5 5 25-44 WMR (Netherlands)
5 34-38 AZTI (Spain)
5 14-21 IEO (Spain)
4b 5 5 16-36 DTU-Aqua (Denmark)
4c 10 23-35 Thünen-Institute (Germany)
5 14-42 DTU-Aqua (Denmark)
5 34-39 MFR (Iceland)
5a 5 5 32-38
5b 5 5 32-39
14 14b 5 35-40
71 64
Institute providing data
Southern
component
8c8cE
IEO (Spain)
9a
ComponentICES
Areasubarea
Nº images Length
range (cm)
MI (Ireland)
TOTAL
Northern
distribution
2 2a
5MFR (Iceland)
135
8abde 8b
Western
component
North Sea
component4
7
Reader No Name Laboratory Country Reading level
R1 Eilert Hermansen IMR Norway Expert
R2 Iñaki Rico AZTI Spain Expert
R3 Deirdre Lynch Marine Institute Ireland Expert
R4 Charo Navarro IEO Spain Expert
R5 Gertrude Delfs Thünen-Institut Germany Expert
R6 Gudrun Finnbogadóttir MFRI Iceland Expert
R7 Maria Jarnum DTU Aqua Denmark Expert
R8 Naiara Serrano AZTI Spain Expert
R9 Orjen Sorensen IMR Norway Expert
R10 Merete Kvalsund IMR Norway Expert
R11 Delfina Morais IPMA Portugal Expert
R12 Athanasios Spetsiotis FRI Greece Trainee
R13 Kate Downes CEFAS UK Trainee
R14 Clara Dueñas IEO Spain Trainee
R15 Gitta Hemken Thünen-Institut Germany Trainee
R16 Selene Hoey Marine Institute Ireland Trainee
R17 Tim Huijer WMR The Netherlands Trainee
R18 Andreia Silva IPMA Portugal Trainee
ICES WKARMAC2 REPORT 2018 | 67
67
to the limited time available to obtain the results before the workshop and that the
application still has some limitations when selecting the options of the analysis, it was
decided to use the Eltink spreadsheet for the analysis instead.
3. Results.
A table with the participants’ readings can be found in Annex 7.2 (Table 7.2.1). In ad-
dition to the estimation of the age of the exchange otoliths, readers were asked to assign
the quality to each reading according to the “3 point grading system” (AQ1, AQ2, AQ3)
recommended by WKNARC (ICES, 2011). Readings with AQ3 were not included in
the analyses. Analyses were performed for the total of areas and all readers and Expert
and Trainee readers separately. Additional analyses were performed by each of the
four areas of mackerel distribution: Southern component (ICES div. 9a, 8c), Western
component (ICES div. 8b, 7bjd), North Sea component (ICES div. 4bc) and Northern
distribution (ICES div. 2a, 5ab, 14b). A summary with the overall agreement, CV and
bias of all analyses are shown in Table 3.1. The Figures and Tables showing the results
of each analysis can be found in Annex 7.2.
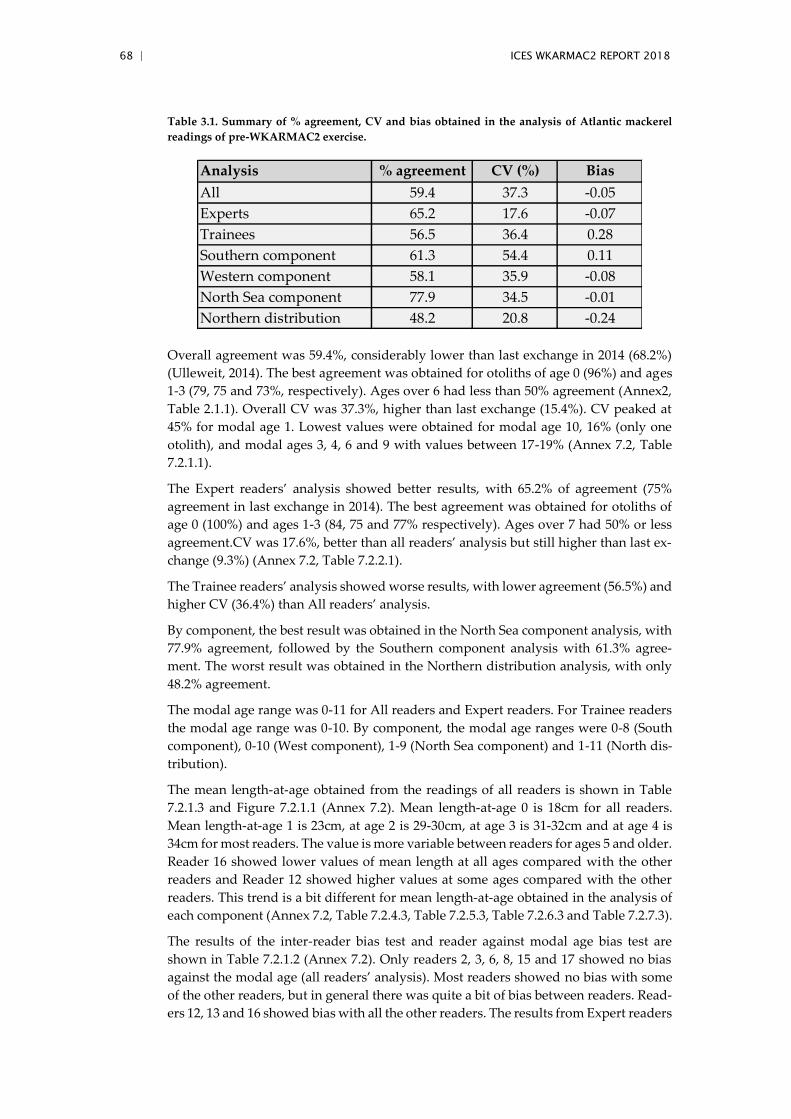
68 | ICES WKARMAC2 REPORT 2018
Table 3.1. Summary of % agreement, CV and bias obtained in the analysis of Atlantic mackerel
readings of pre-WKARMAC2 exercise.
Overall agreement was 59.4%, considerably lower than last exchange in 2014 (68.2%)
(Ulleweit, 2014). The best agreement was obtained for otoliths of age 0 (96%) and ages
1-3 (79, 75 and 73%, respectively). Ages over 6 had less than 50% agreement (Annex2,
Table 2.1.1). Overall CV was 37.3%, higher than last exchange (15.4%). CV peaked at
45% for modal age 1. Lowest values were obtained for modal age 10, 16% (only one
otolith), and modal ages 3, 4, 6 and 9 with values between 17-19% (Annex 7.2, Table
7.2.1.1).
The Expert readers’ analysis showed better results, with 65.2% of agreement (75%
agreement in last exchange in 2014). The best agreement was obtained for otoliths of
age 0 (100%) and ages 1-3 (84, 75 and 77% respectively). Ages over 7 had 50% or less
agreement.CV was 17.6%, better than all readers’ analysis but still higher than last ex-
change (9.3%) (Annex 7.2, Table 7.2.2.1).
The Trainee readers’ analysis showed worse results, with lower agreement (56.5%) and
higher CV (36.4%) than All readers’ analysis.
By component, the best result was obtained in the North Sea component analysis, with
77.9% agreement, followed by the Southern component analysis with 61.3% agree-
ment. The worst result was obtained in the Northern distribution analysis, with only
48.2% agreement.
The modal age range was 0-11 for All readers and Expert readers. For Trainee readers
the modal age range was 0-10. By component, the modal age ranges were 0-8 (South
component), 0-10 (West component), 1-9 (North Sea component) and 1-11 (North dis-
tribution).
The mean length-at-age obtained from the readings of all readers is shown in Table
7.2.1.3 and Figure 7.2.1.1 (Annex 7.2). Mean length-at-age 0 is 18cm for all readers.
Mean length-at-age 1 is 23cm, at age 2 is 29-30cm, at age 3 is 31-32cm and at age 4 is
34cm for most readers. The value is more variable between readers for ages 5 and older.
Reader 16 showed lower values of mean length at all ages compared with the other
readers and Reader 12 showed higher values at some ages compared with the other
readers. This trend is a bit different for mean length-at-age obtained in the analysis of
each component (Annex 7.2, Table 7.2.4.3, Table 7.2.5.3, Table 7.2.6.3 and Table 7.2.7.3).
The results of the inter-reader bias test and reader against modal age bias test are
shown in Table 7.2.1.2 (Annex 7.2). Only readers 2, 3, 6, 8, 15 and 17 showed no bias
against the modal age (all readers’ analysis). Most readers showed no bias with some
of the other readers, but in general there was quite a bit of bias between readers. Read-
ers 12, 13 and 16 showed bias with all the other readers. The results from Expert readers
Analysis % agreement CV (%) Bias
All 59.4 37.3 -0.05
Experts 65.2 17.6 -0.07
Trainees 56.5 36.4 0.28
Southern component 61.3 54.4 0.11
Western component 58.1 35.9 -0.08
North Sea component 77.9 34.5 -0.01
Northern distribution 48.2 20.8 -0.24
ICES WKARMAC2 REPORT 2018 | 69
69
and Trainee readers’ analysis were similar (Annex 7.2, Table 7.2.2.2 and Table 7.2.3.2).
When performing the inter-reader bias test and reader against modal age bias test by
component, the best results were obtained for the North Sea component where only
reader 16 showed bias against the modal age and all the other readers, while the other
readers showed no bias between them or against the modal age (Annex 7.2, Table
7.2.6.2).In the bias test of the Southern component, readers 2, 3, 5, 6, 7, 8, 14 and 15
showed no bias against the modal age. Readers 9, 10,11 and 16 showed bias with most
of the other readers, while the other readers showed bias only with some of the other
readers (Annex 7.2, Table 7.2.4.2). In the bias test of the Western component, readers 1,
2, 5, 6, 8, 15 and 17 showed no bias against the modal age. Readers 7, 10, 11, 12, 13, 14,
16 and 18 showed bias with most readers (Annex 7.2, Table 7.2.5.2). Last, in the bias
test of the Northern distribution, readers 1, 2, 3, 4, 8, 8, 15 and 18 showed no bias against
the modal age. Readers 6, 7, 11, 12, 13, 14 and 16 showed bias with most readers (Annex
7.2, Table 7.2.7.2).
Figure 7.2.1.2 (Annex 7.2) shows age bias plots with the mean age recorded and the
standard deviation of each age reader an all readers combined plotted against the
modal age. Readers 2, 4, 1 and 15 showed a more accurate estimation according to the
modal age. Readers 5, 6, 7, 8, 10, 14, 17 and 18 showed underestimations in older ages
regarding the modal age. Reader 3 showed a bit overestimation of ages 5-7 and then
underestimation of older ages regarding the modal age. Readers 9 and specially reader
16 showed overestimation of all ages regarding the modal age. Last, readers 11, 12 and
13 showed underestimations of most ages regarding the modal age. As the overall
agreement between readers is lower with older ages, the standard deviations are also
mostly higher for the older ages for all readers combined (Annex 7.2, Figure
7.2.1.3).Similar trends are shown for Experts and Trainees separately (Annex 7.2, Fig-
ures 7.2.2.1, 7.2.2.2, 7.2.3.1 and 7.2.3.2). This trend is shown also by component, with a
few differences. For example, for the Southern component, reader 1 showed over esti-
mation in most ages regarding the modal age. Also, reader 6 showed a more marked
underestimation of older ages regarding the modal age (Annex 7.2, Figure 7.2.4.2).
4. Discussion.
The exchange was carried out using the SmartDots application, which made the whole
exchange process quite easy. As this is a new application, for most readers this was the
first time using the program but once all readers became familiar with the use of the
tool it proved to be very beneficial, though some readers did not know how to use all
the applications within the software, such as the selection of brightness of the otolith
images, which would have helped in the age estimation. Also, the exclusive use of im-
ages has the disadvantage that the readers find it difficult to identify the nature of the
otolith edge, which can make the age interpretation problematic, in some cases. In ad-
dition, the use of a standardized reading line for all readers in each otolith image,
makes the comparison between readings easier, it can complicate marking the annuli
on the otolith when they are better observed in another area of the otolith. However,
the use of images allows a better comparison between the readers’ estimations and a
better identification of the problems in locating false rings, as well as speeding up the
process. The use of SmartDots is especially useful for a posterior discussion on screen
of the most significant otoliths during the workshop.
Average percentage of agreement (59.4%) and CV (37.3%) for all components and all
readers is far from satisfactory. The results of the Expert readers were better than the
results of all readers (65.2% of agreement, 17.6% CV), whereas the results of the Trainee
readers were slightly worse than the results of all readers (56.5% of agreement, 36.4%
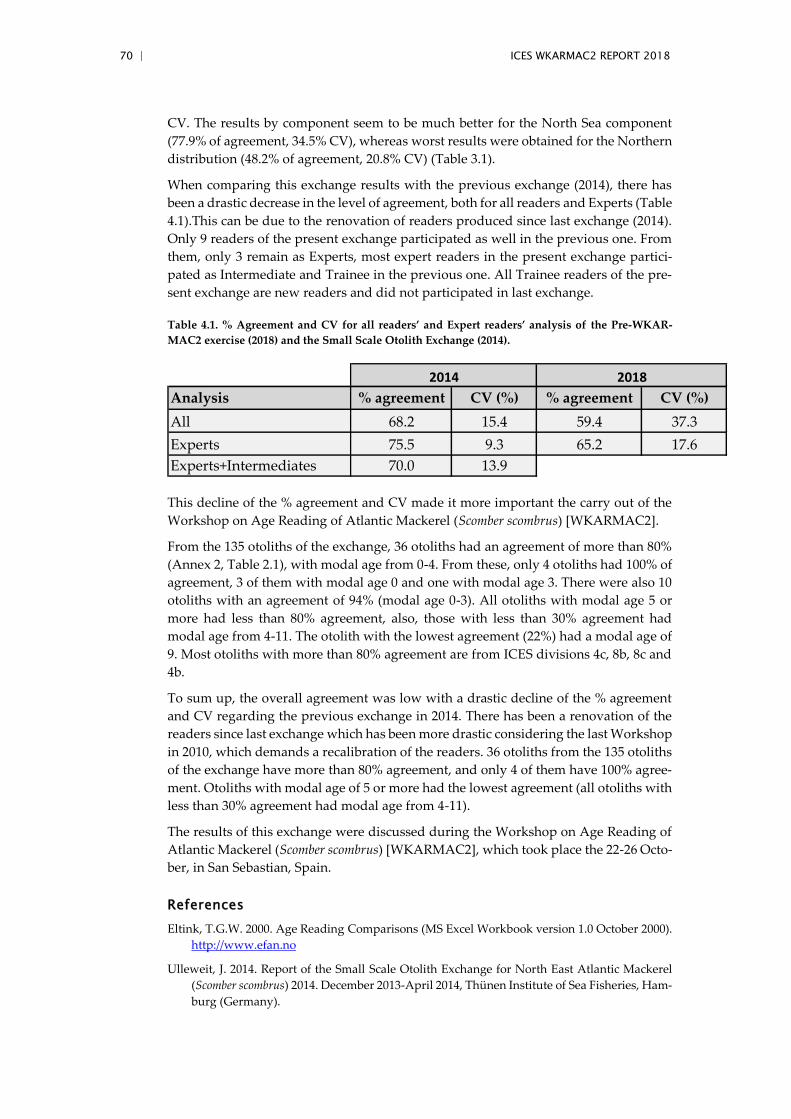
70 | ICES WKARMAC2 REPORT 2018
CV. The results by component seem to be much better for the North Sea component
(77.9% of agreement, 34.5% CV), whereas worst results were obtained for the Northern
distribution (48.2% of agreement, 20.8% CV) (Table 3.1).
When comparing this exchange results with the previous exchange (2014), there has
been a drastic decrease in the level of agreement, both for all readers and Experts (Table
4.1).This can be due to the renovation of readers produced since last exchange (2014).
Only 9 readers of the present exchange participated as well in the previous one. From
them, only 3 remain as Experts, most expert readers in the present exchange partici-
pated as Intermediate and Trainee in the previous one. All Trainee readers of the pre-
sent exchange are new readers and did not participated in last exchange.
Table 4.1. % Agreement and CV for all readers’ and Expert readers’ analysis of the Pre-WKAR-
MAC2 exercise (2018) and the Small Scale Otolith Exchange (2014).
This decline of the % agreement and CV made it more important the carry out of the
Workshop on Age Reading of Atlantic Mackerel (Scomber scombrus) [WKARMAC2].
From the 135 otoliths of the exchange, 36 otoliths had an agreement of more than 80%
(Annex 2, Table 2.1), with modal age from 0-4. From these, only 4 otoliths had 100% of
agreement, 3 of them with modal age 0 and one with modal age 3. There were also 10
otoliths with an agreement of 94% (modal age 0-3). All otoliths with modal age 5 or
more had less than 80% agreement, also, those with less than 30% agreement had
modal age from 4-11. The otolith with the lowest agreement (22%) had a modal age of
9. Most otoliths with more than 80% agreement are from ICES divisions 4c, 8b, 8c and
4b.
To sum up, the overall agreement was low with a drastic decline of the % agreement
and CV regarding the previous exchange in 2014. There has been a renovation of the
readers since last exchange which has been more drastic considering the last Workshop
in 2010, which demands a recalibration of the readers. 36 otoliths from the 135 otoliths
of the exchange have more than 80% agreement, and only 4 of them have 100% agree-
ment. Otoliths with modal age of 5 or more had the lowest agreement (all otoliths with
less than 30% agreement had modal age from 4-11).
The results of this exchange were discussed during the Workshop on Age Reading of
Atlantic Mackerel (Scomber scombrus) [WKARMAC2], which took place the 22-26 Octo-
ber, in San Sebastian, Spain.
References
Eltink, T.G.W. 2000. Age Reading Comparisons (MS Excel Workbook version 1.0 October 2000).
http://www.efan.no
Ulleweit, J. 2014. Report of the Small Scale Otolith Exchange for North East Atlantic Mackerel
(Scomber scombrus) 2014. December 2013-April 2014, Thünen Institute of Sea Fisheries, Ham-
burg (Germany).
Analysis % agreement CV (%) % agreement CV (%)
All 68.2 15.4 59.4 37.3
Experts 75.5 9.3 65.2 17.6
Experts+Intermediates 70.0 13.9
2014 2018
ICES WKARMAC2 REPORT 2018 | 71
71
ICES, 2011. Report of the Workshop of National Age Readings Coordinators (WKNARC). ICES
CM 2011/ACOM:45.
ICES, 2015. Report of the Working Group on Biological Parameters (WGBIOP). ICES CM
2015/SSGIEOM: 08.
ICES, 2017. Report of the Working Group on Biological Parameters (WGBIOP). ICES CM
2017/SSGIEOM: 08.
ICES, 2018. Report of the Workshop on Mackerel biological parameter Quality Indicators
(WKMACQI). ICES CM 2018/EOSG 34
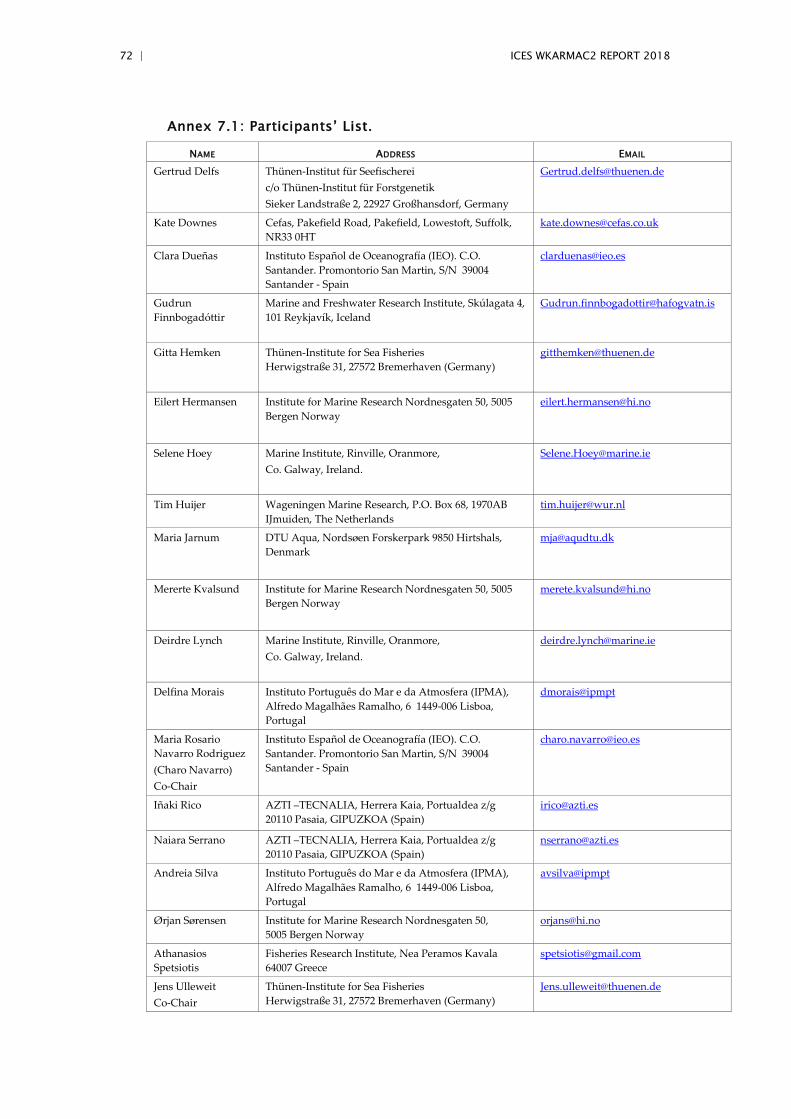
72 | ICES WKARMAC2 REPORT 2018
Annex 7.1: Participants’ List.
NAME ADDRESS EMAIL
Gertrud Delfs
Thünen-Institut für Seefischerei
c/o Thünen-Institut für Forstgenetik
Sieker Landstraße 2, 22927 Großhansdorf, Germany
Kate Downes Cefas, Pakefield Road, Pakefield, Lowestoft, Suffolk,
NR33 0HT
Clara Dueñas Instituto Español de Oceanografía (IEO). C.O.
Santander. Promontorio San Martin, S/N 39004
Santander - Spain
Gudrun
Finnbogadóttir
Marine and Freshwater Research Institute, Skúlagata 4,
101 Reykjavík, Iceland
Gitta Hemken
Thünen-Institute for Sea Fisheries
Herwigstraße 31, 27572 Bremerhaven (Germany)
Eilert Hermansen
Institute for Marine Research Nordnesgaten 50, 5005
Bergen Norway
Selene Hoey
Marine Institute, Rinville, Oranmore,
Co. Galway, Ireland.
Tim Huijer Wageningen Marine Research, P.O. Box 68, 1970AB
IJmuiden, The Netherlands
Maria Jarnum
DTU Aqua, Nordsøen Forskerpark 9850 Hirtshals,
Denmark
Mererte Kvalsund
Institute for Marine Research Nordnesgaten 50, 5005
Bergen Norway
Deirdre Lynch
Marine Institute, Rinville, Oranmore,
Co. Galway, Ireland.
Delfina Morais Instituto Português do Mar e da Atmosfera (IPMA),
Alfredo Magalhães Ramalho, 6 1449-006 Lisboa,
Portugal
dmorais@ipmpt
Maria Rosario
Navarro Rodriguez
(Charo Navarro)
Co-Chair
Instituto Español de Oceanografía (IEO). C.O.
Santander. Promontorio San Martin, S/N 39004
Santander - Spain
Iñaki Rico
AZTI –TECNALIA, Herrera Kaia, Portualdea z/g
20110 Pasaia, GIPUZKOA (Spain)
Naiara Serrano AZTI –TECNALIA, Herrera Kaia, Portualdea z/g
20110 Pasaia, GIPUZKOA (Spain)
Andreia Silva Instituto Português do Mar e da Atmosfera (IPMA),
Alfredo Magalhães Ramalho, 6 1449-006 Lisboa,
Portugal
avsilva@ipmpt
Ørjan Sørensen Institute for Marine Research Nordnesgaten 50,
5005 Bergen Norway
Athanasios
Spetsiotis
Fisheries Research Institute, Nea Peramos Kavala
64007 Greece
Jens Ulleweit
Co-Chair
Thünen-Institute for Sea Fisheries
Herwigstraße 31, 27572 Bremerhaven (Germany)
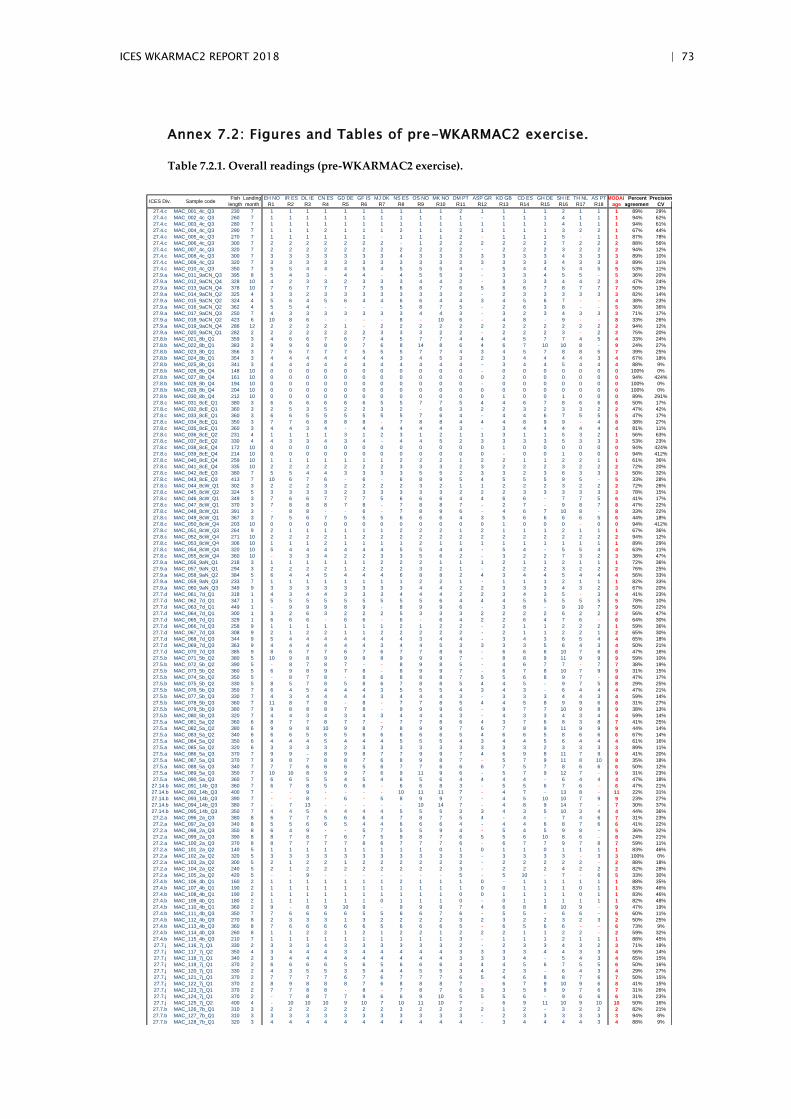
ICES WKARMAC2 REPORT 2018 | 73
Annex 7.2: Figures and Tables of pre-WKARMAC2 exercise.
Table 7.2.1. Overall readings (pre-WKARMAC2 exercise).
Fish Landing EH NO IR ES DL IE CN ES GD DE GF IS MJ DK NS ES OS NO MK NO DM PT ASP GR KD GB CD ES GH DE SH IE TH NL AS PT MODAL Percent Precision
length month R1 R2 R3 R4 R5 R6 R7 R8 R9 R10 R11 R12 R13 R14 R15 R16 R17 R18 age agreement CV
27.4.c MAC_001_4c_Q3 230 7 1 1 1 1 1 1 1 1 1 1 2 1 1 1 1 2 1 1 1 89% 29%
27.4.c MAC_002_4c_Q3 260 7 1 1 1 1 1 1 1 1 1 1 1 - 1 1 1 4 1 1 1 94% 62%
27.4.c MAC_003_4c_Q3 280 7 1 1 1 1 1 1 1 1 1 1 1 1 1 1 1 4 1 1 1 94% 61%
27.4.c MAC_004_4c_Q3 290 7 1 1 1 2 1 1 1 2 1 1 2 1 1 1 1 3 2 2 1 67% 44%
27.4.c MAC_005_4c_Q3 270 7 1 1 1 1 1 1 - 1 1 1 2 - 1 1 1 5 - 1 1 87% 78%
27.4.c MAC_006_4c_Q3 300 7 2 2 2 2 2 2 2 - 1 2 2 2 2 2 2 7 2 2 2 88% 56%
27.4.c MAC_007_4c_Q3 320 7 2 2 2 2 2 2 2 2 2 2 2 - 2 2 2 3 2 2 2 94% 12%
27.4.c MAC_008_4c_Q3 300 7 3 3 3 3 3 3 3 4 3 3 3 3 3 3 3 4 3 3 3 89% 10%
27.4.c MAC_009_4c_Q3 320 7 3 3 3 3 3 3 3 3 3 3 2 3 3 3 3 4 3 3 3 89% 11%
27.4.c MAC_010_4c_Q3 350 7 5 5 4 4 4 5 4 5 5 5 4 - 5 4 4 5 4 5 5 53% 11%
27.9.a MAC_011_9aCN_Q3 395 8 5 4 3 - 4 4 - 4 5 5 3 - 3 3 4 5 5 - 5 36% 20%
27.9.a MAC_012_9aCN_Q4 328 10 4 2 3 3 2 3 3 3 4 4 2 - 3 3 3 4 4 2 3 47% 24%
27.9.a MAC_013_9aCN_Q4 378 10 7 6 7 7 7 7 5 6 8 7 6 5 6 6 7 8 7 7 7 50% 13%
27.9.a MAC_014_9aCN_Q2 325 4 3 3 2 3 3 3 3 3 3 3 2 - 2 3 3 3 3 3 3 82% 14%
27.9.a MAC_015_9aCN_Q2 324 4 5 6 4 5 6 4 4 6 6 4 4 3 4 5 6 7 - - 4 38% 23%
27.9.a MAC_016_9aCN_Q2 362 4 5 5 4 - - - - 5 8 7 5 - 2 6 3 8 - - 5 36% 36%
27.9.a MAC_017_9aCN_Q3 250 7 4 3 3 3 3 3 3 3 4 4 3 - 3 2 3 4 3 3 3 71% 17%
27.9.a MAC_018_9aCN_Q2 423 6 10 8 6 - - - - 8 - 10 6 - 4 8 - 9 - - 8 33% 26%
27.9.a MAC_019_9aCN_Q4 286 12 2 2 2 2 1 - 2 2 2 2 2 2 2 2 2 2 2 2 2 94% 12%
27.9.a MAC_020_9aCN_Q1 282 2 2 2 2 2 2 2 3 3 3 2 2 - 2 2 2 3 - 2 2 75% 20%
27.8.b MAC_021_8b_Q1 359 3 4 6 6 7 6 7 4 5 7 7 4 4 4 5 7 7 4 5 4 33% 24%
27.8.b MAC_022_8b_Q1 383 3 9 9 9 8 9 7 6 8 14 8 6 4 6 7 10 10 8 - 9 24% 27%
27.8.b MAC_023_8b_Q1 356 3 7 6 7 7 7 5 5 5 7 7 4 3 4 5 7 8 8 5 7 39% 25%
27.8.b MAC_024_8b_Q1 354 3 4 4 4 4 4 4 4 3 4 5 3 2 3 4 4 4 4 3 4 67% 18%
27.8.b MAC_025_8b_Q1 341 3 4 4 4 4 4 4 4 4 4 4 4 - 3 4 4 5 4 4 4 88% 9%
27.8.b MAC_026_8b_Q4 148 10 0 0 0 0 0 0 0 0 0 0 0 - 0 0 0 0 0 0 0 100% 0%
27.8.b MAC_027_8b_Q4 161 10 0 0 0 0 0 0 0 0 0 0 0 0 2 0 0 0 0 0 0 94% 424%
27.8.b MAC_028_8b_Q4 194 10 0 0 0 0 0 0 0 0 0 0 0 - 0 0 0 0 0 0 0 100% 0%
27.8.b MAC_029_8b_Q4 204 10 0 0 0 0 0 0 0 0 0 0 0 0 0 0 0 0 0 0 0 100% 0%
27.8.b MAC_030_8b_Q4 212 10 0 0 0 0 0 0 0 0 0 0 0 0 1 0 0 1 0 0 0 89% 291%
27.8.c MAC_031_8cE_Q1 380 3 6 6 6 6 6 6 5 5 7 7 5 4 4 6 7 8 6 6 6 50% 17%
27.8.c MAC_032_8cE_Q1 360 3 2 5 3 5 2 2 3 2 - 6 3 2 2 3 2 3 3 2 2 47% 42%
27.8.c MAC_033_8cE_Q1 360 3 6 6 5 5 5 5 5 5 7 6 4 - 4 4 6 7 5 5 5 47% 17%
27.8.c MAC_034_8cE_Q1 350 3 7 7 6 8 8 8 - 7 8 8 4 4 4 8 9 9 - 4 8 38% 27%
27.8.c MAC_035_8cE_Q1 360 3 4 4 3 4 - 4 4 4 4 4 3 - 3 4 4 4 4 4 4 81% 11%
27.8.c MAC_036_8cE_Q2 231 4 1 1 1 1 3 1 2 3 1 2 1 1 3 1 1 5 3 2 1 56% 63%
27.8.c MAC_037_8cE_Q2 330 4 4 3 3 4 3 4 - 4 4 5 2 3 3 3 3 5 3 3 3 53% 23%
27.8.c MAC_038_8cE_Q4 172 10 0 0 0 0 0 0 0 0 0 0 0 0 1 0 0 0 0 0 0 94% 424%
27.8.c MAC_039_8cE_Q4 214 10 0 0 0 0 0 0 0 0 0 0 0 0 - 0 0 1 0 0 0 94% 412%
27.8.c MAC_040_8cE_Q4 259 10 1 1 1 1 1 1 1 2 2 2 1 2 2 1 1 2 2 1 1 61% 36%
27.8.c MAC_041_8cE_Q4 335 10 2 2 2 2 2 2 2 3 3 3 2 3 2 2 2 3 2 2 2 72% 20%
27.8.c MAC_042_8cE_Q3 380 7 5 5 4 4 3 3 3 3 5 5 2 3 3 2 3 6 3 3 3 50% 32%
27.8.c MAC_043_8cE_Q3 413 7 10 6 7 6 - 6 - 6 8 9 5 4 5 5 5 9 5 - 5 33% 28%
27.8.c MAC_044_8cW_Q1 302 3 2 2 2 3 2 2 2 2 3 2 1 1 2 2 2 3 2 2 2 72% 26%
27.8.c MAC_045_8cW_Q2 324 5 3 3 3 3 2 3 3 3 3 3 2 2 2 3 3 3 3 3 3 78% 15%
27.8.c MAC_046_8cW_Q1 349 3 7 6 6 7 7 7 5 6 6 6 4 4 6 6 - 7 7 5 6 41% 17%
27.8.c MAC_047_8cW_Q1 370 3 7 8 8 8 7 8 - 7 8 8 7 - 2 7 - 9 8 7 8 47% 22%
27.8.c MAC_048_8cW_Q1 391 3 - 8 8 - - 6 - 7 8 9 6 - 4 6 7 10 8 - 8 33% 22%
27.8.c MAC_049_8cW_Q1 367 3 7 5 6 7 5 5 5 6 6 6 4 3 5 6 6 6 6 5 6 44% 18%
27.8.c MAC_050_8cW_Q4 203 10 0 0 0 0 0 0 0 0 0 0 0 0 1 0 0 0 - 0 0 94% 412%
27.8.c MAC_051_8cW_Q3 264 9 2 1 1 1 1 1 1 2 2 2 1 2 1 1 1 2 1 1 1 67% 36%
27.8.c MAC_052_8cW_Q4 271 10 2 2 2 2 1 2 2 2 2 2 2 2 2 2 2 2 2 2 2 94% 12%
27.8.c MAC_053_8cW_Q4 306 10 1 1 1 2 1 1 1 1 2 1 1 1 1 1 1 1 1 1 1 89% 29%
27.8.c MAC_054_8cW_Q4 320 10 5 4 4 4 4 4 4 5 5 4 4 - 5 4 - 5 5 4 4 63% 11%
27.8.c MAC_055_8cW_Q4 360 10 - 3 3 4 2 2 3 3 5 6 2 - 3 2 2 7 3 2 3 38% 47%
27.9.a MAC_056_9aN_Q1 218 3 1 1 1 1 1 1 2 2 2 1 1 1 2 1 1 2 1 1 1 72% 36%
27.9.a MAC_057_9aN_Q1 294 3 2 2 2 2 1 2 2 2 3 2 1 - 2 2 2 3 2 2 2 76% 25%
27.9.a MAC_058_9aN_Q2 384 5 6 4 4 5 4 4 4 6 8 8 2 4 3 4 4 5 4 4 4 56% 33%
27.9.a MAC_059_9aN_Q3 233 7 1 1 1 1 1 1 1 1 2 2 1 - 1 1 1 2 1 1 1 82% 33%
27.9.a MAC_060_9aN_Q3 349 9 3 3 3 3 3 3 3 3 4 4 2 2 3 3 3 4 3 2 3 67% 20%
27.7.d MAC_061_7d_Q1 318 1 4 3 4 4 3 3 3 4 4 4 2 2 3 4 3 5 - 3 4 41% 23%
27.7.d MAC_062_7d_Q1 347 1 5 5 5 5 5 5 5 5 5 6 4 4 4 5 5 5 5 5 5 78% 10%
27.7.d MAC_063_7d_Q1 449 1 - 9 9 9 8 9 - 8 9 9 6 - 3 8 - 9 10 7 9 50% 22%
27.7.d MAC_064_7d_Q1 300 1 3 2 6 3 2 2 2 5 3 3 3 2 2 2 2 6 2 2 2 56% 47%
27.7.d MAC_065_7d_Q1 329 1 6 6 6 - 6 6 - 6 - 6 4 2 2 6 4 7 6 - 6 64% 30%
27.7.d MAC_066_7d_Q3 258 9 1 1 1 1 1 1 1 2 1 2 2 - 2 1 1 2 2 2 1 59% 36%
27.7.d MAC_067_7d_Q3 308 9 2 1 2 2 1 1 2 2 2 2 2 - 2 1 1 2 2 1 2 65% 30%
27.7.d MAC_068_7d_Q3 344 9 5 4 4 4 4 4 4 4 3 4 4 - 3 4 3 6 5 4 4 65% 18%
27.7.d MAC_069_7d_Q3 363 9 4 4 4 4 4 4 3 4 4 5 3 3 3 3 5 6 4 3 4 50% 21%
27.7.d MAC_070_7d_Q3 385 9 8 6 7 7 6 7 6 7 7 8 6 - 6 6 6 10 7 6 6 47% 16%
27.5.b MAC_071_5b_Q2 380 5 10 9 8 9 9 9 8 9 9 9 7 - 8 8 9 11 9 9 9 59% 10%
27.5.b MAC_072_5b_Q2 390 5 - 8 7 8 7 - - 8 9 8 5 - 4 6 7 7 - 7 7 38% 19%
27.5.b MAC_073_5b_Q2 360 5 6 9 8 9 7 8 - 8 9 9 7 - 6 7 8 10 7 9 9 31% 15%
27.5.b MAC_074_5b_Q2 350 5 - 8 7 8 - 8 6 8 8 8 7 5 5 6 8 9 7 - 8 47% 17%
27.5.b MAC_075_5b_Q2 330 5 8 5 7 8 5 8 6 7 8 8 5 4 4 5 - 9 7 5 8 29% 25%
27.5.b MAC_076_5b_Q3 350 7 6 4 5 4 4 4 3 5 5 5 4 3 4 3 - 6 4 4 4 47% 21%
27.5.b MAC_077_5b_Q3 330 7 4 3 4 4 4 4 3 4 4 4 3 - 3 3 3 4 4 3 4 59% 14%
27.5.b MAC_078_5b_Q3 360 7 11 8 7 8 - 8 - 7 7 8 5 4 4 5 8 9 9 6 8 31% 27%
27.5.b MAC_079_5b_Q3 380 7 9 8 8 8 7 8 - 9 9 9 6 - 9 7 7 10 9 8 9 38% 13%
27.5.b MAC_080_5b_Q3 320 7 4 4 3 4 3 4 3 4 4 4 3 - 4 3 3 4 3 4 4 59% 14%
27.5.a MAC_081_5a_Q2 360 6 8 7 7 8 7 7 - 7 7 8 6 4 3 7 6 8 3 8 7 41% 25%
27.5.a MAC_082_5a_Q2 380 6 9 9 8 10 9 8 7 8 9 9 7 6 7 8 9 11 9 9 9 44% 14%
27.5.a MAC_083_5a_Q2 340 6 6 6 5 6 5 6 6 6 6 6 5 4 6 6 5 8 6 6 6 67% 14%
27.5.a MAC_084_5a_Q2 350 6 4 4 4 5 4 4 4 5 5 5 4 3 4 4 5 6 4 4 4 61% 16%
27.5.a MAC_085_5a_Q2 320 6 3 3 3 3 2 3 3 3 3 3 3 3 3 3 2 3 3 3 3 89% 11%
27.5.a MAC_086_5a_Q3 370 7 9 9 - 8 9 8 7 7 9 9 7 4 6 9 8 11 7 9 9 41% 20%
27.5.a MAC_087_5a_Q3 370 7 9 8 7 8 8 7 6 8 9 8 7 - 5 7 9 11 8 10 8 35% 18%
27.5.a MAC_088_5a_Q3 340 7 7 7 6 6 6 5 6 7 7 6 6 6 7 5 7 8 6 6 6 50% 12%
27.5.a MAC_089_5a_Q3 350 7 10 10 8 9 9 7 6 9 11 9 6 - 5 7 9 12 7 - 9 31% 23%
27.5.a MAC_090_5a_Q3 360 7 6 6 5 5 4 5 4 6 5 6 4 4 4 4 - 6 4 4 4 47% 18%
27.14.b MAC_091_14b_Q3 360 7 6 7 8 5 6 6 - 6 6 8 3 - 5 5 6 7 6 - 6 47% 21%
27.14.b MAC_092_14b_Q3 400 7 - - 9 - - - - 10 11 11 7 - 4 7 - 13 8 - 11 22% 31%
27.14.b MAC_093_14b_Q3 390 7 - - 8 - 6 - 5 8 9 9 7 - 4 5 10 10 7 9 9 23% 27%
27.14.b MAC_094_14b_Q3 380 7 - 7 13 - - - - - 10 14 7 - 4 8 9 14 7 - 7 30% 37%
27.14.b MAC_095_14b_Q3 350 7 4 4 5 4 4 4 4 5 5 5 3 3 4 3 5 10 3 4 4 44% 36%
27.2.a MAC_096_2a_Q3 380 8 6 7 7 5 6 6 4 7 8 7 5 4 - 4 - 7 4 6 7 31% 23%
27.2.a MAC_097_2a_Q3 340 8 5 5 6 6 5 4 4 6 6 6 4 - 4 4 6 8 7 6 6 41% 22%
27.2.a MAC_098_2a_Q3 350 8 6 4 9 - - 5 7 5 5 9 4 - 5 4 5 9 8 - 5 36% 32%
27.2.a MAC_099_2a_Q3 390 8 8 7 8 7 6 7 5 9 8 7 6 5 5 6 10 8 6 - 8 24% 21%
27.2.a MAC_100_2a_Q3 370 8 8 7 7 7 7 8 6 7 7 7 6 - 6 7 7 9 7 8 7 59% 11%
27.2.a MAC_101_2a_Q2 140 5 1 1 1 1 1 1 1 1 1 0 1 0 1 1 0 1 1 1 1 83% 46%
27.2.a MAC_102_2a_Q2 320 5 3 3 3 3 3 3 3 3 3 3 3 - 3 3 3 3 - 3 3 100% 0%
27.2.a MAC_103_2a_Q2 300 5 2 1 2 2 1 2 2 2 2 2 2 - 2 2 2 2 2 - 2 88% 18%
27.2.a MAC_104_2a_Q2 240 5 2 1 2 2 2 2 2 2 2 2 3 - 2 2 2 4 2 2 2 82% 28%
27.2.a MAC_105_2a_Q2 420 5 - - 9 - - - - - - - 5 - 5 10 - 7 - 6 5 33% 30%
27.4.b MAC_106_4b_Q1 160 2 1 1 1 1 1 1 1 2 1 1 1 0 - 1 1 1 1 1 1 88% 35%
27.4.b MAC_107_4b_Q1 190 2 1 1 1 1 1 1 1 1 1 1 1 0 0 1 1 1 0 1 1 83% 46%
27.4.b MAC_108_4b_Q1 190 2 1 1 1 1 1 1 1 1 1 1 0 0 1 1 1 1 0 1 1 83% 46%
27.4.b MAC_109_4b_Q1 180 2 1 1 1 1 1 1 0 1 1 1 0 - 0 1 1 1 1 1 1 82% 48%
27.4.b MAC_110_4b_Q1 360 2 9 - 8 9 10 9 - 9 9 9 7 4 6 8 8 10 9 - 9 47% 19%
27.4.b MAC_111_4b_Q3 350 7 7 6 6 6 6 5 5 6 6 7 6 - 5 5 - 6 6 - 6 60% 11%
27.4.b MAC_112_4b_Q3 270 8 2 3 3 3 1 3 2 2 2 2 3 2 3 2 2 3 2 3 2 50% 25%
27.4.b MAC_113_4b_Q3 360 8 7 6 6 6 6 6 5 6 6 6 5 - 6 5 6 6 - - 6 73% 9%
27.4.b MAC_114_4b_Q3 260 8 1 1 2 2 1 2 1 2 2 1 2 2 2 1 1 2 2 - 2 59% 32%
27.4.b MAC_115_4b_Q3 210 7 1 1 1 1 1 1 1 1 1 1 3 - 1 1 1 2 1 1 1 88% 45%
27.7.j MAC_116_7j_Q1 330 2 3 3 3 4 3 3 3 3 3 3 2 - 2 3 3 4 3 2 3 71% 19%
27.7.j MAC_117_7j_Q2 350 4 3 4 4 4 3 4 4 4 4 4 3 3 3 3 4 4 3 3 4 56% 14%
27.7.j MAC_118_7j_Q1 340 2 3 4 4 4 4 4 4 4 4 4 3 3 3 4 - 5 4 3 4 65% 15%
27.7.j MAC_119_7j_Q1 370 2 6 6 6 6 5 6 5 6 6 6 4 4 4 5 6 7 5 5 6 50% 16%
27.7.j MAC_120_7j_Q1 330 2 4 3 5 5 3 5 4 4 5 5 3 4 2 3 - 6 4 3 4 29% 27%
27.7.j MAC_121_7j_Q1 370 2 7 7 7 7 6 7 6 7 7 7 6 5 4 6 8 8 7 6 7 50% 15%
27.7.j MAC_122_7j_Q1 370 2 8 9 8 8 8 7 6 8 8 8 7 - 6 7 9 10 9 6 8 41% 15%
27.7.j MAC_123_7j_Q1 370 2 7 7 8 8 - 8 - 7 8 7 6 3 3 5 8 9 7 6 7 31% 26%
27.7.j MAC_124_7j_Q1 370 2 - 7 8 7 7 9 6 6 9 10 5 5 5 6 - 9 6 6 6 31% 23%
27.7.j MAC_125_7j_Q2 400 4 - 10 10 10 9 10 7 10 11 10 7 - 6 9 11 10 9 10 10 50% 16%
27.7.b MAC_126_7b_Q1 310 3 2 2 2 2 2 2 2 3 2 2 2 2 1 2 - 3 2 2 2 82% 21%
27.7.b MAC_127_7b_Q1 310 3 3 3 3 3 3 3 3 3 3 3 3 - 2 3 3 3 3 3 3 94% 8%
27.7.b MAC_128_7b_Q1 320 3 4 4 4 4 4 4 4 4 4 4 4 - 3 4 4 4 4 3 4 88% 9%
ICES Div. Sample code

74 | ICES WKARMAC2 REPORT 2018
7.2.1. All readers’ analysis.
Table 7.2.1.1. Summary of the average percentage of agreement, CV and relative bias by age for all
readers (pre-WKARMAC2 exercise).
Table 7.2.1.2. Inter-reader bias test and reader against modal age bias test (pre-WKARMAC2 exer-
cise; all readers’ analysis).
Modal Age Otolith No %Agreement CV Bias
0 8 96 - 0.05
1 18 79 45.0 0.18
2 16 75 26.8 0.15
3 14 73 18.0 0.07
4 21 56 19.2 0.18
5 10 50 21.6 0.15
6 13 51 17.3 -0.07
7 10 41 21.6 -0.28
8 13 34 21.6 -0.74
9 10 39 18.9 -0.81
10 1 50 16.0 -
11 1 22 31.0 -
Total 135 59.4 37.3 -0.05
EH NO IR ES DL IE CN ES GD DE GF IS MJ DK NS ES OS NO MK NO DM PT ASP GRKD GB CD ES GH DE SH IE TH NL AS PT
R1 R2 R3 R4 R5 R6 R7 R8 R9 R10 R11 R12 R13 R14 R15 R16 R17 R18
R1 EH NO * * * - * * * * * * - * * * * * * * * * * - * * * * * *
R2 IR ES * * - * * * - * * - * * * * * * * * * * * * - * * - * *
R3 DL IE * - * * * - * * - * * * * * * * * * * * * - * * - * *
R4 CN ES - * * * * * * * * - * * * * * * * * * * * * - * * * * * *
R5 GD DE * * * * * * * * - * * * * * * * * * * * * * * * * * * * * * -
R6 GF IS * * - - * * - * * * * * * * * * * * * * * * - * * - * *
R7 MJ DK * * * * * * * * * * * * * * * * * * - * * * - * * * * * * -
R8 NS ES - - - - * * * * * * * * * * * * * * * * * - * * - * *
R9 OS NO * * * * * * * * * * * * * * * - * * * * * * * * * * * * * * * *
R10 MK NO * * * * * * * * * * * * * * * - * * * * * * * * * * * * * * * *
R11 DM PT * * * * * * * * * * * * - * * * * * * * * * * * * * * * * * * *
R12 ASP GR * * * * * * * * * * * * * * * * * * * * * * * * * * * * * * * * * *
R13 KD GB * * * * * * * * * * * * * * * * * * * * * * * * * * * * * * * *
R14 CD ES * * * * * * * * * * * * - * * * * * * * * * * * * * * * * * * -
R15 GH DE - - - - * * - * * - * * * * * * * * * * * * * * - *
R16 SH IE * * * * * * * * * * * * * * * * * * * * * * * * * * * * * * * * * *
R17 TH NL * * - - * * * - * * - * * * * * * * * * * * * - * * -
R18 AS PT * * * * * * * * - * * - * * * * * * * * * * * * - * * * -
* * - - * * * * - * * - * * * * * * * * * * * * - * * - * *
- = no sign of bias (p>0.05) * = possibility of bias (0.01<p<0.05) * * = certainty of bias (p<0.01)
MODAL AGE
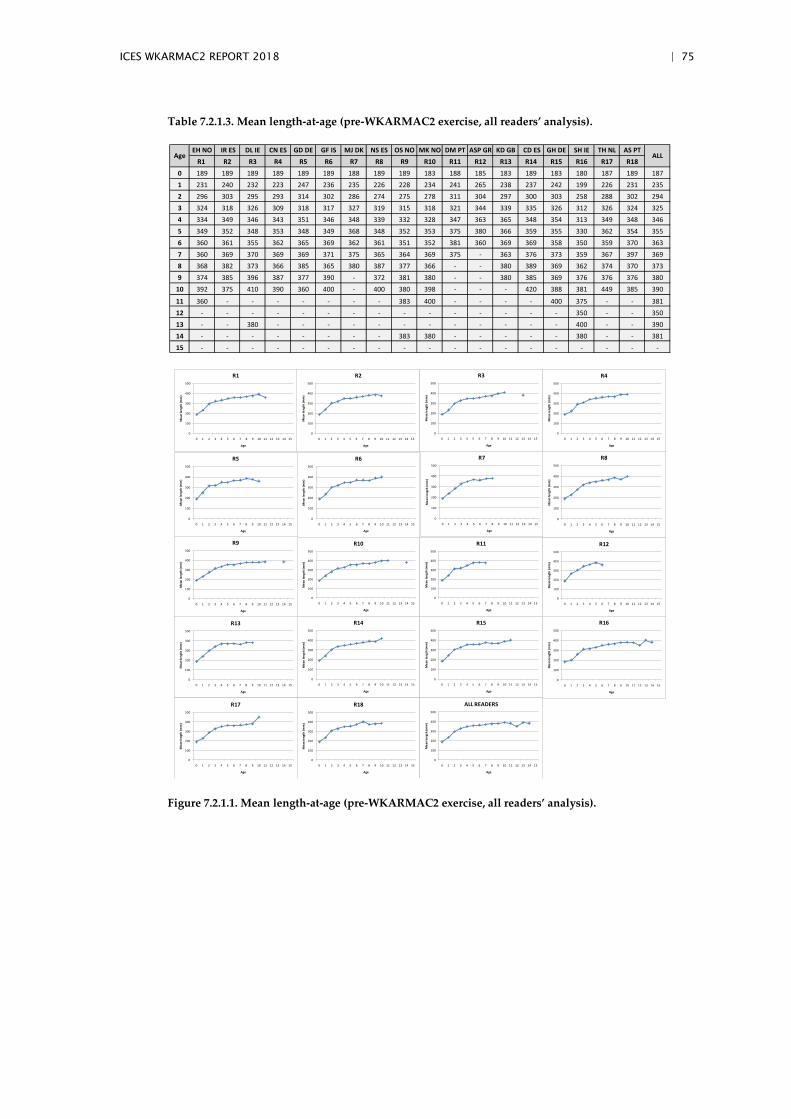
ICES WKARMAC2 REPORT 2018 | 75
Table 7.2.1.3. Mean length-at-age (pre-WKARMAC2 exercise, all readers’ analysis).
Figure 7.2.1.1. Mean length-at-age (pre-WKARMAC2 exercise, all readers’ analysis).
EH NO IR ES DL IE CN ES GD DE GF IS MJ DK NS ES OS NO MK NO DM PT ASP GR KD GB CD ES GH DE SH IE TH NL AS PT
R1 R2 R3 R4 R5 R6 R7 R8 R9 R10 R11 R12 R13 R14 R15 R16 R17 R18
0 189 189 189 189 189 189 188 189 189 183 188 185 183 189 183 180 187 189 187
1 231 240 232 223 247 236 235 226 228 234 241 265 238 237 242 199 226 231 235
2 296 303 295 293 314 302 286 274 275 278 311 304 297 300 303 258 288 302 294
3 324 318 326 309 318 317 327 319 315 318 321 344 339 335 326 312 326 324 325
4 334 349 346 343 351 346 348 339 332 328 347 363 365 348 354 313 349 348 346
5 349 352 348 353 348 349 368 348 352 353 375 380 366 359 355 330 362 354 355
6 360 361 355 362 365 369 362 361 351 352 381 360 369 369 358 350 359 370 363
7 360 369 370 369 369 371 375 365 364 369 375 - 363 376 373 359 367 397 369
8 368 382 373 366 385 365 380 387 377 366 - - 380 389 369 362 374 370 373
9 374 385 396 387 377 390 - 372 381 380 - - 380 385 369 376 376 376 380
10 392 375 410 390 360 400 - 400 380 398 - - - 420 388 381 449 385 390
11 360 - - - - - - - 383 400 - - - - 400 375 - - 381
12 - - - - - - - - - - - - - - - 350 - - 350
13 - - 380 - - - - - - - - - - - - 400 - - 390
14 - - - - - - - - 383 380 - - - - - 380 - - 381
15 - - - - - - - - - - - - - - - - - - -
Age ALL
0
100
200
300
400
500
0 1 2 3 4 5 6 7 8 9 10 11 12 13 14 15
Me
an le
ngt
h (
mm
)
Age
R1
0
100
200
300
400
500
0 1 2 3 4 5 6 7 8 9 10 11 12 13 14 15
Me
an le
ngt
h (
mm
)
Age
R2
0
100
200
300
400
500
0 1 2 3 4 5 6 7 8 9 10 11 12 13 14 15
Me
an le
ngt
h (
mm
)
Age
R3
0
100
200
300
400
500
0 1 2 3 4 5 6 7 8 9 10 11 12 13 14 15
Me
an le
ngt
h (
mm
)
Age
R4
0
100
200
300
400
500
0 1 2 3 4 5 6 7 8 9 10 11 12 13 14 15
Me
an le
ngt
h (
mm
)
Age
R5
0
100
200
300
400
500
0 1 2 3 4 5 6 7 8 9 10 11 12 13 14 15
Me
an le
ngt
h (
mm
)
Age
R6
0
100
200
300
400
500
0 1 2 3 4 5 6 7 8 9 10 11 12 13 14 15
Me
an le
ngt
h (
mm
)
Age
R7
0
100
200
300
400
500
0 1 2 3 4 5 6 7 8 9 10 11 12 13 14 15
Me
an le
ngt
h (
mm
)
Age
R8
0
100
200
300
400
500
0 1 2 3 4 5 6 7 8 9 10 11 12 13 14 15
Me
an le
ngt
h (
mm
)
Age
R9
0
100
200
300
400
500
0 1 2 3 4 5 6 7 8 9 10 11 12 13 14 15
Me
an le
ngt
h (
mm
)
Age
R10
0
100
200
300
400
500
0 1 2 3 4 5 6 7 8 9 10 11 12 13 14 15
Me
an le
ngt
h (
mm
)
Age
R11
0
100
200
300
400
500
0 1 2 3 4 5 6 7 8 9 10 11 12 13 14 15
Me
an le
ngt
h (
mm
)
Age
R12
0
100
200
300
400
500
0 1 2 3 4 5 6 7 8 9 10 11 12 13 14 15
Me
an le
ngt
h (
mm
)
Age
R13
0
100
200
300
400
500
0 1 2 3 4 5 6 7 8 9 10 11 12 13 14 15
Me
an le
ngt
h (
mm
)
Age
R14
0
100
200
300
400
500
0 1 2 3 4 5 6 7 8 9 10 11 12 13 14 15
Me
an le
ngt
h (
mm
)
Age
R15
0
100
200
300
400
500
0 1 2 3 4 5 6 7 8 9 10 11 12 13 14 15
Me
an le
ngt
h (
mm
)
Age
R16
0
100
200
300
400
500
0 1 2 3 4 5 6 7 8 9 10 11 12 13 14 15
Me
an le
ngt
h (
mm
)
Age
R17
0
100
200
300
400
500
0 1 2 3 4 5 6 7 8 9 10 11 12 13 14 15
Me
an le
ngt
h (
mm
)
Age
R18
0
100
200
300
400
500
0 1 2 3 4 5 6 7 8 9 10 11 12 13 14 15
Me
an le
ngt
h (
mm
)
Age
ALL READERS
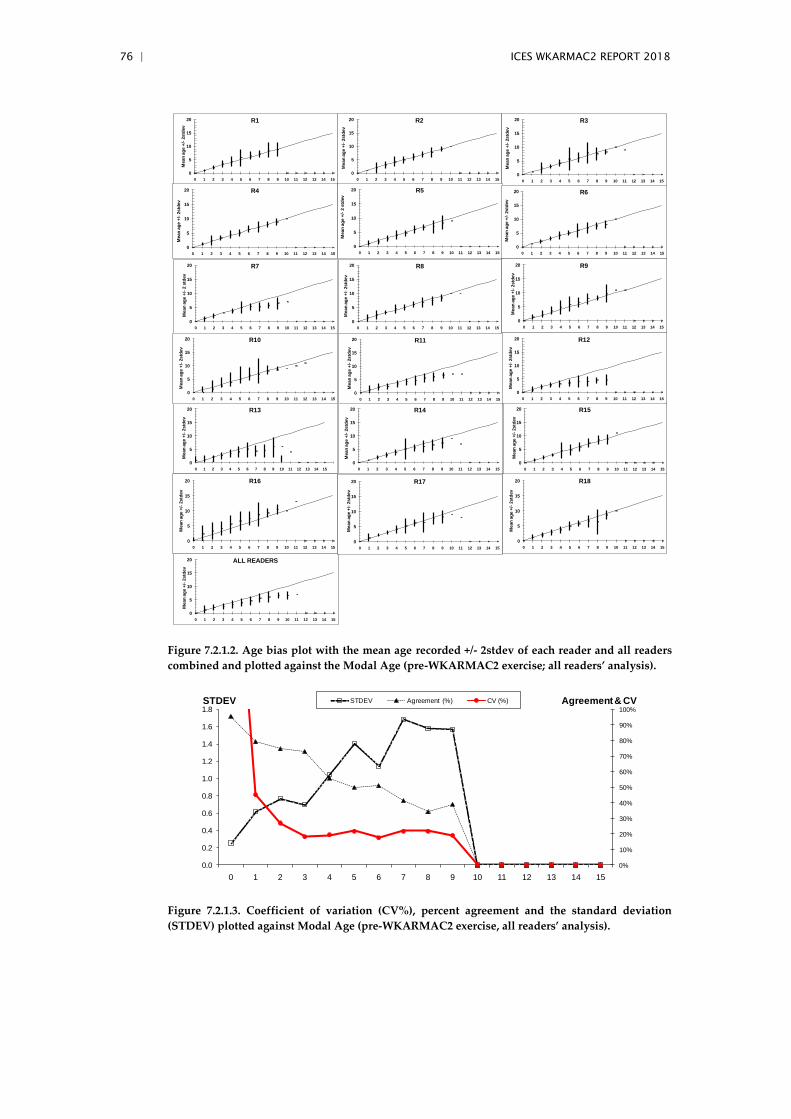
76 | ICES WKARMAC2 REPORT 2018
Figure 7.2.1.2. Age bias plot with the mean age recorded +/- 2stdev of each reader and all readers
combined and plotted against the Modal Age (pre-WKARMAC2 exercise; all readers’ analysis).
Figure 7.2.1.3. Coefficient of variation (CV%), percent agreement and the standard deviation
(STDEV) plotted against Modal Age (pre-WKARMAC2 exercise, all readers’ analysis).
0
5
10
15
20
0 1 2 3 4 5 6 7 8 9 10 11 12 13 14 15
Mean
ag
e +
/-2std
ev
ALL READERS
0
5
10
15
20
0 1 2 3 4 5 6 7 8 9 10 11 12 13 14 15M
ean
ag
e +
/-2std
ev
R1
0
5
10
15
20
0 1 2 3 4 5 6 7 8 9 10 11 12 13 14 15
Mean
ag
e +
/-2std
ev
R2
0
5
10
15
20
0 1 2 3 4 5 6 7 8 9 10 11 12 13 14 15
Mean
ag
e +
/-2std
ev
R3
0
5
10
15
20
0 1 2 3 4 5 6 7 8 9 10 11 12 13 14 15
Mean
ag
e +
/-2std
ev
R4
0
5
10
15
20
0 1 2 3 4 5 6 7 8 9 10 11 12 13 14 15
Mean
ag
e +
/-2 s
tdev
R5
0
5
10
15
20
0 1 2 3 4 5 6 7 8 9 10 11 12 13 14 15
Mean
ag
e +
/-2std
ev
R6
0
5
10
15
20
0 1 2 3 4 5 6 7 8 9 10 11 12 13 14 15
Mean
ag
e +
/-2 s
tdev
R7
0
5
10
15
20
0 1 2 3 4 5 6 7 8 9 10 11 12 13 14 15
Mean
ag
e +
/-2std
ev
R8
0
5
10
15
20
0 1 2 3 4 5 6 7 8 9 10 11 12 13 14 15
Mean
ag
e +
/-2std
ev
R9
0
5
10
15
20
0 1 2 3 4 5 6 7 8 9 10 11 12 13 14 15
Mean
ag
e +
/-2std
ev
R10
0
5
10
15
20
0 1 2 3 4 5 6 7 8 9 10 11 12 13 14 15
Mean
ag
e +
/-2std
ev
R11
0
5
10
15
20
0 1 2 3 4 5 6 7 8 9 10 11 12 13 14 15
Mean
ag
e +
/-2std
ev
R13
0
5
10
15
20
0 1 2 3 4 5 6 7 8 9 10 11 12 13 14 15
Mean
ag
e +
/-2std
ev
R15
0
5
10
15
20
0 1 2 3 4 5 6 7 8 9 10 11 12 13 14 15
Mean
ag
e +
/-2std
ev
R12
0
5
10
15
20
0 1 2 3 4 5 6 7 8 9 10 11 12 13 14 15
Mean
ag
e +
/-2std
ev
R14
0
5
10
15
20
0 1 2 3 4 5 6 7 8 9 10 11 12 13 14 15
Mean
ag
e +
/-2std
ev
R16
0
5
10
15
20
0 1 2 3 4 5 6 7 8 9 10 11 12 13 14 15
Mean
ag
e +
/-2std
ev
R17
0
5
10
15
20
0 1 2 3 4 5 6 7 8 9 10 11 12 13 14 15
Mean
ag
e +
/-2std
ev
R18
0%
10%
20%
30%
40%
50%
60%
70%
80%
90%
100%
0.0
0.2
0.4
0.6
0.8
1.0
1.2
1.4
1.6
1.8
0 1 2 3 4 5 6 7 8 9 10 11 12 13 14 15
STDEV Agreement (%) CV (%)STDEV Agreement & CV
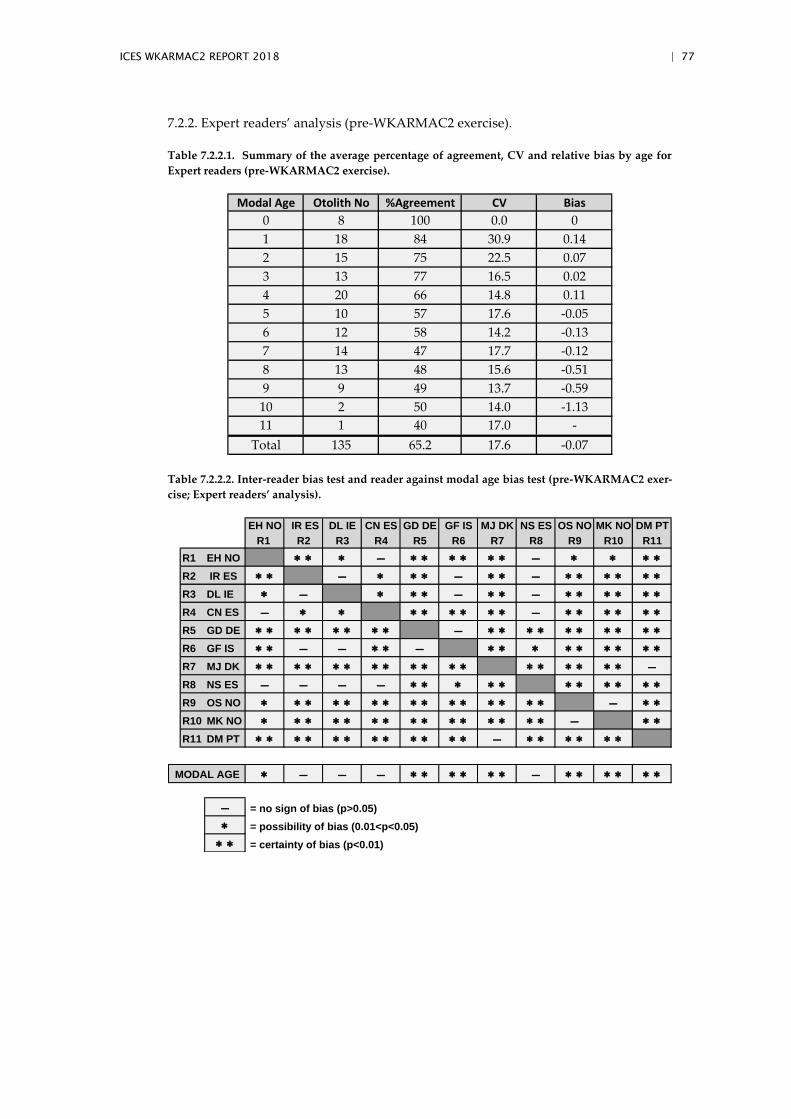
ICES WKARMAC2 REPORT 2018 | 77
7.2.2. Expert readers’ analysis (pre-WKARMAC2 exercise).
Table 7.2.2.1. Summary of the average percentage of agreement, CV and relative bias by age for
Expert readers (pre-WKARMAC2 exercise).
Table 7.2.2.2. Inter-reader bias test and reader against modal age bias test (pre-WKARMAC2 exer-
cise; Expert readers’ analysis).
Modal Age Otolith No %Agreement CV Bias
0 8 100 0.0 0
1 18 84 30.9 0.14
2 15 75 22.5 0.07
3 13 77 16.5 0.02
4 20 66 14.8 0.11
5 10 57 17.6 -0.05
6 12 58 14.2 -0.13
7 14 47 17.7 -0.12
8 13 48 15.6 -0.51
9 9 49 13.7 -0.59
10 2 50 14.0 -1.13
11 1 40 17.0 -
Total 135 65.2 17.6 -0.07
EH NO IR ES DL IE CN ES GD DE GF IS MJ DK NS ES OS NO MK NO DM PT
R1 R2 R3 R4 R5 R6 R7 R8 R9 R10 R11
R1 EH NO * * * - * * * * * * - * * * *
R2 IR ES * * - * * * - * * - * * * * * *
R3 DL IE * - * * * - * * - * * * * * *
R4 CN ES - * * * * * * * * - * * * * * *
R5 GD DE * * * * * * * * - * * * * * * * * * *
R6 GF IS * * - - * * - * * * * * * * * *
R7 MJ DK * * * * * * * * * * * * * * * * * * -
R8 NS ES - - - - * * * * * * * * * * *
R9 OS NO * * * * * * * * * * * * * * * - * *
R10 MK NO * * * * * * * * * * * * * * * - * *
R11 DM PT * * * * * * * * * * * * - * * * * * *
* - - - * * * * * * - * * * * * *
- = no sign of bias (p>0.05)
* = possibility of bias (0.01<p<0.05)
* * = certainty of bias (p<0.01)
MODAL AGE
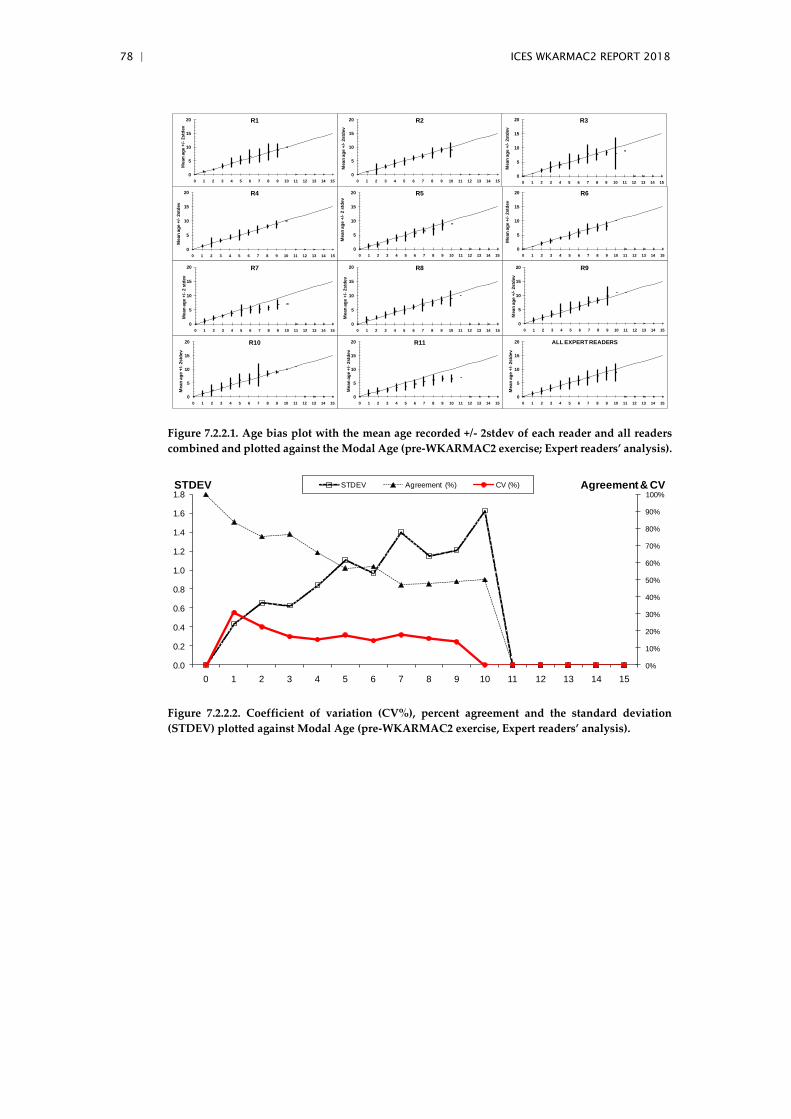
78 | ICES WKARMAC2 REPORT 2018
Figure 7.2.2.1. Age bias plot with the mean age recorded +/- 2stdev of each reader and all readers
combined and plotted against the Modal Age (pre-WKARMAC2 exercise; Expert readers’ analysis).
Figure 7.2.2.2. Coefficient of variation (CV%), percent agreement and the standard deviation
(STDEV) plotted against Modal Age (pre-WKARMAC2 exercise, Expert readers’ analysis).
0
5
10
15
20
0 1 2 3 4 5 6 7 8 9 10 11 12 13 14 15M
ean
ag
e +
/-2std
ev
R1
0
5
10
15
20
0 1 2 3 4 5 6 7 8 9 10 11 12 13 14 15
Mean
ag
e +
/-2std
ev
R2
0
5
10
15
20
0 1 2 3 4 5 6 7 8 9 10 11 12 13 14 15
Mean
ag
e +
/-2std
ev
R3
0
5
10
15
20
0 1 2 3 4 5 6 7 8 9 10 11 12 13 14 15
Mean
ag
e +
/-2std
ev
R4
0
5
10
15
20
0 1 2 3 4 5 6 7 8 9 10 11 12 13 14 15
Mean
ag
e +
/-2 s
tdev
R5
0
5
10
15
20
0 1 2 3 4 5 6 7 8 9 10 11 12 13 14 15
Mean
ag
e +
/-2std
ev
R6
0
5
10
15
20
0 1 2 3 4 5 6 7 8 9 10 11 12 13 14 15
Mean
ag
e +
/-2 s
tdev
R7
0
5
10
15
20
0 1 2 3 4 5 6 7 8 9 10 11 12 13 14 15
Mean
ag
e +
/-2std
ev
R8
0
5
10
15
20
0 1 2 3 4 5 6 7 8 9 10 11 12 13 14 15
Mean
ag
e +
/-2std
ev
R9
0
5
10
15
20
0 1 2 3 4 5 6 7 8 9 10 11 12 13 14 15
Mean
ag
e +
/-2std
ev
R10
0
5
10
15
20
0 1 2 3 4 5 6 7 8 9 10 11 12 13 14 15
Mean
ag
e +
/-2std
ev
R11
0
5
10
15
20
0 1 2 3 4 5 6 7 8 9 10 11 12 13 14 15
Mean
ag
e +
/-2std
ev
ALL EXPERT READERS
0%
10%
20%
30%
40%
50%
60%
70%
80%
90%
100%
0.0
0.2
0.4
0.6
0.8
1.0
1.2
1.4
1.6
1.8
0 1 2 3 4 5 6 7 8 9 10 11 12 13 14 15
STDEV Agreement (%) CV (%)STDEV Agreement & CV
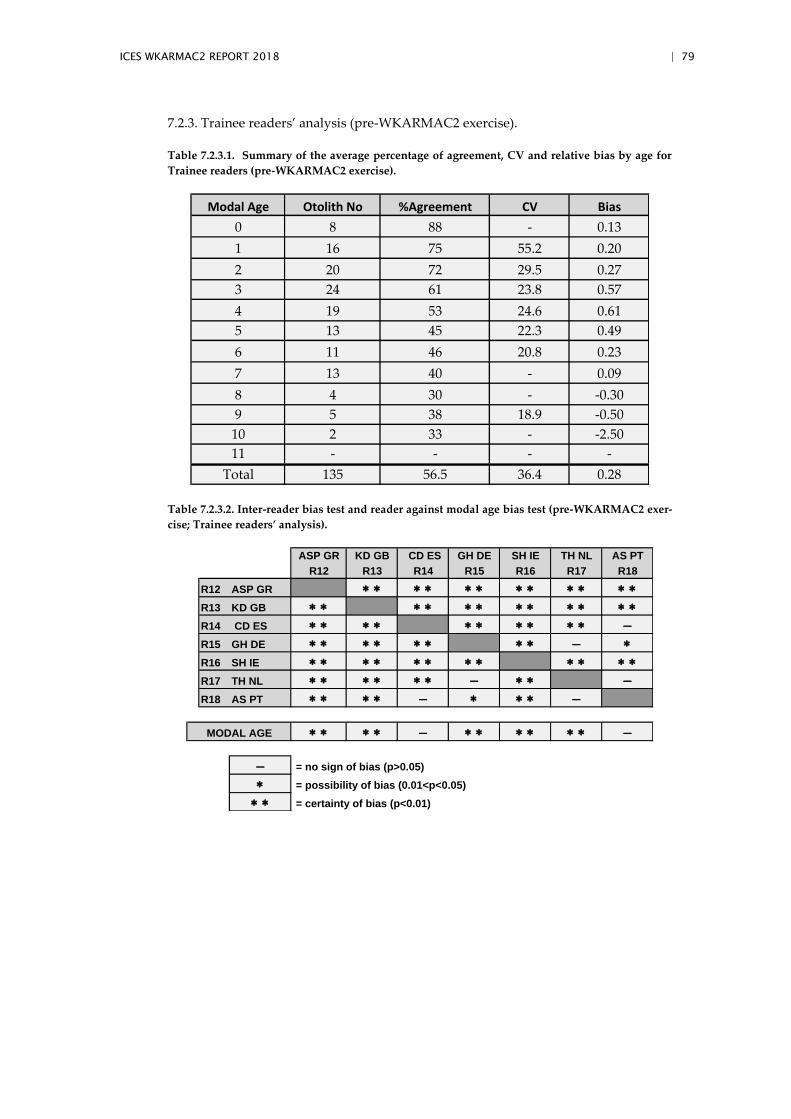
ICES WKARMAC2 REPORT 2018 | 79
7.2.3. Trainee readers’ analysis (pre-WKARMAC2 exercise).
Table 7.2.3.1. Summary of the average percentage of agreement, CV and relative bias by age for
Trainee readers (pre-WKARMAC2 exercise).
Table 7.2.3.2. Inter-reader bias test and reader against modal age bias test (pre-WKARMAC2 exer-
cise; Trainee readers’ analysis).
Modal Age Otolith No %Agreement CV Bias
0 8 88 - 0.13
1 16 75 55.2 0.20
2 20 72 29.5 0.27
3 24 61 23.8 0.57
4 19 53 24.6 0.61
5 13 45 22.3 0.49
6 11 46 20.8 0.23
7 13 40 - 0.09
8 4 30 - -0.30
9 5 38 18.9 -0.50
10 2 33 - -2.50
11 - - - -
Total 135 56.5 36.4 0.28
ASP GR KD GB CD ES GH DE SH IE TH NL AS PT
R12 R13 R14 R15 R16 R17 R18
R12 ASP GR * * * * * * * * * * * *
R13 KD GB * * * * * * * * * * * *
R14 CD ES * * * * * * * * * * -
R15 GH DE * * * * * * * * - *
R16 SH IE * * * * * * * * * * * *
R17 TH NL * * * * * * - * * -
R18 AS PT * * * * - * * * -
* * * * - * * * * * * -
- = no sign of bias (p>0.05)
* = possibility of bias (0.01<p<0.05)
* * = certainty of bias (p<0.01)
MODAL AGE
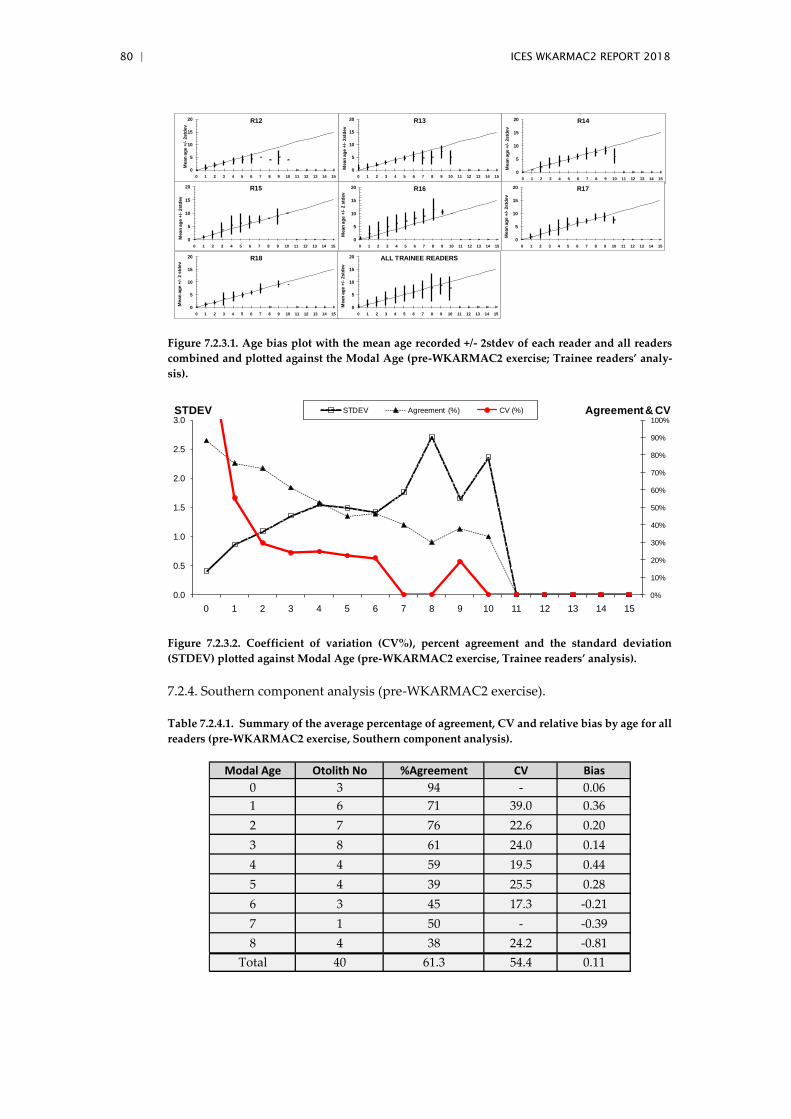
80 | ICES WKARMAC2 REPORT 2018
Figure 7.2.3.1. Age bias plot with the mean age recorded +/- 2stdev of each reader and all readers
combined and plotted against the Modal Age (pre-WKARMAC2 exercise; Trainee readers’ analy-
sis).
Figure 7.2.3.2. Coefficient of variation (CV%), percent agreement and the standard deviation
(STDEV) plotted against Modal Age (pre-WKARMAC2 exercise, Trainee readers’ analysis).
7.2.4. Southern component analysis (pre-WKARMAC2 exercise).
Table 7.2.4.1. Summary of the average percentage of agreement, CV and relative bias by age for all
readers (pre-WKARMAC2 exercise, Southern component analysis).
0
5
10
15
20
0 1 2 3 4 5 6 7 8 9 10 11 12 13 14 15
Mean
ag
e +
/-2std
ev
R12
0
5
10
15
20
0 1 2 3 4 5 6 7 8 9 10 11 12 13 14 15
Mean
ag
e +
/-2std
ev
R13
0
5
10
15
20
0 1 2 3 4 5 6 7 8 9 10 11 12 13 14 15
Mean
ag
e +
/-2std
ev
R14
0
5
10
15
20
0 1 2 3 4 5 6 7 8 9 10 11 12 13 14 15
Mean
ag
e +
/-2std
ev
R15
0
5
10
15
20
0 1 2 3 4 5 6 7 8 9 10 11 12 13 14 15
Mean
ag
e +
/-2 s
tdev
R16
0
5
10
15
20
0 1 2 3 4 5 6 7 8 9 10 11 12 13 14 15
Mean
ag
e +
/-2std
ev
R17
0
5
10
15
20
0 1 2 3 4 5 6 7 8 9 10 11 12 13 14 15
Mean
ag
e +
/-2 s
tdev
R18
0
5
10
15
20
0 1 2 3 4 5 6 7 8 9 10 11 12 13 14 15
Mean
ag
e +
/-2std
ev
ALL TRAINEE READERS
0%
10%
20%
30%
40%
50%
60%
70%
80%
90%
100%
0.0
0.5
1.0
1.5
2.0
2.5
3.0
0 1 2 3 4 5 6 7 8 9 10 11 12 13 14 15
STDEV Agreement (%) CV (%)STDEV Agreement & CV
Modal Age Otolith No %Agreement CV Bias
0 3 94 - 0.06
1 6 71 39.0 0.36
2 7 76 22.6 0.20
3 8 61 24.0 0.14
4 4 59 19.5 0.44
5 4 39 25.5 0.28
6 3 45 17.3 -0.21
7 1 50 - -0.39
8 4 38 24.2 -0.81
Total 40 61.3 54.4 0.11
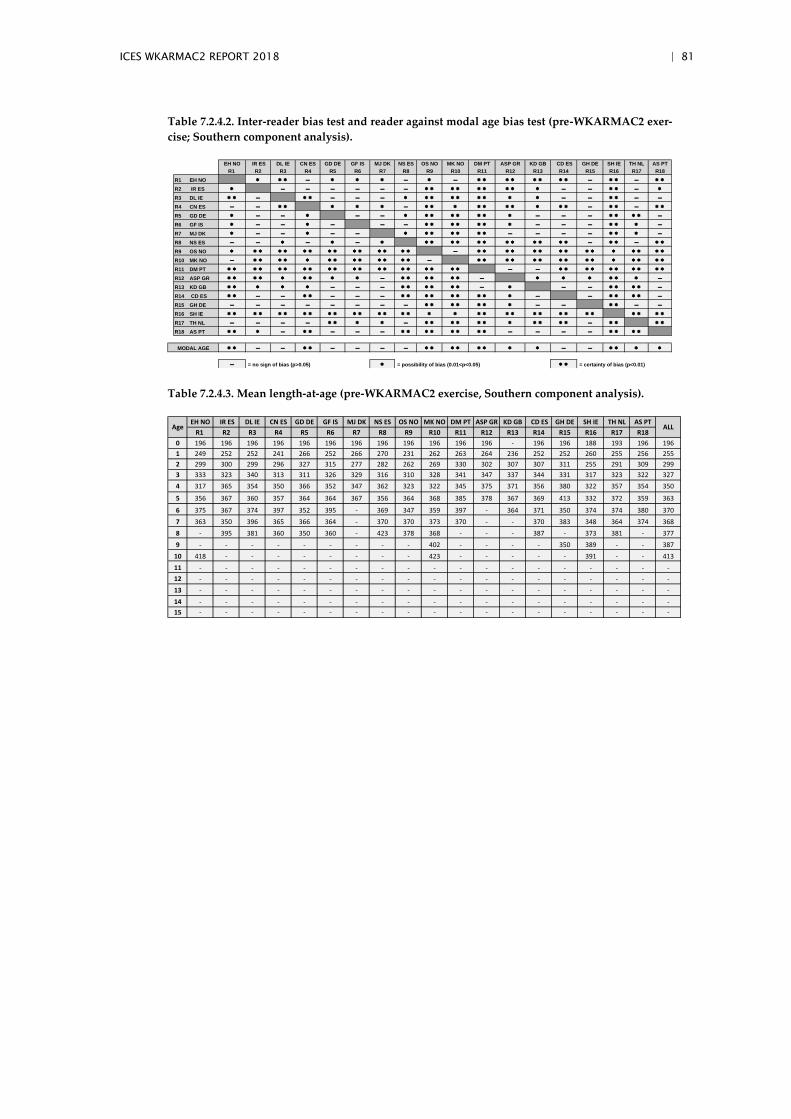
ICES WKARMAC2 REPORT 2018 | 81
Table 7.2.4.2. Inter-reader bias test and reader against modal age bias test (pre-WKARMAC2 exer-
cise; Southern component analysis).
Table 7.2.4.3. Mean length-at-age (pre-WKARMAC2 exercise, Southern component analysis).
EH NO IR ES DL IE CN ES GD DE GF IS MJ DK NS ES OS NO MK NO DM PT ASP GR KD GB CD ES GH DE SH IE TH NL AS PT
R1 R2 R3 R4 R5 R6 R7 R8 R9 R10 R11 R12 R13 R14 R15 R16 R17 R18
R1 EH NO * * * - * * * - * - * * * * * * * * - * * - * *
R2 IR ES * - - - - - - * * * * * * * * * - - * * - *
R3 DL IE * * - * * - - - * * * * * * * * * - - * * - -
R4 CN ES - - * * * * * - * * * * * * * * * * - * * - * *
R5 GD DE * - - * - - * * * * * * * * - - - * * * * -
R6 GF IS * - - * - - - * * * * * * * - - - * * * -
R7 MJ DK * - - * - - * * * * * * * - - - - * * * -
R8 NS ES - - * - * - * * * * * * * * * * * * * - * * - * *
R9 OS NO * * * * * * * * * * * * * * * - * * * * * * * * * * * * * * *
R10 MK NO - * * * * * * * * * * * * * - * * * * * * * * * * * * * * *
R11 DM PT * * * * * * * * * * * * * * * * * * * * - - * * * * * * * * * *
R12 ASP GR * * * * * * * * * - * * * * * * - * * * * * * -
R13 KD GB * * * * * - - - * * * * * * - * - - * * * * -
R14 CD ES * * - - * * - - - * * * * * * * * * - - * * * * -
R15 GH DE - - - - - - - - * * * * * * * - - * * - -
R16 SH IE * * * * * * * * * * * * * * * * * * * * * * * * * * * * * * * *
R17 TH NL - - - - * * * * - * * * * * * * * * * * - * * * *
R18 AS PT * * * - * * - - - * * * * * * * * - - - - * * * *
* * - - * * - - - - * * * * * * * * - - * * * *
- = no sign of bias (p>0.05) * = possibility of bias (0.01<p<0.05) * * = certainty of bias (p<0.01)
MODAL AGE
EH NO IR ES DL IE CN ES GD DE GF IS MJ DK NS ES OS NO MK NO DM PT ASP GR KD GB CD ES GH DE SH IE TH NL AS PT
R1 R2 R3 R4 R5 R6 R7 R8 R9 R10 R11 R12 R13 R14 R15 R16 R17 R18
0 196 196 196 196 196 196 196 196 196 196 196 196 - 196 196 188 193 196 196
1 249 252 252 241 266 252 266 270 231 262 263 264 236 252 252 260 255 256 255
2 299 300 299 296 327 315 277 282 262 269 330 302 307 307 311 255 291 309 299
3 333 323 340 313 311 326 329 316 310 328 341 347 337 344 331 317 323 322 327
4 317 365 354 350 366 352 347 362 323 322 345 375 371 356 380 322 357 354 350
5 356 367 360 357 364 364 367 356 364 368 385 378 367 369 413 332 372 359 363
6 375 367 374 397 352 395 - 369 347 359 397 - 364 371 350 374 374 380 370
7 363 350 396 365 366 364 - 370 370 373 370 - - 370 383 348 364 374 368
8 - 395 381 360 350 360 - 423 378 368 - - - 387 - 373 381 - 377
9 - - - - - - - - - 402 - - - - 350 389 - - 387
10 418 - - - - - - - - 423 - - - - - 391 - - 413
11 - - - - - - - - - - - - - - - - - - -
12 - - - - - - - - - - - - - - - - - - -
13 - - - - - - - - - - - - - - - - - - -
14 - - - - - - - - - - - - - - - - - - -
15 - - - - - - - - - - - - - - - - - - -
Age ALL
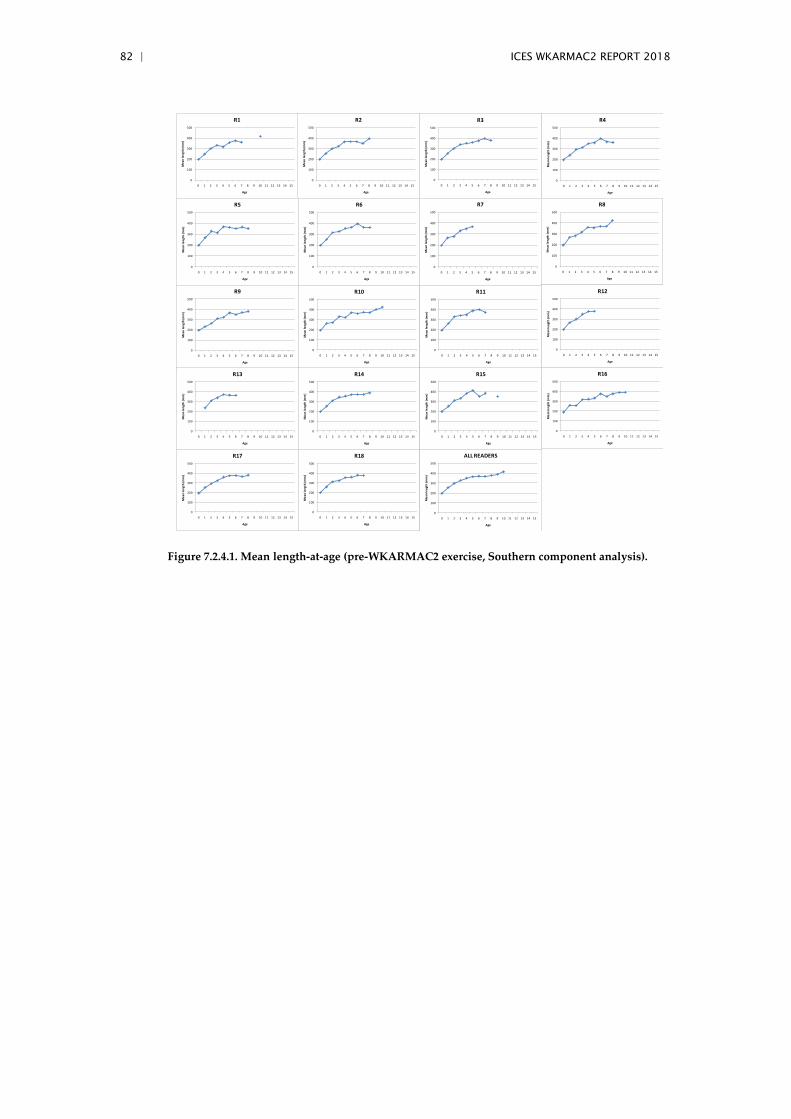
82 | ICES WKARMAC2 REPORT 2018
Figure 7.2.4.1. Mean length-at-age (pre-WKARMAC2 exercise, Southern component analysis).
0
100
200
300
400
500
0 1 2 3 4 5 6 7 8 9 10 11 12 13 14 15
Me
an le
ngt
h (
mm
)
Age
R1
0
100
200
300
400
500
0 1 2 3 4 5 6 7 8 9 10 11 12 13 14 15
Me
an le
ngt
h (
mm
)
Age
R2
0
100
200
300
400
500
0 1 2 3 4 5 6 7 8 9 10 11 12 13 14 15
Me
an le
ngt
h (
mm
)
Age
R3
0
100
200
300
400
500
0 1 2 3 4 5 6 7 8 9 10 11 12 13 14 15
Me
an le
ngt
h (
mm
)
Age
R4
0
100
200
300
400
500
0 1 2 3 4 5 6 7 8 9 10 11 12 13 14 15
Me
an le
ngt
h (
mm
)
Age
R5
0
100
200
300
400
500
0 1 2 3 4 5 6 7 8 9 10 11 12 13 14 15
Me
an le
ngt
h (
mm
)
Age
R6
0
100
200
300
400
500
0 1 2 3 4 5 6 7 8 9 10 11 12 13 14 15
Me
an le
ngt
h (
mm
)
Age
R7
0
100
200
300
400
500
0 1 2 3 4 5 6 7 8 9 10 11 12 13 14 15
Me
an le
ngt
h (
mm
)
Age
R8
0
100
200
300
400
500
0 1 2 3 4 5 6 7 8 9 10 11 12 13 14 15
Me
an le
ngt
h (
mm
)
Age
R9
0
100
200
300
400
500
0 1 2 3 4 5 6 7 8 9 10 11 12 13 14 15
Me
an le
ngt
h (
mm
)
Age
R10
0
100
200
300
400
500
0 1 2 3 4 5 6 7 8 9 10 11 12 13 14 15
Me
an le
ngt
h (
mm
)
Age
R11
0
100
200
300
400
500
0 1 2 3 4 5 6 7 8 9 10 11 12 13 14 15
Me
an le
ngt
h (
mm
)
Age
R12
0
100
200
300
400
500
0 1 2 3 4 5 6 7 8 9 10 11 12 13 14 15
Me
an le
ngt
h (
mm
)
Age
R13
0
100
200
300
400
500
0 1 2 3 4 5 6 7 8 9 10 11 12 13 14 15
Me
an le
ngt
h (
mm
)
Age
R14
0
100
200
300
400
500
0 1 2 3 4 5 6 7 8 9 10 11 12 13 14 15
Me
an le
ngt
h (
mm
)
Age
R15
0
100
200
300
400
500
0 1 2 3 4 5 6 7 8 9 10 11 12 13 14 15
Me
an le
ngt
h (
mm
)
Age
R16
0
100
200
300
400
500
0 1 2 3 4 5 6 7 8 9 10 11 12 13 14 15
Me
an le
ngt
h (
mm
)
Age
R17
0
100
200
300
400
500
0 1 2 3 4 5 6 7 8 9 10 11 12 13 14 15
Me
an le
ngt
h (
mm
)
Age
R18
0
100
200
300
400
500
0 1 2 3 4 5 6 7 8 9 10 11 12 13 14 15
Me
an le
ngt
h (
mm
)
Age
ALL READERS
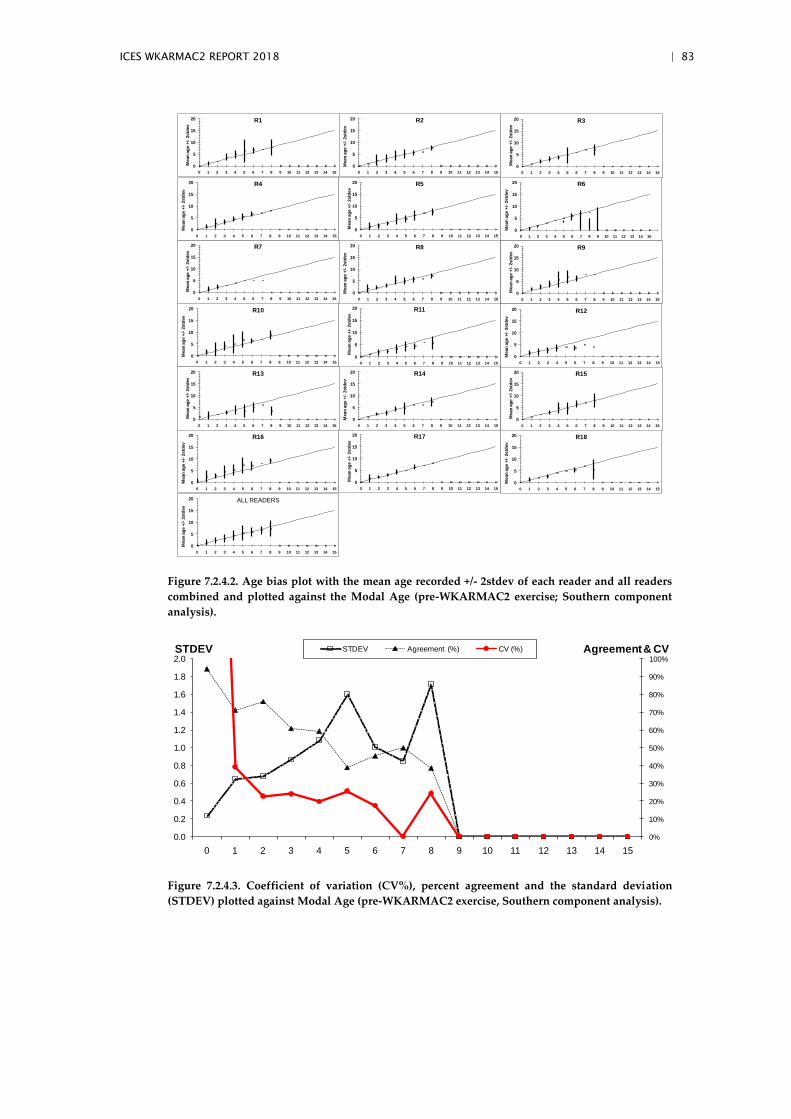
ICES WKARMAC2 REPORT 2018 | 83
Figure 7.2.4.2. Age bias plot with the mean age recorded +/- 2stdev of each reader and all readers
combined and plotted against the Modal Age (pre-WKARMAC2 exercise; Southern component
analysis).
Figure 7.2.4.3. Coefficient of variation (CV%), percent agreement and the standard deviation
(STDEV) plotted against Modal Age (pre-WKARMAC2 exercise, Southern component analysis).
0
5
10
15
20
0 1 2 3 4 5 6 7 8 9 10 11 12 13 14 15
Mean
ag
e +
/-2std
ev
R1
0
5
10
15
20
0 1 2 3 4 5 6 7 8 9 10 11 12 13 14 15
Mean
ag
e +
/-2std
ev
R2
0
5
10
15
20
0 1 2 3 4 5 6 7 8 9 10 11 12 13 14 15
Mean
ag
e +
/-2std
ev
R3
0
5
10
15
20
0 1 2 3 4 5 6 7 8 9 10 11 12 13 14 15
Mean
ag
e +
/-2std
ev
R5
0
5
10
15
20
0 1 2 3 4 5 6 7 8 9 10 11 12 13 14 15
Mean
ag
e +
/-2std
ev
R7
0
5
10
15
20
0 1 2 3 4 5 6 7 8 9 10 11 12 13 14 15
Mean
ag
e +
/-2std
ev
R9
0
5
10
15
20
0 1 2 3 4 5 6 7 8 9 10 11 12 13 14 15
Mean
ag
e +
/-2std
ev
R11
0
5
10
15
20
0 1 2 3 4 5 6 7 8 9 10 11 12 13 14 15
Mean
ag
e +
/-2std
ev
R13
0
5
10
15
20
0 1 2 3 4 5 6 7 8 9 10 11 12 13 14 15
Mean
ag
e +
/-2std
ev
R15
0
5
10
15
20
0 1 2 3 4 5 6 7 8 9 10 11 12 13 14 15
Mean
ag
e +
/-2std
ev
R17
0
5
10
15
20
0 1 2 3 4 5 6 7 8 9 10 11 12 13 14 15
Mean
ag
e +
/-2std
ev
R4
0
5
10
15
20
0 1 2 3 4 5 6 7 8 9 10 11 12 13 14 15
Mean
ag
e +
/-2std
ev
R6
0
5
10
15
20
0 1 2 3 4 5 6 7 8 9 10 11 12 13 14 15
Mean
ag
e +
/-2std
ev
R8
0
5
10
15
20
0 1 2 3 4 5 6 7 8 9 10 11 12 13 14 15
Mean
ag
e +
/-2std
ev
R10
0
5
10
15
20
0 1 2 3 4 5 6 7 8 9 10 11 12 13 14 15
Mean
ag
e +
/-2std
ev
R12
0
5
10
15
20
0 1 2 3 4 5 6 7 8 9 10 11 12 13 14 15
Mean
ag
e +
/-2std
ev
R14
0
5
10
15
20
0 1 2 3 4 5 6 7 8 9 10 11 12 13 14 15
Mean
ag
e +
/-2std
ev
R16
0
5
10
15
20
0 1 2 3 4 5 6 7 8 9 10 11 12 13 14 15
Mean
ag
e +
/-2std
ev
R18
0
5
10
15
20
0 1 2 3 4 5 6 7 8 9 10 11 12 13 14 15
Mean
ag
e +
/-2std
ev
ALL READERS
0%
10%
20%
30%
40%
50%
60%
70%
80%
90%
100%
0.0
0.2
0.4
0.6
0.8
1.0
1.2
1.4
1.6
1.8
2.0
0 1 2 3 4 5 6 7 8 9 10 11 12 13 14 15
STDEV Agreement (%) CV (%)STDEV Agreement & CV
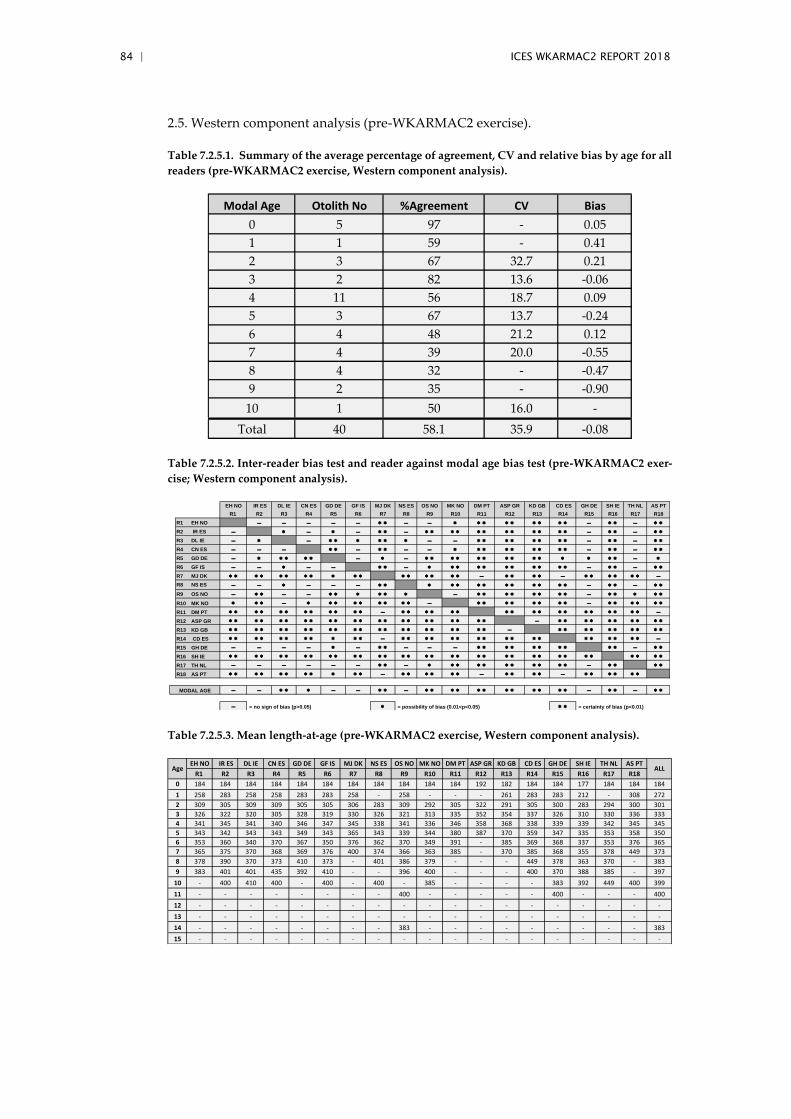
84 | ICES WKARMAC2 REPORT 2018
2.5. Western component analysis (pre-WKARMAC2 exercise).
Table 7.2.5.1. Summary of the average percentage of agreement, CV and relative bias by age for all
readers (pre-WKARMAC2 exercise, Western component analysis).
Table 7.2.5.2. Inter-reader bias test and reader against modal age bias test (pre-WKARMAC2 exer-
cise; Western component analysis).
Table 7.2.5.3. Mean length-at-age (pre-WKARMAC2 exercise, Western component analysis).
Modal Age Otolith No %Agreement CV Bias
0 5 97 - 0.05
1 1 59 - 0.41
2 3 67 32.7 0.21
3 2 82 13.6 -0.06
4 11 56 18.7 0.09
5 3 67 13.7 -0.24
6 4 48 21.2 0.12
7 4 39 20.0 -0.55
8 4 32 - -0.47
9 2 35 - -0.90
10 1 50 16.0 -
Total 40 58.1 35.9 -0.08
EH NO IR ES DL IE CN ES GD DE GF IS MJ DK NS ES OS NO MK NO DM PT ASP GR KD GB CD ES GH DE SH IE TH NL AS PT
R1 R2 R3 R4 R5 R6 R7 R8 R9 R10 R11 R12 R13 R14 R15 R16 R17 R18
R1 EH NO - - - - - * * - - * * * * * * * * * - * * - * *
R2 IR ES - * - * - * * - * * * * * * * * * * * * - * * - * *
R3 DL IE - * - * * * * * * - - * * * * * * * * - * * - * *
R4 CN ES - - - * * - * * - - * * * * * * * * * - * * - * *
R5 GD DE - * * * * * - * - * * * * * * * * * * * * * * - *
R6 GF IS - - * - - * * - * * * * * * * * * * * - * * - * *
R7 MJ DK * * * * * * * * * * * * * * * * * - * * * * - * * * * * * -R8 NS ES - - * - - - * * * * * * * * * * * * * - * * - * *
R9 OS NO - * * - - * * * * * * - * * * * * * * * - * * * * *
R10 MK NO * * * - * * * * * * * * * - * * * * * * * * - * * * * * *
R11 DM PT * * * * * * * * * * * * - * * * * * * * * * * * * * * * * * * -
R12 ASP GR * * * * * * * * * * * * * * * * * * * * * * - * * * * * * * * * *
R13 KD GB * * * * * * * * * * * * * * * * * * * * * * - * * * * * * * * * *
R14 CD ES * * * * * * * * * * * - * * * * * * * * * * * * * * * * * * -
R15 GH DE - - - - * - * * - - - * * * * * * * * * * - * *
R16 SH IE * * * * * * * * * * * * * * * * * * * * * * * * * * * * * * * * * *
R17 TH NL - - - - - - * * - * * * * * * * * * * * - * * * *
R18 AS PT * * * * * * * * * * * - * * * * * * - * * * * - * * * * * *
- - * * * - - * * - * * * * * * * * * * * * - * * - * *
- = no sign of bias (p>0.05) * = possibility of bias (0.01<p<0.05) * * = certainty of bias (p<0.01)
MODAL AGE
EH NO IR ES DL IE CN ES GD DE GF IS MJ DK NS ES OS NO MK NO DM PT ASP GR KD GB CD ES GH DE SH IE TH NL AS PT
R1 R2 R3 R4 R5 R6 R7 R8 R9 R10 R11 R12 R13 R14 R15 R16 R17 R18
0 184 184 184 184 184 184 184 184 184 184 184 192 182 184 184 177 184 184 184
1 258 283 258 258 283 283 258 - 258 - - - 261 283 283 212 - 308 272
2 309 305 309 309 305 305 306 283 309 292 305 322 291 305 300 283 294 300 301
3 326 322 320 305 328 319 330 326 321 313 335 352 354 337 326 310 330 336 333
4 341 345 341 340 346 347 345 338 341 336 346 358 368 338 339 339 342 345 345
5 343 342 343 343 349 343 365 343 339 344 380 387 370 359 347 335 353 358 350
6 353 360 340 370 367 350 376 362 370 349 391 - 385 369 368 337 353 376 365
7 365 375 370 368 369 376 400 374 366 363 385 - 370 385 368 355 378 449 373
8 378 390 370 373 410 373 - 401 386 379 - - - 449 378 363 370 - 383
9 383 401 401 435 392 410 - - 396 400 - - - 400 370 388 385 - 397
10 - 400 410 400 - 400 - 400 - 385 - - - - 383 392 449 400 399
11 - - - - - - - - 400 - - - - - 400 - - - 400
12 - - - - - - - - - - - - - - - - - - -
13 - - - - - - - - - - - - - - - - - - -
14 - - - - - - - - 383 - - - - - - - - - 383
15 - - - - - - - - - - - - - - - - - - -
Age ALL
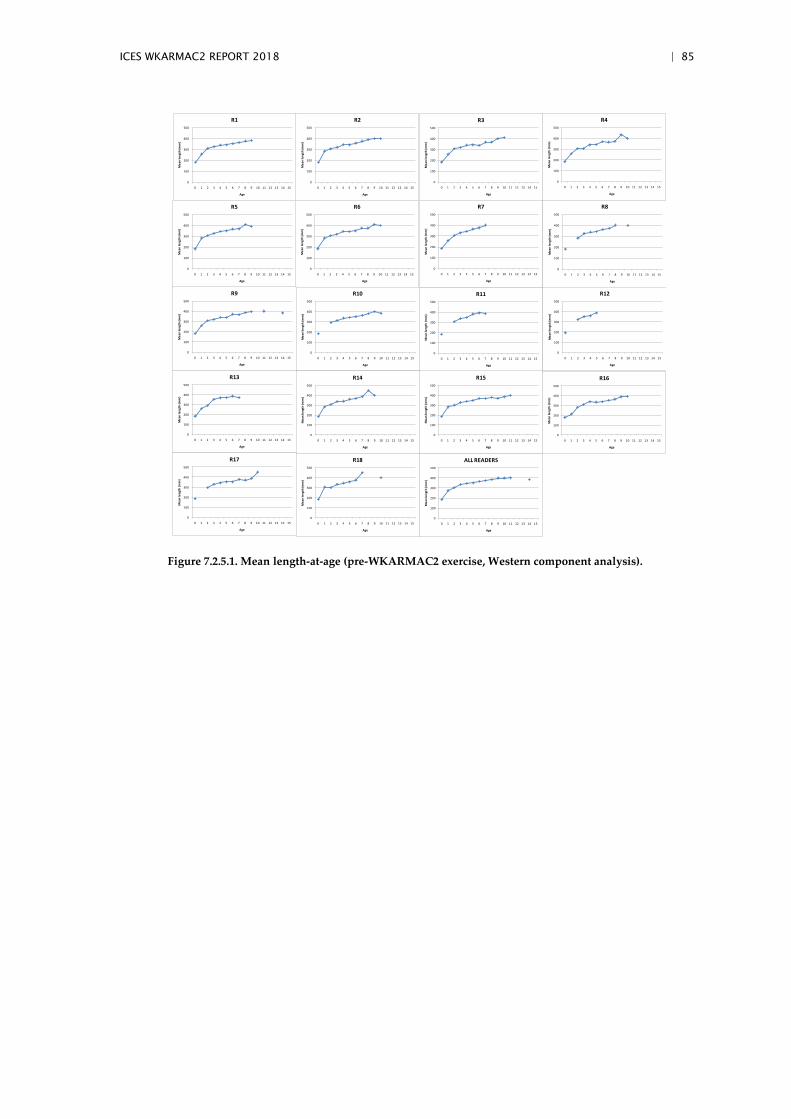
ICES WKARMAC2 REPORT 2018 | 85
Figure 7.2.5.1. Mean length-at-age (pre-WKARMAC2 exercise, Western component analysis).
0
100
200
300
400
500
0 1 2 3 4 5 6 7 8 9 10 11 12 13 14 15
Me
an le
ngt
h (
mm
)
Age
R1
0
100
200
300
400
500
0 1 2 3 4 5 6 7 8 9 10 11 12 13 14 15
Me
an le
ngt
h (
mm
)
Age
R2
0
100
200
300
400
500
0 1 2 3 4 5 6 7 8 9 10 11 12 13 14 15
Me
an le
ngt
h (
mm
)
Age
R3
0
100
200
300
400
500
0 1 2 3 4 5 6 7 8 9 10 11 12 13 14 15
Me
an le
ngt
h (
mm
)
Age
R4
0
100
200
300
400
500
0 1 2 3 4 5 6 7 8 9 10 11 12 13 14 15
Me
an le
ngt
h (
mm
)
Age
R5
0
100
200
300
400
500
0 1 2 3 4 5 6 7 8 9 10 11 12 13 14 15
Me
an le
ngt
h (
mm
)
Age
R6
0
100
200
300
400
500
0 1 2 3 4 5 6 7 8 9 10 11 12 13 14 15
Me
an le
ngt
h (
mm
)
Age
R7
0
100
200
300
400
500
0 1 2 3 4 5 6 7 8 9 10 11 12 13 14 15
Me
an le
ngt
h (
mm
)
Age
R8
0
100
200
300
400
500
0 1 2 3 4 5 6 7 8 9 10 11 12 13 14 15
Me
an le
ngt
h (
mm
)
Age
R9
0
100
200
300
400
500
0 1 2 3 4 5 6 7 8 9 10 11 12 13 14 15
Me
an le
ngt
h (
mm
)
Age
R10
0
100
200
300
400
500
0 1 2 3 4 5 6 7 8 9 10 11 12 13 14 15
Me
an le
ngt
h (
mm
)
Age
R11
0
100
200
300
400
500
0 1 2 3 4 5 6 7 8 9 10 11 12 13 14 15
Me
an le
ngt
h (
mm
)
Age
R12
0
100
200
300
400
500
0 1 2 3 4 5 6 7 8 9 10 11 12 13 14 15
Me
an le
ngt
h (
mm
)
Age
R13
0
100
200
300
400
500
0 1 2 3 4 5 6 7 8 9 10 11 12 13 14 15
Me
an le
ngt
h (
mm
)
Age
R14
0
100
200
300
400
500
0 1 2 3 4 5 6 7 8 9 10 11 12 13 14 15
Me
an le
ngt
h (
mm
)
Age
R15
0
100
200
300
400
500
0 1 2 3 4 5 6 7 8 9 10 11 12 13 14 15
Me
an le
ngt
h (
mm
)
Age
R16
0
100
200
300
400
500
0 1 2 3 4 5 6 7 8 9 10 11 12 13 14 15
Me
an le
ngt
h (
mm
)
Age
R17
0
100
200
300
400
500
0 1 2 3 4 5 6 7 8 9 10 11 12 13 14 15
Me
an le
ngt
h (
mm
)
Age
R18
0
100
200
300
400
500
0 1 2 3 4 5 6 7 8 9 10 11 12 13 14 15
Me
an le
ngt
h (
mm
)
Age
ALL READERS
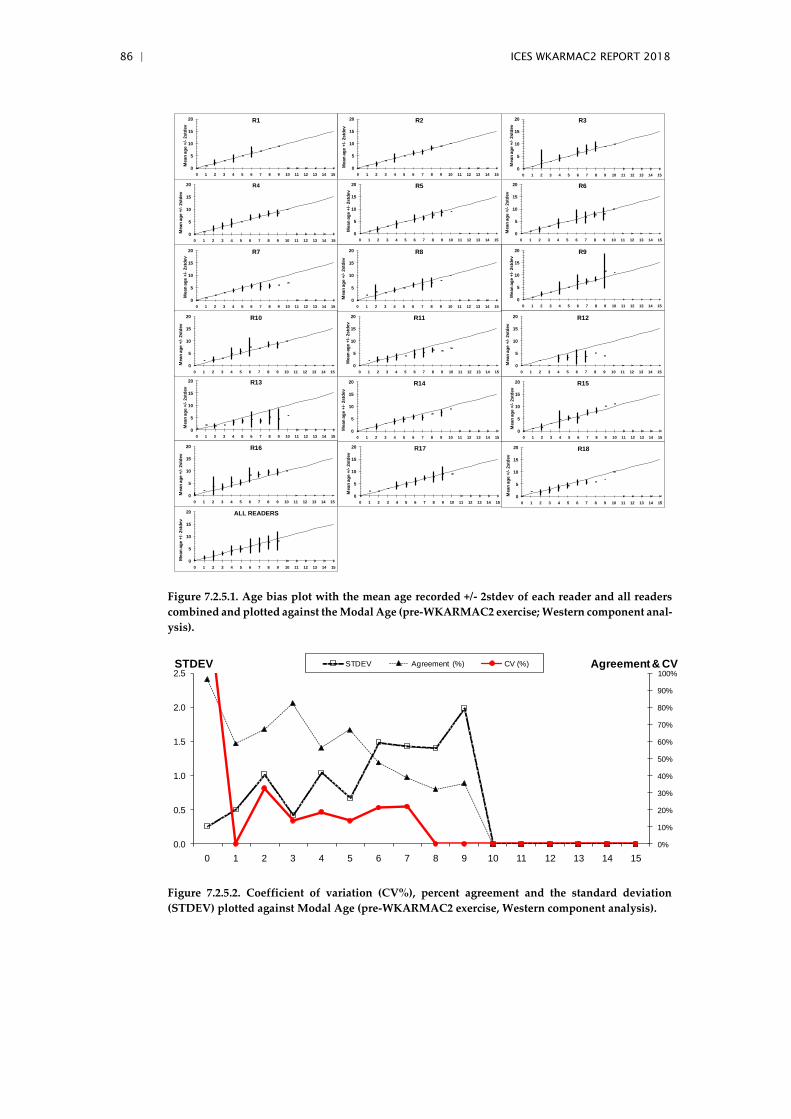
86 | ICES WKARMAC2 REPORT 2018
Figure 7.2.5.1. Age bias plot with the mean age recorded +/- 2stdev of each reader and all readers
combined and plotted against the Modal Age (pre-WKARMAC2 exercise; Western component anal-
ysis).
Figure 7.2.5.2. Coefficient of variation (CV%), percent agreement and the standard deviation
(STDEV) plotted against Modal Age (pre-WKARMAC2 exercise, Western component analysis).
0
5
10
15
20
0 1 2 3 4 5 6 7 8 9 10 11 12 13 14 15
Mean
ag
e +
/-2std
ev
R1
0
5
10
15
20
0 1 2 3 4 5 6 7 8 9 10 11 12 13 14 15
Mean
ag
e +
/-2std
ev
R2
0
5
10
15
20
0 1 2 3 4 5 6 7 8 9 10 11 12 13 14 15
Mean
ag
e +
/-2std
ev
R3
0
5
10
15
20
0 1 2 3 4 5 6 7 8 9 10 11 12 13 14 15
Mean
ag
e +
/-2std
ev
R5
0
5
10
15
20
0 1 2 3 4 5 6 7 8 9 10 11 12 13 14 15
Mean
ag
e +
/-2std
ev
R7
0
5
10
15
20
0 1 2 3 4 5 6 7 8 9 10 11 12 13 14 15
Mean
ag
e +
/-2std
ev
R9
0
5
10
15
20
0 1 2 3 4 5 6 7 8 9 10 11 12 13 14 15
Mean
ag
e +
/-2std
ev
R11
0
5
10
15
20
0 1 2 3 4 5 6 7 8 9 10 11 12 13 14 15
Mean
ag
e +
/-2std
ev
R13
0
5
10
15
20
0 1 2 3 4 5 6 7 8 9 10 11 12 13 14 15
Mean
ag
e +
/-2std
ev
R15
0
5
10
15
20
0 1 2 3 4 5 6 7 8 9 10 11 12 13 14 15
Mean
ag
e +
/-2std
ev
R17
0
5
10
15
20
0 1 2 3 4 5 6 7 8 9 10 11 12 13 14 15
Mean
ag
e +
/-2std
ev
R4
0
5
10
15
20
0 1 2 3 4 5 6 7 8 9 10 11 12 13 14 15
Mean
ag
e +
/-2std
ev
R6
0
5
10
15
20
0 1 2 3 4 5 6 7 8 9 10 11 12 13 14 15
Mean
ag
e +
/-2std
ev
R8
0
5
10
15
20
0 1 2 3 4 5 6 7 8 9 10 11 12 13 14 15
Mean
ag
e +
/-2std
ev
R10
0
5
10
15
20
0 1 2 3 4 5 6 7 8 9 10 11 12 13 14 15
Mean
ag
e +
/-2std
ev
R12
0
5
10
15
20
0 1 2 3 4 5 6 7 8 9 10 11 12 13 14 15
Mean
ag
e +
/-2std
ev
R14
0
5
10
15
20
0 1 2 3 4 5 6 7 8 9 10 11 12 13 14 15
Mean
ag
e +
/-2std
ev
R16
0
5
10
15
20
0 1 2 3 4 5 6 7 8 9 10 11 12 13 14 15M
ean
ag
e +
/-2std
ev
R18
0
5
10
15
20
0 1 2 3 4 5 6 7 8 9 10 11 12 13 14 15
Mean
ag
e +
/-2std
ev
ALL READERS
0%
10%
20%
30%
40%
50%
60%
70%
80%
90%
100%
0.0
0.5
1.0
1.5
2.0
2.5
0 1 2 3 4 5 6 7 8 9 10 11 12 13 14 15
STDEV Agreement (%) CV (%)STDEV Agreement & CV
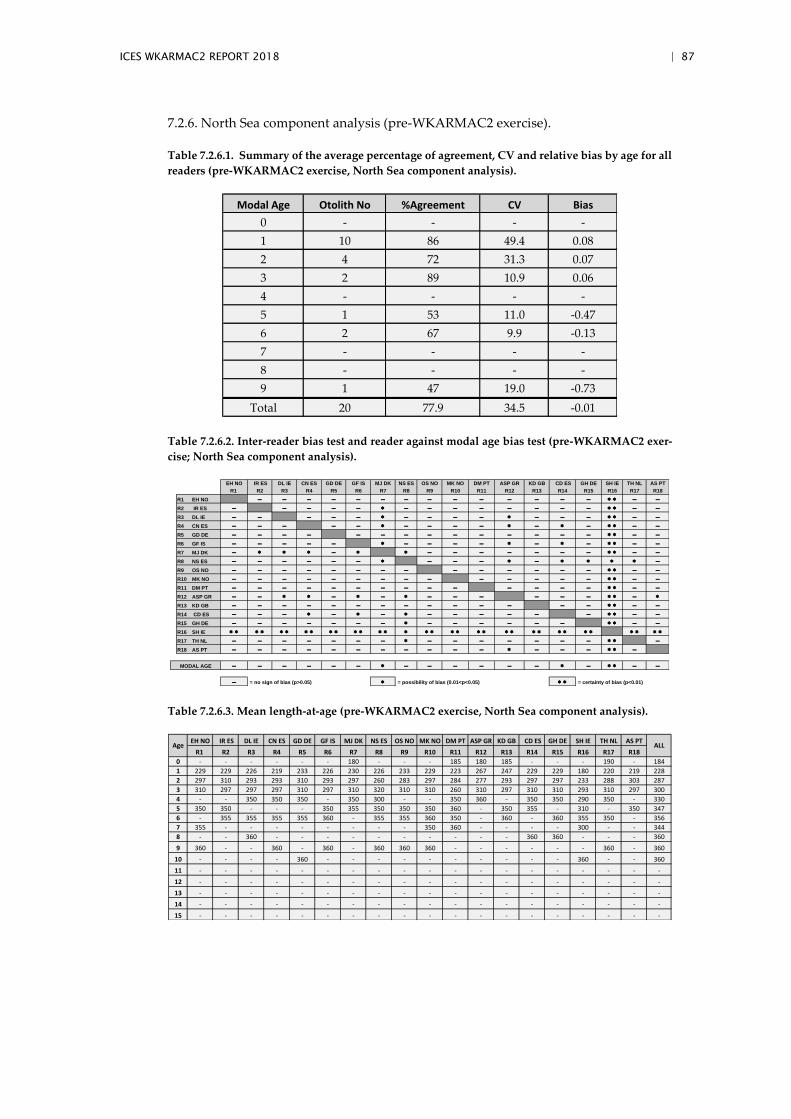
ICES WKARMAC2 REPORT 2018 | 87
7.2.6. North Sea component analysis (pre-WKARMAC2 exercise).
Table 7.2.6.1. Summary of the average percentage of agreement, CV and relative bias by age for all
readers (pre-WKARMAC2 exercise, North Sea component analysis).
Table 7.2.6.2. Inter-reader bias test and reader against modal age bias test (pre-WKARMAC2 exer-
cise; North Sea component analysis).
Table 7.2.6.3. Mean length-at-age (pre-WKARMAC2 exercise, North Sea component analysis).
Modal Age Otolith No %Agreement CV Bias
0 - - - -
1 10 86 49.4 0.08
2 4 72 31.3 0.07
3 2 89 10.9 0.06
4 - - - -
5 1 53 11.0 -0.47
6 2 67 9.9 -0.13
7 - - - -
8 - - - -
9 1 47 19.0 -0.73
Total 20 77.9 34.5 -0.01
EH NO IR ES DL IE CN ES GD DE GF IS MJ DK NS ES OS NO MK NO DM PT ASP GR KD GB CD ES GH DE SH IE TH NL AS PT
R1 R2 R3 R4 R5 R6 R7 R8 R9 R10 R11 R12 R13 R14 R15 R16 R17 R18
R1 EH NO - - - - - - - - - - - - - - * * - -
R2 IR ES - - - - - * - - - - - - - - * * - -
R3 DL IE - - - - - * - - - - * - - - * * - -
R4 CN ES - - - - - * - - - - * - * - * * - -
R5 GD DE - - - - - - - - - - - - - - * * - -
R6 GF IS - - - - - * - - - - * - * - * * - -
R7 MJ DK - * * * - * * - - - - - - - * * - -
R8 NS ES - - - - - - * - - - * - * * * * -
R9 OS NO - - - - - - - - - - - - - - * * - -
R10 MK NO - - - - - - - - - - - - - - * * - -
R11 DM PT - - - - - - - - - - - - - - * * - -
R12 ASP GR - - * * - * - * - - - - - - * * - *
R13 KD GB - - - - - - - - - - - - - - * * - -
R14 CD ES - - - * - * - * - - - - - - * * - -
R15 GH DE - - - - - - - * - - - - - - * * - -
R16 SH IE * * * * * * * * * * * * * * * * * * * * * * * * * * * * * * * * *
R17 TH NL - - - - - - - * - - - - - - - * * -
R18 AS PT - - - - - - - - - - - * - - - * * -
- - - - - - * - - - - - - * - * * - -
- = no sign of bias (p>0.05) * = possibility of bias (0.01<p<0.05) * * = certainty of bias (p<0.01)
MODAL AGE
EH NO IR ES DL IE CN ES GD DE GF IS MJ DK NS ES OS NO MK NO DM PT ASP GR KD GB CD ES GH DE SH IE TH NL AS PT
R1 R2 R3 R4 R5 R6 R7 R8 R9 R10 R11 R12 R13 R14 R15 R16 R17 R18
0 - - - - - - 180 - - - 185 180 185 - - - 190 - 184
1 229 229 226 219 233 226 230 226 233 229 223 267 247 229 229 180 220 219 228
2 297 310 293 293 310 293 297 260 283 297 284 277 293 297 297 233 288 303 287
3 310 297 297 297 310 297 310 320 310 310 260 310 297 310 310 293 310 297 300
4 - - 350 350 350 - 350 300 - - 350 360 - 350 350 290 350 - 330
5 350 350 - - - 350 355 350 350 350 360 - 350 355 - 310 - 350 347
6 - 355 355 355 355 360 - 355 355 360 350 - 360 - 360 355 350 - 356
7 355 - - - - - - - - 350 360 - - - - 300 - - 344
8 - - 360 - - - - - - - - - - 360 360 - - - 360
9 360 - - 360 - 360 - 360 360 360 - - - - - - 360 - 360
10 - - - - 360 - - - - - - - - - - 360 - - 360
11 - - - - - - - - - - - - - - - - - - -
12 - - - - - - - - - - - - - - - - - - -
13 - - - - - - - - - - - - - - - - - - -
14 - - - - - - - - - - - - - - - - - - -
15 - - - - - - - - - - - - - - - - - - -
Age ALL
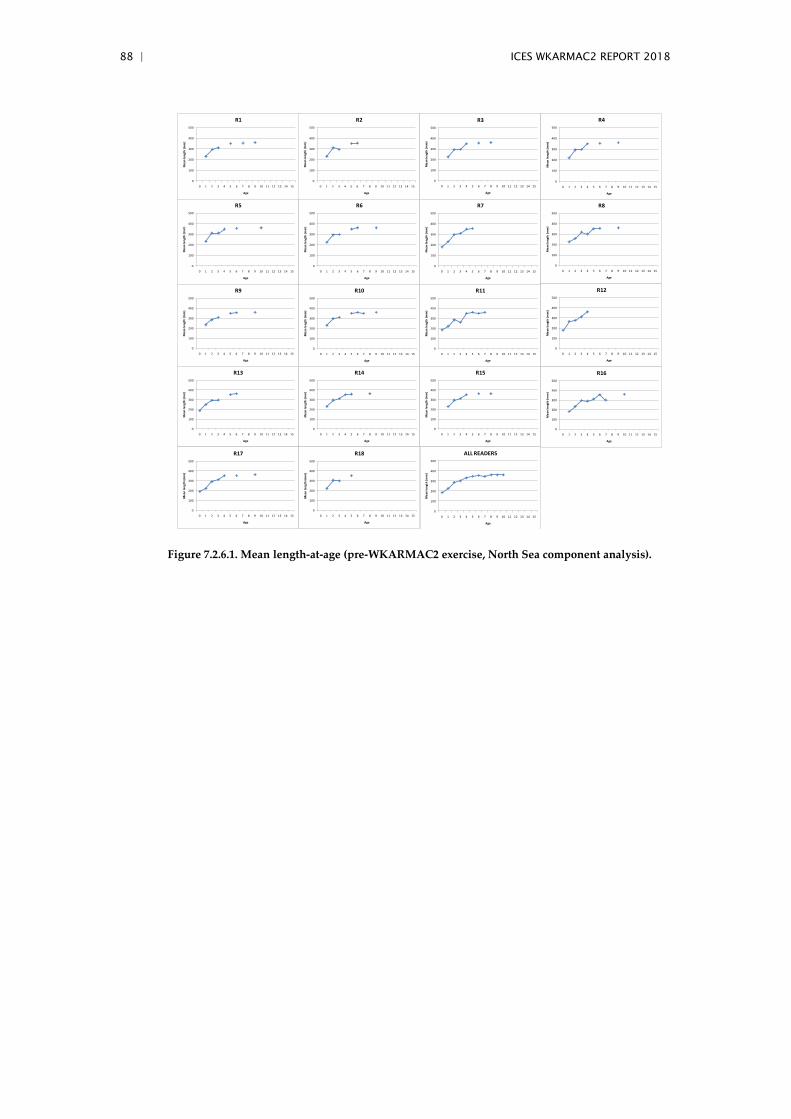
88 | ICES WKARMAC2 REPORT 2018
Figure 7.2.6.1. Mean length-at-age (pre-WKARMAC2 exercise, North Sea component analysis).
0
100
200
300
400
500
0 1 2 3 4 5 6 7 8 9 10 11 12 13 14 15M
ean
len
gth
(m
m)
Age
R1
0
100
200
300
400
500
0 1 2 3 4 5 6 7 8 9 10 11 12 13 14 15
Me
an le
ngt
h (
mm
)
Age
R2
0
100
200
300
400
500
0 1 2 3 4 5 6 7 8 9 10 11 12 13 14 15
Me
an le
ngt
h (
mm
)
Age
R3
0
100
200
300
400
500
0 1 2 3 4 5 6 7 8 9 10 11 12 13 14 15
Me
an le
ngt
h (
mm
)
Age
R4
0
100
200
300
400
500
0 1 2 3 4 5 6 7 8 9 10 11 12 13 14 15
Me
an le
ngt
h (
mm
)
Age
R5
0
100
200
300
400
500
0 1 2 3 4 5 6 7 8 9 10 11 12 13 14 15
Me
an le
ngt
h (
mm
)
Age
R6
0
100
200
300
400
500
0 1 2 3 4 5 6 7 8 9 10 11 12 13 14 15
Me
an le
ngt
h (
mm
)
Age
R7
0
100
200
300
400
500
0 1 2 3 4 5 6 7 8 9 10 11 12 13 14 15
Me
an le
ngt
h (
mm
)
Age
R8
0
100
200
300
400
500
0 1 2 3 4 5 6 7 8 9 10 11 12 13 14 15
Me
an le
ngt
h (
mm
)
Age
R9
0
100
200
300
400
500
0 1 2 3 4 5 6 7 8 9 10 11 12 13 14 15
Me
an le
ngt
h (
mm
)
Age
R10
0
100
200
300
400
500
0 1 2 3 4 5 6 7 8 9 10 11 12 13 14 15
Me
an le
ngt
h (
mm
)
Age
R11
0
100
200
300
400
500
0 1 2 3 4 5 6 7 8 9 10 11 12 13 14 15
Me
an le
ngt
h (
mm
)
Age
R12
0
100
200
300
400
500
0 1 2 3 4 5 6 7 8 9 10 11 12 13 14 15
Me
an le
ngt
h (
mm
)
Age
R13
0
100
200
300
400
500
0 1 2 3 4 5 6 7 8 9 10 11 12 13 14 15
Me
an le
ngt
h (
mm
)
Age
R14
0
100
200
300
400
500
0 1 2 3 4 5 6 7 8 9 10 11 12 13 14 15
Me
an le
ngt
h (
mm
)
Age
R15
0
100
200
300
400
500
0 1 2 3 4 5 6 7 8 9 10 11 12 13 14 15
Me
an le
ngt
h (
mm
)
Age
R16
0
100
200
300
400
500
0 1 2 3 4 5 6 7 8 9 10 11 12 13 14 15
Me
an le
ngt
h (
mm
)
Age
R17
0
100
200
300
400
500
0 1 2 3 4 5 6 7 8 9 10 11 12 13 14 15
Me
an le
ngt
h (
mm
)
Age
R18
0
100
200
300
400
500
0 1 2 3 4 5 6 7 8 9 10 11 12 13 14 15
Me
an le
ngt
h (
mm
)
Age
ALL READERS
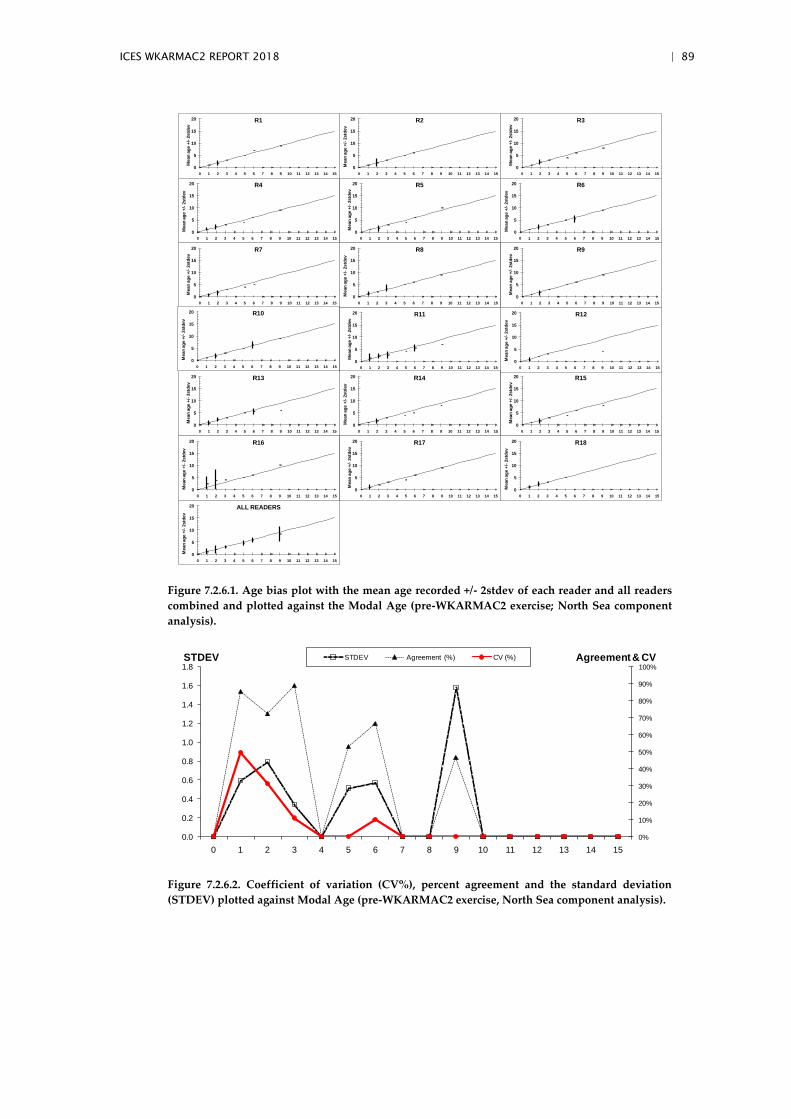
ICES WKARMAC2 REPORT 2018 | 89
Figure 7.2.6.1. Age bias plot with the mean age recorded +/- 2stdev of each reader and all readers
combined and plotted against the Modal Age (pre-WKARMAC2 exercise; North Sea component
analysis).
Figure 7.2.6.2. Coefficient of variation (CV%), percent agreement and the standard deviation
(STDEV) plotted against Modal Age (pre-WKARMAC2 exercise, North Sea component analysis).
0
5
10
15
20
0 1 2 3 4 5 6 7 8 9 10 11 12 13 14 15
Mean
ag
e +
/-2std
ev
R1
0
5
10
15
20
0 1 2 3 4 5 6 7 8 9 10 11 12 13 14 15
Mean
ag
e +
/-2std
ev
R2
0
5
10
15
20
0 1 2 3 4 5 6 7 8 9 10 11 12 13 14 15
Mean
ag
e +
/-2std
ev
R3
0
5
10
15
20
0 1 2 3 4 5 6 7 8 9 10 11 12 13 14 15
Mean
ag
e +
/-2std
ev
R5
0
5
10
15
20
0 1 2 3 4 5 6 7 8 9 10 11 12 13 14 15
Mean
ag
e +
/-2std
ev
R7
0
5
10
15
20
0 1 2 3 4 5 6 7 8 9 10 11 12 13 14 15
Mean
ag
e +
/-2std
ev
R9
0
5
10
15
20
0 1 2 3 4 5 6 7 8 9 10 11 12 13 14 15
Mean
ag
e +
/-2std
ev
R11
0
5
10
15
20
0 1 2 3 4 5 6 7 8 9 10 11 12 13 14 15
Mean
ag
e +
/-2std
ev
R13
0
5
10
15
20
0 1 2 3 4 5 6 7 8 9 10 11 12 13 14 15
Mean
ag
e +
/-2std
ev
R15
0
5
10
15
20
0 1 2 3 4 5 6 7 8 9 10 11 12 13 14 15
Mean
ag
e +
/-2std
ev
R17
0
5
10
15
20
0 1 2 3 4 5 6 7 8 9 10 11 12 13 14 15
Mean
ag
e +
/-2std
ev
R4
0
5
10
15
20
0 1 2 3 4 5 6 7 8 9 10 11 12 13 14 15
Mean
ag
e +
/-2std
ev
R6
0
5
10
15
20
0 1 2 3 4 5 6 7 8 9 10 11 12 13 14 15
Mean
ag
e +
/-2std
ev
R8
0
5
10
15
20
0 1 2 3 4 5 6 7 8 9 10 11 12 13 14 15
Mean
ag
e +
/-2std
ev
R10
0
5
10
15
20
0 1 2 3 4 5 6 7 8 9 10 11 12 13 14 15
Mean
ag
e +
/-2std
ev
R12
0
5
10
15
20
0 1 2 3 4 5 6 7 8 9 10 11 12 13 14 15
Mean
ag
e +
/-2std
ev
R14
0
5
10
15
20
0 1 2 3 4 5 6 7 8 9 10 11 12 13 14 15
Mean
ag
e +
/-2std
ev
R16
0
5
10
15
20
0 1 2 3 4 5 6 7 8 9 10 11 12 13 14 15
Mean
ag
e +
/-2std
ev
R18
0
5
10
15
20
0 1 2 3 4 5 6 7 8 9 10 11 12 13 14 15
Mean
ag
e +
/-2std
ev
ALL READERS
0%
10%
20%
30%
40%
50%
60%
70%
80%
90%
100%
0.0
0.2
0.4
0.6
0.8
1.0
1.2
1.4
1.6
1.8
0 1 2 3 4 5 6 7 8 9 10 11 12 13 14 15
STDEV Agreement (%) CV (%)STDEV Agreement & CV
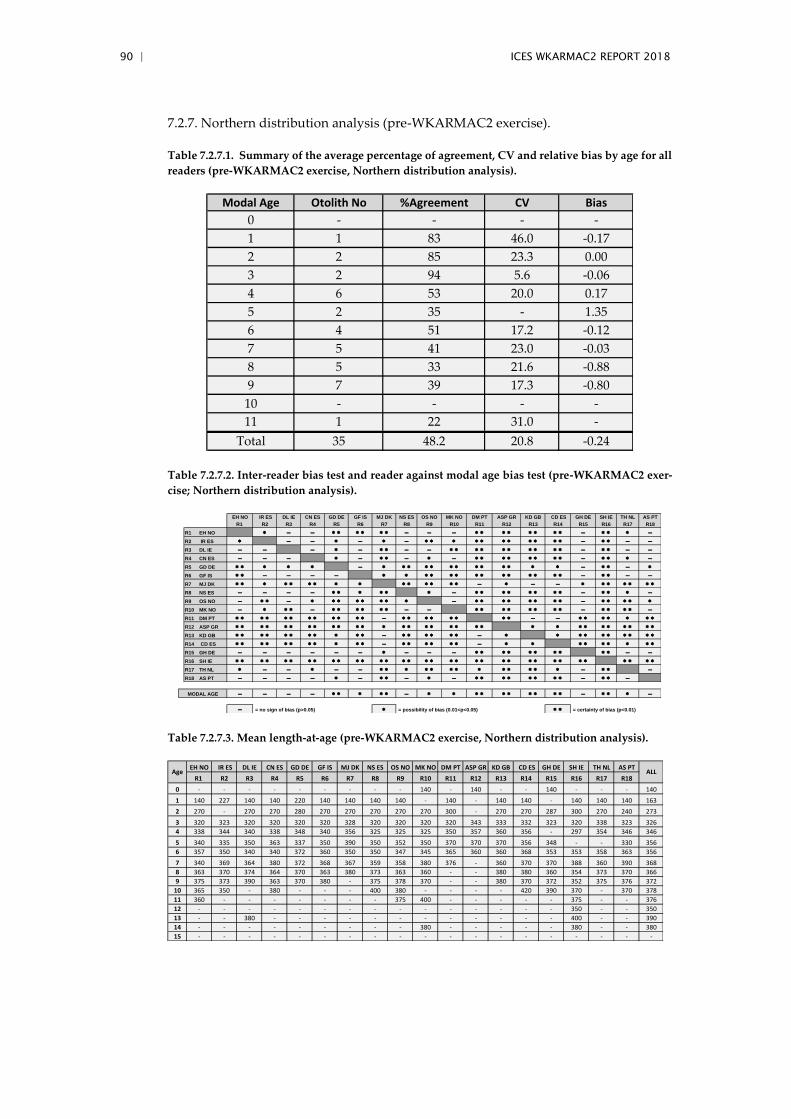
90 | ICES WKARMAC2 REPORT 2018
7.2.7. Northern distribution analysis (pre-WKARMAC2 exercise).
Table 7.2.7.1. Summary of the average percentage of agreement, CV and relative bias by age for all
readers (pre-WKARMAC2 exercise, Northern distribution analysis).
Table 7.2.7.2. Inter-reader bias test and reader against modal age bias test (pre-WKARMAC2 exer-
cise; Northern distribution analysis).
Table 7.2.7.3. Mean length-at-age (pre-WKARMAC2 exercise, Northern distribution analysis).
Modal Age Otolith No %Agreement CV Bias
0 - - - -
1 1 83 46.0 -0.17
2 2 85 23.3 0.00
3 2 94 5.6 -0.06
4 6 53 20.0 0.17
5 2 35 - 1.35
6 4 51 17.2 -0.12
7 5 41 23.0 -0.03
8 5 33 21.6 -0.88
9 7 39 17.3 -0.80
10 - - - -
11 1 22 31.0 -
Total 35 48.2 20.8 -0.24
EH NO IR ES DL IE CN ES GD DE GF IS MJ DK NS ES OS NO MK NO DM PT ASP GR KD GB CD ES GH DE SH IE TH NL AS PT
R1 R2 R3 R4 R5 R6 R7 R8 R9 R10 R11 R12 R13 R14 R15 R16 R17 R18
R1 EH NO * - - * * * * * * - - - * * * * * * * * - * * * -
R2 IR ES * - - * - * - * * * * * * * * * * * - * * - -
R3 DL IE - - - * - * * - - * * * * * * * * * * - * * - -
R4 CN ES - - - * - * * - * - * * * * * * * * - * * * -
R5 GD DE * * * * * - * * * * * * * * * * * * * - * * - *
R6 GF IS * * - - - - * * * * * * * * * * * * * * - * * - -
R7 MJ DK * * * * * * * * * * * * * * * - * - - * * * * * * *
R8 NS ES - - - - * * * * * * - * * * * * * * * - * * * -
R9 OS NO - * * - * * * * * * * * - * * * * * * * * - * * * * *
R10 MK NO - * * * - * * * * * * - - * * * * * * * * - * * * * -
R11 DM PT * * * * * * * * * * * * - * * * * * * * * - - * * * * * * *
R12 ASP GR * * * * * * * * * * * * * * * * * * * * * * * * * * * * * * *
R13 KD GB * * * * * * * * * * * - * * * * * * - * * * * * * * * * *
R14 CD ES * * * * * * * * * * * - * * * * * * - * * * * * * * * *
R15 GH DE - - - - - - * - - - * * * * * * * * * * - -
R16 SH IE * * * * * * * * * * * * * * * * * * * * * * * * * * * * * * * * * *
R17 TH NL * - - * - - * * * * * * * * * * * * * - * * -
R18 AS PT - - - - * - * * - * - * * * * * * * * - * * -
- - - - * * * * * - * * * * * * * * * * - * * * -
- = no sign of bias (p>0.05) * = possibility of bias (0.01<p<0.05) * * = certainty of bias (p<0.01)
MODAL AGE
EH NO IR ES DL IE CN ES GD DE GF IS MJ DK NS ES OS NO MK NO DM PT ASP GR KD GB CD ES GH DE SH IE TH NL AS PT
R1 R2 R3 R4 R5 R6 R7 R8 R9 R10 R11 R12 R13 R14 R15 R16 R17 R18
0 - - - - - - - - - 140 - 140 - - 140 - - - 140
1 140 227 140 140 220 140 140 140 140 - 140 - 140 140 - 140 140 140 163
2 270 - 270 270 280 270 270 270 270 270 300 - 270 270 287 300 270 240 273
3 320 323 320 320 320 320 328 320 320 320 320 343 333 332 323 320 338 323 326
4 338 344 340 338 348 340 356 325 325 325 350 357 360 356 - 297 354 346 346
5 340 335 350 363 337 350 390 350 352 350 370 370 370 356 348 - - 330 356
6 357 350 340 340 372 360 350 350 347 345 365 360 360 368 353 353 358 363 356
7 340 369 364 380 372 368 367 359 358 380 376 - 360 370 370 388 360 390 368
8 363 370 374 364 370 363 380 373 363 360 - - 380 380 360 354 373 370 366
9 375 373 390 363 370 380 - 375 378 370 - - 380 370 372 352 375 376 372
10 365 350 - 380 - - - 400 380 - - - - 420 390 370 - 370 378
11 360 - - - - - - - 375 400 - - - - - 375 - - 376
12 - - - - - - - - - - - - - - - 350 - - 350
13 - - 380 - - - - - - - - - - - - 400 - - 390
14 - - - - - - - - - 380 - - - - - 380 - - 380
15 - - - - - - - - - - - - - - - - - - -
Age ALL
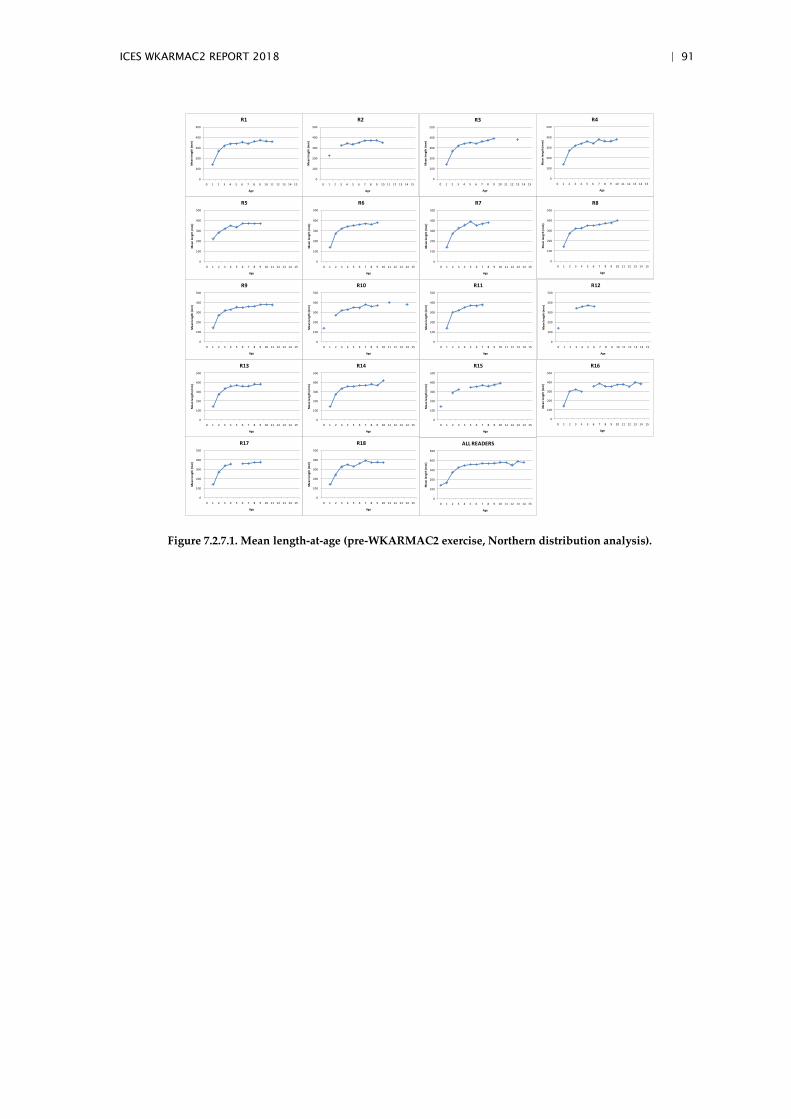
ICES WKARMAC2 REPORT 2018 | 91
Figure 7.2.7.1. Mean length-at-age (pre-WKARMAC2 exercise, Northern distribution analysis).
0
100
200
300
400
500
0 1 2 3 4 5 6 7 8 9 10 11 12 13 14 15
Me
an le
ngt
h (
mm
)
Age
ALL READERS
0
100
200
300
400
500
0 1 2 3 4 5 6 7 8 9 10 11 12 13 14 15
Me
an le
ngt
h (
mm
)Age
R1
0
100
200
300
400
500
0 1 2 3 4 5 6 7 8 9 10 11 12 13 14 15
Me
an le
ngt
h (
mm
)
Age
R2
0
100
200
300
400
500
0 1 2 3 4 5 6 7 8 9 10 11 12 13 14 15
Me
an le
ngt
h (
mm
)
Age
R3
0
100
200
300
400
500
0 1 2 3 4 5 6 7 8 9 10 11 12 13 14 15
Me
an le
ngt
h (
mm
)
Age
R4
0
100
200
300
400
500
0 1 2 3 4 5 6 7 8 9 10 11 12 13 14 15
Me
an le
ngt
h (
mm
)
Age
R5
0
100
200
300
400
500
0 1 2 3 4 5 6 7 8 9 10 11 12 13 14 15
Me
an le
ngt
h (
mm
)
Age
R6
0
100
200
300
400
500
0 1 2 3 4 5 6 7 8 9 10 11 12 13 14 15
Me
an le
ngt
h (
mm
)
Age
R7
0
100
200
300
400
500
0 1 2 3 4 5 6 7 8 9 10 11 12 13 14 15
Me
an le
ngt
h (
mm
)
Age
R8
0
100
200
300
400
500
0 1 2 3 4 5 6 7 8 9 10 11 12 13 14 15
Me
an le
ngt
h (
mm
)
Age
R9
0
100
200
300
400
500
0 1 2 3 4 5 6 7 8 9 10 11 12 13 14 15
Me
an le
ngt
h (
mm
)
Age
R10
0
100
200
300
400
500
0 1 2 3 4 5 6 7 8 9 10 11 12 13 14 15
Me
an le
ngt
h (
mm
)
Age
R11
0
100
200
300
400
500
0 1 2 3 4 5 6 7 8 9 10 11 12 13 14 15
Me
an le
ngt
h (
mm
)
Age
R12
0
100
200
300
400
500
0 1 2 3 4 5 6 7 8 9 10 11 12 13 14 15
Me
an le
ngt
h (
mm
)
Age
R13
0
100
200
300
400
500
0 1 2 3 4 5 6 7 8 9 10 11 12 13 14 15
Me
an le
ngt
h (
mm
)
Age
R14
0
100
200
300
400
500
0 1 2 3 4 5 6 7 8 9 10 11 12 13 14 15M
ean
len
gth
(m
m)
Age
R15
0
100
200
300
400
500
0 1 2 3 4 5 6 7 8 9 10 11 12 13 14 15
Me
an le
ngt
h (
mm
)
Age
R16
0
100
200
300
400
500
0 1 2 3 4 5 6 7 8 9 10 11 12 13 14 15
Me
an le
ngt
h (
mm
)
Age
R17
0
100
200
300
400
500
0 1 2 3 4 5 6 7 8 9 10 11 12 13 14 15
Me
an le
ngt
h (
mm
)
Age
R18
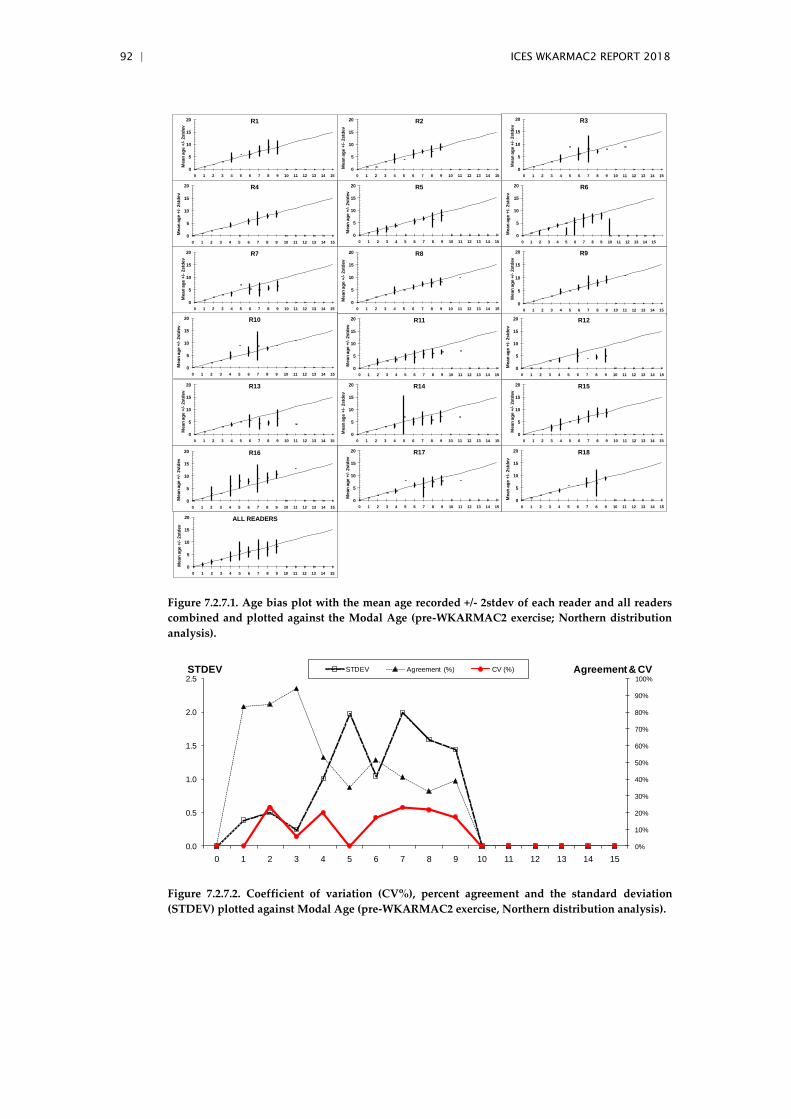
92 | ICES WKARMAC2 REPORT 2018
Figure 7.2.7.1. Age bias plot with the mean age recorded +/- 2stdev of each reader and all readers
combined and plotted against the Modal Age (pre-WKARMAC2 exercise; Northern distribution
analysis).
Figure 7.2.7.2. Coefficient of variation (CV%), percent agreement and the standard deviation
(STDEV) plotted against Modal Age (pre-WKARMAC2 exercise, Northern distribution analysis).
0
5
10
15
20
0 1 2 3 4 5 6 7 8 9 10 11 12 13 14 15
Mean
ag
e +
/-2std
ev
R1
0
5
10
15
20
0 1 2 3 4 5 6 7 8 9 10 11 12 13 14 15
Mean
ag
e +
/-2std
ev
R2
0
5
10
15
20
0 1 2 3 4 5 6 7 8 9 10 11 12 13 14 15
Mean
ag
e +
/-2std
ev
R3
0
5
10
15
20
0 1 2 3 4 5 6 7 8 9 10 11 12 13 14 15
Mean
ag
e +
/-2std
ev
R5
0
5
10
15
20
0 1 2 3 4 5 6 7 8 9 10 11 12 13 14 15
Mean
ag
e +
/-2std
ev
R7
0
5
10
15
20
0 1 2 3 4 5 6 7 8 9 10 11 12 13 14 15
Mean
ag
e +
/-2std
ev
R9
0
5
10
15
20
0 1 2 3 4 5 6 7 8 9 10 11 12 13 14 15
Mean
ag
e +
/-2std
ev
R11
0
5
10
15
20
0 1 2 3 4 5 6 7 8 9 10 11 12 13 14 15
Mean
ag
e +
/-2std
ev
R13
0
5
10
15
20
0 1 2 3 4 5 6 7 8 9 10 11 12 13 14 15
Mean
ag
e +
/-2std
ev
R15
0
5
10
15
20
0 1 2 3 4 5 6 7 8 9 10 11 12 13 14 15
Mean
ag
e +
/-2std
ev
R17
0
5
10
15
20
0 1 2 3 4 5 6 7 8 9 10 11 12 13 14 15
Mean
ag
e +
/-2std
ev
R4
0
5
10
15
20
0 1 2 3 4 5 6 7 8 9 10 11 12 13 14 15
Mean
ag
e +
/-2std
ev
R6
0
5
10
15
20
0 1 2 3 4 5 6 7 8 9 10 11 12 13 14 15
Mean
ag
e +
/-2std
ev
R8
0
5
10
15
20
0 1 2 3 4 5 6 7 8 9 10 11 12 13 14 15
Mean
ag
e +
/-2std
ev
R10
0
5
10
15
20
0 1 2 3 4 5 6 7 8 9 10 11 12 13 14 15
Mean
ag
e +
/-2std
ev
R12
0
5
10
15
20
0 1 2 3 4 5 6 7 8 9 10 11 12 13 14 15
Mean
ag
e +
/-2std
ev
R14
0
5
10
15
20
0 1 2 3 4 5 6 7 8 9 10 11 12 13 14 15
Mean
ag
e +
/-2std
ev
R16
0
5
10
15
20
0 1 2 3 4 5 6 7 8 9 10 11 12 13 14 15M
ean
ag
e +
/-2std
ev
R18
0
5
10
15
20
0 1 2 3 4 5 6 7 8 9 10 11 12 13 14 15
Mean
ag
e +
/-2std
ev
ALL READERS
0%
10%
20%
30%
40%
50%
60%
70%
80%
90%
100%
0.0
0.5
1.0
1.5
2.0
2.5
0 1 2 3 4 5 6 7 8 9 10 11 12 13 14 15
STDEV Agreement (%) CV (%)STDEV Agreement & CV
Recommended