Page 1 of 8
2011-xx-xxxx
Improving Compressed Air Energy Efficiency in Automotive Plants
Nasr Alkadi, Kelly Kissock Copyright © 2011 SAE International
ABSTRACT
Automotive stamping and assembly plants are typically large users of compressed air with annual compressed air electricity bills over
$500,000 per year. This paper describes typical compressed air systems in automotive stamping and assembly plants, and compares
these systems to best practices. The paper then presents a series of case studies, organized using the inside-out approach, that identify
significant energy savings in automotive plants. Case studies include ways to reduce end use compressed air by replacing pneumatic
motors with electric motors and replacing pneumatic suction cups with magnets, reduce distribution losses by replacing braided with
rubber hoses, reduce drying losses by employing demand-based desiccant regeneration, and control losses by increasing throttling
capability and operating centrifugal air compressors in auto-dual control mode.
PAPER OUTLINE
This paper presents a series of case studies that identified significant energy savings in automotive plants. The case studies are
presented using the inside-out approach of first minimizing end use demand, then minimizing distribution losses, and finally making
improvements to primary energy conversion equipment, the air compressor plant (Kissock, XXXX). Case studies include ways to
reduce end use compressed air by replacing air-powered tools with electric tools and replacing pneumatic suction cups with magnets,
reduce distribution losses by replacing braided with rubber hoses, reduce drying losses by employing demand-based desiccant
regeneration, and reduce control losses by increase throttling range and operating centrifugal air compressors in auto-dual control
mode.
ENERGY USAGE PATTERNS IN VEHICLE ASSEMBLY PLANT
To study the opportunities for energy systems improvement, it is important to understand how energy is used in auto assembly plant.
This should include the distribution of each type of energy stream and the total amount of energy used in each operation as well as a
thorough study of the load curve of the given plant. The main energy sources in a typical auto assembly plant are fossil fuels (natural
gas and sometimes coal), and electricity. Fuels are mainly used for space heating, steam generation, and in the curing ovens of the
painting lines. Electricity is used throughout the facility for many different purposes, e.g. compressed air, lighting, ventilation, air
conditioning, motors, materials handling and welding. Estimates of the energy usage in vehicle assembly plants may vary among
plants based on the processes used in that facility [4]. This variation presents a challenge when trying to benchmark the energy use
between auto assembly plants [4]. However, in this paper, we provide a methodological approach that is applicable to U.S auto
industry in general. For this purpose, the differences between plants are not as much of importance; noting that the approach
developed may still apply to other assembly plants. Figures 1, 2, 3, and 4 summarize the patterns of energy usage in a typical U.S auto
assembly plant.
Page 2 of 8
Fig. 1 Energy Distribution by Type in a Typical Auto Assembly Plant
Fuel to
Generate
Steam
63%
NG
12%
Electricity
25%
Fig. 2 Main Electrical Energy Consumers in a Typical Auto Assembly
Plant
Motors and
Welders
49%
Lighting
12%
HVAC
14%
Comp Air
25%
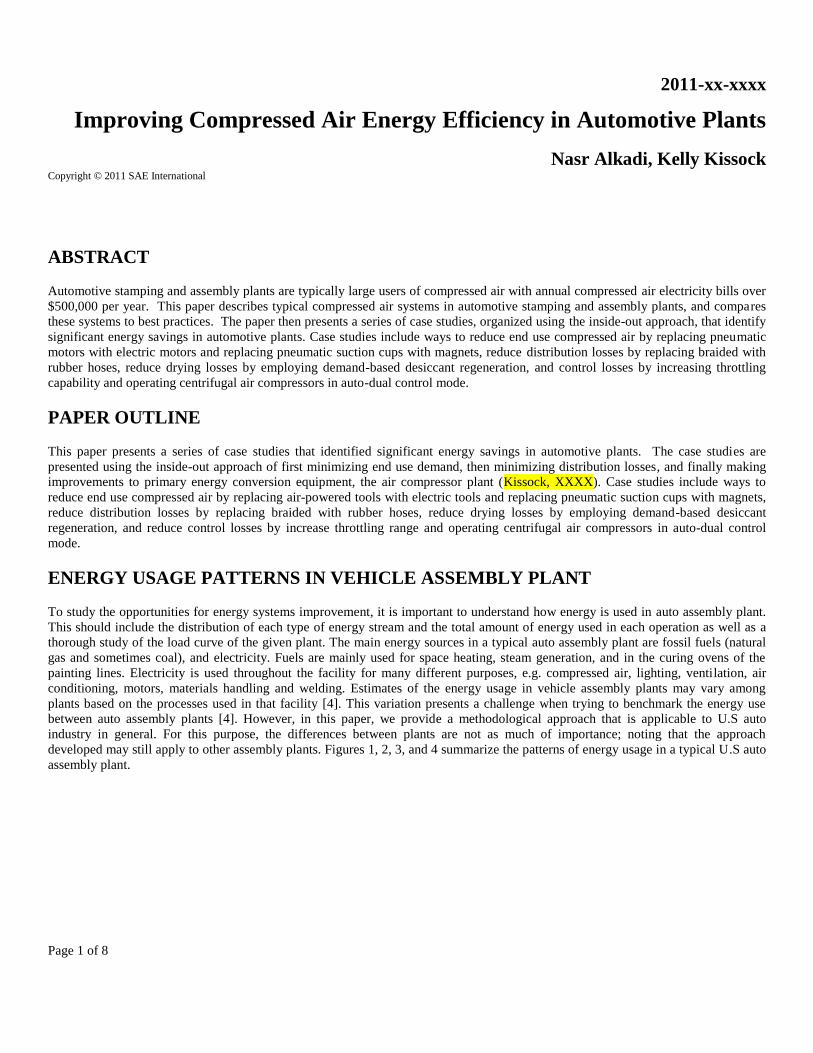
Figure 1. a) Total energy use breakdown and b) electricity use breakdown in typical automotive stamping and assembly plants.
As shown in Fig. 1, Fuels represent 75% of the energy use, while the electricity represents the remaining 25% of the total energy use
in a typical auto assembly plant. About two-thirds of the energy budget in assembly plants is spent on electricity due to the difference
in prices between fossil fuels and electricity. This demonstrates the importance of the electricity in the fuel mix [4]. Fig. 2 shows that
the electric motors and welding machines account for nearly 50% of all electricity used to drive the different pieces of equipment in
the plant and metal welding operations. This emphasizes the importance of motor system optimization and adopting technologies such
as high efficiency welding systems including power factor improvement techniques in the energy efficiency improvement strategies.
Compressed air system accounts for 25% of all electricity used underlying the importance of repairing air leaks, and using more
efficient air assisted equipment as an interim step to minimize the dependency on compressed air to lowest level possible through
upcoming emerging technologies.
TYPICAL COMPRESSED AIR ENERGY USE
Automotive stamping and assembly plants are typically large users of compressed air. As shown in Figure. 1a, fuels represent 75% of
the energy use, while the electricity represents the remaining 25% of the total energy use in a typical auto assembly plant. About two-
thirds of the energy budget in assembly plants is spent on electricity due to the difference in prices between fossil fuels and electricity.
Figure 1b shows that compressed air system accounts for 25% of all electricity used underlying the importance of repairing air leaks,
and using more efficient air assisted equipment as an interim step to minimize the dependency on compressed air to lowest level
possible through upcoming emerging technologies. Thus, in automotive plants compressed air comprises about 17% of total energy
costs (Alkadi, 2006).
TYPICAL COMPRESSED AIR SYSTEMS IN AUTOMOTIVE PLANTS
Automotive assembly and stamping plants typically use compressed air for counter balance, suction cups, clutching brakes, die lifters,
pneumatic tools and motors, and cushion cylinders.
Primary systems typically compress air to a discharge pressure of about 95 psig and supply compressed air at the end use at about 90
psig. Most large plants use 10-inch to 12-inch looped distribution systems to minimize pressure losses in the headers. Due to the
prevalence of centrifugal compressors, many plants have no dedicated primary compressed air storage; instead they rely entirely on
the distribution piping system for pressure buffering. The relatively low compressed air pressure and distribution pressure drop are
consistent with industry best practices.
Primary air is typically supplied by some combination of water-cooled centrifugal air compressors. These compressors typically range
in size from 700 hp and 3,200 cfm to 2,000 hp and 7,500 cfm. The 2,000 hp compressors draw about 1,500 kW at full load. The
centrifugal compressors have limited modulation capacity using either variable inlet vans or inlet butterfly valves to reduce supply air.
When compressed air demand falls below the lower modulation limit, compressed air is typically discharged to atmosphere using
blow-off control. Compressors are typically started and stopped manually to adjust to changing compressed air demand during
different shifts and weekends. In many cases, the centrifugal compressors are configured to compress cooler outside air for
compression, which reduces energy consumption.
Page 3 of 8
In some plants, compressed air is also supplied through a separate high-pressure distribution system. High pressure systems supply air
at up to 210 psig and typically use multiple screw compressors. The screw compressors are typically sequenced using set-point
pressures or automated controls so that the minimum number of compressor are operated. Compressed air is typically dried to a
dewpoint temperature of about -25 F to -30 F using heated desiccant dryers. The desiccant dryers are typically regenerated using
electric resistance heaters and purge air. The regeneration cycles may or may not vary automatically with the load.
The compressed air demand in automotive plants typically varies from shift to shift and between weekdays and weekends. Peak
demand in large plants can be up to 20,000 cfm. Weekend demand is typically 10% to 40% of peak demand and may be dominated
by leaks. On any given shift, compressed air capacity generally exceeds average demand for the shift by up to a factor of two. For
example, if average compressed air demand is 7,000 cfm during first shift, it may be common practice to operate some combination of
air compressors such that the total compressed air capacity is between 10,000 cfm and 14,000 cfm. The ratio of capacity to average
demand is generally a function of the sizes of compressors available for operation, the variation in compressed air demand during the
shift, and the factor of safety desired by compressor operators. In many plants, the factor of safety varies with operators, so that one
operator may be comfortable operating with a capacity to average demand ration of 1.4 while another operator desires a larger ratio of
2.0.
Total air compressor electricity use in large automotive plants is typically from about 10,000,000 kWh/yr to 15,000,000 kWh/yr, costs
between $600,000 and 900,000 per year, and accounts for 12% to 20% of plant electricity use and cost.
REPLACING AIR-POWERED TOOLS WITH ELECTRIC TOOLS
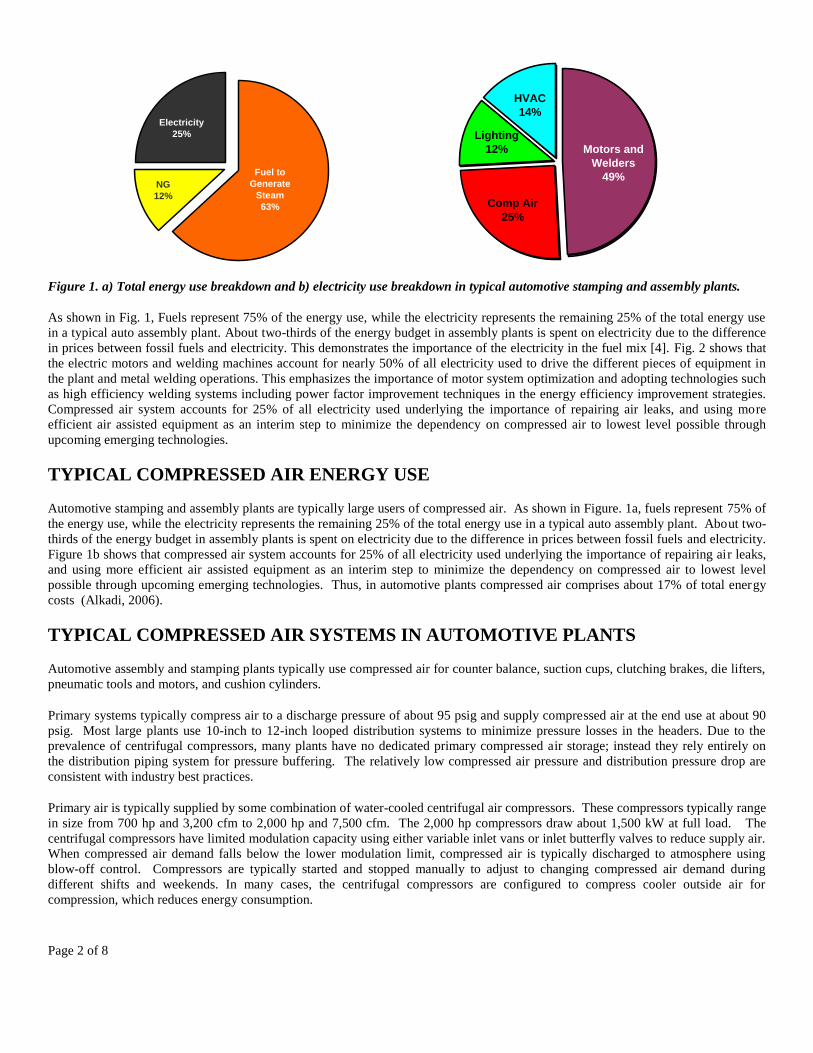
Air powered motors use about 25 cfm of compressed air per hp of power output, which translates to about seven times more electricity
than electric motors to generate the same work output. Thus, their use should be limited to applications that absolutely require
pneumatic tooling and motors. In addition to using less electricity, electric tools also eliminate oil mist on products and reduce
maintenance on the air tools. For example, in one plant, operators frequently complained about the oil mist associated with air tools.
Maintenance personnel respond by reducing the lubrication oil in the compressed air. If not done exactly right, the tools became
under lubricated and needed frequent maintenance. For example, one air powered tool was repaired about 20 times per year at about
$1,500 per repair. Replacing air powered tools with electric powered tools eliminated the oil mist problem, dramatically reduced
maintenance costs on the tools, and dramatically reduced electricity use. Consider the energy savings from replacing 100 1-hp air
powered tools operating 6,000 hours per year with electric powered tools. The electricity cost savings would be about: Cost Savings =
100 hp / 0.90 x 6/7 x 0.75 kW/hp 6,000 hr/yr x $0.10 /kWh = $43,000 /yr
Figure 2. Air pumps use seven times more electricity than electrical pumps
Page 4 of 8
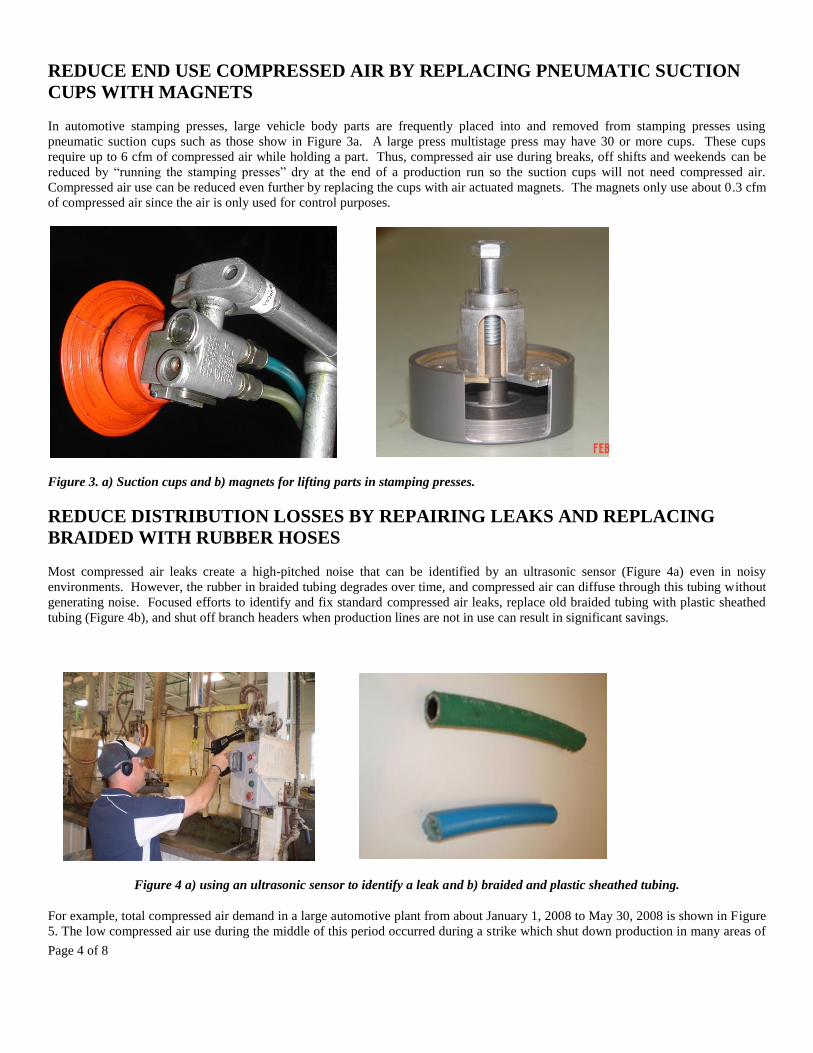
REDUCE END USE COMPRESSED AIR BY REPLACING PNEUMATIC SUCTION
CUPS WITH MAGNETS
In automotive stamping presses, large vehicle body parts are frequently placed into and removed from stamping presses using
pneumatic suction cups such as those show in Figure 3a. A large press multistage press may have 30 or more cups. These cups
require up to 6 cfm of compressed air while holding a part. Thus, compressed air use during breaks, off shifts and weekends can be
reduced by “running the stamping presses” dry at the end of a production run so the suction cups will not need compressed air.
Compressed air use can be reduced even further by replacing the cups with air actuated magnets. The magnets only use about 0.3 cfm
of compressed air since the air is only used for control purposes.
Figure 3. a) Suction cups and b) magnets for lifting parts in stamping presses.
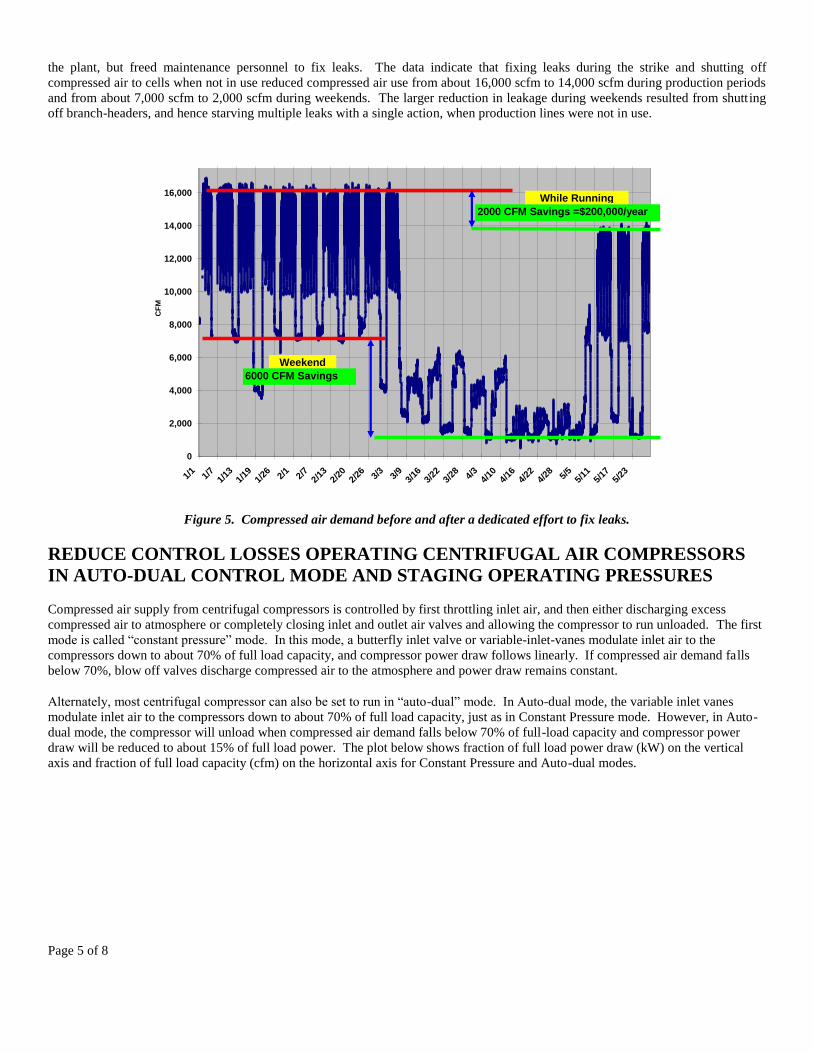
REDUCE DISTRIBUTION LOSSES BY REPAIRING LEAKS AND REPLACING
BRAIDED WITH RUBBER HOSES
Most compressed air leaks create a high-pitched noise that can be identified by an ultrasonic sensor (Figure 4a) even in noisy
environments. However, the rubber in braided tubing degrades over time, and compressed air can diffuse through this tubing without
generating noise. Focused efforts to identify and fix standard compressed air leaks, replace old braided tubing with plastic sheathed
tubing (Figure 4b), and shut off branch headers when production lines are not in use can result in significant savings.
Figure 4 a) using an ultrasonic sensor to identify a leak and b) braided and plastic sheathed tubing.
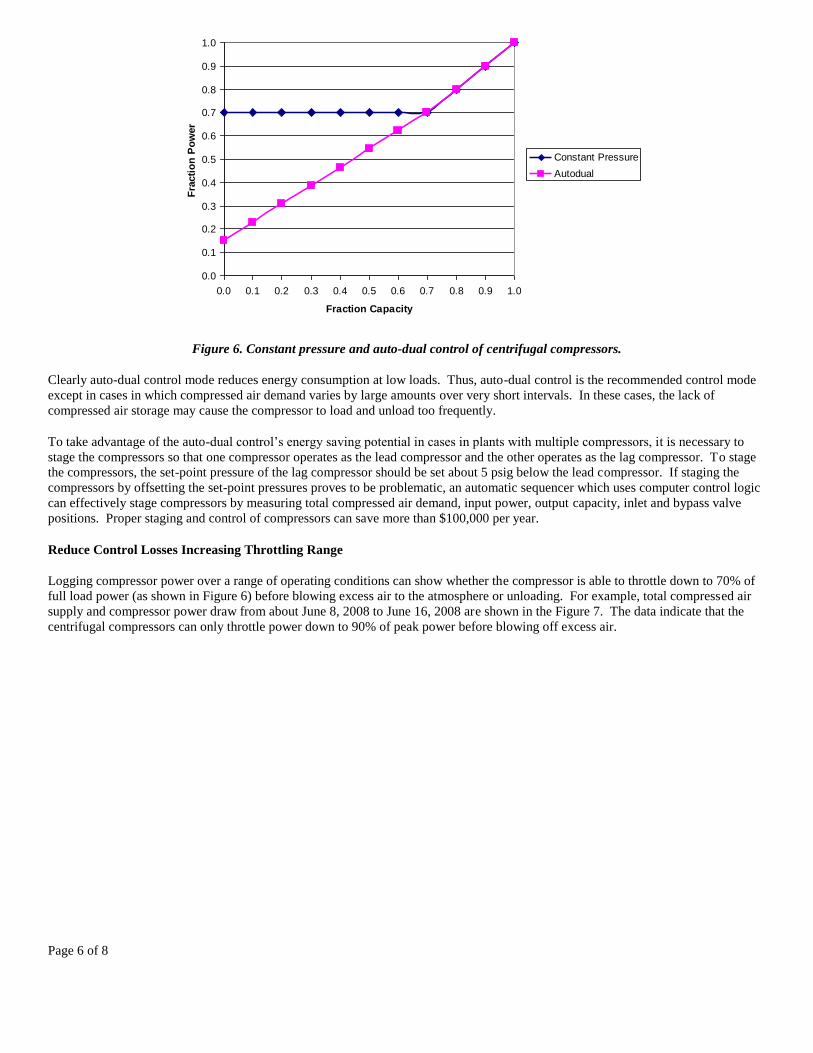
For example, total compressed air demand in a large automotive plant from about January 1, 2008 to May 30, 2008 is shown in Figure
5. The low compressed air use during the middle of this period occurred during a strike which shut down production in many areas of
Page 5 of 8
the plant, but freed maintenance personnel to fix leaks. The data indicate that fixing leaks during the strike and shutting off
compressed air to cells when not in use reduced compressed air use from about 16,000 scfm to 14,000 scfm during production periods
and from about 7,000 scfm to 2,000 scfm during weekends. The larger reduction in leakage during weekends resulted from shutting
off branch-headers, and hence starving multiple leaks with a single action, when production lines were not in use.
Figure 5. Compressed air demand before and after a dedicated effort to fix leaks.
REDUCE CONTROL LOSSES OPERATING CENTRIFUGAL AIR COMPRESSORS
IN AUTO-DUAL CONTROL MODE AND STAGING OPERATING PRESSURES
Compressed air supply from centrifugal compressors is controlled by first throttling inlet air, and then either discharging excess
compressed air to atmosphere or completely closing inlet and outlet air valves and allowing the compressor to run unloaded. The first
mode is called “constant pressure” mode. In this mode, a butterfly inlet valve or variable-inlet-vanes modulate inlet air to the
compressors down to about 70% of full load capacity, and compressor power draw follows linearly. If compressed air demand falls
below 70%, blow off valves discharge compressed air to the atmosphere and power draw remains constant.
Alternately, most centrifugal compressor can also be set to run in “auto-dual” mode. In Auto-dual mode, the variable inlet vanes
modulate inlet air to the compressors down to about 70% of full load capacity, just as in Constant Pressure mode. However, in Auto-
dual mode, the compressor will unload when compressed air demand falls below 70% of full-load capacity and compressor power
draw will be reduced to about 15% of full load power. The plot below shows fraction of full load power draw (kW) on the vertical
axis and fraction of full load capacity (cfm) on the horizontal axis for Constant Pressure and Auto-dual modes.
0
2,000
4,000
6,000
8,000
10,000
12,000
14,000
16,000
18,000
1/1
1/7
1/13
1/19
1/26 2/
12/
72/
132/
202/
26 3/3
3/9
3/16
3/22
3/28 4/
34/
104/
164/
224/
28 5/5
5/11
5/17
5/23
CF
M
2000 CFM Savings =$200,000/year
Wentzville Compressed Air Status Before & After Fixing Leaks - Plant total
While Running
Weekend
6000 CFM Savings
Page 6 of 8
0.0
0.1
0.2
0.3
0.4
0.5
0.6
0.7
0.8
0.9
1.0
0.0 0.1 0.2 0.3 0.4 0.5 0.6 0.7 0.8 0.9 1.0
Fraction Capacity
Fra
cti
on
Po
wer
Constant Pressure
Autodual
Figure 6. Constant pressure and auto-dual control of centrifugal compressors.
Clearly auto-dual control mode reduces energy consumption at low loads. Thus, auto-dual control is the recommended control mode
except in cases in which compressed air demand varies by large amounts over very short intervals. In these cases, the lack of
compressed air storage may cause the compressor to load and unload too frequently.
To take advantage of the auto-dual control’s energy saving potential in cases in plants with multiple compressors, it is necessary to
stage the compressors so that one compressor operates as the lead compressor and the other operates as the lag compressor. To stage
the compressors, the set-point pressure of the lag compressor should be set about 5 psig below the lead compressor. If staging the
compressors by offsetting the set-point pressures proves to be problematic, an automatic sequencer which uses computer control logic
can effectively stage compressors by measuring total compressed air demand, input power, output capacity, inlet and bypass valve
positions. Proper staging and control of compressors can save more than $100,000 per year.
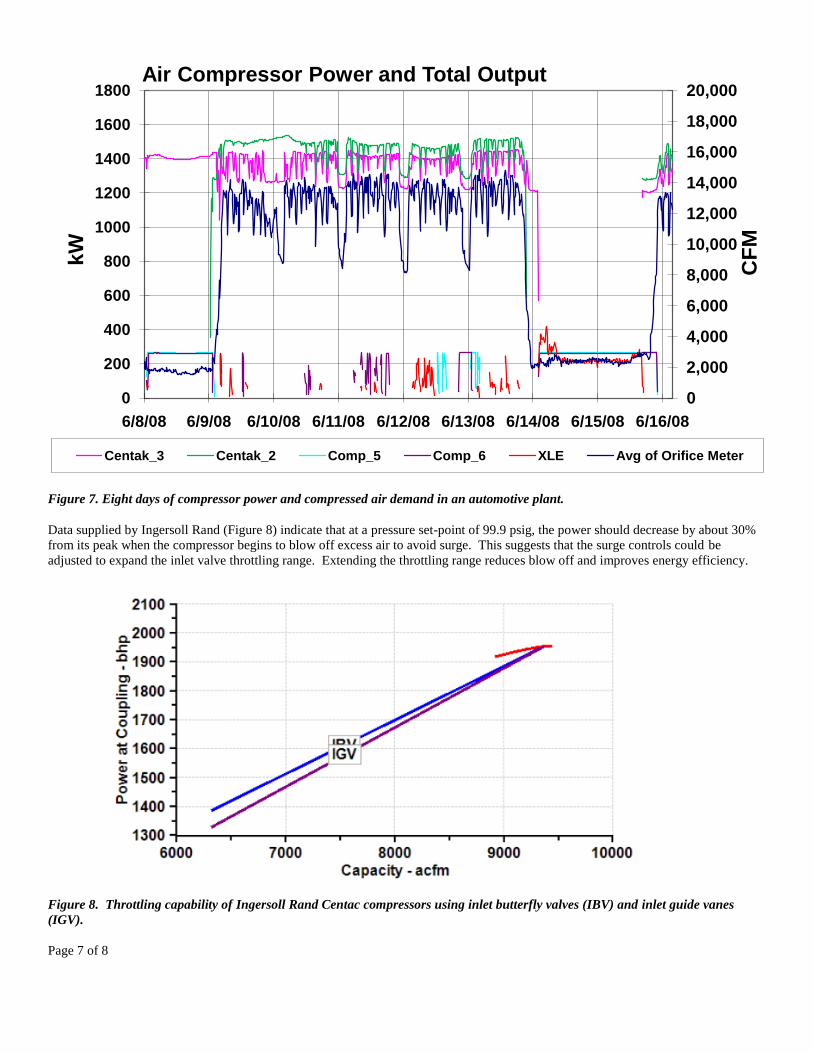
Reduce Control Losses Increasing Throttling Range
Logging compressor power over a range of operating conditions can show whether the compressor is able to throttle down to 70% of
full load power (as shown in Figure 6) before blowing excess air to the atmosphere or unloading. For example, total compressed air
supply and compressor power draw from about June 8, 2008 to June 16, 2008 are shown in the Figure 7. The data indicate that the
centrifugal compressors can only throttle power down to 90% of peak power before blowing off excess air.
Page 7 of 8
Figure 7. Eight days of compressor power and compressed air demand in an automotive plant.
Data supplied by Ingersoll Rand (Figure 8) indicate that at a pressure set-point of 99.9 psig, the power should decrease by about 30%
from its peak when the compressor begins to blow off excess air to avoid surge. This suggests that the surge controls could be
adjusted to expand the inlet valve throttling range. Extending the throttling range reduces blow off and improves energy efficiency.
Figure 8. Throttling capability of Ingersoll Rand Centac compressors using inlet butterfly valves (IBV) and inlet guide vanes
(IGV).
0
2,000
4,000
6,000
8,000
10,000
12,000
14,000
16,000
18,000
20,000
0
200
400
600
800
1000
1200
1400
1600
1800
6/8/08 6/9/08 6/10/08 6/11/08 6/12/08 6/13/08 6/14/08 6/15/08 6/16/08
CF
M
kW
Air Compressor Power and Total Output
Centak_3 Centak_2 Comp_5 Comp_6 XLE Avg of Orifice Meter
Page 8 of 8
SUMMARY/CONCLUSIONS
This paper described typical compressed air systems in automotive stamping and assembly plants, and compared these systems to best
practices. The paper then presented a series of case studies, organized using the inside-out approach, that identify significant energy
savings in automotive plants. Case studies include ways to reduce end use compressed air by replacing pneumatic motors with
electric motors and replacing pneumatic suction cups with magnets, reduce distribution losses by replacing braided with rubber hoses
and control losses by increasing throttling capability and operating centrifugal air compressors in auto-dual control mode.
REFERENCES
Alkadi N., 2006, “Energy and Productivity, Two Sides of a Coin in the U.S. Auto Industry”, 2006 SAE World Congress, Detroit,
Michigan, April 3-6, 2006, 2006-01-0833,
CONTACT INFORMATION
ACKNOWLEDGMENTS
This work was graciously supported by the U.S. Department of Energy Industrial Technologies Program through its support of the
Industrial Assessment Center program.
DEFINITIONS/ABBREVIATIONS
SA
sample abbreviations
UBT use borderless table ≤ 3.5
inches wide
APPENDIX
Recommended