Influence of lithology and climate on spring chemistry in
the Upper Deschutes River watershed, Oregon
Julia E. Schwarz
Senior Integrative Exercise
March 10, 2010
Submitted in partial fulfillment of the requirements for a
Bachelor of Arts degree from Carleton College, Northfield, Minnesota
Table of Contents Abstract Introduction . . . . . . 1 Quantifying weathering controls . . 1 Constraining groundwater age . . 3 Geologic Setting . . . . . 3 Methods . . . . . . 9 Results . . . . . . 11 Geologic Map . . . . 11 Chlorofluorocarbons(CFCs) . . . 11 Field Data . . . . . 14 Trace Element Data and Lab Analyses . 16 Discussion . . . . . . 21 pH. . . . . . . 21
Conductivity and Alkalinity. . . . 23 Spring Temperature. . . . . 24 Dissolved Oxygen Content (DO) . . 25 Dissolved Organic Carbon (DOC) . . 26 Trace Elements . . . . 26 Rare Earth Elements (REEs) . . 26 Other Trace Elements . . . 28 Fe, Al, Mn, Sm, and Nd . . 28 Lithium and Arsenic . . 29 Strontium . . . 30 Vanadium . . . 30 Groundwater Residence Time . . . 30 Weathering Rates . . . . 32 Trace elements and climatic influences . 33 Lithologic influences on trace elements . 33 Conclusions . . . . . . 35 Future Work . . . . . 36 Acknowledgements . . . . . 37 References Cited . . . . . 37
Influence of lithology and climate on spring chemistry in the Upper Deschutes River watershed, Oregon
Julia E. Schwarz
Senior Integrative Exercise
March 10, 2010
Advisors:
Bereket Haileab and Cameron Davidson, Carleton College Department of Geology ABSTRACT Fourteen springs in the Upper Deschutes River watershed, Oregon, were sampled to determine factors contributing to trace element distribution within the watershed. In particular, two areas were compared for differing climate and lithology; the Ochoco Mountains in the east had higher concentrations of trace elements compared to springs within 30 km of the Cascades Mountains crest. Specific trace elements (Fe, Al, Mn, Sm, Nd, Li, As, V) within these spring waters were examined for links with precipitation, air temperature, and catchment lithology. Rock composition plays a large role in element concentrations. For example, vanadium concentrations act as a tracer for certain rock units, particularly the youngest Quaternary basalts and Tertiary andesites. Bedrock age may also play a role in element concentrations, with older rocks in the Ochocos contributing to higher trace element concentrations. Throughout all springs, the weathering relationships between Fe, Al, Mn, Sm, and Nd are constant, though the weathering rate is higher in the Ochocos. High spring temperature and arsenic concentrations indicate that some springs are part of a deeper regional groundwater flow.
Keywords: Deschutes River, ground water, springs, geochemistry, chemical weathering, trace elements, rare earth elements
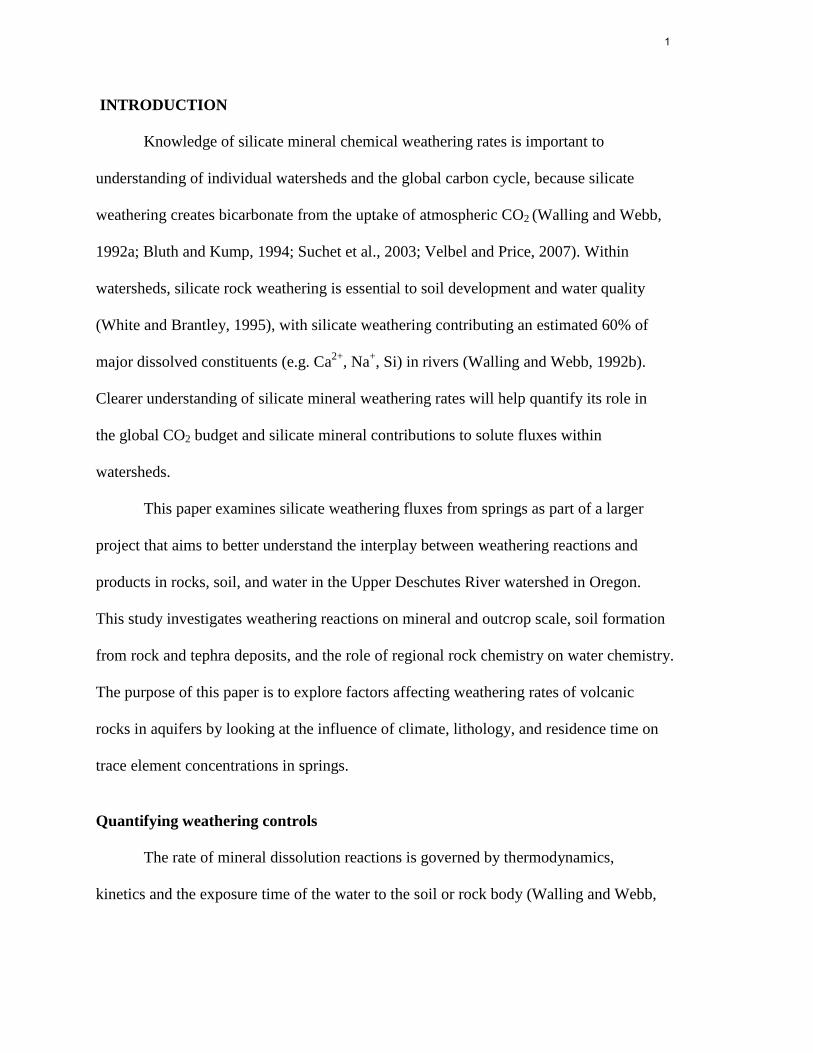
INTRODUCTION
Knowledge of silicate mineral chemical weathering rates is important to
understanding of individual watersheds and the global carbon cycle, because silicate
weathering creates bicarbonate from the uptake of atmospheric CO2 (Walling and Webb,
1992a; Bluth and Kump, 1994; Suchet et al., 2003; Velbel and Price, 2007). Within
watersheds, silicate rock weathering is essential to soil development and water quality
(White and Brantley, 1995), with silicate weathering contributing an estimated 60% of
major dissolved constituents (e.g. Ca2+
, Na+, Si) in rivers (Walling and Webb, 1992b).
Clearer understanding of silicate mineral weathering rates will help quantify its role in
the global CO2 budget and silicate mineral contributions to solute fluxes within
watersheds.
This paper examines silicate weathering fluxes from springs as part of a larger
project that aims to better understand the interplay between weathering reactions and
products in rocks, soil, and water in the Upper Deschutes River watershed in Oregon.
This study investigates weathering reactions on mineral and outcrop scale, soil formation
from rock and tephra deposits, and the role of regional rock chemistry on water chemistry.
The purpose of this paper is to explore factors affecting weathering rates of volcanic
rocks in aquifers by looking at the influence of climate, lithology, and residence time on
trace element concentrations in springs.
Quantifying weathering controls
The rate of mineral dissolution reactions is governed by thermodynamics,
kinetics and the exposure time of the water to the soil or rock body (Walling and Webb,
1

1992b). The reaction rate depends on the solute concentrations already in the water, and
the residence time determines if the reaction runs to equilibrium.
The rate of weathering is also determined by lithology (Walling and Webb, 1992b;
Bluth and Kump, 1994; Bowser and Jones, 2002), because varying mineral compositions
will lead to variable weathering rates. Spatial variation in weathering rates are found due
to a variety of climactic factors, including elevation, temperature (ambient and mean
annual), precipitation, and topographic features (Walling and Webb, 1992b; Bluth and
Kump, 1994).
One of the most reliable and straightforward ways of quantifying weathering
reactions in the field is a geochemical mass-balance model, sometimes referred to as
input-output or solute budgeting (Garrels and Mackenzie, 1967; Bricker and Jones, 2005;
Velbel and Price, 2007). Mass-balance model objectives include quantifying fluxes in
and out of the system, interpreting mineral weathering reactions, and determining
weathering rates of minerals (Bricker and Jones, 2005). Mass-balance models generally
use concentrations (this study) or mass flux of solutes (Bricker and Jones, 2005). Studies
based on concentration of elements in the system are useful in determining the
weathering reactions that are occurring, but they do not provide sufficient information to
determine quantitative weathering rates. In mass-balance models, a closed system is
assumed and all system inputs and outputs must be defined (White and Brantley, 1995;
Bricker and Jones, 2005; Velbel and Price, 2007).
System inputs include all processes that introduce minerals or elements into the
system. Precipitation is one of the major system inputs. Spring chemistry is affected by
2
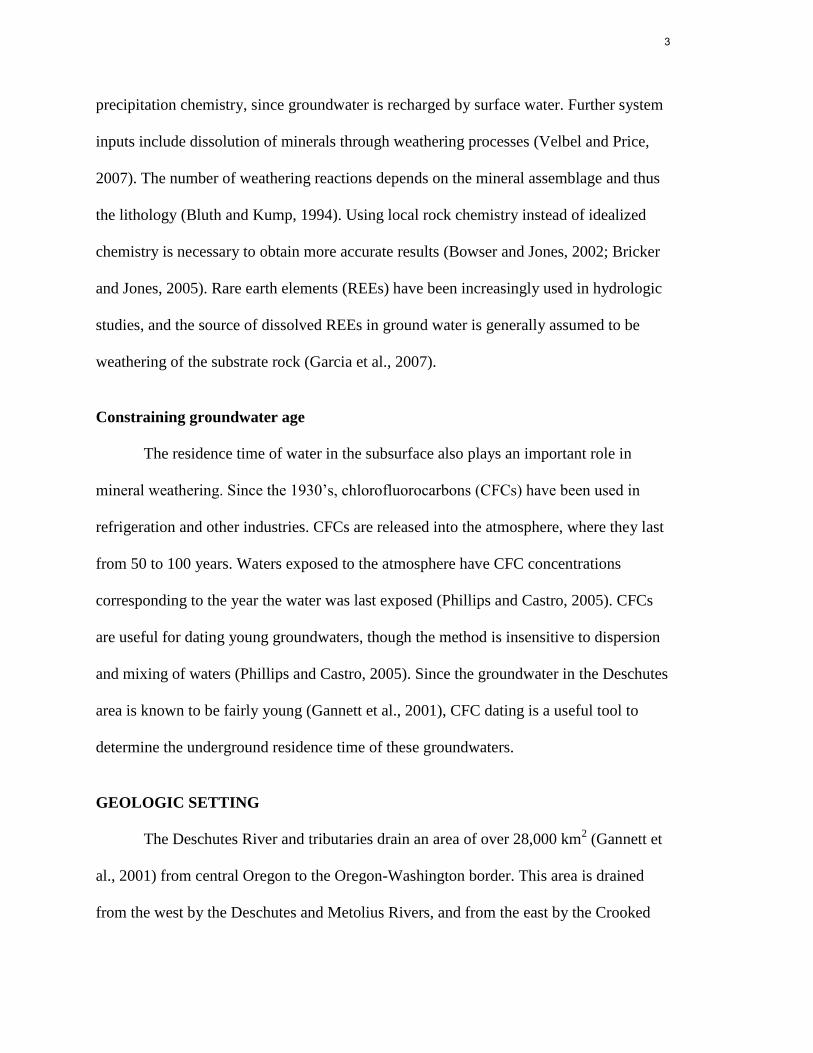
precipitation chemistry, since groundwater is recharged by surface water. Further system
inputs include dissolution of minerals through weathering processes (Velbel and Price,
2007). The number of weathering reactions depends on the mineral assemblage and thus
the lithology (Bluth and Kump, 1994). Using local rock chemistry instead of idealized
chemistry is necessary to obtain more accurate results (Bowser and Jones, 2002; Bricker
and Jones, 2005). Rare earth elements (REEs) have been increasingly used in hydrologic
studies, and the source of dissolved REEs in ground water is generally assumed to be
weathering of the substrate rock (Garcia et al., 2007).
Constraining groundwater age
The residence time of water in the subsurface also plays an important role in
mineral weathering. Since the 1930’s, chlorofluorocarbons (CFCs) have been used in
refrigeration and other industries. CFCs are released into the atmosphere, where they last
from 50 to 100 years. Waters exposed to the atmosphere have CFC concentrations
corresponding to the year the water was last exposed (Phillips and Castro, 2005). CFCs
are useful for dating young groundwaters, though the method is insensitive to dispersion
and mixing of waters (Phillips and Castro, 2005). Since the groundwater in the Deschutes
area is known to be fairly young (Gannett et al., 2001), CFC dating is a useful tool to
determine the underground residence time of these groundwaters.
GEOLOGIC SETTING
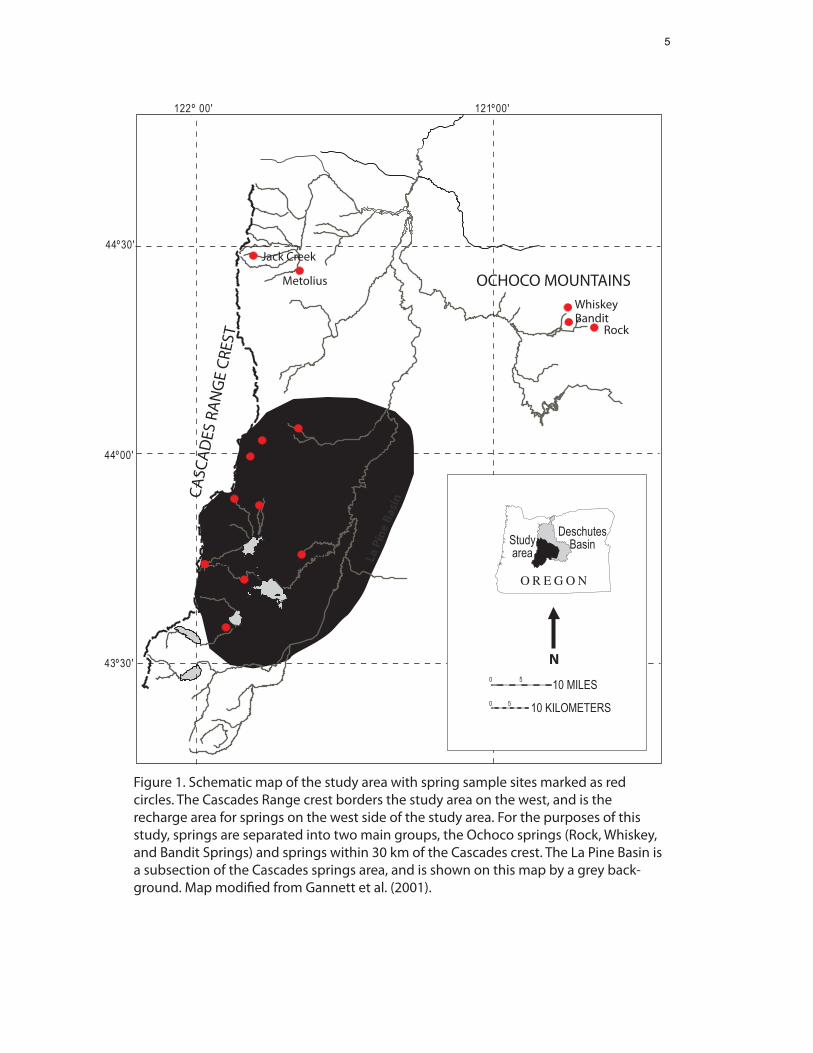
The Deschutes River and tributaries drain an area of over 28,000 km2 (Gannett et
al., 2001) from central Oregon to the Oregon-Washington border. This area is drained
from the west by the Deschutes and Metolius Rivers, and from the east by the Crooked
3
River (Fig. 1). The watershed is bounded on the west by the Oregon Cascade Mountains
crest, on the south between the drainage divide with the Klamath Basin, and on the east
by the Ochoco Mountains (Fig. 1). The northern boundary of the Deschutes watershed is
its confluence with the Columbia River near The Dalles, Oregon. This study concentrates
on the area south of the Metolius-Crooked-Deschutes River confluence area.
The majority of water in the western part of the watershed is from precipitation
falling on the Cascade Range, the principal recharge area for the Deschutes River
(Gannett et al., 2001). Highly permeable igneous rocks of the high Cascades allow
precipitation to enter the subsurface and flow eastward through the basin (Gannett et al.,
2001). Much of this groundwater is released via springs into surface streams at the edge
of the La Pine basin, a structural graben filled with low permeability sediments (James et
al., 2000; Gannett et al., 2001). The La Pine basin is the main source of water into the
Deschutes River. The majority of the remaining groundwater is released into surface
streams near the confluence of the Metolius, Crooked, and Deschutes Rivers, where the
Green Ridge fault juxtaposes high permeability Quaternary and Tertiary volcanics to the
south with the low permeability devitrified John Day Formation to the north (Gannett et
al., 2001). In the eastern part of the study area, groundwater is not from the high
Cascades, but instead falls on the Ochoco Mountains.
In a recharge area, water is absorbed into the subsurface, and can flow
underground for periods of time on the scales of hours to years (Bethke and Johnson,
2008). Water flows down gradient until it flows into surface water, generally through a
spring. The flow of water underground is known as the flow path. Some common reasons
4
La P
ine
Basi
n
Quinn
TyeeBlacktail
Des
chut
esRiver
CASC
ADES
RAN
GE
CRES
T
OCHOCO MOUNTAINSMetolius
Rock
Whiskey Bandit
44º00'
43º30'
44º30'
122º 00' 121º00'
DeschutesBasinStudy
area
0 5 10 MILES0 5 10 KILOMETERS
Jack Creek
Tumalo Creek
Ranger
John
Fall
SnowCultus
Figure 1. Schematic map of the study area with spring sample sites marked as red circles. The Cascades Range crest borders the study area on the west, and is the recharge area for springs on the west side of the study area. For the purposes of this study, springs are separated into two main groups, the Ochoco springs (Rock, Whiskey, and Bandit Springs) and springs within 30 km of the Cascades crest. The La Pine Basin is a subsection of the Cascades springs area, and is shown on this map by a grey back-ground. Map modi�ed from Gannett et al. (2001).
N
5
for water to resurface are when the aquifer level is above the ground level, or when there
is a permeability change of the rocks in the subsurface (Gannett et al., 2001).
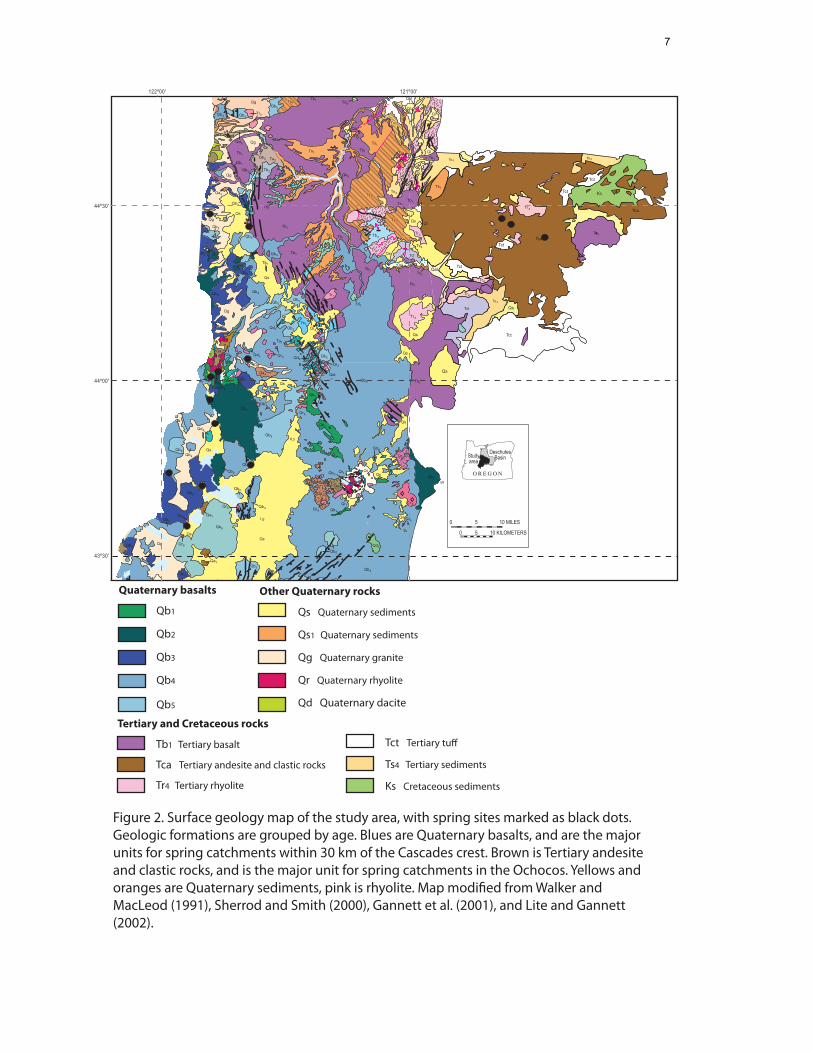
The drainage basin of the Deschutes River is primarily composed of basalt with
some andesites, dacites, and rhyolites (Fig. 2). The area has been a volcanic center for the
last 35 million years (Gannett et al., 2001), resulting in a complex assemblage of volcanic
deposits such as tephra, ignimbrites, and flows.
This study is primarily concerned with the chemistry of 14 springs sampled in the
headwaters of the Deschutes River. Eleven of these springs are within 30 km east of the
Oregon Cascades crest, and three (Bandit, Rock, and Whiskey Springs) are located in the
Ochoco Mountains, over 100 km from the Cascade crest.
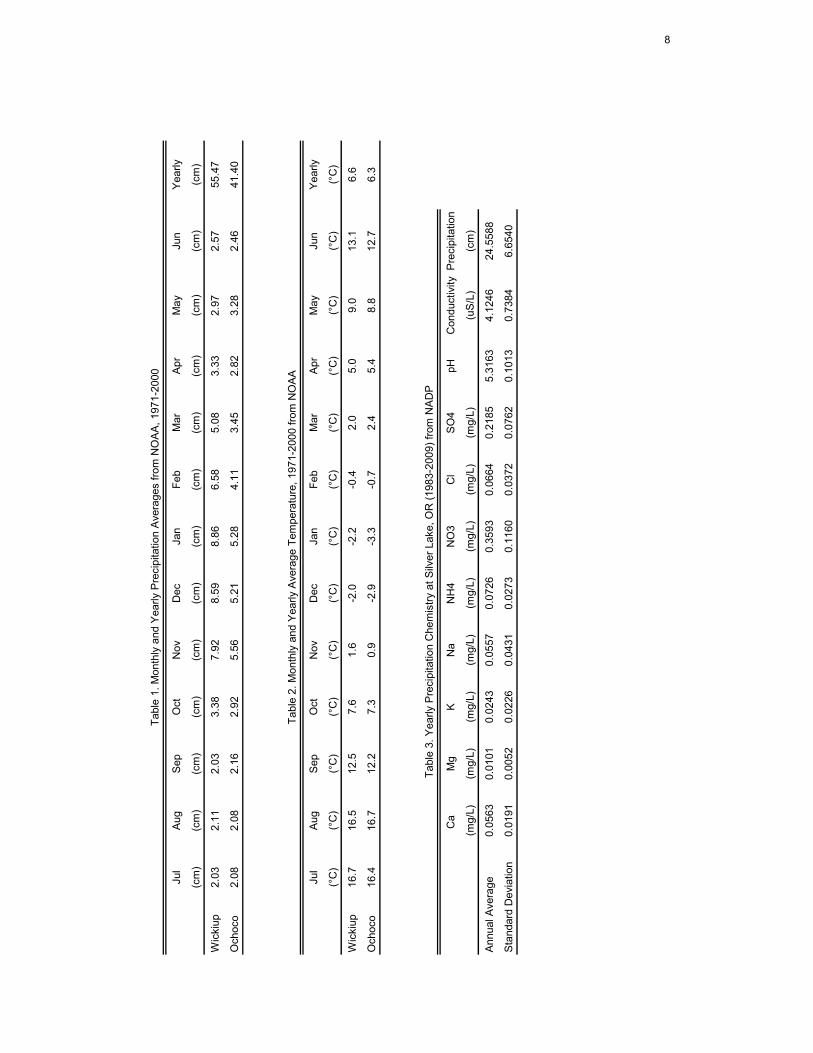
Central Oregon is part of the Oregon high desert, which averages less than 5 cm
of rainfall per month, with June through August the driest months (Table 1) (NOAA,
2006). Precipitation is highest in the western half of the study area and lower in the
Ochocos. Average snowfall follows a similar trend, with Wickiup also receiving the
highest average annual snowfall (NOAA, 2006).The mean annual temperature for the
study area is 6.6 °C for the western half of the study area (Wickiup) and 6.3 °C for the
eastern half (Ochocos), averaged over a period of 1971-2000 (Table 2) (NOAA, 2006).
During the sampling period of July-August, the average temperature was about 18 °C,
with highs of 24 °C and lows of 7 °C (NOAA, 2006), and there was no precipitation.
Precipitation chemistry is sampled every month by the National Atmospheric Deposition
Program (NADP). Chemistry is averaged from 1983 to 2009 (Table 3). The average
precipitation pH is 5.31 across the study area.
6
50
1.0
0.5
2.0
4.0
Ts 4Ts 4
Ts 4
Qs
Qs
Tct
Tct
Tct
Tca
Tca
Qal
Tct
Tct Ks
Figure 2. Surface geology map of the study area, with spring sites marked as black dots. Geologic formations are grouped by age. Blues are Quaternary basalts, and are the major units for spring catchments within 30 km of the Cascades crest. Brown is Tertiary andesite and clastic rocks, and is the major unit for spring catchments in the Ochocos. Yellows and oranges are Quaternary sediments, pink is rhyolite. Map modi�ed from Walker and MacLeod (1991), Sherrod and Smith (2000), Gannett et al. (2001), and Lite and Gannett (2002).
121º00'
44º00'
43º30'
44º30'
122º00'
DeschutesBasinStudy
area
0 5 10 MILES
0 5 10 KILOMETERS
Tct Tertiary tu�
Ts4 Tertiary sediments
Ks Cretaceous sediments
Qb1
Qb2
Qb4
Qb3
Qb5
Quaternary basalts
Qs Quaternary sediments
Qg Quaternary granite
Qr Quaternary rhyolite
Qd Quaternary dacite
Qs1 Quaternary sediments
Other Quaternary rocks
Tb1 Tertiary basalt
Tca Tertiary andesite and clastic rocks
Tr4 Tertiary rhyolite
Tertiary and Cretaceous rocks
7
Jul
Aug
Sep
Oct
Nov
Dec
Jan
Feb
Mar
Apr
May
Jun
Yea
rly
(cm
)(c
m)
(cm
)(c
m)
(cm
)(c
m)
(cm
)(c
m)
(cm
)(c
m)
(cm
)(c
m)
(cm
)
Wic
kiup
2.03
2.11
2.03
3.38
7.92
8.59
8.86
6.58
5.08
3.33
2.97
2.57
55.4
7
Och
oco
2.08
2.08
2.16
2.92
5.56
5.21
5.28
4.11
3.45
2.82
3.28
2.46
41.4
0
Jul
Aug
Sep
Oct
Nov
Dec
Jan
Feb
Mar
Apr
May
Jun
Yea
rly
(°C
)(°
C)
(°C
)(°
C)
(°C
)(°
C)
(°C
)(°
C)
(°C
)(°
C)
(°C
)(°
C)
(°C
)
Wic
kiup
16.7
16.5
12.5
7.6
1.6
-2.0
-2.2
-0.4
2.0
5.0
9.0
13.1
6.6
Och
oco
16.4
16.7
12.2
7.3
0.9
-2.9
-3.3
-0.7
2.4
5.4
8.8
12.7
6.3
Ca
Mg
KN
aN
H4
NO
3C
lS
O4
pHC
ondu
ctiv
ityP
reci
pita
tion
(mg/
L)(m
g/L)
(mg/
L)(m
g/L)
(mg/
L)(m
g/L)
(mg/
L)(m
g/L)
(uS
/L)
(cm
)
Ann
ual A
vera
ge0.
0563
0.01
010.
0243
0.05
570.
0726
0.35
930.
0664
0.21
855.
3163
4.12
4624
.558
8
Sta
ndar
d D
evia
tion
0.01
910.
0052
0.02
260.
0431
0.02
730.
1160
0.03
720.
0762
0.10
130.
7384
6.65
40
Tabl
e 1.
Mon
thly
and
Yea
rly P
reci
pita
tion
Ave
rage
s fro
m N
OA
A, 1
971-
2000
Tabl
e 2.
Mon
thly
and
Yea
rly A
vera
ge T
empe
ratu
re, 1
971-
2000
from
NO
AA
Tabl
e 3.
Yea
rly P
reci
pita
tion
Che
mis
try a
t Silv
er L
ake,
OR
(198
3-20
09) f
rom
NA
DP
8
The higher elevations of the study area (mostly the western and southern regions)
have coniferous forests of predominantly ponderosa pine with some lodgepole pine.
Much of the area has been managed for timber production (Gannett et al., 2001). Lower
areas are dominated by juniper, with some sagebrush and grassland, though much of the
area is cultivated (Oregon Department of Forestry, 1997; Gannett et al., 2001). The
Ochocos to the east have predominantly lodgepole pine and juniper (Oregon Department
of Forestry, 1997).
The Deschutes headwaters are primarily wilderness areas. The human impacts are
relatively few, though many of the sample sites were located in close proximity to roads.
In the Ochocos, the main land use is farming and open range grazing.
METHODS
In June-August 2009, 51 streams and 14 springs in the headwaters of the
Deschutes, Crooked, and Metolius Rivers were sampled. Sampling locations were chosen
based on accessibility and location within the watershed.
Samples were tested for dissolved oxygen, conductivity, pH, and temperature.
Dissolved oxygen data was collected by a YSI 58 Lab/Field Dissolved Oxygen meter,
which was also used for water temperature. Conductivity was collected with a PCSTestr
35 conductivity probe. pH was recorded with a Thermo Orion 3 Star pH meter with a
glass Orion Ross combination pH electrode.
Samples were run on a Dionex ion chromatograph (ICS_2500) at the University
of Arizona, Tucson, AZ and ICP-MS analyses were run on a PerkinElmer/Sciex Elan
6100 DRC at Union College in Schenectady, NY. Water samples were analyzed for 60
trace elements. Samples were also tested for dissolved organic carbon (DOC), alkalinity,
9
and chlorofluorocarbons (CFCs). Samples for CFC dating were prepared and tested using
the method laid out by the USGS Reston Chlorofluorocarbon laboratory (Plummer and
Busenberg, 2009). Alkalinity samples were collected and tested within 36 hours of
collection using the Gran titration method (Gran et al., 1981). All samples except for
DOC and CFCs were filtered with a 0.45 micron nylon filter. IC, ICP-MS, and alkalinity
samples were collected in 30mL HDPE bottles. ICP-MS samples were prepared with 5
drops of nitric acid. DOC were collected in glass boston round bottles. HCl was added to
DOC bottles to inhibit growth and drive off the dissolved inorganic carbon component.
A USGS surface geologic map of Oregon (Fig. 2) (Walker and MacLeod, 1991;
Sherrod and Smith, 2000; Lite and Gannett, 2002) and a groundwater flow map (Lite and
Gannett, 2002) were used to approximate the different rock types within each spring
drainage area. There is no data on subsurface composition in the Deschutes headwaters
area, so this study uses surface lithology as a proxy for subsurface composition. Two
maps (Walker and MacLeod, 1991; Sherrod and Smith, 2000) were correlated to give
surface geology throughout the area. The two maps have different classifications and map
areas for geologic units, which have been simplified into one classification scheme from
Sherrod and Smith (2000). Walker and MacLeod (1991) separate Quaternary basalt into
four general categories: QTba, Quaternary basalt and basaltic andesite; Qyb, youngest
basalt and basaltic andesite; Qba, Quaternary basaltic andesite and andesite; and QTmv,
Quaternary mafic vent complexes. These roughly correlate to five age groups from
Sherrod and Smith (2000): Qb1, 0-12 k.y. (Qyb); Qb2, 12-25 k.y. (Qyb); Qb3, 25-120 k.y.
(QTba); Qb4, 120-780 k.y. (Qba, QTba); Qb5, 780 k.y.-2.m.y. (Qba, QTba). QTmv from
Walker and MacLeod (1991) is denoted in Sherrod and Smith (2000) as a vent symbol on
10
top of the surficial geology. The age range and area of QTba and Qba overlaps in the
Sherrod and Smith (2000) classification, and is grouped together for estimation purposes.
Precipitation data is compiled from the National Atmospheric Deposition
Program (NADP) from their collection site in Silver Lake, OR, and from the National
Oceanic and Atmospheric Administration (NOAA).
RESULTS
Geologic Map
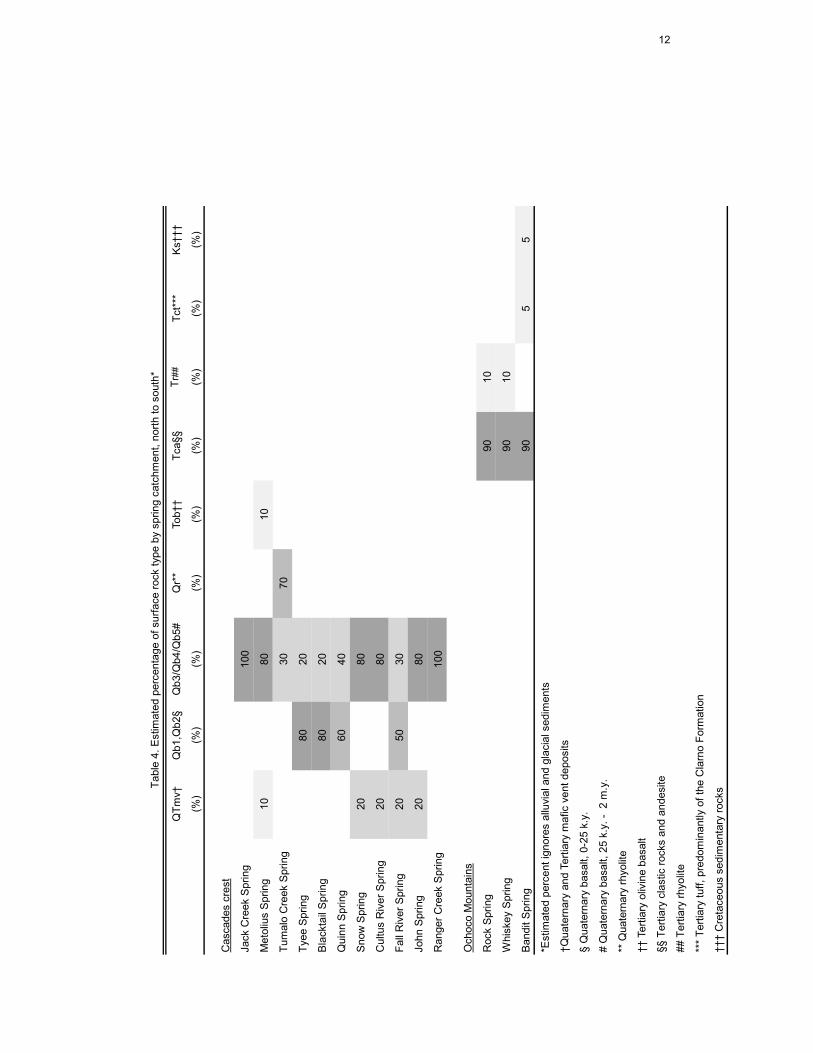
Percentage estimates of surface geology for each spring catchment is given in
Table 4 from north to south, with the springs in the Ochocos last. Of the 11 springs
sampled within 30 km of the Cascades crest, the primary surface formation is Quaternary
basalt (Fig. 2). Tumalo Creek, Tyee, and Blacktail Springs are exceptions. For Tumalo
Creek Spring, the surface rock in the catchment is predominantly Quaternary rhyolite,
with some basaltic andesite. Tyee and Blacktail Springs are near outcrops of dacite,
andesite, and rhyolite (Fig. 2). Springs more than 100 km from the Cascades crest are
predominantly Tertiary andesite flows and clastic rocks from the Clarno Formation.
Chlorofluorocarbons (CFCs)
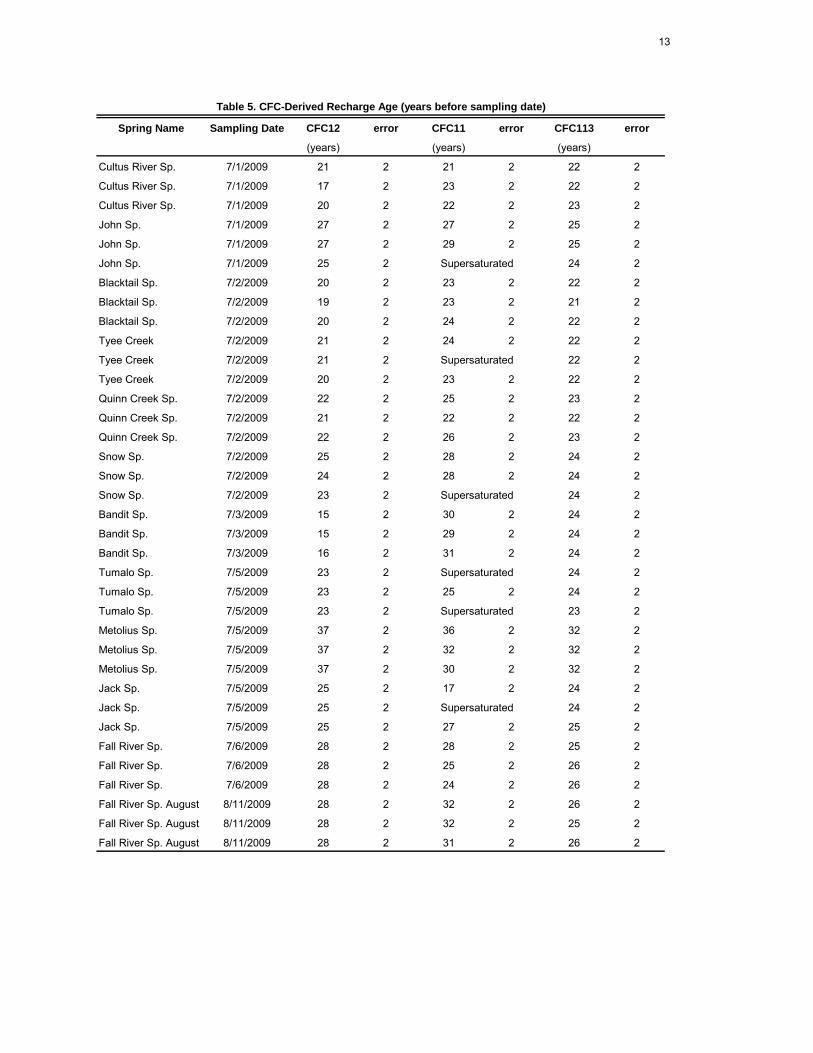
CFC results are given in years (Table 5), with the majority of samples between 21
and 27 years. Three samples were taken at each sample site. For each sample bottle, three
results are given, one for each of the main CFC compounds (CFC-12, CFC-11, CFC-113).
For all CFC sample sites, there is some variability in age within each type of CFC
compound, though all are within the error range of two years. With the exception of
Bandit Spring, the variability at each sample site across all age estimates is 4 years or less.
11
QT
mv†
Qb1
,Qb2
§Q
b3/Q
b4/Q
b5#
Qr*
*Tob††
Tca§
§Tr
##Tc
t***
Ks†††
(%)
(%)
(%)
(%)
(%)
(%)
(%)
(%)
(%)
Cas
cade
s cr
est
Jack
Cre
ek S
prin
g10
0
Met
oliu
s S
prin
g10
8010
Tum
alo
Cre
ek S
prin
g30
70
Tyee
Spr
ing
8020
Bla
ckta
il S
prin
g80
20
Qui
nn S
prin
g60
40
Sno
w S
prin
g20
80
Cul
tus
Riv
er S
prin
g20
80
Fall
Riv
er S
prin
g20
5030
John
Spr
ing
2080
Ran
ger C
reek
Spr
ing
100
Och
oco
Mou
ntai
ns
Roc
k S
prin
g90
10
Whi
skey
Spr
ing
9010
Ban
dit S
prin
g90
55
*Est
imat
ed p
erce
nt ig
nore
s al
luvi
al a
nd g
laci
al s
edim
ents
†Q
uate
rnary
and T
ert
iary
mafic v
ent
deposits
§ Q
uate
rnar
y ba
salt,
0-2
5 k.
y.
# Q
uate
rnar
y ba
salt,
25
k.y.
- 2
m.y
.
** Q
uate
rnar
y rh
yolit
e
†† T
ert
iary
oliv
ine b
asalt
§§ T
ertia
ry c
last
ic ro
cks
and
ande
site
## T
ertia
ry rh
yolit
e
***
Terti
ary
tuff,
pre
dom
inan
tly o
f the
Cla
rno
Form
atio
n
††† C
reta
ceous s
edim
enta
ry r
ocksTa
ble
4. E
stim
ated
per
cent
age
of s
urfa
ce ro
ck ty
pe b
y sp
ring
catc
hmen
t, no
rth to
sou
th*
12
Spring Name Sampling Date CFC12 error CFC11 error CFC113 error
(years) (years) (years)
Cultus River Sp. 7/1/2009 21 2 21 2 22 2
Cultus River Sp. 7/1/2009 17 2 23 2 22 2
Cultus River Sp. 7/1/2009 20 2 22 2 23 2
John Sp. 7/1/2009 27 2 27 2 25 2
John Sp. 7/1/2009 27 2 29 2 25 2
John Sp. 7/1/2009 25 2 24 2
Blacktail Sp. 7/2/2009 20 2 23 2 22 2
Blacktail Sp. 7/2/2009 19 2 23 2 21 2
Blacktail Sp. 7/2/2009 20 2 24 2 22 2
Tyee Creek 7/2/2009 21 2 24 2 22 2
Tyee Creek 7/2/2009 21 2 22 2
Tyee Creek 7/2/2009 20 2 23 2 22 2
Quinn Creek Sp. 7/2/2009 22 2 25 2 23 2
Quinn Creek Sp. 7/2/2009 21 2 22 2 22 2
Quinn Creek Sp. 7/2/2009 22 2 26 2 23 2
Snow Sp. 7/2/2009 25 2 28 2 24 2
Snow Sp. 7/2/2009 24 2 28 2 24 2
Snow Sp. 7/2/2009 23 2 24 2
Bandit Sp. 7/3/2009 15 2 30 2 24 2
Bandit Sp. 7/3/2009 15 2 29 2 24 2
Bandit Sp. 7/3/2009 16 2 31 2 24 2
Tumalo Sp. 7/5/2009 23 2 24 2
Tumalo Sp. 7/5/2009 23 2 25 2 24 2
Tumalo Sp. 7/5/2009 23 2 23 2
Metolius Sp. 7/5/2009 37 2 36 2 32 2
Metolius Sp. 7/5/2009 37 2 32 2 32 2
Metolius Sp. 7/5/2009 37 2 30 2 32 2
Jack Sp. 7/5/2009 25 2 17 2 24 2
Jack Sp. 7/5/2009 25 2 24 2
Jack Sp. 7/5/2009 25 2 27 2 25 2
Fall River Sp. 7/6/2009 28 2 28 2 25 2
Fall River Sp. 7/6/2009 28 2 25 2 26 2
Fall River Sp. 7/6/2009 28 2 24 2 26 2
Fall River Sp. August 8/11/2009 28 2 32 2 26 2
Fall River Sp. August 8/11/2009 28 2 32 2 25 2
Fall River Sp. August 8/11/2009 28 2 31 2 26 2
Supersaturated
Table 5. CFC-Derived Recharge Age (years before sampling date)
Supersaturated
Supersaturated
Supersaturated
Supersaturated
Supersaturated
13
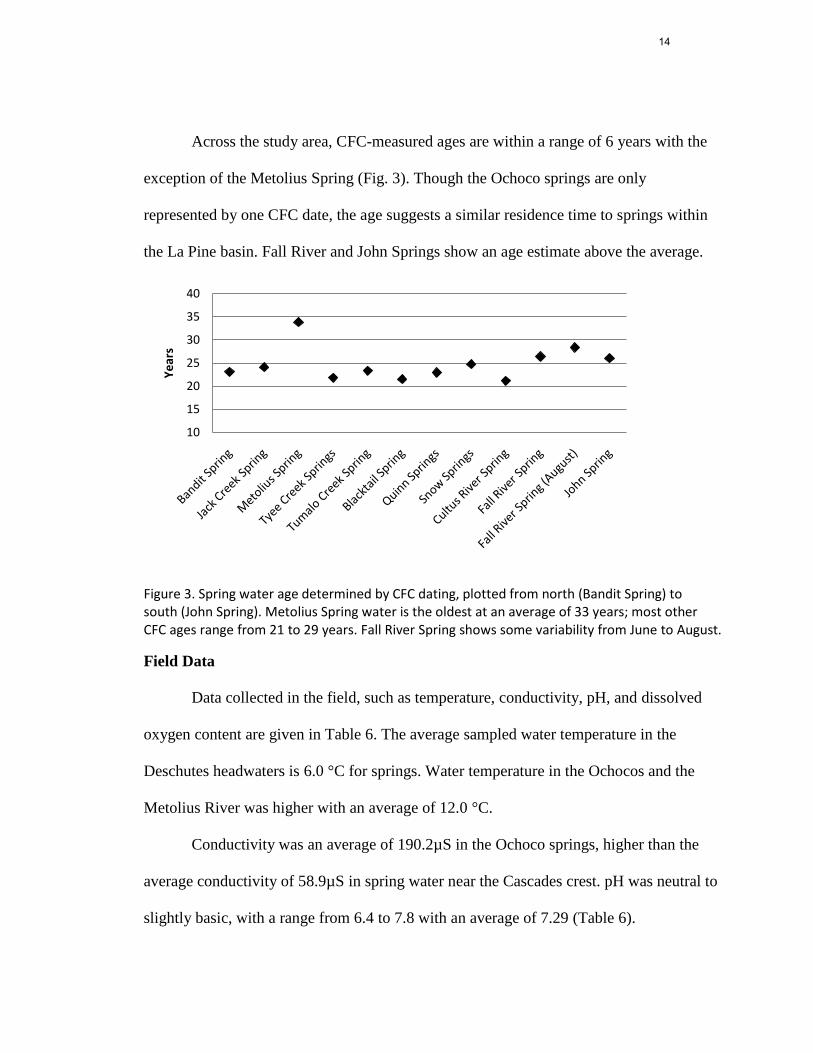
Across the study area, CFC-measured ages are within a range of 6 years with the
exception of the Metolius Spring (Fig. 3). Though the Ochoco springs are only
represented by one CFC date, the age suggests a similar residence time to springs within
the La Pine basin. Fall River and John Springs show an age estimate above the average.
Figure 3. Spring water age determined by CFC dating, plotted from north (Bandit Spring) to south (John Spring). Metolius Spring water is the oldest at an average of 33 years; most other CFC ages range from 21 to 29 years. Fall River Spring shows some variability from June to August.
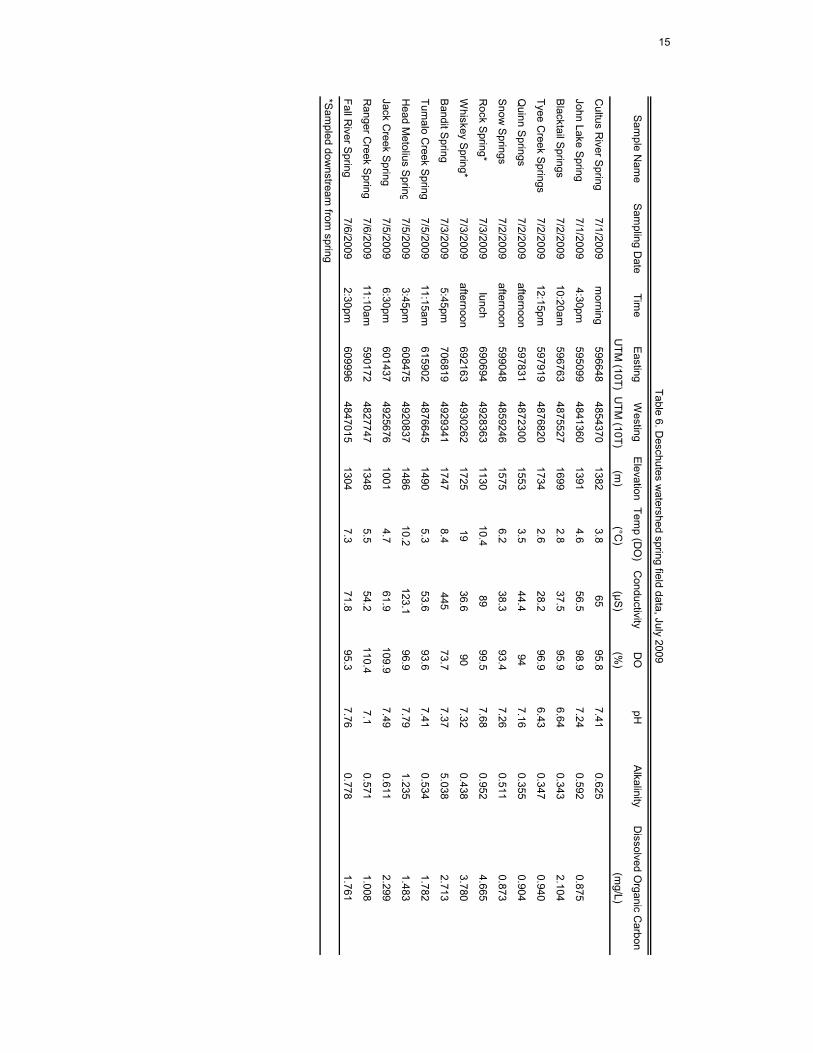
Field Data
Data collected in the field, such as temperature, conductivity, pH, and dissolved
oxygen content are given in Table 6. The average sampled water temperature in the
Deschutes headwaters is 6.0 °C for springs. Water temperature in the Ochocos and the
Metolius River was higher with an average of 12.0 °C.
Conductivity was an average of 190.2µS in the Ochoco springs, higher than the
average conductivity of 58.9µS in spring water near the Cascades crest. pH was neutral to
slightly basic, with a range from 6.4 to 7.8 with an average of 7.29 (Table 6).
10
15
20
25
30
35
40
Ye
ars
14
Sam
ple Nam
eS
ampling D
ateTim
eE
astingW
estingE
levationTem
p (DO
) C
onductivity D
OpH
Alkalinity
Dissolved O
rganic Carbon
UTM
(10T)U
TM (10T)
(m)
(°C)
(µS)
(%)
(mg/L)
Cultus R
iver Spring
7/1/2009m
orning596648
48543701382
3.865
95.87.41
0.625
John Lake Spring
7/1/20094:30pm
5950994841360
13914.6
56.598.9
7.240.592
0.875
Blacktail S
prings7/2/2009
10:20am596763
48755271699
2.837.5
95.96.64
0.3432.104
Tyee Creek S
prings7/2/2009
12:15pm597919
48768201734
2.628.2
96.96.43
0.3470.940
Quinn S
prings7/2/2009
afternoon597831
48723001553
3.544.4
947.16
0.3550.904
Snow
Springs
7/2/2009afternoon
5990484859246
15756.2
38.393.4
7.260.511
0.873
Rock S
pring*7/3/2009
lunch690694
49283631130
10.489
99.57.68
0.9524.665
Whiskey S
pring*7/3/2009
afternoon692163
49302621725
1936.6
907.32
0.4383.780
Bandit S
pring7/3/2009
5:45pm706819
49293411747
8.4445
73.77.37
5.0382.713
Tumalo C
reek Spring
7/5/200911:15am
6159024876645
14905.3
53.693.6
7.410.534
1.782
Head M
etolius Spring
7/5/20093:45pm
6084754920837
148610.2
123.196.9
7.791.235
1.483
Jack Creek S
pring7/5/2009
6:30pm601437
49256761001
4.761.9
109.97.49
0.6112.299
Ranger C
reek Spring
7/6/200911:10am
5901724827747
13485.5
54.2110.4
7.10.571
1.008
Fall River S
pring7/6/2009
2:30pm609996
48470151304
7.371.8
95.37.76
0.7781.761
*Sam
pled downstream
from spring
Table 6. Deschutes w
atershed spring field data, July 2009
15
pH was slightly basic in 12 out of 14 spring samples. Tyee and Blacktail Springs showed
a pH of less than 6.65. Dissolved oxygen content (DO) ranged from 73% to 110% (Table
6). Out of 14 spring samples, 11 have dissolved oxygen content between 90% and 100%.
The springs outside of this range are Bandit Spring with a low DO content, and Jack and
Ranger Creek, with higher DO content.
Trace Element Data and Lab Analyses
Dissolved Organic Carbon (DOC) ranged from .8 to 4.6 mg/L (Table 6). DOC
values were higher in the Ochocos than near the Cascades crest.
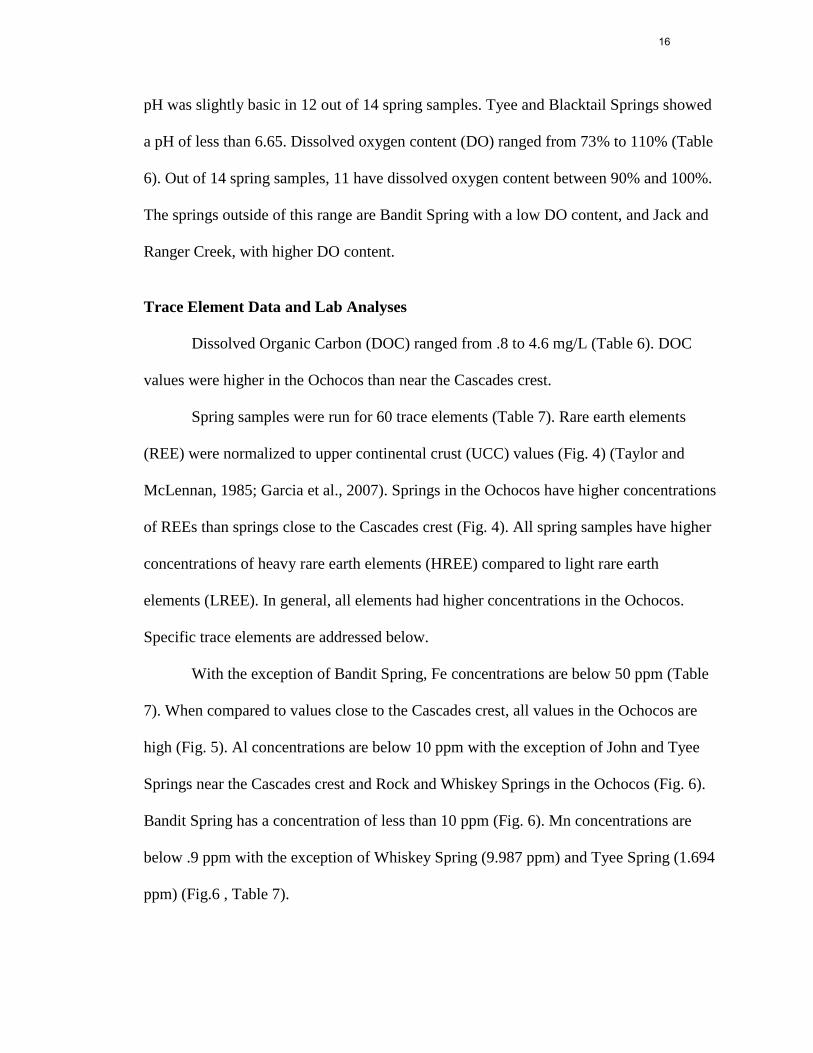
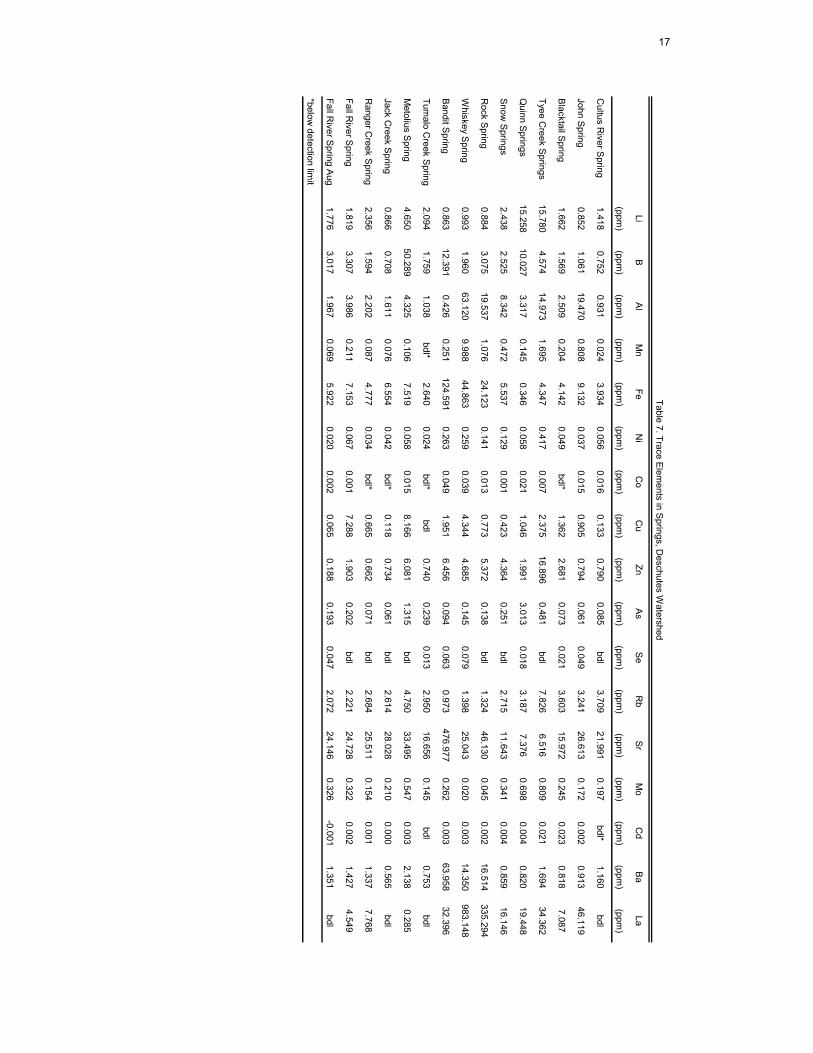
Spring samples were run for 60 trace elements (Table 7). Rare earth elements
(REE) were normalized to upper continental crust (UCC) values (Fig. 4) (Taylor and
McLennan, 1985; Garcia et al., 2007). Springs in the Ochocos have higher concentrations
of REEs than springs close to the Cascades crest (Fig. 4). All spring samples have higher
concentrations of heavy rare earth elements (HREE) compared to light rare earth
elements (LREE). In general, all elements had higher concentrations in the Ochocos.
Specific trace elements are addressed below.
With the exception of Bandit Spring, Fe concentrations are below 50 ppm (Table
7). When compared to values close to the Cascades crest, all values in the Ochocos are
high (Fig. 5). Al concentrations are below 10 ppm with the exception of John and Tyee
Springs near the Cascades crest and Rock and Whiskey Springs in the Ochocos (Fig. 6).
Bandit Spring has a concentration of less than 10 ppm (Fig. 6). Mn concentrations are
below .9 ppm with the exception of Whiskey Spring (9.987 ppm) and Tyee Spring (1.694
ppm) (Fig.6 , Table 7).
16
LiB
Al
Mn
FeN
iC
oC
uZn
As
Se
Rb
Sr
Mo
Cd
Ba
La
(ppm)
(ppm)
(ppm)
(ppm)
(ppm)
(ppm)
(ppm)
(ppm)
(ppm)
(ppm)
(ppm)
(ppm)
(ppm)
(ppm)
(ppm)
(ppm)
(ppm)
Cultus R
iver Spring
1.4180.752
0.9310.024
3.9340.056
0.0160.133
0.7900.085
bdl3.709
21.9910.197
bdl*1.160
bdl
John Spring
0.8521.061
19.4700.808
9.1320.037
0.0150.905
0.7940.061
0.0493.241
26.6130.172
0.0020.913
46.119
Blacktail S
pring1.662
1.5692.509
0.2044.142
0.049bdl*
1.3622.681
0.0730.021
3.60315.972
0.2450.023
0.8187.087
Tyee Creek S
prings15.780
4.57414.973
1.6954.347
0.4170.007
2.37516.896
0.481bdl
7.8266.516
0.8090.021
1.69434.362
Quinn S
prings15.258
10.0273.317
0.1450.346
0.0580.021
1.0461.991
3.0130.018
3.1877.376
0.6980.004
0.82019.448
Snow
Springs
2.4382.525
8.3420.472
5.5370.129
0.0010.423
4.3640.251
bdl2.715
11.6430.341
0.0040.859
16.146
Rock S
pring0.884
3.07519.537
1.07624.123
0.1410.013
0.7735.372
0.138bdl
1.32446.130
0.0450.002
16.514335.294
Whiskey S
pring0.993
1.96063.120
9.98844.863
0.2590.039
4.3444.685
0.1450.079
1.39825.043
0.0200.003
14.350983.148
Bandit S
pring0.863
12.3910.426
0.251124.591
0.2630.049
1.9516.456
0.0940.063
0.973476.977
0.2620.003
63.95832.396
Tumalo C
reek Spring
2.0941.759
1.038bdl*
2.6400.024
bdl*bdl
0.7400.239
0.0132.950
16.6560.145
bdl0.753
bdl
Metolius S
pring4.650
50.2894.325
0.1067.519
0.0580.015
8.1666.081
1.315bdl
4.75033.495
0.5470.003
2.1380.285
Jack Creek S
pring0.866
0.7081.611
0.0766.554
0.042bdl*
0.1180.734
0.061bdl
2.61428.028
0.2100.000
0.565bdl
Ranger C
reek Spring
2.3561.594
2.2020.087
4.7770.034
bdl*0.665
0.6620.071
bdl2.684
25.5110.154
0.0011.337
7.768
Fall River S
pring1.819
3.3073.986
0.2117.153
0.0670.001
7.2881.903
0.202bdl
2.22124.728
0.3220.002
1.4274.549
Fall River S
pring Aug
1.7763.017
1.9670.069
5.9220.020
0.0020.065
0.1880.193
0.0472.072
24.1460.326
-0.0011.351
bdl
*below detection lim
it
Table 7. Trace Elem
ents in Springs, D
eschutes Watershed
17
Pr
Nd
Sm
Eu
Gd
TbD
yH
oE
rTm
YbLu
WP
bU
Cr
(ppm
)(p
pm)
(ppm
)(p
pm)
(ppm
)(p
pm)
(ppm
)(p
pm)
(ppm
)(p
pm)
(ppm
)(p
pm)
(ppm
)(p
pm)
(ppm
)(p
pm)
Cul
tus
Riv
er S
prin
g0.
527
5.17
20.
038
0.28
88.
504
0.00
05.
584
19.8
7611
.660
bdl*
61.0
7532
.258
0.01
4bd
lbd
l3.
5977
John
Spr
ing
67.5
3477
.790
2.22
20.
998
87.4
6121
.461
111.
026
58.0
5911
6.78
3bd
l69
.474
13.8
710.
015
bdl
bdl
3.70
90
Bla
ckta
il S
prin
g14
.984
18.6
850.
543
0.28
128
.962
34.0
7369
.777
25.7
4934
.550
bdl
28.8
4321
.578
0.01
0bd
lbd
l0.
1342
Tyee
Cre
ek S
prin
gs75
.817
366.
108
2.42
61.
194
163.
961
31.2
8656
1.99
219
3.15
066
.589
bdl
638.
065
6.00
70.
075
bdl
bdl
0.57
72
Qui
nn S
prin
gs38
.383
56.2
311.
589
0.69
918
7.57
30.
000
39.4
41bd
l26
.415
bdl
60.7
3525
.398
0.04
2bd
lbd
l0.
8877
Sno
w S
prin
gs41
.278
232.
529
1.33
20.
923
64.1
339.
994
226.
236
56.5
9823
.023
bdl
135.
731
23.3
680.
035
bdl
bdl
1.70
78
Roc
k S
prin
g52
5.46
086
2.56
027
.571
9.12
611
91.8
1234
9.73
316
95.5
4691
7.23
917
33.6
54bd
l17
15.8
74bd
l0.
007
bdl
bdl
1.28
26
Whi
skey
Spr
ing
1446
.329
2482
.306
63.1
4417
.309
8352
.390
0.00
019
18.4
39bd
l14
56.3
14bd
l34
41.6
47bd
l0.
001
bdl
bdl
1.03
29
Ban
dit S
prin
g36
.270
62.9
8015
.499
13.4
3234
4.26
00.
000
83.6
40bd
l11
5.96
4bd
l27
5.75
2bd
l0.
001
bdl
0.06
82.
2366
Tum
alo
Cre
ek S
prin
g1.
518
3.17
40.
143
0.34
222
.446
0.00
051
.034
29.0
9320
.245
7.70
9bd
lbd
l0.
021
bdl
bdl
2.42
52
Met
oliu
s S
prin
g7.
062
22.4
490.
679
0.94
310
.893
9.85
954
.878
37.6
0012
.707
bdl
73.3
5527
.053
0.05
00.
122
0.05
79.
3744
Jack
Cre
ek S
prin
g5.
781
6.66
30.
262
0.15
742
.704
0.00
010
.179
bdl
13.9
2724
.542
21.5
3037
.033
0.01
5bd
lbd
l1.
5463
Ran
ger C
reek
Spr
ing
18.8
6274
.165
0.65
10.
559
34.4
8610
.871
127.
494
41.8
0211
.777
4.34
118
7.20
624
.322
0.01
6bd
lbd
l5.
2175
Fall
Riv
er S
prin
g10
.387
14.5
880.
580
0.33
713
.813
0.00
04.
108
18.9
8119
.825
bdl
23.7
1618
.246
0.02
2bd
lbd
l7.
3657
Fall
Riv
er S
prin
g A
ug1.
569
3.61
30.
039
0.30
147
.650
10.4
976.
901
33.1
888.
643
5.06
614
.831
1688
.264
0.02
0bd
lbd
l12
.537
7
*bel
ow d
etec
tion
limit
Tabl
e 7
(Con
tinue
d). T
race
Ele
men
ts in
Spr
ings
, Des
chut
es W
ater
shed
18
0.0
01
0.0
1
0.1 1
10
10
0
10
00
10
00
0
LaC
eP
rN
dSm
EuG
dTb
Dy
Ho
ErTm
YbLu
log(ppm/UCC)
Cu
ltus R
iver Sprin
g
Joh
n Sp
ring
Blacktail Sp
ring
Tyee Creek Sp
rings
Qu
inn
Sprin
gs
Sno
w Sp
rings
Tum
alo C
reek Sprin
g
Meto
lius Sp
ring
Jack Creek Sp
ring
Ran
ger Creek Sp
ring
Fall River Sp
ring
Fall River Sp
ring A
ugu
st
Ban
dit Sp
ring
Ro
ck Sprin
g
Wh
iskey Sprin
g
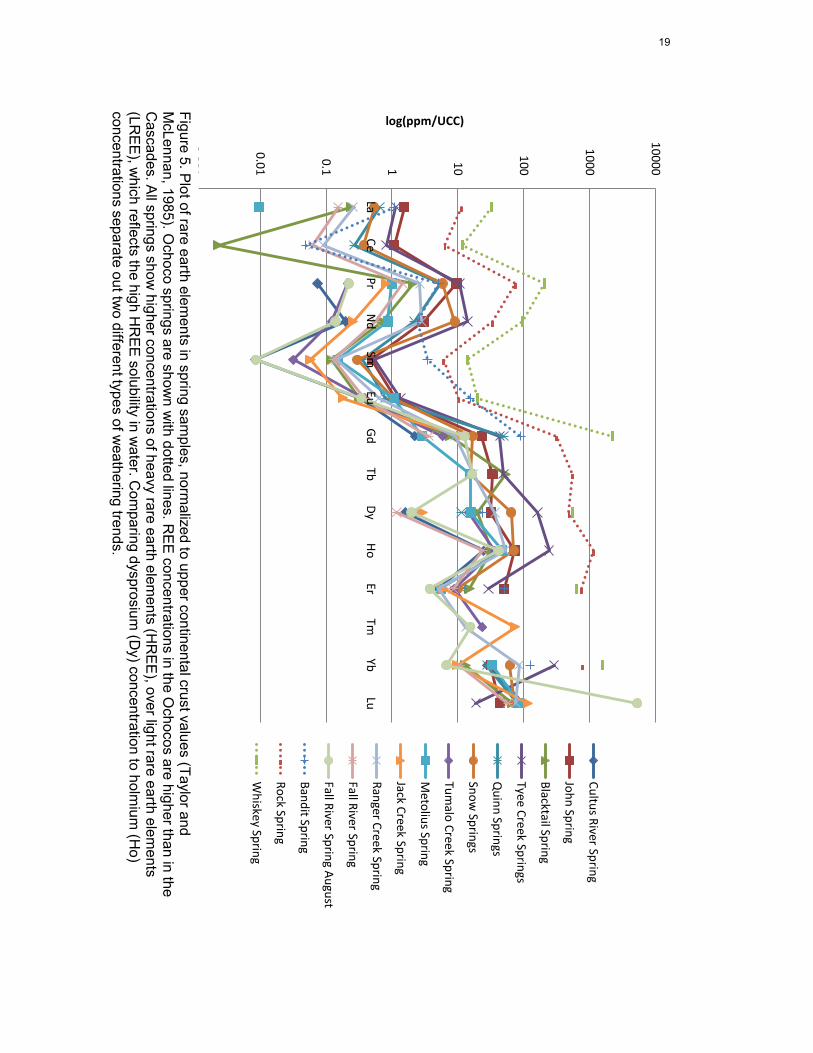
Figure 5. Plot of rare earth elements in spring sam
ples, normalized to upper continental crust values (Taylor and
McLennan, 1985). O
chocosprings are show
n with dotted lines. R
EE concentrations in the Ochocos are higher than in the
Cascades.All springs show
higher concentrations of heavy rare earth elements (H
REE), over light rare earth elem
ents (LR
EE), which reflects the high H
REE solubility in w
ater. Com
paring dysprosium (D
y) concentration to holmium
(Ho)
concentrations separate out two different types of w
eathering trends.
19
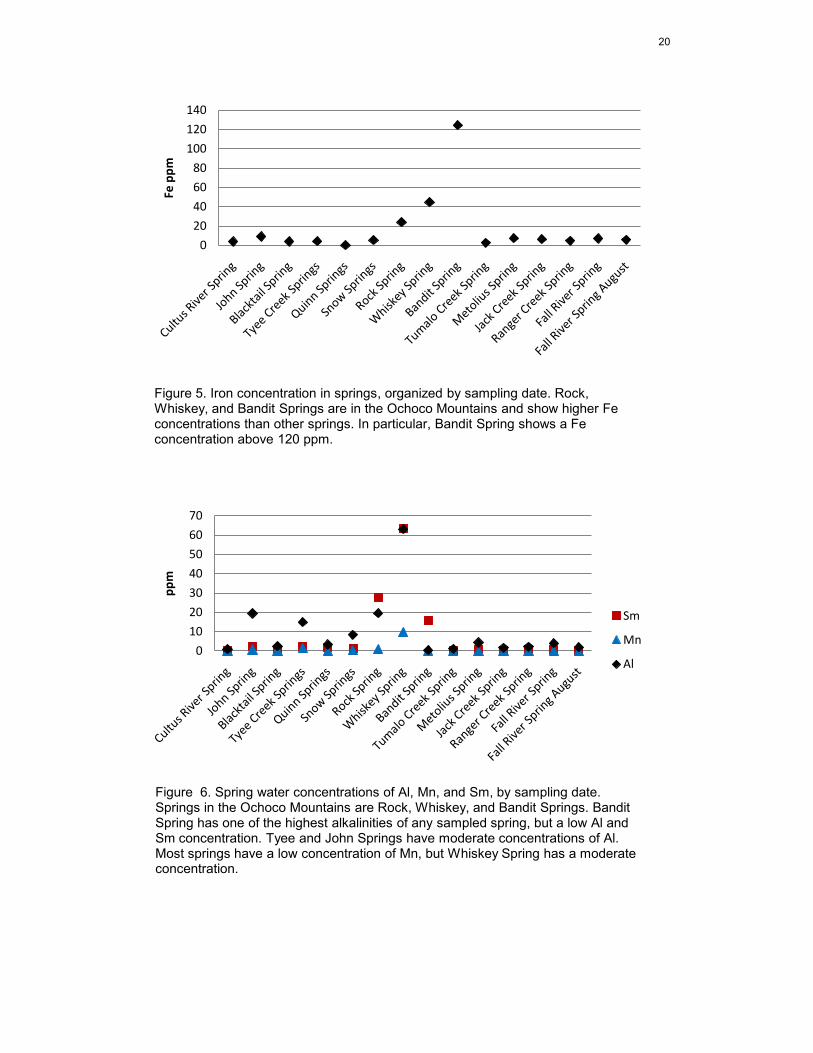
Figure 5. Iron concentration in springs, organized by sampling date. Rock, Whiskey, and Bandit Springs are in the Ochoco Mountains and show higher Fe concentrations than other springs. In particular, Bandit Spring shows a Fe concentration above 120 ppm.
0
20
40
60
80
100
120
140
Fe p
pm
Figure 6. Spring water concentrations of Al, Mn, and Sm, by sampling date. Springs in the Ochoco Mountains are Rock, Whiskey, and Bandit Springs. Bandit Spring has one of the highest alkalinities of any sampled spring, but a low Al and Sm concentration. Tyee and John Springs have moderate concentrations of Al. Most springs have a low concentration of Mn, but Whiskey Spring has a moderate concentration.
0
10
20
30
40
50
60
70
pp
m
Sm
Mn
Al
20
Metolius and Quinn springs both have above average Li and As concentrations
(Fig. 7, Table 7). Li concentrations are also above the average in Tyee Spring (Table 7).
The concentration of vanadium is above 2000 ppm in Tumalo Spring waters, and below
200 ppm in the Ochocos and Blacktail and Tyee Springs (Fig. 8). Sr concentrations are
below 50 ppm except at Bandit Spring, with a concentration of 477 ppm (Table 7).
DISCUSSION
pH
The average precipitation pH from the NADP Silver Lake station from 1983-2009
is 5.3 (Table 3), and the average sampled spring pH is 7.29. None of the sampled pH
values are less than the average precipitation pH, so there must be some basic addition
into the system, probably from silicate weathering.
The two springs with the lowest pH are Blacktail and Tyee Springs, which
correspond to a specific spring drainage lithology, with predominantly the youngest
Quaternary basalts (Qb1, Qb2) (Table 4, Table 6). One possible reason these springs may
have a particularly low pH is that the very young basalts are weathering at a slower rate
and thus contribute fewer elements to the subsurface water. Other spring catchment
lithology groups, such as John Lake Spring and Ranger Creek Spring, or Cultus River
Spring and Snow Spring, show similar pH to each other; this suggests that regardless of
the age of the rocks, the type of rock may control pH and dissolved content of waters.
21
0
0.5
1
1.5
2
2.5
3
3.5
As
pp
m
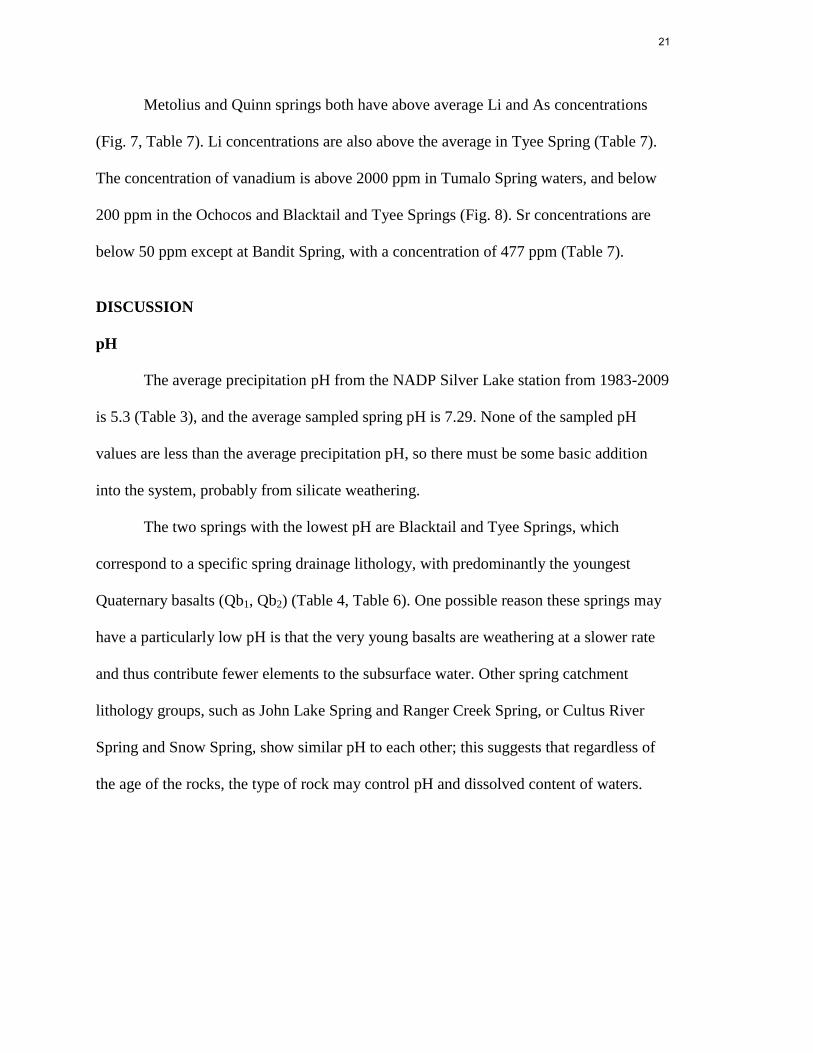
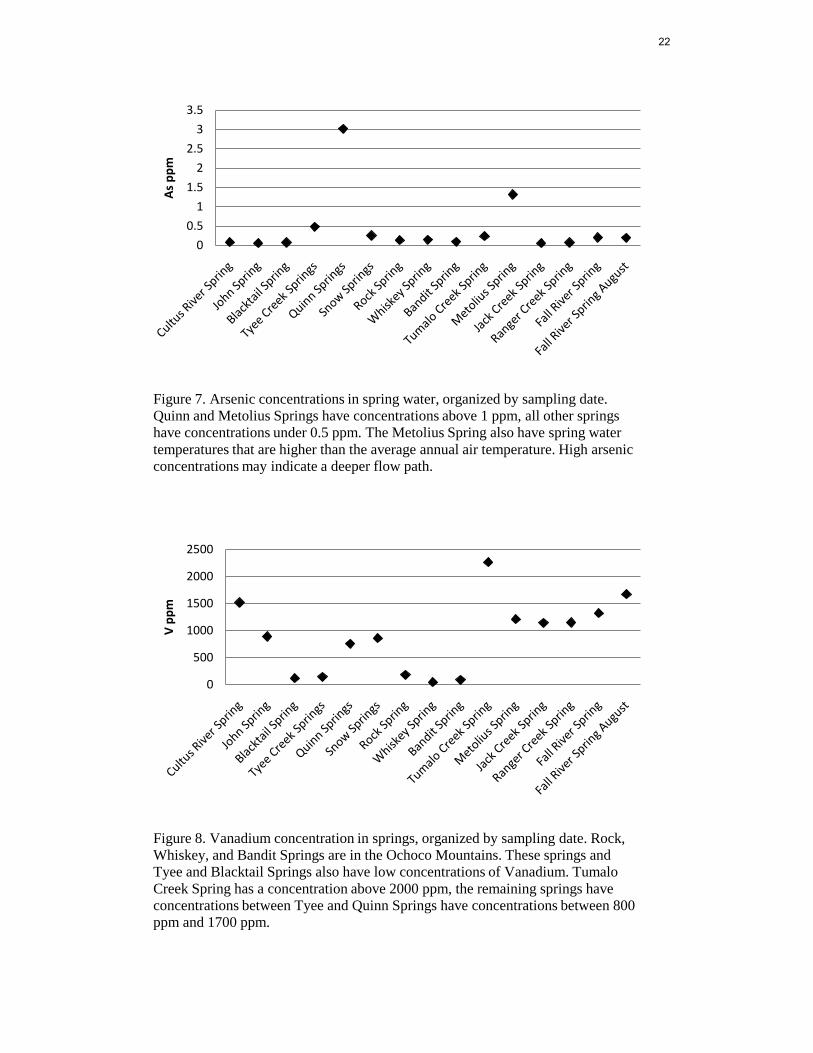
Figure 7. Arsenic concentrations in spring water, organized by sampling date.
Quinn and Metolius Springs have concentrations above 1 ppm, all other springs
have concentrations under 0.5 ppm. The Metolius Spring also have spring water
temperatures that are higher than the average annual air temperature. High arsenic
concentrations may indicate a deeper flow path.
0
500
1000
1500
2000
2500
V p
pm
Figure 8. Vanadium concentration in springs, organized by sampling date. Rock,
Whiskey, and Bandit Springs are in the Ochoco Mountains. These springs and
Tyee and Blacktail Springs also have low concentrations of Vanadium. Tumalo
Creek Spring has a concentration above 2000 ppm, the remaining springs have
concentrations between Tyee and Quinn Springs have concentrations between 800
ppm and 1700 ppm.
22
Conductivity and Alkalinity
In the 14 springs sampled, conductivity and bicarbonate (HCO3-) alkalinity are
strongly correlated (r2=.997). Conductivity is a measure of the solutes in water; the higher
the conductivity, the more dissolved elements. Alkalinity is the water’s ability to
neutralize acids. If the HCO3- alkalinity is high, there are more cations in the water to
balance the negative charge, and it follows that the conductivity will be higher.
The average precipitation chemistry given by the NADP estimates in Table 3
shows the average conductivity to be 4.12 µS, whereas the average for all sampled
springs is 58.5 µS. Thus, there must be some input into waters from the time they fall as
precipitation to the time they emerge from the springs. Bandit Spring is not included in
this average because it skews the average to the right; if Bandit Spring were included, the
input should be even greater.
Spring water temperatures in the western half of the study region are strongly
correlated to alkalinity (r2=.835) and conductivity (r
2= .733). This suggests that near the
Cascades crest, temperature can control the concentrations of dissolved elements in the
water (e.g. Walling and Webb, 1992a) because temperature controls the reaction rates of
the mineral dissolution. There is no correlation between temperature and alkalinity or
conductivity in the Ochocos. There are two statistical reasons for this lack of correlation.
First, it is likely that the small number of data points in the Ochocos contributes to its
lack of statistical significance. Second, while Bandit Spring shows the highest
conductivity and alkalinity by a significant margin, the water is not significantly warmer
than Rock Spring, also in the Ochocos, which has a much lower alkalinity. The highest
temperature is that of Whiskey Spring, with a low alkalinity. This temperature value is
23
misleading, since Whiskey Spring was sampled downstream from the spring and in full
sun, and the velocity and discharge were both small, allowing for a large temperature
increase from the spring to the sampling site. This spread of values means that the
Ochoco springs do not fit the trend from the western springs. Bandit Spring has a much
higher conductivity and alkalinity than any other sampled spring, and since the
temperature is not significantly higher than any other stream in the Ochocos, there is
probably some other local factor controlling the concentrations of elements in this spring.
Spring Temperature
Spring temperatures should approximate the local mean annual temperature
(Kathryn Szramek, pers. comm., October 29, 2009). This holds true for the La Pine basin
with a mean spring water temperature of 6 °C and a mean annual temperature of 6.6 °C
for Wickiup. In contrast, the mean temperature of springs in the Ochocos is 12.6 °C, and
the mean annual air temperature 6.3 °C. This may be influenced by the sampling site,
because Rock and Whiskey spring samples were taken downstream from the actual
springs and had relatively small discharge, so the water temperature could have increased
downstream of the spring. Bandit Spring’s temperature of 8.4 °C is still anomalously high,
but within a more reasonable range. The Metolius Spring temperature of 10.2 °C is also
high relative to the mean annual temperature.
James et al. (2000) suggest that water temperatures warmer than the mean annual
temperature in a region can indicate deeply circulating groundwater, which may absorb
more geothermal heat than shallower groundwater. They suggest the Metolius Spring as
an example of a geothermally warmed spring with an estimated heat slightly more than
the measured background heat flux in the central Oregon Cascades (Blackwell et al.,
24
1982; Ingebritsen et al., 1992; James et al., 2000). This study’s measured discharge is less
and the temperature difference greater, which indicates a smaller geothermal heat flux
(e.g. James et al., 2000).
Bandit Spring also shows a higher than expected temperature, though it is
unknown whether it is another example of regional groundwater flow. Given a shorter
residence time and smaller drainage area than the Metolius Spring, it is likely that the
high temperature of Bandit and other Ochoco springs are due to a different mechanism,
such as a shallow flow path. Water at shallow depths can be influenced by current surface
temperatures. Shallow ground water can be warmer than mean annual temperature
during the summer months if the flow is close to the surface.
Dissolved Oxygen Content (DO)
Dissolved oxygen solubility generally depends on temperature, pressure, and
elevation, since the partial pressure of O2 in the atmosphere changes with elevation
(Walling and Webb, 1992a). Sampled dissolved oxygen content is not correlated to
spring temperature and is moderately negatively correlated with elevation (r2=.468).
Bandit Spring in the Ochocos has a lower than average dissolved oxygen content.
Low dissolved oxygen can indicate microbes in the water, or contamination of water by
livestock waste (Judi Schwarz, pers. comm., March 4, 2010). Bandit spring has a high
water temperature compared to the average air temperature, indicating a shallow flow
path, which are more susceptible to contamination by surface sources. The Ochoco
Mountains are open rangeland for cattle, and some water with cattle manure may be
infiltrating the flow path for Bandit Spring.
25
Dissolved Organic Carbon (DOC)
Dissolved organic carbon content in water often controls the concentrations of
some elements in waters (Gaillardet et al., 2005). However, though springs that had high
alkalinity also had high DOC, there were no elements that directly correlated to DOC
concentrations. The source of dissolved inorganic carbon can be from weathering of
silicate rock, organic breakdown in soils, or pollution (Meybeck, 2003), so it is possible
that the lack of ties between DOC and concentrations in spring water are due less to rock
weathering and more to other inputs. Dissolved organic carbon contents are higher in the
Ochocos, which could be due to contamination, particularly because the flow path is
shallow.
Trace Elements
Rare Earth Elements (REEs)
All springs are heavy REE (HREE) enriched over light REEs (LREE) (Luucc/Ybucc)
compared to the initial rock ratio, which was also weakly HREE enriched. This
corresponds to trends of REE in river water—HREE are more soluble in water than
LREE (Gaillardet et al., 2005). Within the REE graph (Fig. 4), the Cascades and Ochocos
show two different trends for HREEs. Springs near the Cascades crest conform more
closely with the distribution of HREE in the upper continental crust. Spring waters in the
Ochocos are similar to each other but not as similar to the upper continental crust values.
Springs in the Ochocos have higher concentrations of REEs than springs close to
the Cascade crest (Fig. 4). In particular, Rock and Whiskey springs consistently have the
highest concentrations of REEs, with the exception of Lu, where they have anomalously
low values and Fall River Spring (August) has the highest. However, the concentration
26
for the Fall River Spring in August may be suspect since the July value is significantly
less. Alternatively, it could be due to seasonal variation. Tyee Spring is mostly closely
matched with the Cascades trend, though it also shows some characteristic shapes of the
Ochoco trend, particularly for the heavy REEs (HREEs). One element that seems to
differentiate two types of springs is Dysprosium (Dy). Many of the springs show about
equal concentrations of Ho and Dy, but a few (the springs in the Ochocos and Tyee
Spring) show a higher Dy and some a higher Ho concentration (Jack Creek Spring, Fall
River Spring (both), Cultus Spring). This may be due to a difference in the weathering
minerals.
Lithology may play a role in the higher concentrations and trends of HREEs in the
Ochocos. The Ochoco surface lithology is older and probably compositionally and
chemically different from the surface lithology in the Cascades crest area.
Tyee Spring water is not significantly different in composition from other springs
in the Cascades crest region, and is similar to Blacktail Spring both in location and
probable composition of bedrock. However, Blacktail Spring does not show the same
REE trend as Tyee Spring. Some maps suggest that the regional groundwater flow in this
area may come from two different directions, and depending on the exact flow path of
water emerging from these two springs, it is possible that Blacktail Springs is fed from
the high Cascades crest and Tyee Springs is fed largely off of Mt. Sheridan (Lite and
Gannett, 2002).
27
Other Trace Elements
The section below groups elements according to behavior in spring water, and
concentrates on several elements that are of particular interest. These elements are either
abundant in common rock-forming minerals or elements that are often tracers of rock
weathering. Li, Al, Fe, and Mn were chosen because of their relative abundance in
common rock-forming minerals. Sm and Nd concentrations are often indicative of
weathering, particularly when found in suspended sediments (Gaillardet et al., 2005). Sr
was chosen because it is also a classical tracer of rock dissolution, and because it is
highly mobile (Gaillardet et al., 2005). Arsenic is common in some magmatic systems
and is also highly mobile in river waters (Gaillardet et al., 2005). When silica
concentrations are available, the V/Si ratio is also indicative of rock weathering
(Gaillardet et al., 2005), so vanadium concentrations are evaluated even though there is
no available Si water data for this area.
Fe, Al, Mn, Sm, and Nd. Elements in this group are well correlated to each other, and
show higher concentrations in the Ochocos than closer to the Cascade crest.
When considered without Bandit Spring, Fe has a strong positive linear
association with water temperature (r2=.840), as well as with Mn (r
2=.814), Al (r
2=.871),
Sm (r2=.963), and Nd (r
2=.923). Fe has a moderate positive linear association with DOC
(r2=.576) and a moderate negative linear association with DO (r
2=.574). Fe is not well
correlated with Li, V, As, Sr, alkalinity, or pH.
Al has a strong positive linear correlation with Mn (r2=.925), Sm (r
2=.810) and
Nd (r2=.922), and a moderate positive linear correlation with water temperature (r
2=.603);
Al concentration is not correlated with DOC, pH, alkalinity, Li, V, As, or Sr.
28
When considered without Whiskey Spring, Mn concentrations have a moderate
positive correlation with Nd (r2=.571). Mn is strongly correlated to Al and Fe. No
correlation is shown between Mn and water temperature, DOC, pH, alkalinity, Li, V, As,
Sr, or Sm.
Sm and Nd are strongly correlated (r2=.929). Both elements have high
concentrations at Bandit and Rock Springs. They are strongly correlated to Fe and Al. Nd
is moderately correlated with Mn.
Elements abundantly found in common rock-forming or accessory minerals (e.g.
Fe, Al, Mn) are well correlated to each other. The strong correlation suggests that these
elements weather at constant rates relative to each other. Sm and Nd are correlated to Fe
and Al, suggesting that they are also tied up in similar rock weathering reactions. In
springs where the concentrations of these elements are high, there may be higher
concentrations or less water, but the weathering rate relationship between these three
elements stays constant. Five springs have anomalous concentrations for one or more of
these elements. These springs are Bandit Spring (high in Fe, low in Al), Whiskey Spring
(high Al, high Mn), and Rock, Tyee, and John Springs (high in Al). It is logical to
conclude that there is another factor controlling these elements’ concentrations, but Fe,
Al, and Mn concentrations correlate well in all springs but Bandit Spring. Since it is one
single point, it could be that the sample was contaminated in some way, or that local
factors contribute strongly to a locally high iron concentration.
Lithium and Arsenic. Li has a moderate positive linear correlation with As (r2=.526). Li
and As are not correlated with DOC, water temperature, alkalinity, Fe, Al, Mn, Sm, Nd,
V, or Sr. Arsenic is common in fluids within magmatic systems, and is found in high
29
concentrations in Quinn and Metolius Springs, suggesting that the flow path for these two
springs may be closer to some deeper magmatic source. This is consistent with the
previous theory postulated by James et al. (2000) that the Metolius Spring waters may be
part of a deeper basin flow (James et al., 2000; Gannett et al., 2001; Lite and Gannett,
2002).
Strontium. Sr is not well correlated with the minerals mentioned above. It is moderately
correlated with pH when considered without Bandit Spring, and strongly correlated with
alkalinity. It is not correlated with pH, water temperature, or DOC. The high strontium
concentration at Bandit Spring further suggests that factors other than weathering may
influence element concentrations at Bandit Spring.
Vanadium. Vanadium concentrations are not correlated to alkalinity, DOC, water
temperature, pH, or any of the minerals addressed above.
Groundwater Residence Time
With the exception of the Metolius Spring, all of the ages of water emerging from
sampled springs are between 20 and 28 years (Fig. 3). Waters from the Metolius Spring
are older than other spring waters, with an average residence time of 33 years, an outlier
when compared with other spring ages. However, site-specific ranges of estimates show
no outliers. Metolius Spring CFC age estimates are left skewed, suggesting that the actual
range of age estimates trends younger than the average suggests. The youngest spring
waters are in the La Pine Basin.
Previous studies suggest that the Metolius Spring water surfaces because of
underlying geologic structures in the area, particularly the Green River fault system,
30
which juxtaposes more permeable rocks next to less permeable rocks to the north (Fig. 2)
(Gannett et al., 2001; Lite and Gannett, 2002). Additionally, they suggest that the
recharge area for the Metolius is in the high Cascades, similar to springs draining into the
La Pine basin (Fig. 2). However, the Metolius River is farther to the north and the water
must travel farther and longer underground until it is discharged into the Metolius River.
Studies of oxygen isotopes support the high Cascades as the recharge area for the
Metolius Spring based on elevation (James et al., 2000). This hypothesis works in
conjunction with the older age estimate for the Metolius Spring (Fig. 3, Table 5).
When considered without the Ochocos, CFC age has a strong positive linear
correlation with water temperature (r2=.855). This corroborates the idea of regional
groundwater flow leading to warmer spring water temperatures for springs with longer
residence times.
A strong positive linear correlation between CFC age and alkalinity (r2=.817) for
spring waters with Cascade recharge suggests that waters flowing in the subsurface
accrue elements at a relatively constant rate. The Metolius Spring fits this linear trend
even though Metolius Spring water has a longer residence time, which suggests that
spring water in the region does not reach saturation.
Mean residence time for spring water in the Ochocos is similar to spring water
residence time in the La Pine basin. Based on topography, the recharge area for springs in
the Ochocos is not the same as for springs of the La Pine basin, and thus either the flow
path for Bandit Spring is similar in permeability and length to that of the La Pine basin,
or both the permeability and the length are different. The bedrock in the Ochocos is
mostly Tertiary and Cretaceous age, which differentiates it from the predominantly
31
Quaternary basalt and basaltic andesite closer to the Cascade crest. Additional
compounding factors are climatic differences between the two sides of the study area,
including temperature differences, less rainfall, and less discharge from springs in the
Ochocos, which may also influence the velocity of flow within the aquifer.
CFC age results for Bandit Spring have the highest variability between the three
CFC compounds, with an age difference of 15 years (Table 5), more than the 2 year CFC
dating error margin. No other spring shows this wide spread of ages between CFC
compounds. Many factors can influence the accuracy of CFC age estimates, such as the
recharge temperature and the proximity to urban areas (Phillips and Castro, 2005). One
factor that may influence the dates for Bandit Spring is microbial degradation. The
dissolved oxygen content in Bandit Spring is much lower than for any other spring, at
73%, which, while not low enough for anaerobic microbes, may suggest some microbial
growth that affects the water much more than at other springs. In springs with high
concentrations of microbes, CFC-12 is relatively stable, though CFC-11 and CFC-113
results appear older than the actual CFC age (Plummer and Busenberg, 2009). This
suggests that the recharge date for Bandit Spring is not 1986 as the CFC average suggests,
but more likely 1993 or 1994.
Weathering Rates
Assuming a shorter residence time combined with much higher concentrations of
trace elements, conductivity, and alkalinity suggest that the weathering rate in the
Ochocos is much higher than for springs to the west.
32
Trace elements and climatic influences
Data on the concentration of trace elements in precipitation is not available for
this area. Without precipitation concentrations of trace elements, we cannot know what
percentage of trace elements found in springs waters are from sources other than
weathering. Assuming that the precipitation chemistry throughout the basin is the same,
the sites that are most easily discussed are those with much higher or much lower than
average element concentrations. The three springs sampled in the Ochocos nearly always
have concentrations much higher than those springs nearer the Cascades crest.
Climatologic reasons for this could be different temperature, precipitation, or evaporation
conditions, or differences in biomass, or land use.
The average annual temperature difference between the Ochocos and Wickiup is
0.3°C, which does not account for the difference in concentrations of trace elements or in
water temperature. Spring temperature controls trace element concentrations for springs
within 30 km of the Cascades crest, but not for the Ochocos. The annual average
precipitation difference is 14 cm; the Ochocos are somewhat drier than Wickiup. The
annual average snowpack difference also follows this trend, with Wickiup receiving
much more snow. Less water in the system may mean less water overall enters the
groundwater system, allowing the amount of water that is there to become more saturated.
Lithologic influences on trace elements
The majority of rocks within the Deschutes Basin are Quaternary and Tertiary
basalts and andesites (Fig. 2). The actual ages of each formation are only somewhat well
constrained, and since the actual area of each spring catchment and the subsurface
33
geology are not known, the surface lithology is a rough approximation of the rocks within
the flowpath. Nevertheless, it is detailed enough to consider large scale trends in the data.
The vanadium concentrations do not correspond to other elements mentioned
above, but outlying data does correspond to different lithology types. Rock, Whiskey, and
Bandit Springs are all very low in V, and they have approximately the same percentage of
Tertiary age lithologies, with about 70% Tertiary clastic rocks and andesite flows (Table
4). Tumalo Creek Spring has the highest concentration of V, and it is the only spring
catchment that is made up predominantly of rhyolite (80% Qr). Tyee and Blacktail
Springs also have very low V concentrations, and these two springs have about the same
percentage of the youngest Quaternary basalts (80% Qb1, Qb2). pH also corresponds to
spring catchments with high percentages of Qb1and Qb2; For example, Tyee and
Blacktail Springs are the only two springs that have a pH of less than 6.65 (Table 4,
Table 6).
Most notably, the Ochocos, which consistently have higher concentrations of
trace elements compared to springs near the Cascades crest, have a different surface
geology from spring catchments near the Cascades crest. The Ochocos are made of
predominantly Tertiary rocks, whereas the western part of the study area is
predominantly Quaternary. In particular, the Ochocos are composed of Oligocene,
Eocene, and Paleocene clastic rocks and andesite flows, with some Cretaceous
sedimentary rocks and Middle Tertiary tuffs; the Cascades crest is nearly all Quaternary
basalt, basaltic andesite, Quaternary alluvium, and glacial deposits. This difference in age
and composition may be a major factor in the high concentrations of trace elements in the
Ochocos compared to the Cascades.
34
CONCLUSIONS
An increase in pH from 5.3 to 7.3 and increase in conductivity from 4.1µS to
86.0µS indicate that there is an input to the system between precipitation and discharge.
The main source of solutes is related to the release of elements during mineral weathering
within the watershed.
The concentrations of many trace elements are higher in the Ochoco springs than
in the headwaters of the Deschutes River. The difference in concentrations between the
two different hydrogeologic units may be due to a difference in lithology, weathering
rates, or to differences in water budgets, including less precipitation. The age or
composition of the lithology may contribute to the difference in weathering rates because
rocks in the Ochocos are older. Additionally, some areas are clastic rocks, which may be
more susceptible to weathering due to easier water infiltration.
The concentrations of Fe, Al, Mn, Sm, and Nd are related even in waters with
high concentrations of these elements, suggesting that the processes that control the input
of these elements are similar, and not limited by concentration.
Low vanadium concentration may act as a tracer for certain rock units,
particularly Qb1, Qb2, and Tca. This may indicate a lack of vanadium in these rocks, or
that elements containing vanadium weather at a slower rate in these areas. High pH may
indicate a spring catchment with predominantly Qb1and Qb2. Both the rocks and spring
waters are HREE enriched over LREEs, which follows solubility trends of REE in water.
CFC based residence times indicate that all springs except the Metolius River
Spring are recharged within 21-27 years, though the age for Bandit Spring may be
younger than the results suggest due to microbes in the water. The Metolius Spring is
35
recharged from the Cascades crest and travels further; the warmer temperature and high
arsenic concentration may be evidence for a deeper groundwater flow. Correlations
between CFC age dates and alkalinity for springs near the Cascades crest suggest that
waters pick up trace elements at a steady rate, never approaching equilibrium. Trace
element concentrations and CFC age dates suggest that the weathering rate is higher in
the Ochocos than near the Cascades crest.
Near the Cascades crest, spring water temperature is strongly correlated to
concentrations of dissolved elements in spring water. Air temperature does not explain
high spring water temperatures in the Ochocos. Instead, Ochoco spring temperatures are
indicative of a shallow flow path, and water temperature does not control the
concentration of dissolved elements.
Future Work
In the future, more detailed spring sampling coupled with a detailed petrologic
sampling campaign would help constrain the link between spring chemistry and lithology.
In particular, further sampling of rocks within the Ochocos is needed, as well as
examination of all outcrops for jointing and permeability to water. In addition to rock
sampling, springs should be sampled several times, over several days and throughout the
year. This would help to identify seasonal variation within springs as well as sampling
errors. Sampling a larger number of springs within the Ochocos would help to determine
if contamination of spring waters is local or widespread. Further studies should also
consider spring discharge, flow rate, and trace element concentrations in precipitation.
Additional information on major elements in spring water would help to determine the
weathering reactions that are occurring.
36
ACKNOWLEDGEMENTS
I would like to thank the Keck Geology Consortium for providing funding and the
opportunity to conduct this research, as well as Kati Szramek, Bereket Haileab, and Cam
Davidson for their invaluable input. Thanks also to the entire Carleton Geology
Department and to my family for their support throughout the process.
REFERENCES CITED
NADP/NTN Monthly Data Data: http://nadp.sws.uiuc.edu/nadpdata/monthlyRequest.asp?site=OR09 (last accessed December 20, 2009)
1997, Oregon Vegetation 1988: Oregon Department of Forestry. 2006, NOWData - NOAA Online Weather Data:
http://www.weather.gov/climate/xmacis.php?wfo=pdt (last accessed January 3, 2010) Bethke, C. M., and Johnson, T. M., 2008, Ground water age and ground water age dating: Annual
Review of Earth and Planetary Sciences, v. 36, p. 121-152. Blackwell, D. D., Bowen, R. G., Hull, D. A., Riccio, J., and Steele, J. L., 1982, Heat-Flow, Arc
Volcanism, and Subduction in Northern Oregon: Journal of Geophysical Research, v. 87, p. 8735-8754.
Bluth, G. J. S., and Kump, L. R., 1994, Lithologic and Climatologic Controls of River Chemistry: Geochimica Et Cosmochimica Acta, v. 58, p. 2341-2359.
Bowser, C. J., and Jones, B. F., 2002, Mineralogic controls on the composition of natural waters dominated by silicate hydrolysis: American Journal of Science, v. 302, p. 582-662.
Bricker, O. P., and Jones, B. F., 2005, Mass-balance Approach to Interpreting Weathering Reactions in Watershed Systems, in Drever, J. I., ed., Surface and Ground Water, Weathering, and Soils: Treatise on Geochemistry: Oxford, Elsevier, p. 119-132.
Gaillardet, J., Viers, J., and Dupre, B., 2005, Trace Elements in River Waters, in Drever, J. I., ed., Surface and Ground Water, Weathering, and Soils: Treatise on Geochemistry: Oxford, Elsevier, p. 225-273.
Gannett, M. W., Lite, K. E., Morgan, D. S., and Collins, C. A., 2001, Ground-Water Hydrology of the Upper Deschutes Basin, Oregon, U.S. Geological Survey: Water-Resources Investigations Report 00-4162.
Garcia, M. G., Lecomte, K. L., Pasquini, A. I., Formica, S. M., and Depetris, P. J., 2007, Sources of dissolved REE in mountainous streams draining granitic rocks, Sierras Pampeanas (Cordoba, Argentina): Geochimica Et Cosmochimica Acta, v. 71, p. 5355-5368.
Garrels, R. M., and Mackenzie, F. T., 1967, Origin of Chemical Compositions of Some Springs and Lakes: Advances in Chemistry Series, v. 67, p. 222-242.
Gran, G., Johansson, A., and Johansson, S., 1981, Authomatic titration by stepwise addition of equal volumes of titrant, part VII: potentiometric precipitation titrations: Analyst, v. 106, p. 1109-1118.
Ingebritsen, S. E., Sherrod, D. R., and Mariner, R. H., 1992, Rates and Patterns of Groundwater-Flow in the Cascade Range Volcanic Arc, and the Effect on Subsurface Temperatures: Journal of Geophysical Research-Solid Earth, v. 97, p. 4599-4627.
James, E. R., Manga, M., Rose, T. P., and Hudson, G. B., 2000, The use of temperature and the isotopes of O, H, C, and noble gases to determine the pattern and spatial extent of groundwater flow: Journal of Hydrology, v. 237, p. 100-112.
37
Lite, K. E., and Gannett, M. W., 2002, Geologic Framework of the Regional Ground-Water Flow System in the Upper Deschutes Basin, Oregon Report 02-4015: Portland, U.S. Geological Survey.
Meybeck, M., 2003, Global Occurence of Major Elements in Rivers, in Drever, J. I., ed., Surface and Ground Water, Weathering, and Soils: Treatise on Geochemistry: London, Elsevier.
Phillips, F. M., and Castro, M. C., 2005, Groundwater Dating and Residence-time Measurements, in Drever, J. I., ed., Surface and Ground Water, Weathering, and Soils: Treatise on Geochemistry: Oxford, Elsevier, p. 451-498.
Plummer, L. N., and Busenberg, E., 2009, USGS CFC Lab: http://water.usgs.gov/lab/chlorofluorocarbons/background/ (last accessed January 20, 2010)
Sherrod, D. R., and Smith, J. G., 2000, Geologic Map of Upper Eocene to Holocene Volcanic and Related Rocks of the Cascade Range, Oregon: U.S. Geological Survey.
Suchet, P. A., Probst, J. L., and Ludwig, W., 2003, Worldwide distribution of continental rock lithology: Implications for the atmospheric/soil CO2 uptake by continental weathering and alkalinity river transport to the oceans: Global Biogeochemical Cycles, v. 17, p. 1038-1051.
Taylor, S. R., and McLennan, S. M., 1985, The Continental Crust: Its Composition and Evolution: Oxford, Blackwell.
Velbel, M. A., and Price, J. R., 2007, Solute geochemical mass-balances and mineral weathering rates in small watersheds: Methodology, recent advances, and future directions: Applied Geochemistry, v. 22, p. 1682-1700.
Walker, G. W., and MacLeod, N. S., 1991, Geologic Map of Oregon: U.S. Geological Survey, scale 1:500,000.
Walling, D. E., and Webb, B. W., 1992a, Water Quality I: Physical Characteristics, in Petts, G. E., and Calow, P., eds., The Rivers Handbook: Hydrological and Ecological Principles: Oxford, Blackwell.
-, 1992b, Water Quality II: Chemical Characteristics, in Petts, G. E., and Calow, P., eds., The Rivers Handbook: Hydrological and Ecological Principles: Oxford, Blackwell.
White, A. F., and Brantley, S. L., 1995, Chemical weathering rates of silicate minerals: an overview, in White, A. F., and Brantley, S. L., eds., Reviews in Mineralogy and Geochemistry; Chemical Weathering Rates of Silicate Minerals.
38
Recommended