THE ROAD AHEAD
INTERRA RESOURCES LIMITEDANNUAL REPORT 2014Interra Resources Lim
ited Annual Report 2014
INTERRA RESOURCES LIMITEDCompany Registration No. 197300166Z
1 Grange Road #05-04 Orchard BuildingSingapore 239693
Tel : (65) 6732 1711 Fax : (65) 6738 1170Email : [email protected] : www.interraresources.com

DisclaimerThis Annual Report may contain forward-looking statements that are subject to risk factors associated with upstream petroleum industry and mining business. Actual future performance, outcomes and results may differ materially from those expressed in forward-looking statements as a result of a number of risks, uncertainties and assumptions including but not limited to oil and gas price fluctuations, actual demand, currency fluctuations, drilling and production results, reserve estimates, loss of market, industry competition, environmental risks, physical risks, legislative, fiscal and regulatory developments, general industry conditions, economic and financial market conditions in various countries and regions, political risks, project delay or advancement, approvals, cost estimates, changes in operating expenses, cost of capital and capital availability, interest rate trends and the continued availability of financing in the amounts and the terms necessary to support future business. No reliance should be placed on these forward looking statements, which are based on the current view of management of future events.
BOARD OF DIRECTORSEdwin Soeryadjaya Chairman (Non-Executive)
Sandiaga Salahuddin Uno Deputy Chairman (Non-Executive)
Marcel Han Liong TjiaExecutive Director & Chief Executive Officer
Subianto Arpan SumodikoroNon-Executive Director
Ng Soon KaiNon-Executive Director
Low Siew Sie BobLead Independent Director(Non-Executive)
Allan Charles BucklerIndependent Director (Non-Executive)
Lim Hock SanIndependent Director (Non-Executive)
Pepen Handianto DanuatmadjaAlternate Director to Subianto Arpan Sumodikoro
AUDIT COMMITTEELow Siew Sie Bob (Chairman)Allan Charles BucklerLim Hock SanSandiaga Salahuddin Uno
NOMINATING COMMITTEEAllan Charles Buckler (Chairman)Lim Hock SanLow Siew Sie BobNg Soon KaiSandiaga Salahuddin Uno
REMUNERATION COMMITTEEAllan Charles Buckler (Chairman)Lim Hock SanLow Siew Sie BobNg Soon Kai Sandiaga Salahuddin Uno
COMPANY SECRETARIESAdrian Chan PengeeWong Cui Chen Jacinda
CORPORATE INFORMATION
INDEPENDENT AUDITORNexia TS Public Accounting Corporation100 Beach Road#30-00 Shaw TowerSingapore 189702Director-in-charge: Chin Chee Choon(Appointed on 28 April 2011 with effect from FY2011)
REGISTERED OFFICE1 Grange Road#05-04 Orchard BuildingSingapore 239693
STOCK EXCHANGE LISTINGSingapore Exchange (SGX) – MainboardCounter Name: Interra Res (Code: 5GI)
SHARE REGISTRARM & C Services Private Limited112 Robinson Road #05-01Singapore 068902Tel: +65 6227 6660Fax: +65 6225 1452
PI: Participating Interest
Goldwater Eagle Ltd
Goldwater Energy Limited
Goldwater Company Limited
100% 100% 100%
100%
100%100%
100%
49%
100%
100%
49%100% 100%
10%
90%
53.76%
60%
60% PI 60% PI 100% PI 100% PI 100% PI 100% PI
Goldpetrol JOC Inc.
(Joint Operator)
YenangyaungIPRC
ChaukIPRC
MentariPambuang
InternasionalLimited
Goldwater Indonesia Inc.
Goldwater TMT Pte.Ltd.
(Operator)
Tanjung Miring Timur
TAC
Interra Resources (Australia) Pte.Ltd.
GoldwaterLS Pte.Ltd.
PT Mitra Investindo
Tbk
Linda Sele TAC
Bukit Piatu IUP
IBN Oil Holdico Ltd
(Operator)
Interra Resources (Thailand) Limited
GoldwaterKP Pte.Ltd.
PT SumberSari Rejeki
PTPambuang Investindo
PT MentariPambuang
Internasional(Operator)
Kuala Pambuang
PSC
CONTENTS CORPORATE PROFILE 02 FINANCIAL HIGHLIGHTS 04 CHAIRMAN’S STATEMENT 07
BOARD OF DIRECTORS 10 KEY MANAGEMENT 13 OPERATING AND FINANCIAL REVIEW 15
CORPORATE GOVERNANCE REPORT 25 SHAREHOLDER INFORMATION 44 DIRECTORS' REPORT 47
STATEMENT BY DIRECTORS 52 INDEPENDENT AUDITOR’S REPORT 53 BALANCE SHEETS 54
STATEMENT OF COMPREHENSIVE INCOME 55 CONSOLIDATED STATEMENT OF CHANGES IN EQUITY 56
CONSOLIDATED STATEMENT OF CASH FLOWS 58 NOTES TO THE FINANCIAL STATEMENTS 60

Interra Resources Limited The Road Ahead 1
THE ROAD AHEAD IS FULL OF POSSIBILITIES.
OUR VISION FOR LONG-TERM GROWTH IS
CLEAR, AND OUR DRIVE TO DELIVER REMAINS STRONG.
The Road Ahead Annual Report 20142
CORPORATE PROFILE
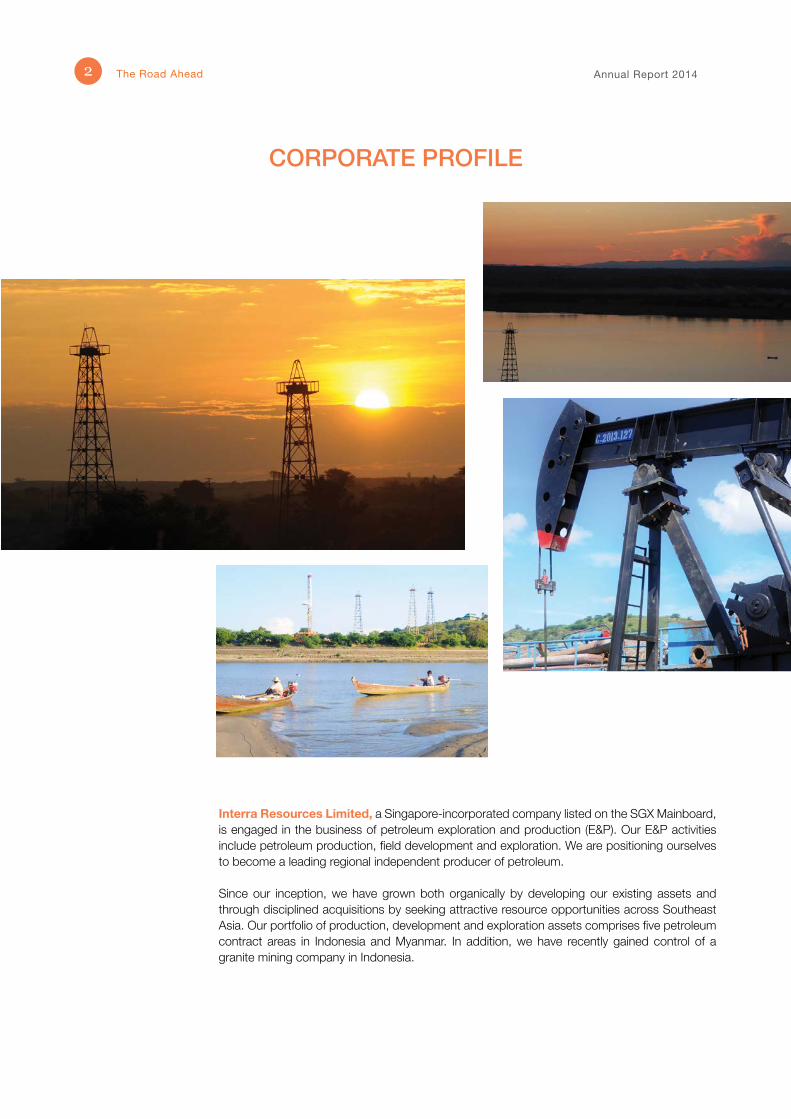
Interra Resources Limited, a Singapore-incorporated company listed on the SGX Mainboard, is engaged in the business of petroleum exploration and production (E&P). Our E&P activities include petroleum production, field development and exploration. We are positioning ourselves to become a leading regional independent producer of petroleum.
Since our inception, we have grown both organically by developing our existing assets and through disciplined acquisitions by seeking attractive resource opportunities across Southeast Asia. Our portfolio of production, development and exploration assets comprises five petroleum contract areas in Indonesia and Myanmar. In addition, we have recently gained control of a granite mining company in Indonesia.

Interra Resources Limited The Road Ahead 3
CORPORATE PROFILE
MYANMARChauk and Yenangyaung FieldsIn central Myanmar, we hold 60% of the rights and interests to two of the largest onshore producing oil fields in Chauk and Yenangyaung under two Improved Petroleum Recovery Contracts (IPRCs). The IPRCs with the Myanma Oil and Gas Enterprise (MOGE) commenced on 4 October 1996 for a term of 20 years and 6 months. We manage the operatorship of the two fields jointly with our joint venture partner through Goldpetrol Joint Operating Company Inc. The adjacent Myanmar concessions extend over a total area of approximately 1,800 square kilometres and are located along the Ayeyarwaddy River, approximately 580 kilometres north of Yangon. During 2014, the combined gross production for both fields was 1,192,523 barrels of oil.
INDONESIATanjung Miring Timur FieldOnshore South Sumatra, we own a 100% participating interest in the Tanjung Miring Timur (TMT) Technical Assistance Contract (TAC). The TAC with PT Pertamina EP commenced on 17 December 1996 for a term of 20 years and we have the full operatorship of the field. The TMT TAC covers an area of approximately 61 square kilometres and is located around 30 kilometres southeast of Prabumulih and about 120 kilometres southwest of Palembang. During 2014, the gross production of the field was 272,538 barrels of oil.
Linda Sele FieldsIn the province of West Papua, we have a 58.38% effective interest in the Linda Sele (LS) Technical Assistance Contract (TAC). The TAC with PT Pertamina EP commenced on 16 November 1998 for a term of 20 years. The LS TAC covers an area of approximately 15 square kilometres in the Salawati Basin and is situated about 60 kilometres south of Sorong. During 2014, the gross production of the onshore fields was 67,938 barrels of oil.
Kuala Pambuang BlockOnshore Central Kalimantan, we have a 67.5% effective interest in an exploration block, namely the Kuala Pambuang (KP) Production Sharing Contract (PSC). The PSC was granted by Badan Pelaksana Kegiatan Usaha Hulu Minyak Dan Gas Bumi (BPMIGAS) on 19 December 2011 and the initial exploration term is 6 years with an option to extend up to 4 years. The KP PSC spans an area of approximately 8,150 square kilometres and is located around 180 kilometres southwest of Palangkaraya. Acquisition of this exploration block was completed in 2014.
Bukit Piatu QuarryIn Bintan, we have a 53.76% effective interest in the Bukit Piatu Mining Business Permit (IUP). The IUP commenced on 20 May 2009 for a term of 5 years and was granted extension for another term of 5 years. The IUP covers an area of 63.72 hectares and is located around 30 kilometres east of Tanjung Pinang. During 2014, the production of the quarry was 1,238,984 tonnes of granite.
The Road Ahead Annual Report 20144
GROUP 2010 2011 2012 2013 2014
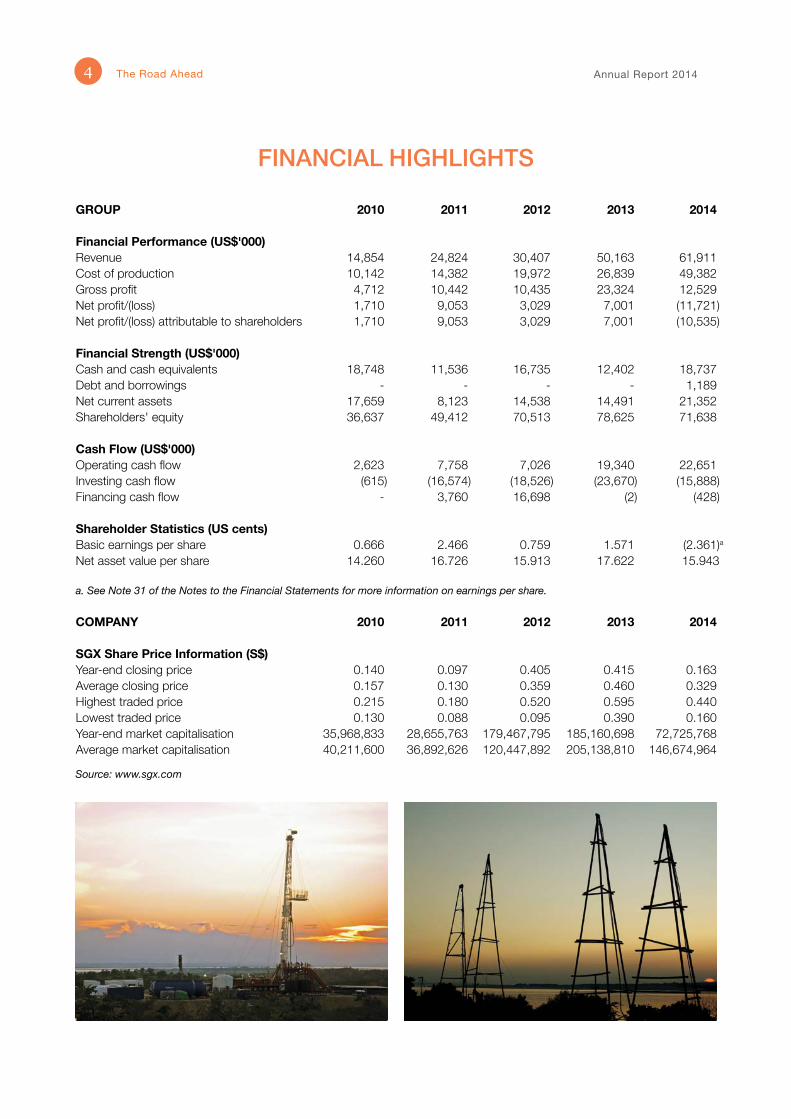
Financial Performance (US$'000)Revenue 14,854 24,824 30,407 50,163 61,911Cost of production 10,142 14,382 19,972 26,839 49,382Gross profit 4,712 10,442 10,435 23,324 12,529Net profit/(loss) 1,710 9,053 3,029 7,001 (11,721)Net profit/(loss) attributable to shareholders 1,710 9,053 3,029 7,001 (10,535)
Financial Strength (US$'000)Cash and cash equivalents 18,748 11,536 16,735 12,402 18,737Debt and borrowings - - - - 1,189Net current assets 17,659 8,123 14,538 14,491 21,352Shareholders' equity 36,637 49,412 70,513 78,625 71,638
Cash Flow (US$'000)Operating cash flow 2,623 7,758 7,026 19,340 22,651Investing cash flow (615) (16,574) (18,526) (23,670) (15,888)Financing cash flow - 3,760 16,698 (2) (428)
Shareholder Statistics (US cents) Basic earnings per share 0.666 2.466 0.759 1.571 (2.361)aNet asset value per share 14.260 16.726 15.913 17.622 15.943
a. See Note 31 of the Notes to the Financial Statements for more information on earnings per share.
COMPANY 2010 2011 2012 2013 2014
SGX Share Price Information (S$)Year-end closing price 0.140 0.097 0.405 0.415 0.163Average closing price 0.157 0.130 0.359 0.460 0.329Highest traded price 0.215 0.180 0.520 0.595 0.440Lowest traded price 0.130 0.088 0.095 0.390 0.160Year-end market capitalisation 35,968,833 28,655,763 179,467,795 185,160,698 72,725,768Average market capitalisation 40,211,600 36,892,626 120,447,892 205,138,810 146,674,964
Source: www.sgx.com
FINANCIAL HIGHLIGHTS
Interra Resources Limited The Road Ahead 5
14.260
36,637
2010
16.726
49,412
2011
15.913
70,513
2012 2014
17.622
2013
71,638
1,710
2010 2011 20142013
1.571
(2.361)
201220142010
4,712
10,142
2011
14,382
2012
19,972
2013
26,839
49,382
61,911
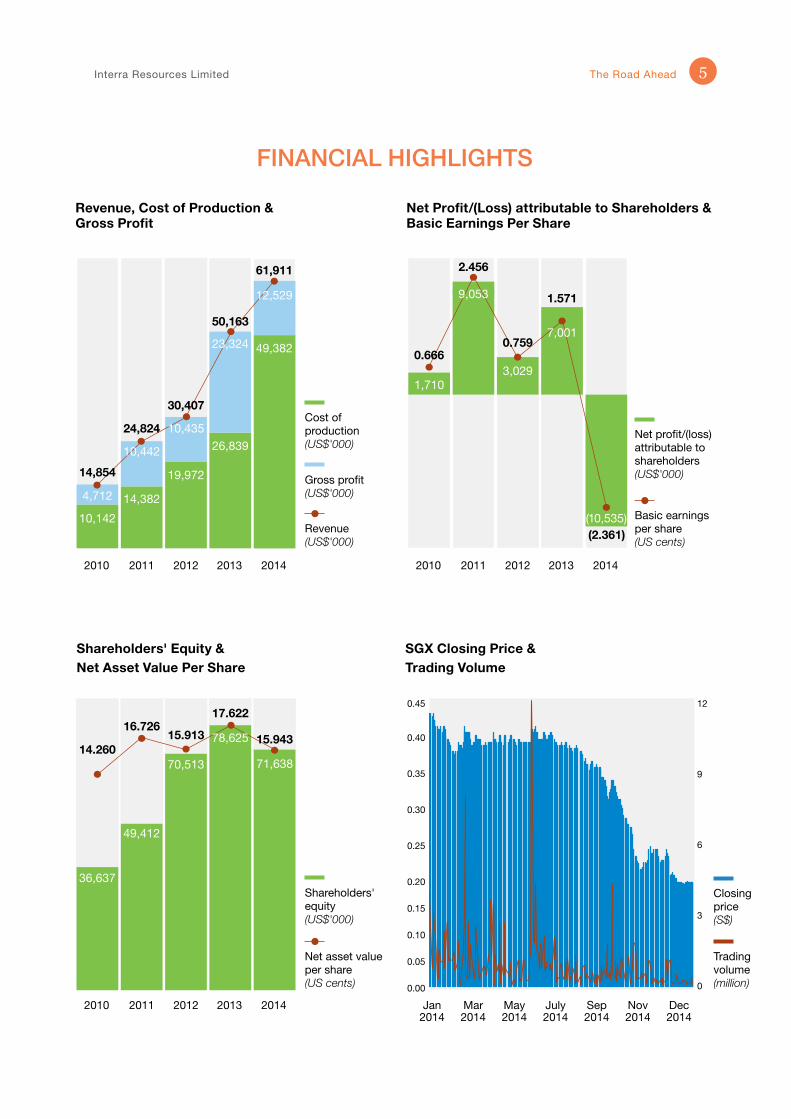
Revenue, Cost of Production & Gross Profit
Shareholders' Equity & Net Asset Value Per Share
Shareholders' equity (US$'000)
Net asset value per share(US cents)
Gross profit(US$'000)
Cost of production(US$'000)
Revenue(US$'000)
SGX Closing Price &Trading Volume
Trading volume(million)
Closing price(S$)
Jan2014
0.45
0.40
0.35
0.30
0.25
0.20
0.15
0.10
0.05
0.00
12
9
6
3
0
Net Profit/(Loss) attributable to Shareholders & Basic Earnings Per Share
Net profit/(loss) attributable to shareholders(US$'000)
Basic earnings per share(US cents)
Mar2014
May 2014
July2014
Sep2014
Dec2014
Nov2014
FINANCIAL HIGHLIGHTS
12,529
10,442
10,435
23,3247,001
(10,535)
3,029
9,053
0.666
2.456
0.759
14,854
24,824
30,407
50,163
15.94378,625

Our primary focus is to boost our operations by optimising our existing assets and our team's capabilities, and taking
advantage of our cross-border presence.
eyes on the road
Interra Resources Limited The Road Ahead 7
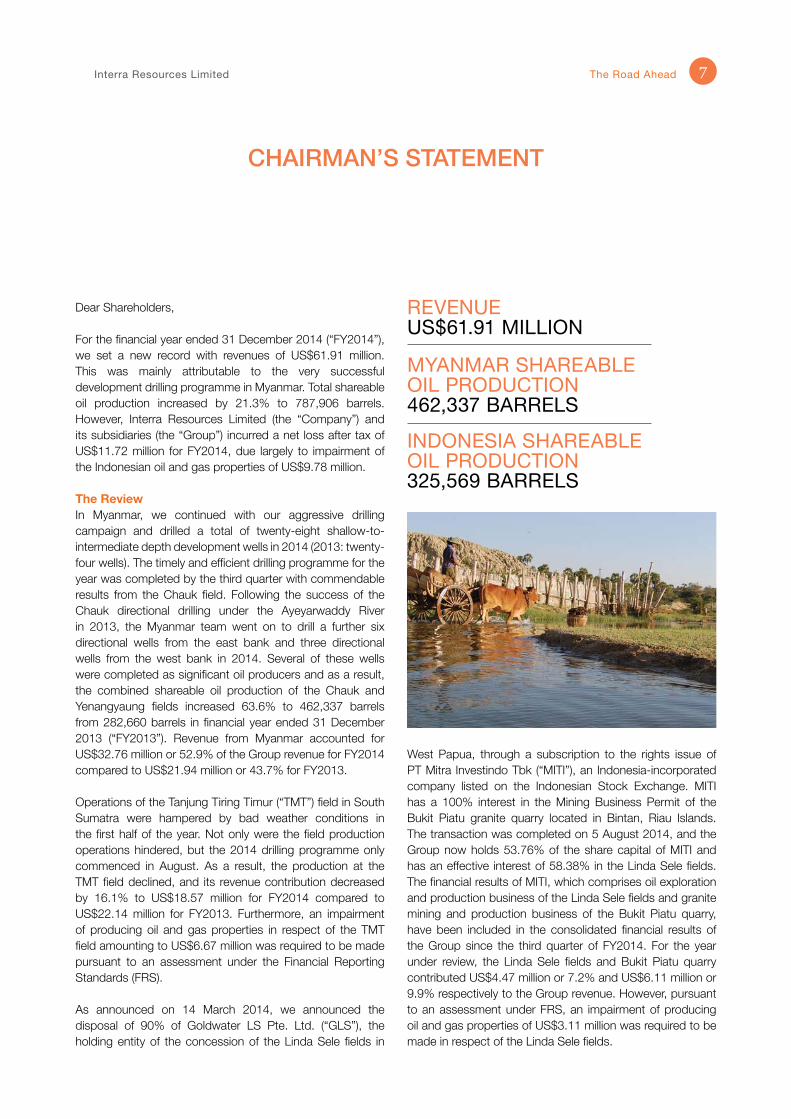
REVENUE US$61.91 MILLION
MYANMAR SHAREABLE OIL PRODUCTION 462,337 BARRELS
INDONESIA SHAREABLEOIL PRODUCTION 325,569 BARRELS
Dear Shareholders,
For the financial year ended 31 December 2014 (“FY2014”), we set a new record with revenues of US$61.91 million. This was mainly attributable to the very successful development drilling programme in Myanmar. Total shareable oil production increased by 21.3% to 787,906 barrels. However, Interra Resources Limited (the “Company”) and its subsidiaries (the “Group”) incurred a net loss after tax of US$11.72 million for FY2014, due largely to impairment of the Indonesian oil and gas properties of US$9.78 million.
The ReviewIn Myanmar, we continued with our aggressive drilling campaign and drilled a total of twenty-eight shallow-to-intermediate depth development wells in 2014 (2013: twenty-four wells). The timely and efficient drilling programme for the year was completed by the third quarter with commendable results from the Chauk field. Following the success of the Chauk directional drilling under the Ayeyarwaddy River in 2013, the Myanmar team went on to drill a further six directional wells from the east bank and three directional wells from the west bank in 2014. Several of these wells were completed as significant oil producers and as a result, the combined shareable oil production of the Chauk and Yenangyaung fields increased 63.6% to 462,337 barrels from 282,660 barrels in financial year ended 31 December 2013 (“FY2013”). Revenue from Myanmar accounted for US$32.76 million or 52.9% of the Group revenue for FY2014 compared to US$21.94 million or 43.7% for FY2013.
Operations of the Tanjung Tiring Timur (“TMT”) field in South Sumatra were hampered by bad weather conditions in the first half of the year. Not only were the field production operations hindered, but the 2014 drilling programme only commenced in August. As a result, the production at the TMT field declined, and its revenue contribution decreased by 16.1% to US$18.57 million for FY2014 compared to US$22.14 million for FY2013. Furthermore, an impairment of producing oil and gas properties in respect of the TMT field amounting to US$6.67 million was required to be made pursuant to an assessment under the Financial Reporting Standards (FRS).
As announced on 14 March 2014, we announced the disposal of 90% of Goldwater LS Pte. Ltd. (“GLS”), the holding entity of the concession of the Linda Sele fields in
West Papua, through a subscription to the rights issue of PT Mitra Investindo Tbk (“MITI”), an Indonesia-incorporated company listed on the Indonesian Stock Exchange. MITI has a 100% interest in the Mining Business Permit of the Bukit Piatu granite quarry located in Bintan, Riau Islands. The transaction was completed on 5 August 2014, and the Group now holds 53.76% of the share capital of MITI and has an effective interest of 58.38% in the Linda Sele fields. The financial results of MITI, which comprises oil exploration and production business of the Linda Sele fields and granite mining and production business of the Bukit Piatu quarry, have been included in the consolidated financial results of the Group since the third quarter of FY2014. For the year under review, the Linda Sele fields and Bukit Piatu quarry contributed US$4.47 million or 7.2% and US$6.11 million or 9.9% respectively to the Group revenue. However, pursuant to an assessment under FRS, an impairment of producing oil and gas properties of US$3.11 million was required to be made in respect of the Linda Sele fields.
CHAIRMAN’S STATEMENT
The Road Ahead Annual Report 20148
CHAIRMAN’S STATEMENT
During the third quarter of the year, we also finalised the acquisition of the Kuala Pambuang block in Central Kalimantan, of which the Group now has an effective interest of 67.5%. The proposed 2D seismic survey over the most prospective area of the block kicked off in October 2014 and was nearing completion towards the end of the year. Preliminary seismic data processing and interpretation has been accomplished and several areas of interest have already been identified. In the year to come, we will strive to work towards the objective of evaluating the potential for the discovery of new hydrocarbon resources in this block.
Challenging Times AheadThe relative stability of crude oil prices since the beginning of 2011 was disrupted unexpectedly during the second half of 2014 by the global downturn in crude oil prices, which plummeted from above U$100 per barrel to below US$60 per barrel at year end. Moving forward, we will adopt a prudent approach to managing the capital spending and to striking a balance between cost and production. The direction of crude oil prices is still very uncertain at this juncture due to numerous conflicting variables from supply and demand, global monetary environment and geopolitics. Having been through a similar crude oil price cycle in 2008 and based upon a solid foundation laid over the years, I believe the Group is well prepared to weather the challenging times ahead.
During the year, we continued to evaluate new concessions, one of which was the proposed acquisition relating to the participating interest of the Benakat Barat field in South Sumatra. I am pleased to report that we have entered into a conditional sale and purchase agreement on 12 March 2015 to acquire approximately 21.5% equity interest in PT Benakat Oil, which translates into an indirect interest of 20% in PT Benakat Barat Petroleum (“BBP”). BBP holds the entire participating interest and operatorship of the Benakat Barat field. We believe that the indirect acquisition of 20% of BBP is a strategic investment because not only is the Benakat Barat field adjacent to our TMT field, it also produces oil from the same geological structures and formations as the field.
As at the end of FY2014, the financial position of the Group remained healthy with US$18.74 million (excluding restricted cash) in cash and cash equivalents and total borrowings undertaken by MITI of US$1.19 million. Barring further declines in crude oil prices, the Group has sufficient cash on hand to meet its work commitments in 2015 and will evaluate and source funding when the need arises.
Corporate ActionsOn 9 December 2014, the Company issued and allotted and issued 44,616,914 free warrants to shareholders on the basis of one warrant for every ten existing ordinary shares pursuant to a bonus warrants issue approved at the extraordinary general meeting held on 24 October 2014. The Board had proposed the bonus warrants issue to reward shareholders for the continued participation in and support for the Company, and to raise funds for the Company and its subsidiaries. The Board does not recommend any dividend for FY2014.
The Board strives to maintain high standards of corporate governance, thereby promoting corporate transparency and accountability to enhance long-term shareholder value. It is the objective of the Group to operate in a socially and environmentally sustainable manner whilst balancing the interests of stakeholders and society at large. We endeavour to raise awareness of these ethics within the Group and to integrate them into the everyday business practices and decision making.
AcknowledgementsIn conclusion, I would like to express my sincere appreciation to my fellow Board and committee members for your active participation and guidance throughout the year. I would also like to thank our shareholders for your understanding and steadfast trust in us, and to our joint-venture partners, business associates and various relevant government authorities for supporting the Group’s growth and development over the years.
Our progress towards our strategic goals over the past year would not have been possible without the untiring efforts of our management team and staff. On behalf of the Board, I would like to convey my gratitude to all our employees for your dedication, commitment and loyalty. The road ahead may be challenging but I am optimistic that, with your unwavering support and perseverance, we are able to navigate the path with confidence and stay the course.
Yours sincerely,EDWIN SOERYADJAYAChairman
25 March 2015
“The Board strives to maintain high standards of corporate governance, thereby promoting corporate transparency and
accountability to enhance long-term shareholder value.”

Through prudent management of our resources, we strive to achieve the organisational flexibility required to stay resilient
and to tap into growth prospects as they arise.
staying on course
The Road Ahead Annual Report 201410
BOARD OF DIRECTORS
Edwin SoeryadjayaChairman (Non-Executive)Mr Edwin Soeryadjaya is the Chairman of the Company. He was first appointed as a Director on 14 December 2004 and subsequently took on the role of Chairman on 1 July 2005. Mr Soeryadjaya was last re-elected as a Director on 29 April 2014.
Mr Soeryadjaya is the President Commissioner of PT Saratoga Investama Sedaya Tbk, an active investment firm in Indonesia and has deep insight into the Indonesian economy. He commenced his career with PT Astra International Tbk in 1978 and was responsible for its financial restructuring and public listing. He left the Astra group as Vice President Director in 1993 to set up his own investment company. His chairmanships include being the President Commissioner of PT Adaro Energy Tbk (coal mine), President Commissioner of PT Lintas Marga Sedaya (toll road concession holder, operator and contractor), President Commissioner of PT Mitra Pinashtika Mustika Tbk (distributor of Honda motorcycles), President Commissioner of PT Tower Bersama Infrastruktur Tbk (base telecommunication towers), and Commissioner of PT Provident Agro Tbk (palm plantation). He also sits on the boards of Seroja Investments Limited (maritime transportation) and Goldwater Company Limited (oil and gas).
Mr Soeryadjaya graduated with a Bachelor of Business Administration from the University of Southern California, Los Angeles in 1974.
Sandiaga Salahuddin UnoDeputy Chairman (Non-Executive)Mr Sandiaga Salahuddin Uno is the Deputy Chairman of the Company. He was appointed as a Director on 1 July 2003 and the Deputy Chairman on 1 July 2005. Mr Uno was last re-elected as a Director on 26 April 2013. He also serves as a member of the Audit Committee, the Nominating Committee and the Remuneration Committee.
Currently, Mr Uno is the President Director of PT Saratoga Investama Sedaya Tbk, an active investment firm in Indonesia. He also sits on the boards of directors of PT Adaro Energy Tbk (coal mine) and PT Tri Wahana Universal (oil refinery), and also serves on the boards of commissioners of PT Lintas Marga Sedaya (toll road concession holder, operator and contractor) and PT Medco Power Indonesia (independent power plant).
Mr Uno received a Bachelor of Business Administration with summa cum laude from the Wichita State University, Kansas in 1990 and a Master of Business Administration from The George Washington University, Washington D.C. in 1992.
Further information on the Directors and their respective interests in the Company can be found in the Corporate Governance Report and Directors’ Report sections of this Annual Report.
Interra Resources Limited The Road Ahead 11
BOARD OF DIRECTORS
Subianto Arpan SumodikoroNon-Executive Director Mr Subianto Arpan Sumodikoro is a Non-Executive Director of the Company. He was first appointed as a Director on 14 December 2004 and was last re-elected on 29 April 2014.
Mr Subianto commenced his career with PT Astra International Tbk in 1969 and held a variety of positions within the Astra group, rising to be its Vice Chairman in 2000. Before he retired from the Astra group in 2006, he also served on the board of commissioners of PT Astra Agro Lestari Tbk.
Currently, Mr Subianto leads the boards of directors of his own investment and holding companies, and is the Chairman of Multico Infracore Holdings Pte Ltd and Multi-Corporation (S) Pte Ltd. In addition, he is the President Commissioner of PT Agro Multi Persada, PT Dharma Satya Nusantara, PT Kirana Megatara and PT Triputra Agro Persada; Commissioner of PT Adaro Energy Tbk; President Director of PT Persada Capital Investama; and Director of Shining Persada Investments Pte Ltd and Triple AR Holding Pte Ltd.
Mr Subianto graduated from the Bandung Institute of Technology in 1969 with a Bachelor’s Degree in Mechanical Engineering.
Marcel Han Liong TjiaExecutive Director & Chief Executive OfficerMr Marcel Han Liong Tjia is the Chief Executive Officer and Executive Director of the Company. He was appointed as a Director on 20 June 2009 and re-elected on 28 April 2010. Mr Tjia also sits on various boards and management committees of the Company’s subsidiary companies and joint venture entities.
Prior to joining the Company, Mr Tjia was a partner in a regional private equity and direct investment company with interests in energy and natural resources. Over the past 25 years, Mr Tjia has gained extensive experience in mergers and acquisitions as well as corporate finance in Hong Kong, Indonesia, Singapore and Canada. He is currently a partner in an investment company with holdings in real estate and the automotive industry.
Mr Tjia holds a Bachelor of Commerce (Honours) and a Master of Business Administration from the University of British Columbia, Vancouver.
Ng Soon KaiNon-Executive Director Mr Ng Soon Kai is a Non-Executive Director of the Company. He was first appointed as a Director on 1 November 2005 and was last re-elected on 26 April 2013. Mr Ng also serves as a member of the Nominating Committee and the Remuneration Committee.
Mr Ng is currently the Managing Director of Ng Chong & Hue LLC and has vast legal experience in litigation, mergers and acquisitions, corporate restructuring, reverse takeovers and schemes of arrangement.
Mr Ng obtained a Bachelor of Laws (Second Class Upper) from the National University of Singapore in 1989. He is a Commissioner for Oaths and a Notary Public.
Further information on the Directors and their respective interests in the Company can be found in the Corporate Governance Report and Directors’ Report sections of this Annual Report.
The Road Ahead Annual Report 201412
BOARD OF DIRECTORS
Low Siew Sie BobLead Independent Director (Non-Executive)Mr Low Siew Sie Bob is the Lead Independent Director of the Company. He was appointed as a Director on 18 February 2011 and was last re-elected on 29 April 2014. Mr Low also serves as the Chairman of the Audit Committee and a member of the Nominating Committee and the Remuneration Committee.
Mr Low is currently the Principal Consultant of Bob Low & Co. and his area of expertise includes corporate assurance, corporate recovery and restructuring, judicial management, acting as receiver and manager, acting as scheme manager, due diligence and project evaluation. He also serves as a lead independent director of China Hongcheng Holdings Limited and LH Group Limited, an independent director of Veio Capital Master Fund Limited, Veio Capital Offshore Feeder Fund Limited and Veio Capital US Feeder Fund Limited, and a director of Genesis Ltd.
Mr Low qualified as a UK Chartered Certified Accountant in 1974 and subsequently obtained a Bachelor of Laws (Second Class Lower) from the University of London in 1985. He is a Fellow of the Institute of Singapore Chartered Accountants, Certified Public Accountants, Australia, and Insolvency Practitioners Association of Singapore Limited, and a member of the Chartered Institute of Arbitrators of Hong Kong and UK, Singapore Academy of Law, Singapore Institute of Arbitrators, and an Accredited Tax Adviser/Practitioner.
Allan Charles BucklerIndependent Director (Non-Executive)Mr Allan Charles Buckler is an Independent Director of the Company. He was first appointed as a Director on 14 December 2004 and was last re-elected on 24 April 2012. Mr Buckler also serves as the Chairman of the Nominating Committee and the Remuneration Committee and a member of the Audit Committee.
Mr Buckler sits on the boards of directors of Altura Mining Limited and Sayona Mining Limited, both mining companies listed on the Australian Securities Exchange, as well as Merida Corporation Pte Ltd.
Mr Buckler holds Certificates in Mine Surveying and Mining. He also has a First Class Mine Managers Certificate and a Mine Surveyor Certificate issued by the Queensland Government’s Department of Mines.
Lim Hock SanIndependent Director (Non-Executive)Mr Lim Hock San is an Independent Director of the Company. He was appointed as a Director on 8 September 2012 and was re-elected on 26 April 2013. Mr Lim also serves as a member of the Audit Committee, the Nominating Committee and the Remuneration Committee.
Currently, Mr Lim is the President and Chief Executive Officer of United Industrial Corporation Limited and Singapore Land Limited. He also holds directorships in Gallant Venture Ltd. and Indofood Agri Resources Ltd.
Mr Lim graduated from the then University of Singapore with a Bachelor of Accountancy in 1968. He obtained a Master of Science in Management from Massachusetts Institute of Technology, USA in 1973 and attended the Advanced Management Program at Harvard Business School in 1991. He is a Fellow of The Chartered Institute of Management Accountants, UK and a Fellow and past President of the Institute of Singapore Chartered Accountants.
Pepen Handianto DanuatmadjaAlternate Director to Subianto Arpan SumodikoroMr Pepen Handianto Danuatmadja is the Alternate Director to Mr Subianto Arpan Sumodikoro appointed on 18 February 2011.
Mr Pepen is currently the Executive Director of Multico Infracore Holdings Pte Ltd and Multi-Corporation (S) Pte Ltd. He also holds directorships in Shining Persada Investments Pte Ltd.
Mr Pepen graduated with a Diplom-Ingenieur in Mechanical Engineering from the Technische Universitaet Darmstadt, Germany in 1982.
Further information on the Directors and their respective interests in the Company can be found in the Corporate Governance Report and Directors’ Report sections of this Annual Report.
Interra Resources Limited The Road Ahead 13
KEY MANAGEMENT
Foo Say Tain Chief Financial OfficerMr Foo Say Tain joined the Company as Chief Financial Officer in November 2007. He has overall responsibility for the Group’s financial and management accounting, treasury, taxation and other corporate compliance matters. He has more than 20 years of experience in accounting, finance and administration in listed companies and foreign multinational corporations.
Mr Foo is a Fellow Chartered Accountant of Singapore and a Fellow of the Association of Chartered Certified Accountants, UK. He also holds a degree in Bachelor of Business Administration from The National University of Singapore.
Frank Overall HollingerChief Technical OfficerMr Frank Overall Hollinger was appointed the Chief Technical Officer of the Company in July 2006. He manages the geoscience and other technical aspects of the oil and gas exploration and production business.
Before joining the Company, Mr Hollinger spent 8 years in Myanmar as a Geophysical Consultant for Premier Petroleum Myanmar Ltd., Myanmar Petroleum Resources Ltd. and Goldpetrol JOC Inc. He commenced his geoscience career in 1971 while in graduate school as a National Aeronautics and Space Administration research assistant at The University of New Mexico, USA. Subsequently, he worked on numerous exploration and development projects in different capacities with oil and gas corporations such as Texaco Inc., Petroleum Exploration Consultants Worldwide Inc., Mapco Production Co., Ladd Petroleum Corp., Enron Oil & Gas, Columbia Gas Development Corporation, and Petronas Carigali Sdn Bhd. He has more than 35 years experience in the oil and gas industry.
Mr Hollinger graduated from the University of South Alabama with a Bachelor of Science in Geology in 1971. Subsequently, he obtained a Master of Science in Geology from The University of New Mexico in 1973. In 1988, Mr Hollinger completed the Professional Degree Program in Geology at the Colorado School of Mines. He is a member of the American Association of Petroleum Geologists.
Sugi HandokoVice President, OperationsMr Sugi Handoko was appointed the Vice President, Operations of the Company in January 2012. He has overall responsibility of managing the oil and gas exploration and production operations of the Group.
Prior to the current appointment, Mr Handoko was the Country Manager of Goldpetrol JOC Inc. He has more than 25 years of experience in oil and gas exploration and production management and operations, which includes engineering, production, finance, procurement, logistic, human resources, and government liaison.
Mr Handoko graduated from the Bandung Institute of Technology in 1988 with a Bachelor’s Degree in Petroleum Engineering. He is a member of the Society of Petroleum Engineers, Indonesian Petroleum Association and Ikatan Ahli Teknik Perminyakan Indonesia.
Han LiqiangRegional Operations ManagerMr Han Liqiang was appointed the Regional Operations Manager of the Company in April 2014. His main role is to manage the regional petroleum exploration and production operations of the Group. Currently, he is seconded to the Myanmar operations as the Country Manager.
Mr Han commenced his career with BGP in 1992 as a geophysicist for various petroleum projects in China. Subsequently, he was based in overseas branch offices managing a variety of seismic projects in the Middle East and Asia Pacific region. He has more than 20 years of experience in project management, marketing and HSE management in the industry and has worked with numerous oil and gas companies such as Total, Saudi Aramco and Salamander Energy.

myanmar
Nay Pyi Daw
Bagan
Chauk IPRCYenangyaung IPRC
Yangon
singapore
indonesiaJakarta
SUMATRA
JAVA
KualaPambuang PSC
Linda Sele TAC
WEST PAPUA
SorongKALIMANTAN
SULAWESIPalembangTanjung Miring
Timur TAC
Always on the lookout to expand, we will continue to seek new concessions and assets to strengthen our regional presence and
achieve sustainable growth.
never stop exploring
Bukit Piatu IUP
Interra Resources Limited The Road Ahead 15
OPERATING AND FINANCIAL REVIEW
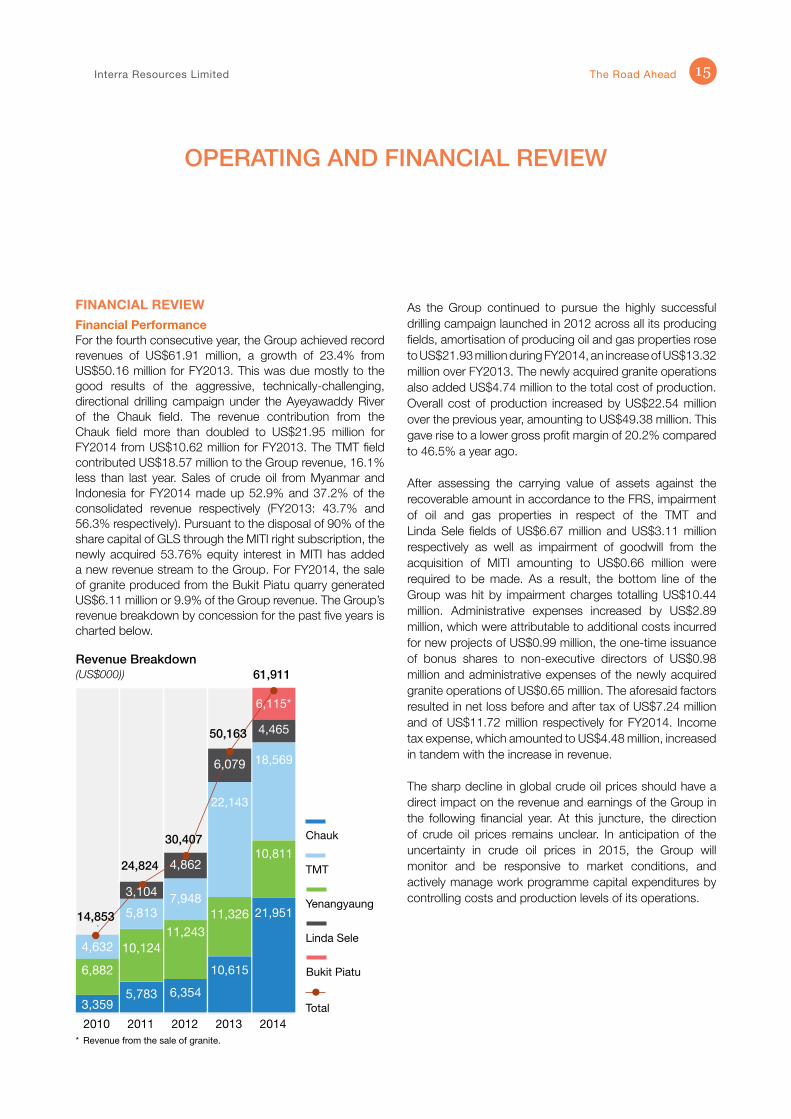
FINANCIAL REVIEWFinancial PerformanceFor the fourth consecutive year, the Group achieved record revenues of US$61.91 million, a growth of 23.4% from US$50.16 million for FY2013. This was due mostly to the good results of the aggressive, technically-challenging, directional drilling campaign under the Ayeyawaddy River of the Chauk field. The revenue contribution from the Chauk field more than doubled to US$21.95 million for FY2014 from US$10.62 million for FY2013. The TMT field contributed US$18.57 million to the Group revenue, 16.1% less than last year. Sales of crude oil from Myanmar and Indonesia for FY2014 made up 52.9% and 37.2% of the consolidated revenue respectively (FY2013: 43.7% and 56.3% respectively). Pursuant to the disposal of 90% of the share capital of GLS through the MITI right subscription, the newly acquired 53.76% equity interest in MITI has added a new revenue stream to the Group. For FY2014, the sale of granite produced from the Bukit Piatu quarry generated US$6.11 million or 9.9% of the Group revenue. The Group’s revenue breakdown by concession for the past five years is charted below.
As the Group continued to pursue the highly successful drilling campaign launched in 2012 across all its producing fields, amortisation of producing oil and gas properties rose to US$21.93 million during FY2014, an increase of US$13.32 million over FY2013. The newly acquired granite operations also added US$4.74 million to the total cost of production. Overall cost of production increased by US$22.54 million over the previous year, amounting to US$49.38 million. This gave rise to a lower gross profit margin of 20.2% compared to 46.5% a year ago.
After assessing the carrying value of assets against the recoverable amount in accordance to the FRS, impairment of oil and gas properties in respect of the TMT and Linda Sele fields of US$6.67 million and US$3.11 million respectively as well as impairment of goodwill from the acquisition of MITI amounting to US$0.66 million were required to be made. As a result, the bottom line of the Group was hit by impairment charges totalling US$10.44 million. Administrative expenses increased by US$2.89 million, which were attributable to additional costs incurred for new projects of US$0.99 million, the one-time issuance of bonus shares to non-executive directors of US$0.98 million and administrative expenses of the newly acquired granite operations of US$0.65 million. The aforesaid factors resulted in net loss before and after tax of US$7.24 million and of US$11.72 million respectively for FY2014. Income tax expense, which amounted to US$4.48 million, increased in tandem with the increase in revenue.
The sharp decline in global crude oil prices should have a direct impact on the revenue and earnings of the Group in the following financial year. At this juncture, the direction of crude oil prices remains unclear. In anticipation of the uncertainty in crude oil prices in 2015, the Group will monitor and be responsive to market conditions, and actively manage work programme capital expenditures by controlling costs and production levels of its operations.
Revenue Breakdown(US$000))
Yenangyaung
* Revenue from the sale of granite.
TMT
Chauk
Linda Sele
Bukit Piatu
Total2012
6,354
11,243
7,948
2010
3,359
6,882
4,632
2014
61,911
21,951
10,811
18,569
4,465
2013
10,615
22,143
11,326
2011
5,783
10,124
5,813
30,407
14,853
50,163
24,824 4,862
6,079
6,115*
3,104
The Road Ahead Annual Report 201416
OPERATING AND FINANCIAL REVIEW
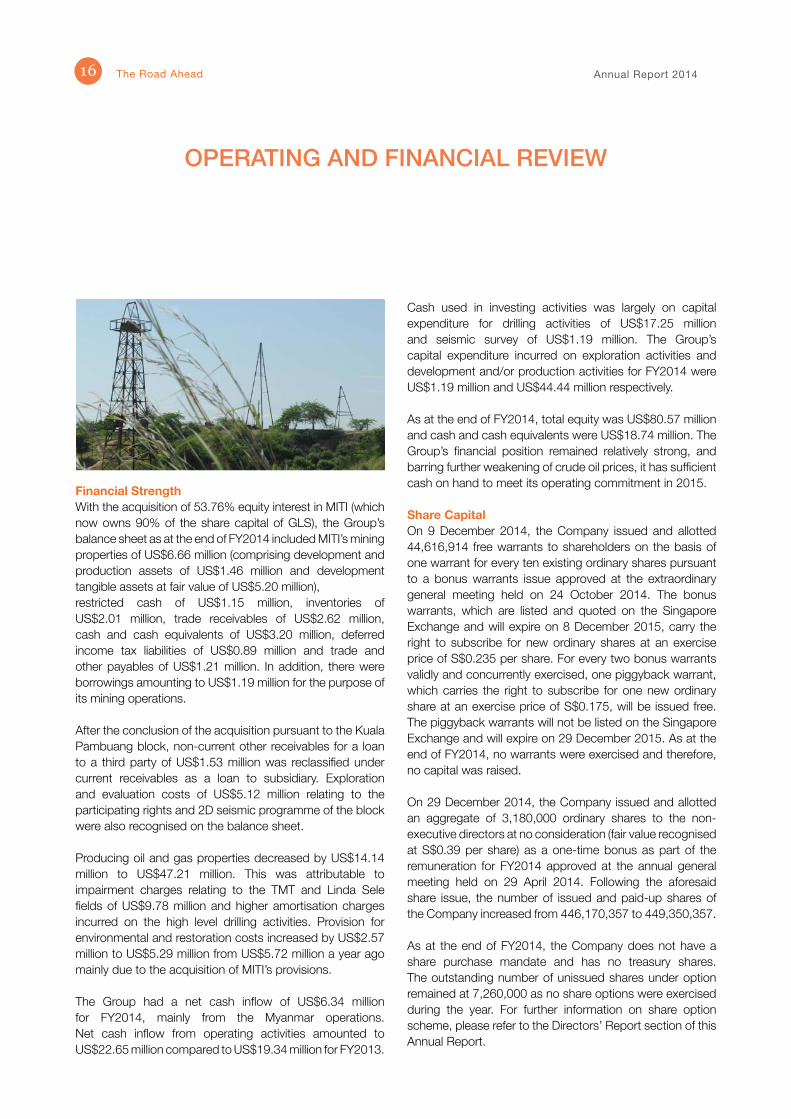
Financial StrengthWith the acquisition of 53.76% equity interest in MITI (which now owns 90% of the share capital of GLS), the Group’s balance sheet as at the end of FY2014 included MITI’s mining properties of US$6.66 million (comprising development and production assets of US$1.46 million and development tangible assets at fair value of US$5.20 million),restricted cash of US$1.15 million, inventories of US$2.01 million, trade receivables of US$2.62 million, cash and cash equivalents of US$3.20 million, deferred income tax liabilities of US$0.89 million and trade and other payables of US$1.21 million. In addition, there were borrowings amounting to US$1.19 million for the purpose of its mining operations.
After the conclusion of the acquisition pursuant to the Kuala Pambuang block, non-current other receivables for a loan to a third party of US$1.53 million was reclassified under current receivables as a loan to subsidiary. Exploration and evaluation costs of US$5.12 million relating to the participating rights and 2D seismic programme of the block were also recognised on the balance sheet.
Producing oil and gas properties decreased by US$14.14 million to US$47.21 million. This was attributable to impairment charges relating to the TMT and Linda Sele fields of US$9.78 million and higher amortisation charges incurred on the high level drilling activities. Provision for environmental and restoration costs increased by US$2.57 million to US$5.29 million from US$5.72 million a year ago mainly due to the acquisition of MITI’s provisions.
The Group had a net cash inflow of US$6.34 million for FY2014, mainly from the Myanmar operations. Net cash inflow from operating activities amounted to US$22.65 million compared to US$19.34 million for FY2013.
Cash used in investing activities was largely on capital expenditure for drilling activities of US$17.25 million and seismic survey of US$1.19 million. The Group’s capital expenditure incurred on exploration activities and development and/or production activities for FY2014 were US$1.19 million and US$44.44 million respectively.
As at the end of FY2014, total equity was US$80.57 million and cash and cash equivalents were US$18.74 million. The Group’s financial position remained relatively strong, and barring further weakening of crude oil prices, it has sufficient cash on hand to meet its operating commitment in 2015.
Share CapitalOn 9 December 2014, the Company issued and allotted 44,616,914 free warrants to shareholders on the basis of one warrant for every ten existing ordinary shares pursuant to a bonus warrants issue approved at the extraordinary general meeting held on 24 October 2014. The bonus warrants, which are listed and quoted on the Singapore Exchange and will expire on 8 December 2015, carry the right to subscribe for new ordinary shares at an exercise price of S$0.235 per share. For every two bonus warrants validly and concurrently exercised, one piggyback warrant, which carries the right to subscribe for one new ordinary share at an exercise price of S$0.175, will be issued free. The piggyback warrants will not be listed on the Singapore Exchange and will expire on 29 December 2015. As at the end of FY2014, no warrants were exercised and therefore, no capital was raised.
On 29 December 2014, the Company issued and allotted an aggregate of 3,180,000 ordinary shares to the non-executive directors at no consideration (fair value recognised at S$0.39 per share) as a one-time bonus as part of the remuneration for FY2014 approved at the annual general meeting held on 29 April 2014. Following the aforesaid share issue, the number of issued and paid-up shares of the Company increased from 446,170,357 to 449,350,357.
As at the end of FY2014, the Company does not have a share purchase mandate and has no treasury shares. The outstanding number of unissued shares under option remained at 7,260,000 as no share options were exercised during the year. For further information on share option scheme, please refer to the Directors’ Report section of this Annual Report.
Interra Resources Limited The Road Ahead 17
OPERATING AND FINANCIAL REVIEW
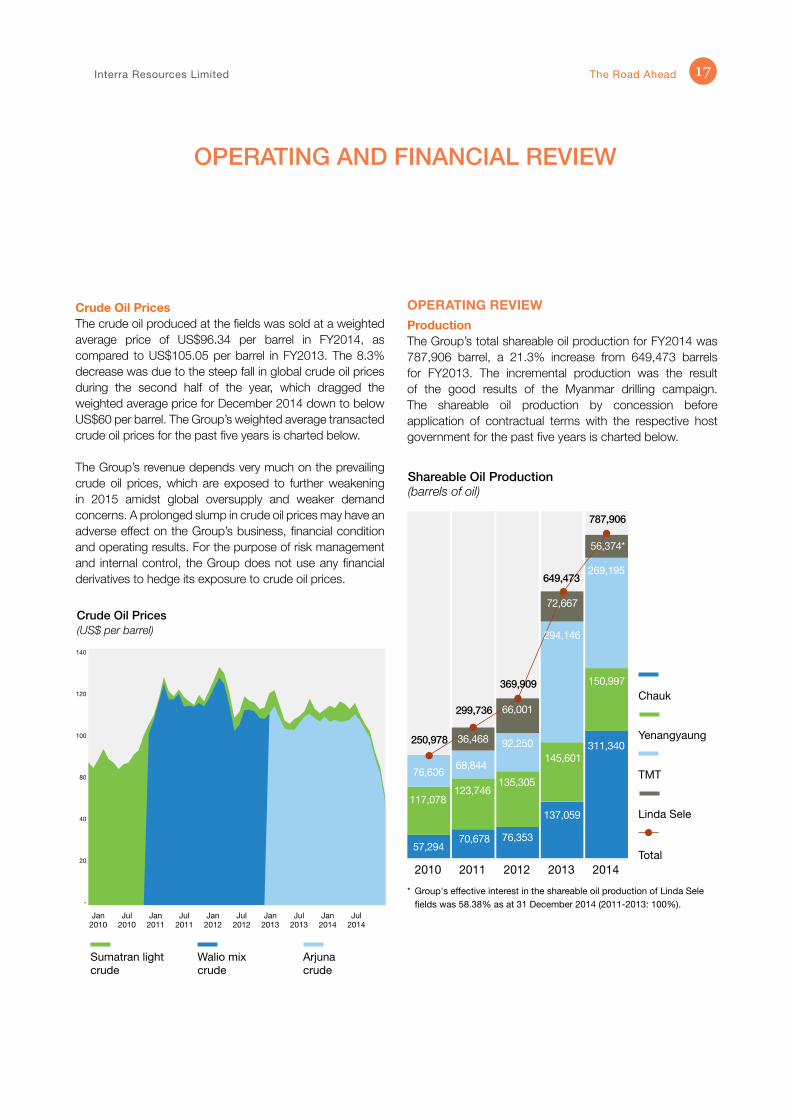
Crude Oil PricesThe crude oil produced at the fields was sold at a weighted average price of US$96.34 per barrel in FY2014, as compared to US$105.05 per barrel in FY2013. The 8.3% decrease was due to the steep fall in global crude oil prices during the second half of the year, which dragged the weighted average price for December 2014 down to below US$60 per barrel. The Group’s weighted average transacted crude oil prices for the past five years is charted below.
The Group’s revenue depends very much on the prevailing crude oil prices, which are exposed to further weakening in 2015 amidst global oversupply and weaker demand concerns. A prolonged slump in crude oil prices may have an adverse effect on the Group’s business, financial condition and operating results. For the purpose of risk management and internal control, the Group does not use any financial derivatives to hedge its exposure to crude oil prices.
OPERATING REVIEWProductionThe Group’s total shareable oil production for FY2014 was 787,906 barrel, a 21.3% increase from 649,473 barrels for FY2013. The incremental production was the result of the good results of the Myanmar drilling campaign. The shareable oil production by concession before application of contractual terms with the respective host government for the past five years is charted below.
Crude Oil Prices(US$ per barrel)
140
120
100
80
40
20
-
Walio mix crude
Sumatran light crude
Arjuna crude
Jan2010
Jul2010
Jan 2011
Jul2011
Jan2012
Jan2013
Jan2014
Jul2012
Jul2013
Jul2014
* Group's effective interest in the shareable oil production of Linda Sele fields was 58.38% as at 31 December 2014 (2011-2013: 100%).
Shareable Oil Production(barrels of oil)
Yenangyaung
TMT
Chauk
Linda Sele
Total
250,978
57,294
117,078
76,606
2010
70,678
68,844
123,746
299,736
2011
76,353
135,305
92,250
2012
137,059
145,601
2013
787,906
311,340
150,997
269,195
2014
369,909
649,473
36,468
66,001
72,667
56,374*
294,146
The Road Ahead Annual Report 201418
OPERATING AND FINANCIAL REVIEW
The Chauk field in Myanmar did exceptionally well during the year under review, with shareable oil production increasing by 127.2% to 311,340 barrels from 282,660 barrels for FY2013. The adjacent Yenangyaung field maintained its steady production which yielded shareable oil of 150,997 barrels compared to 145,601 barrels last year.
In Indonesia, the performance of the TMT field was below expectations. Its shareable oil production of 269,195 barrels for FY2014 was 8.5% lower than the previous year (FY2013: 294,146 barrels). At Linda Sele, natural production declines were observed, primarily due to lack of new drillings. Moreover, the Group’s interest in the field was reduced to 58.38% with the disposal of 90% of the share capital of GLS, its shareable oil production decreased by 22.4% to 56,374 barrels from 72,667 barrels for FY2013.
In the year ahead, the drilling activities of the fields will logically be dependent on the direction of crude oil prices. Should the weak crude oil prices prevail throughout 2015, the Group intends to focus on its base production growth through low-cost enhancement and optimisation of existing producing wells. It will exercise due care in analysing costs and returns before proceeding with any major work plans and developmental or exploratory projects.
The acquisition of 53.76% equity interest in MITI encompassed an equivalent indirect interest in the mining business permit in respect of the Bukit Piatu granite quarry in Bintan, Indonesia. The granite business, which depends largely on the local construction industry, was slightly affected by the presidential election activities during the year. Sales of granite produced at the quarry were 1,314,882 tonnes for FY2014, 1.28% higher than FY2013. In the coming year, sales volume is expected to grow steadily with the government’s continual development of infrastructure in the Riau Islands and the corresponding growth in property market and private investments in the region.
Operating Activities• Myanmar – Chauk and Yenangyaung FieldsEncouraged by the drilling success achieved in 2013, the operator of the Myanmar fields increased the momentum of the drilling programme by drilling twenty-eight shallow-to-intermediate depth development wells in 2014 (2013: twenty-four wells). Deploying three drilling
rigs, the last well for the year 2014 was commenced by the third quarter and the first well of the 2015 work plan was drilled and completed during the last quarter of 2014. Of the twenty-eight wells drilled in 2014 (including the 2015 well), twenty-four were completed as oil producers and four were awaiting further reservoir stimulation or new perforations in other reservoirs. The combined gross oil production of the two fields was 1,192,523 barrels, 30.9% more than 910,875 barrels produced in 2013.
Following the success of the initial directional drilling under the Ayeyarwaddy River in 2013, the team drilled nine directional wells under the river – six from the east bank and three from the west. Of note, the latest directional well, was completed with the highest single well oil production rate onshore Myanmar and continues to produce oil at a high rate. The directional wells accounted for the significant gains realised for the year. The gross oil production of the Chauk field was an impressive 583,299 barrels, almost double that of the preceding year (2013: 297,676 barrels). At the Yenangyaung field, seven wells were drilled under the 2014 work plan and four were completed as oil producers. These new wells sustained the gross oil production of the field which produced 609,224 barrels in 2014 (2013: 613,199 barrels).
In 2015, the operator will continue to optimise production via surface and borehole enhancements and scheduled maintenance with the objective of maintaining or increasing current production levels from existing wells. It will carry on technical reservoir studies aimed at identifying additional opportunities with respect to increasing production in existing wells and future well opportunities. Studies with respect to advanced stimulation techniques including formation hydraulic fracturing will also be ongoing.
• Indonesia – TMT FieldDuring the year, the TMT field was faced with unusually bad weather conditions which hindered field production operations, servicing and maintenance. Drilling operations were also significantly affected as the first well of the 2014 drilling plan was not commenced until August. The first well drilled commenced in February but was a carry-over from the 2013 drilling schedule which was delayed for many of the same reasons. Of the four wells drilled in 2014, one was completed as oil producer and the remaining
Interra Resources Limited The Road Ahead 19
OPERATING AND FINANCIAL REVIEW
three are undergoing testing or awaiting further reservoir stimulation or initial completion testing. Although various production optimisation efforts were conducted, the natural field production decline was not arrested. As a result, the gross oil production of the TMT field decreased by 8.5% to 272,538 barrels from 297,827 barrels in 2013.
Going forward, further work will be performed on both existing and newly drilled wells to increase production. This will include additional perforations into prospective formations that have not been tested, and more aggressive formation stimulation techniques applied to current productive formations. Besides regular surface and borehole enhancements combined with scheduled maintenance, the installation of new lifting and other production equipment with the aim of enhancing production from current producing wells will continue. Production and reservoir studies and detailed 3D seismic data interpretation incorporating data from these studies will also be ongoing.
• Indonesia – Linda Sele FieldsThere were no new drillings at the Linda Sele fields in 2014. The operator continued to perform production optimisation works through surface and borehole enhancements, scheduled maintenance, and installation of new lifting and other production equipment. The gross oil production of the fields declined by 6.5% to 67,938 barrels from 72,667 barrels in 2013.
Detailed 3D seismic data interpretation and contracted reservoir studies were completed in the first and second quarters of 2014. The study was incorporated into the 3D seismic data interpretation and has yielded a very
optimistic understanding of the reef structure of the Linda field with respect to reservoir continuity. Importantly the new interpretation delineates a much larger continuous area than before the 3D mapping and can potentially support numerous development wells. Likewise at the Sele field, the reef characteristics in the primary target reservoir are more completely imaged based on the 3D seismic data and, in addition, a shallower objective covering a large area has been delineated.
In 2015, prospective drilling locations and shallower hydrocarbon bearing reservoir delineated from the detailed 3D seismic interpretation may be tested via new drilling and casing penetrations of existing wells respectively.
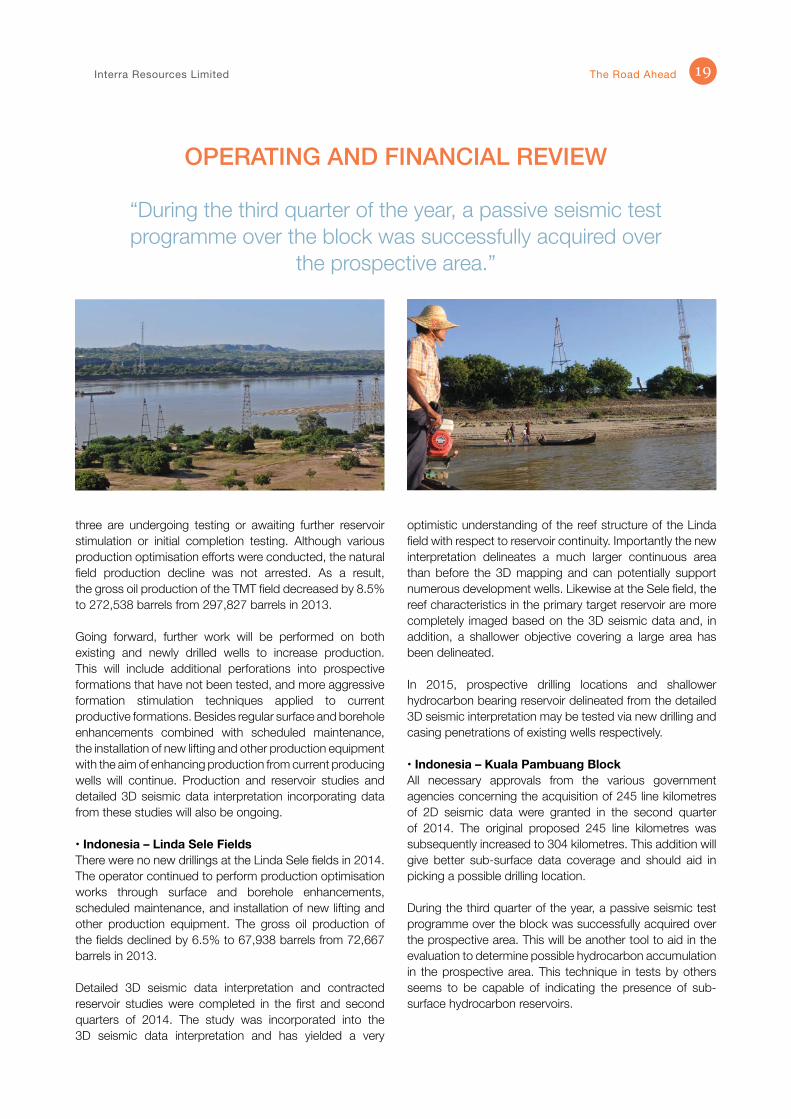
• Indonesia – Kuala Pambuang BlockAll necessary approvals from the various government agencies concerning the acquisition of 245 line kilometres of 2D seismic data were granted in the second quarter of 2014. The original proposed 245 line kilometres was subsequently increased to 304 kilometres. This addition will give better sub-surface data coverage and should aid in picking a possible drilling location.
During the third quarter of the year, a passive seismic test programme over the block was successfully acquired over the prospective area. This will be another tool to aid in the evaluation to determine possible hydrocarbon accumulation in the prospective area. This technique in tests by others seems to be capable of indicating the presence of sub-surface hydrocarbon reservoirs.
“During the third quarter of the year, a passive seismic test programme over the block was successfully acquired over
the prospective area.”
The Road Ahead Annual Report 201420
The acquisition formally commenced in the fourth quarter of the year. By year end, approximately 75% of the acquisition was completed, preliminary data processing was accomplished and several areas of interest were identified. The remaining acquisition programme and subsequent final processing will be completed in the first quarter of 2015. Optimistically, the combination of the 2D seismic results, passive seismic test and geologic studies will yield a quality drillable location for a possible exploration well to test the hydrocarbon potential of this portion of the Pambuang Basin.
• Indonesia – Bukit Piatu QuarryThe gross granite production at the quarry was 1,238,984 tonnes for FY2014, 6.57% lower than the previous year. Production activities during the year were interrupted by some major repairs and maintenance of the production machines. Going forward, the operator will take some efficiency initiatives such as reschedule major repairs on fleets and other supporting production equipment, enhance control on production, sales and stock management, and improve supply chain management.
Environmental and Social ResponsibilityThe Group strives to operate responsibly towards local communities and the environment within and surrounding its operational areas. These values have been adopted within the Group’s business practices in which it aims to uphold high level of environmental, safety and social standards. It also has in place risk management policies and processes which help address the environmental and social aspects of its operations. The ensuing risk management reports provide management with useful data for identifying emerging issues and developing appropriate responses that help protect corporate reputation and improve shareholder value.
Environmental sustainability forms an integral part of the Group’s operating procedures and supports its decision-making processes. The Group aims to make a positive contribution in maintaining and preserving the environment through various practices that serve to promote sustainability and minimise the impact of its operating activities on the environment. The respective operations are required to comply with the applicable environmental and restoration laws and regulations administered by the relevant government agencies, which include conducting environmental impact assessments and
making regular contributions to environment restoration funds. Throughout the year, the Group continued to review and implement good mining practices with regard to accountable mine development, replanting of mine areas, responsible waste management, contamination control and environmental monitoring.
Health and safety is a natural priority of the Group’s activities and due care and attention is being paid to the physical health and well being of its employees and contractors whilst in the workplace. All sites are equipped with safety management systems which adhere to regulatory requirements of the relevant government bodies. In addition to implementing zero accident policies across all site operations, the Group also places strong emphasis on human dignity and respect for cultural practices and religious beliefs of its employees. It is constantly working towards creating an inclusive workplace where everyone is treated with dignity and respect, where the talents and skills of different groups are valued, and where productivity and morale of the workforce are optimised.
The Group believes that having close and cordial relationship with the local authorities and government is important and that relationships with local communities are to be conducted sensitively and with mutual respect. To ensure that harmonious relationships are being maintained with the local communities and authorities, the Group actively engages in social community development through partnerships with local communities and stakeholders in mutually beneficial activities and movements, such as enhancing labour practices and relations, facilitating relocation and fair compensation of land, participating in community events, sponsorship of community programmes, donations towards education, healthcare and infrastructure projects, etc. During the year, the Group’s social services included cash donations made towards village fire survivors, medical equipment sponsorship for government hospital upgrading programme, building repair and renovation of public schools, construction of new road access connecting villages and main roads, and funding for sanitation facilities such as water storage tanks, pipelines for water supply, public health centres and toilets.
OPERATING AND FINANCIAL REVIEW
Interra Resources Limited The Road Ahead 21
FACTORS AFFECTING PERFORMANCE OF THE BUSINESSThe key factors affecting the Group’s business including financial and operating conditions are set out below.
• Sales of Crude OilThe marketability of crude oil produced by the Group depends on the proximity of its reserves to pipelines and processing facilities and is related to operational problems with such pipelines and facilities which could cause delays in the delivery of crude oil and thus affect its billings. The Group currently sells all the crude oil that it produces to the respective host governments and is subject to extensive government regulations relating to price, taxes, royalties, land tenure, allowable production and many other aspects of the upstream petroleum business.
• Sales of GraniteThe Group’s sales of granite currently depend solely on local market demand as the Indonesian government has imposed a ban on the export of the granite since 2012. Therefore, the Group faces stiff competition in granite sales and prices with the shrink in market size. At the same time, the exposure to foreign exchange risk is reduced as the sales of granite are predominately transacted in Indonesian Rupiah.
• Crude Oil PricesPetroleum exploration and production is fundamentally a commodity business and hence, revenue is exposed to fluctuations in the prevailing crude oil prices, which are dependent on the geopolitical developments, global economic conditions and demand for oil and gas. The Group currently does not have any hedging or derivative arrangements which would have the effect of giving the business a certain and fixed sale price for the crude oil it produces. Any material decline in crude oil prices may affect profitability or even may render extraction from some wells commercially unviable.
• Operating CostsThe Group operates in a very challenging business environment and faces competition on access to oil services and rigs, technology and equipment, expertise and human resources. Although high crude oil prices may give rise to higher revenue, it may also result in higher operating costs due to greater demand for materials, equipment, rigs, oil services, expertise and human resources. This may in turn affect the bottom line of the business. Limited availability of materials and equipment may also delay exploration and production activities and increase cost of operations.
• Credit RiskThe Group currently sells all the crude oil that it produces to the respective host governments in Indonesia and Myanmar. Although the Group currently does not have any issues with invoice payments, there can be no assurance that risks of default would not occur in the future. Any significant default or delay in the payment could adversely affect its cash flow and financial position.
• Capital FundingPetroleum exploration and production is a long-term and capital intensive business. Substantial capital expenditure is required to exploit and develop reserves for petroleum production. Cash flow from operations may not be sufficient to fund drilling activities and business operations from time to time. Failure to obtain additional funding on a timely may cause the Group to forfeit its interests in certain concessions or to discontinue some of its exploration, development and production activities, thus resulting in material adverse effects on the Group’s financial condition, results of operations or prospects. On the other hand, raising capital through certain debt or equity financing may have dilutive effect on the Group’s earnings.
OPERATING AND FINANCIAL REVIEW
The Road Ahead Annual Report 201422
• Concession Agreements and PermitsThe petroleum contractual agreement with the respective host government grants the participating party (or parties) the rights and obligations to conduct exploitation and production of hydrocarbons at its own expense and risk on a compensated basis for an established time period. The final shareable production, to be translated into revenue and split with the host government, is derived after deducting the various capital and operational expenditure, royalties and taxes, etc. Due to the intrinsic complexity of the formulae used in the calculation of shareable production, revenue is not proportionately dependent on gross production and crude oil prices. In addition, there is no guarantee that contract renewal or extension will be granted upon expiration, failing which may result in substantial losses and significant reduction in investment value. Similarly, the granite mining business permit granted by the host government is subject to its prevailing laws and regulations, and there is no guarantee that further extension or renewal will be granted on expiry.
• Regulatory RisksThe Group operates in countries where political, economic and social transitions are taking place or may occur from time to time. Developments in politics, laws and regulations can affect its operational performance and financial position. Potential developments include forced divestment of assets, limits on production or cost recovery, international sanctions, import and export restrictions, price controls, tax increases and other retroactive tax claims, expropriation of property, cancellation of contract rights, international conflicts including war, civil unrest, acts of sabotage or terrorism and local security concerns that threaten the safe operation of facilities, and environmental regulations. In countries which lack well-developed legal systems or have not yet adopted clear regulatory frameworks for petroleum industry, the Group’s operations are exposed to increased risk of adverse or unpredictable actions by government officials and may also face difficulty in enforcing contracts.
• Reserve ReplacementFuture petroleum production will depend on the Group’s access to new reserves through exploration and development of existing concessions, negotiations with governments and other owners of reserves, and acquisitions of new concessions. Failures in exploration or development drilling, or in identifying and finalising transactions to access potential reserves could slow its petroleum production and replacement of reserves. Given the limited availability of petroleum acreages, the Group faces stiff competition and price pressure in the search for the acquisition of petroleum concessions.
• Reserve DiminishmentGranite deposits diminish along with open-pit mining for commercial production and ultimately, mining operation will cease when the reserve is exhausted or production becomes economically unviable.
• Exploration RiskExploration activity involves a significant inherent risk of not discovering any accumulation of hydrocarbons, or that the discovery of hydrocarbons is not commercially recoverable or viable. In the event that an exploration programme proves to be unsuccessful, it may lead to hefty losses, considerable reduction in cash reserves, significant diminution in asset values and possible relinquishment of concessions.
OPERATING AND FINANCIAL REVIEW
Interra Resources Limited The Road Ahead 23
• Drilling RiskThe Group endeavours to maintain and grow its petroleum production through drilling programmes, which may be developmental or exploratory in nature, based upon geological and geophysical studies of available information or new data. However, it is not certain that such drillings will ultimately yield commercially recoverable hydrocarbons or profitable production. Besides, there is always a risk of drillings being unsuccessful and thus affecting the operating results and financial position of the Group. Even if these drillings are successful, it may not be able to lift the overall production due to the simultaneous decline of mature wells.
• Production RiskThere are inherent risks involved in the production of hydrocarbons that, in addition to impacting the actual volumes produced, may ultimately affect the reserves (recovered). Continuous disregard for industry standard production practices can lead to reduction in production volumes, and in extreme cases, actual total loss of production.
• Reserve Calculation RiskThere are indefinite inherent uncertainties in respect of the estimation and evaluation of reserves. The estimation of petroleum reserves is not an exact science and depends on numerous factors such as the reservoir type, source of reservoir energy, quantity and quality of the geological, engineering, and geophysical data, assumptions adopted when making the estimate, available technology, and the experience and knowledge of the evaluator. Inaccurate reserve estimates will affect the Group’s financials particularly where the amount of petroleum that the Group produces and the net cash flow that it receives from that production differ materially from the amounts reflected in its reserve estimates. Moreover, reserves certification conducted by different estimators may vary considerably depending on the methodology and approaches employed in the assessment. Any such instance may adversely affect the future net cash flow and fair asset value of the Group.
• Environmental and Operational HazardsGiven the nature of mining operations, the Group is exposed to a wide spectrum of risks related to health, safety, environment and security. Environmental and operational hazards including blowouts, leaks, spills, property damage and personal injury could cause disruptions and affect the Group’s operational performance and financial results. The Group’s insurance may limit or may not cover all risks of liabilities which the Group is exposed to, or the Group may elect not to obtain insurance to deal with specific risks due to the high premiums associated with such insurance or other reasons. Moreover, the Group’s operations may be affected by fire, typhoons, floods and other natural calamities, which are generally excluded from insurance policies.
For more information on the factors impacting the financial and operating performance of the Group, please see the following sections of the Notes to the Financial Statements of this Annual Report:- Note 3, Critical Accounting Estimates, Assumptions and Judgements- Note 33, Contingent Liabilities- Note 34, Financial Risk Management
The Group may be affected by a number of risks that may relate to the industries and countries in which the Group operates as well as those that may generally arise from, inter alia, economic, business, market and political factors, including the risks set out herein. The risks described above are not intended to be exhaustive. There may be additional risks not presently known to the Group, or that the Group may currently deem immaterial, which could affect its operations, possibly materially.
OPERATING AND FINANCIAL REVIEW
The Road Ahead Annual Report 201424
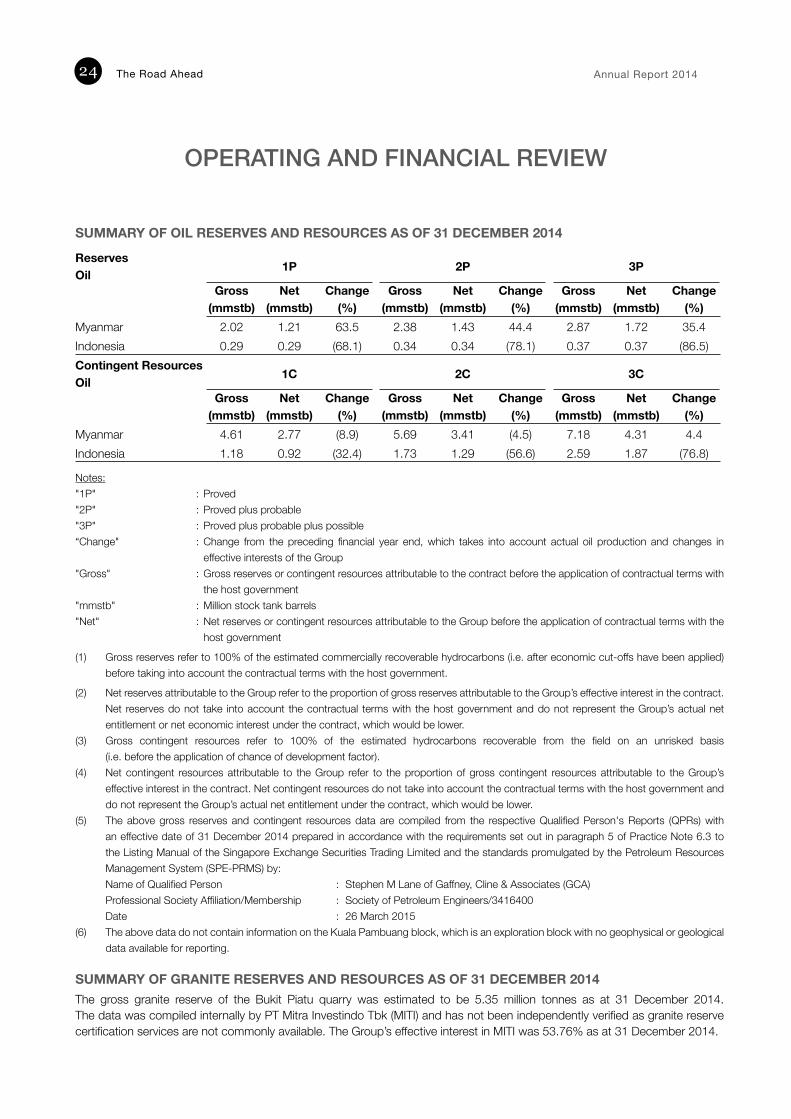
SUMMARY OF OIL RESERVES AND RESOURCES AS OF 31 DECEMBER 2014
ReservesOil
1P 2P 3P
Gross(mmstb)
Net(mmstb)
Change(%)
Gross(mmstb)
Net(mmstb)
Change(%)
Gross(mmstb)
Net(mmstb)
Change(%)
Myanmar 2.02 1.21 63.5 2.38 1.43 44.4 2.87 1.72 35.4Indonesia 0.29 0.29 (68.1) 0.34 0.34 (78.1) 0.37 0.37 (86.5)Contingent Resources Oil
1C 2C 3C
Gross(mmstb)
Net(mmstb)
Change(%)
Gross(mmstb)
Net(mmstb)
Change(%)
Gross(mmstb)
Net(mmstb)
Change(%)
Myanmar 4.61 2.77 (8.9) 5.69 3.41 (4.5) 7.18 4.31 4.4Indonesia 1.18 0.92 (32.4) 1.73 1.29 (56.6) 2.59 1.87 (76.8)
Notes:"1P" : Proved"2P" : Proved plus probable"3P" : Proved plus probable plus possible“Change" : Change from the preceding financial year end, which takes into account actual oil production and changes in
effective interests of the Group"Gross" : Gross reserves or contingent resources attributable to the contract before the application of contractual terms with
the host government"mmstb" : Million stock tank barrels"Net" : Net reserves or contingent resources attributable to the Group before the application of contractual terms with the
host government
(1) Gross reserves refer to 100% of the estimated commercially recoverable hydrocarbons (i.e. after economic cut-offs have been applied) before taking into account the contractual terms with the host government.
(2) Net reserves attributable to the Group refer to the proportion of gross reserves attributable to the Group’s effective interest in the contract. Net reserves do not take into account the contractual terms with the host government and do not represent the Group’s actual net entitlement or net economic interest under the contract, which would be lower.
(3) Gross contingent resources refer to 100% of the estimated hydrocarbons recoverable from the field on an unrisked basis (i.e. before the application of chance of development factor).
(4) Net contingent resources attributable to the Group refer to the proportion of gross contingent resources attributable to the Group’s effective interest in the contract. Net contingent resources do not take into account the contractual terms with the host government and do not represent the Group’s actual net entitlement under the contract, which would be lower.
(5) The above gross reserves and contingent resources data are compiled from the respective Qualified Person's Reports (QPRs) with an effective date of 31 December 2014 prepared in accordance with the requirements set out in paragraph 5 of Practice Note 6.3 to the Listing Manual of the Singapore Exchange Securities Trading Limited and the standards promulgated by the Petroleum Resources Management System (SPE-PRMS) by:Name of Qualified Person : Stephen M Lane of Gaffney, Cline & Associates (GCA)Professional Society Affiliation/Membership : Society of Petroleum Engineers/3416400Date : 26 March 2015
(6) The above data do not contain information on the Kuala Pambuang block, which is an exploration block with no geophysical or geological data available for reporting.
SUMMARY OF GRANITE RESERVES AND RESOURCES AS OF 31 DECEMBER 2014The gross granite reserve of the Bukit Piatu quarry was estimated to be 5.35 million tonnes as at 31 December 2014. The data was compiled internally by PT Mitra Investindo Tbk (MITI) and has not been independently verified as granite reserve certification services are not commonly available. The Group’s effective interest in MITI was 53.76% as at 31 December 2014.
OPERATING AND FINANCIAL REVIEW
Interra Resources Limited The Road Ahead 25
CORPORATE GOVERNANCE REPORT
The Company is required under the Singapore Exchange Securities Trading Limited (the “SGX-ST”) Listing Manual (the “SGX-ST Listing Manual”) to describe its corporate governance practices with specific reference to the principles of the Code of Corporate Governance 2012 issued by the Committee on Corporate Governance (the “Code”).
The following report discloses the Company’s corporate governance policies and practices which has been adopted in line with the spirit of the Code. The Company adheres largely to the principles and guidelines as set out in the Code, and endeavours to specify and explain any deviation from the Code.
BOARD MATTERSPrinciple 1 – Board’s Conduct of its AffairsEvery company should be headed by an effective Board to lead and control the company. The Board is collectively responsible for the long-term success of the company. The Board works with Management to achieve this objective and Management remains accountable to the Board.
The role of the Board includes:
(a) providing entrepreneurial leadership and setting corporate strategy and direction, and ensuring that the necessary financial resources and Management of high integrity are in place for the Company to meet its objectives;
(b) reviewing the risk management framework and controls, including safeguarding of shareholders’ interests and the Company’s assets;
(c) reviewing Management’s performance and providing oversight in the proper conduct of the Company’s business; (d) identifying the key stakeholder groups and recognising that their perceptions affect the Company’s reputation;(e) setting the Company’s values and standards (including ethical standards), and ensuring that obligations to shareholders
and other stakeholders are understood and met; and(f) considering sustainability issues such as environmental and social factors, as part of its strategic formulation.
To assist in the efficient discharge of its fiduciary duties and responsibilities, the Board had previously, without abdicating its responsibility, established three (3) Board Committees namely, the Audit Committee (“AC”), the Nominating Committee (“NC”) and the Remuneration Committee (“RC”). Each Board Committee has its own terms of reference, which has been recently amended to be in line with the revised Code, to address their respective areas of focus. Matters which are delegated to the Board Committees are reported to and approved collectively by the Board. The compositions of the Board and Board Committees as at the date of this Annual Report are set out under the Further Information on Directors section of this report.
The Company has ensured that the roles and responsibilities of the Board and Management are clearly defined in order to facilitate better understanding of their respective accountabilities and contributions. Management has been charged to run the ordinary business of the Company and its operations, while major matters and material transactions are brought to the Board’s attention for its decision. The Company has adopted internal guidelines which specifically reserve the following key matters for the Board’s approval: significant acquisitions and disposals or undertakings, funding proposals, and the releases of financial results, exploratory drilling updates and other significant announcements. All Directors objectively take decisions in the interests of the Company and if necessary, abstain from voting to avoid any conflict of interests.
There was no resignation or new appointment of Director during the year. If a new Director is appointed, the Company would provide a formal letter to him, setting out the Director’s duties and obligations. Further, the Company would provide the new Director with a customised induction and orientation programme to enable him to become familiar with the Company’s business and governance practices, including his duties as a Director and how to discharge those duties. If a new Director has no prior experience as a director of a listed company, the Company would endeavour to arrange for training appropriate to the level of his previous experience in areas such as accounting, legal and industry-specific knowledge. All such training undertaken by Directors are funded by the Company.

The Road Ahead Annual Report 201426
To enable Directors to keep up with regulatory and industry changes, the Company encourages Directors to receive regular training, keeps Directors informed of and makes arrangement for Directors to attend (as applicable) suitable training programmes organised by the Singapore Institute of Directors from time to time, particularly on relevant new accounting standards, laws, regulations and changing policies and changing commercial risks. Directors are also entitled to take up training that they deem suitable at the Company’s expense.
During the year, the Board met formally on six (6) occasions to review and approve various matters relating to business strategies, material transactions, corporate governance matters and performance of the Group. Whenever possible, Board meetings were scheduled to coincide with quarterly financial results reporting in order to facilitate the review of financial results announcements. Where the attendance of certain Directors was not physically possible, meetings were conducted with these Directors communicating through teleconferencing. The Articles of Association of the Company provides that the Directors may meet by audio or audio-visual communication by which all persons participating in the meeting are able to hear and be heard by all other participants. In order to gather views and address major concerns without delay, ad-hoc Board discussions via electronic means were organised to deliberate material acquisitions or disposals of assets, and major undertakings whenever the need arose. To further facilitate efficient management of the Company’s affairs, resolutions of the Board were passed by way of circulating minutes pursuant to the Articles of Association of the Company.
The attendance of every member at Board and Board Committee meetings, expressed as a ratio of the total number of meetings held during each member’s period of appointment in 2014, is set out below.
Board Meeting AC Meeting NC Meeting RC MeetingName Attendance Attendance Attendance Attendance
Edwin Soeryadjaya 1/6 - - - Chairman (Non-Executive) Sandiaga Salahuddin Uno 6/6 3/3 1/1 1/1 Deputy Chairman (Non-Executive) Marcel Han Liong Tjia 6/6 - - - ExecutiveDirector&ChiefExecutiveOfficer Subianto Arpan Sumodikoro 1/6 - - - Non-Executive Director Ng Soon Kai 5/6 - 1/1 1/1 Non-Executive Director Low Siew Sie Bob 6/6 3/3 1/1 1/1 Lead Independent Director (Non-Executive) Allan Charles Buckler 4/6 2/3 1/1 1/1 Independent Director (Non-Executive)Lim Hock San 6/6 3/3 1/1 1/1 Independent Director (Non-Executive) Pepen Handianto Danuatmadja 6/6 - - - Alternate Director to Subianto Arpan Sumodikoro
CORPORATE GOVERNANCE REPORT
Interra Resources Limited The Road Ahead 27
Principle 2 – Board Composition and BalanceThere should be a strong and independent element on the Board, which is able to exercise objective judgement on corporate affairs independently, in particular, from Management and 10% shareholders. No individual or small group of individuals should be allowed to dominate the Board’s decision making.
Currently, the Board comprises eight (8) Directors (three (3) of whom are independent) and one (1) alternate Director. The three (3) Independent Directors, namely, Mr Low Siew Sie Bob, Mr Allan Charles Bucker and Mr Lim Hock San, currently form over one-third (⅓) of the Board, with Mr Low being the Lead Independent Director. The Board acknowledges that based on the current composition, half (½) of the Board should be comprised of independent directors as indicated in the Code, and will take the requirement into consideration during the review of its succession plans in the next few years.
Collectively, the Independent Directors have strong accounting and industry background and their independence is individually reviewed from time to time by the NC based on the guidelines set forth in the Code. The Board concurs with the NC’s recommendation that each of the three (3) independent Directors has no relationship which could interfere, or could be reasonably perceived to interfere, with the exercise of his independent business judgement with a view to the best interests of the Company. While Mr Buckler has served more than nine (9) years on the Board, his independence is subject to rigorous annual review by the NC. The Board has determined that Mr Buckler be considered independent notwithstanding that he has served on the Board beyond nine (9) years as he has continued to demonstrate strong independence in character and judgement in the discharge of his responsibilities as a Director of the Company and he fulfils all other criteria of independence, as outlined in the Code. The Board is of the view that its current size is appropriate, taking into account the size, scope and nature of operations of the Company, the requirements of the business and the need to avoid undue disruptions from changes to the composition of the Board and Board Committees. The Board and its Board Committees comprise Directors who possess the requisite experience and knowledge across various fields. As a group, the Board, which comprises both local and foreign Directors, is an appropriate balance and diversity of skills, experience and knowledge that encompass core competencies such as accounting/finance, business/management, industry knowledge, law and strategic planning.
In addition to formal Board and Board Committee meetings, the Board and Management maintain active and effective communication through emails whereby Management provides the Board with regular corporate, financial and operational updates and the Board members engage in deliberation of important issues. This manner of electronic communication facilitates swift gathering of views or inputs and prompt address of major concerns. It also enables the non-executive Directors to communicate regularly without the presence of Management so as to facilitate a more effective check on Management. The matters discussed include developing proposals on strategy, reviewing the performance of Management in meeting agreed goals and objectives, and monitoring the reporting of performance.
CORPORATE GOVERNANCE REPORT
The Road Ahead Annual Report 201428
Principle 3 – Chairman and Chief Executive Officer (“CEO”)There should be a clear division of responsibilities between the leadership of the Board and the executives responsible for managing the company’s business. No one individual should represent a considerable concentration of power.
The roles of the Chairman, Deputy Chairman and the CEO are kept separate to ensure an appropriate balance of power, increased accountability and greater capacity of the Board for independent decision-making.
The CEO, who is responsible for the day-to-day operations of the Group, has his role and responsibilities clearly established by the Board and set out in writing under his employment agreement. The Chairman and Deputy Chairman, who are both non-executive Directors, are responsible for the leadership and objective functioning of the Board, including its effectiveness on all aspects of its role. Their complementary roles provide a pillar of balance for the Board while promoting a culture of openness and debate at the Board and encouraging constructive relations within the Board and between the Board and Management. With the support from the Lead Independent Director, the Chairman and Deputy Chairman also take a leading role in facilitating the effective contributions of non-executive Directors and ensure effective communication with shareholders. In addition, Management actively supports them in the organisation of essential meeting agenda and dissemination of inclusive meeting materials.
Mr Low Siew Sie Bob has been appointed the Lead Independent Director. The Lead Independent Director is available to shareholders where they have concerns for which contact through the normal channels of the Chairman or Deputy Chairman, the CEO or the Chief Financial Officer (“CFO”) has failed to resolve or is inappropriate. At times, the independent Directors communicate, formally or informally, without the presence of the other executive and non-independent Directors, and any matters of significance arising from such discussions are conveyed to the Chairman or Deputy Chairman.
Principle 4 – Board MembershipThere should be a formal and transparent process for the appointment and re-appointment of Directors to the Board.
The NC has been delegated by the Board to be in charge of Board membership matters. It comprises five (5) non-executive Directors, the majority of whom, including the Chairman, are Independent Directors. The Lead Independent Director is also a member of the NC. As at the date of this Annual Report, the members of the NC are:
(a) Mr Allan Charles Buckler (Independent Director) – Chairman;(b) Mr Lim Hock San (Independent Director);(c) Mr Low Siew Sie Bob (Lead Independent Director);(d) Mr Ng Soon Kai (Non-Executive Director); and(e) Mr Sandiaga Salahuddin Uno (Deputy Chairman).
The NC has written terms of reference that clearly sets out its duties and functions as follows:
(a) To review the size and composition of the Board and Board Committees, taking into consideration the independent element, the need for progressive refreshing, the necessity of alternate directorship, core competencies, and balance and diversity of skills, experience, gender and knowledge, and to recommend any changes it considers necessary to the Board.
(b) To develop, implement and maintain a formal and transparent process for the search, nomination, selection, appointment and re-appointment of Directors (including alternate Directors) to the Board.
(c) To review all nominations for the appointment and re-appointment of members of the Board (including alternate Directors), taking into consideration the composition and progressive renewal of the Board and the attributes of each nominee, before making recommendations to the Board.
CORPORATE GOVERNANCE REPORT
Interra Resources Limited The Road Ahead 29
(d) To ensure that all Directors submit themselves for re-nomination and re-election at regular intervals and at least once every three (3) years or in accordance with the requirements of the Articles of Association of the Company, the Code and the Companies Act, Cap. 50 (the “Act”) as amended or modified from time to time.
(e) To determine annually, and as and when circumstances require, whether a Director is independent in character and judgement and whether there are relationships or circumstances which are likely to affect, or could appear to affect the Director’s judgement, bearing in mind the years of services, relationships or circumstances set forth in the Code and any other salient factors.
(f) To develop, implement and maintain a formal process for evaluation of the performance of the Board, Board Committees and Board members.
(g) To decide on how the Board’s performance may be evaluated and propose objective performance criteria for the Board’s approval.
(h) To decide on the maximum number of listed company board representations a Director may hold for the Board’s approval.(i) To assess and report to the Board annually the effectiveness of the Board as a whole and the Board Committees and the
contributions of each individual Director to the effectiveness of the Board.(j) To review the results of the performance evaluation and recommend to the Board on whether to appoint new Directors or
to seek resignation of Directors.(k) To review the succession plans for Directors, in particular, the Chairman and the CEO of the Company.(l) To review and make recommendations to the Board the training and professional development programme for
the Board.(m) To review the various disclosure requirements on the appointment and resignation of Directors, particularly those required
by regulatory bodies such as the SGX-ST.(n) To retain such professional consultancy firm as the NC may deem necessary to enable it to discharge its duties hereunder
satisfactorily.(o) To undertake such other duties and projects as may be requested by the Board, and to report to the Board its findings
from time to time on matters arising and requiring the attention of the NC.(p) To conduct periodic review of its own performance and, at least annually, review its constitution and terms of reference to
ensure it is operating at optimal effectiveness and recommend any changes it considers necessary to the Board.
During the year, the NC reviewed the performance of each Director, each Board Committee and the Board as a whole and made the requisite recommendations to the Board on the re-nomination and re-election of Directors in accordance with the Articles of Association of the Company and as contemplated by the Code. The NC also reviewed and determined, based on the guidelines set forth in the Code, that there was no change in the independent status of all three (3) Independent Directors. When considering the nomination of Directors for re-nomination and re-election, the NC took into account their competencies, commitment, contribution and performance (e.g. attendance, preparedness, participation and candour).
The NC has adopted internal guidelines addressing competing time commitments that are faced when Directors serve on multiple boards. To ensure that each Director is assessed accurately in relation to his ability to give sufficient time and attention to the affairs of the Company, including through the appointment of a deputy or alternate Director, the NC has recommended and the Board has approved that each individual Director be evaluated on an individual basis instead of identifying a maximum number of listed company board representations that a Director may hold which may not necessarily be representative of whether a Director is able to and has adequately carried out his duties as a Director of the Company. The NC is of the view that the each Director is able to adequately carry out their duties as Directors of the Company besides their principal commitments and other board representations. It is also satisfied with the commitment demonstrated by Mr Pepen Handianto Danuatmadja, the Alternate Director to Mr Subianto Arpan Sumodikoro. The Board will nevertheless keep in mind the need to review from time to time the number of listed company representations of each Director to ensure that the Directors continue to meet the demands of the Group and are able to discharge their duties adequately.
CORPORATE GOVERNANCE REPORT
The Road Ahead Annual Report 201430
There was no new appointment of Director during the year. If there is a need for a new Director, the NC has in place an internal process to facilitate the search, selection and nomination of suitable Director. The members would first evaluate the range of skills, experience and expertise of the Board and identify the necessary competencies required from the incoming Director that would best increase Board effectiveness, and then search externally for suitable candidates who are highly regarded in the relevant industry. When considering the new Board member, the NC would review the curriculum vitae of each potential candidate and consider his/her experience and expertise and likely contribution to the Board. Subsequently, interviews would be conducted before the NC makes its recommendation to the Board. The Board shall make the final determination for the appointment.
Each meeting of the NC was properly minuted and upon confirmation of such minutes by the NC Chairman, a copy of the confirmed minutes was duly circulated to all members and reported to the Board.
The profiles and key information of the current Directors are set out in the Board of Directors section and Further Information on Directors section of this Annual Report.
Principle 5 – Board PerformanceThere should be a formal annual assessment of the effectiveness of the Board as a whole and its Board committees and the contribution by each Director to the effectiveness of the Board.
The NC has established an appraisal process to assess the performance and effectiveness of the Board as a whole and its Board Committees as well as to assess the contribution of the Chairman, Deputy Chairman and each individual Director. The range of performance criteria used for the evaluation is proposed by the NC and approved by the Board, and does not change from year to year unless circumstances deem it necessary for any of the criteria to be changed.
The assessment parameters for the effectiveness of the Board as a whole include its working relationship with Management, independent element, size and composition, mix of competency, conduct and frequency of meetings, decision-making processes and accountability, effectiveness of strategies and directions of the Company in enhancing long-term shareholders’ value, and effectiveness of risk management and internal control systems in safeguarding the Company’s assets and shareholders’ investment. The assessment parameters for the performance of individual Directors, which aim to assess whether each Director continues to contribute effectively and demonstrate commitment to the role, include attendance at meetings, adequacy of preparation for meetings, participation in discussions, responses to circulating resolutions and matters that require prompt attention and decision, core competency contributions, maintenance of independence, and disclosure of related party transactions.
Towards the end of the financial year, all Directors are requested to complete a Board performance evaluation questionnaire to seek their view on the various aspects of the Board’s performance so as to assess the overall effectiveness of the Board, as well as complete an appraisal form to evaluate each individual Director’s contributions to the Board and the Board Committees. Directors who are members of the respective Board Committees are also requested to complete appraisal forms for the respective Board Committees to assess the overall effectiveness of each Board Committee. The responses are collated and compiled on a non-attribution basis to encourage open and frank discussions and feedback, and the collated results are reviewed by the NC and submitted to the Board together with its recommendations for the Board’s deliberation and decision.
CORPORATE GOVERNANCE REPORT
Interra Resources Limited The Road Ahead 31
Principle 6 – Access to InformationIn order to fulfil their responsibilities, Directors should be provided with complete, adequate and timely information prior to Board meetings and on an on-going basis so as to enable them to make informed decisions to discharge their duties and responsibilities.
Management regularly keeps the Board updated on the operational activities, project progress and development, and business prospects of the Group through monthly management accounts, quarterly Board papers and ad hoc email correspondences. Comprehensive quarterly financial and activity reports are submitted to the Board for review and approval before releasing to the public. These updates and reports are supported with background or explanatory information, disclosure documents, work plans, expenditure proposals, budgets and forecasts. In respect of budgets, any material variance between the projections and actual results are disclosed and explained. In addition, the Directors have separate and independent access to Management as and when they require further enquiries or additional information. Management endeavours to meet their requirements in a timely manner so as to enable them to make informed decisions.
The Directors have direct and independent access to the Company Secretary, whose appointment and removal is a matter for the Board as a whole. The existing Joint Company Secretary, Ms Wong Cui Chen Jacinda, was appointed upon the resignation of Ms Kwa Xian-Zhen, Christie on 3 November 2014. The responsibilities of the Company Secretary include:
(a) attending all Board and Board Committee meetings and preparing minutes of these meetings;(b) ensuring compliance with applicable laws and regulations; (c) ensuring compliance with internal procedures and guidelines of the Company; (d) maintaining and updating all statutory books and records; (e) ensuring that good information flows within the Board and its Board Committees and between Management and non-
executive Directors;(f) advising the Board on all governance matters; and (g) facilitating orientation and assisting with professional development as required.
In the furtherance of their duties, the Directors may seek independent professional advice, if necessary, at the Company’s expense after reaching a general consensus.
CORPORATE GOVERNANCE REPORT
The Road Ahead Annual Report 201432
REMUNERATION MATTERSPrinciple 7 – Procedures for Developing Remuneration PoliciesThere should be a formal and transparent procedure for developing policy on executive remuneration and for fixing the remuneration packages of individual Directors. No Director should be involved in deciding his own remuneration.
The RC has been delegated by the Board to be in charge of Board remuneration matters. It comprises five (5) non-executive Directors, the majority of whom, including the Chairman, are Independent Directors. As at the date of this Annual Report, the members of the RC are:
(a) Mr Allan Charles Buckler (Independent Director) – Chairman;(b) Mr Lim Hock San (Independent Director);(c) Mr Low Siew Sie Bob (Lead Independent Director);(d) Mr Ng Soon Kai (Non-Executive Director); and(e) Mr Sandiaga Salahuddin Uno (Deputy Chairman).
The RC has written terms of reference that clearly sets out its duties and functions as follows:
(a) To develop, implement and maintain a formal and transparent policy for the determination of Directors’ and key executives’ remuneration packages, including but not limited to Directors’ fees, salaries, allowances, bonuses, options, share-based incentives and awards, and benefits-in-kind.
(b) To review and recommend to the Board a general framework of remuneration for the Board and Management, and the specific remuneration packages for each Director and key executive.
(c) To structure and propose appropriate performance conditions to be linked to the remuneration of executive Directors and key executives for the Board’s approval.
(d) To review the Company’s obligations arising in the event of termination of contracts of services of executive Directors and key executives, to ensure that such contracts of service contain fair and reasonable termination clauses which are not overly generous.
(e) To assess and report to the Board annually the performance of executive Directors and key executives and whether their performance conditions are met.
(f) To ensure that the remuneration of non-executive Directors is appropriate to the level of contribution, taking into account factors such as effort and time spent, and responsibilities undertaken, but not excessive to the extent that their independence may be compromised.
(g) To administer the share-based incentive scheme(s) of the Company as amended or modified from time to time and to report to the Board annually the important terms of the scheme(s).
(h) To make remuneration recommendations in consultation with the CEO and submit its recommendations for endorsement by the entire Board.
(i) To review the various disclosure requirements on the remuneration of Directors and key executives, particularly those required by regulatory bodies such as the SGX-ST, and to ensure that there is adequate disclosure in the financial statements.
(j) To retain such professional consultancy firm as the RC may deem necessary to enable it to discharge its duties hereunder satisfactorily.
(k) To undertake such other duties as may be requested by the Board, and to report to the Board its findings from time to time on matters arising and requiring the attention of the RC.
(l) To conduct periodic review of its own performance and, at least annually, review its constitution and terms of reference to ensure it is operating at optimal effectiveness and recommend any changes it considers necessary to the Board.
CORPORATE GOVERNANCE REPORT
Interra Resources Limited The Road Ahead 33
During the year, the RC reviewed and made the requisite recommendations in relation to the general remuneration framework for the Board as well as regarding the specific remuneration packages of key management personnel and submitted them for endorsement by the entire Board. The RC’s recommendations covered all aspects of remuneration, including but not limited to Director’s fees, salaries, allowances, bonuses, options, share-based incentives and awards, and benefits-in-kind. The proposal of one-time issuance of 3,180,000 bonus shares to non-executive directors as part of their remuneration for FY2014 was approved by shareholders at the annual general meeting held on 29 April 2014. No Director was involved in deciding his own remuneration other than the framework of remuneration for the Board as a whole.
The RC also reviewed and made recommendations to the Board the compensation package of Mr Han Liqiang, who was appointed the Regional Operations Manager of the Company on 7 April 2014 and subsequently seconded to its joint venture company as Country Manager. The package comprising various components of salary, benefits-in-kind and long-term incentives was structured in accordance with the existing policy and guidelines set forth by the RC as disclosed below. The RC also reviewed the Company’s obligations arising in the event of termination of such key management personnel’s contract of service and was assured that the contract of service contained fair and reasonable termination clauses which were not overly generous. Being familiar with the compensation benchmark of the industry, the RC did not need to obtain advice from external remuneration consultants for the review of the contract of service.
Each meeting of the RC was properly minuted and upon confirmation of such minutes by the Chairman, a copy of the confirmed minutes was duly circulated to all members and reported to the Board.
Principle 8 – Level and Mix of RemunerationThe level and structure of remuneration should be aligned with the long-term interest and risk policies of the company, and should be appropriate to attract, retain and motivate (a) the Directors to provide good stewardship of the company, and (b) key management personnel to successfully manage the company. However, companies should avoid paying more than is necessary for this purpose.
The RC has in place a remuneration scheme for non-executive Directors, which takes into account individual level of contribution and factors such as effort and time spent, and responsibilities based on the role undertaken on the Board and Board Committees and the number of Board Committees served on. The scheme is reviewed annually by the RC to ensure that the level of compensation is optimal for attracting, retaining and motivating the non-executive Directors, and does not change from year to year unless circumstances deem it necessary to be changed. To better align the interests of non-executive Directors with the interests of shareholders, share options or other share-based instruments are awarded from time to time, if necessary, under shareholders’ approval. The RC is mindful that non-executive Directors should not be over-compensated to the extent that their independence may be compromised.
In setting the remuneration packages of the executive Director and key management personnel, the RC takes into consideration the remuneration and employment conditions within the same industry and of comparable companies as well as the Group’s size and scope of operations. A significant and appropriate portion of the executive Director’s and key management personnel’s remuneration is structured so as to link rewards to corporate and individual performance. Such performance-related remuneration takes into account the risk policies of the Company, is symmetric with risk outcomes and is sensitive to the time horizon of risks. In assessing the performance of the executive Director and key management personnel, the RC takes into account the financial and operational performance of the Group as well as management execution and expansion growth of the Company.
CORPORATE GOVERNANCE REPORT
The Road Ahead Annual Report 201434
A long-term incentive scheme, namely the Interra Share Option Plan (“ISOP”), has been employed to align the remuneration of the executive Director and key management personnel with the interests of shareholders and to promote long-term success of the Company. Options granted under the scheme are to meet the vesting period requirements of SGX-ST before they can be exercised. The executive Director and key management personnel are encouraged to hold their shares for longer term where possible, subject to the need to finance any cost of acquiring the shares and associated tax liability. The remuneration packages of the executive Director and key management personnel are reviewed annually by the RC to ensure that the level of compensation remains competitive for attracting, retaining and motivating capable and talented employees. While the use of contractual provisions to reclaim incentive components of remuneration from executives in exceptional circumstances of misstatement of financial results or of misconduct resulting in financial loss to the Company is not a common industry practice, the RC aims to be fair and avoid rewarding poor performance when setting the remuneration packages of the executive Director and key management personnel.
Principle 9 – Disclosure on RemunerationEvery company should provide clear disclosure of its remuneration policies, level and mix of remuneration, and the procedure for setting remuneration, in the company’s Annual Report. It should provide disclosure in relation to its remuneration policies to enable investors to understand the link between remuneration paid to Directors and key management personnel, and performance.
The Company endeavours to provide adequate disclosure of its Directors’, including CEO’s, and key management personnel’s remuneration for the purpose of enhancing transparency between the Company and shareholders. However, being faced with stiff competition in attracting and retaining talents in similar industry, the Company does not wish to divulge too much information with regard to remuneration packages of its Directors and key management personnel for its competitors to take advantage of.The total remuneration of Directors including CEO for the financial year ended 31 December 2014, which amounted to S$2,330,800, is summarised below.
Benefits- in-kind, Variable Share- Allowances Directors' Base/Fixed Component based and Other Name Fees Salary or Bonuses Bonus Incentives
Below S$250,000 Non-Executive DirectorsEdwin Soeryadjaya 19% - - 81% -Sandiaga Salahuddin Uno 23% - - 77% -Ng Soon Kai 22% - - 78% -Subianto Arpan Sumodikoro 16% - - 84% -Low Siew Sie Bob 61% - - 39% -Allan Charles Buckler 26% - - 74% -Lim Hock San 31% - - 39% -Pepen Handianto Danuatmadja - - - - -Above S$500,000Executive Director & CEOMarcel Han Liong Tjia - 78% 19% - 3%
CORPORATE GOVERNANCE REPORT
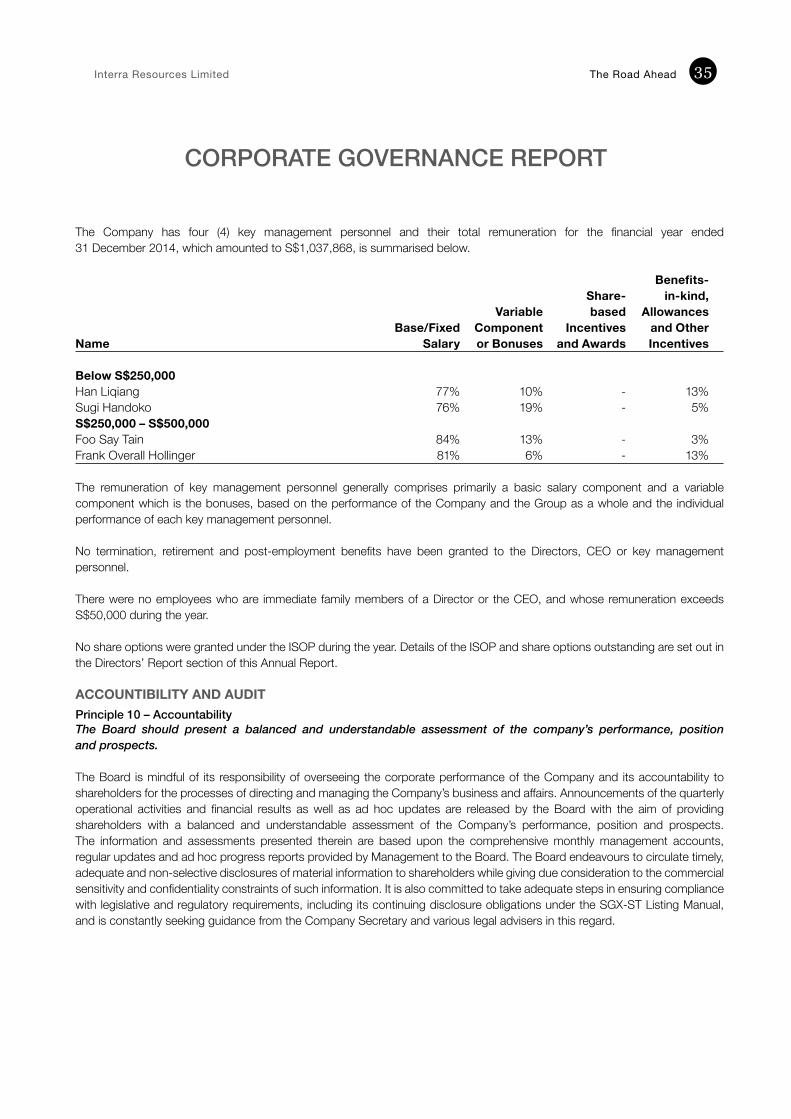
Interra Resources Limited The Road Ahead 35
The Company has four (4) key management personnel and their total remuneration for the financial year ended 31 December 2014, which amounted to S$1,037,868, is summarised below.
Benefits- Share- in-kind, Variable based Allowances Base/Fixed Component Incentives and Other Name Salary or Bonuses and Awards Incentives
Below S$250,000 Han Liqiang 77% 10% - 13%Sugi Handoko 76% 19% - 5%S$250,000 – S$500,000Foo Say Tain 84% 13% - 3%Frank Overall Hollinger 81% 6% - 13%
The remuneration of key management personnel generally comprises primarily a basic salary component and a variable component which is the bonuses, based on the performance of the Company and the Group as a whole and the individual performance of each key management personnel.
No termination, retirement and post-employment benefits have been granted to the Directors, CEO or key management personnel.
There were no employees who are immediate family members of a Director or the CEO, and whose remuneration exceeds S$50,000 during the year.
No share options were granted under the ISOP during the year. Details of the ISOP and share options outstanding are set out in the Directors’ Report section of this Annual Report.
ACCOUNTIBILITY AND AUDITPrinciple 10 – AccountabilityThe Board should present a balanced and understandable assessment of the company’s performance, position and prospects.
The Board is mindful of its responsibility of overseeing the corporate performance of the Company and its accountability to shareholders for the processes of directing and managing the Company’s business and affairs. Announcements of the quarterly operational activities and financial results as well as ad hoc updates are released by the Board with the aim of providing shareholders with a balanced and understandable assessment of the Company’s performance, position and prospects. The information and assessments presented therein are based upon the comprehensive monthly management accounts, regular updates and ad hoc progress reports provided by Management to the Board. The Board endeavours to circulate timely, adequate and non-selective disclosures of material information to shareholders while giving due consideration to the commercial sensitivity and confidentiality constraints of such information. It is also committed to take adequate steps in ensuring compliance with legislative and regulatory requirements, including its continuing disclosure obligations under the SGX-ST Listing Manual, and is constantly seeking guidance from the Company Secretary and various legal advisers in this regard.
CORPORATE GOVERNANCE REPORT
The Road Ahead Annual Report 201436
Principle 11 – Risk Management and Internal ControlsThe Board is responsible for the governance of risk. The Board should ensure that Management maintains a sound system of risk management and internal controls to safeguard shareholders’ interests and the company’s assets, and should determine the nature and extent of the significant risks which the Board is willing to take in achieving its strategic objectives.
In furtherance of its continuing efforts to safeguard shareholders’ interests and the Company’s assets, the Board has recently formally tasked the AC with an additional responsibility of overseeing the risk management framework and policies of the Company which includes determining the Company’s levels of risk tolerance and risk policies and overseeing Management in the design, implementation and monitoring of the risk management and internal control systems. It has also retained Crowe Horwath First Trust Advisory Pte Ltd (“Crowe Horwath”), a reputable professional firm specialising in audit and risk solutions, to provide enterprise risk management (“ERM”) services in order to assist the Board in reviewing the adequacy and effectiveness of the Company’s risk management and internal control systems.
The scope of the ERM services is to facilitate the development and subsequent updating of key risk profiles in respect of the Company’s business and operations. During the annual review, key risk profiles are compiled by Crowe Horwath based on the risk management methodology adopted by the Company, which is aligned with an internationally recognised standard. The findings, which cover areas in strategic, financial, operational, compliance and information technology, are then presented to the AC for its deliberation and recommendation to the Board. In assessing these results, the AC aims to strike a balance between pursuing strategic objectives and focusing on the consensual levels of risk appetite and risk tolerance. Besides the assistance from the ERM services, the AC is provided with findings and recommendations from the internal auditor, who performs an annual review of the internal control systems, as well as the independent auditor, who conducts an annual compliance check on the accounting records and the financial statements prepared by Management. This three-dimensional approach facilitates the AC in assessing the adequacy and effectiveness of the Company’s risk management framework and internal control systems.
The Board is of the opinion, with the concurrence of the AC, that based on the ERM evaluation and the review performed by the internal and independent auditors, the Company maintains a sound system of risk management and internal controls, including financial, operational, compliance risks and information technology controls, and is assured of its adequacy and effectiveness in safeguarding the shareholders’ interests and the Company’s assets. The Board however notes that no system of internal controls can provide absolute assurance against failure to meet business objectives, poor business judgement, human fallibility, material errors or losses, frauds, breaches of laws or regulations, or other unforeseeable occurrences.
The CEO and CFO have provided a letter of assurance with respect to the financial year ended 31 December 2014 to the Board confirming, inter alia, that:
(a) the financial statements of the Company have been prepared in accordance with the provisions of the Act and Singapore Financial Reporting Standards so as to give a true and fair view of the state of business and financial affairs of the Company;
(b) the accounting and other financial records have been properly maintained and in accordance with the provisions of the Act; and
(c) the Company has put in place and will continue to maintain an effective and reliable system of risk management and internal controls.
CORPORATE GOVERNANCE REPORT
Interra Resources Limited The Road Ahead 37
CORPORATE GOVERNANCE REPORT
Principle 12 – Audit CommitteeThe Board should establish an Audit Committee with written terms of reference which clearly set out its authority and duties.
The AC has been delegated by the Board to oversee matters pertaining to financial reporting, internal and independent audit as well as the aforementioned risk management function of the Company. It comprises four (4) non-executive Directors, the majority of whom, including the Chairman, are Independent Directors. In addition, the majority of the AC members, including the Chairman, have relevant accounting or related financial management expertise or experience and accounting qualifications. As at the date of this Annual Report, the members of the AC are:
(a) Mr Low Siew Sie Bob (Lead Independent Director) – Chairman;(b) Mr Allan Charles Buckler (Independent Director);(c) Mr Lim Hock San (Independent Director); and(d) Mr Sandiaga Salahuddin Uno (Deputy Chairman).
The AC has written terms of reference that clearly sets out its duties and functions as follows:
(a) To review the significant financial reporting issues and judgements so as to ensure the integrity of the financial statements of the Company and any formal announcements relating to the Company’s financial performance.
(b) To review the annual consolidated financial statements and the external auditors’ report on those financial statements, and discuss any significant adjustments, major risks areas, changes in accounting policies, compliance with Singapore Financial Reporting Standards, concerns and issues arising from their audits including any matters which the auditors may wish to discuss in the absence of Management, where necessary, before submission to the Board for approval.
(c) To review the periodic consolidated financial statements and such other financial information required under the SGX-ST Listing Manual, before submission to the Board for approval.
(d) To review the various disclosure requirements for the financial reporting, particularly those required by regulatory bodies such as the SGX-ST and ensure that there is adequate disclosure in the financial statements.
(e) To approve the hiring, removal, evaluation and compensation of the head of the internal audit function, or the accounting/auditing firm or corporation to which the internal audit function is outsourced and ensure that the internal auditor has unfettered access to all the Company’s documents, records, properties and personnel, including access to the AC.
(f) To ensure that the internal audit function is adequately resourced, independent of the activities it audits, has appropriate standing within the Company and is staffed with persons with the relevant qualifications and experience.
(g) To review with the internal auditors, their audit plan, scope of internal control procedures and results of the audit.(h) To review the adequacy and effectiveness of the internal audit function at least once a year.(i) To meet with the internal auditors without the presence of Management at least once a year and to review the assistance
given by the Company’s officers, including Management, to the internal auditors.(j) To review and report to the Board at least annually the adequacy and effectiveness of the Company’s risk management
and internal controls systems, including financial, operational, compliance and information technology controls.(k) To review with the external auditors, their audit plan, evaluation of the system of internal accounting controls and their
audit report.(l) To review the scope and results of the external audit and appraise the effectiveness of the audit efforts of the
external auditors.(m) To review the independence and objectivity of the external auditors annually and to report the aggregate amount of fees
paid to the external auditors, broken down into audit and non-audit services.(n) To meet with the external auditors without the presence of Management at least once a year and to review the assistance
given by the Company’s officers, including Management, to the external auditors.(o) To serve as a channel of communication between the Board and the external auditors on matters relating to and arising
out of the external audit.(p) To make recommendations to the Board on the proposals to the shareholders on the appointment, re-appointment and
removal of the external auditors, and approving the remuneration and terms of engagement of the external auditors.

The Road Ahead Annual Report 201438
(q) To review the policy and arrangements by which staff of the Company and any other persons may, in confidence, raise concerns about possible improprieties in matters of financial reporting or other matters.
(r) To review and discuss with the external and internal auditors and report to the Board, when appropriate, any suspected fraud or irregularity, or suspected infringement of any laws or regulations or rules of the SGX-ST Listing Manual or any other regulatory authority, which has or is likely to have a material impact on the Company’s operating results or financial position and Management’s response.
(s) To commission and review the findings of internal or external investigations into matters where there is any suspected fraud or irregularity, or failure of internal controls or infringement of any law, rule or regulation or where it will be in the best interest of the Company.
(t) To determine and recommend to the Board for its approval, the nature and extent of significant risks in achieving the Board’s strategic objectives.
(u) in relation to risk assessment, (i) to keep under review the Company’s overall risk assessment processes that form the Board’s decision making; (ii) to review regularly and approve the parameters used in these measures and the methodology adopted; and (iii) to set a process for the accurate and timely monitoring of large exposures and certain risk types of critical importance.
(v) To advise the Board on proposed strategic transactions, focussing in particular on risk aspects and implications for the risk tolerance of the Company, and taking independent external advice where appropriate and available.
(w) To ensure that the financial records have been properly maintained and the financial statements give a true and accurate view of the Company’s operations and finances.
(x) To monitor the independence of risk management functions throughout the organisation.(y) To review any interested person transactions subject to the provisions of the Act or falling within the scope of the SGX-ST
Listing Manual as may be amended or modified from time to time and such other rules and regulations of the SGX-ST that may be applicable in relation to such matters from time to time.
(z) To review any potential conflicts of interest.(aa) To take such measures to keep abreast of changes to accounting standards and issues which have a direct impact on
financial statements.(bb) To undertake generally such other functions and duties as may be required by law, the Act, the SGX-ST Listing Manual or
the Securities and Futures Act, Cap. 289 and by such amendments made thereto from time to time.(cc) To ensure the Company complies with requirements under the Act and the SGX-ST Listing Manual and any undertakings
given by the Company to the SGX-ST.(dd) To undertake such other reviews and projects as may be requested by the Board, and to report to the Board its findings
from time to time on matters arising and requiring the attention of the AC.(ee) To retain such professional consultancy firm as the AC may deem necessary to enable it to discharge its duties hereunder
satisfactorily.(ff) To conduct periodic review of its own performance and, at least annually, review its constitution and terms of reference to
ensure it is operating at optimal effectiveness and recommend any changes it considers necessary to the Board.
The AC has explicit authority to investigate any matter within its terms of reference, full access to and co-operation by Management and full discretion to invite any Director or executive officer to attend its meetings, and is provided with reasonable resources to enable it to discharge its functions properly. The Board is of the view that the present members of the AC, whose professions or principal commitments require them to keep abreast of changes to accounting standards and issues, have sufficient accounting or related financial management expertise and experience to discharge their responsibilities as set out in the terms of reference. Furthermore, changes to the various accounting standards are monitored closely by Management. Where these changes have an important bearing on the Company’s disclosure obligations, the Directors (including members of the AC) are kept informed of such changes from time to time through circulation of the relevant changes which are also tabled during Board meetings.
CORPORATE GOVERNANCE REPORT
Interra Resources Limited The Road Ahead 39
During the financial year, the AC met with Management and the independent auditor on three (3) occasions. Agenda of these meetings included, inter alia, review of financial statements, accounting policies and internal control procedures that are relevant in the preparation of financial statements, scope and findings of audit, and objectivity and independence of the independent auditor. The AC also had one (1) separate session with the independent auditor, without the presence of Management.
The Company has engaged the same Singapore-based independent auditor, Nexia TS Public Accounting Corporation (“Nexia TS”), to audit its accounts and all its Singapore-incorporated subsidiaries’ accounts. Nexia TS is a respectable accounting firm registered with and regulated by the Accounting and Corporate Regulatory Authority. In addition, both the firm and the director-in-charge have relevant experiences, professional capabilities and collective expertise in the petroleum and mining industry. The accounts of the Company's significant foreign-incorporated components are audited by either Nexia TS affiliates or reputable accounting firms. Therefore, the Company has complied with Rules 712 and 715 of the SGX-ST Listing Manual for the financial year ended 31 December 2014.
The report of Nexia TS as the independent auditor of the Company is set out in the Independent Auditor’s Report section of this Annual Report. The fees paid or payable by the Group to Nexia TS for its audit services with respect to the financial year ended 31 December 2014 amounted to US$151,623. During the financial year, the Group engaged Nexia TS to provide financial due diligence and review services on project basis and the fees for such non-audit services amounted to US$66,459. The AC had reviewed the nature and extent of the ad hoc engagement and was satisfied with the cost effectiveness of such engagement and the objectivity of Nexia TS. After considering the experience of and resources provided by Nexia TS and the director-in-charge as well as the terms and remuneration of the engagement and various regulatory requirements, the AC has recommended to the Board the re-appointment of Nexia TS as independent auditor for the Company’s audit obligations in the financial year ending 31 December 2015. The re-nomination will be put to shareholders for approval at the annual general meeting.
The AC has in place a whistle blowing policy which provides a platform for employees of the Group to report any fraud, abuse or violation of business ethics and regulations to its Chairman directly, and puts in place arrangements for independent investigation of such concerns and appropriate follow-up action. An employee who makes an allegation in good faith will be treated fairly and justly, and the Company will not tolerate harassment or victimisation of an employee who has lodged a report. The violations that can be reported on under the policy include both accounting and non-accounting related matters. Employees of the Company may, in confidence, report any such violations in writing to the AC Chairman.
Each meeting of the AC was properly minuted and upon confirmation of such minutes by the Chairman, a copy of the confirmed minutes was duly circulated to all members and tabled at Board meetings.
Principle 13 – Internal AuditThe company should establish an effective internal audit function that is adequately resourced and independent of the activities it audits.
The internal audit function of the Company is outsourced to Crowe Horwath, who aligned their services to the standards set by the relevant professional bodies in Singapore including the Standards for the Professional Practice of Internal Auditing set by The Institute of Internal Auditors. The internal auditor has unfettered access to all the Company’s documents, records, and personnel, including access to the AC. The AC reviews and approves the engagement, evaluation and remuneration of the internal auditor, who reports functionally to the AC Chairman and administratively to Management.
During the year, the AC met with the internal auditor on two (2) occasions, of which one separate session was held without the presence of Management. Agenda of these meetings included, inter alia, review of internal controls maintained by the Company, scope, findings and recommendations of audit, and objectivity and independence of the internal auditor. The AC also reviewed the adequacy and effectiveness of the internal audit function and was satisfied with qualifications and experience as well as the work performed and resources provided by Crowe Horwath. It has reported to the Board that the internal audit function of the Company is adequately resourced and independent of the activities it audits.
CORPORATE GOVERNANCE REPORT
The Road Ahead Annual Report 201440
SHAREHOLDER RIGHTS AND RESPONSIBILITIESPrinciple 14 – Shareholder RightsCompanies should treat all shareholders fairly and equitably, and should recognise, protect and facilitate the exercise of shareholders’ rights, and continually review and update such governance arrangements.
Principle 15 – Communication with ShareholdersCompanies should actively engage their shareholders and put in place an investor relations policy to promote regular, effective and fair communication with shareholders.
The Company has in place an investor communication framework that disseminates timely financial data, price-sensitive information and material developments to shareholders. All public releases are drafted under the legal or secretarial guidance, so as to provide relevant and sufficient information without being overly detailed and technical. Releases of quarterly financial and activity reports, project updates, media releases on significant developments and other pertinent information are first announced on the website of Singapore Exchange via SGXNET and then posted on the Company’s website, which is updated regularly and also provides an avenue for communication with shareholders.
The Company welcomes ad hoc enquiries from shareholders but avoids making inadvertent disclosures in the course of addressing their concerns. Besides engaging shareholders through email correspondence, the Company ensures that the shareholders have the opportunity to participate effectively in and vote at its general meetings, where rules and voting procedures governing the meetings were clearly communicated to shareholders. After the general meetings, Management endeavours to solicit and gather views and inputs from shareholders through dialogue sessions where shareholders openly communicate with the Directors and Management. To promote regular and effective communication with analysts and the media, the Company has retained the services of an investor relation firm to manage its analyst and media relations. From time to time, Management meets with the analysts and media separately to explain and clarify the Company’s financial results and industry operations.
The Company is a developing company and does not have a fixed dividend policy at this premature stage of growth. However, it endeavours to reward shareholders through other means, such as the enhancing the intrinsic value of the Company through long-term growth strategy.
Principle 16 – Conduct of Shareholder MeetingsCompanies should encourage greater shareholder participation at general meetings of shareholders, and allow shareholders the opportunity to communicate their views on various matters affecting the company.
The Company encourages active shareholder participation at its general meetings. Notices of general meetings are published in major newspapers and reports or circulars of the general meetings are despatched to all shareholders by post. The Articles of Association of the Company allows shareholders who are unable to attend the general meetings to appoint up to two proxies each to attend and vote on their behalf as long as their proxy forms are duly lodged with the Company in advance. Shareholders whose shares are held through nominees are allowed to attend general meetings as observers with advance notice to the Company through their nominees. The Company has decided not to provide for other absentia voting methods until security and other pertinent issues relating to shareholder identity authentication can be satisfactorily resolved.
Resolutions proposed at general meetings are kept separate with respect to each distinct issue, to which explanatory notes are furnished in the general meeting notices. Shareholders are also given the opportunity to ask questions relating to each resolution tabled for approval. The Company endeavours to arrange for at least the Lead Independent Director and one chairperson of the AC, NC or RC to be present and available to address shareholders’ queries at general meetings. The Company Secretary and independent auditor are also present to assist the Directors in answering relevant questions raised by shareholders. Minutes of the meetings are taken and are available to shareholders for inspection upon their request.
With regard to the new Listing Rule requirement to conduct voting by poll rather than by a show of hands which will take effect from 1 August 2015, the Company had already put all resolutions of its 2014 annual general meeting to vote by poll and announced the detailed results showing the number of votes cast for and against each resolution and the respective percentages and will continue to do so for future general meetings.
CORPORATE GOVERNANCE REPORT
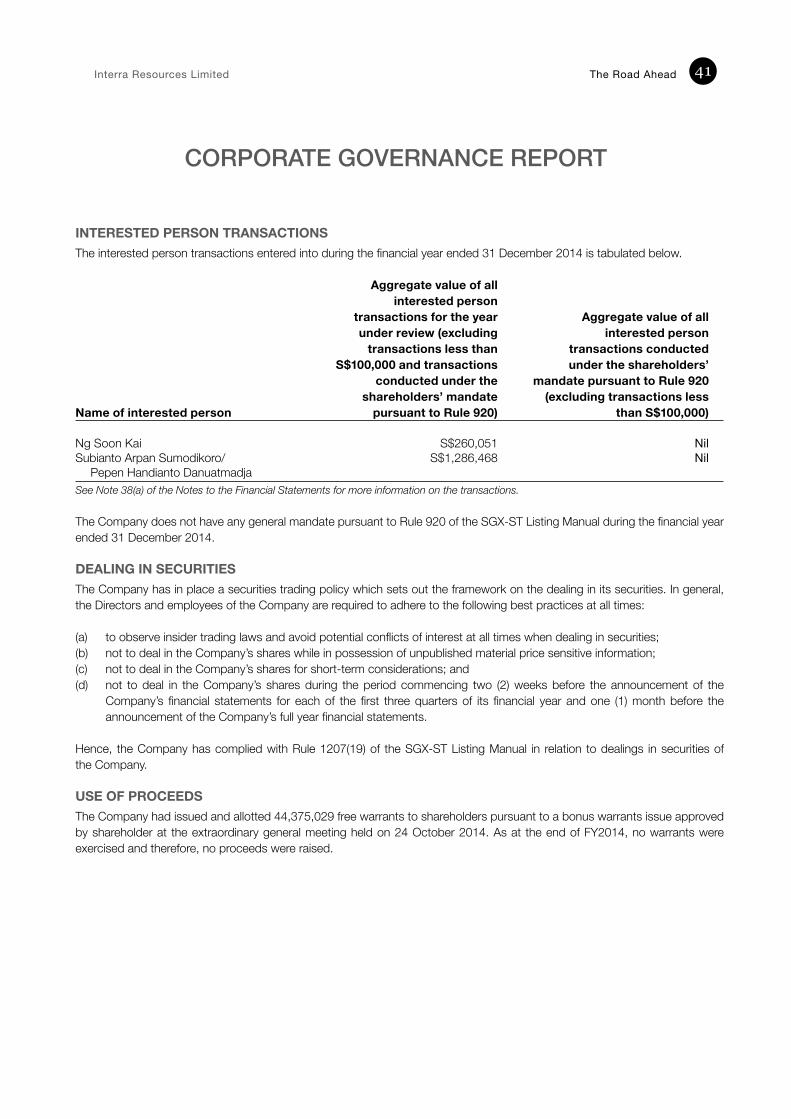
Interra Resources Limited The Road Ahead 41
INTERESTED PERSON TRANSACTIONSThe interested person transactions entered into during the financial year ended 31 December 2014 is tabulated below.
Aggregate value of all interested person transactions for the year Aggregate value of all under review (excluding interested person transactions less than transactions conducted S$100,000 and transactions under the shareholders’ conducted under the mandate pursuant to Rule 920 shareholders’ mandate (excluding transactions lessName of interested person pursuant to Rule 920) than S$100,000)
Ng Soon Kai S$260,051 NilSubianto Arpan Sumodikoro/ S$1,286,468 Nil
Pepen Handianto DanuatmadjaSee Note 38(a) of the Notes to the Financial Statements for more information on the transactions.
The Company does not have any general mandate pursuant to Rule 920 of the SGX-ST Listing Manual during the financial year ended 31 December 2014.
DEALING IN SECURITIESThe Company has in place a securities trading policy which sets out the framework on the dealing in its securities. In general, the Directors and employees of the Company are required to adhere to the following best practices at all times:
(a) to observe insider trading laws and avoid potential conflicts of interest at all times when dealing in securities;(b) not to deal in the Company’s shares while in possession of unpublished material price sensitive information;(c) not to deal in the Company’s shares for short-term considerations; and(d) not to deal in the Company’s shares during the period commencing two (2) weeks before the announcement of the
Company’s financial statements for each of the first three quarters of its financial year and one (1) month before the announcement of the Company’s full year financial statements.
Hence, the Company has complied with Rule 1207(19) of the SGX-ST Listing Manual in relation to dealings in securities of the Company.
USE OF PROCEEDSThe Company had issued and allotted 44,375,029 free warrants to shareholders pursuant to a bonus warrants issue approved by shareholder at the extraordinary general meeting held on 24 October 2014. As at the end of FY2014, no warrants were exercised and therefore, no proceeds were raised.
CORPORATE GOVERNANCE REPORT
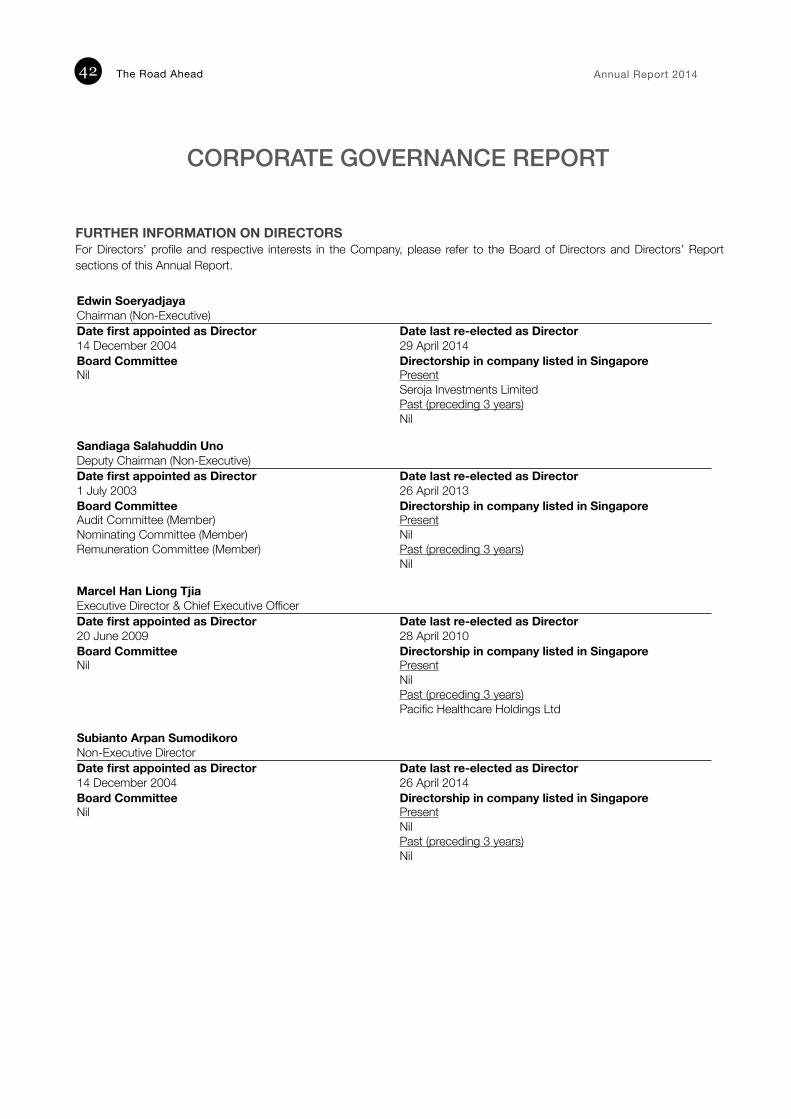
The Road Ahead Annual Report 201442
FURTHER INFORMATION ON DIRECTORSFor Directors’ profile and respective interests in the Company, please refer to the Board of Directors and Directors’ Report sections of this Annual Report.
Edwin SoeryadjayaChairman (Non-Executive)Date first appointed as Director 14 December 2004
Date last re-elected as Director 29 April 2014
Board Committee Directorship in company listed in SingaporeNil Present
Seroja Investments LimitedPast (preceding 3 years)Nil
Sandiaga Salahuddin UnoDeputy Chairman (Non-Executive) Date first appointed as Director 1 July 2003
Date last re-elected as Director 26 April 2013
Board Committee Directorship in company listed in SingaporeAudit Committee (Member) Nominating Committee (Member) Remuneration Committee (Member)
PresentNilPast (preceding 3 years)Nil
Marcel Han Liong TjiaExecutive Director & Chief Executive OfficerDate first appointed as Director 20 June 2009
Date last re-elected as Director 28 April 2010
Board Committee Directorship in company listed in SingaporeNil Present
NilPast (preceding 3 years)Pacific Healthcare Holdings Ltd
Subianto Arpan SumodikoroNon-Executive DirectorDate first appointed as Director 14 December 2004
Date last re-elected as Director 26 April 2014
Board Committee Directorship in company listed in SingaporeNil Present
NilPast (preceding 3 years)Nil
CORPORATE GOVERNANCE REPORT
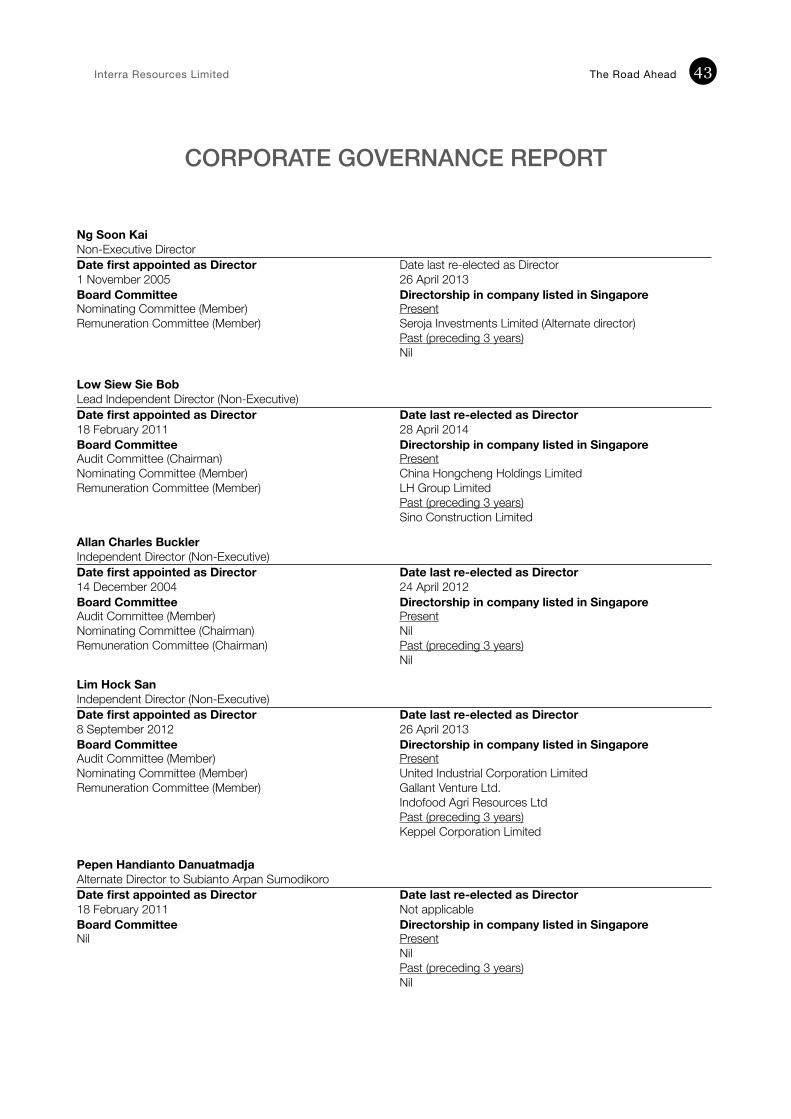
Interra Resources Limited The Road Ahead 43
CORPORATE GOVERNANCE REPORT
Ng Soon KaiNon-Executive DirectorDate first appointed as Director 1 November 2005
Date last re-elected as Director 26 April 2013
Board Committee Directorship in company listed in SingaporeNominating Committee (Member)Remuneration Committee (Member)
PresentSeroja Investments Limited (Alternate director)Past (preceding 3 years)Nil
Low Siew Sie BobLead Independent Director (Non-Executive)Date first appointed as Director 18 February 2011
Date last re-elected as Director 28 April 2014
Board Committee Directorship in company listed in SingaporeAudit Committee (Chairman)Nominating Committee (Member)Remuneration Committee (Member)
PresentChina Hongcheng Holdings LimitedLH Group LimitedPast (preceding 3 years)Sino Construction Limited
Allan Charles BucklerIndependent Director (Non-Executive)Date first appointed as Director 14 December 2004
Date last re-elected as Director 24 April 2012
Board Committee Directorship in company listed in SingaporeAudit Committee (Member)Nominating Committee (Chairman)Remuneration Committee (Chairman)
PresentNilPast (preceding 3 years)Nil
Lim Hock SanIndependent Director (Non-Executive)Date first appointed as Director 8 September 2012
Date last re-elected as Director 26 April 2013
Board Committee Directorship in company listed in SingaporeAudit Committee (Member)Nominating Committee (Member)Remuneration Committee (Member)
PresentUnited Industrial Corporation LimitedGallant Venture Ltd.Indofood Agri Resources LtdPast (preceding 3 years)Keppel Corporation Limited
Pepen Handianto DanuatmadjaAlternate Director to Subianto Arpan SumodikoroDate first appointed as Director 18 February 2011
Date last re-elected as Director Not applicable
Board Committee Directorship in company listed in SingaporeNil Present
NilPast (preceding 3 years)Nil
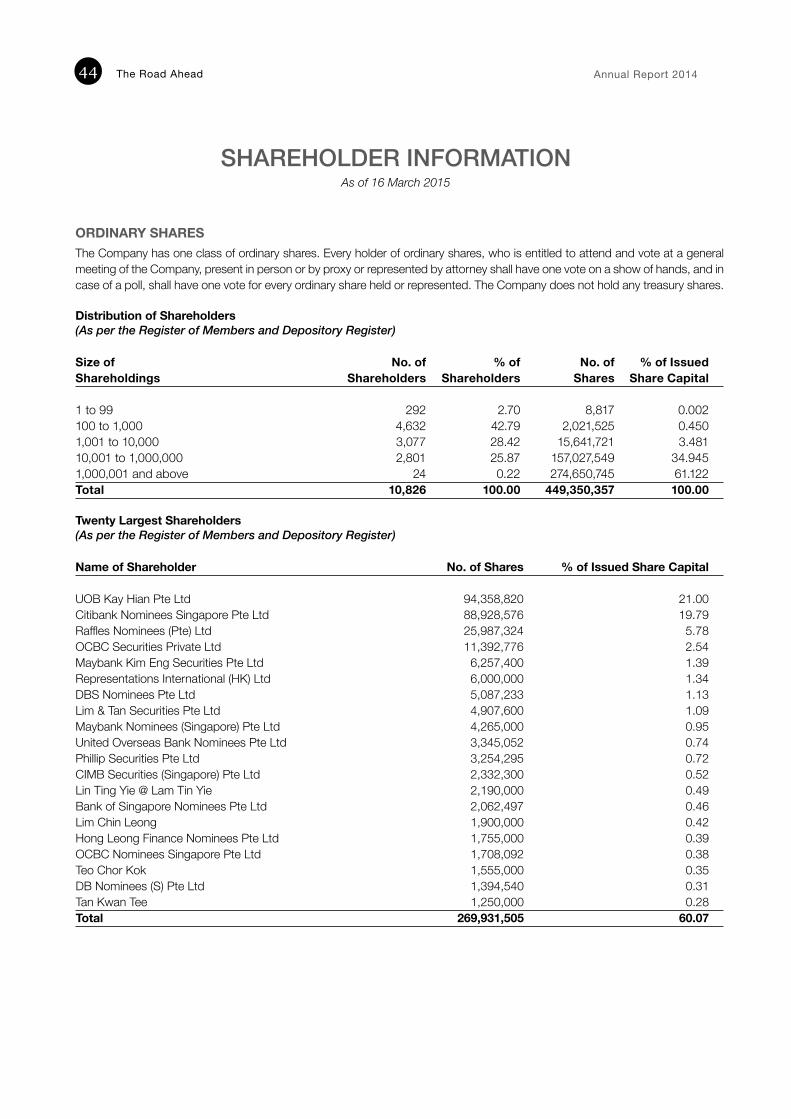
The Road Ahead Annual Report 201444
SHAREHOLDER INFORMATIONAs of 16 March 2015
ORDINARY SHARESThe Company has one class of ordinary shares. Every holder of ordinary shares, who is entitled to attend and vote at a general meeting of the Company, present in person or by proxy or represented by attorney shall have one vote on a show of hands, and in case of a poll, shall have one vote for every ordinary share held or represented. The Company does not hold any treasury shares.
Distribution of Shareholders(As per the Register of Members and Depository Register)
Size of No. of % of No. of % of IssuedShareholdings Shareholders Shareholders Shares Share Capital
1 to 99 292 2.70 8,817 0.002100 to 1,000 4,632 42.79 2,021,525 0.4501,001 to 10,000 3,077 28.42 15,641,721 3.48110,001 to 1,000,000 2,801 25.87 157,027,549 34.9451,000,001 and above 24 0.22 274,650,745 61.122Total 10,826 100.00 449,350,357 100.00
Twenty Largest Shareholders(As per the Register of Members and Depository Register)
Name of Shareholder No. of Shares % of Issued Share Capital
UOB Kay Hian Pte Ltd 94,358,820 21.00Citibank Nominees Singapore Pte Ltd 88,928,576 19.79Raffles Nominees (Pte) Ltd 25,987,324 5.78OCBC Securities Private Ltd 11,392,776 2.54Maybank Kim Eng Securities Pte Ltd 6,257,400 1.39Representations International (HK) Ltd 6,000,000 1.34DBS Nominees Pte Ltd 5,087,233 1.13Lim & Tan Securities Pte Ltd 4,907,600 1.09Maybank Nominees (Singapore) Pte Ltd 4,265,000 0.95United Overseas Bank Nominees Pte Ltd 3,345,052 0.74Phillip Securities Pte Ltd 3,254,295 0.72CIMB Securities (Singapore) Pte Ltd 2,332,300 0.52Lin Ting Yie @ Lam Tin Yie 2,190,000 0.49Bank of Singapore Nominees Pte Ltd 2,062,497 0.46Lim Chin Leong 1,900,000 0.42Hong Leong Finance Nominees Pte Ltd 1,755,000 0.39OCBC Nominees Singapore Pte Ltd 1,708,092 0.38Teo Chor Kok 1,555,000 0.35DB Nominees (S) Pte Ltd 1,394,540 0.31Tan Kwan Tee 1,250,000 0.28Total 269,931,505 60.07
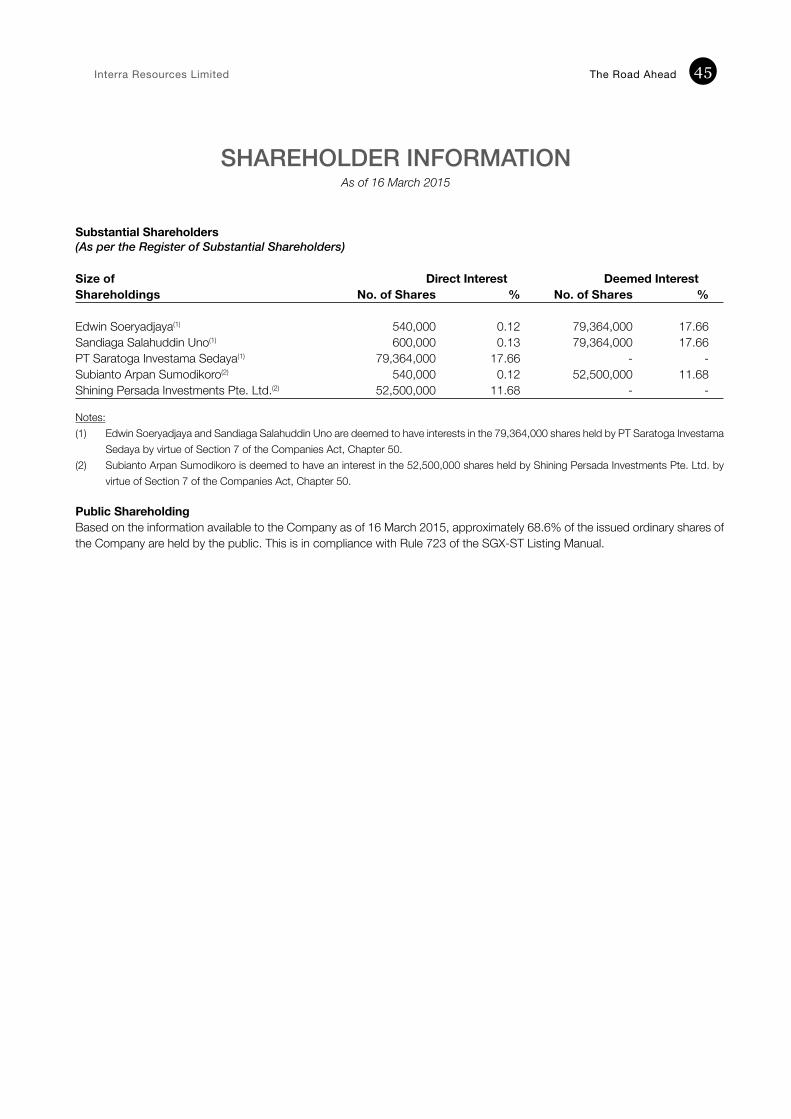
Interra Resources Limited The Road Ahead 45
Substantial Shareholders(As per the Register of Substantial Shareholders)
Size of Direct Interest Deemed InterestShareholdings No. of Shares % No. of Shares %
Edwin Soeryadjaya(1) 540,000 0.12 79,364,000 17.66Sandiaga Salahuddin Uno(1) 600,000 0.13 79,364,000 17.66PT Saratoga Investama Sedaya(1) 79,364,000 17.66 - -Subianto Arpan Sumodikoro(2) 540,000 0.12 52,500,000 11.68Shining Persada Investments Pte. Ltd.(2) 52,500,000 11.68 - -
Notes:(1) Edwin Soeryadjaya and Sandiaga Salahuddin Uno are deemed to have interests in the 79,364,000 shares held by PT Saratoga Investama
Sedaya by virtue of Section 7 of the Companies Act, Chapter 50.(2) Subianto Arpan Sumodikoro is deemed to have an interest in the 52,500,000 shares held by Shining Persada Investments Pte. Ltd. by
virtue of Section 7 of the Companies Act, Chapter 50.
Public ShareholdingBased on the information available to the Company as of 16 March 2015, approximately 68.6% of the issued ordinary shares of the Company are held by the public. This is in compliance with Rule 723 of the SGX-ST Listing Manual.
SHAREHOLDER INFORMATIONAs of 16 March 2015
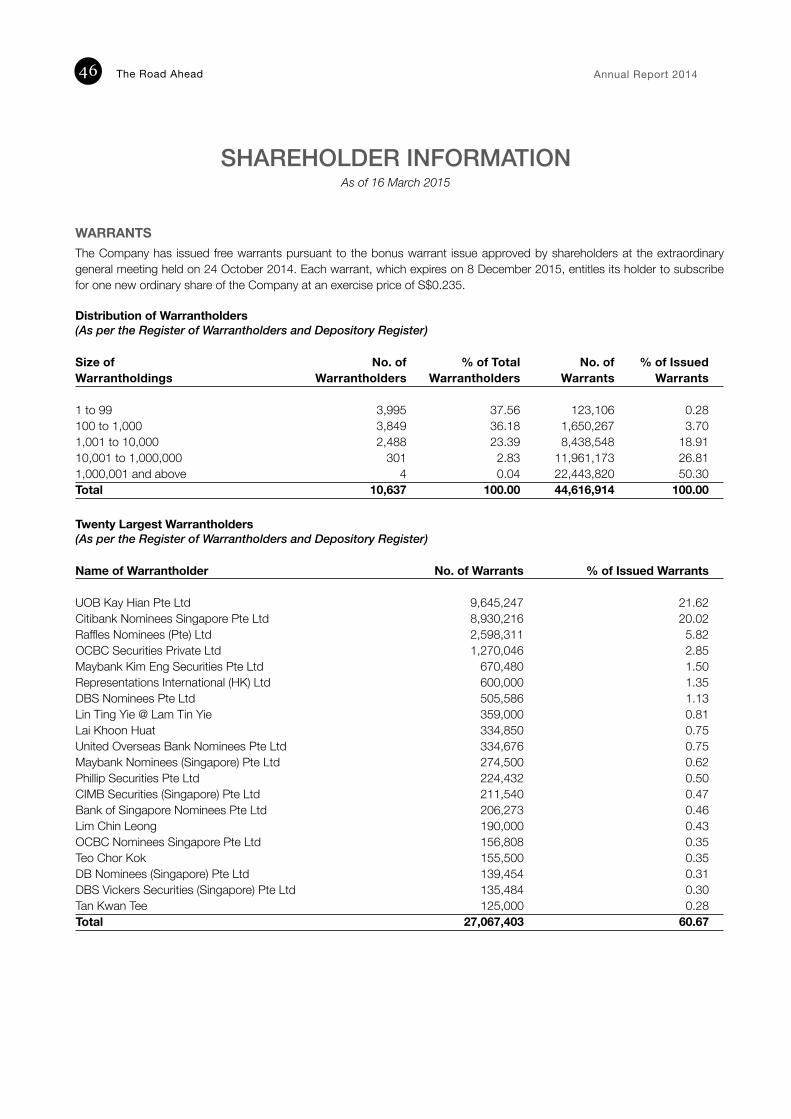
The Road Ahead Annual Report 201446
WARRANTSThe Company has issued free warrants pursuant to the bonus warrant issue approved by shareholders at the extraordinary general meeting held on 24 October 2014. Each warrant, which expires on 8 December 2015, entitles its holder to subscribe for one new ordinary share of the Company at an exercise price of S$0.235.
Distribution of Warrantholders(As per the Register of Warrantholders and Depository Register)
Size of No. of % of Total No. of % of IssuedWarrantholdings Warrantholders Warrantholders Warrants Warrants
1 to 99 3,995 37.56 123,106 0.28100 to 1,000 3,849 36.18 1,650,267 3.701,001 to 10,000 2,488 23.39 8,438,548 18.9110,001 to 1,000,000 301 2.83 11,961,173 26.811,000,001 and above 4 0.04 22,443,820 50.30Total 10,637 100.00 44,616,914 100.00
Twenty Largest Warrantholders(As per the Register of Warrantholders and Depository Register)
Name of Warrantholder No. of Warrants % of Issued Warrants
UOB Kay Hian Pte Ltd 9,645,247 21.62Citibank Nominees Singapore Pte Ltd 8,930,216 20.02Raffles Nominees (Pte) Ltd 2,598,311 5.82OCBC Securities Private Ltd 1,270,046 2.85Maybank Kim Eng Securities Pte Ltd 670,480 1.50Representations International (HK) Ltd 600,000 1.35DBS Nominees Pte Ltd 505,586 1.13Lin Ting Yie @ Lam Tin Yie 359,000 0.81Lai Khoon Huat 334,850 0.75United Overseas Bank Nominees Pte Ltd 334,676 0.75Maybank Nominees (Singapore) Pte Ltd 274,500 0.62Phillip Securities Pte Ltd 224,432 0.50CIMB Securities (Singapore) Pte Ltd 211,540 0.47Bank of Singapore Nominees Pte Ltd 206,273 0.46Lim Chin Leong 190,000 0.43OCBC Nominees Singapore Pte Ltd 156,808 0.35Teo Chor Kok 155,500 0.35DB Nominees (Singapore) Pte Ltd 139,454 0.31DBS Vickers Securities (Singapore) Pte Ltd 135,484 0.30Tan Kwan Tee 125,000 0.28Total 27,067,403 60.67
SHAREHOLDER INFORMATIONAs of 16 March 2015

Interra Resources Limited The Road Ahead 47
DIRECTORS’ REPORTForthefinancialyearended31December2014
The directors present their report to the members together with the balance sheet of the Company as at 31 December 2014 and financial statements of the Group for the financial year ended 31 December 2014.
DIRECTORSThe directors of the Company at the date of this report are as follows:
Edwin Soeryadjaya (Chairman) Sandiaga Salahuddin Uno (Deputy Chairman)Marcel Han Liong Tjia Subianto Arpan Sumodikoro Allan Charles Buckler Low Siew Sie Bob Ng Soon Kai Lim Hock San Pepen Handianto Danuatmadja (Alternate to Subianto Arpan Sumodikoro)
ARRANGEMENTS FOR DIRECTORS TO ACQUIRE SHARES, WARRANTS OR DEBENTURESNeither at the end of nor at any time during the financial year was the Company a party to any arrangement whose object was to enable the directors of the Company to acquire benefits by means of the acquisition of shares in, warrants or debentures of, the Company or any other body corporate, other than as disclosed under “Share Options” on pages 48 to 50 of this report.
DIRECTORS’ INTERESTS IN SHARES, WARRANTS OR DEBENTURES(a) According to the register kept by the Company for the purposes of Section 164 of the Singapore Companies Act,
Chapter 50 (the “Act”), the interests of directors holding office at the end of the financial year in shares, warrants or debentures of the Company and its related corporations other than wholly-owned subsidiaries were as follows:
Held in the name of Held in which the director is of director or nominee deemed to have an interest At end of the At beginning At end of the At beginning
financial year and of the financial year and of the 21 January 2015 financial year 21 January 2015 financial year
The CompanyOrdinary SharesEdwin Soeryadjaya 540,000 - 79,364,000 79,364,000Sandiaga Salahuddin Uno 600,000 - 79,364,000 79,364,000Subianto Arpan Sumodikoro 540,000 - 52,500,000 52,500,000Allan Charles Buckler 6,458,400 5,918,400 - -Ng Soon Kai 480,000 - - -Low Siew Sie Bob 120,000 - - -Lim Hock San 360,000 - - -
Warrants Edwin Soeryadjaya - - 7,936,400 -Sandiaga Salahuddin Uno - - 7,936,400 -Subianto Arpan Sumodikoro - - 5,250,000 -Allan Charles Buckler 591,840 - - -
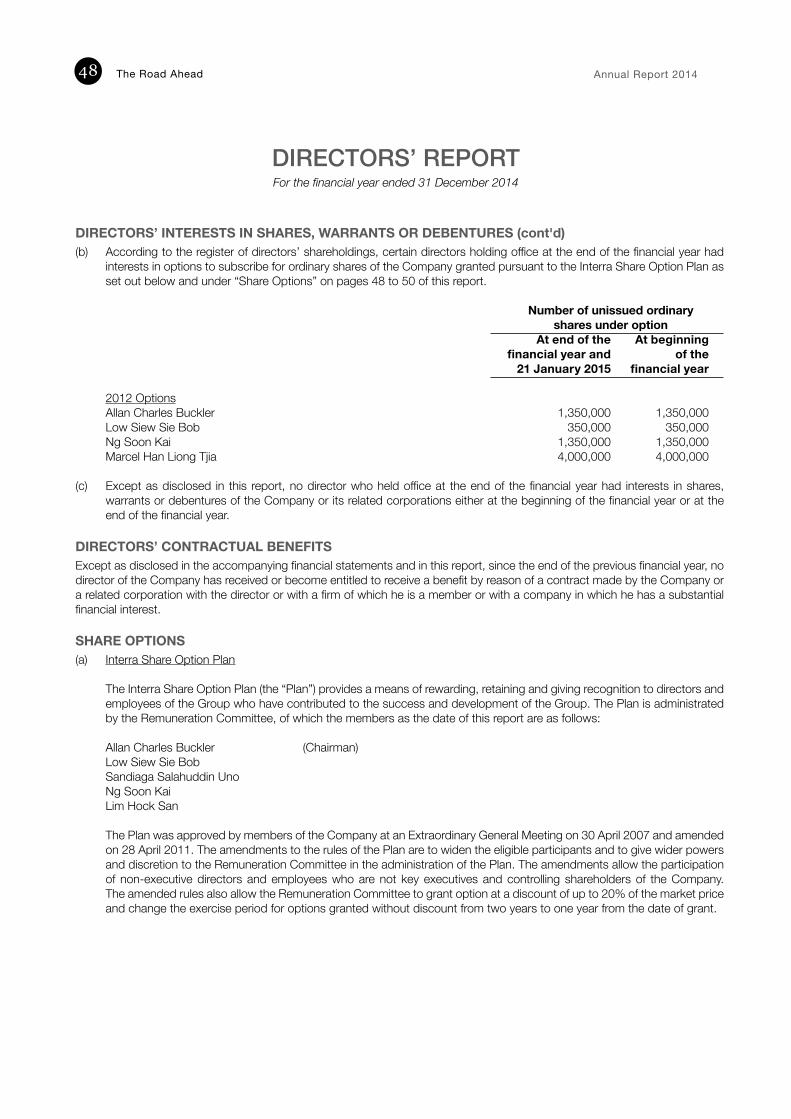
The Road Ahead Annual Report 201448
DIRECTORS’ INTERESTS IN SHARES, WARRANTS OR DEBENTURES (cont'd)(b) According to the register of directors’ shareholdings, certain directors holding office at the end of the financial year had
interests in options to subscribe for ordinary shares of the Company granted pursuant to the Interra Share Option Plan as set out below and under “Share Options” on pages 48 to 50 of this report.
Number of unissued ordinary shares under option At end of the At beginning
financial year and of the 21 January 2015 financial year
2012 Options Allan Charles Buckler 1,350,000 1,350,000Low Siew Sie Bob 350,000 350,000Ng Soon Kai 1,350,000 1,350,000Marcel Han Liong Tjia 4,000,000 4,000,000
(c) Except as disclosed in this report, no director who held office at the end of the financial year had interests in shares, warrants or debentures of the Company or its related corporations either at the beginning of the financial year or at the end of the financial year.
DIRECTORS’ CONTRACTUAL BENEFITSExcept as disclosed in the accompanying financial statements and in this report, since the end of the previous financial year, no director of the Company has received or become entitled to receive a benefit by reason of a contract made by the Company or a related corporation with the director or with a firm of which he is a member or with a company in which he has a substantial financial interest.
SHARE OPTIONS(a) Interra Share Option Plan The Interra Share Option Plan (the “Plan”) provides a means of rewarding, retaining and giving recognition to directors and
employees of the Group who have contributed to the success and development of the Group. The Plan is administrated by the Remuneration Committee, of which the members as the date of this report are as follows:
Allan Charles Buckler (Chairman) Low Siew Sie Bob Sandiaga Salahuddin Uno Ng Soon Kai Lim Hock San
The Plan was approved by members of the Company at an Extraordinary General Meeting on 30 April 2007 and amended
on 28 April 2011. The amendments to the rules of the Plan are to widen the eligible participants and to give wider powers and discretion to the Remuneration Committee in the administration of the Plan. The amendments allow the participation of non-executive directors and employees who are not key executives and controlling shareholders of the Company. The amended rules also allow the Remuneration Committee to grant option at a discount of up to 20% of the market price and change the exercise period for options granted without discount from two years to one year from the date of grant.
DIRECTORS’ REPORTForthefinancialyearended31December2014
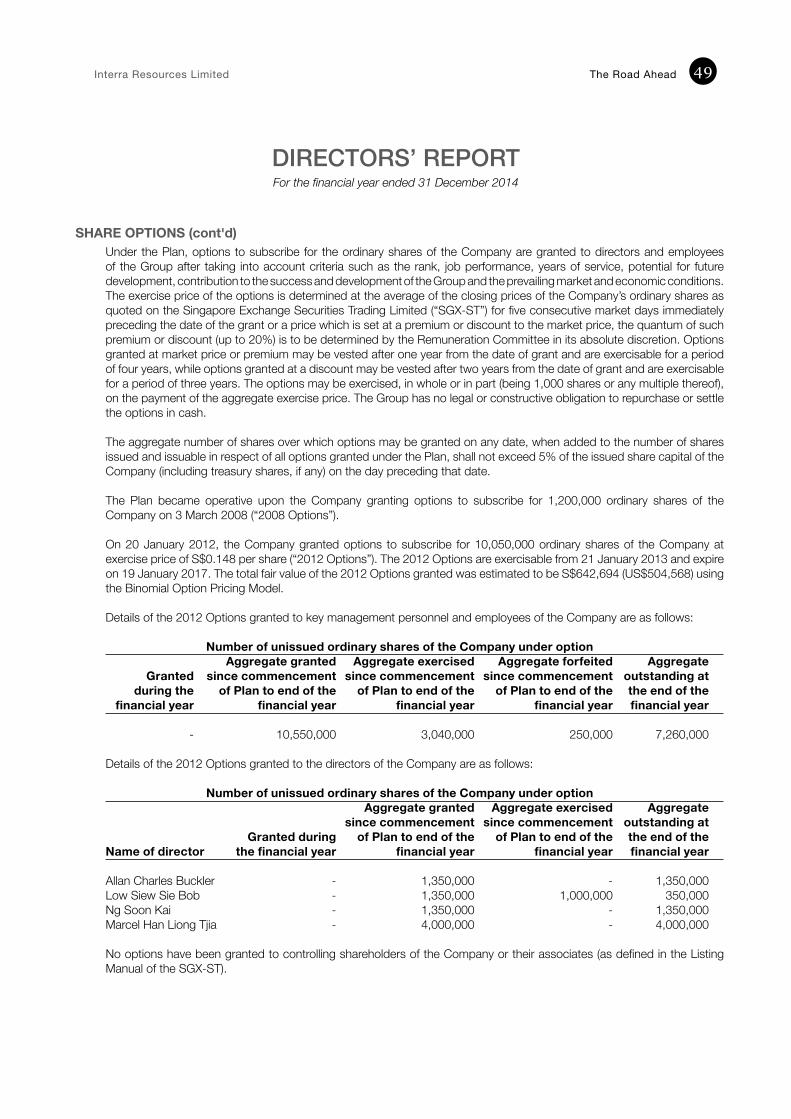
Interra Resources Limited The Road Ahead 49
SHARE OPTIONS (cont'd) Under the Plan, options to subscribe for the ordinary shares of the Company are granted to directors and employees
of the Group after taking into account criteria such as the rank, job performance, years of service, potential for future development, contribution to the success and development of the Group and the prevailing market and economic conditions. The exercise price of the options is determined at the average of the closing prices of the Company’s ordinary shares as quoted on the Singapore Exchange Securities Trading Limited (“SGX-ST”) for five consecutive market days immediately preceding the date of the grant or a price which is set at a premium or discount to the market price, the quantum of such premium or discount (up to 20%) is to be determined by the Remuneration Committee in its absolute discretion. Options granted at market price or premium may be vested after one year from the date of grant and are exercisable for a period of four years, while options granted at a discount may be vested after two years from the date of grant and are exercisable for a period of three years. The options may be exercised, in whole or in part (being 1,000 shares or any multiple thereof), on the payment of the aggregate exercise price. The Group has no legal or constructive obligation to repurchase or settle the options in cash.
The aggregate number of shares over which options may be granted on any date, when added to the number of shares
issued and issuable in respect of all options granted under the Plan, shall not exceed 5% of the issued share capital of the Company (including treasury shares, if any) on the day preceding that date.
The Plan became operative upon the Company granting options to subscribe for 1,200,000 ordinary shares of the
Company on 3 March 2008 (“2008 Options”). On 20 January 2012, the Company granted options to subscribe for 10,050,000 ordinary shares of the Company at
exercise price of S$0.148 per share (“2012 Options”). The 2012 Options are exercisable from 21 January 2013 and expire on 19 January 2017. The total fair value of the 2012 Options granted was estimated to be S$642,694 (US$504,568) using the Binomial Option Pricing Model.
Details of the 2012 Options granted to key management personnel and employees of the Company are as follows:
Number of unissued ordinary shares of the Company under option Aggregate granted Aggregate exercised Aggregate forfeited Aggregate Granted since commencement since commencement since commencement outstanding at
during the of Plan to end of the of Plan to end of the of Plan to end of the the end of the financial year financial year financial year financial year financial year
- 10,550,000 3,040,000 250,000 7,260,000
Details of the 2012 Options granted to the directors of the Company are as follows:
Number of unissued ordinary shares of the Company under option Aggregate granted Aggregate exercised Aggregate since commencement since commencement outstanding at
Granted during of Plan to end of the of Plan to end of the the end of the Name of director the financial year financial year financial year financial year
Allan Charles Buckler - 1,350,000 - 1,350,000Low Siew Sie Bob - 1,350,000 1,000,000 350,000Ng Soon Kai - 1,350,000 - 1,350,000Marcel Han Liong Tjia - 4,000,000 - 4,000,000
No options have been granted to controlling shareholders of the Company or their associates (as defined in the Listing Manual of the SGX-ST).
DIRECTORS’ REPORTForthefinancialyearended31December2014
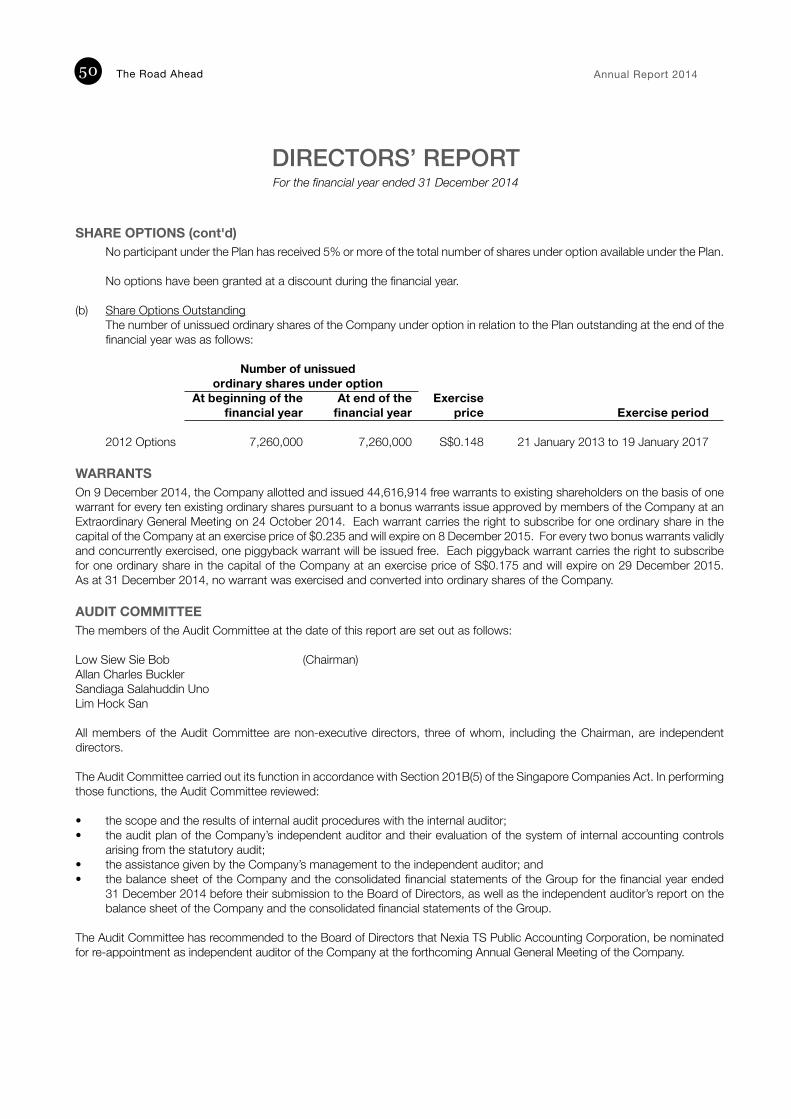
The Road Ahead Annual Report 201450
SHARE OPTIONS (cont'd) No participant under the Plan has received 5% or more of the total number of shares under option available under the Plan.
No options have been granted at a discount during the financial year. (b) Share Options Outstanding The number of unissued ordinary shares of the Company under option in relation to the Plan outstanding at the end of the
financial year was as follows:
Number of unissued ordinary shares under option At beginning of the At end of the Exercise financial year financial year price Exercise period
2012 Options 7,260,000 7,260,000 S$0.148 21 January 2013 to 19 January 2017
WARRANTSOn 9 December 2014, the Company allotted and issued 44,616,914 free warrants to existing shareholders on the basis of one warrant for every ten existing ordinary shares pursuant to a bonus warrants issue approved by members of the Company at an Extraordinary General Meeting on 24 October 2014. Each warrant carries the right to subscribe for one ordinary share in the capital of the Company at an exercise price of $0.235 and will expire on 8 December 2015. For every two bonus warrants validly and concurrently exercised, one piggyback warrant will be issued free. Each piggyback warrant carries the right to subscribe for one ordinary share in the capital of the Company at an exercise price of S$0.175 and will expire on 29 December 2015. As at 31 December 2014, no warrant was exercised and converted into ordinary shares of the Company.
AUDIT COMMITTEEThe members of the Audit Committee at the date of this report are set out as follows:
Low Siew Sie Bob (Chairman)Allan Charles Buckler Sandiaga Salahuddin UnoLim Hock San
All members of the Audit Committee are non-executive directors, three of whom, including the Chairman, are independent directors.
The Audit Committee carried out its function in accordance with Section 201B(5) of the Singapore Companies Act. In performing those functions, the Audit Committee reviewed:
• the scope and the results of internal audit procedures with the internal auditor;• the audit plan of the Company’s independent auditor and their evaluation of the system of internal accounting controls
arising from the statutory audit;• the assistance given by the Company’s management to the independent auditor; and• the balance sheet of the Company and the consolidated financial statements of the Group for the financial year ended
31 December 2014 before their submission to the Board of Directors, as well as the independent auditor’s report on the balance sheet of the Company and the consolidated financial statements of the Group.
The Audit Committee has recommended to the Board of Directors that Nexia TS Public Accounting Corporation, be nominated for re-appointment as independent auditor of the Company at the forthcoming Annual General Meeting of the Company.
DIRECTORS’ REPORTForthefinancialyearended31December2014
Interra Resources Limited The Road Ahead 51
INDEPENDENT AUDITORThe independent auditor, Nexia TS Public Accounting Corporation, has expressed its willingness to accept re-appointment.
On behalf of the Board of Directors
Marcel Han Liong Tjia Low Siew Sie BobDirector Director
25 March 2015
DIRECTORS’ REPORTForthefinancialyearended31December2014
The Road Ahead Annual Report 201452
In the opinion of the directors, (a) the balance sheet of the Company and the consolidated financial statements of the Group as set out on pages 54 to 119
are drawn up so as to give a true and fair view of the state of affairs of the Company and of the Group as at 31 December 2014 and of the results of the business, changes in equity and cash flows of the Group for the financial year then ended; and
(b) at the date of this statement, there are reasonable grounds to believe that the Company will be able to pay its debts as
and when they fall due.
The Board of Directors has, on the date of this statement, authorised these financial statements for issue.
On behalf of the Board of Directors
Marcel Han Liong Tjia Low Siew Sie BobDirector Director
25 March 2015
STATEMENT BY DIRECTORSForthefinancialyearended31December2014
Interra Resources Limited The Road Ahead 53
INDEPENDENT AUDITOR’S REPORTTo the Members of Interra Resources Limited
REPORT ON THE FINANCIAL STATEMENTSWe have audited the accompanying financial statements of Interra Resources Limited (the “Company”) and its subsidiaries (the “Group”) set out on pages 54 to 119, which comprise the consolidated balance sheet of the Group and balance sheet of the Company as at 31 December 2014, the consolidated statement of comprehensive income, statement of changes in equity and statement of cash flows of the Group for the financial year then ended, and a summary of significant accounting policies and other explanatory information.
Management’s Responsibility for the Financial StatementsManagement is responsible for the preparation of financial statements that give a true and fair view in accordance with the provisions of the Singapore Companies Act (the “Act”) and Singapore Financial Reporting Standards, and for devising and maintaining a system of internal accounting controls sufficient to provide a reasonable assurance that assets are safeguarded against loss from unauthorised use or disposition; and transactions are properly authorised and that they are recorded as necessary to permit the preparation of true and fair profit and loss accounts and balance sheets and to maintain accountability of assets.
Auditor’s ResponsibilityOur responsibility is to express an opinion on these financial statements based on our audit. We conducted our audit in accordance with Singapore Standards on Auditing. Those Standards require that we comply with ethical requirements and plan and perform the audit to obtain reasonable assurance about whether the financial statements are free from material misstatement.
An audit involves performing procedures to obtain audit evidence about the amounts and disclosures in the financial statements. The procedures selected depend on the auditor’s judgement, including the assessment of the risks of material misstatement of the financial statements, whether due to fraud or error. In making those risk assessments, the auditor considers internal control relevant to the entity’s preparation of financial statements that give a true and fair view in order to design audit procedures that are appropriate in the circumstances, but not for the purpose of expressing an opinion on the effectiveness of the entity’s internal control. An audit also includes evaluating the appropriateness of accounting policies used and the reasonableness of accounting estimates made by management, as well as evaluating the overall presentation of the financial statements.
We believe that the audit evidence we have obtained is sufficient and appropriate to provide a basis for our audit opinion.
OpinionIn our opinion, the consolidated financial statements of the Group and the balance sheet of the Company are properly drawn up in accordance with the provisions of the Act and Singapore Financial Reporting Standards so as to give a true and fair view of the state of affairs of the Group and of the Company as at 31 December 2014, and of the results, changes in equity and cash flows of the Group for the financial year ended on that date.
REPORT ON OTHER LEGAL AND REGULATORY REQUIREMENTSIn our opinion, the accounting and other records required by the Act to be kept by the Company and by those subsidiaries incorporated in Singapore, of which we are the auditors, have been properly kept in accordance with the provisions of the Act.
Nexia TS Public Accounting CorporationPublic Accountants and Chartered Accountants
Director-in-charge: Chin Chee ChoonAppointed since financial year ended 31 December 2011
Singapore
25 March 2015

The Road Ahead Annual Report 201454
BALANCE SHEETSAsat31December2014
Company Group 2014 2013 2014 2013 Note US$ US$ US$ US$
ASSETS Non-current assetsProperty, plant and equipment 4 55,752 16,154 222,028 16,506Producing oil and gas properties 5 - - 47,206,789 61,346,474Mining properties 6 - - 6,660,574 -Exploration and evaluation assets 7 - - 5,121,123 72,311Intangible assets 8 - - 2,045,349 1,488,902Investments in subsidiaries 9 39,226,061 44,776,089 - -Other receivables 12 - - 318,684 1,531,495Retirement benefit obligations 21 - - 153,680 119,356Restricted cash 14 - - 3,443,691 2,273,948Investment properties 10 - - 226,263 - 39,281,813 44,792,243 65,398,181 66,848,992Current assetsInventories 11 - - 9,430,271 6,135,569Trade and other receivables 12 198,572 139,411 11,951,892 11,410,294Other current assets 13 255,920 82,253 1,317,687 708,486Cash and cash equivalents 14 3,595,621 3,716,476 18,736,660 12,401,632 4,050,113 3,938,140 41,436,510 30,655,981
Total Assets 43,331,926 48,730,383 106,834,691 97,504,973LIABILITIESCurrent liabilitiesTrade and other payables 15 708,404 761,154 12,107,836 8,596,059Bank loan 16 - - 806,998 -Finance lease payable 17 - - 381,957 -Current income tax liabilities 18 16 - 6,787,532 7,568,904 708,420 761,154 20,084,323 16,164,963Non-current liabilitiesProvision for environmental and restoration costs 20 - - 5,286,886 2,715,279Deferred income tax liabilities 22 - - 892,893 - - - 6,179,779 2,715,279
Total Liabilities 708,420 761,154 26,264,102 18,880,242NET ASSETS 42,623,506 47,969,229 80,570,589 78,624,731EQUITYShare capital 23 63,125,113 62,138,007 63,125,113 62,138,007(Accumulated losses)/retained profits (20,866,101) (14,533,272) 26,394,683 33,890,808Other reserves 25 364,494 364,494 (17,881,411) (17,404,084)Equity attributable to owners of the Company 42,623,506 47,969,229 71,638,385 78,624,731 Non-controlling interests 9 - - 8,932,204 -TOTAL EQUITY 42,623,506 47,969,229 80,570,589 78,624,731
Theaccompanyingnotesformanintegralpartofthesefinancialstatements.
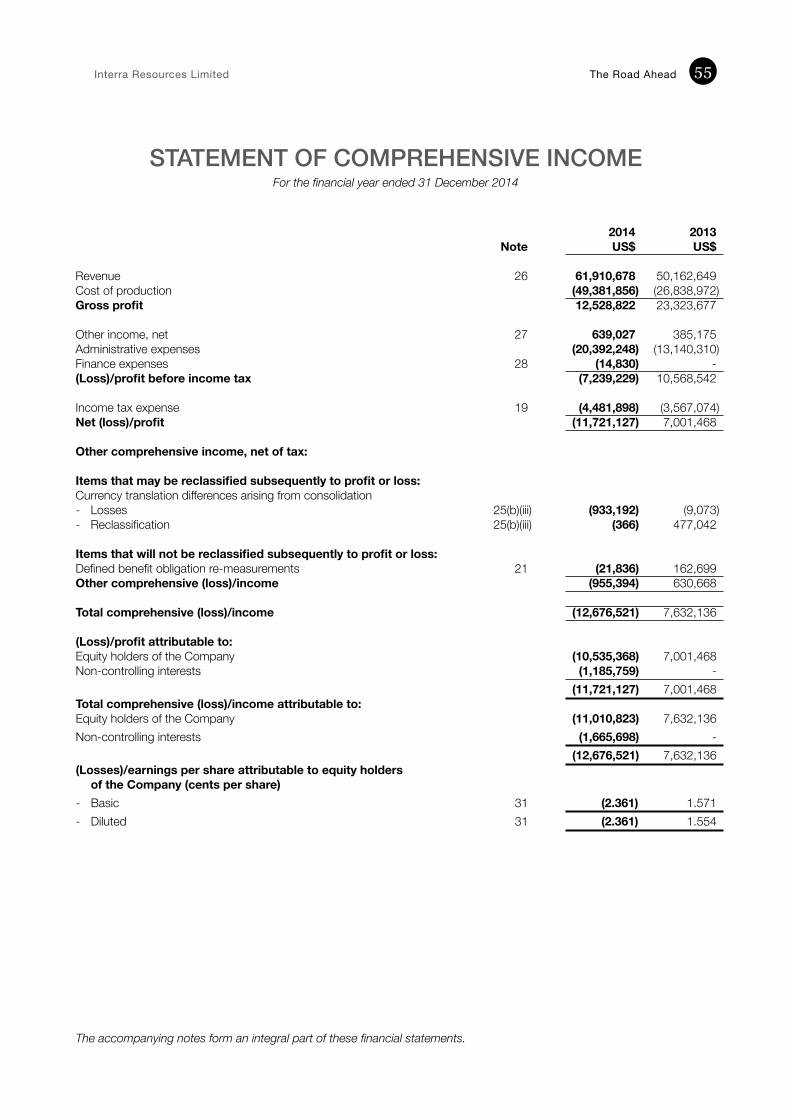
Interra Resources Limited The Road Ahead 55
STATEMENT OF COMPREHENSIVE INCOMEForthefinancialyearended31December2014
2014 2013 Note US$ US$
Revenue 26 61,910,678 50,162,649Cost of production (49,381,856) (26,838,972)Gross profit 12,528,822 23,323,677
Other income, net 27 639,027 385,175Administrative expenses (20,392,248) (13,140,310)Finance expenses 28 (14,830) -(Loss)/profit before income tax (7,239,229) 10,568,542
Income tax expense 19 (4,481,898) (3,567,074)Net (loss)/profit (11,721,127) 7,001,468
Other comprehensive income, net of tax:
Items that may be reclassified subsequently to profit or loss:Currency translation differences arising from consolidation- Losses 25(b)(iii) (933,192) (9,073)- Reclassification 25(b)(iii) (366) 477,042
Items that will not be reclassified subsequently to profit or loss:Defined benefit obligation re-measurements 21 (21,836) 162,699Other comprehensive (loss)/income (955,394) 630,668
Total comprehensive (loss)/income (12,676,521) 7,632,136
(Loss)/profit attributable to:Equity holders of the Company (10,535,368) 7,001,468Non-controlling interests (1,185,759) - (11,721,127) 7,001,468Total comprehensive (loss)/income attributable to:Equity holders of the Company (11,010,823) 7,632,136Non-controlling interests (1,665,698) - (12,676,521) 7,632,136(Losses)/earnings per share attributable to equity holders
of the Company (cents per share)- Basic 31 (2.361) 1.571- Diluted 31 (2.361) 1.554
Theaccompanyingnotesformanintegralpartofthesefinancialstatements.
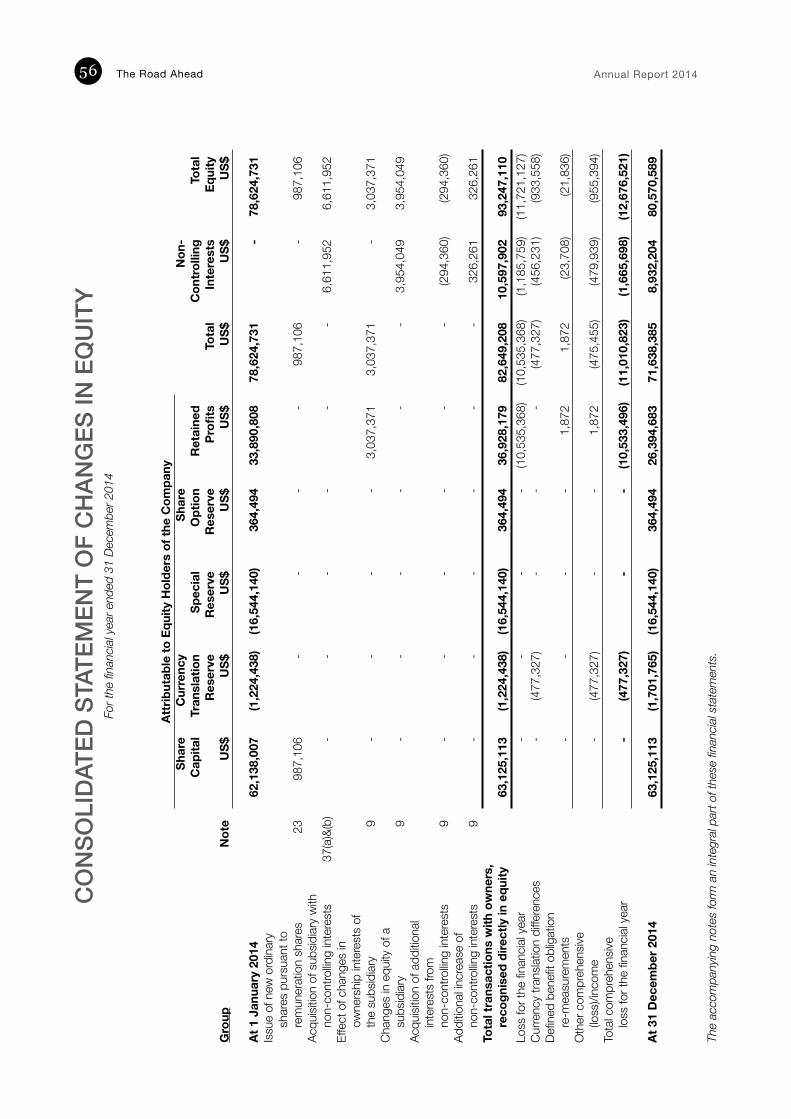
The Road Ahead Annual Report 201456C
ON
SO
LID
ATE
D S
TAT
EM
EN
T O
F C
HA
NG
ES
IN E
QU
ITY
Forthefinancialyearended31De
cember2
014
Theaccompanyingnotesform
anintegralpartofthesefinancia
lstatements.
At
trib
utab
le to
Equ
ity H
olde
rs o
f the
Com
pany
Sh
are
Cur
renc
y
Shar
e
N
on-
C
apita
l Tr
ansl
atio
n Sp
ecia
l O
ptio
n R
etai
ned
C
ontr
ollin
g To
tal
Res
erve
R
eser
ve
Res
erve
Pr
ofits
To
tal
Inte
rest
s Eq
uity
Gro
up
N
ote
US$
U
S$
US$
U
S$
US$
U
S$
US$
U
S$
At 1
Jan
uary
201
4
62
,138
,007
(1
,224
,438
) (1
6,54
4,14
0)
364,
494
33,8
90,8
08
78,6
24,7
31
- 78
,624
,731
Issue
of n
ew o
rdin
ary
shar
es p
ursu
ant t
ore
mun
erat
ion
shar
es
23
987,
106
- -
- -
987,
106
- 98
7,10
6Ac
quisi
tion
of s
ubsid
iary
with
non-
cont
rollin
g in
tere
sts
37(a
)&(b
) -
- -
- -
- 6,
611,
952
6,61
1,95
2Eff
ect o
f cha
nges
inow
ners
hip
inte
rest
s of
the
subs
idiar
y
9
- -
- -
3,03
7,37
1 3,
037,
371
- 3,
037,
371
Chan
ges
in e
quity
of a
subs
idiar
y
9 -
- -
- -
- 3,
954,
049
3,95
4,04
9Ac
quisi
tion
of a
dditio
nal
inte
rest
s fro
mno
n-co
ntro
lling
inte
rest
s 9
- -
- -
- -
(294
,360
) (2
94,3
60)
Addi
tiona
l incr
ease
of
non-
cont
rollin
g in
tere
sts
9 -
- -
- -
- 32
6,26
1 32
6,26
1To
tal t
rans
actio
ns w
ith o
wne
rs,
reco
gnis
ed d
irect
ly in
equ
ity
63
,125
,113
(1
,224
,438
) (1
6,54
4,14
0)
364,
494
36,9
28,1
79
82,6
49,2
08
10,5
97,9
02
93,2
47,1
10Lo
ss fo
r the
fina
ncial
yea
r
- -
- -
(10,
535,
368)
(1
0,53
5,36
8)
(1,1
85,7
59)
(11,
721,
127)
Curre
ncy
trans
latio
n di
ffere
nces
- (4
77,3
27)
- -
- (4
77,3
27)
(456
,231
) (9
33,5
58)
Defin
ed b
enefi
t obl
igat
ion
re-m
easu
rem
ents
-
- -
- 1,
872
1,87
2 (2
3,70
8)
(21,
836)
Oth
er c
ompr
ehen
sive
(loss
)/inc
ome
-
(477
,327
) -
- 1,
872
(475
,455
) (4
79,9
39)
(955
,394
)To
tal c
ompr
ehen
sive
loss
for t
he fi
nanc
ial y
ear
-
(477
,327
) -
- (1
0,53
3,49
6)
(11,
010,
823)
(1
,665
,698
) (1
2,67
6,52
1)
At 3
1 D
ecem
ber 2
014
63,1
25,1
13
(1,7
01,7
65)
(16,
544,
140)
36
4,49
4 26
,394
,683
71
,638
,385
8,
932,
204
80,5
70,5
89
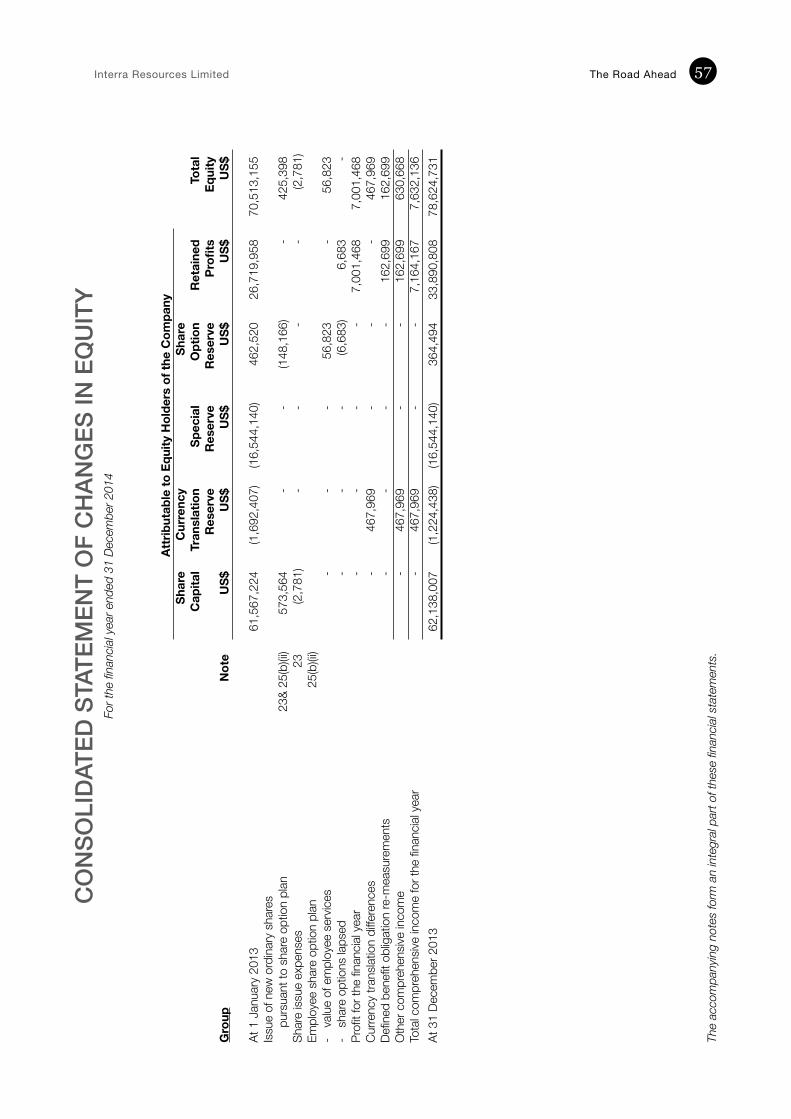
Interra Resources Limited The Road Ahead 57C
ON
SO
LID
ATE
D S
TAT
EM
EN
T O
F C
HA
NG
ES
IN E
QU
ITY
Forthefinancialyearended31De
cember2
014
At
trib
utab
le to
Equ
ity H
olde
rs o
f the
Com
pany
Sh
are
Cur
renc
y
Shar
e
C
apita
l Tr
ansl
atio
n Sp
ecia
l O
ptio
n R
etai
ned
Tota
l
R
eser
ve
Res
erve
R
eser
ve
Profi
ts
Equi
tyG
roup
Not
e U
S$
US$
U
S$
US$
U
S$
US$
At 1
Jan
uary
201
3
61
,567
,224
(1
,692
,407
) (1
6,54
4,14
0)
462,
520
26,7
19,9
58
70,5
13,1
55Iss
ue o
f new
ord
inar
y sh
ares
purs
uant
to s
hare
opt
ion
plan
23
& 25
(b)(ii
) 57
3,56
4 -
- (1
48,1
66)
- 42
5,39
8Sh
are
issue
exp
ense
s
23
(2,7
81)
- -
- -
(2,7
81)
Empl
oyee
sha
re o
ptio
n pl
an
25(b
)(ii)
- va
lue
of e
mpl
oyee
ser
vices
- -
- 56
,823
-
56,8
23-
shar
e op
tions
laps
ed
-
- -
(6,6
83)
6,68
3 -
Profi
t for
the
finan
cial y
ear
-
- -
- 7,
001,
468
7,00
1,46
8Cu
rrenc
y tra
nslat
ion
diffe
renc
es
-
467,
969
- -
- 46
7,96
9De
fined
ben
efit o
blig
atio
n re
-mea
sure
men
ts
- -
- -
162,
699
162,
699
Oth
er c
ompr
ehen
sive
inco
me
-
467,
969
- -
162,
699
630,
668
Tota
l com
preh
ensiv
e in
com
e fo
r the
fina
ncial
yea
r
-
467,
969
- -
7,16
4,16
7 7,
632,
136
At 3
1 De
cem
ber 2
013
62,1
38,0
07
(1,2
24,4
38)
(16,
544,
140)
36
4,49
4 33
,890
,808
78
,624
,731
Theaccompanyingnotesform
anintegralpartofthesefinancia
lstatements.
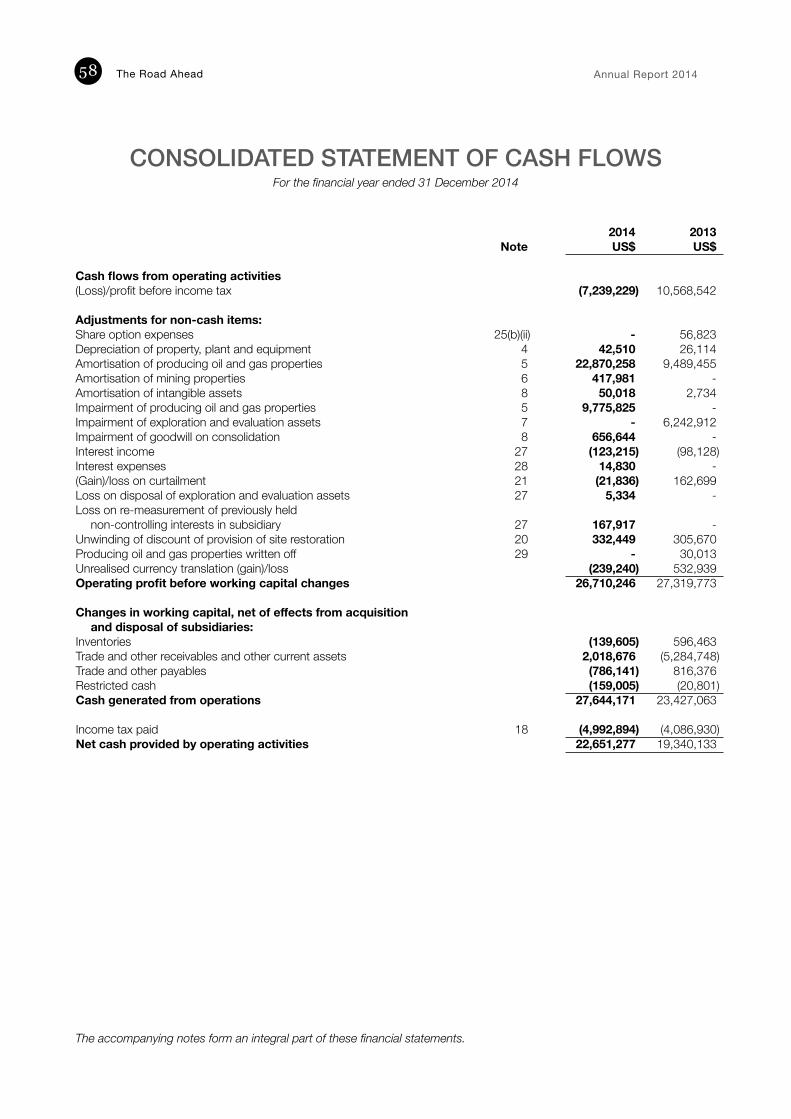
The Road Ahead Annual Report 201458
2014 2013 Note US$ US$ Cash flows from operating activities(Loss)/profit before income tax (7,239,229) 10,568,542
Adjustments for non-cash items: Share option expenses 25(b)(ii) - 56,823Depreciation of property, plant and equipment 4 42,510 26,114Amortisation of producing oil and gas properties 5 22,870,258 9,489,455Amortisation of mining properties 6 417,981 -Amortisation of intangible assets 8 50,018 2,734Impairment of producing oil and gas properties 5 9,775,825 -Impairment of exploration and evaluation assets 7 - 6,242,912Impairment of goodwill on consolidation 8 656,644 -Interest income 27 (123,215) (98,128)Interest expenses 28 14,830 -(Gain)/loss on curtailment 21 (21,836) 162,699Loss on disposal of exploration and evaluation assets 27 5,334 -Loss on re-measurement of previously held
non-controlling interests in subsidiary 27 167,917 -Unwinding of discount of provision of site restoration 20 332,449 305,670Producing oil and gas properties written off 29 - 30,013Unrealised currency translation (gain)/loss (239,240) 532,939Operating profit before working capital changes 26,710,246 27,319,773
Changes in working capital, net of effects from acquisitionand disposal of subsidiaries:
Inventories (139,605) 596,463Trade and other receivables and other current assets 2,018,676 (5,284,748)Trade and other payables (786,141) 816,376Restricted cash (159,005) (20,801)Cash generated from operations 27,644,171 23,427,063
Income tax paid 18 (4,992,894) (4,086,930)Net cash provided by operating activities 22,651,277 19,340,133
CONSOLIDATED STATEMENT OF CASH FLOWSForthefinancialyearended31December2014
Theaccompanyingnotesformanintegralpartofthesefinancialstatements.
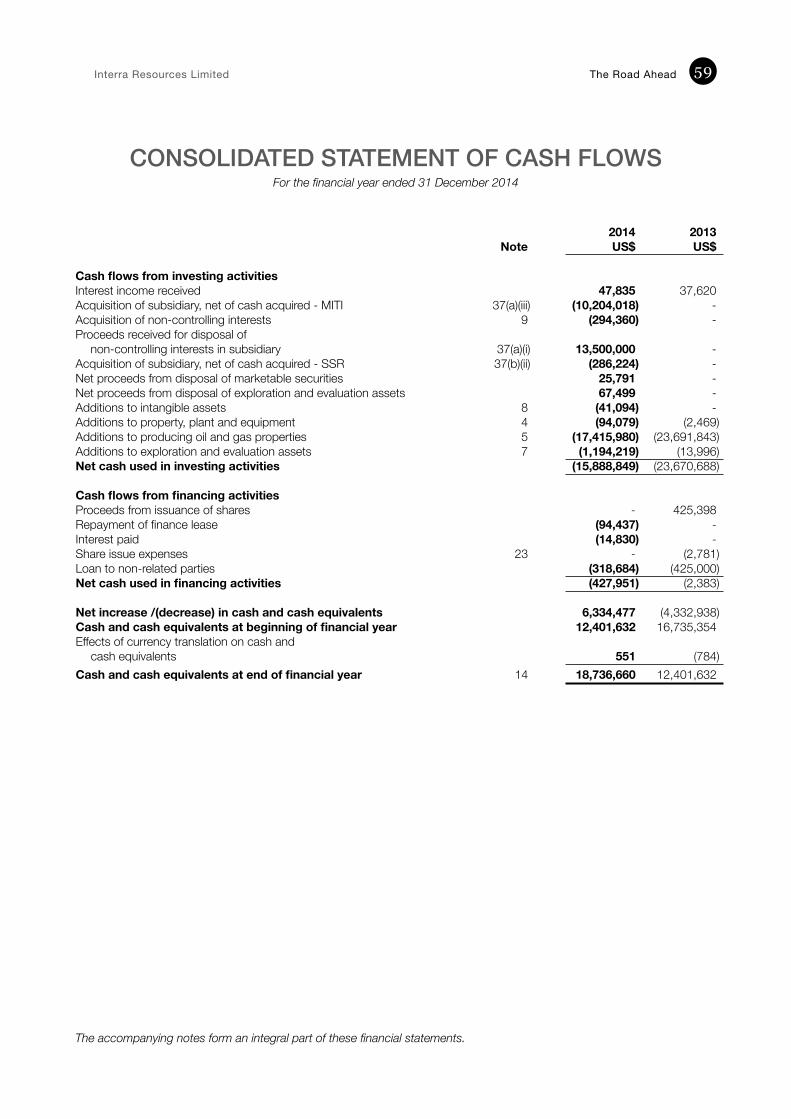
Interra Resources Limited The Road Ahead 59
2014 2013 Note US$ US$ Cash flows from investing activities Interest income received 47,835 37,620Acquisition of subsidiary, net of cash acquired - MITI 37(a)(iii) (10,204,018) -Acquisition of non-controlling interests 9 (294,360) -Proceeds received for disposal of
non-controlling interests in subsidiary 37(a)(i) 13,500,000 -Acquisition of subsidiary, net of cash acquired - SSR 37(b)(ii) (286,224) -Net proceeds from disposal of marketable securities 25,791 -Net proceeds from disposal of exploration and evaluation assets 67,499 -Additions to intangible assets 8 (41,094) -Additions to property, plant and equipment 4 (94,079) (2,469)Additions to producing oil and gas properties 5 (17,415,980) (23,691,843)Additions to exploration and evaluation assets 7 (1,194,219) (13,996)Net cash used in investing activities (15,888,849) (23,670,688) Cash flows from financing activities Proceeds from issuance of shares - 425,398Repayment of finance lease (94,437) -Interest paid (14,830) -Share issue expenses 23 - (2,781)Loan to non-related parties (318,684) (425,000)Net cash used in financing activities (427,951) (2,383)
Net increase /(decrease) in cash and cash equivalents 6,334,477 (4,332,938)Cash and cash equivalents at beginning of financial year 12,401,632 16,735,354Effects of currency translation on cash and
cash equivalents 551 (784)Cash and cash equivalents at end of financial year 14 18,736,660 12,401,632
CONSOLIDATED STATEMENT OF CASH FLOWSForthefinancialyearended31December2014
Theaccompanyingnotesformanintegralpartofthesefinancialstatements.
The Road Ahead Annual Report 201460
NOTES TO THE FINANCIAL STATEMENTSFor the financial year ended 31 December 2014
1. GENERALInterra Resources Limited (the “Company”) is a company incorporated in the Republic of Singapore and is publicly traded on the Singapore Exchange Securities Trading Limited (“SGX-ST”) Mainboard with effect from 10 January 2013. The address of its registered office is at 1 Grange Road #05-04 Orchard Building Singapore 239693. Its Singapore company registration number is 197300166Z.
The principal activity of the Company is that of investment holding.
The principal activities, country of incorporation and place of operation of the subsidiaries of the Company are set out in Note 9 to the financial statements.
During the current financial year, the Group acquired control of PT Mitra Investindo Tbk (“MITI”), a company incorporated in the Republic of Indonesia and is publicly traded on the Indonesia Stock Exchange. The principal activity is to engage in granite mining.
In addition, the Company’s wholly-owned subsidiary, Goldwater KP Pte. Ltd. acquired 100% of the issued and paid up capital of PT Sumber Sari Rejeki (“SSR”) and its subsidiary, PT Pambuang Investindo (“PI”), a company incorporated in the Republic of Indonesia. PI owns 67.5% issued and paid up capital of PT Mentari Pambuang Internasional (“MPI”). The principal activities of SSR and PI are wholesale trading of photographic equipment and optical goods and multi-industry business sector respectively. The principal activities of MPI are exploration and operation of oil fields for crude petroleum production.
The consolidated financial statements relate to the Company and its subsidiaries (the “Group”) and the Group’s interests in joint operations.
2. SUMMARY OF SIGNIFICANT ACCOUNTING POLICIESThe significant accounting policies which have been consistently applied in the preparation of the financial statements of the Group and of the Company are as follows:
(a) Basis of Preparation
The financial statements have been prepared in accordance with the Singapore Financial Reporting Standards (“FRS”). The financial statements are prepared in accordance with the historical cost convention except as disclosed in the accounting policies below.
The preparation of financial statements in conformity with FRS requires management to exercise its judgement in the process of applying the Group’s accounting policies. It also requires the use of certain critical accounting estimates and assumptions. The areas which involve a higher degree of judgement or complexity, or areas where assumptions and estimates are significant to the financial statements are disclosed in Note 3.
Interpretations and amendments to published standards effective in 2014
On 1 January 2014, the Group adopted the new and amended FRS and Interpretations to FRS (“INT FRS”) that are mandatory for application for the financial year. Changes to the Group’s accounting policies have been made as required, in accordance with the transitional provisions in the respective FRS and INT FRS.
The adoption of the following new or amended FRS and INT FRS did not result in substantial changes to the Group’s and the Company’s accounting policies and had no material effect on the amounts reported for the current or prior financial years:
Interra Resources Limited The Road Ahead 61
NOTES TO THE FINANCIAL STATEMENTSFor the financial year ended 31 December 2014
2. SUMMARY OF SIGNIFICANT ACCOUNTING POLICIES (cont’d) (a) Basis of Preparation (cont’d)
FRS 27 (revised 2011) – Separate Financial StatementsFRS 28 (revised 2011) - Investments in Associates and Joint VenturesAmendments to FRS 32 - Financial Instruments: Offsetting Financial Assets and Financial LiabilitiesAmendments to FRS 36 - Recoverable Amount Disclosures for Non-Financial AssetsAmendments to FRS 39 - Novation of Derivatives and Continuation of Hedge AccountingFRS 110 - Consolidated Financial StatementsFRS 111 - Joint ArrangementsFRS 112 - Disclosure of Interests in Other EntitiesAmendments to FRS 110, FRS 111, FRS 112, FRS 27 (2011) and FRS 28 (2011) - Mandatory Effective DateAmendments to FRS 110, FRS 111 and FRS 112 - Transition GuidanceAmendments to FRS 110, FRS 111, FRS 112 and FRS 27 - Investment Entities
FRS 111 Joint Arrangements
From 1 January 2014, as a result of FRS 111 Joints Arrangements, the Group has changed its accounting policy for its interests in joint arrangements. Under FRS 111, the Group has classified its interests in joint arrangements as either joint operations (if the Group has rights to the assets, and obligations for the liabilities, relating to an arrangement) or joint ventures (if the Group has rights only to the net assets of an arrangement). When making this assessment, the Group considered the structure of the arrangements, the legal form of any separate vehicles, the contractual terms of the arrangements and other facts and circumstances. Previously, the structure of the arrangement was the sole focus of classification.
The Group has re-evaluated its involvement in its only joint arrangement and has reclassified the investment from a jointly controlled entity to joint operations. Notwithstanding the reclassification, the investment continues to be recognised by applying its interest in the joint operations and there has been no impact on the recognised assets, liabilities and comprehensive income of the Group.
FRS 112 Disclosures of Interests in Other Entities
The Group has adopted the above new FRS on 1 January 2014. The amendment is applicable for annual periods beginning on or after 1 January 2014. It sets out the required disclosures for entities reporting under the new FRS 110 Consolidated Financial Statements and FRS 111 Joint Arrangements, and replaces the disclosure requirements currently found in FRS 27 (revised 2011) Separate Financial Statements and FRS 28 (revised 2011) Investments in Associates and Joint Ventures.
The Group has applied FRS 112 retrospectively in accordance with the transitional provisions (as amended subsequent to the issuance of FRS 112 in September 2011) in FRS 112 and amended for consolidation exceptions for “investment entity” from 1 January 2014. The Group has incorporated the additional required disclosures into the financial statements.
The Road Ahead Annual Report 201462
NOTES TO THE FINANCIAL STATEMENTSFor the financial year ended 31 December 2014
2. SUMMARY OF SIGNIFICANT ACCOUNTING POLICIES (cont’d) (b) Group Accounting
(i) SubsidiariesSubsidiaries are entities (including special structured entities) over which the Group has controls. The Group controls an entity when the Group is exposed to, or has rights to, variable returns from its involvement with the entity and has the ability to affect those returns through its power over the entity. The existence and effect of potential voting rights that are currently exercisable or convertible are considered when assessing whether the Group controls another entity. Subsidiaries are consolidated from the date on which control is fully transferred to the Group. They are deconsolidated from the date on the control ceases.
In preparing the consolidated financial statements, transactions, balances and unrealised gains on transactions between group entities are eliminated. Unrealised losses are also eliminated but are considered an impairment indicator of the asset transferred. Accounting policies of subsidiary has been changed where necessary to ensure consistency of the policies adopted by the Group.
Non-controlling interests comprise the portion of a subsidiary’s net results of operations and its net assets, which is attributable to the interests that are not owned directly or indirectly by the equity holders of the Company. They are shown separately in the consolidated statement of comprehensive income, statement of changes in equity, and balance sheet. Total comprehensive income is attributed to the non-controlling interests based on their respective interests in a subsidiary, even if this results in the non-controlling interests having a deficit balance.
Investment in a subsidiary is stated in the Company’s balance sheet at cost less impairment losses. On disposal of such investment, the difference between disposal proceeds and the carrying amount of the investment is recognised in profit or loss.
(ii) Acquisition of SubsidiariesThe acquisition method of accounting is used to account for business combinations entered into by the Group.
The consideration transferred for the acquisition of a subsidiary or business comprises the fair value of the assets transferred, the liabilities incurred and the equity interests issued by the Group. The consideration transferred also includes any contingent consideration arrangement and any pre-existing equity interest in the subsidiary measured at their fair values at the acquisition date.
Acquisition-related costs are expensed as incurred. Identifiable assets acquired, and liabilities and contingent liabilities assumed in a business combination are, with limited exceptions, measured initially at their fair values at the acquisition date.
On an acquisition-by-acquisition basis, the Group recognises any non-controlling interests in the acquiree at the date of acquisition either at fair value or at the non-controlling interest’s proportionate share of the acquiree’s identifiable net assets.
If the business combination is achieved in stages, the acquisition date carrying value of acquirer’s previously held equity, interest in the acquire is re-measured to fair value at the acquisition date, any gains or losses arising from such re-measurement are recognised in profit and loss.
Any contingent consideration to be transferred by the Group is recognised at fair value at the acquisition date. Subsequent changes to the fair value of the contingent consideration that is deemed to the asset or liability is recognised in accordance with FRS 39 Financial Instruments Recognition and Measurement either in profit or loss or as a change to other comprehensive income. Contingent consideration that is classified as equity is not re-measured, and its subsequent settlement is accounted for within equity.
Interra Resources Limited The Road Ahead 63
NOTES TO THE FINANCIAL STATEMENTSFor the financial year ended 31 December 2014
2. SUMMARY OF SIGNIFICANT ACCOUNTING POLICIES (cont’d) (b) Group Accounting (cont’d)
The excess of the consideration transferred the amount of any non-controlling interests in the acquiree and the acquisition date fair value of any previous equity interest in the acquiree over the fair value of the net identifiable assets acquired is recorded as goodwill. Please refer to the paragraph “Intangible assets - Goodwill” for the subsequent accounting policy on goodwill.
(iii) Transactions with Non-Controlling InterestsTransactions with non-controlling interests that do not result in loss of control are accounted for as equity transactions – that is, as transactions with the owners in their capacity as owners. The difference between fair value of any consideration paid and the relevant share acquired of the carrying value of net assets of the subsidiary is recorded in equity attributable to the equity holders of the Company.
(iv) Disposal of SubsidiariesWhen a change in the Group’s ownership interest in a subsidiary results in a loss of control over the subsidiary, the assets and liabilities of the subsidiary including any goodwill are de-recognised. Amounts previously recognised in other comprehensive income in respect of that entity are also reclassified to profit or loss or transferred directly to retained profits if required by a specific Standard.
Any retained equity interest in the entity is re-measured at fair value. The difference between the carrying amount of the retained interest at the date when control is lost and its fair value is recognised in profit or loss.
(v) Reverse Acquisition Consolidated financial statements prepared following a reverse acquisition are issued under the name of the legal parent (accounting acquire) but described in the notes as a continuation of the financial statements of the legal subsidiary (accounting acquirer), with one adjustment, which is to adjust retroactively the accounting acquirer’s legal capital to reflect the legal capital of the accounting acquiree.
Because the consolidated financial statements represent the continuation of the financial statements of the legal subsidiary except for its capital structure, the consolidated financial statements reflect:
• the assets and liabilities of the legal subsidiary (the accounting acquirer) recognised and measured at their pre-combination carrying amounts.
• the assets and liabilities of the legal parent (the accounting acquire) are recognised at fair value and measured in accordance with FRS 103 Business Combination.
• the retained profits and other equity balances of the legal subsidiary (the accounting acquirer) before the business combination.
• the amount recognised as issued equity interests in the consolidated financial statements is determined by adding the issued equity interest of the legal subsidiary (the accounting acquirer) outstanding immediately before the business combination to cost of reverse acquisition determined in accordance with FRS 103. However, the equity structure (i.e. the number and type of equity interests issued) reflects the equity structure of the legal parent (the accounting acquire), including the equity interests the legal parent issued to effect the combination. Accordingly, the equity structure of the legal subsidiary (the accounting acquirer) is restated using the exchange ratio established in the acquisition agreement to reflect the number of shares of the legal parent (the accounting acquire) issued in the reverse acquisition.
The Road Ahead Annual Report 201464
NOTES TO THE FINANCIAL STATEMENTSFor the financial year ended 31 December 2014
2. SUMMARY OF SIGNIFICANT ACCOUNTING POLICIES (cont’d) (b) Group Accounting (cont’d)
(vi) Joint OperationsThe Group’s joint operations are joint arrangements whereby the parties (the joint operators) that have joint control of the arrangement have rights to the assets, and obligations to the liabilities, relating to the arrangement.
The Group recognises, in relation to its interest in the joint operation:• its assets, including its share of any assets held jointly;• its liabilities, including its share of any liabilities incurred jointly;• its revenue from the sale of its share of the output arising from the joint operation;• its share of the revenue from the sale of the output by the joint operation; and• its expenses, including its share of any expenses incurred jointly.
When the Group sells or contributes assets to a joint operation, the Group recognises gains or losses on the sale or contribution of assets that is attributable to the interest of the other joint operators. The Group recognises the full amount of any loss when the sale or contribution of assets provides evidence of a reduction in the net realisable value, or an impairment loss, of those assets.
When the Group purchases assets from a joint venture, it does not recognise its share of the profits of the joint ventures arising from the Group’s purchase of assets until it resells the assets to an independent party. However, a loss on the transaction is recognised immediately if the loss provides evidence of a reduction in the net realisable value of current assets or an impairment loss.
The accounting policies of the assets, liabilities, revenues and expenses relating to the Group’s interest in a joint operation have been changed where necessary to ensure consistency with the accounting policies adopted by the Group.
(c) Producing Oil and Gas Properties/Mining Properties
The Group applies successful efforts method of accounting for exploration and evaluation costs, having regard to the requirements of FRS 106 Exploration for and Evaluation of Mineral Resources.
(i) Exploration and Evaluation PhaseExploration and evaluation activity involves the search for hydrocarbon resources, the determination of technical feasible and the assessment of commercial viability of an identified resource.
Exploration and evaluation costs are accumulated in respect of each area of interest. Exploration and evaluation costs include the cost of acquisition, drilling, seismic, technical evaluation and feasibility studies, stripping costs and include manpower and associated overhead charges incurred during the initial study period.
Costs of evaluation and unsuccessful exploration in areas of interest where economically recoverable reserves do not currently exist (or is held under Retention Lease or equivalent) are expensed as incurred even if facilities in this area of interest are continuing. When an area of interest is abandoned or decided by the directors that it is not commercially viable, any accumulated costs in respect of that area are written off in the financial period when the decision is made. Each area of interest is also subject to technical, commercial and management review, as well as review for indicators of impairment at least once a year and its accumulated costs are written off to the extent that they will not be recoverable or impaired when proved reserves of oil and natural gas are identified and development is sanctioned by management due to unavailability of technical resources from development in near future. Each potential or recognised area of interest is evaluated as and when management deems there are indications of significant change in the oil or mining reserves.
Interra Resources Limited The Road Ahead 65
NOTES TO THE FINANCIAL STATEMENTSFor the financial year ended 31 December 2014
2. SUMMARY OF SIGNIFICANT ACCOUNTING POLICIES (cont’d) (c) Producing Oil and Gas Properties/Mining Properties (cont’d)
Exploration and evaluation costs are carried forward to where the right to tenure of the area of interest is current and they are expected to be recouped through successful development and exploitation of the area of interest, or where activities in the area of interest have not yet reached a stage that allows reasonable assessment of the existence of economically recoverable reserves. If commercial reserves have been discovered, the carrying value, after the impairment loss of the relevant exploration and evaluation costs, is then reclassified as development and production assets.
Exploration and evaluation assets are transferred to mines under development in the mining properties after the mines are determined to be economically viable to be developed.
(ii) Development and Production PhaseDevelopment costs are incurred within an area of interest as a component of a commercial development phase only upon its commitment to a commercial development.
Expenditure on the construction, installation or completion of infrastructure facilities such as platforms, pipelines and the drilling of commercially proven development wells, is capitalised within development and production assets and development tangible assets according to the nature.
The cost of development and production assets are capitalised as completed wells and related facilities when drilling or construction is completed. Uncompleted wells and related facilities are not amortised as these assets are not yet available for use.
Mine development costs and acquisition costs in developing an area of interest subsequent to the transfer from exploration and evaluation assets but prior to the commencement of production stage in the respective area, as long as they meet the recognition criteria are capitalised to mines under development. The stripping costs incurred during the production phrase of a mine are accounted for as variable production costs and are included in the costs of inventories produced during the period that the stripping costs are incurred.
(iii) Development Tangible AssetsDevelopment tangible assets are stated at cost less accumulated depreciation and accumulated impairment losses. The cost of an asset comprises its purchase price and any directly attributable costs of bringing the asset to working condition for its intended use. When assets are sold or retired, their cost and accumulated depreciation are removed from the financial statements and any gain or loss resulting from their disposal is included in profit or loss.
Subsequent expenditure relating to an asset that has already been recognised is added to the carrying amount of the asset only when it is probable that future economic benefits associated with the item will flow to the Group and the cost of the item can be measured reliably. All other repair and maintenance expenses are recognised in profit or loss when incurred.

The Road Ahead Annual Report 201466
NOTES TO THE FINANCIAL STATEMENTSFor the financial year ended 31 December 2014
2. SUMMARY OF SIGNIFICANT ACCOUNTING POLICIES (cont’d)(c) Producing Oil and Gas Properties/Mining Properties (cont’d)
(iv) Amortisation/DepreciationAmortisation is not charged on costs carried forward in respect of areas of interest in the development phase until production commences. When production commences, carried forward development and production assets are amortised on the units of production basis over the life of the economically recoverable reserves.
Depreciation of development tangible assets is calculated on a straight-line basis so as to write off the costs of these assets over their respective estimated useful life as follows:
Oil and gas tangible assets 2 to 4 yearsMining tangible assets 8 to 20 years
Fully depreciated assets are retained in the financial statements until they are no longer in use.
The residual values, estimated useful lives and depreciation method of development tangible assets are reviewed, and adjusted as appropriate, at each balance sheet date. The effects of any revision are recognised in profit or loss when the changes arise.
(v) ImpairmentDevelopment and production assets and development tangible assets are reviewed for impairment whenever events or changes in circumstances indicate that the carrying amount may not be recoverable. An impairment loss is recognised for the amount by which the asset’s carrying amount exceeds its recoverable amount. The recoverable amount is the higher of an asset’s fair value less costs to sell and value in use. For the purposes of assessing impairment, assets are grouped at the lowest cash-generating units (“CGU”) for which there are separately identifiable cash flows.
When estimating these future cash flows, the Group makes reasonable and supportable assumptions based on a range of economic conditions that will exist over the remaining useful life of the asset. Although these estimates are based on management’s best knowledge of current events and actions, actual results may ultimately differ from these estimates.
An impairment loss is recognised in profit or loss whenever the carrying amount of an asset or its CGU is estimated to exceed its recoverable amount.
An impairment loss for an asset is reversed only if there has been a change in the estimates used to determine the asset’s recoverable amount since the last impairment loss was recognised. The carrying amount of an asset is increased to its revised recoverable amount, provided that this amount does not exceed the carrying amount that would have been determined (net of accumulated amortisation or depreciation) had no impairment loss been recognised for the asset in prior years. A reversal of impairment loss for an asset is recognised in profit or loss. However, to the extent that an impairment loss on the same revalued asset was previously recognised as an expense, a reversal of that impairment is also recognised to profit or loss.
(vi) Participating Rights for Technical Assistance Contract for Tanjung Miring Timur (“TAC TMT”) and Linda Sele (“TAC LS”)/Participating Rights for Production Sharing Contract for Kuala Pambuang (“PSC KP”)Participating rights represent the excess of the fair value of the identifiable assets acquired and the liabilities assumed over the cost of acquisition of the 100% participating interest in the TAC TMT, 100% participating interest in the TAC LS and 67.5% participating interest in the PSC KP.
Interra Resources Limited The Road Ahead 67
NOTES TO THE FINANCIAL STATEMENTSFor the financial year ended 31 December 2014
2. SUMMARY OF SIGNIFICANT ACCOUNTING POLICIES (cont’d)(c) Producing Oil and Gas Properties/Mining Properties (cont’d)
Participating rights are amortised on a straight-line basis from the date of initial recognition over the remaining period of TACs. The remaining period of TAC TMT is 5.10 years from 25 November 2011 to 31 December 2016. The remaining period of TAC LS is 7.90 years from 24 January 2011 to 16 November 2018. No amortisation is charged for PSC KP during the exploration and evaluation phrase.
(vii) Concession RightsConcession rights refer to the amount paid to acquire the interest in Improved Petroleum Recovery Contracts (“IPRCs”). Concession rights are capitalised and amortised on a straight-line basis over the remaining life of IPRCs of approximately 14 years from 1 March 2003 to 31 March 2017.
(d) Intangible Assets
(i) Goodwill on Reverse AcquisitionGoodwill arising from reverse acquisition represents the excess of the deemed cost of acquisition over the fair value of the Group’s share of the identifiable net assets acquired. Goodwill is tested for its impairment at least annually or more frequently if events or changes in circumstances indicate that the goodwill may be impaired.
(ii) Goodwill on ConsolidationGoodwill on acquisitions of subsidiaries and businesses on or after 1 January 2010 represents the excess of (i) the sum of the consideration transferred, the amount of any non-controlling interest in the acquire and the acquisition-date fair value of any previous equity interest in the acquiree over (ii) the fair value of the identifiable net assets acquired.
Goodwill on acquisition of subsidiaries and businesses prior to 1 January 2010 and on acquisition of joint ventures and associated companies represents the excess of the cost of the acquisition over the fair value of the Group’s share of the identifiable net assets acquired.
Goodwill on subsidiaries is recognised separately as intangible assets and carried at cost less accumulated impairment losses.
Gains and losses on the disposal of subsidiaries include the carrying amount of goodwill relating to the entity sold, except for goodwill arising from acquisitions prior to 1 January 2001. Such goodwill was adjusted against retained profits in the year of acquisition and is not recognised in profit or loss on disposal.
(iii) Computer SoftwareComputer software is capitalised initially at cost which includes the purchase prices (net of any discounts and rebates) and other directly attributable costs and are subsequently carried at cost less accumulated amortisation and impairment losses. The cost is amortised on a straight-line basis over its useful life of 3 to 4 years.
(iv) Non-contractual Customer Relationship
Non-contractual customer relationship acquired in a business combination is initially recognised at cost and is subsequently carried at cost less accumulated amortisation and accumulated impairment losses. These costs are amortised to the profit or loss using the straight-line basis over the remaining period of mine permit of 4.79 years.
The amortisation period and method of computer software and non-contractual customer relationship are reviewed at least at each balance sheet date. The effects of any revision are recognised in profit or loss when the changes arise.
The Road Ahead Annual Report 201468
NOTES TO THE FINANCIAL STATEMENTSFor the financial year ended 31 December 2014
2. SUMMARY OF SIGNIFICANT ACCOUNTING POLICIES (cont’d) (e) Property, Plant and Equipment
Property, plant and equipment is stated at cost less accumulated depreciation and accumulated impairment losses. The cost of an asset comprises its purchase price and any directly attributable costs of bringing the asset to working condition for its intended use. When assets are sold or retired, their costs and accumulated depreciation are removed from the financial statements and any gain or loss resulting from their disposal is included in profit or loss.
Subsequent expenditure relating to property, plant and equipment that has already been recognised is added to the carrying amount of the asset only when it is probable that future economic benefits associated with the item will flow to the Group and the cost of the item can be measured reliably. All other repair and maintenance expenses are recognised in profit or loss when incurred.
On disposal of an item of property, plant and equipment, the difference between the disposal proceeds and its carrying amount is recognised in profit or loss.
Depreciation
Depreciation is calculated for all property, plant and equipment on a straight-line basis so as to write off the costs of these assets over their respective estimated useful lives as follows:
Computers 3 yearsOffice equipment 3 yearsRenovations, furniture and fittings 2 to 3 yearsMotor vehicles 4 to 8 years
The residual values, estimated useful lives and depreciation method of property, plant and equipment are reviewed, and adjusted as appropriate, at each balance sheet date. The effects of any revision are recognised in profit or loss when the changes arise.
(f) Investment Properties
Investment properties include those portions of office buildings that are held for long-term rental yields and/or for capital appreciation and land under operating leases that is held for long-term capital appreciation or for a currently indeterminate use. Investment properties include properties that are being constructed or developed for future use as investment properties.
Investment properties are initially recognised at cost and subsequently carried at fair value, determined annually by independent professional valuers on the highest and best use basis. Changes in fair values are recognised in profit or loss.
Investment properties are subject to renovations or improvements at regular intervals. The cost of major renovations and improvements is capitalised and the carrying amounts of the replaced components are recognised in profit or loss. The cost of maintenance, repairs and minor improvements is recognised in profit or loss when incurred.
On disposal of an investment property, the difference between the disposal proceeds and the carrying amount is recognised in profit or loss.
Interra Resources Limited The Road Ahead 69
NOTES TO THE FINANCIAL STATEMENTSFor the financial year ended 31 December 2014
2. SUMMARY OF SIGNIFICANT ACCOUNTING POLICIES (cont’d)(g) Impairment of Non-financial Assets other than Producing Oil and Gas Properties/Mining Properties
(i) GoodwillGoodwill is reviewed for impairment whenever there is an indication of impairment and at least once a year.
For the purpose of impairment testing of goodwill, goodwill is allocated to each of the Group’s cash-generating units (“CGU”) which are expected to benefit from the synergies of the business combinations. An impairment loss is recognised in profit or loss when the carrying amount of the CGU, including the goodwill, exceeds the recoverable amount of the CGU. The recoverable amount of the CGU is the higher of the CGU’s fair value less cost to sell and value-in-use. The total impairment loss is allocated first to reduce the carrying amount of goodwill allocated to the CGU and then to the other assets of the CGU pro-rata on the basis of the carrying amount of each asset in the CGU.
An impairment loss on goodwill is recognised as an expense and is not reversed in subsequent periods.
(ii) Other Non-Financial AssetsOther non-financial assets including intangible assets, property, plant and equipment, and investments in subsidiaries are reviewed for impairment whenever there is any objective evidence or indication that these assets may be impaired.
For the purpose of impairment testing of these assets, the recoverable amount (i.e. the higher of the fair value less cost to sell and the value-in-use) is determined on an individual asset basis unless the asset does not generate cash inflows that are largely independent of those from other assets. If that is the case, the recoverable amount is determined for the CGU to which the asset belongs. When estimating these future cash flows, management makes reasonable and supportable assumptions based on a range of economic conditions that will exist over the remaining useful life of the asset. Although these estimates are based on management’s best knowledge of current events and actions, actual results may ultimately differ from these estimates.
An impairment loss is recognised in profit or loss whenever the carrying amount of an asset or its CGU is estimated to exceed its recoverable amount.
The difference between the carrying amount and recoverable amount is recognised as an impairment loss in profit or loss, unless the asset is carried at revalued amount, in which case, such impairment loss is treated as a revaluation decrease.
An impairment loss for these assets is reversed only if there has been a change in the estimates used to determine the asset’s recoverable amount since the last impairment loss was recognised. The carrying amount of these assets is increased to its revised recoverable amount, provided that this amount does not exceed the carrying amount that would have been determined (net of any accumulated amortisation or depreciation) had no impairment loss been recognised for the asset in prior years. A reversal of impairment loss for an asset recognised other than goodwill is recognised in profit or loss. However, to the extent that an impairment loss on the same revalued asset was previously recognised as an expense, a reversal of that impairment is also recognised to profit or loss.
(h) Payables
Trade and other payables represent liabilities for goods and services provided to the Group prior to the end of the financial year which are unpaid. They are classified as current liabilities if payment is due within one year or less (or in normal operating cycle of the business if longer). If not, they are presented as non-current liabilities.
Trade and other payables are initially measured at fair value, and subsequently measured at amortised cost using effective interest method.
The Road Ahead Annual Report 201470
NOTES TO THE FINANCIAL STATEMENTSFor the financial year ended 31 December 2014
2. SUMMARY OF SIGNIFICANT ACCOUNTING POLICIES (cont’d)(i) Provisions
(i) GeneralA provision is recognised in the balance sheet when the Company or the Group has a legal constructive obligation as a result of a past event, and it is probable that an outflow of economic benefits will be required to settle the obligation.
A provision for onerous contracts is recognised when the expected benefits from a contract are lower than the unavoidable cost of meeting the obligations under the contract.
(ii) Environmental Expenditures and LiabilitiesOil and Gas
Environmental expenditures that relate to current or future revenues and expensed or capitalised as appropriate. Expenditures that relate to an existing condition caused by past operations and do not contribute to current or future earnings as expensed.
Liabilities for environmental costs are recognised when a clean-up is probable and the associated costs can be reliably estimated. Generally the timing of recognition of these provisions coincides with the commitment to formal plan and action or, if earlier, on divestment or on closure of inactive site. The amount recognised is the best estimate of the expenditure required. If the effect of the time value of money is material, the amount recognised is the present value of the estimated future expenditure.
Granite
Restoration, rehabilitation and environmental expenditure incurred during the production phase of operations are charged as part of the cost of production.
The Group has certain obligations for restoration and rehabilitation of mining areas and retirement of assets following the completion of production. In determining whether a liability exists in respect of such requirements, the Group refers to the criteria for such liability recognition under the applicable accounting standards. The amount of the obligation is calculated using the units of production method over the life of the mine in order to obtain sufficient amount to meet those obligations once production has been completed. Changes in estimated restoration and environmental expenditure to be incurred are accounted for on a prospective basis over the remaining life of the mine.
(j) Income Taxes
(i) Current Income TaxCurrent income tax liabilities (and assets) for current and prior periods are recognised at the amounts expected to be paid to (or recovered from) the tax authorities.
(ii) Deferred Income TaxDeferred income tax is recognised for all temporary difference except when the deferred income tax arises from the initial recognition of an asset or liability affects neither accounting nor taxable profit or loss at the time of the transaction.
A deferred income tax liability is recognised on temporary differences arising on investments in subsidiaries and joint ventures, except where the Group is able to control the timing of the reversal of the temporary difference and it is probable that the temporary difference will not reverse in the foreseeable future.
A deferred income tax asset is recognised to the extent it is probable that future taxable profit will be available against which the deductible temporary differences and tax losses can be utilised.
Interra Resources Limited The Road Ahead 71
NOTES TO THE FINANCIAL STATEMENTSFor the financial year ended 31 December 2014
2. SUMMARY OF SIGNIFICANT ACCOUNTING POLICIES (cont’d)(j) Income Taxes (cont'd)
Current and deferred income taxes are measured using the tax rates and tax laws that have been enacted or substantially enacted by the balance sheet date and are recognised as income or expenses in profit or loss for the period, except to the extent that the tax arising from a business combination or a transaction is recognised directly in equity.
Deferred income tax is also measured based on the tax consequence that will follow from the manner in which the Group expects, at the balance sheet date, to recover or settle the carrying amounts of its assets and liabilities.
(k) Borrowings and Finance Costs
Borrowings are initially recognised at fair value (net of transaction costs) and subsequently carried at amortised cost. Any difference between the proceeds (net of transaction costs) and the redemption value is recognised in profit or loss over the period of borrowings using effective interest method.
Borrowings are presented as current liabilities unless the Group has an unconditional right to defer settlement for at least 12 months after the balance sheet date.
Interest expense and similar charges are expensed in profit or loss in the period in which they are incurred, except to the extent that the expense is being capitalised as part of a cost that is directly attributable to the acquisition, construction or production of an asset which necessarily takes a substantial period of time to get ready for its intended use or sale. All borrowing costs are recognised in profit or loss using the effective interest method.
(l) Employee Benefits
The Group operates both defined contribution post-employment benefit and defined benefit plans. Employee benefits are recognised as an expense, unless the cost qualifies to be capitalised as an asset.
(i) Defined Contribution PlansDefined contribution plans are post-employment benefit plans under which the Group pay fixed contributions to entities such as the Central Provident Fund Board on a mandatory, contractual or voluntary basis. The Group has no further payment obligations once the contributions are paid.
(ii) Defined Benefit PlansDefined benefit plans are post-employment benefit pension plans other than defined contribution plans. Defined benefit plans typically define the amount of benefit that an employee will receive upon or after retirement, usually dependent on one or more factors such as age, years of service and compensation.
The liability recognised in the balance sheet in respect of defined benefit plans is the present value of the defined benefit obligation at the balance sheet date less the fair value of the plan assets together with adjustments for unrecognised past service costs. The defined benefit obligation calculated annually by independent actuaries using the projected unit credit method. The present value of the defined benefit obligation is determined by discounting the estimated future cash outflows using market yield of high quality corporate bond that is denominated in the currency and the country in which the benefit will be paid and has tenure approximating to that of the defined benefit obligation.
Actuarial gains and losses arising from experience adjustments and changes in actuarial assumptions are charged or credited to equity in other comprehensive income in the period in which they arise.
Past service costs are recognised immediately in profit or loss.
The Road Ahead Annual Report 201472
NOTES TO THE FINANCIAL STATEMENTSFor the financial year ended 31 December 2014
2. SUMMARY OF SIGNIFICANT ACCOUNTING POLICIES (cont’d)(l) Employee Benefits (cont'd)
(iii) Employee Leave EntitlementsEmployees’ entitlements to annual leave are recognised when they are accrued to employees. A provision is made for the estimated liabilities for annual leave as a result of services rendered by employees up to the balance sheet date.
(iv) Share-Based CompensationThe Group operates an equity-settled, share-based compensation plan, the share option plan which allows employees to acquire shares of the Company. The fair value of options granted is recognised as an employee expense in profit or loss with a corresponding increase in the share option reserve over the vesting period. The fair value is measured at grant date and spread over the period during which the employee become unconditionally entitled to the options. At each balance sheet date, the Group revises its estimates of the number of shares under options that are expected to become exercisable on the vesting date and recognises the impact of the estimates in profit or loss, with a corresponding adjustment to the share option reserve over the remaining vesting period.
When the options are exercised, the proceeds received (net of transaction costs) and the related amount previously recognised in the share option reserve are credited to the share capital account on the issuance of new ordinary shares.
Where the terms of the share option plan are modified, the expense that is not yet recognised for the award is recognised over the remaining vesting period as if the terms had not been modified. Additional expense is recognised for any increase in the total fair value of the share options due to the modification as measured at the date of modification.
(m) Financial Assets
The Group classifies its financial assets as loans and receivables. The classification depends on the nature of the asset and the purpose for which the asset was acquired. Financial assets are recognised on the balance sheet only when the Group becomes a party to the contractual provision of the financial instrument. The Group determines the classification of the financial assets upon initial recognition and, where allowed and appropriate, re-evaluates this designation at each financial year end.
Loans and Receivables
Loans and receivables are non-derivative financial assets with fixed or determinable payments that are not quoted in active markets. They are presented as current assets, except for those maturing later than 12 months after the balance sheet date which are presented as non-current assets.
Loans and receivables are presented as trade and other receivables (Note 12) and cash and cash equivalents (Note 14) on the balance sheet and deposits refundable (Note 13). They are initially recognised at fair value, and subsequently carried at amortised cost using the effective interest method.
An allowance for impairment of loans and receivables is recognised when there is objective evidence that the Group will not be able to collect all the amounts due in accordance to the original terms of the receivables. The amount of the allowance is the difference between the asset’s carrying amount and the present value of estimated future cash flows, discounted at the original effective interest rate. When the asset becomes uncollectible, it is written off against the allowance. Subsequent recoveries of amounts previously written off are recognised against the same line item in profit or loss.
The impairment allowance is reduced through profit or loss in a subsequent period when the amount of impairment loss decreases and the related decrease can be objectively measured. The carrying amount of the asset previously impaired is increased to the extent that the new carrying amount does not exceed the amortised cost had no impairment been recognised in prior periods.
Interra Resources Limited The Road Ahead 73
NOTES TO THE FINANCIAL STATEMENTSFor the financial year ended 31 December 2014
2. SUMMARY OF SIGNIFICANT ACCOUNTING POLICIES (cont’d)(n) Cash and Cash Equivalents
Cash and cash equivalents comprise cash balances, bank balances, restricted cash and bank deposits which are subject to an insignificant risk of change in value. For the purpose of presentation in the statement of cash flows, cash and cash equivalents are presented net of bank overdrafts (if any) which are repayable on demand and which form an integral part of the Group’s cash management and restricted cash. Restricted cash is not available for use by the Group, therefore it is not considered highly liquid and is excluded from cash and cash equivalents.
(o) Inventories
(i) Crude Oil InventoryCrude oil inventory is the crude oil stored at the stock points and not transferred. The cost of crude oil is the cost of production, including the appropriate proportion of depreciation, amortisation and impairment and overheads based on normal operating capacity, determined on a weighted average basis. The net realisable value of crude oil is based on the estimated selling price in the ordinary course of business, less the estimated costs of completion and the estimated costs necessary to make the sale.
(ii) Granite InventoryGranite inventory is valued at the lower of cost or net realisable value. Cost is determined based on the weighted average cost basis and includes an appropriate portion of fixed and variable overheads. Net realisable value is the estimated sales amount in the ordinary course of business less the costs of completion and selling expenses.
(iii) Other InventoriesInventories comprise mainly consumable stocks, spare parts, fuel, lubricants and supplies which are stated at the lower of cost and net realisable value. Cost is determined by applying the first-in-first-out basis.
(p) Revenue Recognition
Revenue is recognised when it is probable that the economic benefits will flow to the Group and the revenue and costs, if applicable, can be measured reliably. Revenue is recognised in profit or loss as follows:
(i) Sale of Oil and Petroleum ProductsRevenue from the sale of oil and petroleum products is recognised when the significant risks and rewards of ownership has transferred, which is considered to have occur when title passes to the customer. This generally occurs when the product is physically transferred into a vessel, pipe or by other delivery mechanism. Crude oil stored at the stock points and not transferred at the balance sheet date is recognised as inventories.
(ii) Sale of GraniteRevenue from sale of granite using barge are recognised upon delivery of the goods to customers in accordance with the terms of sale. Revenue from sale of granite using truck is recognised upon the collection of the goods by customers.
(iii) Interest IncomeInterest income from bank deposits and advances made to third party are accrued on a time basis, with reference to the principal outstanding and the interest rate applicable.
(iv) Dividend IncomeDividend income from subsidiaries is recognised when the right to receive payment is established.
(v) Management and Petroleum Services FeesManagement and petroleum services fees are recognised upon the rendering of management and consultation services to and the acceptance by subsidiaries and joint operations.
The Road Ahead Annual Report 201474
NOTES TO THE FINANCIAL STATEMENTSFor the financial year ended 31 December 2014
2. SUMMARY OF SIGNIFICANT ACCOUNTING POLICIES (cont’d)(q) Currency Translation
(i) Functional and Presentation CurrencyItems included in the financial statements are measured using the currency that best reflects the economic substance of the underlying events and circumstances relevant to that entity. The financial statements are presented in United States Dollar (“USD”), which is the functional and presentation currency of the Company.
(ii) Transactions and BalancesTransactions in a currency other than the functional currency (“foreign currency”) are translated into the functional currency using the exchange rates at the dates of the transactions. Currency translation differences resulting from the settlement for such transactions and from the translation of monetary assets and liabilities denominated in foreign currencies at the closing rates at the balance sheet date are recognised in profit or loss, unless they arise from borrowings in foreign currencies and other currency instruments designated and qualifying as net investment hedges and net investment in foreign operations. Those currency translation differences are recognised in either comprehensive income and accumulated in the currency translation reserve and reclassified to profit or loss as part of the gain or loss on disposal of the foreign operation or when any loan forming part of the net investment of foreign operation is repaid.
All the other foreign exchange gains and losses impacting profit or loss are presented in profit or loss within other income, net.
Non-monetary items measured at fair values in foreign currencies are translated using the exchange rates at the date the fair values are determined.
(iii) Translation of Group Entities’ Financial Statements The results and financial position of all the Group entities that are in functional currencies other than United States Dollar are translated into United States Dollar on the following basis:
(1) Assets and liabilities for each balance sheet presented are translated at the rates of exchange at the balance sheet date;
(2) Income and expenses are translated at average exchange rates (unless this average is not a reasonable approximation of the cumulative effect of the rates prevailing on the transaction dates, in which case income and expenses are translated using the exchange rates at the date of transactions); and
(3) All resulting foreign currency translation differences are recognised in other comprehensive income and accumulated in the currency translation reserve. These currency translation differences are reclassified to profit or loss on disposal or partial disposal of the entity giving rise to such reserve.
Goodwill and fair value adjustments arising from the acquisitions of foreign operations on or after 1 January 2005 are treated as assets and liabilities of the foreign operations and translated at the closing rates on the reporting dates. For acquisitions prior to 1 January 2005, the exchange rates at the date of acquisitions are used.
Interra Resources Limited The Road Ahead 75
NOTES TO THE FINANCIAL STATEMENTSFor the financial year ended 31 December 2014
2. SUMMARY OF SIGNIFICANT ACCOUNTING POLICIES (cont’d)(r) Leases
When the Group is the lessee:
The Group leases office premises, vehicles and drilling equipment, mining machineries and motor vehicles under operating leases from non-related parties.
(i) Lessee – Finance LeasesLeases where the Group assumes substantially all risks and rewards incidental to ownership of the leased assets are classified as finance leases.
The leased assets and the corresponding lease liabilities (net of finance charges) under finance leases are recognised on the balance sheet as mining properties, plant and equipment and borrowings respectively, at the inception of the leases based on the lower of the fair value of the leased assets and the present value of the minimum lease payments.
Each lease payment is apportioned between the finance expense and the reduction of the outstanding lease liability. The finance expense is recognised in profit or loss on a basis that reflects a constant periodic rate of interest on the finance lease liability.
Gain or loss on sale-and-leaseback transactions resulting from a finance lease, is deferred and amortised over the lease term.
(ii) Lessee – Operating LeasesLeases where significant portions of the risks and rewards incidental to ownership are retained by lessors are classified as operating leases. Payments made under operating leases (net of any incentives received from lessors) are taken in profit or loss on a straight-line basis over the period of the leases.
Contingent rents are recognised as expenses in profit or loss in the financial period in which they are incurred.
When an operating lease is terminated before the lease period expires, any payment required to be made to the lessor by way of penalty is recognised as an expense in the financial period in which the termination takes place.
(s) Segment Reporting
Operating segments are reported in a manner consistent with the internal reporting provided to the Board of Directors whose members are responsible for allocating resources and assessing performance of the operating segments.
(t) Dividends to Company’s Shareholders
Dividends to the Company’s shareholders are recognised when the dividends are approved for payment.
(u) Fair Value Estimation
The fair values of financial instruments traded in active markets (such as exchange-traded and over-the-counter securities and derivatives) are based on quoted market prices at the balance sheet date. The quoted market prices used for financial assets are the current bid prices and the appropriate quoted market prices used for financial liabilities are the current asking prices.
The fair values of current financial assets and liabilities are carried at amortised cost approximating their carrying amounts.
The Road Ahead Annual Report 201476
NOTES TO THE FINANCIAL STATEMENTSFor the financial year ended 31 December 2014
2. SUMMARY OF SIGNIFICANT ACCOUNTING POLICIES (cont’d)(v) Government Grants
Grants from the government are recognised as a receivable at their fair value when there is reasonable assurance that the grant will be received and the Group will comply with all the attached conditions.
Government grants receivable are recognised as income over the periods necessary to match them with the related costs which they are intended to compensate, on a systematic basis.
(w) Share Capital
Ordinary shares are classified as equity. Incremental costs directly attributable to the issuance of new ordinary shares are deducted against the share capital account.
3. CRITICAL ACCOUNTING ESTIMATES, ASSUMPTIONS AND JUDGEMENTSEstimates, assumptions and judgements concerning the future are made in preparation of the financial statements. They affect the application of the Group’s accounting policies, and the reported amounts of the financial statements and the disclosures made. They are assessed on an on-going basis and are based on experience, relevant factors and conditions, including current and expected future events that are believed to be reasonable under the circumstances.
Key Sources of Estimating Uncertainty
(a) Amortisation of Development and Production Assets (Producing Oil and Gas Properties)
The amounts recorded for amortisation and the recovery of the carrying value of development and production assets depend on the estimates of petroleum recoverable reserves and the remaining life of the contract period. There are numerous uncertainties inherent in the estimation of reserves and cash flows, including many factors beyond the Group’s control. Evaluation of reserves and cash flows includes a number of assumptions relating to factors such as initial production rates, production decline rates, ultimate recovery of reserves, timing and amount of capital expenditures, marketability of production, future petroleum prices, future operating costs and government levies that may be imposed over the producing life of the reserves. Many of these assumptions are subject to change and are beyond the Group’s control. The determination of petroleum recoverable reserves has a significant impact on future cash flows which may affect the production level and hence future sales.
The Group currently amortises development and production assets using the units of production method against management’s estimates of petroleum recoverable reserves. Changes in the petroleum recoverable reserves could impact future amortisation charges. Accordingly, there may be material adjustments made to the carrying amount of the respective assets. As at 31 December 2014, the carrying amount of the development and production assets is US$39,717,197 (2013: US$54,353,824) (Note 5). The amortisation charge for the financial year ended 31 December 2014 is US$20,120,662 (2013: US$7,524,753) (Note 5).
If management’s estimated petroleum recoverable reserves had been higher/lower by 5% (2013: 5%), the carrying amount of development and production assets would have been increased/decreased in aggregate by approximately US$1,373,000 and US$1,629,000 (2013: US$393,000 and US$439,000) accordingly.
(b) Estimated Impairment of Producing Oil and Gas Properties and Goodwill on Reverse Acquisition
The Group performs assessment of the carrying value of its assets when there is indication of impairment. Goodwill on reverse acquisition is assessed for impairment at least once a year or when there is indication of impairment. The recoverable amounts of CGU are determined based on value-in-use calculations. These calculations require the use of estimates and key assumptions, inter alia, petroleum recoverable reserves, future crude oil prices, operating costs, capital expenditure and number of payment of invoices received by the Group in the financial year. Management has used the 2015 budgets reviewed by the respective operators’ owner committees and also past experiences as a guide. The period beyond 2015 until the contracts expire assumes some drilling activities undertaken to further develop the existing fields. Future cash flows are discounted using discount rates of 8% - 11% per annum (a comparable rate used by other companies in the region and in the similar nature of business sector). The pre-tax discount rates are estimated to be 10% - 18% per annum.
Interra Resources Limited The Road Ahead 77
NOTES TO THE FINANCIAL STATEMENTSFor the financial year ended 31 December 2014
3. CRITICAL ACCOUNTING ESTIMATES, ASSUMPTIONS AND JUDGEMENTS (cont'd)Actual results may ultimately differ from the estimates and key assumptions utilised in the calculations. Accordingly, there may be material adjustments to the carrying amount of the respective assets.
As at 31 December 2014, the carrying amounts of producing oil and gas properties and goodwill on reverse acquisition are US$47,206,789 (2013: US$61,346,474) (Note 5) and US$1,488,902 (2013: US$1,488,902) (Note 8) respectively.
(i) Indonesia CGU (Producing Oil and Gas Properties)An impairment charge of $9,775,825 (2013: Nil) was recognised for producing oil and gas properties for the financial year ended 31 December 2014 (2013: Nil), which reduced the carrying amount of producing oil and gas properties of Indonesia CGU from US$47,587,267 to US$37,811,442.
If management’s estimated discount rates applied to the discounted cash flows as at 31 December 2014 had been raised by 2% the carrying amount of producing oil and gas properties of Indonesia CGU would have been reduced by US$8,256,000.
If management’s estimated crude oil price used in the discounted cash flows as at 31 December 2014 had been lower by 5%, the carrying amount of producing oil and gas properties of Indonesia CGU would have been reduced by US$5,267,000.
(ii) Myanmar CGU (Producing Oil and Gas Properties and Goodwill on Reverse Acquisition)Based on the impairment assessment, management is of the view that no impairment is required for producing oil and gas properties and goodwill on reverse acquisition as at 31 December 2014 and 31 December 2013 as the recoverable amount of the Myanmar CGU is higher than the carrying amount of the CGU.
Based on an impairment test of the Myanmar CGU as at 31 December 2014 which includes goodwill on reverse acquisition recognised on the balance sheet included under intangible assets, the estimated recoverable amount of the CGU is higher than the carrying amount of the CGU (inclusive of attributable goodwill) by US$24,159,720 or 140% higher than its carrying amount. If the estimated crude oil price used to estimate recoverable amount decline by 18% or the discount rate increase by 18%, the recoverable amount of producing oil and gas properties of Myanmar CGU would fall to its carrying amount.
(c) Reserves Estimates, Impairment of Mining Properties and Goodwill on Consolidation
Proven reserves are estimates of the amount of product that can be economically and legally exploited from the Group’s mining properties. In order to estimate granite rock reserves, assumptions are required about a range of geological, technical and economic factors, including quantities, production techniques, production costs, transport costs, commodity demand, commodity prices and exchange rates.
Because the economic assumptions used to estimate reserves change from period to period, and because additional geological data is generated during the course of operations, estimates of reserves may change from period to period. Changes in reported reserves may affect the Company’s financial results and financial position in a number of ways, including the following:
- Asset carrying values may be affected due to changes in estimated future cash flows.- Depreciation and amortisation charged in the profit or loss may change where such charges are determined
on the units of production basis, or where the useful economic lives of assets change.
The Road Ahead Annual Report 201478
NOTES TO THE FINANCIAL STATEMENTSFor the financial year ended 31 December 2014
3. CRITICAL ACCOUNTING ESTIMATES, ASSUMPTIONS AND JUDGEMENTS (cont'd)The Group performs assessment of the carrying value of its mining properties and goodwill on consolidation based on the operating and financial performance. The carrying value of mining properties is assessed for impairment when there is indication of impairment. Goodwill onconsolidation is assessed for impairment at least once a year. There coverable amounts of CGU are determined based on value-in-use calculations. Key assumptions used for value-in-use calculations include sales projection, selling price, operating costs and others. Cash flow projections used in the calculation were based on the financial budgets approved by management covering the period till the expiry of the mining permit. Future cash flows are discounted using a discount rate of 14% per annum. The pre-tax discount rate is estimated to be 18% per annum.
As at 31 December 2014, the goodwill on consolidation of US$656,644 is fully impaired (Note 8) as the recoverable amount of the Mining CGU is lower than the carrying amount of the CGU (inclusive of attributable goodwill). Management has assessed that no impairment is required for mining properties as its recoverable amount is higher than its carrying amount. If the estimated sales projections applied to the discounted cash flows of mining properties reduce by 5% or the discount rate increase by 15%, the recoverable amount of mining properties would fall to its carrying amounts. The carrying amount of mining properties as at 31 December 2014 is US$6,660,574 (2013: Nil) (Note 6). The amortisation charge for the financial year ended 31 December 2014 is US$417,981 (2013: Nil) (Note 6).
(d) Provision for Environmental and Restoration Costs
Environmental and restoration costs are a normal consequence of oil extraction and the majority of this expenditure is incurred at the end of a well’s life or an area of interest. In determining an appropriate level of provision, consideration is given to the expected future costs to be incurred, the timing of these expected future costs (largely dependent on the life of wells), and the expected useful life of the areas of interest and the wells. The ultimate environmental and restoration cost are uncertain and may vary in response to many factors, including changes to the relevant legal requirements and the emergence of new restoration techniques or experience at other wells.
Full provision was made for future restoration costs of oil exploration site in Indonesia on a discounted basis, which represents the present value of restoration cost relating to producing oil and gas properties and are expected to be incurred up to the end of TAC which is when the producing oil and gas properties are expected to cease operation. The provision for environmental and restoration costs for mining site is using the units of production method. The carrying amount of the provision for environmental and restoration costs as at 31 December 2014 is US$5,286,886 (2013: US$2,715,279) (Note 20).
If management's estimated discount rate used to calculate the present value of the provision for environmental and restoration costs for oil exploration in Indonesia change by 2% (2013: 2%) and if the estimated mining reserves change by 5% (2013: Nil), the impact to the carrying amount of provision for environmental and restoration costs are not likely to be material.
(e) Income Taxes
The Group’s profit is subject to income tax mainly in Indonesia, Myanmar and Singapore. Significant judgement is required in determining the Group-wide provisions for income taxes including capital allowances and deductibility of certain expenses. The Group has made the necessary tax provisions under the respective petroleum contracts. The Group has not paid income tax in respect of the Indonesia operations as there is unrecovered cost pool. As for the Myanmar operations, tax assessments have been finalised up to 2004. During the current financial year, the income tax expense paid is US$4,849,378 of which US$2,309,522 relates to tax assessment 2007 to 2015 and remaining of US$2,539,856 for tax assessment 2016 (2013: US$4,082,765) but is subject to the final tax assessments from the tax authority. If the final tax outcome allows deduction of unrecovered cost pools against profit oil, the actual tax expenses may be lower than the current tax provision. If such over-provision occurs, it will be reversed upon determination. The amounts of current income tax liabilities and income tax expenses are disclosed in Notes 18 and 19 respectively. Please refer to Note 33 for contingent liabilities for possible capital gain tax in Myanmar.
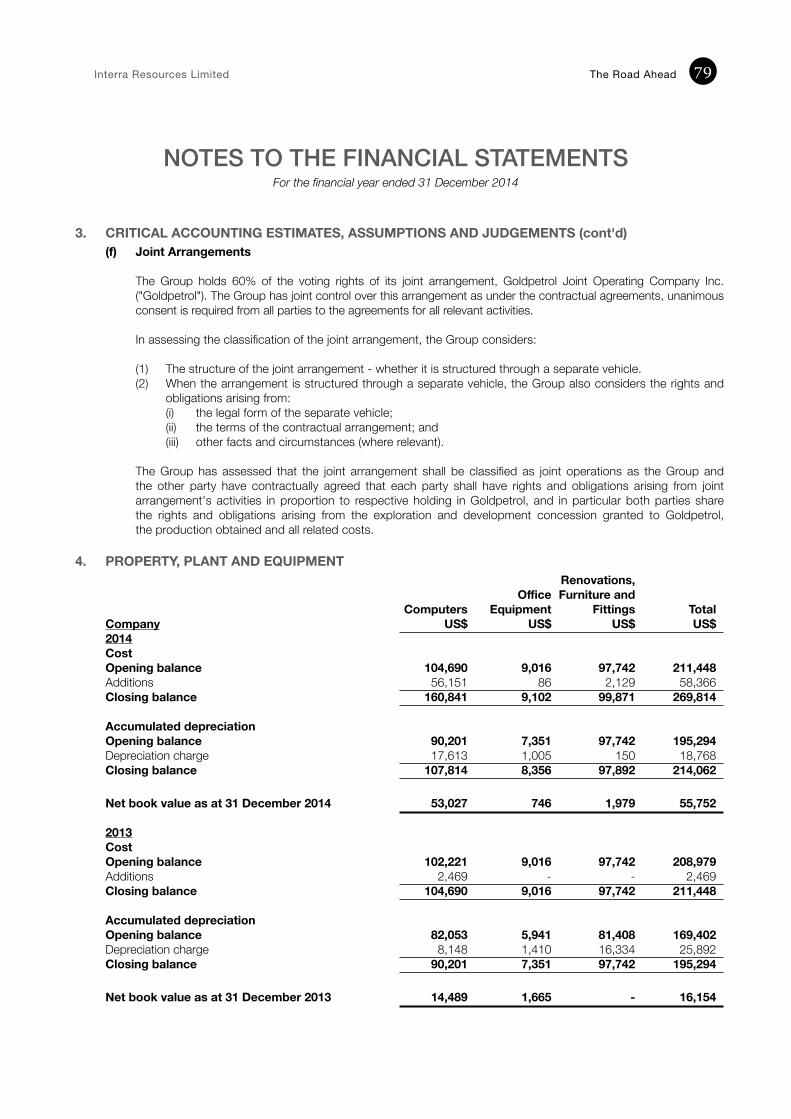
Interra Resources Limited The Road Ahead 79
NOTES TO THE FINANCIAL STATEMENTSFor the financial year ended 31 December 2014
3. CRITICAL ACCOUNTING ESTIMATES, ASSUMPTIONS AND JUDGEMENTS (cont'd)(f) Joint Arrangements
The Group holds 60% of the voting rights of its joint arrangement, Goldpetrol Joint Operating Company Inc. ("Goldpetrol"). The Group has joint control over this arrangement as under the contractual agreements, unanimous consent is required from all parties to the agreements for all relevant activities.
In assessing the classification of the joint arrangement, the Group considers:
(1) The structure of the joint arrangement - whether it is structured through a separate vehicle.(2) When the arrangement is structured through a separate vehicle, the Group also considers the rights and
obligations arising from:(i) the legal form of the separate vehicle;(ii) the terms of the contractual arrangement; and(iii) other facts and circumstances (where relevant).
The Group has assessed that the joint arrangement shall be classified as joint operations as the Group and the other party have contractually agreed that each party shall have rights and obligations arising from joint arrangement's activities in proportion to respective holding in Goldpetrol, and in particular both parties share the rights and obligations arising from the exploration and development concession granted to Goldpetrol, the production obtained and all related costs.
4. PROPERTY, PLANT AND EQUIPMENT Renovations, Office Furniture and Computers Equipment Fittings Total
Company US$ US$ US$ US$2014CostOpening balance 104,690 9,016 97,742 211,448Additions 56,151 86 2,129 58,366Closing balance 160,841 9,102 99,871 269,814
Accumulated depreciationOpening balance 90,201 7,351 97,742 195,294Depreciation charge 17,613 1,005 150 18,768Closing balance 107,814 8,356 97,892 214,062
Net book value as at 31 December 2014 53,027 746 1,979 55,752
2013CostOpening balance 102,221 9,016 97,742 208,979Additions 2,469 - - 2,469Closing balance 104,690 9,016 97,742 211,448
Accumulated depreciationOpening balance 82,053 5,941 81,408 169,402Depreciation charge 8,148 1,410 16,334 25,892Closing balance 90,201 7,351 97,742 195,294 Net book value as at 31 December 2013 14,489 1,665 - 16,154
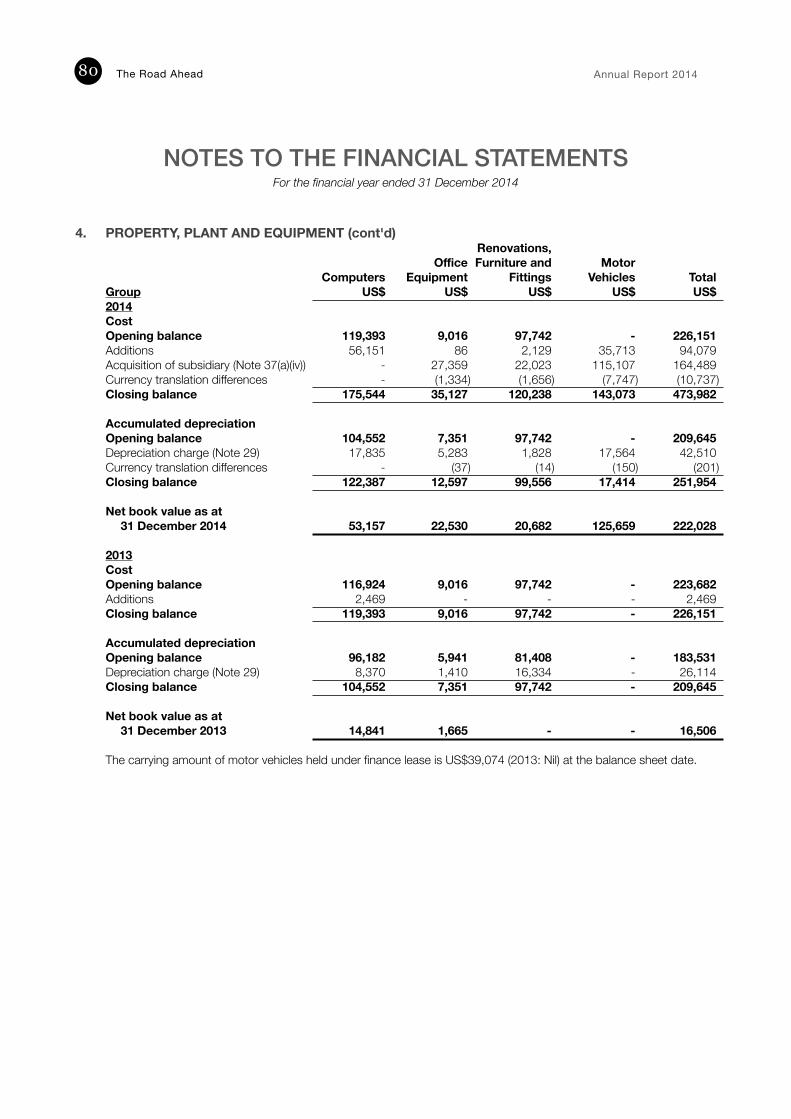
The Road Ahead Annual Report 201480
NOTES TO THE FINANCIAL STATEMENTSFor the financial year ended 31 December 2014
4. PROPERTY, PLANT AND EQUIPMENT (cont'd) Renovations, Office Furniture and Motor Computers Equipment Fittings Vehicles TotalGroup US$ US$ US$ US$ US$2014Cost Opening balance 119,393 9,016 97,742 - 226,151Additions 56,151 86 2,129 35,713 94,079Acquisition of subsidiary (Note 37(a)(iv)) - 27,359 22,023 115,107 164,489Currency translation differences - (1,334) (1,656) (7,747) (10,737)Closing balance 175,544 35,127 120,238 143,073 473,982 Accumulated depreciationOpening balance 104,552 7,351 97,742 - 209,645Depreciation charge (Note 29) 17,835 5,283 1,828 17,564 42,510Currency translation differences - (37) (14) (150) (201)Closing balance 122,387 12,597 99,556 17,414 251,954
Net book value as at31 December 2014 53,157 22,530 20,682 125,659 222,028
2013 CostOpening balance 116,924 9,016 97,742 - 223,682Additions 2,469 - - - 2,469Closing balance 119,393 9,016 97,742 - 226,151
Accumulated depreciationOpening balance 96,182 5,941 81,408 - 183,531Depreciation charge (Note 29) 8,370 1,410 16,334 - 26,114Closing balance 104,552 7,351 97,742 - 209,645 Net book value as at
31 December 2013 14,841 1,665 - - 16,506
The carrying amount of motor vehicles held under finance lease is US$39,074 (2013: Nil) at the balance sheet date.
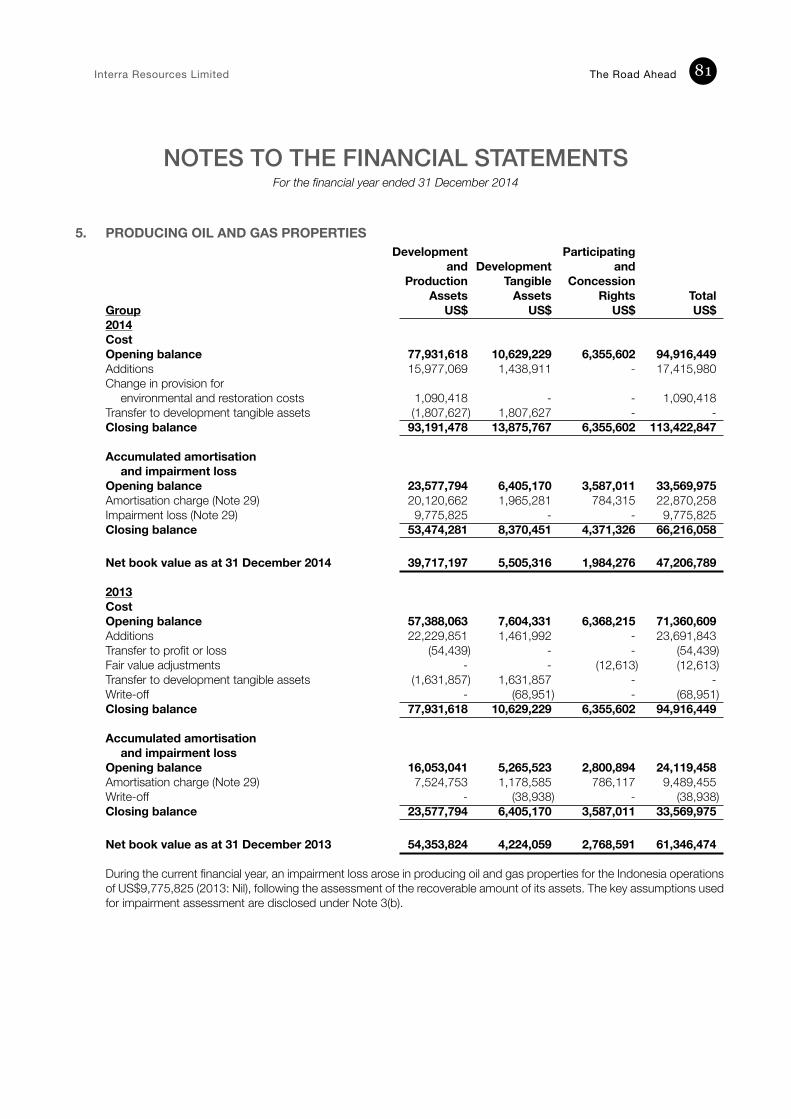
Interra Resources Limited The Road Ahead 81
NOTES TO THE FINANCIAL STATEMENTSFor the financial year ended 31 December 2014
5. PRODUCING OIL AND GAS PROPERTIES Development Participating and Development and Production Tangible Concession Assets Assets Rights TotalGroup US$ US$ US$ US$2014CostOpening balance 77,931,618 10,629,229 6,355,602 94,916,449Additions 15,977,069 1,438,911 - 17,415,980Change in provision for
environmental and restoration costs 1,090,418 - - 1,090,418Transfer to development tangible assets (1,807,627) 1,807,627 - -Closing balance 93,191,478 13,875,767 6,355,602 113,422,847 Accumulated amortisation
and impairment lossOpening balance 23,577,794 6,405,170 3,587,011 33,569,975Amortisation charge (Note 29) 20,120,662 1,965,281 784,315 22,870,258Impairment loss (Note 29) 9,775,825 - - 9,775,825Closing balance 53,474,281 8,370,451 4,371,326 66,216,058
Net book value as at 31 December 2014 39,717,197 5,505,316 1,984,276 47,206,789 2013CostOpening balance 57,388,063 7,604,331 6,368,215 71,360,609Additions 22,229,851 1,461,992 - 23,691,843Transfer to profit or loss (54,439) - - (54,439)Fair value adjustments - - (12,613) (12,613)Transfer to development tangible assets (1,631,857) 1,631,857 - -Write-off - (68,951) - (68,951)Closing balance 77,931,618 10,629,229 6,355,602 94,916,449 Accumulated amortisation
and impairment lossOpening balance 16,053,041 5,265,523 2,800,894 24,119,458Amortisation charge (Note 29) 7,524,753 1,178,585 786,117 9,489,455Write-off - (38,938) - (38,938)Closing balance 23,577,794 6,405,170 3,587,011 33,569,975 Net book value as at 31 December 2013 54,353,824 4,224,059 2,768,591 61,346,474
During the current financial year, an impairment loss arose in producing oil and gas properties for the Indonesia operations of US$9,775,825 (2013: Nil), following the assessment of the recoverable amount of its assets. The key assumptions used for impairment assessment are disclosed under Note 3(b).
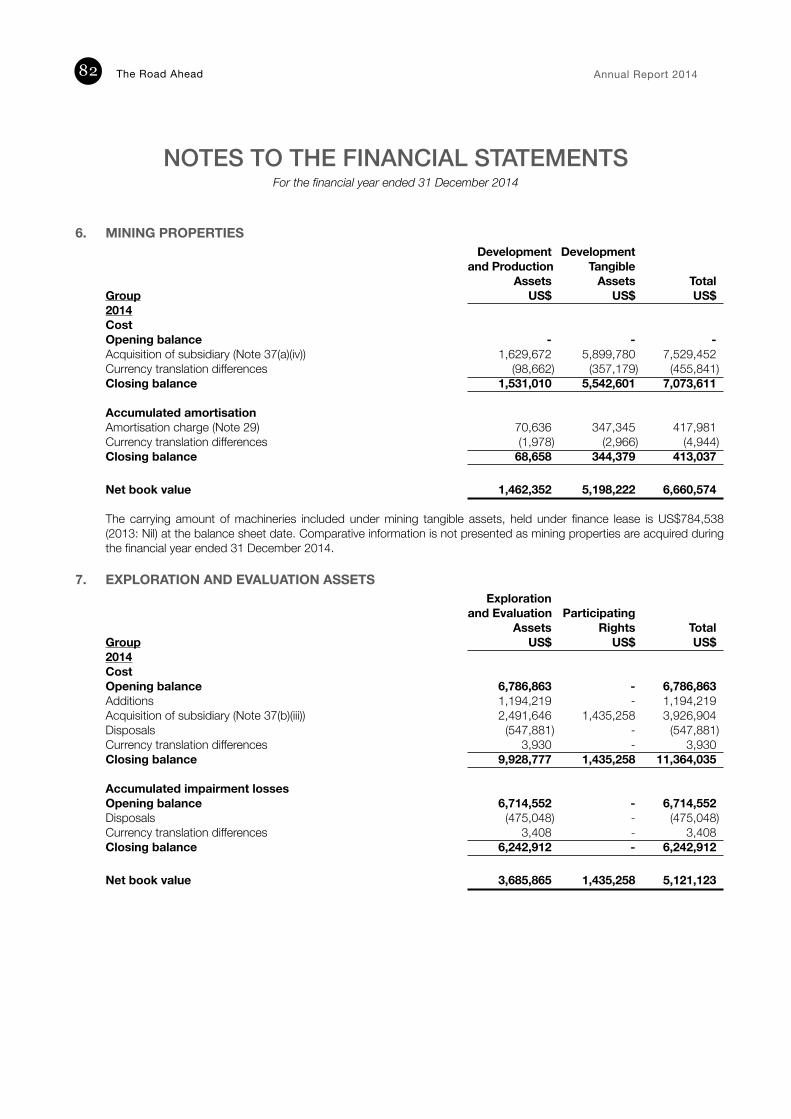
The Road Ahead Annual Report 201482
NOTES TO THE FINANCIAL STATEMENTSFor the financial year ended 31 December 2014
6. MINING PROPERTIES Development Development and Production Tangible Assets Assets Total Group US$ US$ US$2014Cost Opening balance - - -Acquisition of subsidiary (Note 37(a)(iv)) 1,629,672 5,899,780 7,529,452Currency translation differences (98,662) (357,179) (455,841)Closing balance 1,531,010 5,542,601 7,073,611 Accumulated amortisationAmortisation charge (Note 29) 70,636 347,345 417,981Currency translation differences (1,978) (2,966) (4,944)Closing balance 68,658 344,379 413,037
Net book value 1,462,352 5,198,222 6,660,574
The carrying amount of machineries included under mining tangible assets, held under finance lease is US$784,538 (2013: Nil) at the balance sheet date. Comparative information is not presented as mining properties are acquired during the financial year ended 31 December 2014.
7. EXPLORATION AND EVALUATION ASSETS Exploration
and Evaluation Participating Assets Rights Total Group US$ US$ US$2014CostOpening balance 6,786,863 - 6,786,863Additions 1,194,219 - 1,194,219Acquisition of subsidiary (Note 37(b)(iii)) 2,491,646 1,435,258 3,926,904Disposals (547,881) - (547,881)Currency translation differences 3,930 - 3,930Closing balance 9,928,777 1,435,258 11,364,035
Accumulated impairment lossesOpening balance 6,714,552 - 6,714,552Disposals (475,048) - (475,048)Currency translation differences 3,408 - 3,408Closing balance 6,242,912 - 6,242,912
Net book value 3,685,865 1,435,258 5,121,123
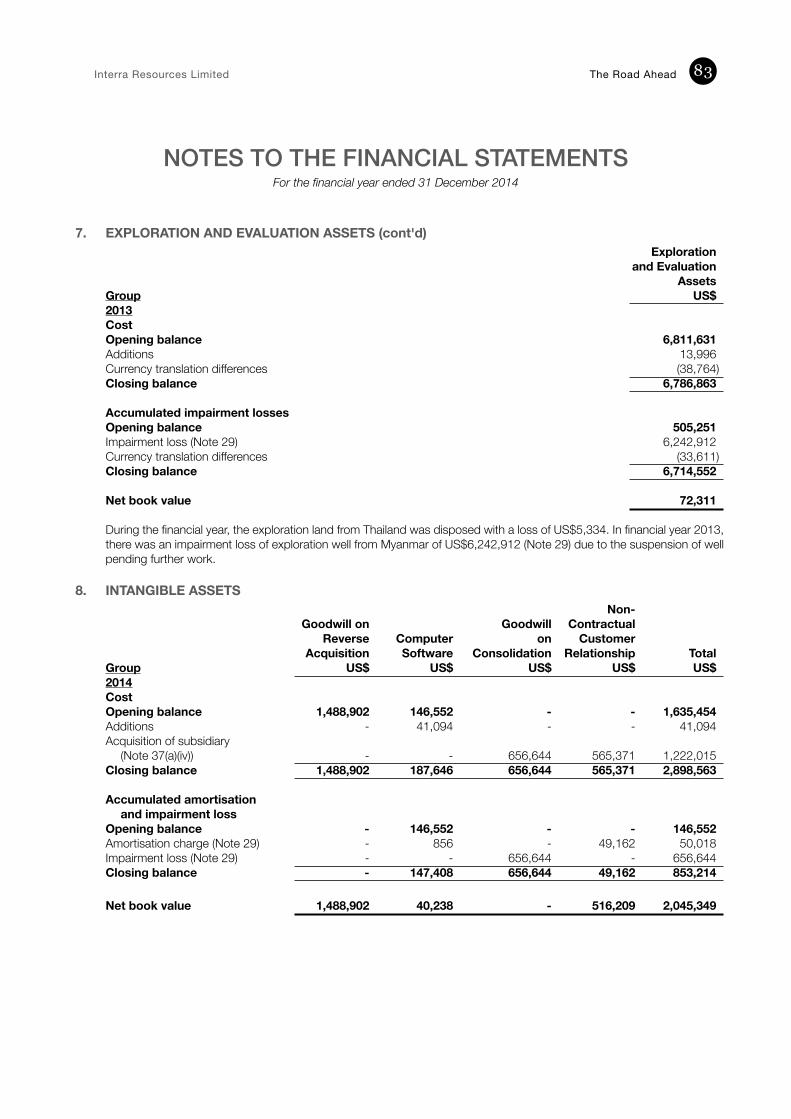
Interra Resources Limited The Road Ahead 83
NOTES TO THE FINANCIAL STATEMENTSFor the financial year ended 31 December 2014
7. EXPLORATION AND EVALUATION ASSETS (cont'd) Exploration and Evaluation AssetsGroup US$2013 Cost Opening balance 6,811,631Additions 13,996Currency translation differences (38,764)Closing balance 6,786,863 Accumulated impairment lossesOpening balance 505,251Impairment loss (Note 29) 6,242,912Currency translation differences (33,611)Closing balance 6,714,552
Net book value 72,311
During the financial year, the exploration land from Thailand was disposed with a loss of US$5,334. In financial year 2013, there was an impairment loss of exploration well from Myanmar of US$6,242,912 (Note 29) due to the suspension of well pending further work.
8. INTANGIBLE ASSETS
Non- Goodwill on Goodwill Contractual Reverse Computer on Customer Acquisition Software Consolidation Relationship TotalGroup US$ US$ US$ US$ US$2014CostOpening balance 1,488,902 146,552 - - 1,635,454Additions - 41,094 - - 41,094Acquisition of subsidiary
(Note 37(a)(iv)) - - 656,644 565,371 1,222,015Closing balance 1,488,902 187,646 656,644 565,371 2,898,563
Accumulated amortisation and impairment loss
Opening balance - 146,552 - - 146,552Amortisation charge (Note 29) - 856 - 49,162 50,018Impairment loss (Note 29) - - 656,644 - 656,644Closing balance - 147,408 656,644 49,162 853,214
Net book value 1,488,902 40,238 - 516,209 2,045,349
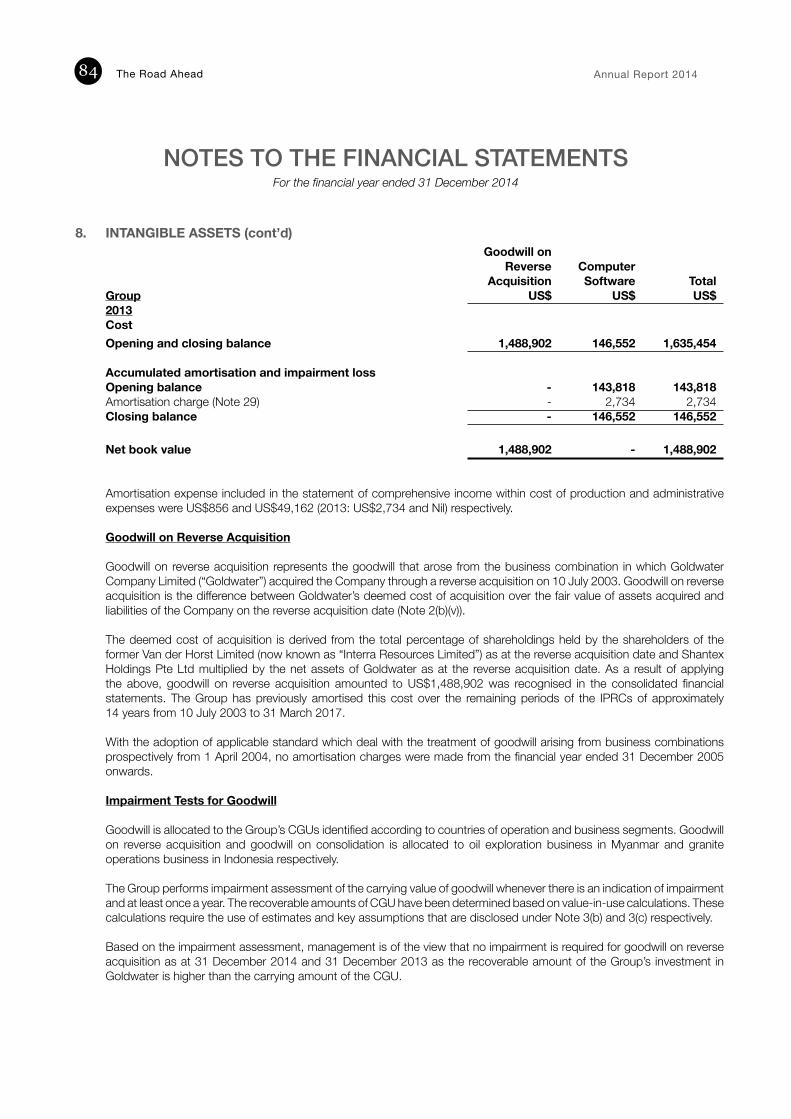
The Road Ahead Annual Report 201484
NOTES TO THE FINANCIAL STATEMENTSFor the financial year ended 31 December 2014
8. INTANGIBLE ASSETS (cont’d) Goodwill on Reverse Computer Acquisition Software TotalGroup US$ US$ US$2013CostOpening and closing balance 1,488,902 146,552 1,635,454
Accumulated amortisation and impairment loss Opening balance - 143,818 143,818Amortisation charge (Note 29) - 2,734 2,734Closing balance - 146,552 146,552 Net book value 1,488,902 - 1,488,902
Amortisation expense included in the statement of comprehensive income within cost of production and administrative expenses were US$856 and US$49,162 (2013: US$2,734 and Nil) respectively.
Goodwill on Reverse Acquisition
Goodwill on reverse acquisition represents the goodwill that arose from the business combination in which Goldwater Company Limited (“Goldwater”) acquired the Company through a reverse acquisition on 10 July 2003. Goodwill on reverse acquisition is the difference between Goldwater’s deemed cost of acquisition over the fair value of assets acquired and liabilities of the Company on the reverse acquisition date (Note 2(b)(v)).
The deemed cost of acquisition is derived from the total percentage of shareholdings held by the shareholders of the former Van der Horst Limited (now known as “Interra Resources Limited”) as at the reverse acquisition date and Shantex Holdings Pte Ltd multiplied by the net assets of Goldwater as at the reverse acquisition date. As a result of applying the above, goodwill on reverse acquisition amounted to US$1,488,902 was recognised in the consolidated financial statements. The Group has previously amortised this cost over the remaining periods of the IPRCs of approximately 14 years from 10 July 2003 to 31 March 2017.
With the adoption of applicable standard which deal with the treatment of goodwill arising from business combinations prospectively from 1 April 2004, no amortisation charges were made from the financial year ended 31 December 2005 onwards.
Impairment Tests for Goodwill
Goodwill is allocated to the Group’s CGUs identified according to countries of operation and business segments. Goodwill on reverse acquisition and goodwill on consolidation is allocated to oil exploration business in Myanmar and granite operations business in Indonesia respectively.
The Group performs impairment assessment of the carrying value of goodwill whenever there is an indication of impairment and at least once a year. The recoverable amounts of CGU have been determined based on value-in-use calculations. These calculations require the use of estimates and key assumptions that are disclosed under Note 3(b) and 3(c) respectively.
Based on the impairment assessment, management is of the view that no impairment is required for goodwill on reverse acquisition as at 31 December 2014 and 31 December 2013 as the recoverable amount of the Group’s investment in Goldwater is higher than the carrying amount of the CGU.
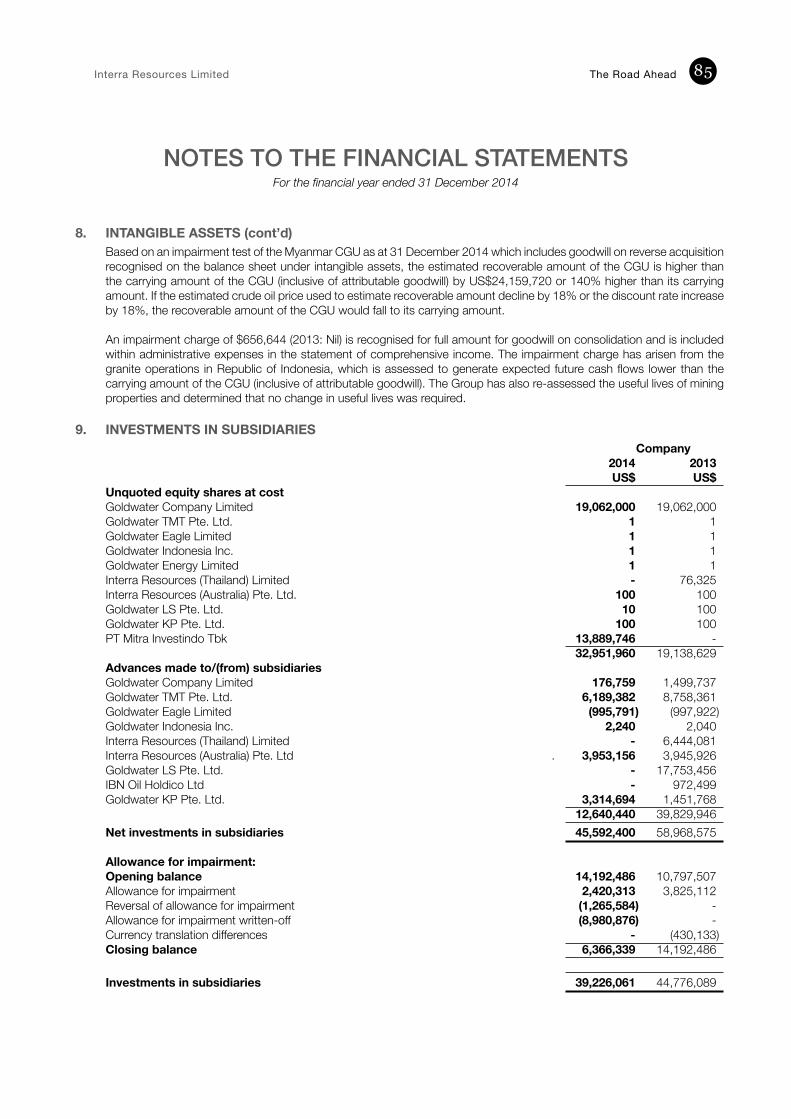
Interra Resources Limited The Road Ahead 85
NOTES TO THE FINANCIAL STATEMENTSFor the financial year ended 31 December 2014
8. INTANGIBLE ASSETS (cont’d)Based on an impairment test of the Myanmar CGU as at 31 December 2014 which includes goodwill on reverse acquisition recognised on the balance sheet under intangible assets, the estimated recoverable amount of the CGU is higher than the carrying amount of the CGU (inclusive of attributable goodwill) by US$24,159,720 or 140% higher than its carrying amount. If the estimated crude oil price used to estimate recoverable amount decline by 18% or the discount rate increase by 18%, the recoverable amount of the CGU would fall to its carrying amount.
An impairment charge of $656,644 (2013: Nil) is recognised for full amount for goodwill on consolidation and is included within administrative expenses in the statement of comprehensive income. The impairment charge has arisen from the granite operations in Republic of Indonesia, which is assessed to generate expected future cash flows lower than the carrying amount of the CGU (inclusive of attributable goodwill). The Group has also re-assessed the useful lives of mining properties and determined that no change in useful lives was required.
9. INVESTMENTS IN SUBSIDIARIES Company 2014 2013
US$ US$Unquoted equity shares at costGoldwater Company Limited 19,062,000 19,062,000Goldwater TMT Pte. Ltd. 1 1Goldwater Eagle Limited 1 1Goldwater Indonesia Inc. 1 1Goldwater Energy Limited 1 1Interra Resources (Thailand) Limited - 76,325Interra Resources (Australia) Pte. Ltd. 100 100Goldwater LS Pte. Ltd. 10 100Goldwater KP Pte. Ltd. 100 100PT Mitra Investindo Tbk 13,889,746 - 32,951,960 19,138,629Advances made to/(from) subsidiaries Goldwater Company Limited 176,759 1,499,737Goldwater TMT Pte. Ltd. 6,189,382 8,758,361Goldwater Eagle Limited (995,791) (997,922)Goldwater Indonesia Inc. 2,240 2,040Interra Resources (Thailand) Limited - 6,444,081Interra Resources (Australia) Pte. Ltd . 3,953,156 3,945,926Goldwater LS Pte. Ltd. - 17,753,456IBN Oil Holdico Ltd - 972,499Goldwater KP Pte. Ltd. 3,314,694 1,451,768 12,640,440 39,829,946Net investments in subsidiaries 45,592,400 58,968,575
Allowance for impairment: Opening balance 14,192,486 10,797,507Allowance for impairment 2,420,313 3,825,112Reversal of allowance for impairment (1,265,584) -Allowance for impairment written-off (8,980,876) -Currency translation differences - (430,133)Closing balance 6,366,339 14,192,486 Investments in subsidiaries 39,226,061 44,776,089
The Road Ahead Annual Report 201486
NOTES TO THE FINANCIAL STATEMENTSFor the financial year ended 31 December 2014
9. INVESTMENTS IN SUBSIDIARIES (cont’d) Advances made to/(from) Subsidiaries
The advances made to/(from) subsidiaries form part of the Company’s net investments in the subsidiaries. Advances made to/(from) subsidiaries are interest free advances for the purpose of operating and development activities in their respective fields. These advances are not expected to be repaid within the next 12 months from the balance sheet date. The Company will assess annually whether there is evidence showing that the nature of the advances have changed. When evidence of change exists, the Company would consider the effects of the change in determining the fair value of the advances. As at the end of financial year, the fair value of these advances is assessed to approximate their carrying amounts.
During the financial year, the Company recognised an impairment charge of US$2,413,183 for its net investment in subsidiary, PT Mitra Investindo Tbk based on value-in-use calculation. Cash flow projections used in the calculation were based on the financial budgets approved by management covering the period till the expiry of the mining permit. Key assumptions used for value-in-use calculations include sales projection, selling price, operating costs and others. Future cash flows are discounted using a discount rate of 14% per annum.
During the financial year, the Company recognised an impairment write back for its investment in Goldwater LS Pte Ltd ("GLS") of US$1,265,584 after the disposed of 90% interests in GLS at purchase consideration of US$13.50million. In 2013, the Company recognised an impairment charge of US$3,825,112 for its net investment in a subsidiary, Goldwater LS Pte Ltd based on value-in-use calculation. Cash flow projections used in the calculation were based on the financial budgets approved by management covering the period till the expiry of the contract assumes some drilling activities undertaken to further develop the related fields. Key assumptions used for value-in-use calculations include petroleum recoverable reserves, future crude oil prices, operating costs and capital expenditure. Future cashflows are discounted using a discount rate of 11% per annum.
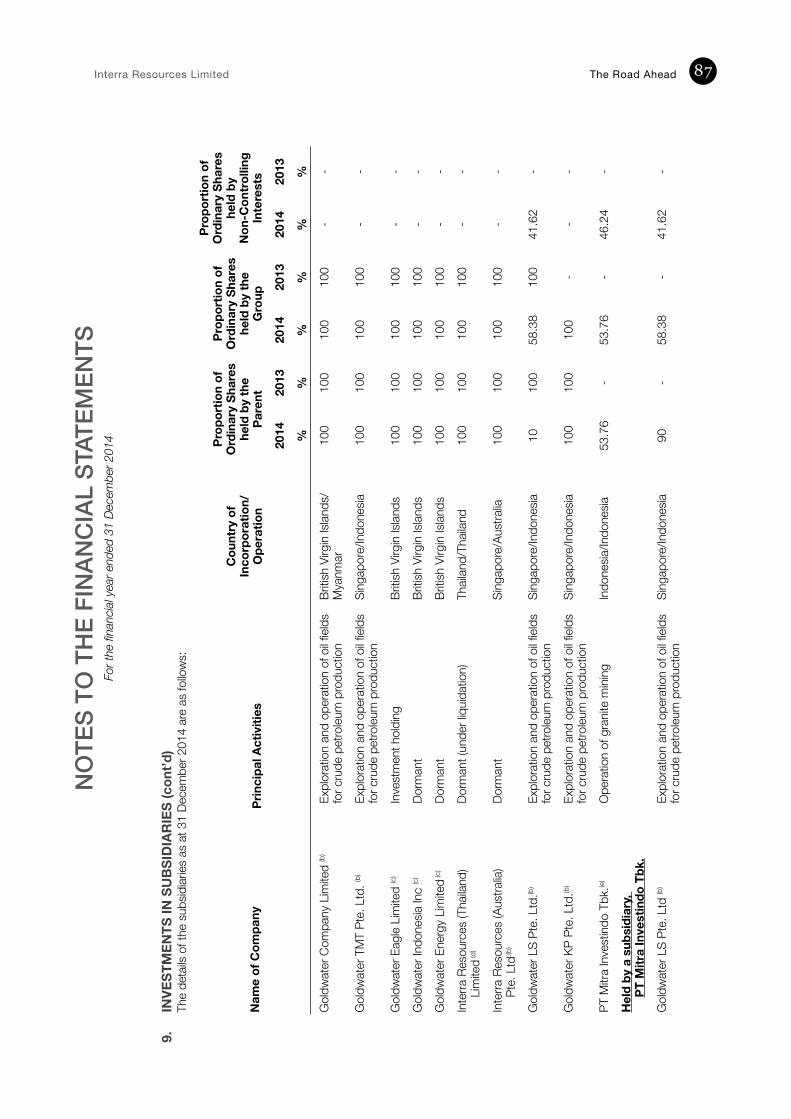
Interra Resources Limited The Road Ahead 87N
OT
ES
TO
TH
E F
INA
NC
IAL
STA
TE
ME
NT
SForthefinancialyearended31De
cember2
014
9.
INVE
STM
ENTS
IN S
UBS
IDIA
RIE
S (c
ont’d
) Th
e de
tails
of t
he s
ubsid
iaries
as
at 3
1 De
cem
ber 2
014
are
as fo
llow
s:
Nam
e of
Com
pany
Prin
cipa
l Act
iviti
es
Cou
ntry
of
Inco
rpor
atio
n/
Ope
ratio
n
Prop
ortio
n of
O
rdin
ary
Shar
es
held
by
the
Pare
nt
Pr
opor
tion
of
Ord
inar
y Sh
ares
he
ld b
y th
e G
roup
Prop
ortio
n of
O
rdin
ary
Shar
es
held
by
Non
-Con
trol
ling
Inte
rest
s
2014
2013
2014
2013
2014
2013
%%
%%
%%
Gol
dwat
er C
ompa
ny L
imite
d (b
) Ex
plor
atio
n an
d op
erat
ion
of o
il field
s fo
r cru
de p
etro
leum
pro
duct
ion
Britis
h Vi
rgin
Islan
ds/
Mya
nmar
100
100
100
100
--
Gol
dwat
er T
MT
Pte.
Ltd
. (b)
Expl
orat
ion
and
oper
atio
n of
oil fi
elds
for c
rude
pet
roleu
m p
rodu
ctio
nSi
ngap
ore/
Indo
nesia
100
100
100
100
--
Gol
dwat
er E
agle
Lim
ited
(c)
Inve
stm
ent h
oldi
ng Br
itish
Virg
in Is
lands
100
100
100
100
--
Gol
dwat
er In
done
sia In
c (c
)Do
rman
t Br
itish
Virg
in Is
lands
100
100
100
100
--
Gol
dwat
er E
nerg
y Li
mite
d (c)
Dorm
ant
Britis
h Vi
rgin
Islan
ds10
010
010
010
0-
-
Inte
rra R
esou
rces
(Tha
iland
)Li
mite
d (d)
Dorm
ant (
unde
r liq
uida
tion)
Thail
and/
Thail
and
100
100
100
100
--
Inte
rra R
esou
rces
(Aus
tralia
)Pt
e. L
td.(b
)Do
rman
tSi
ngap
ore/
Aust
ralia
100
100
100
100
--
Gol
dwat
er L
S Pt
e. L
td.(b
)Ex
plor
atio
n an
d op
erat
ion
of o
il field
s fo
r cru
de p
etro
leum
pro
duct
ion
Sing
apor
e/In
done
sia10
100
58.3
810
041
.62
-
Gol
dwat
er K
P Pt
e. L
td.(b
) Ex
plor
atio
n an
d op
erat
ion
of o
il field
s fo
r cru
de p
etro
leum
pro
duct
ion
Sing
apor
e/In
done
sia10
010
010
0-
--
PT M
itra
Inve
stin
do T
bk.(e
)O
pera
tion
of g
rani
te m
inin
g In
done
sia/In
done
sia53
.76
-53
.76
-46
.24
-
Hel
d by
a s
ubsi
diar
y,
PT M
itra
Inve
stin
do T
bk.
Gol
dwat
er L
S Pt
e. L
td (b
)Ex
plor
atio
n an
d op
erat
ion
of o
il field
s fo
r cru
de p
etro
leum
pro
duct
ion
Sing
apor
e/In
done
sia90
-58
.38
-41
.62
-
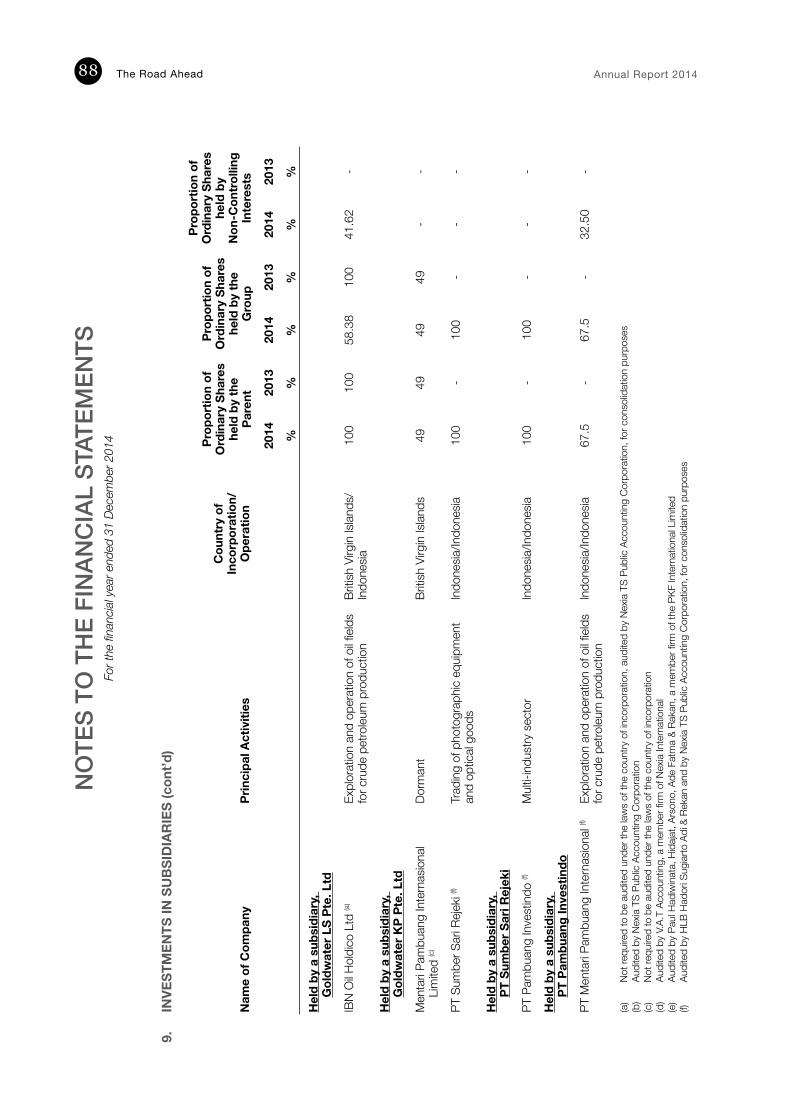
The Road Ahead Annual Report 201488
9.
INVE
STM
ENTS
IN S
UBS
IDIA
RIE
S (c
ont’d
)
Nam
e of
Com
pany
Prin
cipa
l Act
iviti
es
Cou
ntry
of
Inco
rpor
atio
n/
Ope
ratio
n
Prop
ortio
n of
O
rdin
ary
Shar
es
held
by
the
Pare
nt
Pr
opor
tion
of
Ord
inar
y Sh
ares
he
ld b
y th
e G
roup
Prop
ortio
n of
O
rdin
ary
Shar
es
held
by
Non
-Con
trol
ling
Inte
rest
s
2014
2013
2014
2013
2014
2013
%%
%%
%%
Hel
d by
a s
ubsi
diar
y,
Gol
dwat
er L
S Pt
e. L
td
IBN
Oil H
oldi
co L
td (a
)Ex
plor
atio
n an
d op
erat
ion
of o
il field
s fo
r cru
de p
etro
leum
pro
duct
ion
Britis
h Vi
rgin
Islan
ds/
Indo
nesia
100
100
58.3
810
041
.62
-
Hel
d by
a s
ubsi
diar
y,
Gol
dwat
er K
P Pt
e. L
td
Men
tari
Pam
buan
g In
tern
asio
nal
Lim
ited
(c)
Dorm
ant
Britis
h Vi
rgin
Islan
ds49
4949
49-
-
PT S
umbe
r Sar
i Reje
ki (f)
Trad
ing
of p
hoto
grap
hic
equi
pmen
t an
d op
tical
good
sIn
done
sia/In
done
sia10
0-
100
--
-
Hel
d by
a s
ubsi
diar
y,
PT S
umbe
r Sar
i Rej
eki
PT P
ambu
ang
Inve
stin
do (f)
Mul
ti-in
dust
ry s
ecto
rIn
done
sia/In
done
sia10
0-
100
--
-
Hel
d by
a s
ubsi
diar
y,
PT P
ambu
ang
Inve
stin
do
PT M
enta
ri Pa
mbu
ang
Inte
rnas
iona
l (f)Ex
plor
atio
n an
d op
erat
ion
of o
il field
s fo
r cru
de p
etro
leum
pro
duct
ion
Indo
nesia
/Indo
nesia
67.5
-67
.5-
32.5
0-
(a)
No
t req
uire
d to
be
audi
ted
unde
r the
law
s of
the
coun
try o
f inc
orpo
ratio
n, a
udite
d by
Nex
ia TS
Pub
lic A
ccou
ntin
g Co
rpor
atio
n, fo
r con
solid
atio
n pu
rpos
es(b
) Au
dite
d by
Nex
ia TS
Pub
lic A
ccou
ntin
g Co
rpor
atio
n(c
)
Not r
equi
red
to b
e au
dite
d un
der t
he la
ws
of th
e co
untry
of i
ncor
pora
tion
(d)
Audi
ted
by V
.A.T
Acc
ount
ing,
a m
embe
r firm
of N
exia
Inte
rnat
iona
l(e
)
Audi
ted
by P
aul H
adiw
inat
a, H
idaja
t, Ar
sono
, Ade
Fat
ma
& Ra
kan,
a m
embe
r firm
of t
he P
KF In
tern
atio
nal L
imite
d (f)
Audi
ted
by H
LB H
ador
i Sug
iarto
Adi
& R
ekan
and
by
Nexia
TS
Publ
ic Ac
coun
ting
Corp
orat
ion,
for c
onso
lidat
ion
purp
oses
NO
TE
S T
O T
HE
FIN
AN
CIA
L S
TAT
EM
EN
TS
Forthefinancialyearended31De
cember2
014
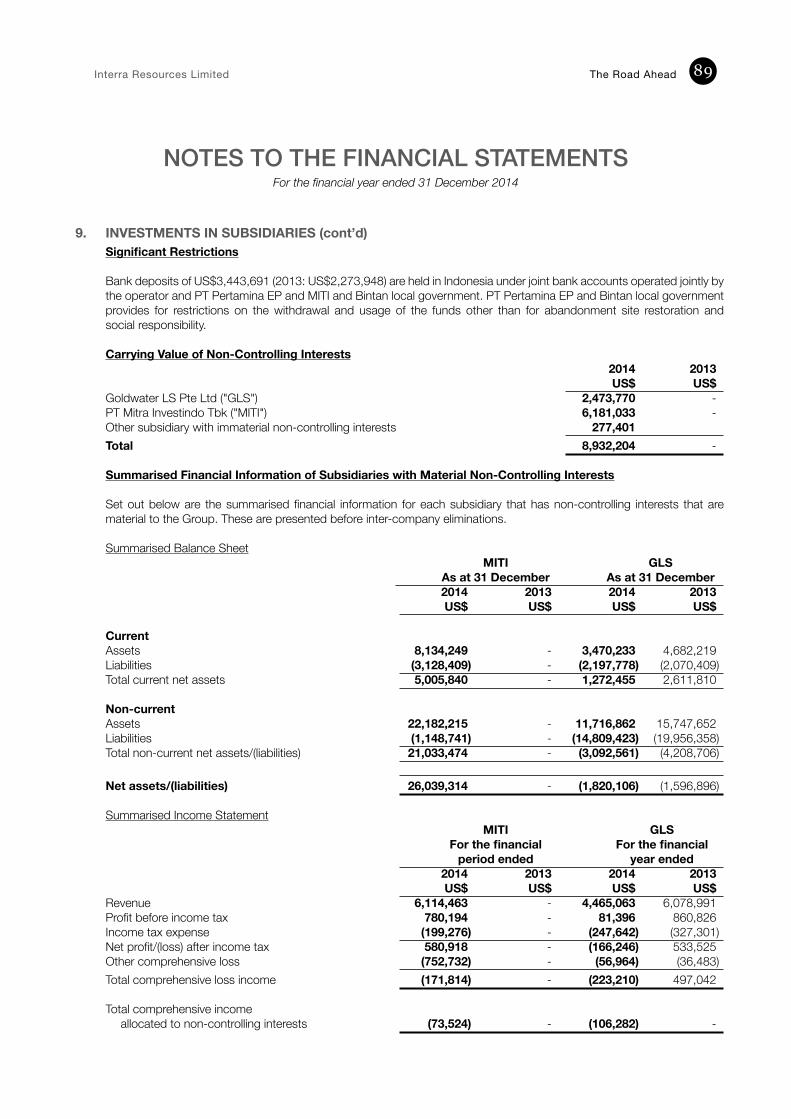
Interra Resources Limited The Road Ahead 89
NOTES TO THE FINANCIAL STATEMENTSFor the financial year ended 31 December 2014
9. INVESTMENTS IN SUBSIDIARIES (cont’d)Significant Restrictions
Bank deposits of US$3,443,691 (2013: US$2,273,948) are held in Indonesia under joint bank accounts operated jointly by the operator and PT Pertamina EP and MITI and Bintan local government. PT Pertamina EP and Bintan local government provides for restrictions on the withdrawal and usage of the funds other than for abandonment site restoration and social responsibility. Carrying Value of Non-Controlling Interests 2014 2013 US$ US$Goldwater LS Pte Ltd ("GLS") 2,473,770 -PT Mitra Investindo Tbk ("MITI") 6,181,033 -Other subsidiary with immaterial non-controlling interests 277,401 Total 8,932,204 - Summarised Financial Information of Subsidiaries with Material Non-Controlling Interests Set out below are the summarised financial information for each subsidiary that has non-controlling interests that are material to the Group. These are presented before inter-company eliminations. Summarised Balance Sheet
MITI GLS As at 31 December As at 31 December
2014 2013 2014 2013 US$ US$ US$ US$ CurrentAssets 8,134,249 - 3,470,233 4,682,219Liabilities (3,128,409) - (2,197,778) (2,070,409)Total current net assets 5,005,840 - 1,272,455 2,611,810
Non-currentAssets 22,182,215 - 11,716,862 15,747,652Liabilities (1,148,741) - (14,809,423) (19,956,358)Total non-current net assets/(liabilities) 21,033,474 - (3,092,561) (4,208,706)
Net assets/(liabilities) 26,039,314 - (1,820,106) (1,596,896)
Summarised Income Statement MITI GLS
For the financial For the financial period ended year ended 2014 2013 2014 2013 US$ US$ US$ US$Revenue 6,114,463 - 4,465,063 6,078,991Profit before income tax 780,194 - 81,396 860,826Income tax expense (199,276) - (247,642) (327,301)Net profit/(loss) after income tax 580,918 - (166,246) 533,525Other comprehensive loss (752,732) - (56,964) (36,483)Total comprehensive loss income (171,814) - (223,210) 497,042 Total comprehensive income
allocated to non-controlling interests (73,524) - (106,282) -
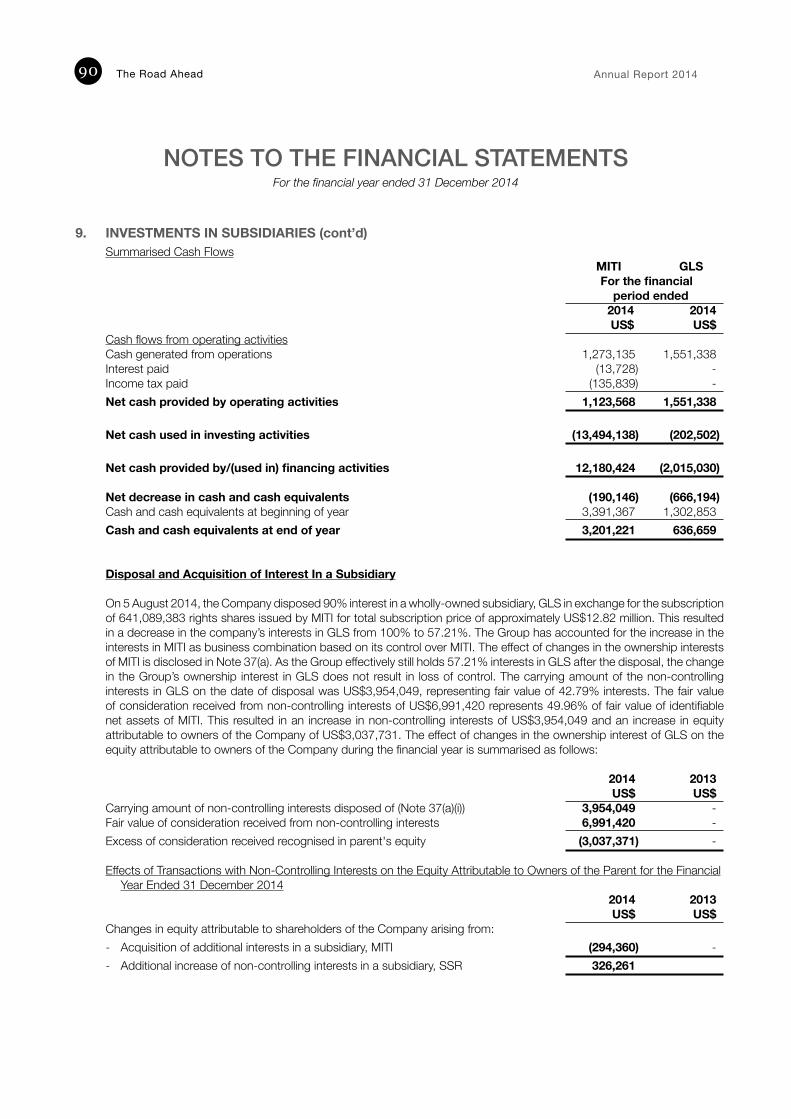
The Road Ahead Annual Report 201490
NOTES TO THE FINANCIAL STATEMENTSFor the financial year ended 31 December 2014
9. INVESTMENTS IN SUBSIDIARIES (cont’d)Summarised Cash Flows MITI GLS For the financial
period ended 2014 2014 US$ US$Cash flows from operating activities Cash generated from operations 1,273,135 1,551,338Interest paid (13,728) -Income tax paid (135,839) -Net cash provided by operating activities 1,123,568 1,551,338 Net cash used in investing activities (13,494,138) (202,502) Net cash provided by/(used in) financing activities 12,180,424 (2,015,030) Net decrease in cash and cash equivalents (190,146) (666,194)Cash and cash equivalents at beginning of year 3,391,367 1,302,853Cash and cash equivalents at end of year 3,201,221 636,659
Disposal and Acquisition of Interest In a Subsidiary On 5 August 2014, the Company disposed 90% interest in a wholly-owned subsidiary, GLS in exchange for the subscription of 641,089,383 rights shares issued by MITI for total subscription price of approximately US$12.82 million. This resulted in a decrease in the company’s interests in GLS from 100% to 57.21%. The Group has accounted for the increase in the interests in MITI as business combination based on its control over MITI. The effect of changes in the ownership interests of MITI is disclosed in Note 37(a). As the Group effectively still holds 57.21% interests in GLS after the disposal, the change in the Group’s ownership interest in GLS does not result in loss of control. The carrying amount of the non-controlling interests in GLS on the date of disposal was US$3,954,049, representing fair value of 42.79% interests. The fair value of consideration received from non-controlling interests of US$6,991,420 represents 49.96% of fair value of identifiable net assets of MITI. This resulted in an increase in non-controlling interests of US$3,954,049 and an increase in equity attributable to owners of the Company of US$3,037,731. The effect of changes in the ownership interest of GLS on the equity attributable to owners of the Company during the financial year is summarised as follows:
2014 2013 US$ US$Carrying amount of non-controlling interests disposed of (Note 37(a)(i)) 3,954,049 -Fair value of consideration received from non-controlling interests 6,991,420 -Excess of consideration received recognised in parent's equity (3,037,371) - Effects of Transactions with Non-Controlling Interests on the Equity Attributable to Owners of the Parent for the Financial
Year Ended 31 December 2014 2014 2013 US$ US$Changes in equity attributable to shareholders of the Company arising from:- Acquisition of additional interests in a subsidiary, MITI (294,360) -- Additional increase of non-controlling interests in a subsidiary, SSR 326,261

Interra Resources Limited The Road Ahead 91
NOTES TO THE FINANCIAL STATEMENTSFor the financial year ended 31 December 2014
10. INVESTMENT PROPERTIES Group 2014 2013 US$ US$ Opening balance - - Acquisition of subsidiary (Note 37(a)(iv)) 237,772 - Currency translation differences (11,509) Closing balance 226,263 -
Investment properties are held for long-term rental yields and/or for capital appreciation. During the financial year, the Group’s investment properties are not leased out, accordingly no rental income is recognised in profit or loss and no significant direct operating expenses incurred.
The Group has no restrictions on the realisability of its investment properties and no contractual obligations to purchase, construct or develop investment properties or for repairs, maintenance or enhancements.
Location Description/Existing use Tenure
Villa Coolibah, Cimacan Village, Pacet District, Cianjur Regency, West Java
Land/vacant Freehold
Komplek Ruko Buana Subur Regency Blok D No. 1-2 and Blok No. 33, Kutajaya Village, Pasar Kemis District, Tangerang Regency, Banten
3 units of shop houses/vacant Leasehold with 25 years lease expiring on 24 October 2015
ITC Kuningan, 4th Floor Block B9 No. 7, Jalan Prof. Dr. Satrio, Karet Kuningan Village, Setiabudi District, Jakarta Selatan City, DKI Jakarta
Kiosk/vacant Leasehold with 20 years lease expiring on 10 November 2027
All of the above investment properties are measured at fair value using significant other observable inputs (Level 2).
Valuation Techniques Used to Derive Level 2 Fair Values Level 2 fair values of the Group’s properties have been derived using sales comparison approach. Sales price of comparable properties in close proximity are adjusted for differences in key attributable such as property size. The most significant input in this valuation approach is the selling price per square metre. Valuation Processes of the Group The Group engages external, independent and qualified valuers to determine the fair value of the Group’s properties at the end of financial year based on the properties’ highest and best use. As at 31 December 2014, the fair values of the properties have been determined by Nirboyo A., Dewi A., & Rekan.
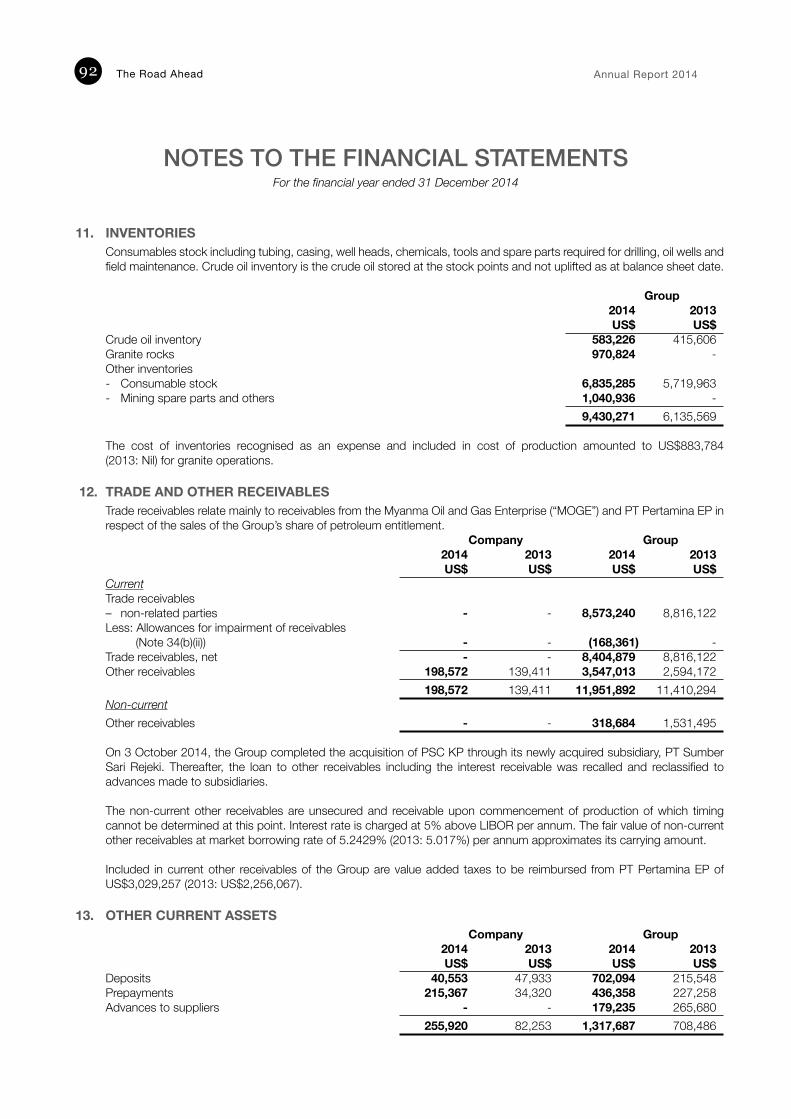
The Road Ahead Annual Report 201492
NOTES TO THE FINANCIAL STATEMENTSFor the financial year ended 31 December 2014
11. INVENTORIES Consumables stock including tubing, casing, well heads, chemicals, tools and spare parts required for drilling, oil wells and field maintenance. Crude oil inventory is the crude oil stored at the stock points and not uplifted as at balance sheet date.
Group 2014 2013 US$ US$ Crude oil inventory 583,226 415,606 Granite rocks 970,824 - Other inventories- Consumable stock 6,835,285 5,719,963- Mining spare parts and others 1,040,936 - 9,430,271 6,135,569
The cost of inventories recognised as an expense and included in cost of production amounted to US$883,784 (2013: Nil) for granite operations.
12. TRADE AND OTHER RECEIVABLES Trade receivables relate mainly to receivables from the Myanma Oil and Gas Enterprise (“MOGE”) and PT Pertamina EP in respect of the sales of the Group’s share of petroleum entitlement. Company Group 2014 2013 2014 2013 US$ US$ US$ US$CurrentTrade receivables – non-related parties - - 8,573,240 8,816,122Less: Allowances for impairment of receivables
(Note 34(b)(ii)) - - (168,361) -Trade receivables, net - - 8,404,879 8,816,122Other receivables 198,572 139,411 3,547,013 2,594,172 198,572 139,411 11,951,892 11,410,294Non-currentOther receivables - - 318,684 1,531,495
On 3 October 2014, the Group completed the acquisition of PSC KP through its newly acquired subsidiary, PT Sumber Sari Rejeki. Thereafter, the loan to other receivables including the interest receivable was recalled and reclassified to advances made to subsidiaries.
The non-current other receivables are unsecured and receivable upon commencement of production of which timing cannot be determined at this point. Interest rate is charged at 5% above LIBOR per annum. The fair value of non-current other receivables at market borrowing rate of 5.2429% (2013: 5.017%) per annum approximates its carrying amount. Included in current other receivables of the Group are value added taxes to be reimbursed from PT Pertamina EP of US$3,029,257 (2013: US$2,256,067).
13. OTHER CURRENT ASSETS Company Group 2014 2013 2014 2013 US$ US$ US$ US$Deposits 40,553 47,933 702,094 215,548Prepayments 215,367 34,320 436,358 227,258Advances to suppliers - - 179,235 265,680 255,920 82,253 1,317,687 708,486
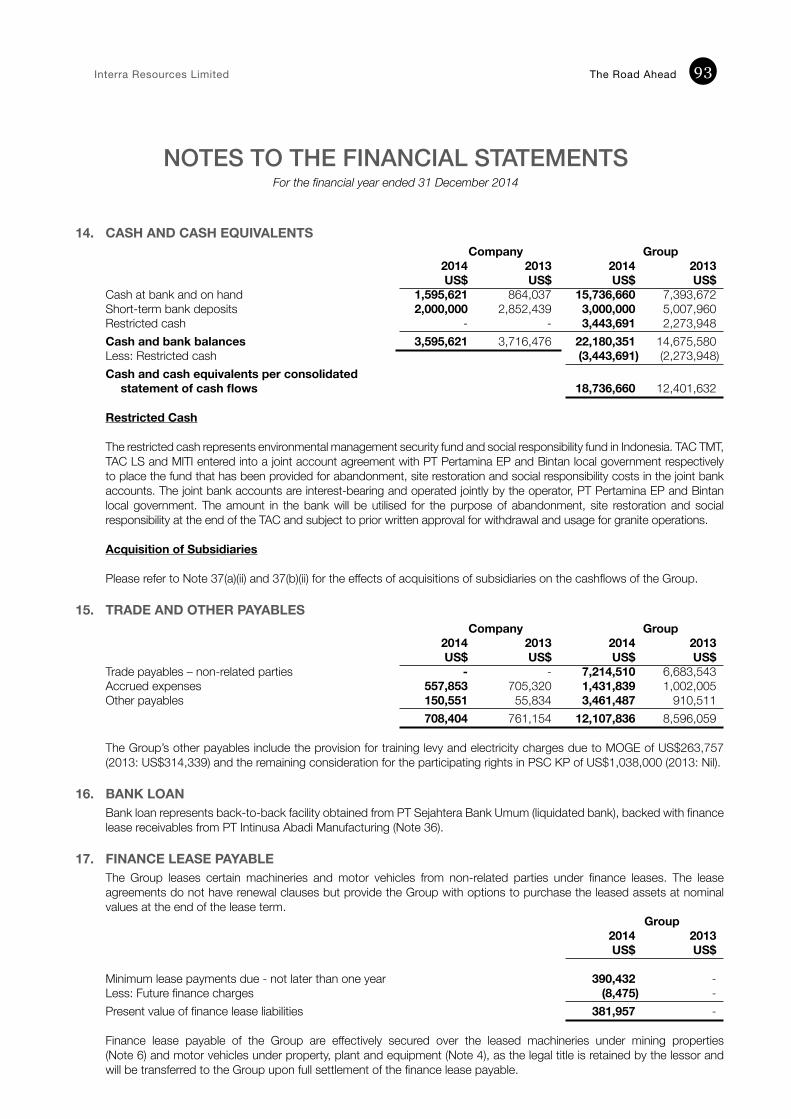
Interra Resources Limited The Road Ahead 93
NOTES TO THE FINANCIAL STATEMENTSFor the financial year ended 31 December 2014
14. CASH AND CASH EQUIVALENTS Company Group 2014 2013 2014 2013 US$ US$ US$ US$ Cash at bank and on hand 1,595,621 864,037 15,736,660 7,393,672 Short-term bank deposits 2,000,000 2,852,439 3,000,000 5,007,960 Restricted cash - - 3,443,691 2,273,948 Cash and bank balances 3,595,621 3,716,476 22,180,351 14,675,580 Less: Restricted cash (3,443,691) (2,273,948) Cash and cash equivalents per consolidated
statement of cash flows 18,736,660 12,401,632
Restricted Cash
The restricted cash represents environmental management security fund and social responsibility fund in Indonesia. TAC TMT, TAC LS and MITI entered into a joint account agreement with PT Pertamina EP and Bintan local government respectively to place the fund that has been provided for abandonment, site restoration and social responsibility costs in the joint bank accounts. The joint bank accounts are interest-bearing and operated jointly by the operator, PT Pertamina EP and Bintan local government. The amount in the bank will be utilised for the purpose of abandonment, site restoration and social responsibility at the end of the TAC and subject to prior written approval for withdrawal and usage for granite operations. Acquisition of Subsidiaries Please refer to Note 37(a)(ii) and 37(b)(ii) for the effects of acquisitions of subsidiaries on the cashflows of the Group.
15. TRADE AND OTHER PAYABLES Company Group 2014 2013 2014 2013 US$ US$ US$ US$ Trade payables – non-related parties - - 7,214,510 6,683,543 Accrued expenses 557,853 705,320 1,431,839 1,002,005 Other payables 150,551 55,834 3,461,487 910,511 708,404 761,154 12,107,836 8,596,059 The Group’s other payables include the provision for training levy and electricity charges due to MOGE of US$263,757 (2013: US$314,339) and the remaining consideration for the participating rights in PSC KP of US$1,038,000 (2013: Nil).
16. BANK LOAN Bank loan represents back-to-back facility obtained from PT Sejahtera Bank Umum (liquidated bank), backed with finance lease receivables from PT Intinusa Abadi Manufacturing (Note 36).
17. FINANCE LEASE PAYABLEThe Group leases certain machineries and motor vehicles from non-related parties under finance leases. The lease agreements do not have renewal clauses but provide the Group with options to purchase the leased assets at nominal values at the end of the lease term. Group 2014 2013 US$ US$
Minimum lease payments due - not later than one year 390,432 -Less: Future finance charges (8,475) -Present value of finance lease liabilities 381,957 - Finance lease payable of the Group are effectively secured over the leased machineries under mining properties (Note 6) and motor vehicles under property, plant and equipment (Note 4), as the legal title is retained by the lessor and will be transferred to the Group upon full settlement of the finance lease payable.
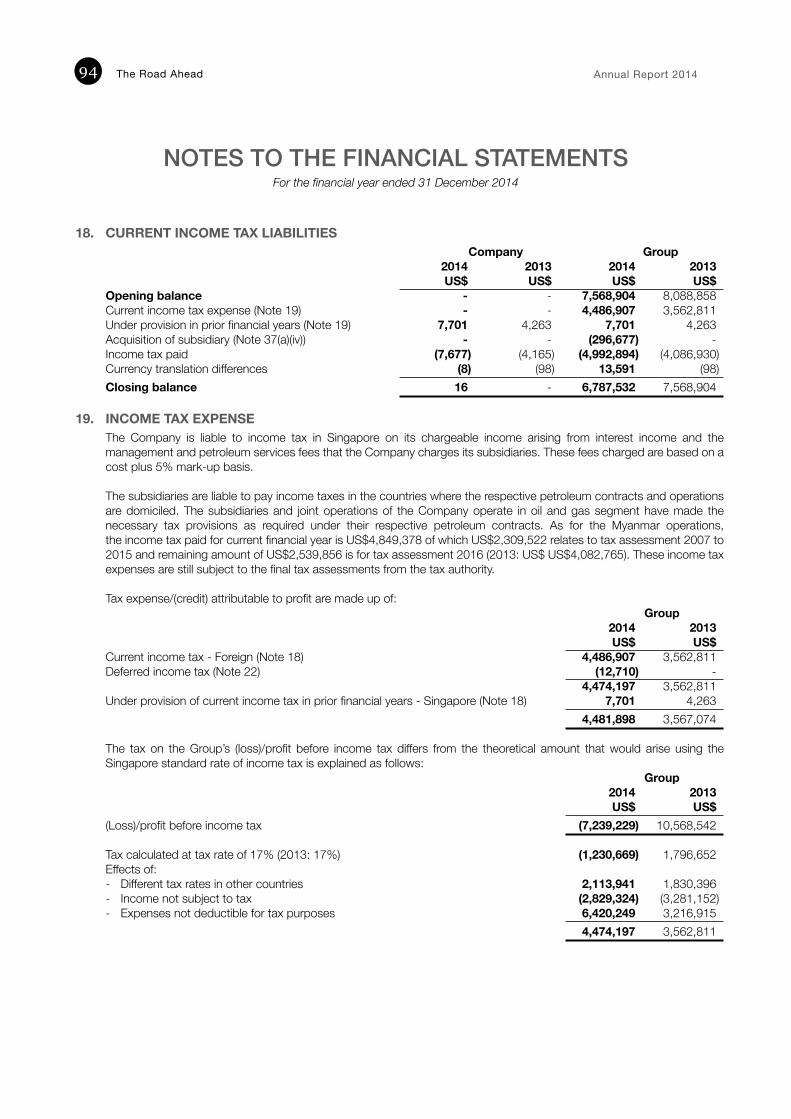
The Road Ahead Annual Report 201494
NOTES TO THE FINANCIAL STATEMENTSFor the financial year ended 31 December 2014
18. CURRENT INCOME TAX LIABILITIES Company Group 2014 2013 2014 2013 US$ US$ US$ US$ Opening balance - - 7,568,904 8,088,858 Current income tax expense (Note 19) - - 4,486,907 3,562,811 Under provision in prior financial years (Note 19) 7,701 4,263 7,701 4,263 Acquisition of subsidiary (Note 37(a)(iv)) - - (296,677) - Income tax paid (7,677) (4,165) (4,992,894) (4,086,930) Currency translation differences (8) (98) 13,591 (98) Closing balance 16 - 6,787,532 7,568,904
19. INCOME TAX EXPENSE The Company is liable to income tax in Singapore on its chargeable income arising from interest income and the management and petroleum services fees that the Company charges its subsidiaries. These fees charged are based on a cost plus 5% mark-up basis. The subsidiaries are liable to pay income taxes in the countries where the respective petroleum contracts and operations are domiciled. The subsidiaries and joint operations of the Company operate in oil and gas segment have made the necessary tax provisions as required under their respective petroleum contracts. As for the Myanmar operations, the income tax paid for current financial year is US$4,849,378 of which US$2,309,522 relates to tax assessment 2007 to 2015 and remaining amount of US$2,539,856 is for tax assessment 2016 (2013: US$ US$4,082,765). These income tax expenses are still subject to the final tax assessments from the tax authority.
Tax expense/(credit) attributable to profit are made up of: Group 2014 2013 US$ US$Current income tax - Foreign (Note 18) 4,486,907 3,562,811Deferred income tax (Note 22) (12,710) - 4,474,197 3,562,811Under provision of current income tax in prior financial years - Singapore (Note 18) 7,701 4,263 4,481,898 3,567,074 The tax on the Group’s (loss)/profit before income tax differs from the theoretical amount that would arise using the Singapore standard rate of income tax is explained as follows: Group 2014 2013 US$ US$(Loss)/profit before income tax (7,239,229) 10,568,542
Tax calculated at tax rate of 17% (2013: 17%) (1,230,669) 1,796,652Effects of: - Different tax rates in other countries 2,113,941 1,830,396- Income not subject to tax (2,829,324) (3,281,152)- Expenses not deductible for tax purposes 6,420,249 3,216,915 4,474,197 3,562,811
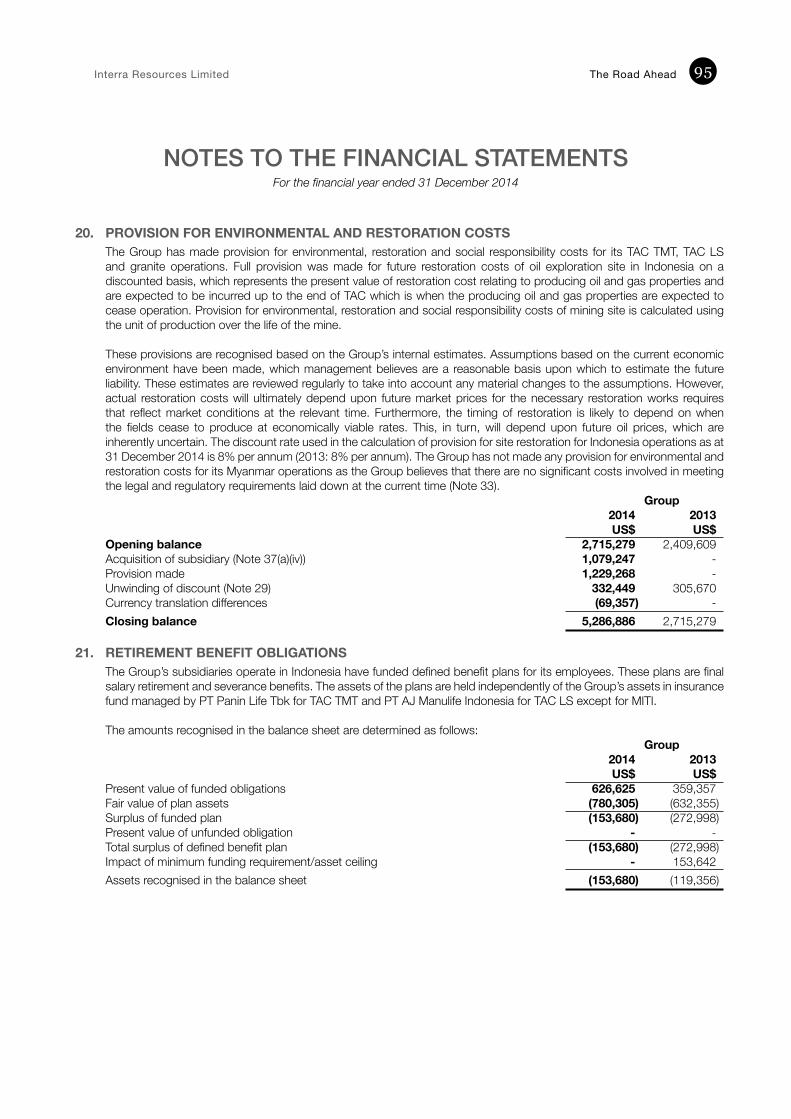
Interra Resources Limited The Road Ahead 95
NOTES TO THE FINANCIAL STATEMENTSFor the financial year ended 31 December 2014
20. PROVISION FOR ENVIRONMENTAL AND RESTORATION COSTS The Group has made provision for environmental, restoration and social responsibility costs for its TAC TMT, TAC LS and granite operations. Full provision was made for future restoration costs of oil exploration site in Indonesia on a discounted basis, which represents the present value of restoration cost relating to producing oil and gas properties and are expected to be incurred up to the end of TAC which is when the producing oil and gas properties are expected to cease operation. Provision for environmental, restoration and social responsibility costs of mining site is calculated using the unit of production over the life of the mine.
These provisions are recognised based on the Group’s internal estimates. Assumptions based on the current economic environment have been made, which management believes are a reasonable basis upon which to estimate the future liability. These estimates are reviewed regularly to take into account any material changes to the assumptions. However, actual restoration costs will ultimately depend upon future market prices for the necessary restoration works requires that reflect market conditions at the relevant time. Furthermore, the timing of restoration is likely to depend on when the fields cease to produce at economically viable rates. This, in turn, will depend upon future oil prices, which are inherently uncertain. The discount rate used in the calculation of provision for site restoration for Indonesia operations as at 31 December 2014 is 8% per annum (2013: 8% per annum). The Group has not made any provision for environmental and restoration costs for its Myanmar operations as the Group believes that there are no significant costs involved in meeting the legal and regulatory requirements laid down at the current time (Note 33). Group 2014 2013 US$ US$ Opening balance 2,715,279 2,409,609 Acquisition of subsidiary (Note 37(a)(iv)) 1,079,247 - Provision made 1,229,268 - Unwinding of discount (Note 29) 332,449 305,670 Currency translation differences (69,357) - Closing balance 5,286,886 2,715,279
21. RETIREMENT BENEFIT OBLIGATIONS The Group’s subsidiaries operate in Indonesia have funded defined benefit plans for its employees. These plans are final salary retirement and severance benefits. The assets of the plans are held independently of the Group’s assets in insurance fund managed by PT Panin Life Tbk for TAC TMT and PT AJ Manulife Indonesia for TAC LS except for MITI.
The amounts recognised in the balance sheet are determined as follows: Group 2014 2013 US$ US$Present value of funded obligations 626,625 359,357Fair value of plan assets (780,305) (632,355)Surplus of funded plan (153,680) (272,998)Present value of unfunded obligation - -Total surplus of defined benefit plan (153,680) (272,998)Impact of minimum funding requirement/asset ceiling - 153,642Assets recognised in the balance sheet (153,680) (119,356)
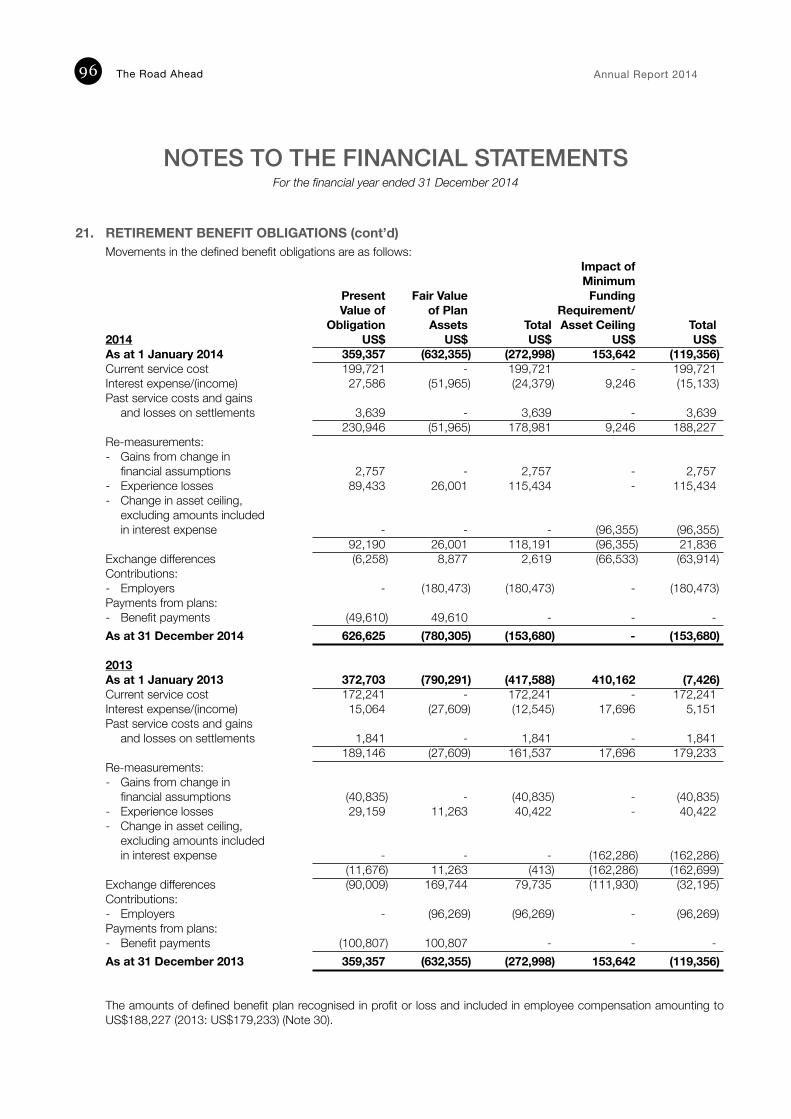
The Road Ahead Annual Report 201496
NOTES TO THE FINANCIAL STATEMENTSFor the financial year ended 31 December 2014
21. RETIREMENT BENEFIT OBLIGATIONS (cont’d) Movements in the defined benefit obligations are as follows: Impact of Minimum Present Fair Value Funding Value of of Plan Requirement/ Obligation Assets Total Asset Ceiling Total2014 US$ US$ US$ US$ US$As at 1 January 2014 359,357 (632,355) (272,998) 153,642 (119,356)Current service cost 199,721 - 199,721 - 199,721Interest expense/(income) 27,586 (51,965) (24,379) 9,246 (15,133)Past service costs and gains
and losses on settlements 3,639 - 3,639 - 3,639 230,946 (51,965) 178,981 9,246 188,227Re-measurements: - Gains from change in
financial assumptions 2,757 - 2,757 - 2,757- Experience losses 89,433 26,001 115,434 - 115,434- Change in asset ceiling,
excluding amounts includedin interest expense - - - (96,355) (96,355)
92,190 26,001 118,191 (96,355) 21,836Exchange differences (6,258) 8,877 2,619 (66,533) (63,914)Contributions:- Employers - (180,473) (180,473) - (180,473)Payments from plans:- Benefit payments (49,610) 49,610 - - -As at 31 December 2014 626,625 (780,305) (153,680) - (153,680)
2013As at 1 January 2013 372,703 (790,291) (417,588) 410,162 (7,426)Current service cost 172,241 - 172,241 - 172,241Interest expense/(income) 15,064 (27,609) (12,545) 17,696 5,151Past service costs and gains
and losses on settlements 1,841 - 1,841 - 1,841 189,146 (27,609) 161,537 17,696 179,233Re-measurements:- Gains from change in
financial assumptions (40,835) - (40,835) - (40,835)- Experience losses 29,159 11,263 40,422 - 40,422- Change in asset ceiling,
excluding amounts includedin interest expense - - - (162,286) (162,286)
(11,676) 11,263 (413) (162,286) (162,699)Exchange differences (90,009) 169,744 79,735 (111,930) (32,195)Contributions: - Employers - (96,269) (96,269) - (96,269)Payments from plans: - Benefit payments (100,807) 100,807 - - -As at 31 December 2013 359,357 (632,355) (272,998) 153,642 (119,356)
The amounts of defined benefit plan recognised in profit or loss and included in employee compensation amounting to US$188,227 (2013: US$179,233) (Note 30).
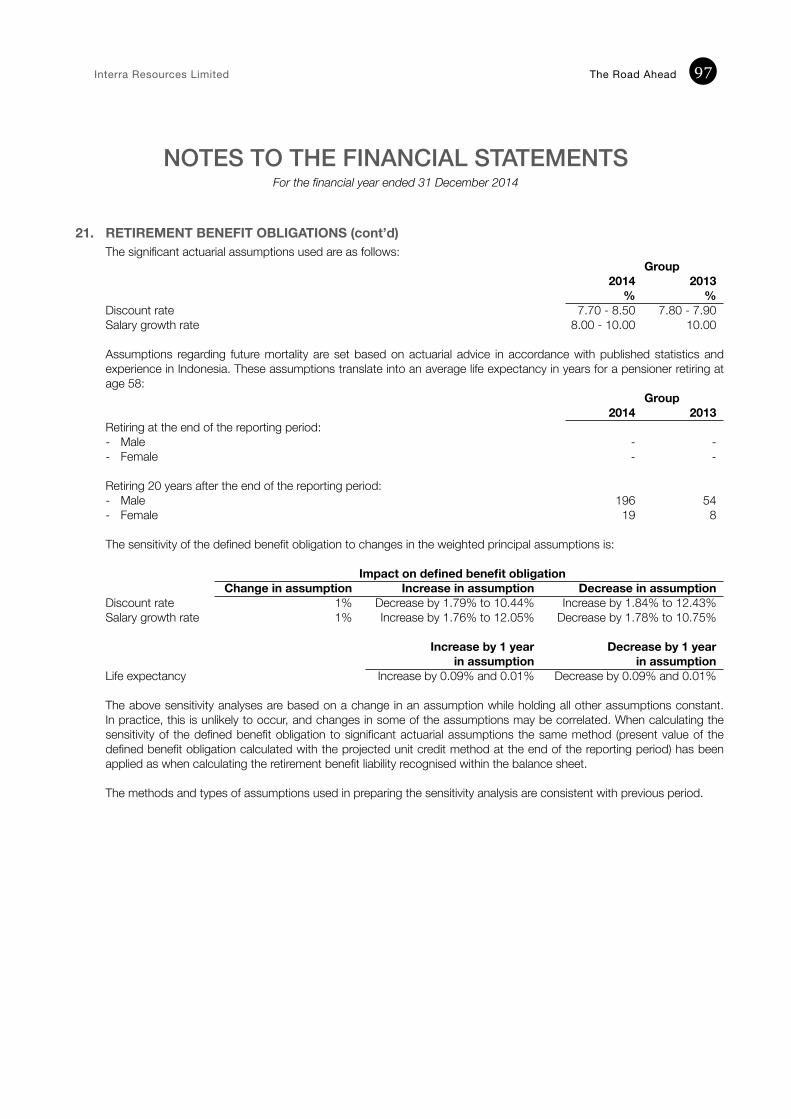
Interra Resources Limited The Road Ahead 97
NOTES TO THE FINANCIAL STATEMENTSFor the financial year ended 31 December 2014
21. RETIREMENT BENEFIT OBLIGATIONS (cont’d)The significant actuarial assumptions used are as follows: Group 2014 2013 % %Discount rate 7.70 - 8.50 7.80 - 7.90Salary growth rate 8.00 - 10.00 10.00
Assumptions regarding future mortality are set based on actuarial advice in accordance with published statistics and experience in Indonesia. These assumptions translate into an average life expectancy in years for a pensioner retiring at age 58: Group 2014 2013Retiring at the end of the reporting period: - Male - -- Female - - Retiring 20 years after the end of the reporting period: - Male 196 54- Female 19 8
The sensitivity of the defined benefit obligation to changes in the weighted principal assumptions is: Impact on defined benefit obligation Change in assumption Increase in assumption Decrease in assumption Discount rate 1% Decrease by 1.79% to 10.44% Increase by 1.84% to 12.43%Salary growth rate 1% Increase by 1.76% to 12.05% Decrease by 1.78% to 10.75%
Increase by 1 year Decrease by 1 year in assumption in assumptionLife expectancy Increase by 0.09% and 0.01% Decrease by 0.09% and 0.01% The above sensitivity analyses are based on a change in an assumption while holding all other assumptions constant. In practice, this is unlikely to occur, and changes in some of the assumptions may be correlated. When calculating the sensitivity of the defined benefit obligation to significant actuarial assumptions the same method (present value of the defined benefit obligation calculated with the projected unit credit method at the end of the reporting period) has been applied as when calculating the retirement benefit liability recognised within the balance sheet.
The methods and types of assumptions used in preparing the sensitivity analysis are consistent with previous period.
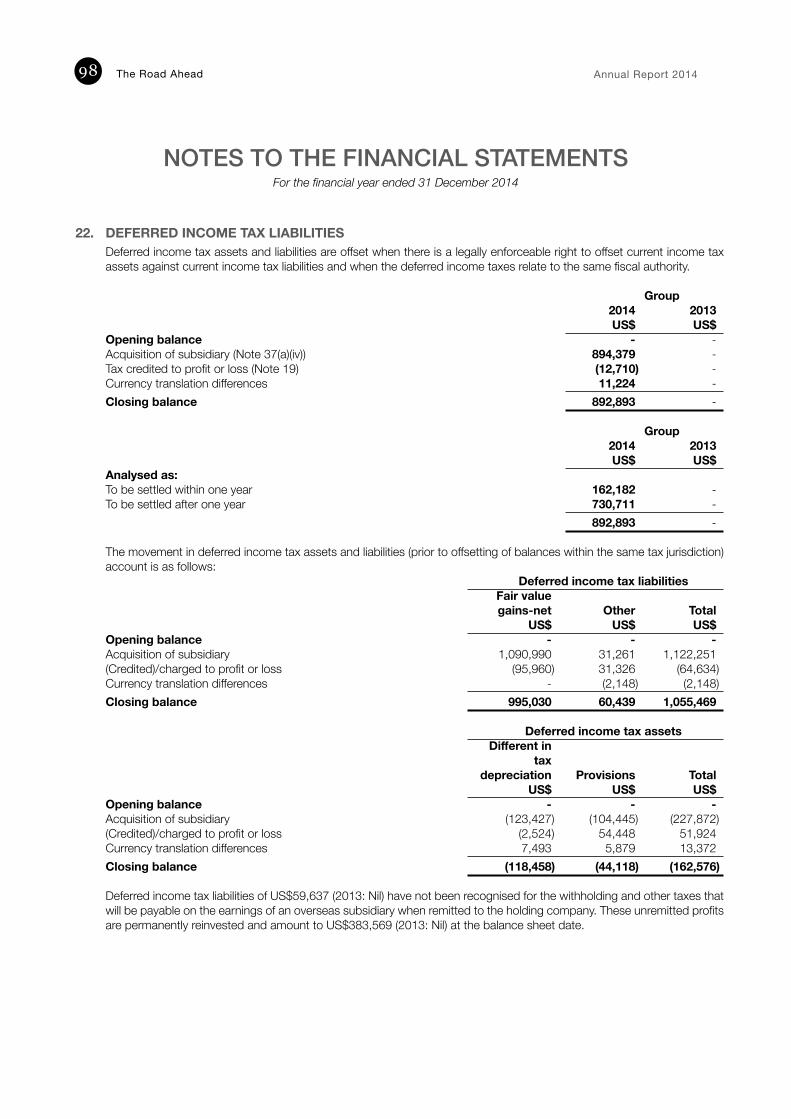
The Road Ahead Annual Report 201498
NOTES TO THE FINANCIAL STATEMENTSFor the financial year ended 31 December 2014
22. DEFERRED INCOME TAX LIABILITIES Deferred income tax assets and liabilities are offset when there is a legally enforceable right to offset current income tax assets against current income tax liabilities and when the deferred income taxes relate to the same fiscal authority.
Group 2014 2013 US$ US$Opening balance - -Acquisition of subsidiary (Note 37(a)(iv)) 894,379 -Tax credited to profit or loss (Note 19) (12,710) -Currency translation differences 11,224 -Closing balance 892,893 - Group 2014 2013 US$ US$Analysed as: To be settled within one year 162,182 -To be settled after one year 730,711 - 892,893 -
The movement in deferred income tax assets and liabilities (prior to offsetting of balances within the same tax jurisdiction) account is as follows: Deferred income tax liabilities Fair value gains-net Other Total US$ US$ US$Opening balance - - -Acquisition of subsidiary 1,090,990 31,261 1,122,251(Credited)/charged to profit or loss (95,960) 31,326 (64,634)Currency translation differences - (2,148) (2,148)Closing balance 995,030 60,439 1,055,469
Deferred income tax assets Different in tax depreciation Provisions Total US$ US$ US$Opening balance - - -Acquisition of subsidiary (123,427) (104,445) (227,872)(Credited)/charged to profit or loss (2,524) 54,448 51,924Currency translation differences 7,493 5,879 13,372Closing balance (118,458) (44,118) (162,576)
Deferred income tax liabilities of US$59,637 (2013: Nil) have not been recognised for the withholding and other taxes that will be payable on the earnings of an overseas subsidiary when remitted to the holding company. These unremitted profits are permanently reinvested and amount to US$383,569 (2013: Nil) at the balance sheet date.
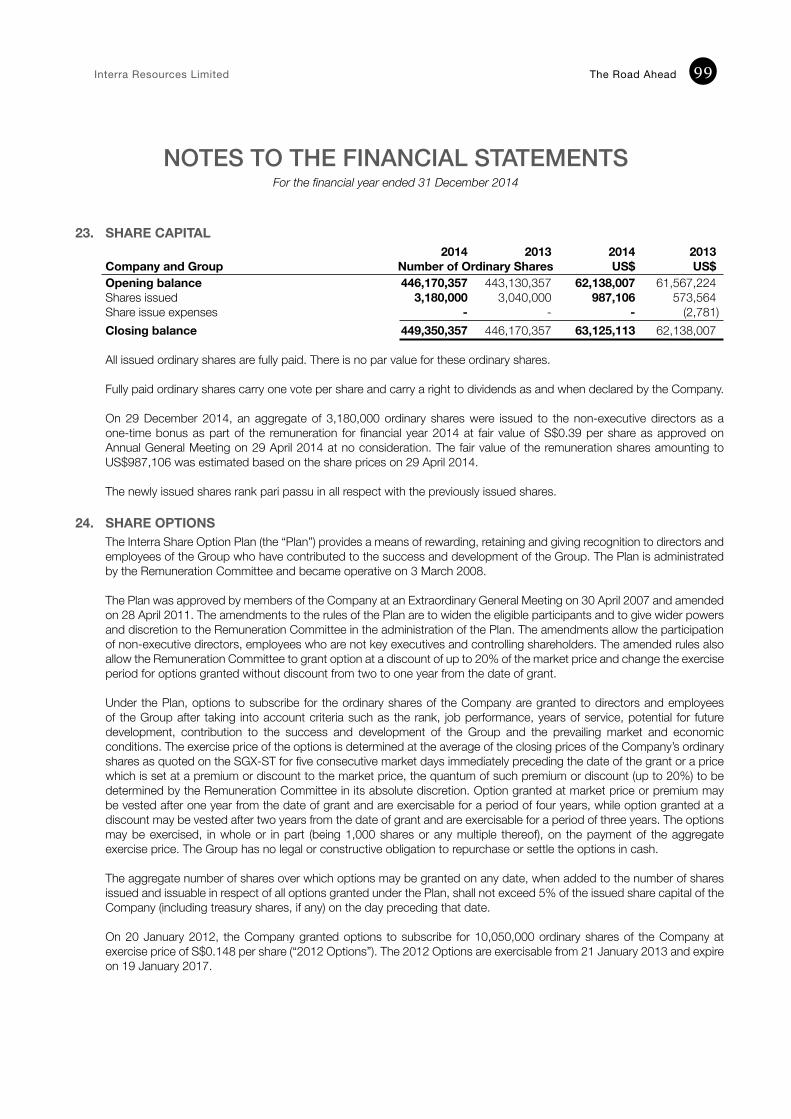
Interra Resources Limited The Road Ahead 99
NOTES TO THE FINANCIAL STATEMENTSFor the financial year ended 31 December 2014
23. SHARE CAPITAL 2014 2013 2014 2013Company and Group Number of Ordinary Shares US$ US$Opening balance 446,170,357 443,130,357 62,138,007 61,567,224Shares issued 3,180,000 3,040,000 987,106 573,564Share issue expenses - - - (2,781)Closing balance 449,350,357 446,170,357 63,125,113 62,138,007 All issued ordinary shares are fully paid. There is no par value for these ordinary shares. Fully paid ordinary shares carry one vote per share and carry a right to dividends as and when declared by the Company. On 29 December 2014, an aggregate of 3,180,000 ordinary shares were issued to the non-executive directors as a one-time bonus as part of the remuneration for financial year 2014 at fair value of S$0.39 per share as approved on Annual General Meeting on 29 April 2014 at no consideration. The fair value of the remuneration shares amounting to US$987,106 was estimated based on the share prices on 29 April 2014.
The newly issued shares rank pari passu in all respect with the previously issued shares.
24. SHARE OPTIONS
The Interra Share Option Plan (the “Plan”) provides a means of rewarding, retaining and giving recognition to directors and employees of the Group who have contributed to the success and development of the Group. The Plan is administrated by the Remuneration Committee and became operative on 3 March 2008. The Plan was approved by members of the Company at an Extraordinary General Meeting on 30 April 2007 and amended on 28 April 2011. The amendments to the rules of the Plan are to widen the eligible participants and to give wider powers and discretion to the Remuneration Committee in the administration of the Plan. The amendments allow the participation of non-executive directors, employees who are not key executives and controlling shareholders. The amended rules also allow the Remuneration Committee to grant option at a discount of up to 20% of the market price and change the exercise period for options granted without discount from two to one year from the date of grant.
Under the Plan, options to subscribe for the ordinary shares of the Company are granted to directors and employees of the Group after taking into account criteria such as the rank, job performance, years of service, potential for future development, contribution to the success and development of the Group and the prevailing market and economic conditions. The exercise price of the options is determined at the average of the closing prices of the Company’s ordinary shares as quoted on the SGX-ST for five consecutive market days immediately preceding the date of the grant or a price which is set at a premium or discount to the market price, the quantum of such premium or discount (up to 20%) to be determined by the Remuneration Committee in its absolute discretion. Option granted at market price or premium may be vested after one year from the date of grant and are exercisable for a period of four years, while option granted at a discount may be vested after two years from the date of grant and are exercisable for a period of three years. The options may be exercised, in whole or in part (being 1,000 shares or any multiple thereof), on the payment of the aggregate exercise price. The Group has no legal or constructive obligation to repurchase or settle the options in cash. The aggregate number of shares over which options may be granted on any date, when added to the number of shares issued and issuable in respect of all options granted under the Plan, shall not exceed 5% of the issued share capital of the Company (including treasury shares, if any) on the day preceding that date. On 20 January 2012, the Company granted options to subscribe for 10,050,000 ordinary shares of the Company at exercise price of S$0.148 per share (“2012 Options”). The 2012 Options are exercisable from 21 January 2013 and expire on 19 January 2017.
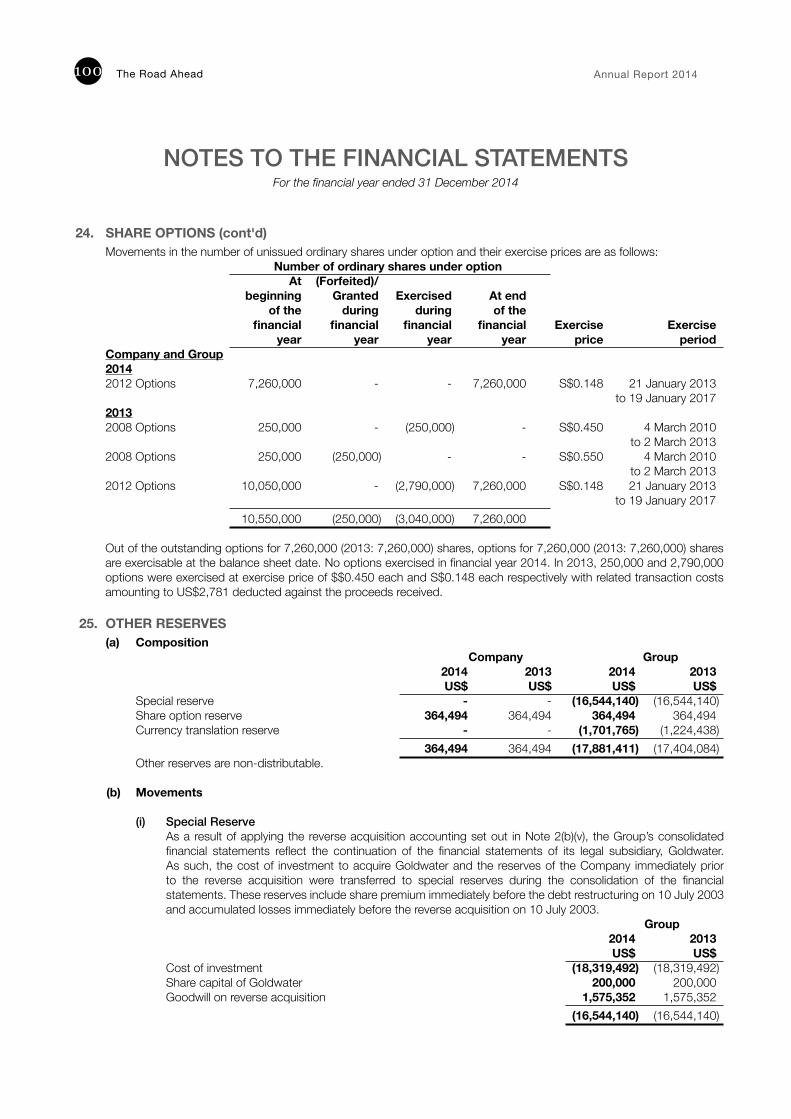
The Road Ahead Annual Report 2014100
NOTES TO THE FINANCIAL STATEMENTSFor the financial year ended 31 December 2014
24. SHARE OPTIONS (cont'd) Movements in the number of unissued ordinary shares under option and their exercise prices are as follows: Number of ordinary shares under option At (Forfeited)/ beginning Granted Exercised At end of the during during of the financial financial financial financial Exercise Exercise year year year year price period Company and Group 2014 2012 Options 7,260,000 - - 7,260,000 S$0.148 21 January 2013 to 19 January 2017 2013 2008 Options 250,000 - (250,000) - S$0.450 4 March 2010 to 2 March 20132008 Options 250,000 (250,000) - - S$0.550 4 March 2010 to 2 March 20132012 Options 10,050,000 - (2,790,000) 7,260,000 S$0.148 21 January 2013
to 19 January 2017 10,550,000 (250,000) (3,040,000) 7,260,000
Out of the outstanding options for 7,260,000 (2013: 7,260,000) shares, options for 7,260,000 (2013: 7,260,000) shares are exercisable at the balance sheet date. No options exercised in financial year 2014. In 2013, 250,000 and 2,790,000 options were exercised at exercise price of $$0.450 each and S$0.148 each respectively with related transaction costs amounting to US$2,781 deducted against the proceeds received.
25. OTHER RESERVES(a) Composition Company Group 2014 2013 2014 2013 US$ US$ US$ US$
Special reserve - - (16,544,140) (16,544,140) Share option reserve 364,494 364,494 364,494 364,494 Currency translation reserve - - (1,701,765) (1,224,438) 364,494 364,494 (17,881,411) (17,404,084) Other reserves are non-distributable.
(b) Movements (i) Special Reserve
As a result of applying the reverse acquisition accounting set out in Note 2(b)(v), the Group’s consolidated financial statements reflect the continuation of the financial statements of its legal subsidiary, Goldwater. As such, the cost of investment to acquire Goldwater and the reserves of the Company immediately prior to the reverse acquisition were transferred to special reserves during the consolidation of the financial statements. These reserves include share premium immediately before the debt restructuring on 10 July 2003 and accumulated losses immediately before the reverse acquisition on 10 July 2003.
Group 2014 2013 US$ US$
Cost of investment (18,319,492) (18,319,492) Share capital of Goldwater 200,000 200,000 Goodwill on reverse acquisition 1,575,352 1,575,352 (16,544,140) (16,544,140)
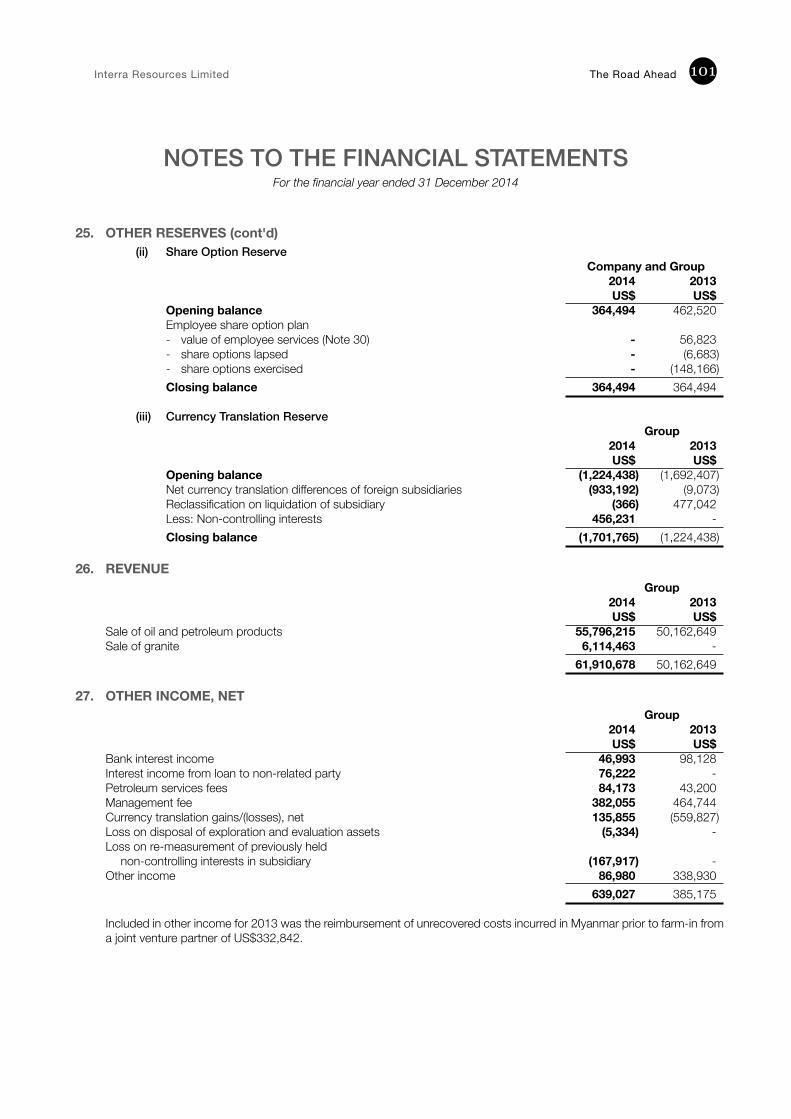
Interra Resources Limited The Road Ahead 101
NOTES TO THE FINANCIAL STATEMENTSFor the financial year ended 31 December 2014
25. OTHER RESERVES (cont'd)(ii) Share Option Reserve
Company and Group 2014 2013 US$ US$
Opening balance 364,494 462,520 Employee share option plan- value of employee services (Note 30) - 56,823- share options lapsed - (6,683)- share options exercised - (148,166) Closing balance 364,494 364,494
(iii) Currency Translation Reserve
Group 2014 2013 US$ US$
Opening balance (1,224,438) (1,692,407)Net currency translation differences of foreign subsidiaries (933,192) (9,073)Reclassification on liquidation of subsidiary (366) 477,042Less: Non-controlling interests 456,231 -Closing balance (1,701,765) (1,224,438)
26. REVENUE Group 2014 2013 US$ US$ Sale of oil and petroleum products 55,796,215 50,162,649 Sale of granite 6,114,463 - 61,910,678 50,162,649
27. OTHER INCOME, NET
Group 2014 2013 US$ US$ Bank interest income 46,993 98,128 Interest income from loan to non-related party 76,222 - Petroleum services fees 84,173 43,200 Management fee 382,055 464,744 Currency translation gains/(losses), net 135,855 (559,827)Loss on disposal of exploration and evaluation assets (5,334) - Loss on re-measurement of previously held
non-controlling interests in subsidiary (167,917) - Other income 86,980 338,930 639,027 385,175
Included in other income for 2013 was the reimbursement of unrecovered costs incurred in Myanmar prior to farm-in from a joint venture partner of US$332,842.
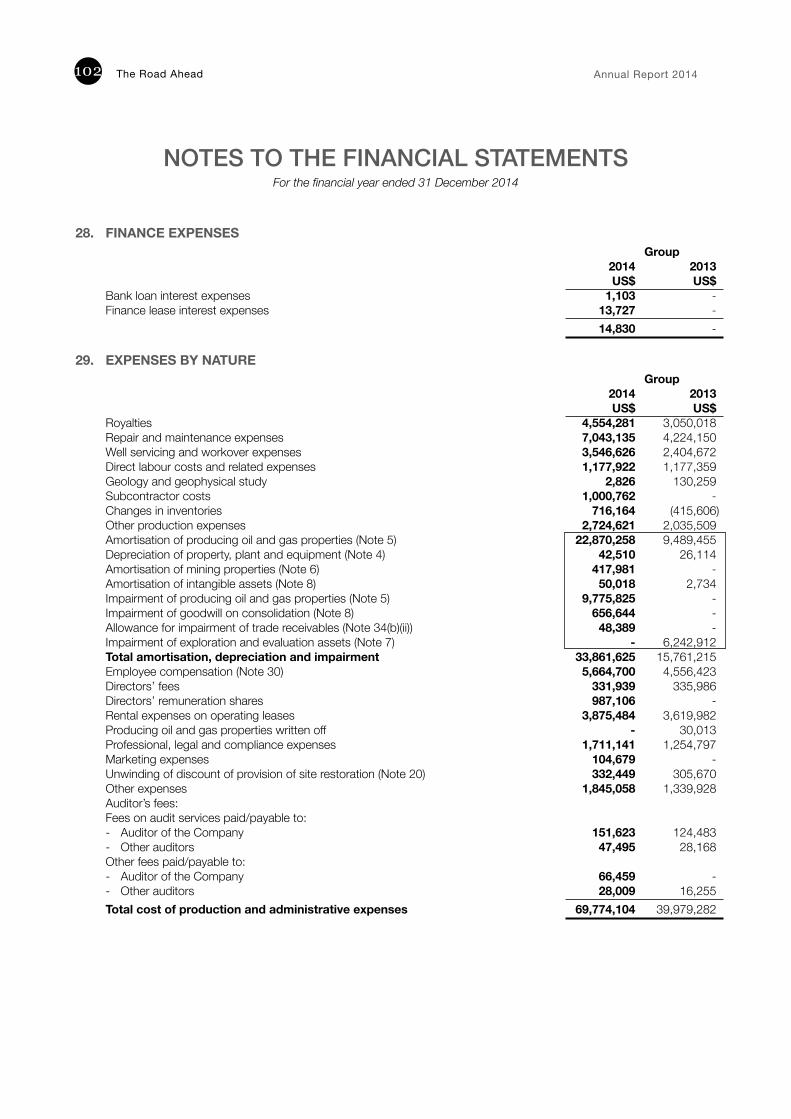
The Road Ahead Annual Report 2014102
NOTES TO THE FINANCIAL STATEMENTSFor the financial year ended 31 December 2014
28. FINANCE EXPENSES Group 2014 2013 US$ US$ Bank loan interest expenses 1,103 - Finance lease interest expenses 13,727 - 14,830 -
29. EXPENSES BY NATURE Group 2014 2013 US$ US$Royalties 4,554,281 3,050,018 Repair and maintenance expenses 7,043,135 4,224,150Well servicing and workover expenses 3,546,626 2,404,672 Direct labour costs and related expenses 1,177,922 1,177,359Geology and geophysical study 2,826 130,259Subcontractor costs 1,000,762 -Changes in inventories 716,164 (415,606)Other production expenses 2,724,621 2,035,509Amortisation of producing oil and gas properties (Note 5) 22,870,258 9,489,455 Depreciation of property, plant and equipment (Note 4) 42,510 26,114 Amortisation of mining properties (Note 6) 417,981 - Amortisation of intangible assets (Note 8) 50,018 2,734Impairment of producing oil and gas properties (Note 5) 9,775,825 - Impairment of goodwill on consolidation (Note 8) 656,644 -Allowance for impairment of trade receivables (Note 34(b)(ii)) 48,389 -Impairment of exploration and evaluation assets (Note 7) - 6,242,912Total amortisation, depreciation and impairment 33,861,625 15,761,215 Employee compensation (Note 30) 5,664,700 4,556,423 Directors’ fees 331,939 335,986Directors’ remuneration shares 987,106 - Rental expenses on operating leases 3,875,484 3,619,982Producing oil and gas properties written off - 30,013Professional, legal and compliance expenses 1,711,141 1,254,797Marketing expenses 104,679 -Unwinding of discount of provision of site restoration (Note 20) 332,449 305,670Other expenses 1,845,058 1,339,928Auditor’s fees:Fees on audit services paid/payable to:- Auditor of the Company 151,623 124,483- Other auditors 47,495 28,168 Other fees paid/payable to:- Auditor of the Company 66,459 -- Other auditors 28,009 16,255 Total cost of production and administrative expenses 69,774,104 39,979,282
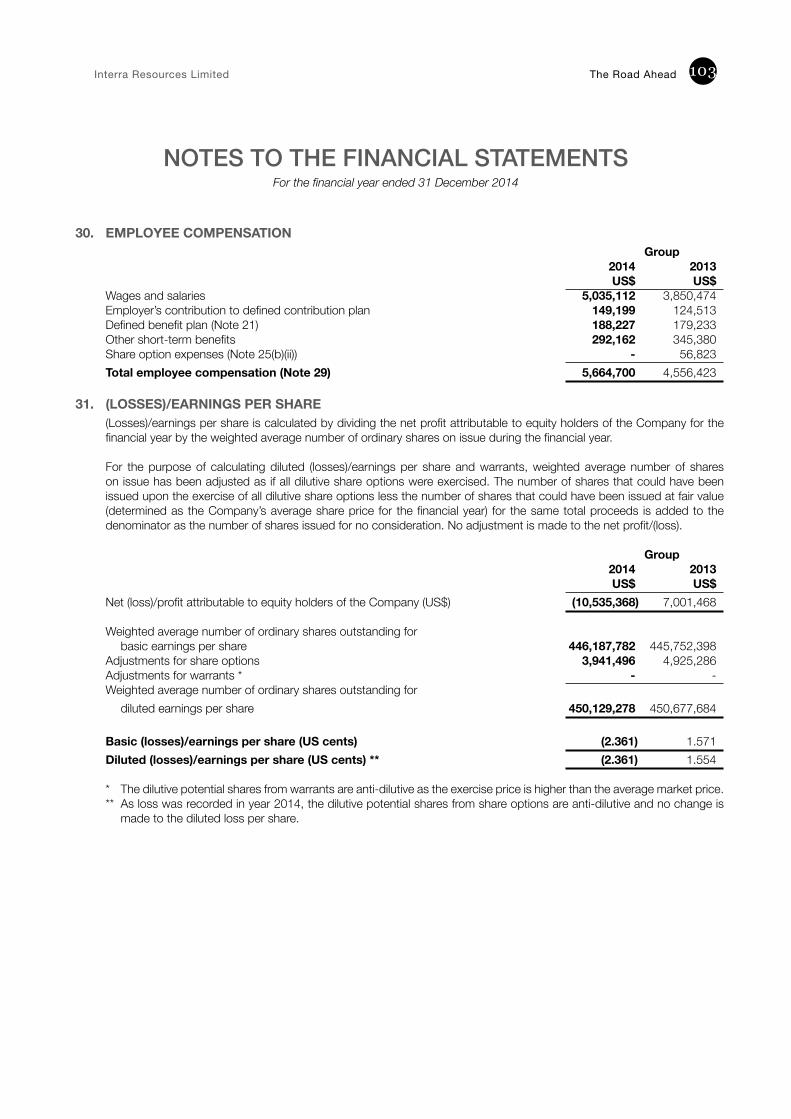
Interra Resources Limited The Road Ahead 103
NOTES TO THE FINANCIAL STATEMENTSFor the financial year ended 31 December 2014
30. EMPLOYEE COMPENSATION Group 2014 2013 US$ US$ Wages and salaries 5,035,112 3,850,474 Employer’s contribution to defined contribution plan 149,199 124,513 Defined benefit plan (Note 21) 188,227 179,233 Other short-term benefits 292,162 345,380 Share option expenses (Note 25(b)(ii)) - 56,823 Total employee compensation (Note 29) 5,664,700 4,556,423
31. (LOSSES)/EARNINGS PER SHARE (Losses)/earnings per share is calculated by dividing the net profit attributable to equity holders of the Company for the financial year by the weighted average number of ordinary shares on issue during the financial year. For the purpose of calculating diluted (losses)/earnings per share and warrants, weighted average number of shares on issue has been adjusted as if all dilutive share options were exercised. The number of shares that could have been issued upon the exercise of all dilutive share options less the number of shares that could have been issued at fair value (determined as the Company’s average share price for the financial year) for the same total proceeds is added to the denominator as the number of shares issued for no consideration. No adjustment is made to the net profit/(loss).
Group 2014 2013 US$ US$ Net (loss)/profit attributable to equity holders of the Company (US$) (10,535,368) 7,001,468 Weighted average number of ordinary shares outstanding for
basic earnings per share 446,187,782 445,752,398 Adjustments for share options 3,941,496 4,925,286 Adjustments for warrants * - - Weighted average number of ordinary shares outstanding for
diluted earnings per share 450,129,278 450,677,684 Basic (losses)/earnings per share (US cents) (2.361) 1.571 Diluted (losses)/earnings per share (US cents) ** (2.361) 1.554 * The dilutive potential shares from warrants are anti-dilutive as the exercise price is higher than the average market price.** As loss was recorded in year 2014, the dilutive potential shares from share options are anti-dilutive and no change is
made to the diluted loss per share.
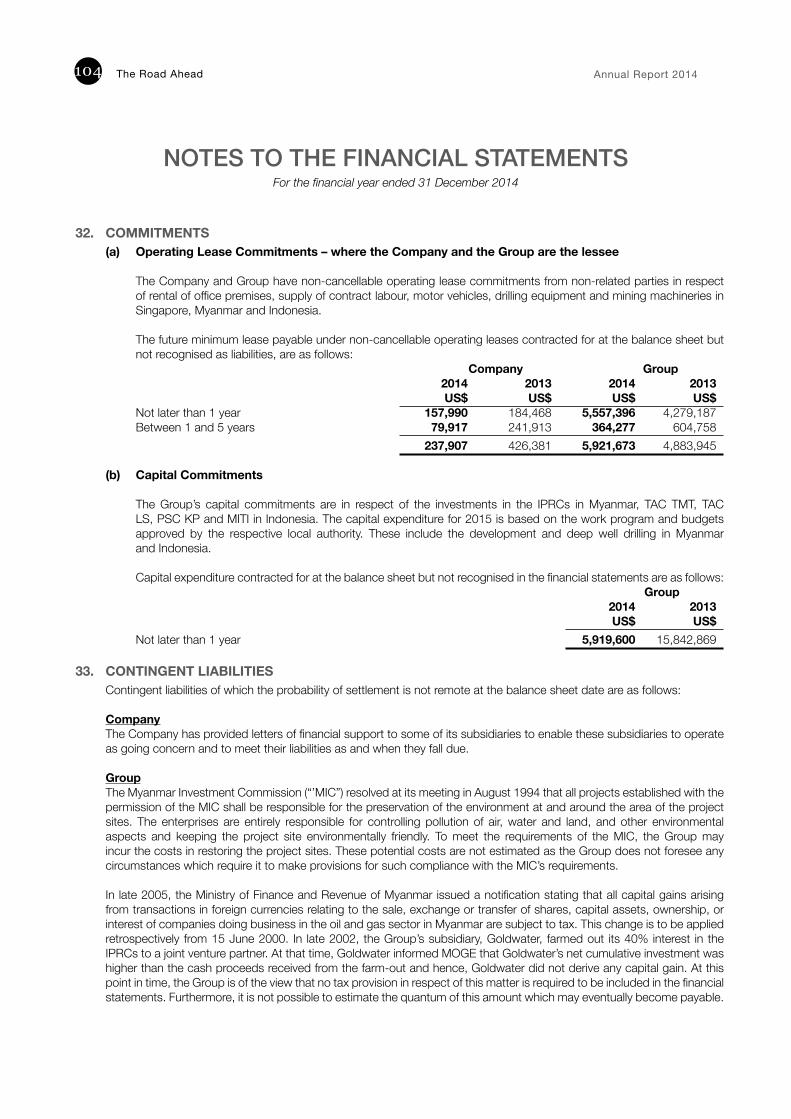
The Road Ahead Annual Report 2014104
NOTES TO THE FINANCIAL STATEMENTSFor the financial year ended 31 December 2014
32. COMMITMENTS(a) Operating Lease Commitments – where the Company and the Group are the lessee
The Company and Group have non-cancellable operating lease commitments from non-related parties in respect of rental of office premises, supply of contract labour, motor vehicles, drilling equipment and mining machineries in Singapore, Myanmar and Indonesia. The future minimum lease payable under non-cancellable operating leases contracted for at the balance sheet but not recognised as liabilities, are as follows:
Company Group 2014 2013 2014 2013 US$ US$ US$ US$
Not later than 1 year 157,990 184,468 5,557,396 4,279,187Between 1 and 5 years 79,917 241,913 364,277 604,758
237,907 426,381 5,921,673 4,883,945
(b) Capital Commitments The Group’s capital commitments are in respect of the investments in the IPRCs in Myanmar, TAC TMT, TAC LS, PSC KP and MITI in Indonesia. The capital expenditure for 2015 is based on the work program and budgets approved by the respective local authority. These include the development and deep well drilling in Myanmar and Indonesia. Capital expenditure contracted for at the balance sheet but not recognised in the financial statements are as follows:
Group 2014 2013 US$ US$
Not later than 1 year 5,919,600 15,842,869
33. CONTINGENT LIABILITIES Contingent liabilities of which the probability of settlement is not remote at the balance sheet date are as follows: Company The Company has provided letters of financial support to some of its subsidiaries to enable these subsidiaries to operate as going concern and to meet their liabilities as and when they fall due.
Group The Myanmar Investment Commission (“’MIC”) resolved at its meeting in August 1994 that all projects established with the permission of the MIC shall be responsible for the preservation of the environment at and around the area of the project sites. The enterprises are entirely responsible for controlling pollution of air, water and land, and other environmental aspects and keeping the project site environmentally friendly. To meet the requirements of the MIC, the Group may incur the costs in restoring the project sites. These potential costs are not estimated as the Group does not foresee any circumstances which require it to make provisions for such compliance with the MIC’s requirements. In late 2005, the Ministry of Finance and Revenue of Myanmar issued a notification stating that all capital gains arising from transactions in foreign currencies relating to the sale, exchange or transfer of shares, capital assets, ownership, or interest of companies doing business in the oil and gas sector in Myanmar are subject to tax. This change is to be applied retrospectively from 15 June 2000. In late 2002, the Group’s subsidiary, Goldwater, farmed out its 40% interest in the IPRCs to a joint venture partner. At that time, Goldwater informed MOGE that Goldwater’s net cumulative investment was higher than the cash proceeds received from the farm-out and hence, Goldwater did not derive any capital gain. At this point in time, the Group is of the view that no tax provision in respect of this matter is required to be included in the financial statements. Furthermore, it is not possible to estimate the quantum of this amount which may eventually become payable.
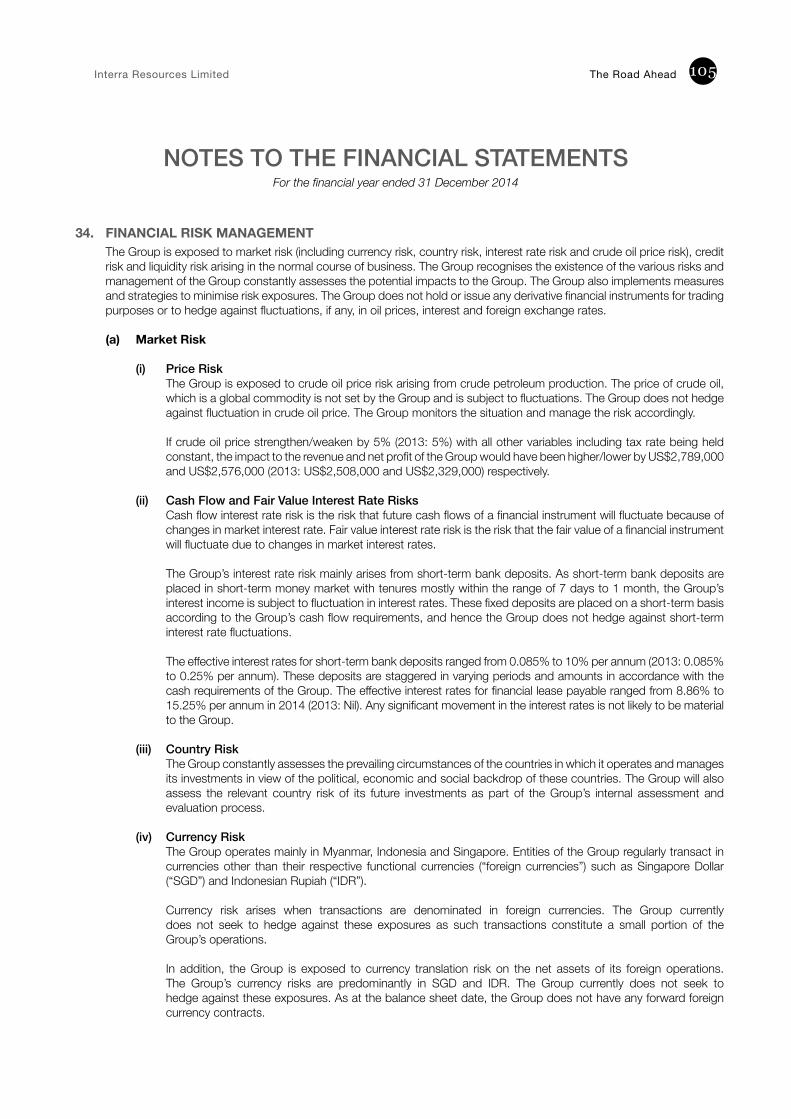
Interra Resources Limited The Road Ahead 105
NOTES TO THE FINANCIAL STATEMENTSFor the financial year ended 31 December 2014
34. FINANCIAL RISK MANAGEMENT The Group is exposed to market risk (including currency risk, country risk, interest rate risk and crude oil price risk), credit risk and liquidity risk arising in the normal course of business. The Group recognises the existence of the various risks and management of the Group constantly assesses the potential impacts to the Group. The Group also implements measures and strategies to minimise risk exposures. The Group does not hold or issue any derivative financial instruments for trading purposes or to hedge against fluctuations, if any, in oil prices, interest and foreign exchange rates. (a) Market Risk
(i) Price RiskThe Group is exposed to crude oil price risk arising from crude petroleum production. The price of crude oil, which is a global commodity is not set by the Group and is subject to fluctuations. The Group does not hedge against fluctuation in crude oil price. The Group monitors the situation and manage the risk accordingly. If crude oil price strengthen/weaken by 5% (2013: 5%) with all other variables including tax rate being held constant, the impact to the revenue and net profit of the Group would have been higher/lower by US$2,789,000 and US$2,576,000 (2013: US$2,508,000 and US$2,329,000) respectively.
(ii) Cash Flow and Fair Value Interest Rate RisksCash flow interest rate risk is the risk that future cash flows of a financial instrument will fluctuate because of changes in market interest rate. Fair value interest rate risk is the risk that the fair value of a financial instrument will fluctuate due to changes in market interest rates. The Group’s interest rate risk mainly arises from short-term bank deposits. As short-term bank deposits are placed in short-term money market with tenures mostly within the range of 7 days to 1 month, the Group’s interest income is subject to fluctuation in interest rates. These fixed deposits are placed on a short-term basis according to the Group’s cash flow requirements, and hence the Group does not hedge against short-term interest rate fluctuations. The effective interest rates for short-term bank deposits ranged from 0.085% to 10% per annum (2013: 0.085% to 0.25% per annum). These deposits are staggered in varying periods and amounts in accordance with the cash requirements of the Group. The effective interest rates for financial lease payable ranged from 8.86% to 15.25% per annum in 2014 (2013: Nil). Any significant movement in the interest rates is not likely to be material to the Group.
(iii) Country Risk
The Group constantly assesses the prevailing circumstances of the countries in which it operates and manages its investments in view of the political, economic and social backdrop of these countries. The Group will also assess the relevant country risk of its future investments as part of the Group’s internal assessment and evaluation process.
(iv) Currency RiskThe Group operates mainly in Myanmar, Indonesia and Singapore. Entities of the Group regularly transact in currencies other than their respective functional currencies (“foreign currencies”) such as Singapore Dollar (“SGD”) and Indonesian Rupiah (“IDR”). Currency risk arises when transactions are denominated in foreign currencies. The Group currently does not seek to hedge against these exposures as such transactions constitute a small portion of the Group’s operations. In addition, the Group is exposed to currency translation risk on the net assets of its foreign operations. The Group’s currency risks are predominantly in SGD and IDR. The Group currently does not seek to hedge against these exposures. As at the balance sheet date, the Group does not have any forward foreign currency contracts.
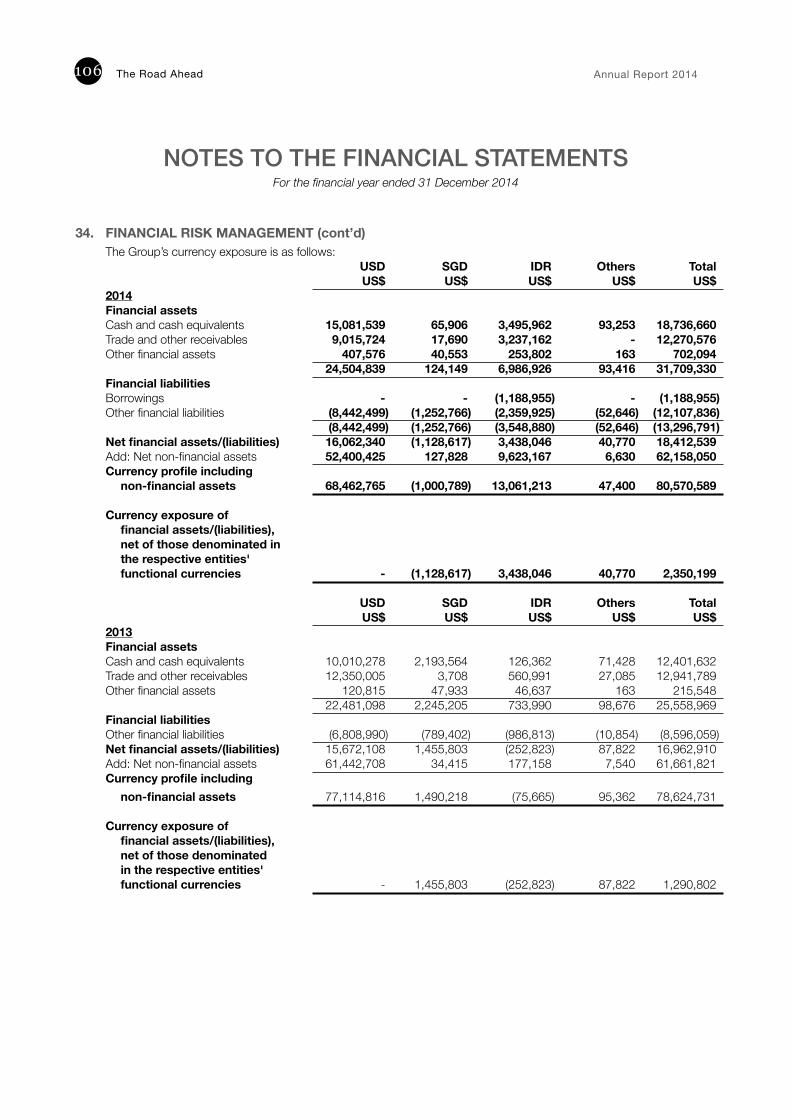
The Road Ahead Annual Report 2014106
NOTES TO THE FINANCIAL STATEMENTSFor the financial year ended 31 December 2014
34. FINANCIAL RISK MANAGEMENT (cont’d) The Group’s currency exposure is as follows: USD SGD IDR Others Total US$ US$ US$ US$ US$2014Financial assets Cash and cash equivalents 15,081,539 65,906 3,495,962 93,253 18,736,660Trade and other receivables 9,015,724 17,690 3,237,162 - 12,270,576Other financial assets 407,576 40,553 253,802 163 702,094 24,504,839 124,149 6,986,926 93,416 31,709,330Financial liabilities Borrowings - - (1,188,955) - (1,188,955)Other financial liabilities (8,442,499) (1,252,766) (2,359,925) (52,646) (12,107,836) (8,442,499) (1,252,766) (3,548,880) (52,646) (13,296,791)Net financial assets/(liabilities) 16,062,340 (1,128,617) 3,438,046 40,770 18,412,539Add: Net non-financial assets 52,400,425 127,828 9,623,167 6,630 62,158,050Currency profile including
non-financial assets 68,462,765 (1,000,789) 13,061,213 47,400 80,570,589 Currency exposure of
financial assets/(liabilities),net of those denominated inthe respective entities'functional currencies - (1,128,617) 3,438,046 40,770 2,350,199
USD SGD IDR Others Total US$ US$ US$ US$ US$2013 Financial assets Cash and cash equivalents 10,010,278 2,193,564 126,362 71,428 12,401,632Trade and other receivables 12,350,005 3,708 560,991 27,085 12,941,789Other financial assets 120,815 47,933 46,637 163 215,548 22,481,098 2,245,205 733,990 98,676 25,558,969Financial liabilities Other financial liabilities (6,808,990) (789,402) (986,813) (10,854) (8,596,059)Net financial assets/(liabilities) 15,672,108 1,455,803 (252,823) 87,822 16,962,910Add: Net non-financial assets 61,442,708 34,415 177,158 7,540 61,661,821Currency profile including
non-financial assets 77,114,816 1,490,218 (75,665) 95,362 78,624,731 Currency exposure of
financial assets/(liabilities),net of those denominatedin the respective entities'functional currencies - 1,455,803 (252,823) 87,822 1,290,802
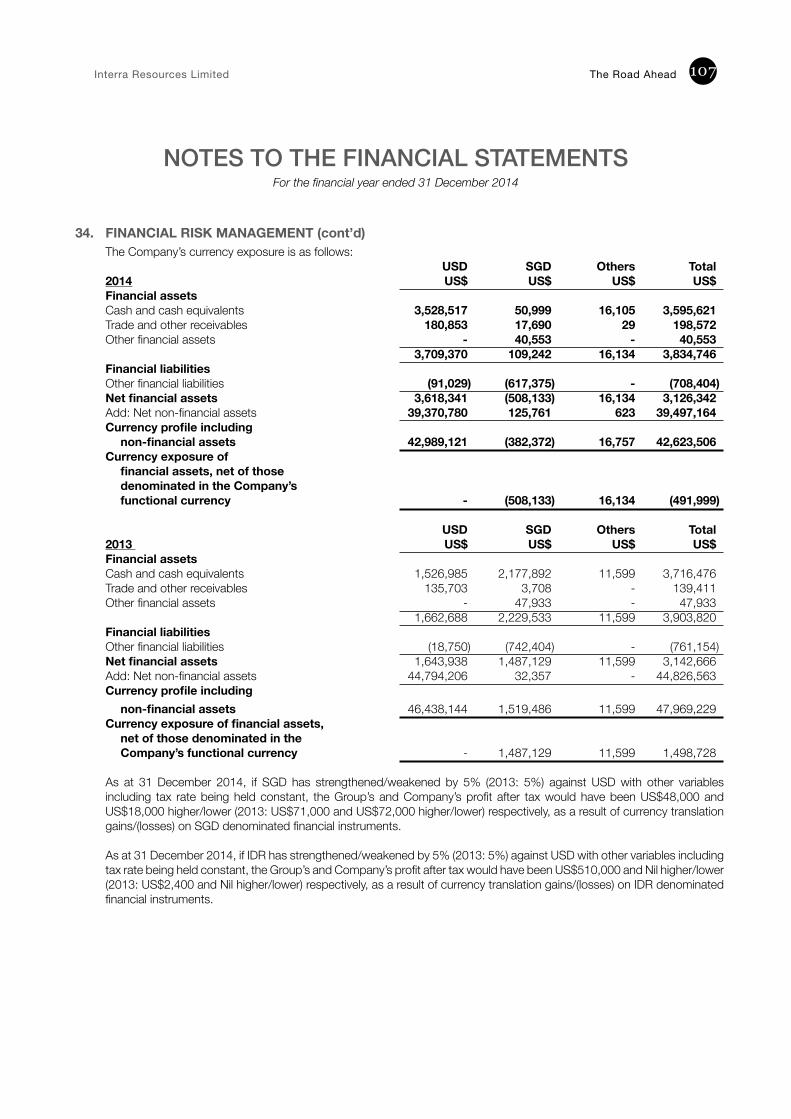
Interra Resources Limited The Road Ahead 107
NOTES TO THE FINANCIAL STATEMENTSFor the financial year ended 31 December 2014
34. FINANCIAL RISK MANAGEMENT (cont’d) The Company’s currency exposure is as follows: USD SGD Others Total2014 US$ US$ US$ US$Financial assets Cash and cash equivalents 3,528,517 50,999 16,105 3,595,621Trade and other receivables 180,853 17,690 29 198,572Other financial assets - 40,553 - 40,553 3,709,370 109,242 16,134 3,834,746Financial liabilities Other financial liabilities (91,029) (617,375) - (708,404)Net financial assets 3,618,341 (508,133) 16,134 3,126,342Add: Net non-financial assets 39,370,780 125,761 623 39,497,164Currency profile including
non-financial assets 42,989,121 (382,372) 16,757 42,623,506Currency exposure of
financial assets, net of thosedenominated in the Company’sfunctional currency - (508,133) 16,134 (491,999)
USD SGD Others Total2013 US$ US$ US$ US$Financial assets Cash and cash equivalents 1,526,985 2,177,892 11,599 3,716,476Trade and other receivables 135,703 3,708 - 139,411Other financial assets - 47,933 - 47,933 1,662,688 2,229,533 11,599 3,903,820Financial liabilities Other financial liabilities (18,750) (742,404) - (761,154)Net financial assets 1,643,938 1,487,129 11,599 3,142,666Add: Net non-financial assets 44,794,206 32,357 - 44,826,563Currency profile including
non-financial assets 46,438,144 1,519,486 11,599 47,969,229Currency exposure of financial assets,
net of those denominated in theCompany’s functional currency - 1,487,129 11,599 1,498,728
As at 31 December 2014, if SGD has strengthened/weakened by 5% (2013: 5%) against USD with other variables including tax rate being held constant, the Group’s and Company’s profit after tax would have been US$48,000 and US$18,000 higher/lower (2013: US$71,000 and US$72,000 higher/lower) respectively, as a result of currency translation gains/(losses) on SGD denominated financial instruments. As at 31 December 2014, if IDR has strengthened/weakened by 5% (2013: 5%) against USD with other variables including tax rate being held constant, the Group’s and Company’s profit after tax would have been US$510,000 and Nil higher/lower (2013: US$2,400 and Nil higher/lower) respectively, as a result of currency translation gains/(losses) on IDR denominated financial instruments.
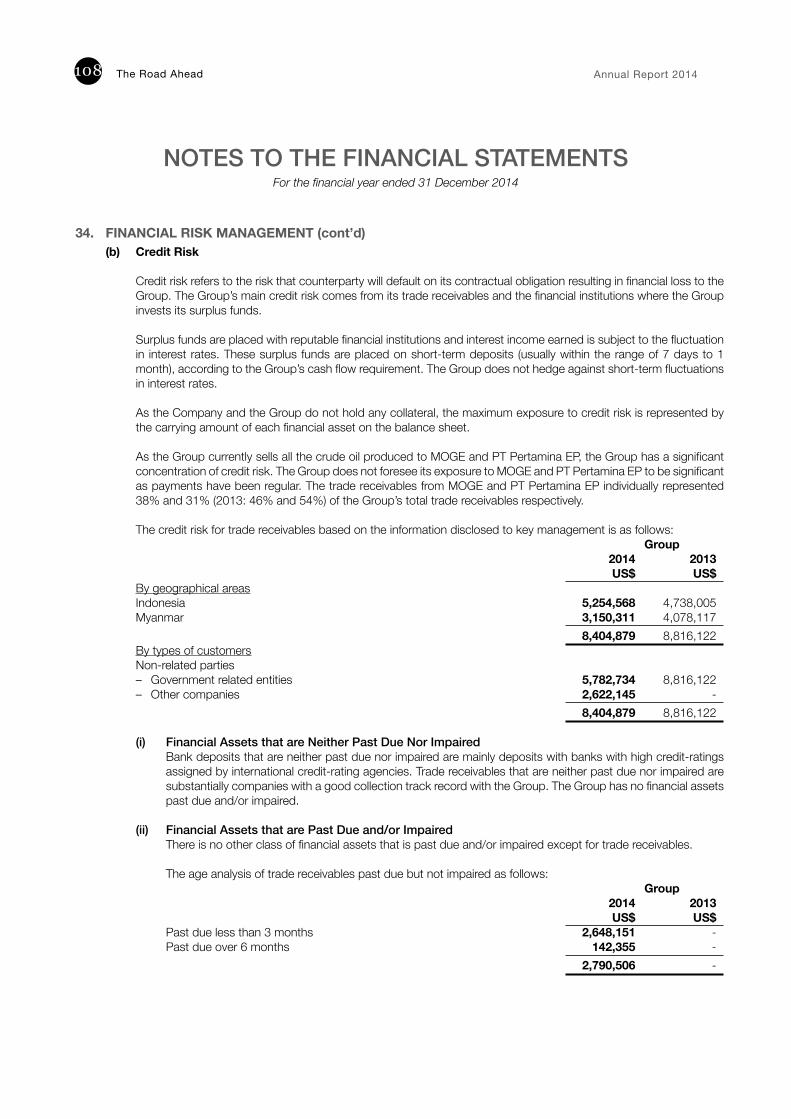
The Road Ahead Annual Report 2014108
NOTES TO THE FINANCIAL STATEMENTSFor the financial year ended 31 December 2014
34. FINANCIAL RISK MANAGEMENT (cont’d)(b) Credit Risk
Credit risk refers to the risk that counterparty will default on its contractual obligation resulting in financial loss to the Group. The Group’s main credit risk comes from its trade receivables and the financial institutions where the Group invests its surplus funds. Surplus funds are placed with reputable financial institutions and interest income earned is subject to the fluctuation in interest rates. These surplus funds are placed on short-term deposits (usually within the range of 7 days to 1 month), according to the Group’s cash flow requirement. The Group does not hedge against short-term fluctuations in interest rates.
As the Company and the Group do not hold any collateral, the maximum exposure to credit risk is represented by the carrying amount of each financial asset on the balance sheet. As the Group currently sells all the crude oil produced to MOGE and PT Pertamina EP, the Group has a significant concentration of credit risk. The Group does not foresee its exposure to MOGE and PT Pertamina EP to be significant as payments have been regular. The trade receivables from MOGE and PT Pertamina EP individually represented 38% and 31% (2013: 46% and 54%) of the Group’s total trade receivables respectively. The credit risk for trade receivables based on the information disclosed to key management is as follows:
Group 2014 2013 US$ US$
By geographical areas Indonesia 5,254,568 4,738,005Myanmar 3,150,311 4,078,117 8,404,879 8,816,122By types of customers Non-related parties – Government related entities 5,782,734 8,816,122– Other companies 2,622,145 - 8,404,879 8,816,122
(i) Financial Assets that are Neither Past Due Nor Impaired Bank deposits that are neither past due nor impaired are mainly deposits with banks with high credit-ratings assigned by international credit-rating agencies. Trade receivables that are neither past due nor impaired are substantially companies with a good collection track record with the Group. The Group has no financial assets past due and/or impaired.
(ii) Financial Assets that are Past Due and/or Impaired
There is no other class of financial assets that is past due and/or impaired except for trade receivables.
The age analysis of trade receivables past due but not impaired as follows: Group 2014 2013 US$ US$
Past due less than 3 months 2,648,151 -Past due over 6 months 142,355 - 2,790,506 -
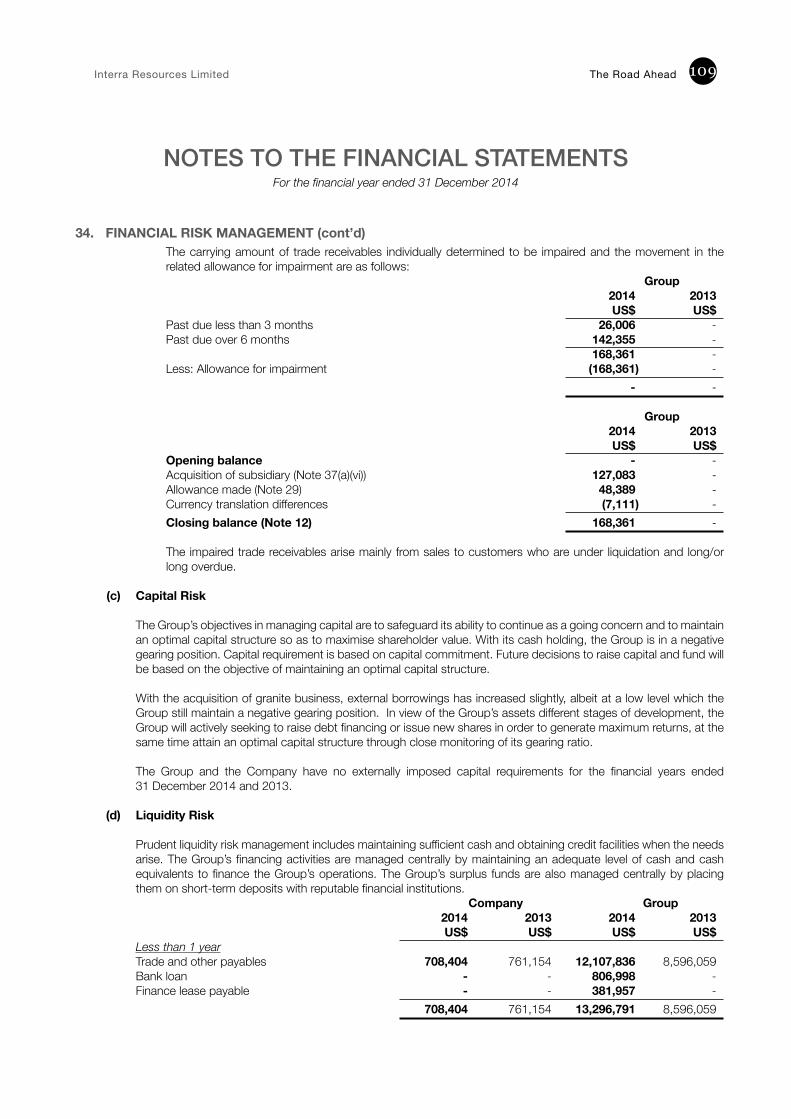
Interra Resources Limited The Road Ahead 109
NOTES TO THE FINANCIAL STATEMENTSFor the financial year ended 31 December 2014
34. FINANCIAL RISK MANAGEMENT (cont’d) The carrying amount of trade receivables individually determined to be impaired and the movement in the related allowance for impairment are as follows:
Group 2014 2013 US$ US$
Past due less than 3 months 26,006 -Past due over 6 months 142,355 - 168,361 -Less: Allowance for impairment (168,361) - - -
Group 2014 2013 US$ US$
Opening balance - -Acquisition of subsidiary (Note 37(a)(vi)) 127,083 -Allowance made (Note 29) 48,389 -Currency translation differences (7,111) -Closing balance (Note 12) 168,361 -
The impaired trade receivables arise mainly from sales to customers who are under liquidation and long/or long overdue.
(c) Capital Risk
The Group’s objectives in managing capital are to safeguard its ability to continue as a going concern and to maintain an optimal capital structure so as to maximise shareholder value. With its cash holding, the Group is in a negative gearing position. Capital requirement is based on capital commitment. Future decisions to raise capital and fund will be based on the objective of maintaining an optimal capital structure. With the acquisition of granite business, external borrowings has increased slightly, albeit at a low level which the Group still maintain a negative gearing position. In view of the Group’s assets different stages of development, the Group will actively seeking to raise debt financing or issue new shares in order to generate maximum returns, at the same time attain an optimal capital structure through close monitoring of its gearing ratio.
The Group and the Company have no externally imposed capital requirements for the financial years ended 31 December 2014 and 2013.
(d) Liquidity Risk
Prudent liquidity risk management includes maintaining sufficient cash and obtaining credit facilities when the needs arise. The Group’s financing activities are managed centrally by maintaining an adequate level of cash and cash equivalents to finance the Group’s operations. The Group’s surplus funds are also managed centrally by placing them on short-term deposits with reputable financial institutions.
Company Group 2014 2013 2014 2013 US$ US$ US$ US$
Less than 1 year Trade and other payables 708,404 761,154 12,107,836 8,596,059Bank loan - - 806,998 -Finance lease payable - - 381,957 - 708,404 761,154 13,296,791 8,596,059
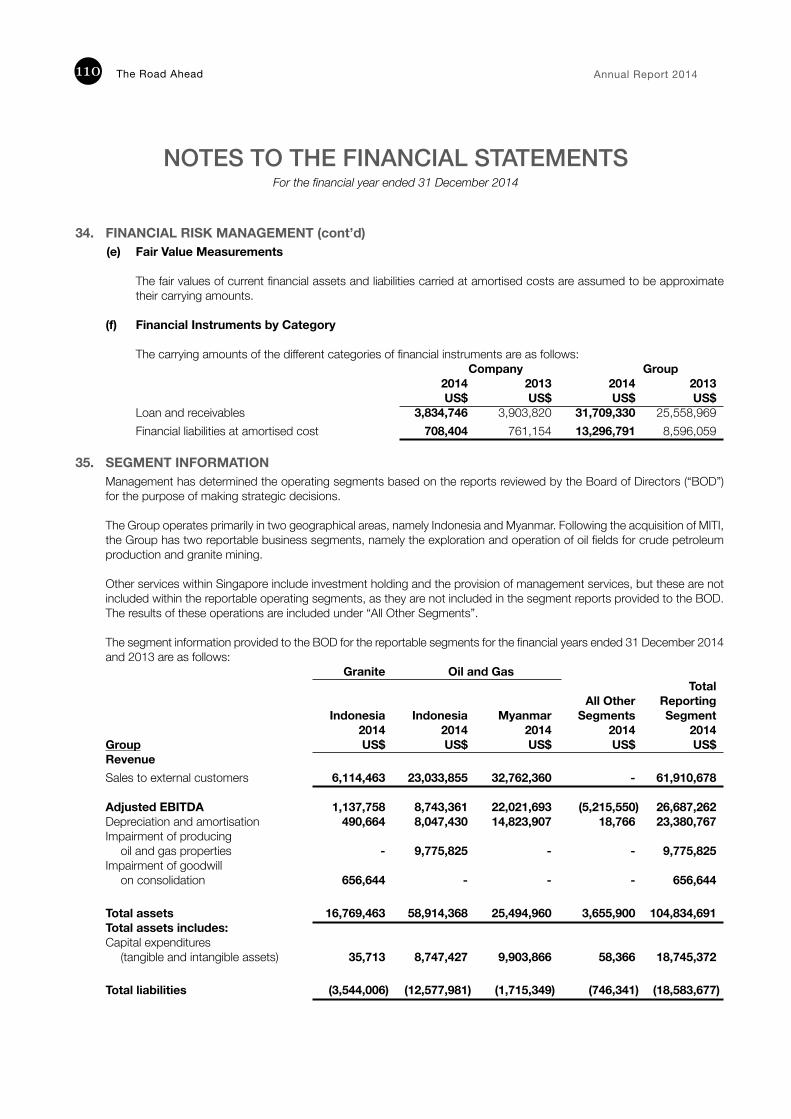
The Road Ahead Annual Report 2014110
NOTES TO THE FINANCIAL STATEMENTSFor the financial year ended 31 December 2014
34. FINANCIAL RISK MANAGEMENT (cont’d) (e) Fair Value Measurements
The fair values of current financial assets and liabilities carried at amortised costs are assumed to be approximate their carrying amounts.
(f) Financial Instruments by Category The carrying amounts of the different categories of financial instruments are as follows:
Company Group 2014 2013 2014 2013 US$ US$ US$ US$
Loan and receivables 3,834,746 3,903,820 31,709,330 25,558,969 Financial liabilities at amortised cost 708,404 761,154 13,296,791 8,596,059
35. SEGMENT INFORMATION
Management has determined the operating segments based on the reports reviewed by the Board of Directors (“BOD”) for the purpose of making strategic decisions. The Group operates primarily in two geographical areas, namely Indonesia and Myanmar. Following the acquisition of MITI, the Group has two reportable business segments, namely the exploration and operation of oil fields for crude petroleum production and granite mining. Other services within Singapore include investment holding and the provision of management services, but these are not included within the reportable operating segments, as they are not included in the segment reports provided to the BOD. The results of these operations are included under “All Other Segments”.
The segment information provided to the BOD for the reportable segments for the financial years ended 31 December 2014 and 2013 are as follows: Granite Oil and Gas Total All Other Reporting Indonesia Indonesia Myanmar Segments Segment 2014 2014 2014 2014 2014Group US$ US$ US$ US$ US$Revenue Sales to external customers 6,114,463 23,033,855 32,762,360 - 61,910,678
Adjusted EBITDA 1,137,758 8,743,361 22,021,693 (5,215,550) 26,687,262Depreciation and amortisation 490,664 8,047,430 14,823,907 18,766 23,380,767Impairment of producing
oil and gas properties - 9,775,825 - - 9,775,825Impairment of goodwill
on consolidation 656,644 - - - 656,644 Total assets 16,769,463 58,914,368 25,494,960 3,655,900 104,834,691Total assets includes: Capital expenditures
(tangible and intangible assets) 35,713 8,747,427 9,903,866 58,366 18,745,372 Total liabilities (3,544,006) (12,577,981) (1,715,349) (746,341) (18,583,677)
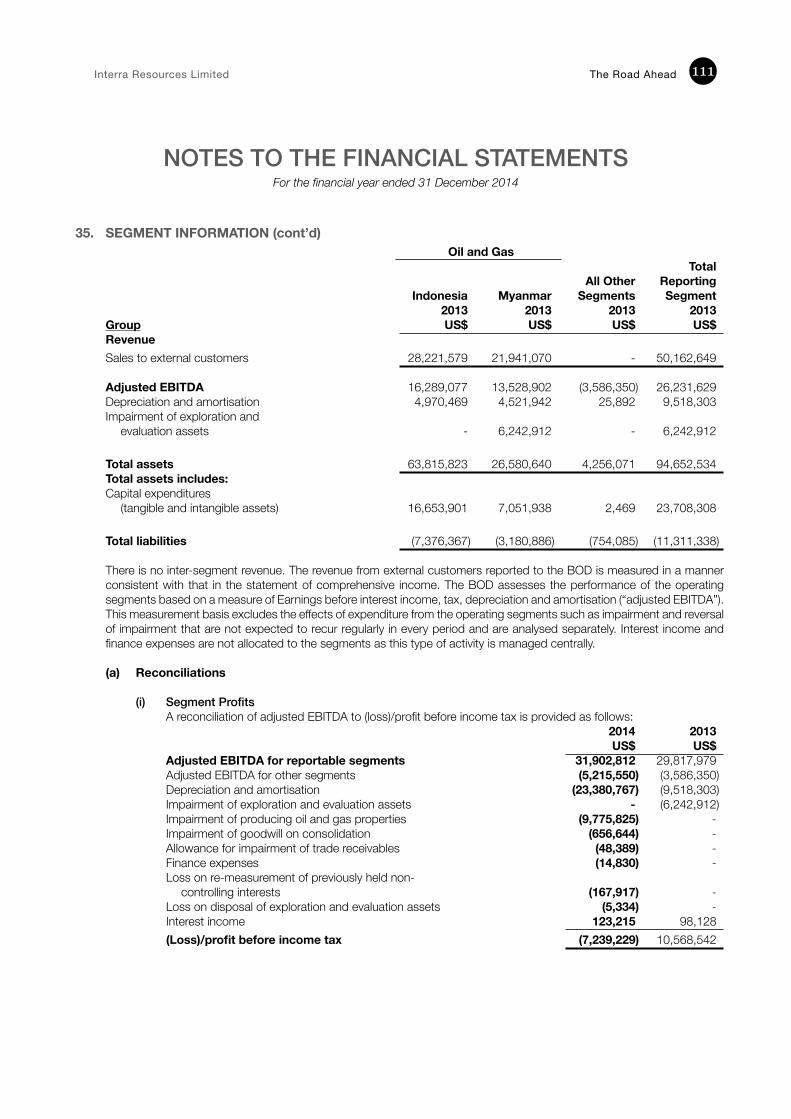
Interra Resources Limited The Road Ahead 111
NOTES TO THE FINANCIAL STATEMENTSFor the financial year ended 31 December 2014
35. SEGMENT INFORMATION (cont’d) Oil and Gas Total All Other Reporting Indonesia Myanmar Segments Segment 2013 2013 2013 2013Group US$ US$ US$ US$Revenue Sales to external customers 28,221,579 21,941,070 - 50,162,649
Adjusted EBITDA 16,289,077 13,528,902 (3,586,350) 26,231,629Depreciation and amortisation 4,970,469 4,521,942 25,892 9,518,303Impairment of exploration and
evaluation assets - 6,242,912 - 6,242,912 Total assets 63,815,823 26,580,640 4,256,071 94,652,534Total assets includes: Capital expenditures
(tangible and intangible assets) 16,653,901 7,051,938 2,469 23,708,308 Total liabilities (7,376,367) (3,180,886) (754,085) (11,311,338)
There is no inter-segment revenue. The revenue from external customers reported to the BOD is measured in a manner consistent with that in the statement of comprehensive income. The BOD assesses the performance of the operating segments based on a measure of Earnings before interest income, tax, depreciation and amortisation (“adjusted EBITDA”). This measurement basis excludes the effects of expenditure from the operating segments such as impairment and reversal of impairment that are not expected to recur regularly in every period and are analysed separately. Interest income and finance expenses are not allocated to the segments as this type of activity is managed centrally.
(a) Reconciliations
(i) Segment Profits
A reconciliation of adjusted EBITDA to (loss)/profit before income tax is provided as follows: 2014 2013 US$ US$ Adjusted EBITDA for reportable segments 31,902,812 29,817,979 Adjusted EBITDA for other segments (5,215,550) (3,586,350) Depreciation and amortisation (23,380,767) (9,518,303) Impairment of exploration and evaluation assets - (6,242,912) Impairment of producing oil and gas properties (9,775,825) - Impairment of goodwill on consolidation (656,644) - Allowance for impairment of trade receivables (48,389) - Finance expenses (14,830) -Loss on re-measurement of previously held non-
controlling interests (167,917) -Loss on disposal of exploration and evaluation assets (5,334) - Interest income 123,215 98,128 (Loss)/profit before income tax (7,239,229) 10,568,542
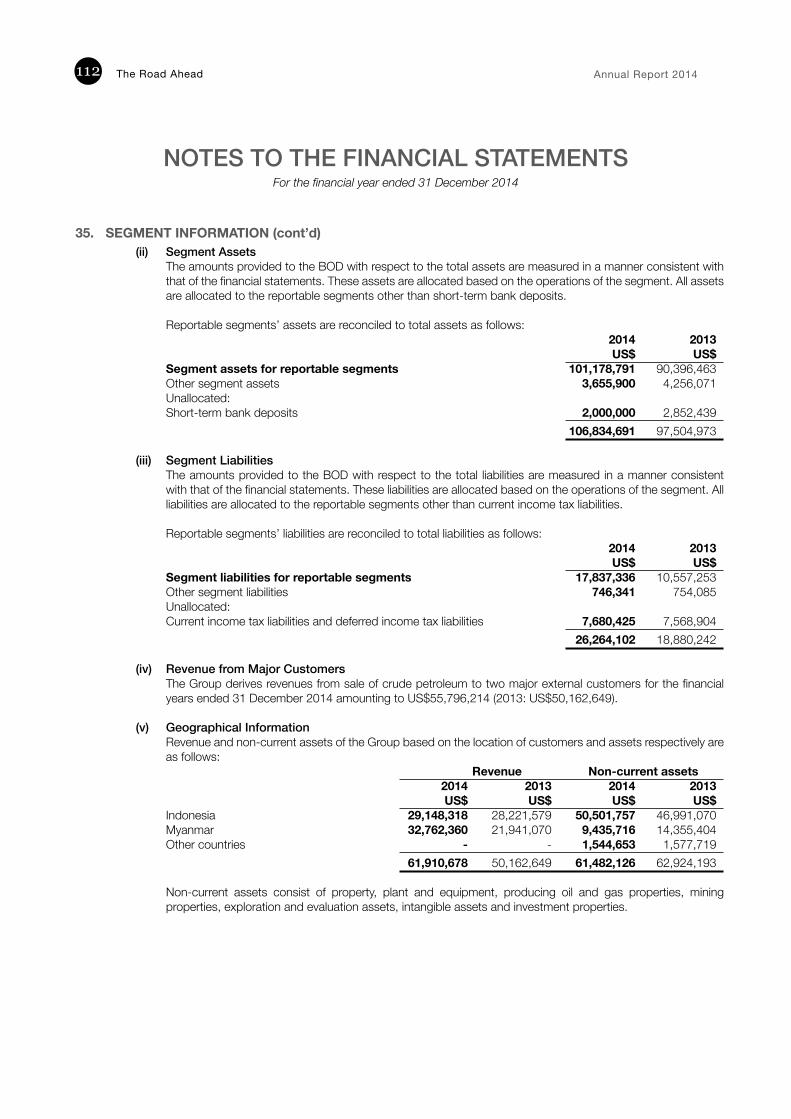
The Road Ahead Annual Report 2014112
NOTES TO THE FINANCIAL STATEMENTSFor the financial year ended 31 December 2014
35. SEGMENT INFORMATION (cont’d)(ii) Segment Assets
The amounts provided to the BOD with respect to the total assets are measured in a manner consistent with that of the financial statements. These assets are allocated based on the operations of the segment. All assets are allocated to the reportable segments other than short-term bank deposits. Reportable segments’ assets are reconciled to total assets as follows: 2014 2013 US$ US$ Segment assets for repor table segments 101,178,791 90,396,463 Other segment assets 3,655,900 4,256,071 Unallocated: Short-term bank deposits 2,000,000 2,852,439 106,834,691 97,504,973
(iii) Segment Liabilities The amounts provided to the BOD with respect to the total liabilities are measured in a manner consistent with that of the financial statements. These liabilities are allocated based on the operations of the segment. All liabilities are allocated to the reportable segments other than current income tax liabilities.
Reportable segments’ liabilities are reconciled to total liabilities as follows: 2014 2013 US$ US$ Segment liabilities for reportable segments 17,837,336 10,557,253 Other segment liabilities 746,341 754,085 Unallocated: Current income tax liabilities and deferred income tax liabilities 7,680,425 7,568,904 26,264,102 18,880,242
(iv) Revenue from Major Customers
The Group derives revenues from sale of crude petroleum to two major external customers for the financial years ended 31 December 2014 amounting to US$55,796,214 (2013: US$50,162,649).
(v) Geographical Information
Revenue and non-current assets of the Group based on the location of customers and assets respectively are as follows: Revenue Non-current assets 2014 2013 2014 2013 US$ US$ US$ US$Indonesia 29,148,318 28,221,579 50,501,757 46,991,070Myanmar 32,762,360 21,941,070 9,435,716 14,355,404Other countries - - 1,544,653 1,577,719 61,910,678 50,162,649 61,482,126 62,924,193
Non-current assets consist of property, plant and equipment, producing oil and gas properties, mining properties, exploration and evaluation assets, intangible assets and investment properties.
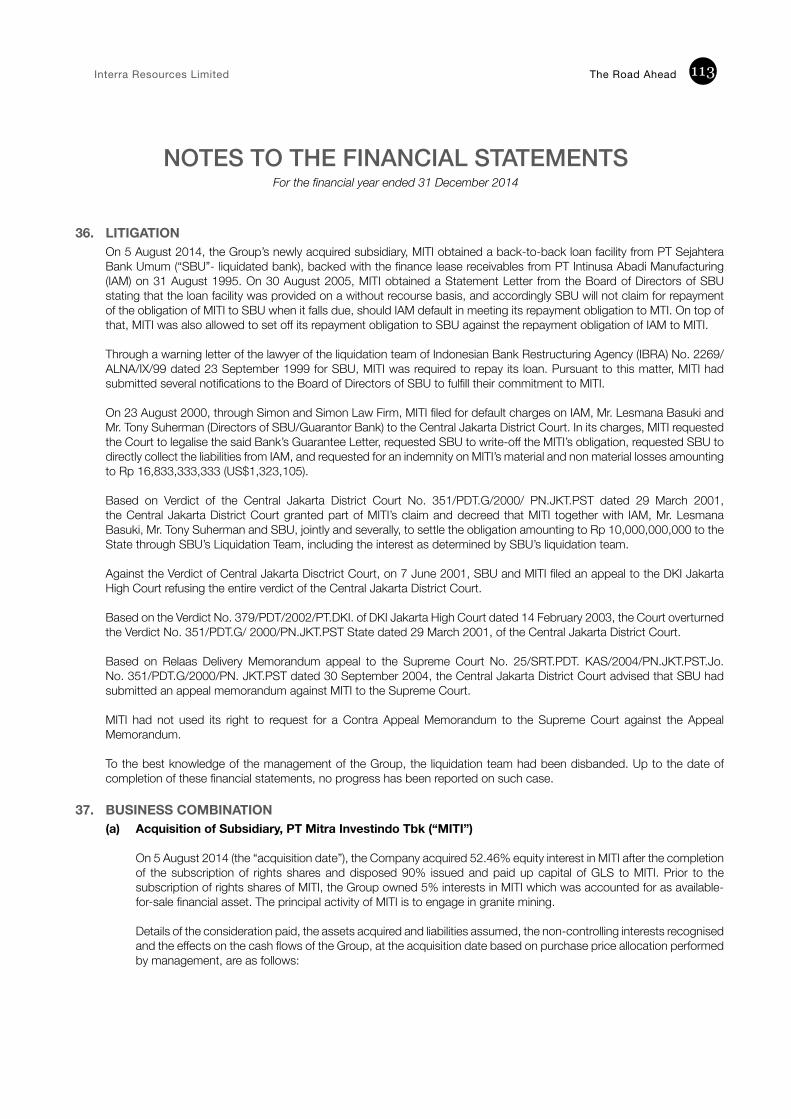
Interra Resources Limited The Road Ahead 113
NOTES TO THE FINANCIAL STATEMENTSFor the financial year ended 31 December 2014
36. LITIGATION On 5 August 2014, the Group’s newly acquired subsidiary, MITI obtained a back-to-back loan facility from PT Sejahtera Bank Umum (“SBU”- liquidated bank), backed with the finance lease receivables from PT Intinusa Abadi Manufacturing (IAM) on 31 August 1995. On 30 August 2005, MITI obtained a Statement Letter from the Board of Directors of SBU stating that the loan facility was provided on a without recourse basis, and accordingly SBU will not claim for repayment of the obligation of MITI to SBU when it falls due, should IAM default in meeting its repayment obligation to MTI. On top of that, MITI was also allowed to set off its repayment obligation to SBU against the repayment obligation of IAM to MITI. Through a warning letter of the lawyer of the liquidation team of Indonesian Bank Restructuring Agency (IBRA) No. 2269/ALNA/IX/99 dated 23 September 1999 for SBU, MITI was required to repay its loan. Pursuant to this matter, MITI had submitted several notifications to the Board of Directors of SBU to fulfill their commitment to MITI.
On 23 August 2000, through Simon and Simon Law Firm, MITI filed for default charges on IAM, Mr. Lesmana Basuki and Mr. Tony Suherman (Directors of SBU/Guarantor Bank) to the Central Jakarta District Court. In its charges, MITI requested the Court to legalise the said Bank’s Guarantee Letter, requested SBU to write-off the MITI’s obligation, requested SBU to directly collect the liabilities from IAM, and requested for an indemnity on MITI’s material and non material losses amounting to Rp 16,833,333,333 (US$1,323,105). Based on Verdict of the Central Jakarta District Court No. 351/PDT.G/2000/ PN.JKT.PST dated 29 March 2001, the Central Jakarta District Court granted part of MITI’s claim and decreed that MITI together with IAM, Mr. Lesmana Basuki, Mr. Tony Suherman and SBU, jointly and severally, to settle the obligation amounting to Rp 10,000,000,000 to the State through SBU’s Liquidation Team, including the interest as determined by SBU’s liquidation team. Against the Verdict of Central Jakarta Disctrict Court, on 7 June 2001, SBU and MITI filed an appeal to the DKI Jakarta High Court refusing the entire verdict of the Central Jakarta District Court. Based on the Verdict No. 379/PDT/2002/PT.DKI. of DKI Jakarta High Court dated 14 February 2003, the Court overturned the Verdict No. 351/PDT.G/ 2000/PN.JKT.PST State dated 29 March 2001, of the Central Jakarta District Court. Based on Relaas Delivery Memorandum appeal to the Supreme Court No. 25/SRT.PDT. KAS/2004/PN.JKT.PST.Jo. No. 351/PDT.G/2000/PN. JKT.PST dated 30 September 2004, the Central Jakarta District Court advised that SBU had submitted an appeal memorandum against MITI to the Supreme Court.
MITI had not used its right to request for a Contra Appeal Memorandum to the Supreme Court against the Appeal Memorandum. To the best knowledge of the management of the Group, the liquidation team had been disbanded. Up to the date of completion of these financial statements, no progress has been reported on such case.
37. BUSINESS COMBINATION
(a) Acquisition of Subsidiary, PT Mitra Investindo Tbk (“MITI”)
On 5 August 2014 (the “acquisition date”), the Company acquired 52.46% equity interest in MITI after the completion of the subscription of rights shares and disposed 90% issued and paid up capital of GLS to MITI. Prior to the subscription of rights shares of MITI, the Group owned 5% interests in MITI which was accounted for as available-for-sale financial asset. The principal activity of MITI is to engage in granite mining. Details of the consideration paid, the assets acquired and liabilities assumed, the non-controlling interests recognised and the effects on the cash flows of the Group, at the acquisition date based on purchase price allocation performed by management, are as follows:
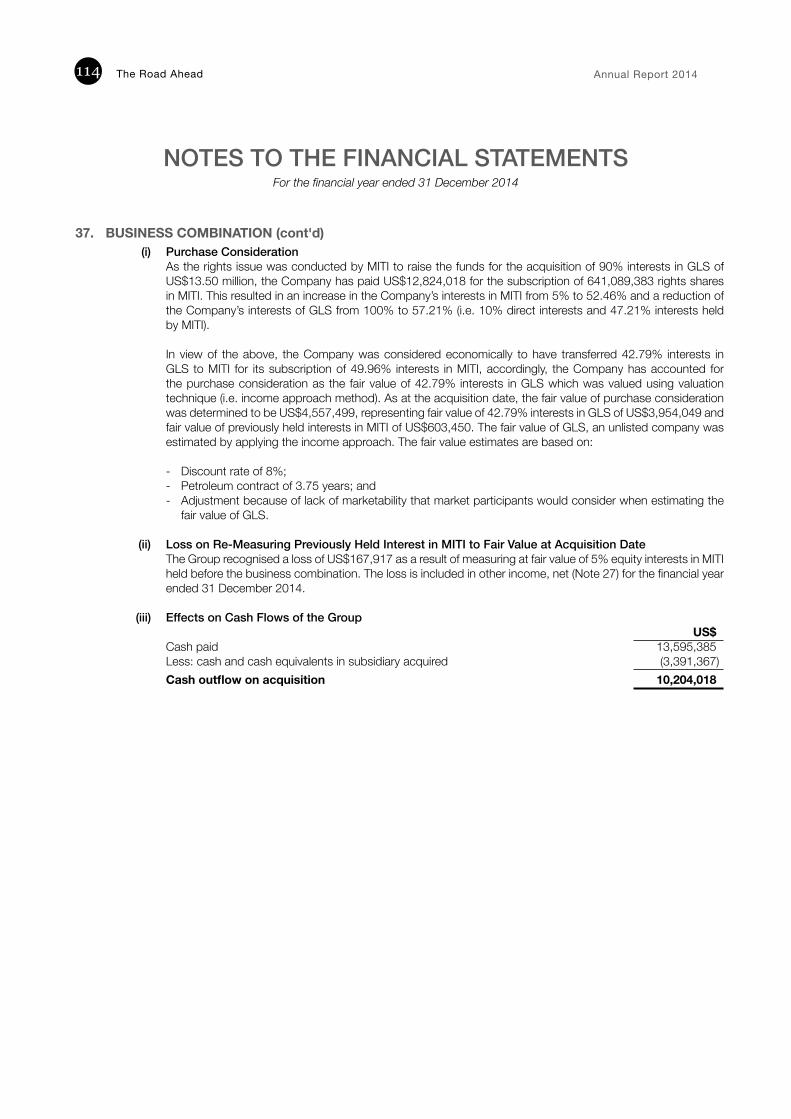
The Road Ahead Annual Report 2014114
NOTES TO THE FINANCIAL STATEMENTSFor the financial year ended 31 December 2014
37. BUSINESS COMBINATION (cont'd) (i) Purchase Consideration
As the rights issue was conducted by MITI to raise the funds for the acquisition of 90% interests in GLS of US$13.50 million, the Company has paid US$12,824,018 for the subscription of 641,089,383 rights shares in MITI. This resulted in an increase in the Company’s interests in MITI from 5% to 52.46% and a reduction of the Company’s interests of GLS from 100% to 57.21% (i.e. 10% direct interests and 47.21% interests held by MITI).
In view of the above, the Company was considered economically to have transferred 42.79% interests in GLS to MITI for its subscription of 49.96% interests in MITI, accordingly, the Company has accounted for the purchase consideration as the fair value of 42.79% interests in GLS which was valued using valuation technique (i.e. income approach method). As at the acquisition date, the fair value of purchase consideration was determined to be US$4,557,499, representing fair value of 42.79% interests in GLS of US$3,954,049 and fair value of previously held interests in MITI of US$603,450. The fair value of GLS, an unlisted company was estimated by applying the income approach. The fair value estimates are based on: - Discount rate of 8%;- Petroleum contract of 3.75 years; and- Adjustment because of lack of marketability that market participants would consider when estimating the
fair value of GLS.
(ii) Loss on Re-Measuring Previously Held Interest in MITI to Fair Value at Acquisition Date The Group recognised a loss of US$167,917 as a result of measuring at fair value of 5% equity interests in MITI held before the business combination. The loss is included in other income, net (Note 27) for the financial year ended 31 December 2014.
(iii) Effects on Cash Flows of the Group US$
Cash paid 13,595,385 Less: cash and cash equivalents in subsidiary acquired (3,391,367) Cash outflow on acquisition 10,204,018
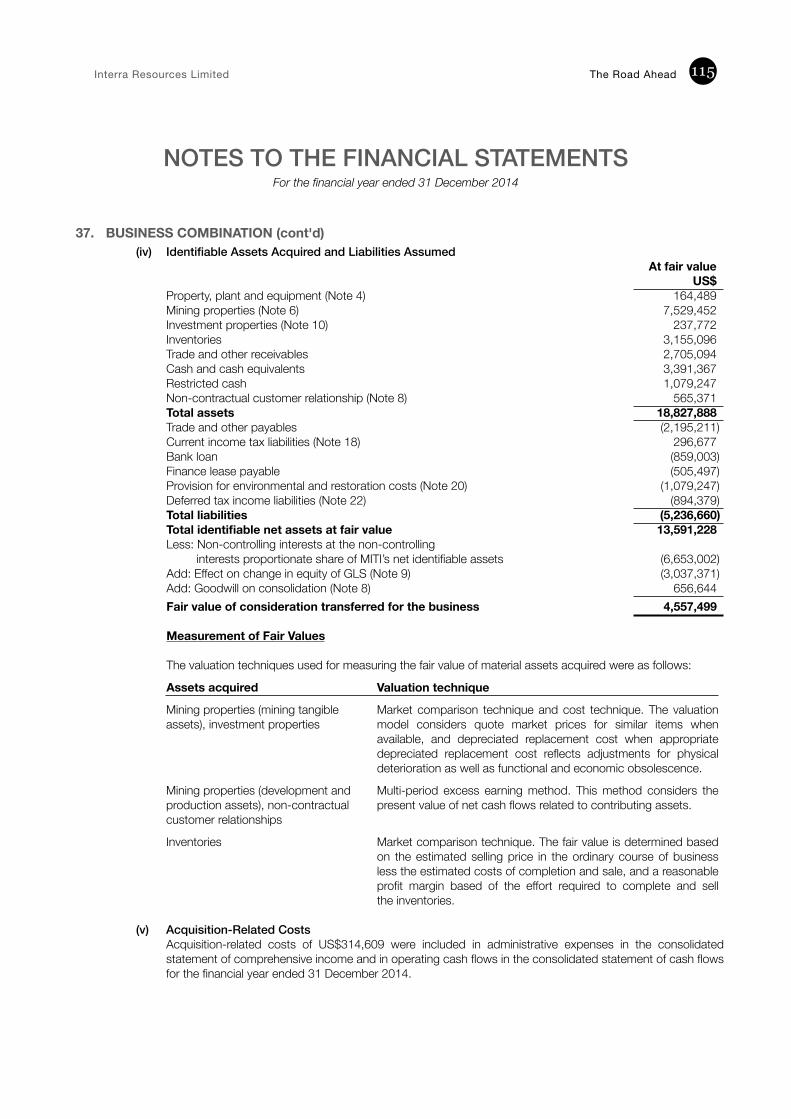
Interra Resources Limited The Road Ahead 115
NOTES TO THE FINANCIAL STATEMENTSFor the financial year ended 31 December 2014
37. BUSINESS COMBINATION (cont'd)(iv) Identifiable Assets Acquired and Liabilities Assumed
At fair value US$
Property, plant and equipment (Note 4) 164,489 Mining properties (Note 6) 7,529,452 Investment properties (Note 10) 237,772Inventories 3,155,096 Trade and other receivables 2,705,094 Cash and cash equivalents 3,391,367 Restricted cash 1,079,247 Non-contractual customer relationship (Note 8) 565,371 Total assets 18,827,888 Trade and other payables (2,195,211) Current income tax liabilities (Note 18) 296,677 Bank loan (859,003) Finance lease payable (505,497) Provision for environmental and restoration costs (Note 20) (1,079,247) Deferred tax income liabilities (Note 22) (894,379) Total liabilities (5,236,660) Total identifiable net assets at fair value 13,591,228 Less: Non-controlling interests at the non-controlling
interests proportionate share of MITI’s net identifiable assets (6,653,002) Add: Effect on change in equity of GLS (Note 9) (3,037,371) Add: Goodwill on consolidation (Note 8) 656,644 Fair value of consideration transferred for the business 4,557,499 Measurement of Fair Values The valuation techniques used for measuring the fair value of material assets acquired were as follows:
Assets acquired Valuation technique
Mining properties (mining tangible assets), investment properties
Market comparison technique and cost technique. The valuation model considers quote market prices for similar items when available, and depreciated replacement cost when appropriate depreciated replacement cost reflects adjustments for physical deterioration as well as functional and economic obsolescence.
Mining properties (development and production assets), non-contractual customer relationships
Multi-period excess earning method. This method considers the present value of net cash flows related to contributing assets.
Inventories Market comparison technique. The fair value is determined based on the estimated selling price in the ordinary course of business less the estimated costs of completion and sale, and a reasonable profit margin based of the effort required to complete and sell the inventories.
(v) Acquisition-Related Costs
Acquisition-related costs of US$314,609 were included in administrative expenses in the consolidated statement of comprehensive income and in operating cash flows in the consolidated statement of cash flows for the financial year ended 31 December 2014.
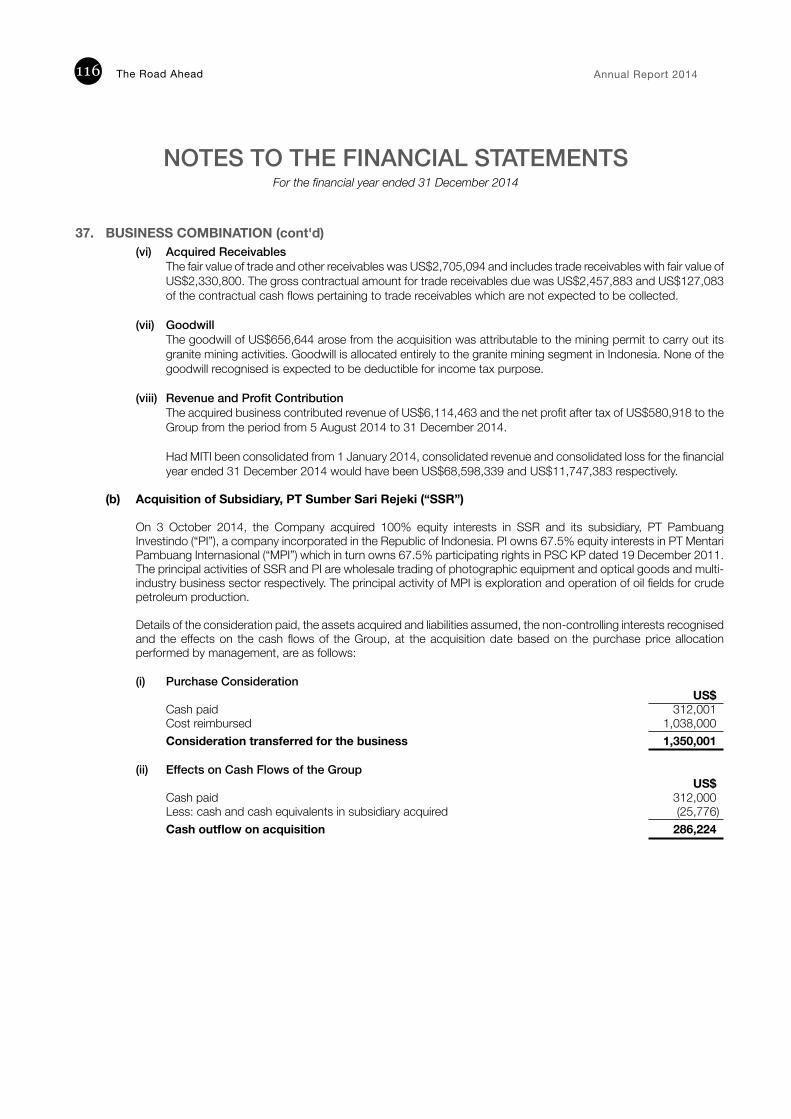
The Road Ahead Annual Report 2014116
NOTES TO THE FINANCIAL STATEMENTSFor the financial year ended 31 December 2014
37. BUSINESS COMBINATION (cont'd)(vi) Acquired Receivables
The fair value of trade and other receivables was US$2,705,094 and includes trade receivables with fair value of US$2,330,800. The gross contractual amount for trade receivables due was US$2,457,883 and US$127,083 of the contractual cash flows pertaining to trade receivables which are not expected to be collected.
(vii) GoodwillThe goodwill of US$656,644 arose from the acquisition was attributable to the mining permit to carry out its granite mining activities. Goodwill is allocated entirely to the granite mining segment in Indonesia. None of the goodwill recognised is expected to be deductible for income tax purpose.
(viii) Revenue and Profit ContributionThe acquired business contributed revenue of US$6,114,463 and the net profit after tax of US$580,918 to the Group from the period from 5 August 2014 to 31 December 2014. Had MITI been consolidated from 1 January 2014, consolidated revenue and consolidated loss for the financial year ended 31 December 2014 would have been US$68,598,339 and US$11,747,383 respectively.
(b) Acquisition of Subsidiary, PT Sumber Sari Rejeki (“SSR”)
On 3 October 2014, the Company acquired 100% equity interests in SSR and its subsidiary, PT Pambuang Investindo (“PI”), a company incorporated in the Republic of Indonesia. PI owns 67.5% equity interests in PT Mentari Pambuang Internasional (“MPI”) which in turn owns 67.5% participating rights in PSC KP dated 19 December 2011. The principal activities of SSR and PI are wholesale trading of photographic equipment and optical goods and multi-industry business sector respectively. The principal activity of MPI is exploration and operation of oil fields for crude petroleum production.
Details of the consideration paid, the assets acquired and liabilities assumed, the non-controlling interests recognised and the effects on the cash flows of the Group, at the acquisition date based on the purchase price allocation performed by management, are as follows:
(i) Purchase Consideration US$
Cash paid 312,001 Cost reimbursed 1,038,000 Consideration transferred for the business 1,350,001
(ii) Effects on Cash Flows of the Group US$
Cash paid 312,000 Less: cash and cash equivalents in subsidiary acquired (25,776) Cash outflow on acquisition 286,224
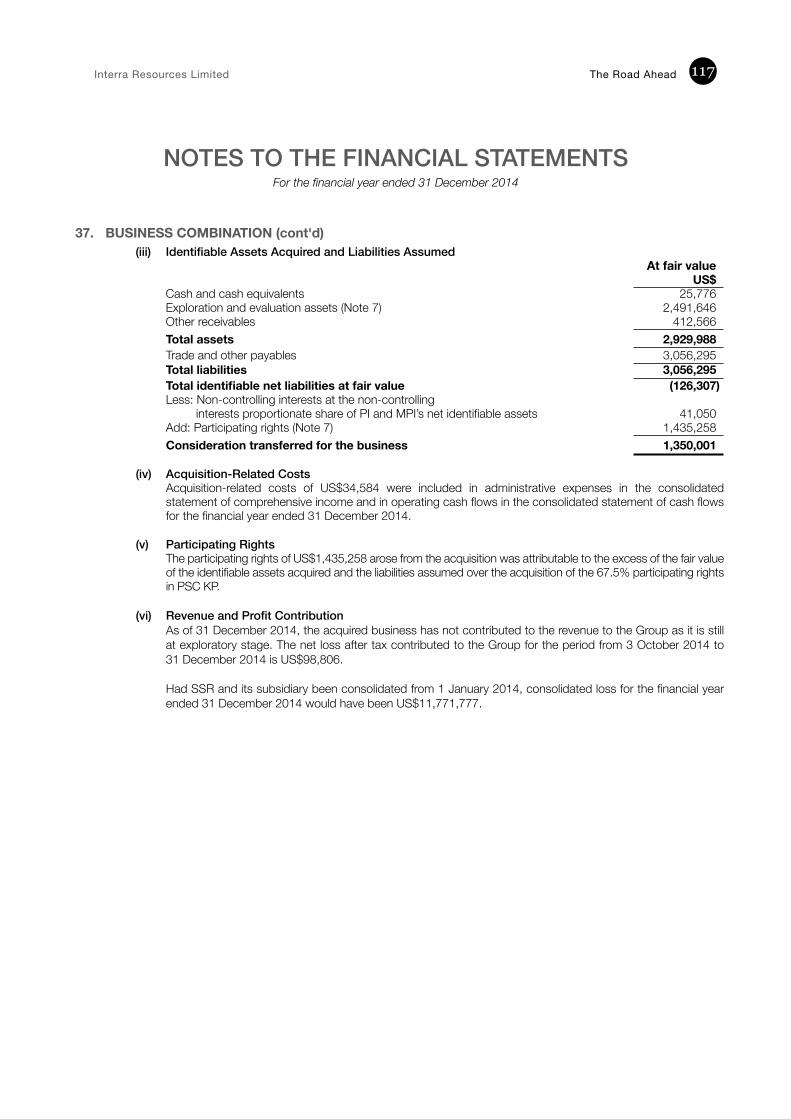
Interra Resources Limited The Road Ahead 117
NOTES TO THE FINANCIAL STATEMENTSFor the financial year ended 31 December 2014
37. BUSINESS COMBINATION (cont'd)(iii) Identifiable Assets Acquired and Liabilities Assumed At fair value US$
Cash and cash equivalents 25,776 Exploration and evaluation assets (Note 7) 2,491,646 Other receivables 412,566 Total assets 2,929,988 Trade and other payables 3,056,295 Total liabilities 3,056,295 Total identifiable net liabilities at fair value (126,307) Less: Non-controlling interests at the non-controlling
interests proportionate share of PI and MPI’s net identifiable assets 41,050 Add: Participating rights (Note 7) 1,435,258 Consideration transferred for the business 1,350,001
(iv) Acquisition-Related Costs Acquisition-related costs of US$34,584 were included in administrative expenses in the consolidated
statement of comprehensive income and in operating cash flows in the consolidated statement of cash flows for the financial year ended 31 December 2014.
(v) Participating Rights The participating rights of US$1,435,258 arose from the acquisition was attributable to the excess of the fair value
of the identifiable assets acquired and the liabilities assumed over the acquisition of the 67.5% participating rights in PSC KP.
(vi) Revenue and Profit Contribution As of 31 December 2014, the acquired business has not contributed to the revenue to the Group as it is still
at exploratory stage. The net loss after tax contributed to the Group for the period from 3 October 2014 to 31 December 2014 is US$98,806.
Had SSR and its subsidiary been consolidated from 1 January 2014, consolidated loss for the financial year
ended 31 December 2014 would have been US$11,771,777.
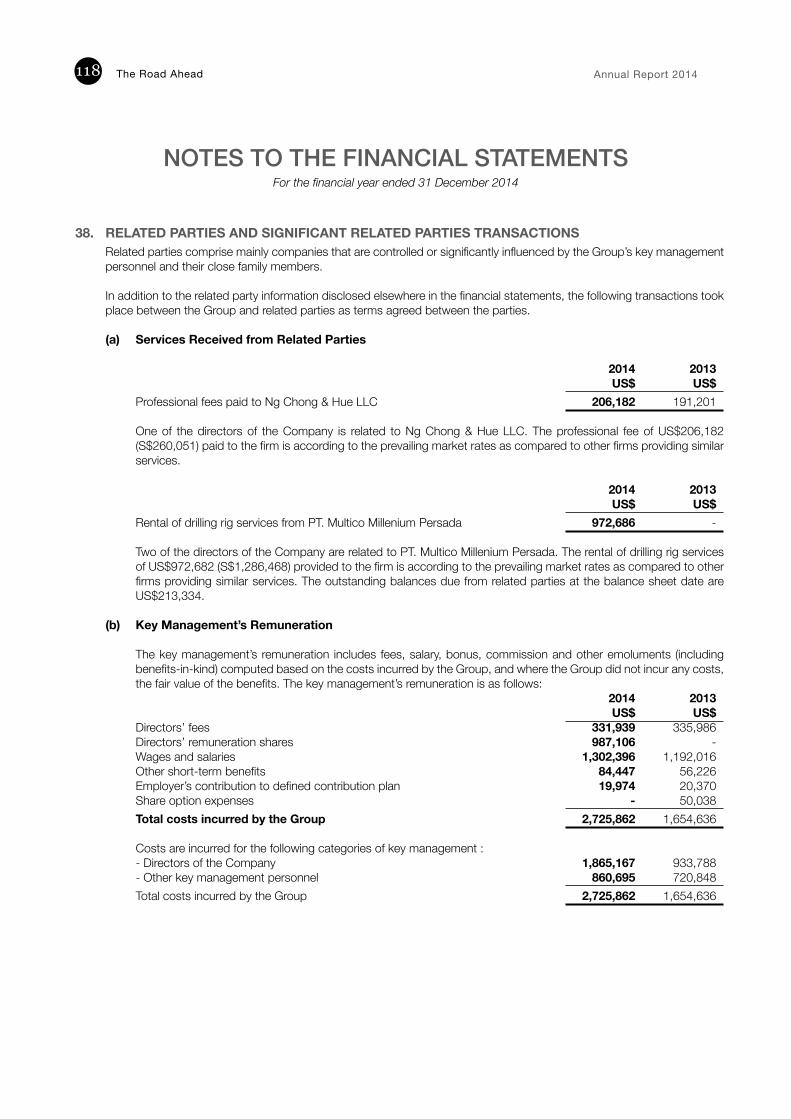
The Road Ahead Annual Report 2014118
NOTES TO THE FINANCIAL STATEMENTSFor the financial year ended 31 December 2014
38. RELATED PARTIES AND SIGNIFICANT RELATED PARTIES TRANSACTIONS Related parties comprise mainly companies that are controlled or significantly influenced by the Group’s key management personnel and their close family members. In addition to the related party information disclosed elsewhere in the financial statements, the following transactions took place between the Group and related parties as terms agreed between the parties. (a) Services Received from Related Parties
2014 2013 US$ US$
Professional fees paid to Ng Chong & Hue LLC 206,182 191,201 One of the directors of the Company is related to Ng Chong & Hue LLC. The professional fee of US$206,182 (S$260,051) paid to the firm is according to the prevailing market rates as compared to other firms providing similar services. 2014 2013 US$ US$ Rental of drilling rig services from PT. Multico Millenium Persada 972,686 - Two of the directors of the Company are related to PT. Multico Millenium Persada. The rental of drilling rig services of US$972,682 (S$1,286,468) provided to the firm is according to the prevailing market rates as compared to other firms providing similar services. The outstanding balances due from related parties at the balance sheet date are US$213,334.
(b) Key Management’s Remuneration
The key management’s remuneration includes fees, salary, bonus, commission and other emoluments (including benefits-in-kind) computed based on the costs incurred by the Group, and where the Group did not incur any costs, the fair value of the benefits. The key management’s remuneration is as follows: 2014 2013 US$ US$ Directors’ fees 331,939 335,986 Directors’ remuneration shares 987,106 - Wages and salaries 1,302,396 1,192,016 Other short-term benefits 84,447 56,226 Employer’s contribution to defined contribution plan 19,974 20,370 Share option expenses - 50,038 Total costs incurred by the Group 2,725,862 1,654,636 Costs are incurred for the following categories of key management : - Directors of the Company 1,865,167 933,788 - Other key management personnel 860,695 720,848 Total costs incurred by the Group 2,725,862 1,654,636
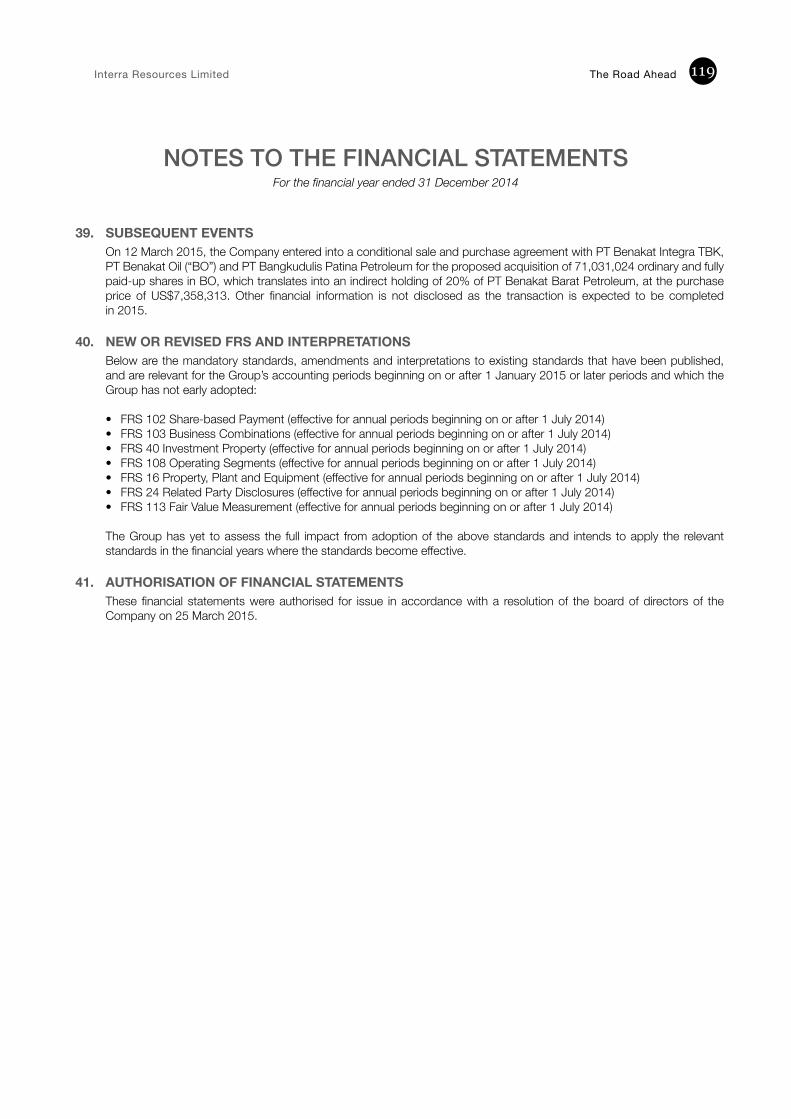
Interra Resources Limited The Road Ahead 119
NOTES TO THE FINANCIAL STATEMENTSFor the financial year ended 31 December 2014
39. SUBSEQUENT EVENTS On 12 March 2015, the Company entered into a conditional sale and purchase agreement with PT Benakat Integra TBK, PT Benakat Oil (“BO”) and PT Bangkudulis Patina Petroleum for the proposed acquisition of 71,031,024 ordinary and fully paid-up shares in BO, which translates into an indirect holding of 20% of PT Benakat Barat Petroleum, at the purchase price of US$7,358,313. Other financial information is not disclosed as the transaction is expected to be completed in 2015.
40. NEW OR REVISED FRS AND INTERPRETATIONS
Below are the mandatory standards, amendments and interpretations to existing standards that have been published, and are relevant for the Group’s accounting periods beginning on or after 1 January 2015 or later periods and which the Group has not early adopted:
• FRS 102 Share-based Payment (effective for annual periods beginning on or after 1 July 2014)• FRS 103 Business Combinations (effective for annual periods beginning on or after 1 July 2014)• FRS 40 Investment Property (effective for annual periods beginning on or after 1 July 2014)• FRS 108 Operating Segments (effective for annual periods beginning on or after 1 July 2014)• FRS 16 Property, Plant and Equipment (effective for annual periods beginning on or after 1 July 2014)• FRS 24 Related Party Disclosures (effective for annual periods beginning on or after 1 July 2014)• FRS 113 Fair Value Measurement (effective for annual periods beginning on or after 1 July 2014)
The Group has yet to assess the full impact from adoption of the above standards and intends to apply the relevant standards in the financial years where the standards become effective.
41. AUTHORISATION OF FINANCIAL STATEMENTS
These financial statements were authorised for issue in accordance with a resolution of the board of directors of the Company on 25 March 2015.

This page has been intentionally left blank.
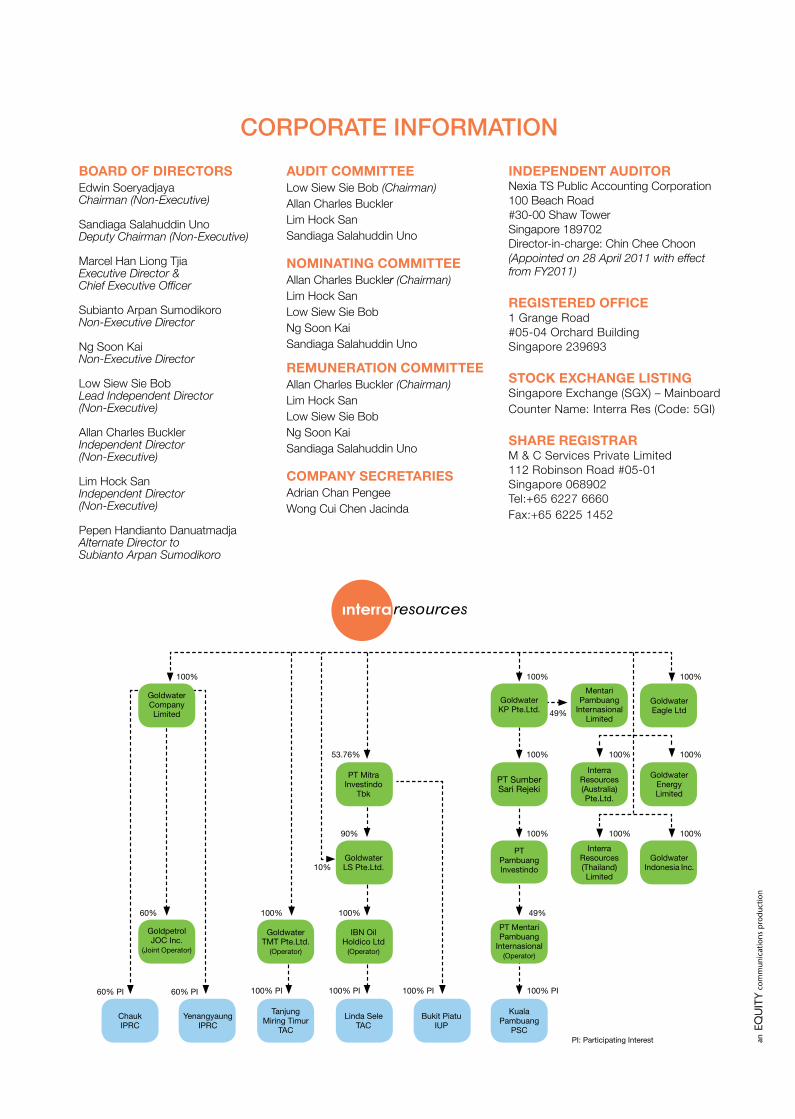
DisclaimerThis Annual Report may contain forward-looking statements that are subject to risk factors associated with upstream petroleum industry and mining business. Actual future performance, outcomes and results may differ materially from those expressed in forward-looking statements as a result of a number of risks, uncertainties and assumptions including but not limited to oil and gas price fluctuations, actual demand, currency fluctuations, drilling and production results, reserve estimates, loss of market, industry competition, environmental risks, physical risks, legislative, fiscal and regulatory developments, general industry conditions, economic and financial market conditions in various countries and regions, political risks, project delay or advancement, approvals, cost estimates, changes in operating expenses, cost of capital and capital availability, interest rate trends and the continued availability of financing in the amounts and the terms necessary to support future business. No reliance should be placed on these forward looking statements, which are based on the current view of management of future events.
BOARD OF DIRECTORSEdwin Soeryadjaya Chairman (Non-Executive)
Sandiaga Salahuddin Uno Deputy Chairman (Non-Executive)
Marcel Han Liong TjiaExecutive Director & Chief Executive Officer
Subianto Arpan SumodikoroNon-Executive Director
Ng Soon KaiNon-Executive Director
Low Siew Sie BobLead Independent Director(Non-Executive)
Allan Charles BucklerIndependent Director (Non-Executive)
Lim Hock SanIndependent Director (Non-Executive)
Pepen Handianto DanuatmadjaAlternate Director to Subianto Arpan Sumodikoro
AUDIT COMMITTEELow Siew Sie Bob (Chairman)Allan Charles BucklerLim Hock SanSandiaga Salahuddin Uno
NOMINATING COMMITTEEAllan Charles Buckler (Chairman)Lim Hock SanLow Siew Sie BobNg Soon KaiSandiaga Salahuddin Uno
REMUNERATION COMMITTEEAllan Charles Buckler (Chairman)Lim Hock SanLow Siew Sie BobNg Soon Kai Sandiaga Salahuddin Uno
COMPANY SECRETARIESAdrian Chan PengeeWong Cui Chen Jacinda
CORPORATE INFORMATION
INDEPENDENT AUDITORNexia TS Public Accounting Corporation100 Beach Road#30-00 Shaw TowerSingapore 189702Director-in-charge: Chin Chee Choon(Appointed on 28 April 2011 with effect from FY2011)
REGISTERED OFFICE1 Grange Road#05-04 Orchard BuildingSingapore 239693
STOCK EXCHANGE LISTINGSingapore Exchange (SGX) – MainboardCounter Name: Interra Res (Code: 5GI)
SHARE REGISTRARM & C Services Private Limited112 Robinson Road #05-01Singapore 068902Tel: +65 6227 6660Fax: +65 6225 1452
PI: Participating Interest
Goldwater Eagle Ltd
Goldwater Energy Limited
Goldwater Company Limited
100% 100% 100%
100%
100%100%
100%
49%
100%
100%
49%100% 100%
10%
90%
53.76%
60%
60% PI 60% PI 100% PI 100% PI 100% PI 100% PI
Goldpetrol JOC Inc.
(Joint Operator)
YenangyaungIPRC
ChaukIPRC
MentariPambuang
InternasionalLimited
Goldwater Indonesia Inc.
Goldwater TMT Pte.Ltd.
(Operator)
Tanjung Miring Timur
TAC
Interra Resources (Australia) Pte.Ltd.
GoldwaterLS Pte.Ltd.
PT Mitra Investindo
Tbk
Linda Sele TAC
Bukit Piatu IUP
IBN Oil Holdico Ltd
(Operator)
Interra Resources (Thailand) Limited
GoldwaterKP Pte.Ltd.
PT SumberSari Rejeki
PTPambuang Investindo
PT MentariPambuang
Internasional(Operator)
Kuala Pambuang
PSC
CONTENTS CORPORATE PROFILE 02 FINANCIAL HIGHLIGHTS 04 CHAIRMAN’S STATEMENT 07
BOARD OF DIRECTORS 10 KEY MANAGEMENT 13 OPERATING AND FINANCIAL REVIEW 15
CORPORATE GOVERNANCE REPORT 25 SHAREHOLDER INFORMATION 44 DIRECTORS' REPORT 47
STATEMENT BY DIRECTORS 52 INDEPENDENT AUDITOR’S REPORT 53 BALANCE SHEETS 54
STATEMENT OF COMPREHENSIVE INCOME 55 CONSOLIDATED STATEMENT OF CHANGES IN EQUITY 56
CONSOLIDATED STATEMENT OF CASH FLOWS 58 NOTES TO THE FINANCIAL STATEMENTS 60

THE ROAD AHEAD
INTERRA RESOURCES LIMITEDANNUAL REPORT 2014Interra Resources Lim
ited Annual Report 2014
INTERRA RESOURCES LIMITEDCompany Registration No. 197300166Z
1 Grange Road #05-04 Orchard BuildingSingapore 239693
Tel : (65) 6732 1711 Fax : (65) 6738 1170Email : [email protected] : www.interraresources.com
Recommended