RIVISTA ITALIANA DI GEOTECNICA 2/2011
Lesson Learned from Liquefaction Potential Assessment of Silty Sand Deposits in a Case Study in Italy
Diego C.F. Lo Presti, Nunzio Squeglia
SummaryThe paper shows a case study concerning the liquefaction potential assessment of deposits which mainly consist of non
plastic silts and sands. The site under study has been characterized by means of in situ tests (CPTU, SPT and DPSH),boreholes and laboratory tests on undisturbed samples. Liquefaction susceptibility has been evaluated by means of severalstandard procedures prescribed by codes or available in technical literature. The evaluation of liquefaction potential has beencarried out by means of different standard procedures based on in situ and laboratory tests. A qualitative estimation of possibledamages to shallow structures has been obtained on the basis of indication contained in TC4-ISSMGE [1993]. In addition,quantitative effects of minor liquefaction phoenomena on shallow structures have been studied by means of simplified soil-foundation interaction. The main scope of the paper is to show that application of standard procedures for liquefaction suscep-tibility or liquefaction potential in areas of medium – low seismicity can lead to overemphasize the liquefaction problem. Inaddition, any liquefaction study should consider, at least in a simplified way, the effects of possible liquefaction on the shallowstructures. In addition useful information about the liquefaction strength of silty sands is provided.
Introduction
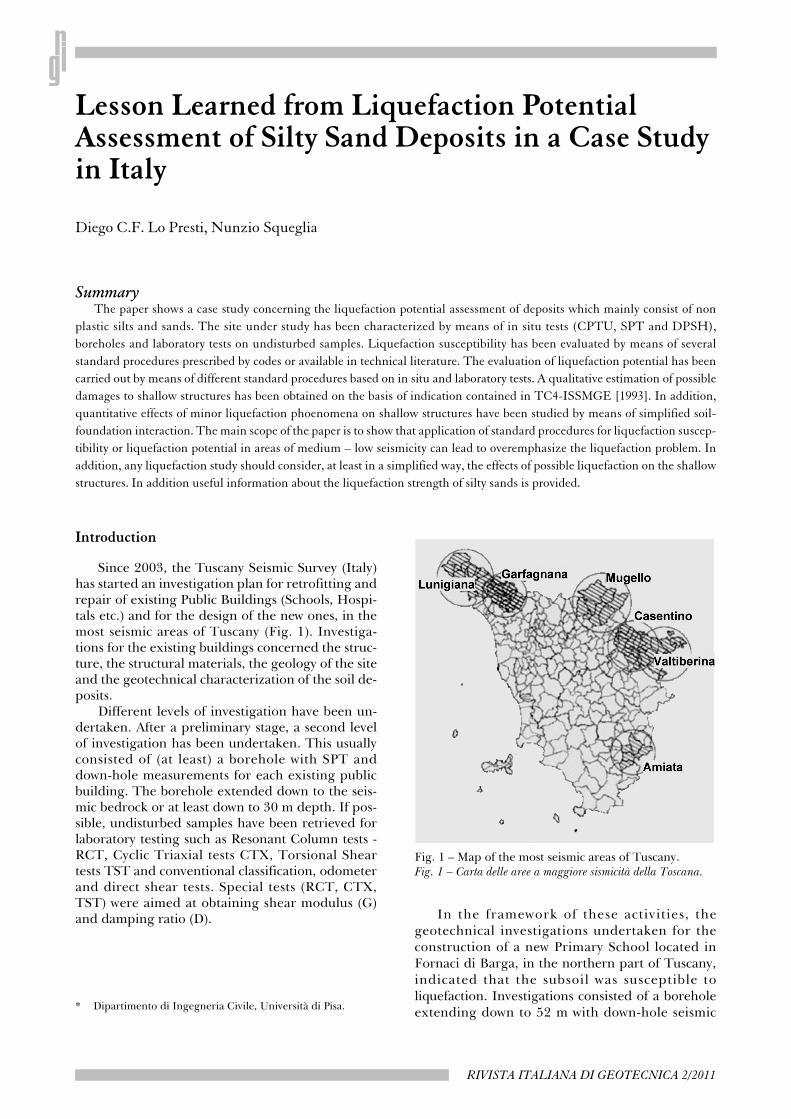
Since 2003, the Tuscany Seismic Survey (Italy)has started an investigation plan for retrofitting andrepair of existing Public Buildings (Schools, Hospi-tals etc.) and for the design of the new ones, in themost seismic areas of Tuscany (Fig. 1). Investiga-tions for the existing buildings concerned the struc-ture, the structural materials, the geology of the siteand the geotechnical characterization of the soil de-posits.
Different levels of investigation have been un-dertaken. After a preliminary stage, a second levelof investigation has been undertaken. This usuallyconsisted of (at least) a borehole with SPT anddown-hole measurements for each existing publicbuilding. The borehole extended down to the seis-mic bedrock or at least down to 30 m depth. If pos-sible, undisturbed samples have been retrieved forlaboratory testing such as Resonant Column tests -RCT, Cyclic Triaxial tests CTX, Torsional Sheartests TST and conventional classification, odometerand direct shear tests. Special tests (RCT, CTX,TST) were aimed at obtaining shear modulus (G)and damping ratio (D). In the framework of these activities, the
geotechnical investigations undertaken for theconstruction of a new Primary School located inFornaci di Barga, in the northern part of Tuscany,indicated that the subsoil was susceptible toliquefaction. Investigations consisted of a boreholeextending down to 52 m with down-hole seismic* Dipartimento di Ingegneria Civile, Università di Pisa.
Fig. 1 – Map of the most seismic areas of Tuscany.Fig. 1 – Carta delle aree a maggiore sismicità della Toscana.
69LESSON LEARNED FROM LIQUEFACTION POTENTIAL ASSESSMENT OF SILTY SAND DEPOSITS IN A CASE STUDY IN ITALY
APRILE - GIUGNO 2011
measurements and a limited number of SPTmeasurements. Therefore, additional investigationshave been carried out in order to have a betterevaluation of liquefaction susceptibility andliquefaction hazards. More specifically, twoboreholes with SPT measurements, a continuousdynamic probing (DPSH), three CPTU tests and anumber of classification tests and undrainedcompression loading cyclic triaxial tests (UCTX) inthe laboratory were performed.
On the other hand, seismic risk analysis based ona probabilistic approach indicated, for the site underconsideration, that the earthquake which mainlycontributes to the seismic risk in terms of horizontalpeak ground acceleration (HPGA) can be character-ized by a Magnitude of 5.8 with a distance of 20 km[LAI et al., 2005]. Historically, the site has experi-enced a number of earthquakes with Magnitude anddistance similar to those above indicated even in re-cent years (Tab.I), [FIALDINI, 2008]. Nonetheless, rel-evant liquefaction phenomena have never been ob-served in the study area. Therefore, it is possible toconclude that a true liquefaction can be excluded.On the other hand it is not possible to exclude theoccurrence in the past or in the future of minor liq-uefaction phenomena (e.g. sand boils, water spouts).In fact, in the past the area was not urbanised, there-
fore in remote times minor liquefaction phenomenacould have happened without any record of them.
The designed building is a one-storey construc-tion with a reinforced concrete cast-in-situ structure.
The paper shows the results of the investigat-ions and analyses. The analysis results are discussedwith special attention to the effect of non-plastic silton liquefaction resistance of cohesionless soils.Moreover the prescriptions of Eurocode 8 andIta l ian code, concerning the l iquefact ionsusceptibility, are critically discussed, in the light ofthe case study.
Seismicity of the study area
In recent years big efforts have been done in It-aly to improve the seismic macrozonation of the ter-ritory. Actually the HPGA for different return peri-ods are available at the apexes of a square net of0.05° of side [INGV, 2005], which really representsan extremely advanced tool in the a-seismic design.Moreover a MS-Excel based software [SpettriNTCver.1.0.3, 2008] is available to interpolate the HPGAwith respect to period and referring to the effectivesite co-ordinates.
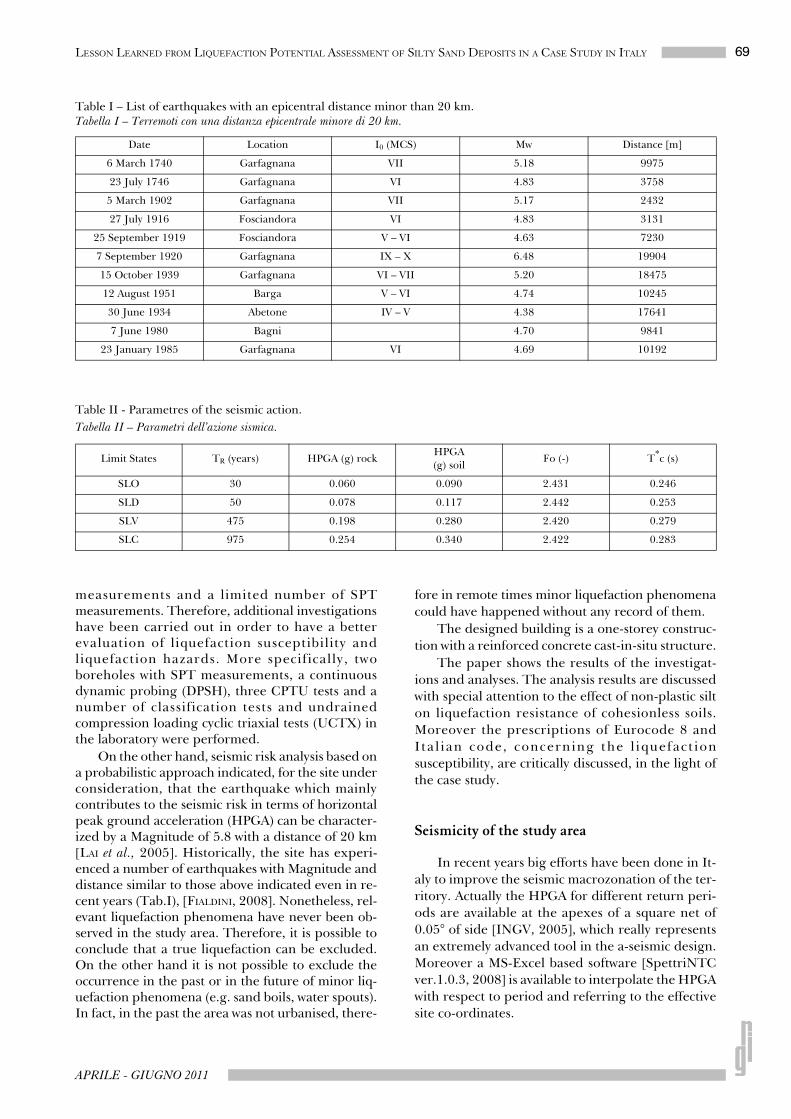
Table I – List of earthquakes with an epicentral distance minor than 20 km.Tabella I – Terremoti con una distanza epicentrale minore di 20 km.
Date Location I0 (MCS) Mw Distance [m]
6 March 1740 Garfagnana VII 5.18 9975
23 July 1746 Garfagnana VI 4.83 3758
5 March 1902 Garfagnana VII 5.17 2432
27 July 1916 Fosciandora VI 4.83 3131
25 September 1919 Fosciandora V – VI 4.63 7230
7 September 1920 Garfagnana IX – X 6.48 19904
15 October 1939 Garfagnana VI – VII 5.20 18475
12 August 1951 Barga V – VI 4.74 10245
30 June 1934 Abetone IV – V 4.38 17641
7 June 1980 Bagni 4.70 9841
23 January 1985 Garfagnana VI 4.69 10192
Table II - Parametres of the seismic action.Tabella II – Parametri dell’azione sismica.
Limit States TR (years) HPGA (g) rockHPGA(g) soil
Fo (-) T*c (s)
SLO 30 0.060 0.090 2.431 0.246
SLD 50 0.078 0.117 2.442 0.253
SLV 475 0.198 0.280 2.420 0.279
SLC 975 0.254 0.340 2.422 0.283
70 LO PRESTI - SQUEGLIA
RIVISTA ITALIANA DI GEOTECNICA
For the case study the values reported in TableII have been obtained.
In Table II, TR is return period, F0 and T*c areparameters used in NTC2008 to define elastic spec-trum. The parameter F0 is also used in NTC2008 tocompute the stratigraphic amplification factor S =k1 – F0·k2·HPGA(rock), in which k1 and k2 are con-stants depending on type of soil.
Due to amplification effects, the HPGA at thetop of the soil deposit has been computed as:
HPGA(soil) = S*HPGA(rock) (1)
where the parameter S takes into account both top-ographic and stratigraphic amplification.
For the case under consideration the topo-graphic amplification factor suggested by NTC2008is equal to 1.0 and S is equal to 1.5 for the first twoserviceability limit states (SLO and SLD) and to1.412 and 1.328 for the two ultimate limit states re-spectively (SLV and SLC)
Even though there is no specification in theNTC [2008] about the limit state to be considered,it seems reasonable (for liquefaction analysis) to re-fer to the SLV limit state with a return period of 475years, which corresponds to a probability of exceed-ing equal to 10% in 50 years.
The seismicity of the study area has been com-pletely defined by LAI et al. [2005] that performed ade-aggregation of the seismic hazard. The study hasbeen carried out using standard de-aggregationprocedures [KRAMER, 1996] obtaining the followingcouple of Magnitudes and epicentral distanceswhich mainly contribute to the hazard in terms ofHPGA with a return period of 475 years:
M = 5.8, d = 20 km.
After that, they selected a group of seven free-field natural accelerograms compatible with the ob-tained Magnitude-epicentral distance couples, es-tablishing a window for both M and d. They also ver-ified the capability of the selected accelerograms ofreproducing on average the prescribed spectrum onrock [NTC 2008; Eurocode 8, 2003]. The character-
istics of the selected accelerograms are listed in Ta-ble III.
Such accelerograms have been used to computethe seismic response at the top of the soil depositperforming 1D total stress analysis. This approachwas used as an alternative to the application of NTC[2008] in assessing the HPGA.
More recently, SPALLAROSSA and BARANI [2007]published the results of de-aggregation of the seis-mic hazard with respect to the HPGA for a returnperiod of 475 years for the whole Italian territory.Their study indicate for the site under considerationa Magnitude of 5.0 – 5.5 with a distance range be-tween 5 and 25 km.
Ground investigation
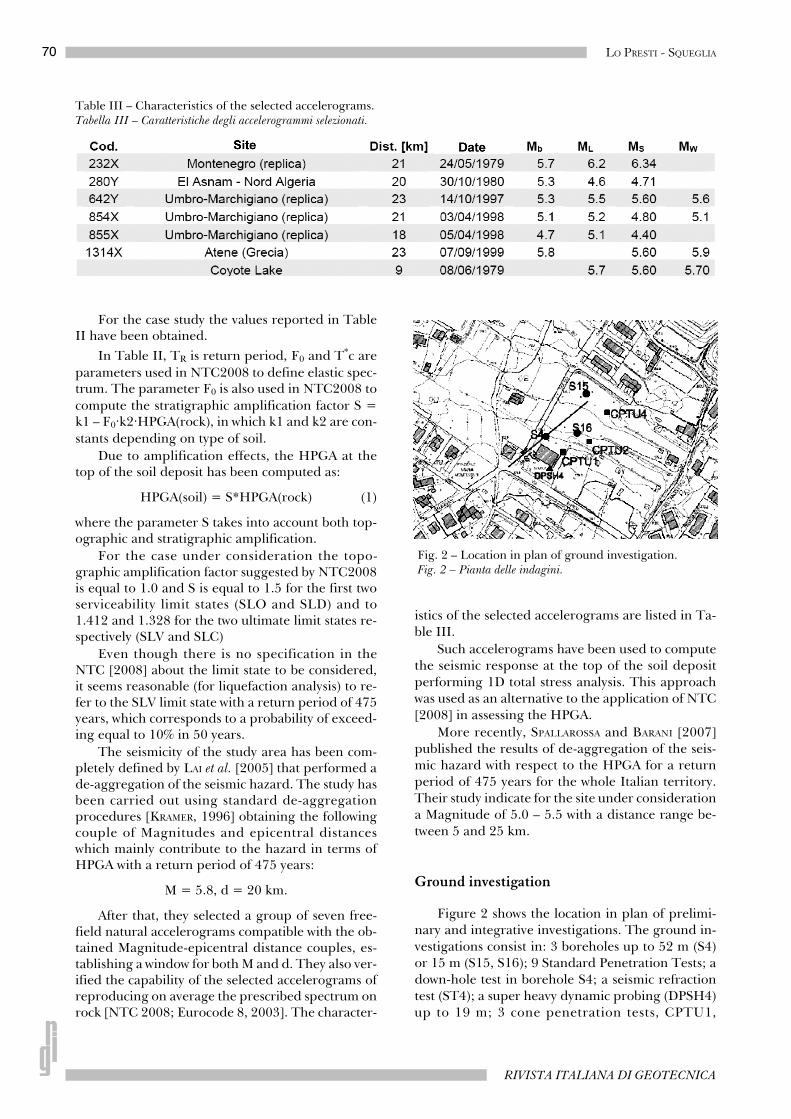
Figure 2 shows the location in plan of prelimi-nary and integrative investigations. The ground in-vestigations consist in: 3 boreholes up to 52 m (S4)or 15 m (S15, S16); 9 Standard Penetration Tests; adown-hole test in borehole S4; a seismic refractiontest (ST4); a super heavy dynamic probing (DPSH4)up to 19 m; 3 cone penetration tests, CPTU1,
Table III – Characteristics of the selected accelerograms.Tabella III – Caratteristiche degli accelerogrammi selezionati.
Fig. 2 – Location in plan of ground investigation.Fig. 2 – Pianta delle indagini.
71LESSON LEARNED FROM LIQUEFACTION POTENTIAL ASSESSMENT OF SILTY SAND DEPOSITS IN A CASE STUDY IN ITALY
APRILE - GIUGNO 2011
CPTU2 and CPTU3, carried out by means of a pie-zocone up to 10, 11.3 and 16.4 m, respectively. Ninesamples have been retrieved from boreholes bymeans of thin wall inox tube sampler (Shelby sam-pler). About the possibility of obtaining “undis-turbed” samples with any type of sampler, there areseveral doubts in particular with this kind of soil. Onthe other hand, there are not reliable procedures toassess sample disturbance. Therefore, the fact thatwe are dealing with “undisturbed” samples is a con-sequence of visual inspection of sample after its ex-traction (e.g. Fig. 7).
Several laboratory tests have been carried out,including RCTs, TSTs, and UCTX. Table IV liststhe laboratory tests performed on undisturbed sam-ples. In addition to listed tests, several determina-tion of grain size distribution and plastic index havebeen carried out on remoulded specimens.
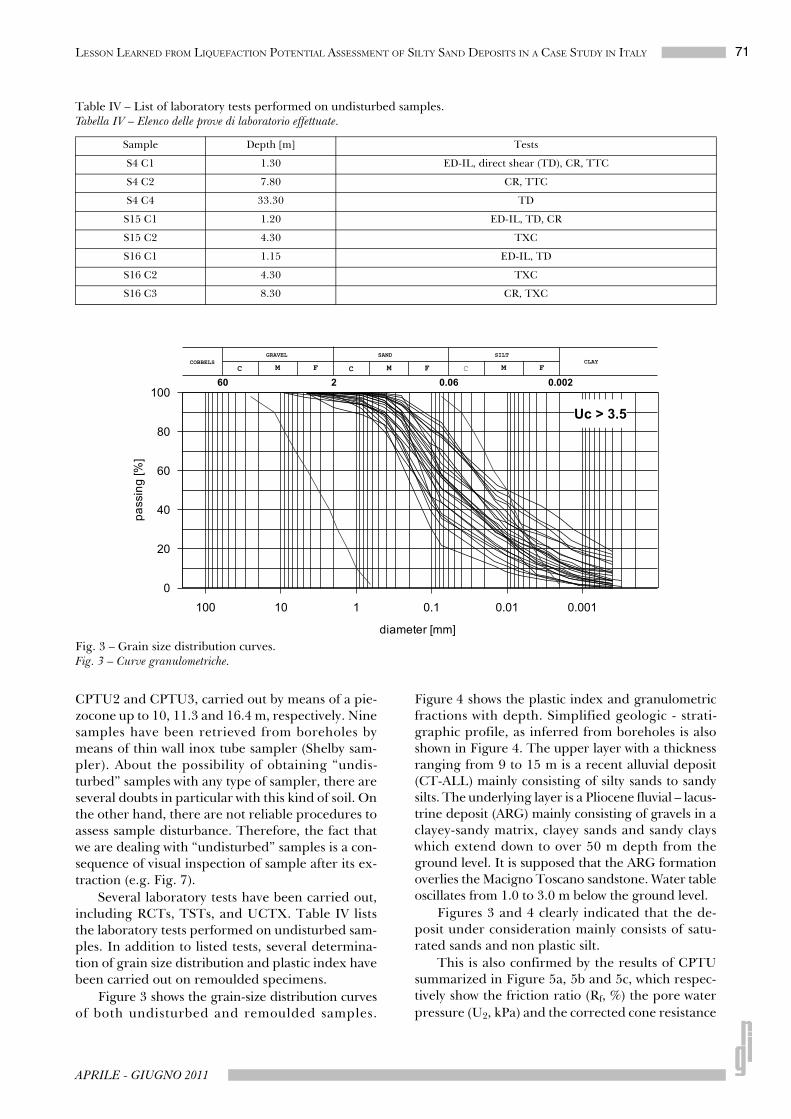
Figure 3 shows the grain-size distribution curvesof both undisturbed and remoulded samples.
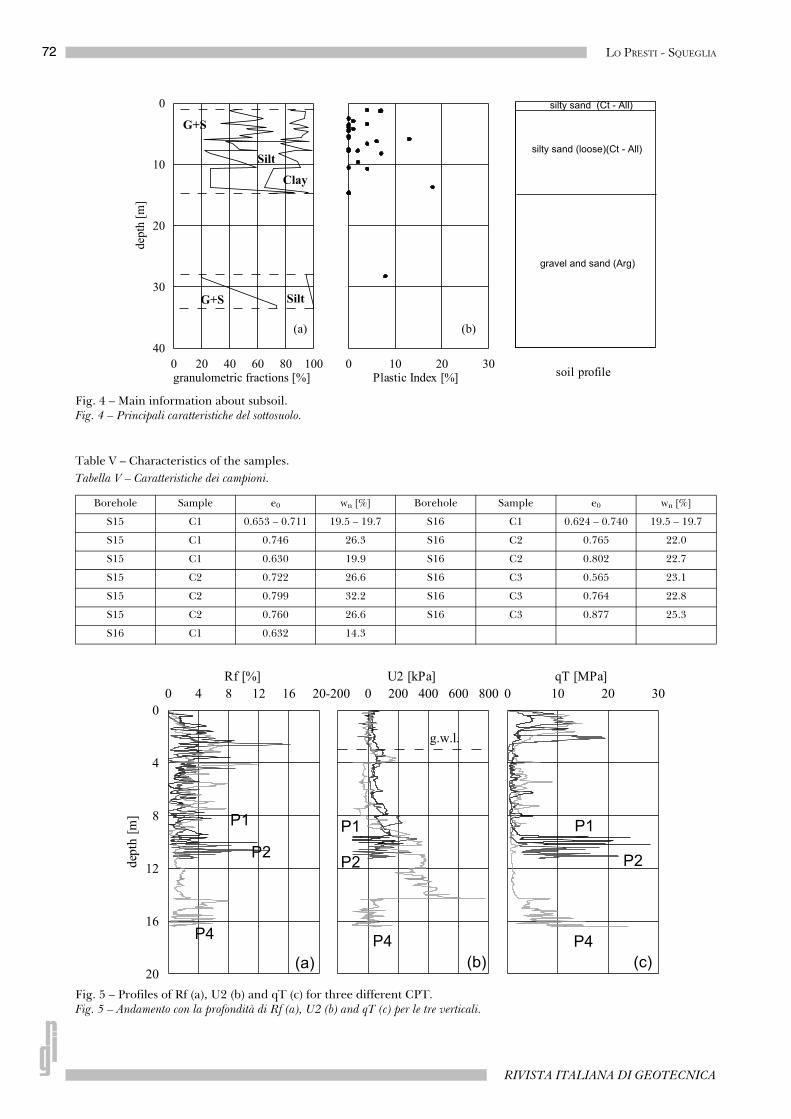
Figure 4 shows the plastic index and granulometricfractions with depth. Simplified geologic - strati-graphic profile, as inferred from boreholes is alsoshown in Figure 4. The upper layer with a thicknessranging from 9 to 15 m is a recent alluvial deposit(CT-ALL) mainly consisting of silty sands to sandysilts. The underlying layer is a Pliocene fluvial – lacus-trine deposit (ARG) mainly consisting of gravels in aclayey-sandy matrix, clayey sands and sandy clayswhich extend down to over 50 m depth from theground level. It is supposed that the ARG formationoverlies the Macigno Toscano sandstone. Water tableoscillates from 1.0 to 3.0 m below the ground level.
Figures 3 and 4 clearly indicated that the de-posit under consideration mainly consists of satu-rated sands and non plastic silt.
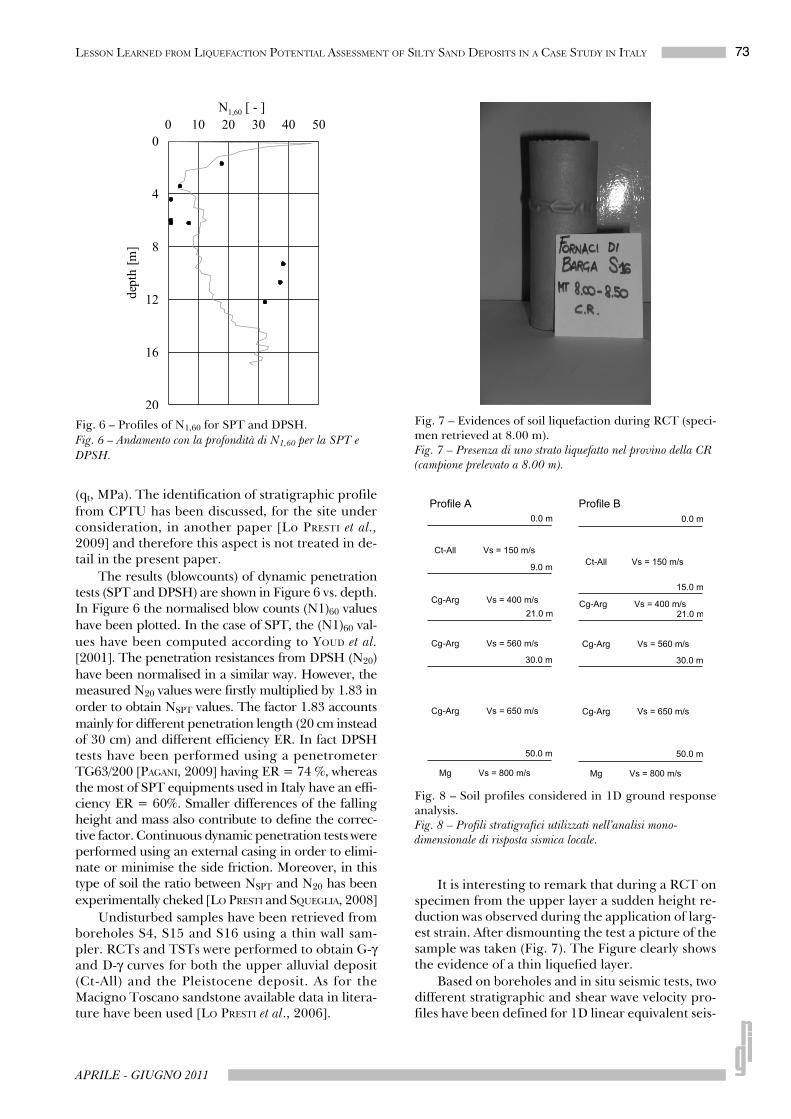
This is also confirmed by the results of CPTUsummarized in Figure 5a, 5b and 5c, which respec-tively show the friction ratio (Rf, %) the pore waterpressure (U2, kPa) and the corrected cone resistance
Table IV – List of laboratory tests performed on undisturbed samples.Tabella IV – Elenco delle prove di laboratorio effettuate.
Sample Depth [m] Tests
S4 C1 1.30 ED-IL, direct shear (TD), CR, TTC
S4 C2 7.80 CR, TTC
S4 C4 33.30 TD
S15 C1 1.20 ED-IL, TD, CR
S15 C2 4.30 TXC
S16 C1 1.15 ED-IL, TD
S16 C2 4.30 TXC
S16 C3 8.30 CR, TXC
Fig. 3 – Grain size distribution curves.Fig. 3 – Curve granulometriche.
72 LO PRESTI - SQUEGLIA
RIVISTA ITALIANA DI GEOTECNICA
Fig. 4 – Main information about subsoil.Fig. 4 – Principali caratteristiche del sottosuolo.
Table V – Characteristics of the samples.Tabella V – Caratteristiche dei campioni.
Borehole Sample e0 wn [%] Borehole Sample e0 wn [%]
S15 C1 0.653 – 0.711 19.5 – 19.7 S16 C1 0.624 – 0.740 19.5 – 19.7
S15 C1 0.746 26.3 S16 C2 0.765 22.0
S15 C1 0.630 19.9 S16 C2 0.802 22.7
S15 C2 0.722 26.6 S16 C3 0.565 23.1
S15 C2 0.799 32.2 S16 C3 0.764 22.8
S15 C2 0.760 26.6 S16 C3 0.877 25.3
S16 C1 0.632 14.3
Fig. 5 – Profiles of Rf (a), U2 (b) and qT (c) for three different CPT.Fig. 5 – Andamento con la profondità di Rf (a), U2 (b) and qT (c) per le tre verticali.
73LESSON LEARNED FROM LIQUEFACTION POTENTIAL ASSESSMENT OF SILTY SAND DEPOSITS IN A CASE STUDY IN ITALY
APRILE - GIUGNO 2011
(qt, MPa). The identification of stratigraphic profilefrom CPTU has been discussed, for the site underconsideration, in another paper [Lo PRESTI et al.,2009] and therefore this aspect is not treated in de-tail in the present paper.
The results (blowcounts) of dynamic penetrationtests (SPT and DPSH) are shown in Figure 6 vs. depth.In Figure 6 the normalised blow counts (N1)60 valueshave been plotted. In the case of SPT, the (N1)60 val-ues have been computed according to YOUD et al.[2001]. The penetration resistances from DPSH (N20)have been normalised in a similar way. However, themeasured N20 values were firstly multiplied by 1.83 inorder to obtain NSPT values. The factor 1.83 accountsmainly for different penetration length (20 cm insteadof 30 cm) and different efficiency ER. In fact DPSHtests have been performed using a penetrometerTG63/200 [PAGANI, 2009] having ER = 74 %, whereasthe most of SPT equipments used in Italy have an effi-ciency ER = 60%. Smaller differences of the fallingheight and mass also contribute to define the correc-tive factor. Continuous dynamic penetration tests wereperformed using an external casing in order to elimi-nate or minimise the side friction. Moreover, in thistype of soil the ratio between NSPT and N20 has beenexperimentally cheked [LO PRESTI and SQUEGLIA, 2008]
Undisturbed samples have been retrieved fromboreholes S4, S15 and S16 using a thin wall sam-pler. RCTs and TSTs were performed to obtain G-γand D-γ curves for both the upper alluvial deposit(Ct-All) and the Pleistocene deposit. As for theMacigno Toscano sandstone available data in litera-ture have been used [LO PRESTI et al., 2006].
It is interesting to remark that during a RCT onspecimen from the upper layer a sudden height re-duction was observed during the application of larg-est strain. After dismounting the test a picture of thesample was taken (Fig. 7). The Figure clearly showsthe evidence of a thin liquefied layer.
Based on boreholes and in situ seismic tests, twodifferent stratigraphic and shear wave velocity pro-files have been defined for 1D linear equivalent seis-
Fig. 6 – Profiles of N1,60 for SPT and DPSH.Fig. 6 – Andamento con la profondità di N1,60 per la SPT e DPSH.
Fig. 7 – Evidences of soil liquefaction during RCT (speci-men retrieved at 8.00 m).Fig. 7 – Presenza di uno strato liquefatto nel provino della CR (campione prelevato a 8.00 m).
Fig. 8 – Soil profiles considered in 1D ground responseanalysis.Fig. 8 – Profili stratigrafici utilizzati nell’analisi mono-dimensionale di risposta sismica locale.
74 LO PRESTI - SQUEGLIA
RIVISTA ITALIANA DI GEOTECNICA
mic response analyses. Figure 8 shows the consid-ered profiles and soil parameters.
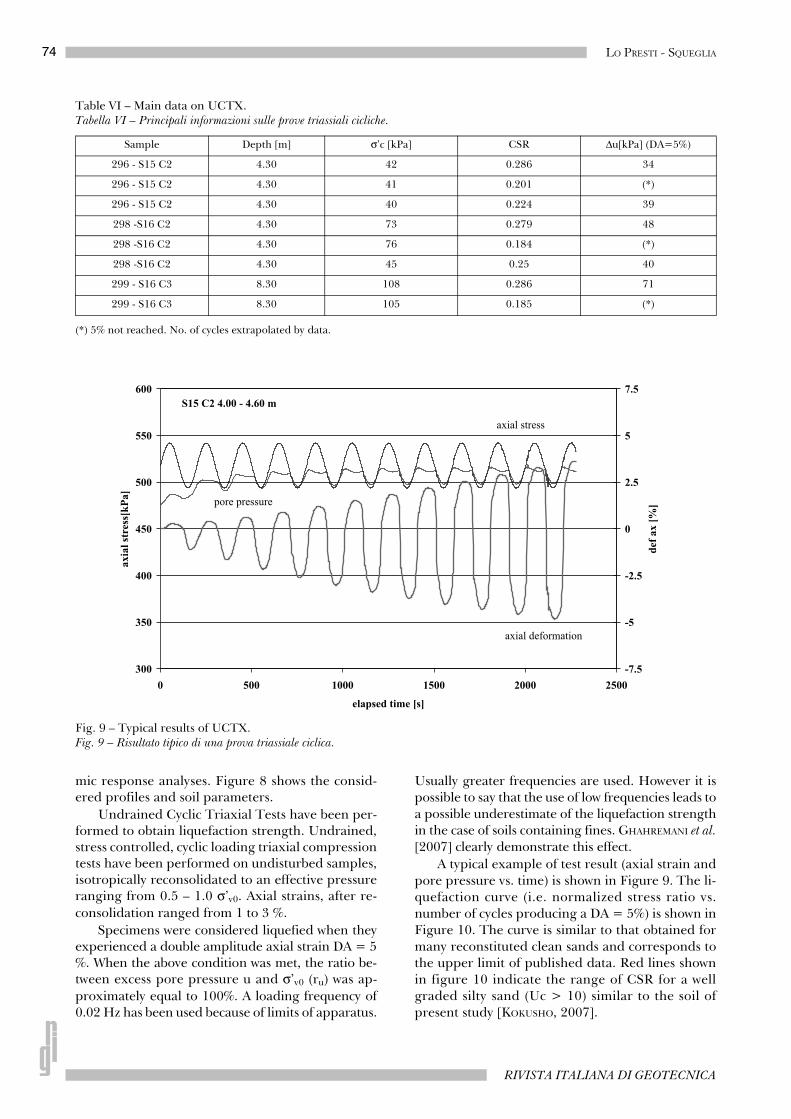
Undrained Cyclic Triaxial Tests have been per-formed to obtain liquefaction strength. Undrained,stress controlled, cyclic loading triaxial compressiontests have been performed on undisturbed samples,isotropically reconsolidated to an effective pressureranging from 0.5 – 1.0 σ’v0. Axial strains, after re-consolidation ranged from 1 to 3 %.
Specimens were considered liquefied when theyexperienced a double amplitude axial strain DA = 5%. When the above condition was met, the ratio be-tween excess pore pressure u and σ’v0 (ru) was ap-proximately equal to 100%. A loading frequency of0.02 Hz has been used because of limits of apparatus.
Usually greater frequencies are used. However it ispossible to say that the use of low frequencies leads toa possible underestimate of the liquefaction strengthin the case of soils containing fines. GHAHREMANI et al.[2007] clearly demonstrate this effect.
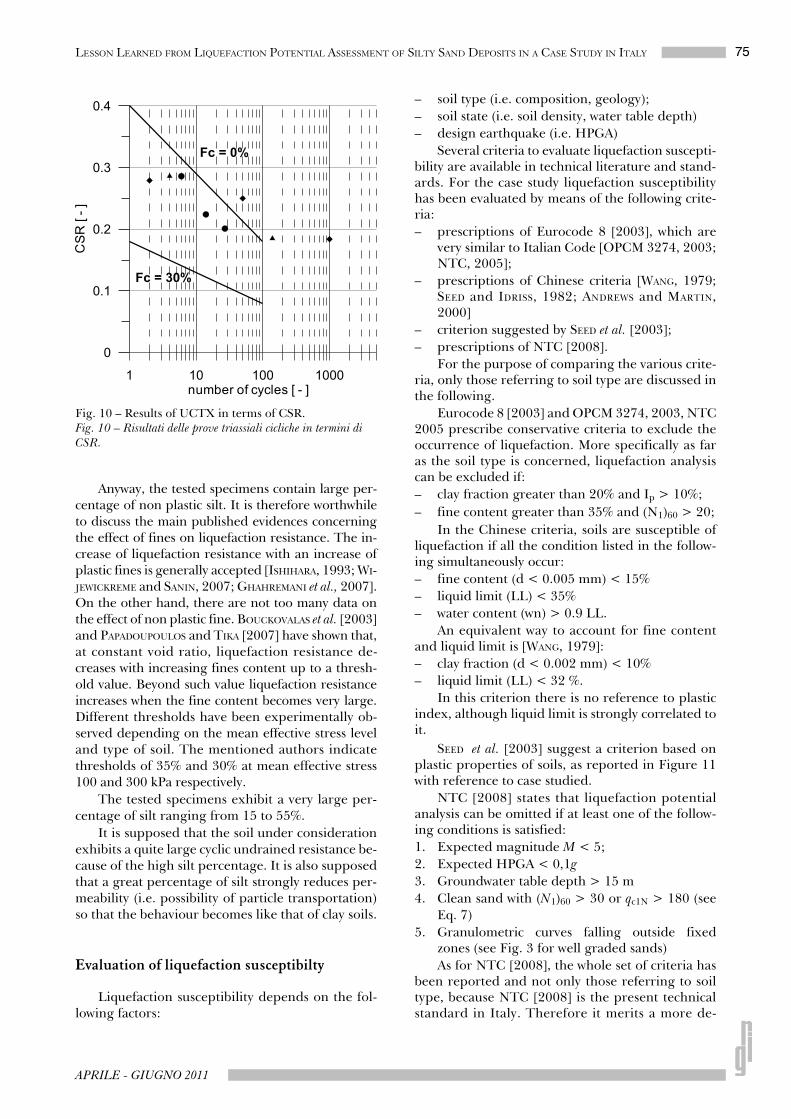
A typical example of test result (axial strain andpore pressure vs. time) is shown in Figure 9. The li-quefaction curve (i.e. normalized stress ratio vs.number of cycles producing a DA = 5%) is shown inFigure 10. The curve is similar to that obtained formany reconstituted clean sands and corresponds tothe upper limit of published data. Red lines shownin figure 10 indicate the range of CSR for a wellgraded silty sand (Uc > 10) similar to the soil ofpresent study [KOKUSHO, 2007].
Table VI – Main data on UCTX.Tabella VI – Principali informazioni sulle prove triassiali cicliche.
(*) 5% not reached. No. of cycles extrapolated by data.
Sample Depth [m] σ’c [kPa] CSR Δu[kPa] (DA=5%)
296 - S15 C2 4.30 42 0.286 34
296 - S15 C2 4.30 41 0.201 (*)
296 - S15 C2 4.30 40 0.224 39
298 -S16 C2 4.30 73 0.279 48
298 -S16 C2 4.30 76 0.184 (*)
298 -S16 C2 4.30 45 0.25 40
299 - S16 C3 8.30 108 0.286 71
299 - S16 C3 8.30 105 0.185 (*)
Fig. 9 – Typical results of UCTX.Fig. 9 – Risultato tipico di una prova triassiale ciclica.
75LESSON LEARNED FROM LIQUEFACTION POTENTIAL ASSESSMENT OF SILTY SAND DEPOSITS IN A CASE STUDY IN ITALY
APRILE - GIUGNO 2011
Anyway, the tested specimens contain large per-centage of non plastic silt. It is therefore worthwhileto discuss the main published evidences concerningthe effect of fines on liquefaction resistance. The in-crease of liquefaction resistance with an increase ofplastic fines is generally accepted [ISHIHARA, 1993; WI-JEWICKREME and SANIN, 2007; GHAHREMANI et al., 2007].On the other hand, there are not too many data onthe effect of non plastic fine. BOUCKOVALAS et al. [2003]and PAPADOUPOULOS and TIKA [2007] have shown that,at constant void ratio, liquefaction resistance de-creases with increasing fines content up to a thresh-old value. Beyond such value liquefaction resistanceincreases when the fine content becomes very large.Different thresholds have been experimentally ob-served depending on the mean effective stress leveland type of soil. The mentioned authors indicatethresholds of 35% and 30% at mean effective stress100 and 300 kPa respectively.
The tested specimens exhibit a very large per-centage of silt ranging from 15 to 55%.
It is supposed that the soil under considerationexhibits a quite large cyclic undrained resistance be-cause of the high silt percentage. It is also supposedthat a great percentage of silt strongly reduces per-meability (i.e. possibility of particle transportation)so that the behaviour becomes like that of clay soils.
Evaluation of liquefaction susceptibilty
Liquefaction susceptibility depends on the fol-lowing factors:
– soil type (i.e. composition, geology);– soil state (i.e. soil density, water table depth)– design earthquake (i.e. HPGA)
Several criteria to evaluate liquefaction suscepti-bility are available in technical literature and stand-ards. For the case study liquefaction susceptibilityhas been evaluated by means of the following crite-ria:– prescriptions of Eurocode 8 [2003], which are
very similar to Italian Code [OPCM 3274, 2003;NTC, 2005];
– prescriptions of Chinese criteria [WANG, 1979;SEED and IDRISS, 1982; ANDREWS and MARTIN,2000]
– criterion suggested by SEED et al. [2003];– prescriptions of NTC [2008].
For the purpose of comparing the various crite-ria, only those referring to soil type are discussed inthe following.
Eurocode 8 [2003] and OPCM 3274, 2003, NTC2005 prescribe conservative criteria to exclude theoccurrence of liquefaction. More specifically as faras the soil type is concerned, liquefaction analysiscan be excluded if:– clay fraction greater than 20% and Ip > 10%;– fine content greater than 35% and (N1)60 > 20;
In the Chinese criteria, soils are susceptible ofliquefaction if all the condition listed in the follow-ing simultaneously occur:– fine content (d < 0.005 mm) < 15%– liquid limit (LL) < 35%– water content (wn) > 0.9 LL.
An equivalent way to account for fine contentand liquid limit is [WANG, 1979]:– clay fraction (d < 0.002 mm) < 10%– liquid limit (LL) < 32 %.
In this criterion there is no reference to plasticindex, although liquid limit is strongly correlated toit.
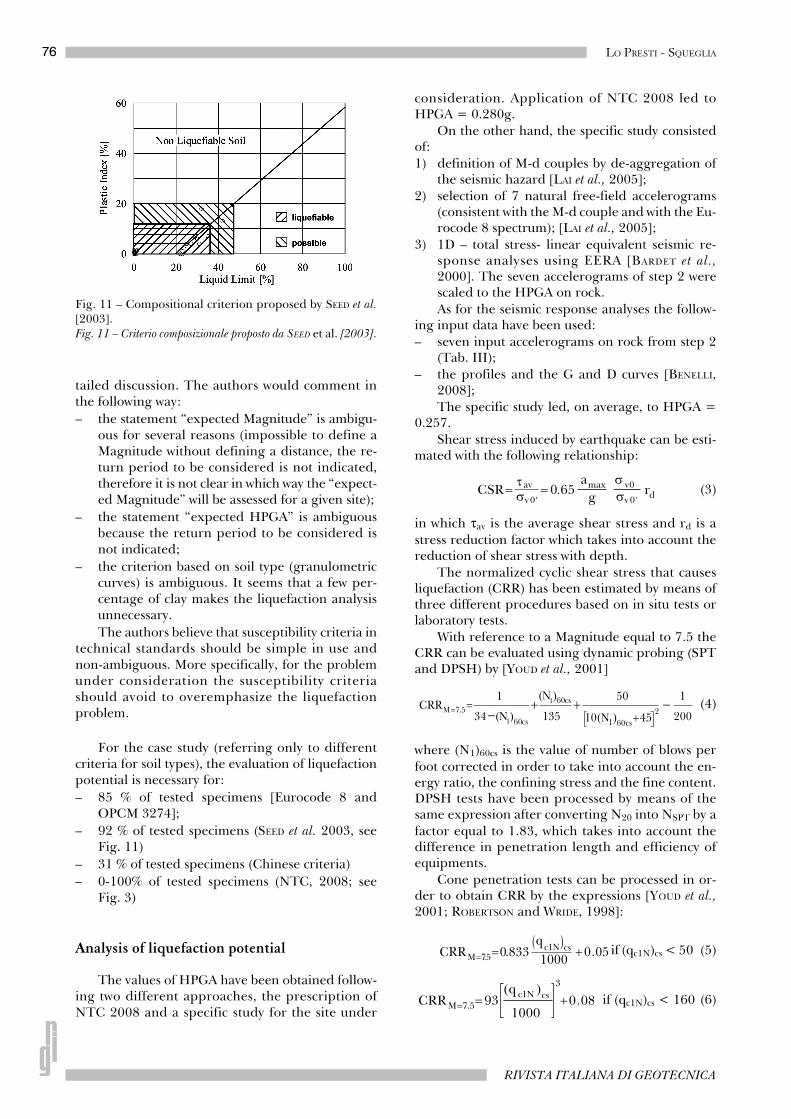
SEED et al. [2003] suggest a criterion based onplastic properties of soils, as reported in Figure 11with reference to case studied.
NTC [2008] states that liquefaction potentialanalysis can be omitted if at least one of the follow-ing conditions is satisfied:1. Expected magnitude M < 5;2. Expected HPGA < 0,1g3. Groundwater table depth > 15 m4. Clean sand with (N1)60 > 30 or qc1N > 180 (see
Eq. 7)5. Granulometric curves falling outside fixed
zones (see Fig. 3 for well graded sands)As for NTC [2008], the whole set of criteria has
been reported and not only those referring to soiltype, because NTC [2008] is the present technicalstandard in Italy. Therefore it merits a more de-
Fig. 10 – Results of UCTX in terms of CSR.Fig. 10 – Risultati delle prove triassiali cicliche in termini di CSR.
76 LO PRESTI - SQUEGLIA
RIVISTA ITALIANA DI GEOTECNICA
tailed discussion. The authors would comment inthe following way:– the statement “expected Magnitude” is ambigu-
ous for several reasons (impossible to define aMagnitude without defining a distance, the re-turn period to be considered is not indicated,therefore it is not clear in which way the “expect-ed Magnitude” will be assessed for a given site);
– the statement “expected HPGA” is ambiguousbecause the return period to be considered isnot indicated;
– the criterion based on soil type (granulometriccurves) is ambiguous. It seems that a few per-centage of clay makes the liquefaction analysisunnecessary.The authors believe that susceptibility criteria in
technical standards should be simple in use andnon-ambiguous. More specifically, for the problemunder consideration the susceptibility criteriashould avoid to overemphasize the liquefactionproblem.
For the case study (referring only to differentcriteria for soil types), the evaluation of liquefactionpotential is necessary for:– 85 % of tested specimens [Eurocode 8 and
OPCM 3274];– 92 % of tested specimens (SEED et al. 2003, see
Fig. 11)– 31 % of tested specimens (Chinese criteria)– 0-100% of tested specimens (NTC, 2008; see
Fig. 3)
Analysis of liquefaction potential
The values of HPGA have been obtained follow-ing two different approaches, the prescription ofNTC 2008 and a specific study for the site under
consideration. Application of NTC 2008 led toHPGA = 0.280g.
On the other hand, the specific study consistedof:1) definition of M-d couples by de-aggregation of
the seismic hazard [LAI et al., 2005];2) selection of 7 natural free-field accelerograms
(consistent with the M-d couple and with the Eu-rocode 8 spectrum); [LAI et al., 2005];
3) 1D – total stress- linear equivalent seismic re-sponse analyses using EERA [BARDET et al.,2000]. The seven accelerograms of step 2 werescaled to the HPGA on rock.As for the seismic response analyses the follow-
ing input data have been used:– seven input accelerograms on rock from step 2
(Tab. III);– the profiles and the G and D curves [BENELLI,
2008];The specific study led, on average, to HPGA =
0.257.Shear stress induced by earthquake can be esti-
mated with the following relationship:
(3)
in which τav is the average shear stress and rd is astress reduction factor which takes into account thereduction of shear stress with depth.
The normalized cyclic shear stress that causesliquefaction (CRR) has been estimated by means ofthree different procedures based on in situ tests orlaboratory tests.
With reference to a Magnitude equal to 7.5 theCRR can be evaluated using dynamic probing (SPTand DPSH) by [YOUD et al., 2001]
(4)
where (N1)60cs is the value of number of blows perfoot corrected in order to take into account the en-ergy ratio, the confining stress and the fine content.DPSH tests have been processed by means of thesame expression after converting N20 into NSPT by afactor equal to 1.83, which takes into account thedifference in penetration length and efficiency ofequipments.
Cone penetration tests can be processed in or-der to obtain CRR by the expressions [YOUD et al.,2001; ROBERTSON and WRIDE, 1998]:
if (qc1N)cs < 50 (5)
if (qc1N)cs < 160 (6)
Fig. 11 – Compositional criterion proposed by SEED et al.[2003].Fig. 11 – Criterio composizionale proposto da SEED et al. [2003].
77LESSON LEARNED FROM LIQUEFACTION POTENTIAL ASSESSMENT OF SILTY SAND DEPOSITS IN A CASE STUDY IN ITALY
APRILE - GIUGNO 2011
where (qc1N)cs is the cone penetration resistance cor-rected in order to take into account both the confin-ing stress and the fine content.
To obtain (qc1N)cs the following procedure wasused [Youd et al., 2001]:
(7)
(8)
(9)
(10)
(11)
(12)
(13)
The above expressions use [kPa] for bothstresses and penetration resistance. The followingsteps are necessary:– assume n = 1.0 and compute Ic;– if Ic > 2.6 the soil is classified as clay and the
computation can terminate;– otherwise assume n = 0.5. If assuming n = 0.5,
Ic < 2.6, the soil is classified as cohesionless andit is necessary to evaluate the liquefaction poten-tial;
– if assuming n=0.5 Ic > 2.6, the soil contains nonplastic silt and computation has to be done withn = 0.7;It is worthwhile to stress that, according to the
suggested procedure [YOUD et al., 2001], the soilcould be classified as clay (Ic > 2.6, n = 1.0) whichcontrasts the laboratory soil classification. Followingthe laboratory classification, data have been proc-essed assuming n = 0.7.
Lastly, CRR can be obtained by means of labo-ratory tests. In particular eight undrained triaxialcyclic tests have been carried out on samples re-trieved at depth showing the lowest penetration re-sistance. Since a Magnitude equal to 5.8 corre-sponds to a number of equivalent uniform stress cy-cles equal to 4, the value of CRR deduced by labora-tory tests is 0.280 (Fig. 10).
Starting from the considerations reportedabove, an estimation of factor of safety against lique-faction has been computed by means of the follow-ing relation
(14)
where MSF = 102.24·M-2.56 [YOUD et al., 2001] whichtakes into account the differences in Magnitude. Thisfactor has not been applied at the case of CRR de-duced by laboratory tests. An alternative way is to de-termine CRRM=7.5, in corrispondence of 15 cycles(Fig. 10), then to apply MSF to take into account thedifference in Magnitude. This alternative way leadsto a value of CRRM=5.8 greater than that correspond-ing to 4 cycles, as a consequence it is less conservative.
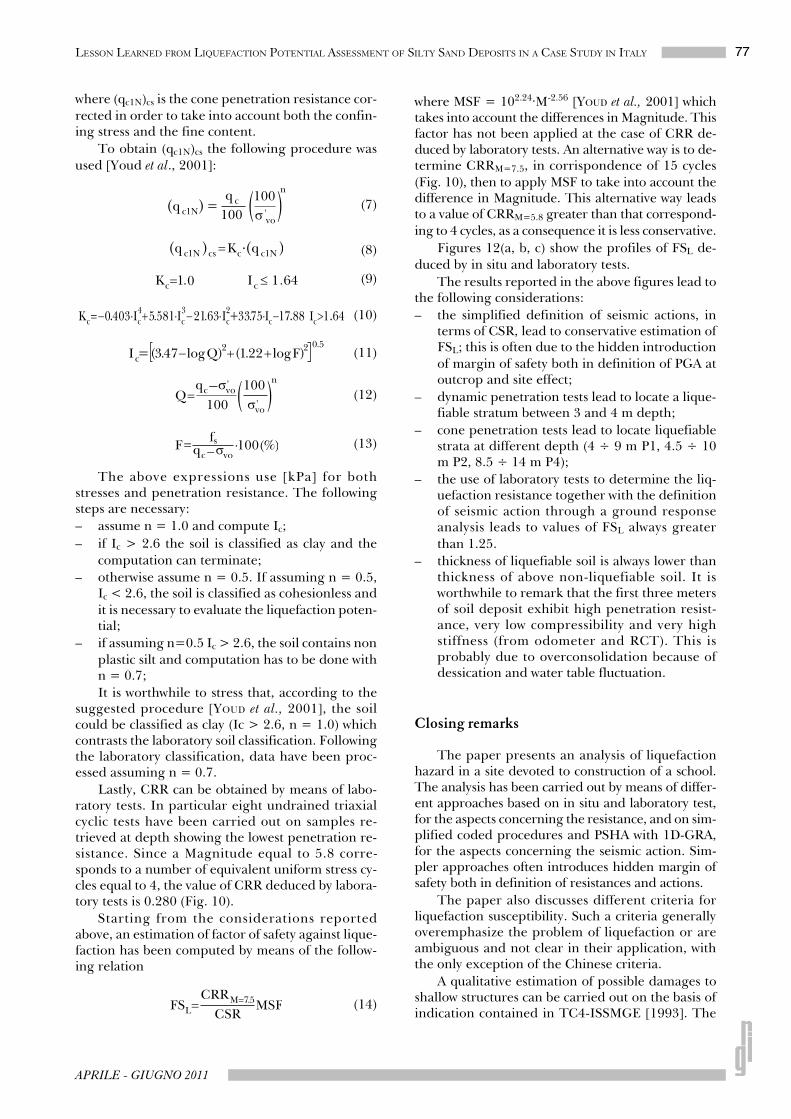
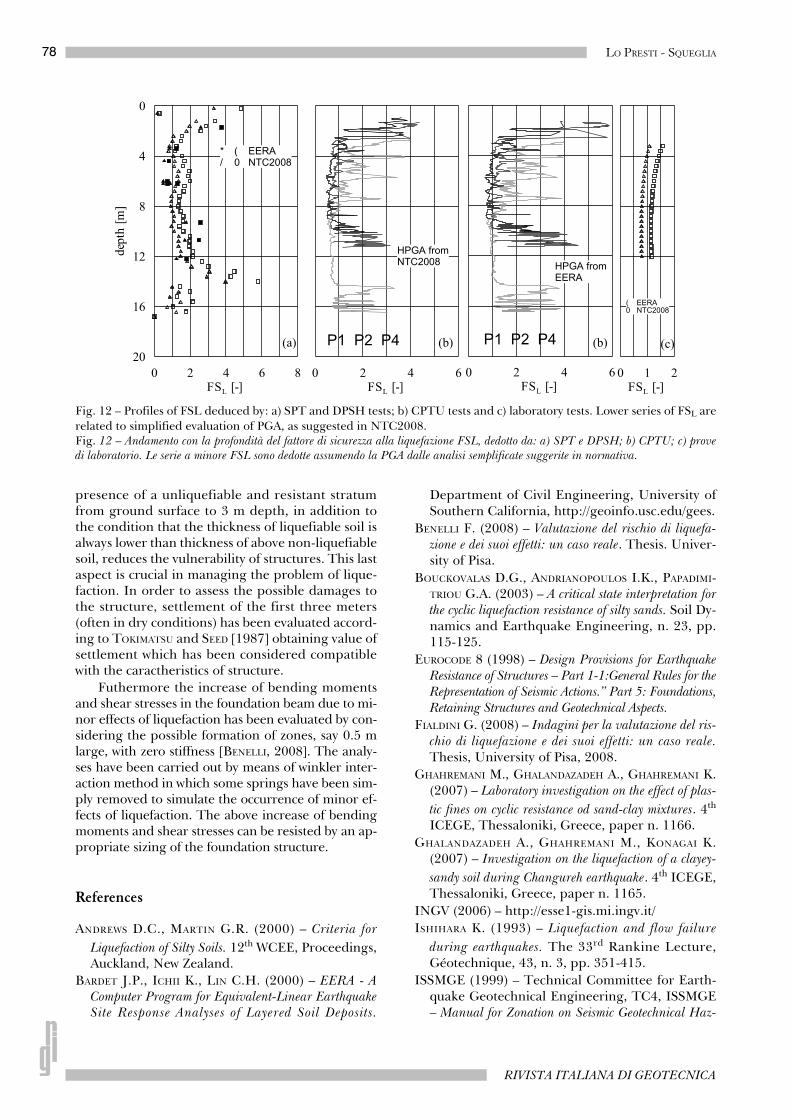
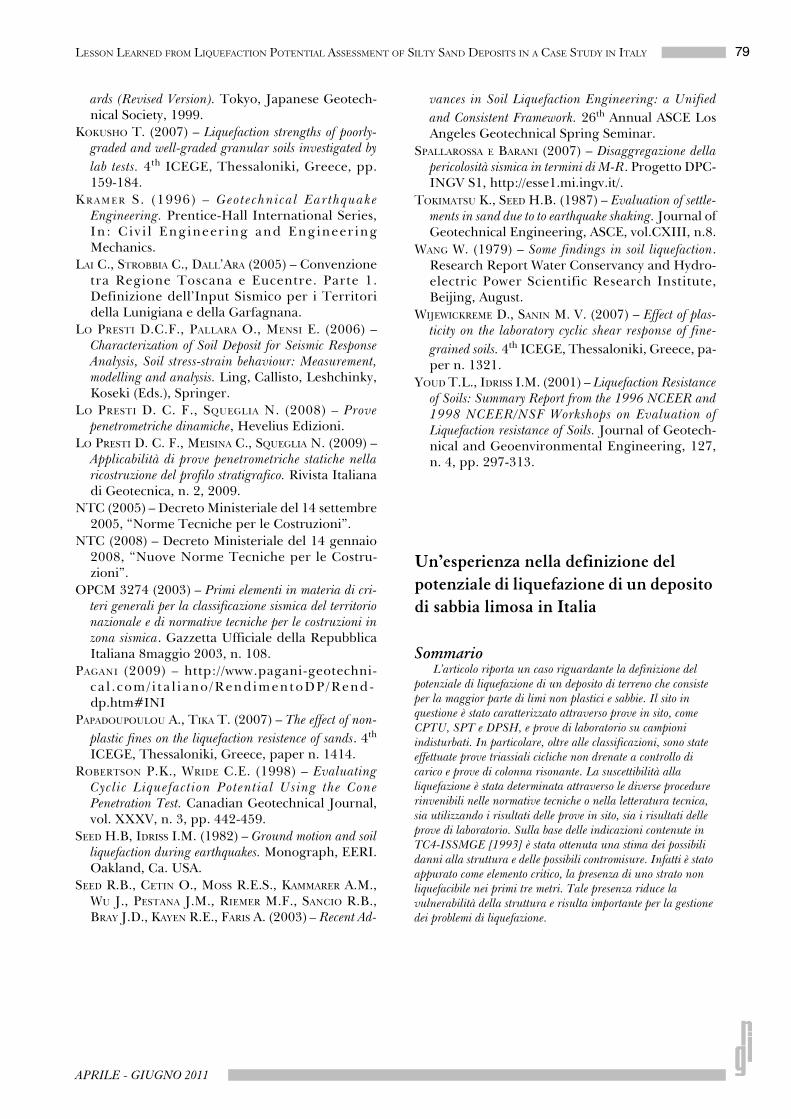
Figures 12(a, b, c) show the profiles of FSL de-duced by in situ and laboratory tests.
The results reported in the above figures lead tothe following considerations:– the simplified definition of seismic actions, in
terms of CSR, lead to conservative estimation ofFSL; this is often due to the hidden introductionof margin of safety both in definition of PGA atoutcrop and site effect;
– dynamic penetration tests lead to locate a lique-fiable stratum between 3 and 4 m depth;
– cone penetration tests lead to locate liquefiablestrata at different depth (4 ÷ 9 m P1, 4.5 ÷ 10m P2, 8.5 ÷ 14 m P4);
– the use of laboratory tests to determine the liq-uefaction resistance together with the definitionof seismic action through a ground responseanalysis leads to values of FSL always greaterthan 1.25.
– thickness of liquefiable soil is always lower thanthickness of above non-liquefiable soil. It isworthwhile to remark that the first three metersof soil deposit exhibit high penetration resist-ance, very low compressibility and very highstiffness (from odometer and RCT). This isprobably due to overconsolidation because ofdessication and water table fluctuation.
Closing remarks
The paper presents an analysis of liquefactionhazard in a site devoted to construction of a school.The analysis has been carried out by means of differ-ent approaches based on in situ and laboratory test,for the aspects concerning the resistance, and on sim-plified coded procedures and PSHA with 1D-GRA,for the aspects concerning the seismic action. Sim-pler approaches often introduces hidden margin ofsafety both in definition of resistances and actions.
The paper also discusses different criteria forliquefaction susceptibility. Such a criteria generallyoveremphasize the problem of liquefaction or areambiguous and not clear in their application, withthe only exception of the Chinese criteria.
A qualitative estimation of possible damages toshallow structures can be carried out on the basis ofindication contained in TC4-ISSMGE [1993]. The
78 LO PRESTI - SQUEGLIA
RIVISTA ITALIANA DI GEOTECNICA
presence of a unliquefiable and resistant stratumfrom ground surface to 3 m depth, in addition tothe condition that the thickness of liquefiable soil isalways lower than thickness of above non-liquefiablesoil, reduces the vulnerability of structures. This lastaspect is crucial in managing the problem of lique-faction. In order to assess the possible damages tothe structure, settlement of the first three meters(often in dry conditions) has been evaluated accord-ing to TOKIMATSU and SEED [1987] obtaining value ofsettlement which has been considered compatiblewith the caractheristics of structure.
Futhermore the increase of bending momentsand shear stresses in the foundation beam due to mi-nor effects of liquefaction has been evaluated by con-sidering the possible formation of zones, say 0.5 mlarge, with zero stiffness [BENELLI, 2008]. The analy-ses have been carried out by means of winkler inter-action method in which some springs have been sim-ply removed to simulate the occurrence of minor ef-fects of liquefaction. The above increase of bendingmoments and shear stresses can be resisted by an ap-propriate sizing of the foundation structure.
References
ANDREWS D.C., MARTIN G.R. (2000) – Criteria forLiquefaction of Silty Soils. 12th WCEE, Proceedings,Auckland, New Zealand.
BARDET J.P., ICHII K., LIN C.H. (2000) – EERA - AComputer Program for Equivalent-Linear EarthquakeSite Response Analyses of Layered Soil Deposits.
Department of Civil Engineering, University ofSouthern California, http://geoinfo.usc.edu/gees.
BENELLI F. (2008) – Valutazione del rischio di liquefa-zione e dei suoi effetti: un caso reale. Thesis. Univer-sity of Pisa.
BOUCKOVALAS D.G., ANDRIANOPOULOS I.K., PAPADIMI-TRIOU G.A. (2003) – A critical state interpretation forthe cyclic liquefaction resistance of silty sands. Soil Dy-namics and Earthquake Engineering, n. 23, pp.115-125.
EUROCODE 8 (1998) – Design Provisions for EarthquakeResistance of Structures – Part 1-1:General Rules for theRepresentation of Seismic Actions.” Part 5: Foundations,Retaining Structures and Geotechnical Aspects.
FIALDINI G. (2008) – Indagini per la valutazione del ris-chio di liquefazione e dei suoi effetti: un caso reale.Thesis, University of Pisa, 2008.
GHAHREMANI M., GHALANDAZADEH A., GHAHREMANI K.(2007) – Laboratory investigation on the effect of plas-tic fines on cyclic resistance od sand-clay mixtures. 4th
ICEGE, Thessaloniki, Greece, paper n. 1166.GHALANDAZADEH A., GHAHREMANI M., KONAGAI K.
(2007) – Investigation on the liquefaction of a clayey-sandy soil during Changureh earthquake. 4th ICEGE,Thessaloniki, Greece, paper n. 1165.
INGV (2006) – http://esse1-gis.mi.ingv.it/ISHIHARA K. (1993) – Liquefaction and flow failure
during earthquakes. The 33rd Rankine Lecture,Géotechnique, 43, n. 3, pp. 351-415.
ISSMGE (1999) – Technical Committee for Earth-quake Geotechnical Engineering, TC4, ISSMGE– Manual for Zonation on Seismic Geotechnical Haz-
Fig. 12 – Profiles of FSL deduced by: a) SPT and DPSH tests; b) CPTU tests and c) laboratory tests. Lower series of FSL arerelated to simplified evaluation of PGA, as suggested in NTC2008.Fig. 12 – Andamento con la profondità del fattore di sicurezza alla liquefazione FSL, dedotto da: a) SPT e DPSH; b) CPTU; c) provedi laboratorio. Le serie a minore FSL sono dedotte assumendo la PGA dalle analisi semplificate suggerite in normativa.
79LESSON LEARNED FROM LIQUEFACTION POTENTIAL ASSESSMENT OF SILTY SAND DEPOSITS IN A CASE STUDY IN ITALY
APRILE - GIUGNO 2011
ards (Revised Version). Tokyo, Japanese Geotech-nical Society, 1999.
KOKUSHO T. (2007) – Liquefaction strengths of poorly-graded and well-graded granular soils investigated bylab tests. 4th ICEGE, Thessaloniki, Greece, pp.159-184.
KR A M ER S. (1996) – Geotechnical EarthquakeEngineering. Prentice-Hall International Series,In : Civ i l Engineer ing and Engineer ingMechanics.
LAI C., STROBBIA C., DALL’ARA (2005) – Convenzionetra Regione Toscana e Eucentre. Parte 1.Definizione dell’Input Sismico per i Territoridella Lunigiana e della Garfagnana.
LO PRESTI D.C.F., PALLARA O., MENSI E. (2006) –Characterization of Soil Deposit for Seismic ResponseAnalysis, Soil stress-strain behaviour: Measurement,modelling and analysis. Ling, Callisto, Leshchinky,Koseki (Eds.), Springer.
LO PRESTI D. C. F., SQUEGLIA N. (2008) – Provepenetrometriche dinamiche, Hevelius Edizioni.
LO PRESTI D. C. F., MEISINA C., SQUEGLIA N. (2009) –Applicabilità di prove penetrometriche statiche nellaricostruzione del profilo stratigrafico. Rivista Italianadi Geotecnica, n. 2, 2009.
NTC (2005) – Decreto Ministeriale del 14 settembre2005, “Norme Tecniche per le Costruzioni”.
NTC (2008) – Decreto Ministeriale del 14 gennaio2008, “Nuove Norme Tecniche per le Costru-zioni”.
OPCM 3274 (2003) – Primi elementi in materia di cri-teri generali per la classificazione sismica del territorionazionale e di normative tecniche per le costruzioni inzona sismica. Gazzetta Ufficiale della RepubblicaItaliana 8maggio 2003, n. 108.
PAGANI (2009) – http://www.pagani-geotechni-ca l . com/ i t a l i ano /RendimentoDP/Rend-dp.htm#INI
PAPADOUPOULOU A., TIKA T. (2007) – The effect of non-plastic fines on the liquefaction resistence of sands. 4th
ICEGE, Thessaloniki, Greece, paper n. 1414.ROBERTSON P.K., WRIDE C.E. (1998) – Evaluating
Cyclic Liquefaction Potential Using the ConePenetration Test. Canadian Geotechnical Journal,vol. XXXV, n. 3, pp. 442-459.
SEED H.B, IDRISS I.M. (1982) – Ground motion and soilliquefaction during earthquakes. Monograph, EERI.Oakland, Ca. USA.
SEED R.B., CETIN O., MOSS R.E.S., KAMMARER A.M.,WU J., PESTANA J.M., RIEMER M.F., SANCIO R.B.,BRAY J.D., KAYEN R.E., FARIS A. (2003) – Recent Ad-
vances in Soil Liquefaction Engineering: a Unifiedand Consistent Framework. 26th Annual ASCE LosAngeles Geotechnical Spring Seminar.
SPALLAROSSA E BARANI (2007) – Disaggregazione dellapericolosità sismica in termini di M-R. Progetto DPC-INGV S1, http://esse1.mi.ingv.it/.
TOKIMATSU K., SEED H.B. (1987) – Evaluation of settle-ments in sand due to to earthquake shaking. Journal ofGeotechnical Engineering, ASCE, vol.CXIII, n.8.
WANG W. (1979) – Some findings in soil liquefaction.Research Report Water Conservancy and Hydro-electric Power Scientific Research Institute,Beijing, August.
WIJEWICKREME D., SANIN M. V. (2007) – Effect of plas-ticity on the laboratory cyclic shear response of fine-grained soils. 4th ICEGE, Thessaloniki, Greece, pa-per n. 1321.
YOUD T.L., IDRISS I.M. (2001) – Liquefaction Resistanceof Soils: Summary Report from the 1996 NCEER and1998 NCEER/NSF Workshops on Evaluation ofLiquefaction resistance of Soils. Journal of Geotech-nical and Geoenvironmental Engineering, 127,n. 4, pp. 297-313.
Un’esperienza nella definizione del potenziale di liquefazione di un deposito di sabbia limosa in Italia
SommarioL’articolo riporta un caso riguardante la definizione del
potenziale di liquefazione di un deposito di terreno che consiste per la maggior parte di limi non plastici e sabbie. Il sito in questione è stato caratterizzato attraverso prove in sito, come CPTU, SPT e DPSH, e prove di laboratorio su campioni indisturbati. In particolare, oltre alle classificazioni, sono state effettuate prove triassiali cicliche non drenate a controllo di carico e prove di colonna risonante. La suscettibilità alla liquefazione è stata determinata attraverso le diverse procedure rinvenibili nelle normative tecniche o nella letteratura tecnica, sia utilizzando i risultati delle prove in sito, sia i risultati delle prove di laboratorio. Sulla base delle indicazioni contenute in TC4-ISSMGE [1993] è stata ottenuta una stima dei possibili danni alla struttura e delle possibili contromisure. Infatti è stato appurato come elemento critico, la presenza di uno strato non liquefacibile nei primi tre metri. Tale presenza riduce la vulnerabilità della struttura e risulta importante per la gestione dei problemi di liquefazione.
Recommended