Wood is the most environmentally sound material on earth. It is renewable, highly versatile, grown with relatively little eff ort, carbon friendly and it’s produced and stored as forests that provide clean air, water, wildlife habitat, biodiversity, recreation and beautiful vistas.
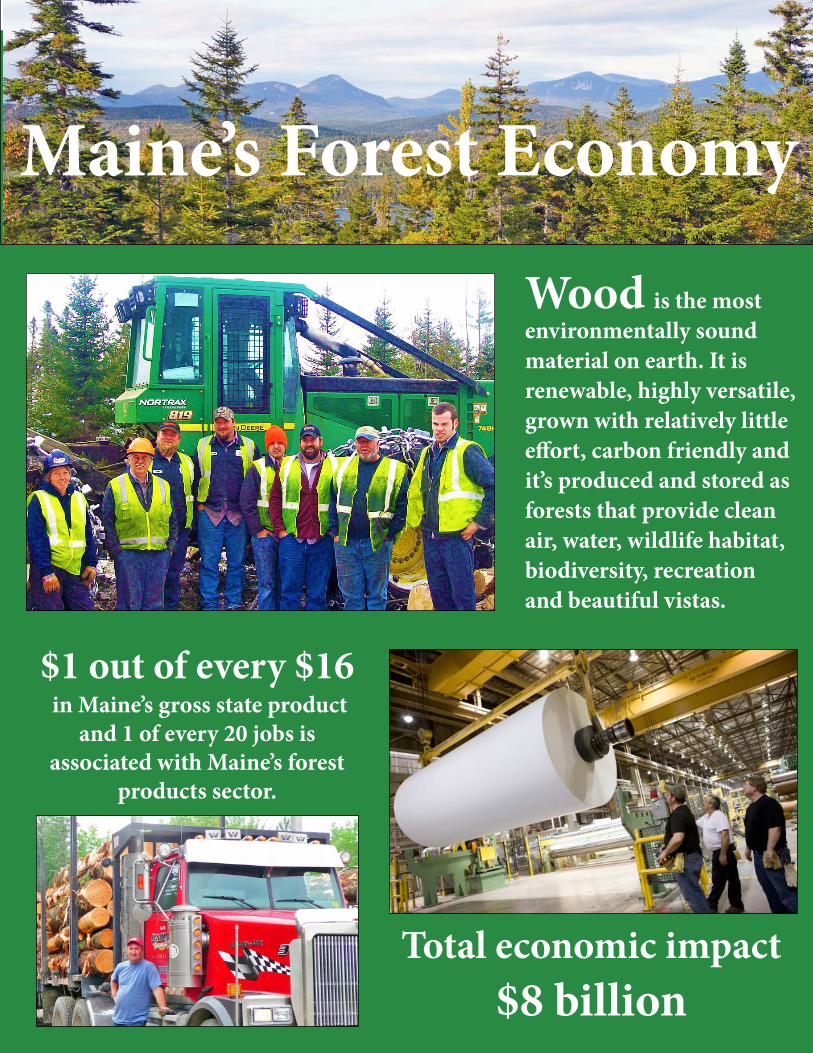
$1 out of every $16 in Maine’s gross state product
and 1 of every 20 jobs is associated with Maine’s forest
products sector.
Maine’s Forest Economy
Total economic impact$8 billion
Th is report was produced bythe Maine Forest Products Council
535 Civic Center DriveAugusta ME 04330
207-622-9288www.maineforest.org
Cover photos courtesy of Keeping Maine’s Forests, Comstock Logging, Plum Creek Timber and Verso Paper.
Sources of data on cover: Economic Contributions of Maine’s Forest Products Sector 2013, Dr. Todd Gabe, University of Maine School of Economics, and Dr. Robert Wagner, Henry W. Saunders Distinguished Professor in Forestry and director, Center for Research
on Sustainable Forests (CRSF) and Cooperative Forestry Research Unit (CFRU).
Special thanks to Ken Laustsen, MFS biometrician, who spent many hours collecting data and checking facts and fi gures, to the Maine Department of Labor, and to Sappi
Fine Paper North America, for donating certifi ed SFI paper.
Page 1
Table of ContentsMaine forest industry at a glance ............................................................ 2Why Maine is a great place for a forest industry .................................... 3Th is is not your father’s forest products industry .................................. 4
Table 1. Estimated annual statewide economic contribution Table 2. Industries impacted by Maine’s forest products sectorTable 3. Maine forest products sector direct and indirect employment impact by county
Jobs decline, but productivity and safety improve ................................. 9Fewer loggers can produce far more wood ........................................... 11Paper industry productivity rises dramatically .................................... 13Output per worker increasing at sawmills ........................................... 14Maine has a resilient and healthy forest ............................................... 15Tree Growth program preserves Maine’s forests...................................17Despite changing land owners, working forest thrives ........................ 18Logging injuries and workers comp rates drop sharply ....................... 19Don’t forget trucking! ........................................................................... 21Game changers ...................................................................................... 22
1. Th e King’s Broad Arrow2. Lumber capital of the world3. Using wood for pulp sparks Maine paper industry4. End of log drives5. Spruce budworm6. Forest Practices Act and clearcutting referendums7. Energy crisis sparks biomass boom8. Forest certifi cation: 9.4 million acres9. Conservation easements 10. Working forests provide habitat for Maine’s wildlife
Good reasons for optimism about our forest economy........................ 25
Page 2
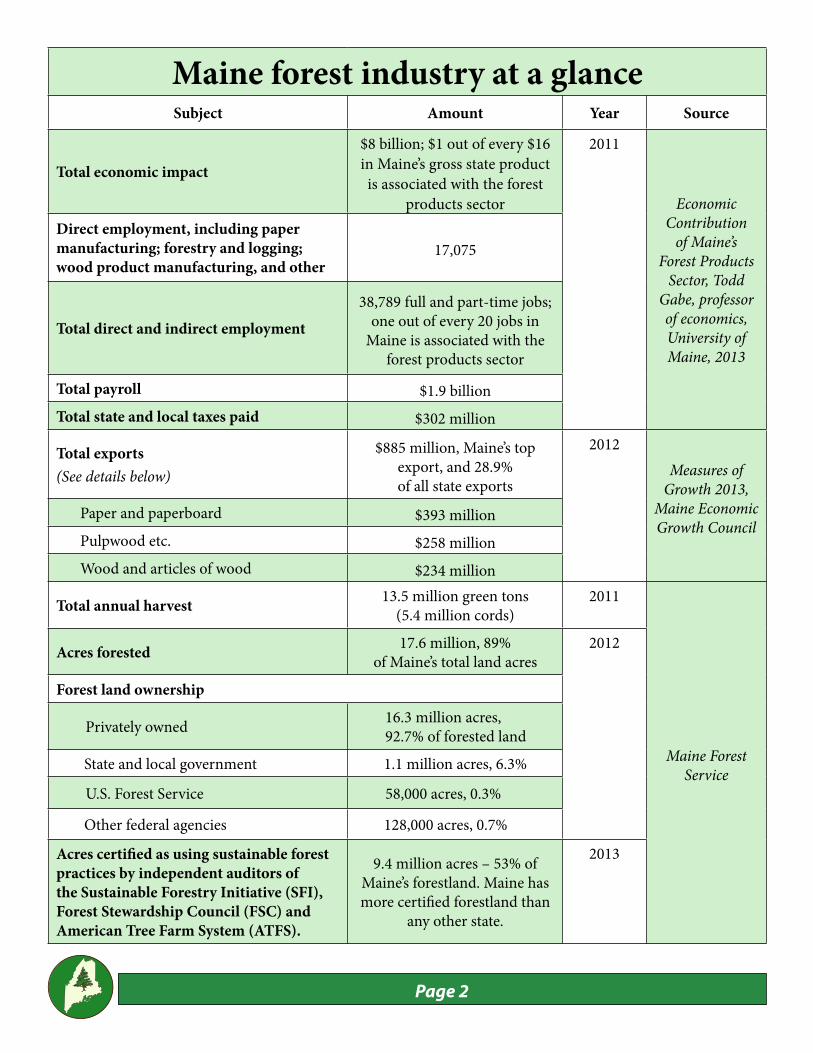
Maine forest industry at a glanceSubject Amount Year Source
Total economic impact
$8 billion; $1 out of every $16 in Maine’s gross state product is associated with the forest
products sector
2011
Economic Contribution
of Maine’s Forest Products
Sector, Todd Gabe, professor of economics, University of Maine, 2013
Direct employment, including paper manufacturing; forestry and logging; wood product manufacturing, and other
17,075
Total direct and indirect employment38,789 full and part-time jobs;
one out of every 20 jobs in Maine is associated with the
forest products sector
Total payroll $1.9 billionTotal state and local taxes paid $302 million
Total exports(See details below)
$885 million, Maine’s top export, and 28.9% of all state exports
2012Measures of
Growth 2013, Maine Economic Growth Council
Paper and paperboard $393 millionPulpwood etc. $258 millionWood and articles of wood $234 million
Total annual harvest 13.5 million green tons (5.4 million cords)
2011
Maine Forest Service
Acres forested 17.6 million, 89% of Maine’s total land acres
2012
Forest land ownership
Privately owned 16.3 million acres,92.7% of forested land
State and local government 1.1 million acres, 6.3%
U.S. Forest Service 58,000 acres, 0.3%
Other federal agencies 128,000 acres, 0.7%
Acres certifi ed as using sustainable forest practices by independent auditors of the Sustainable Forestry Initiative (SFI), Forest Stewardship Council (FSC) and American Tree Farm System (ATFS).
9.4 million acres – 53% of Maine’s forestland. Maine has more certifi ed forestland than
any other state.
2013
Page 3
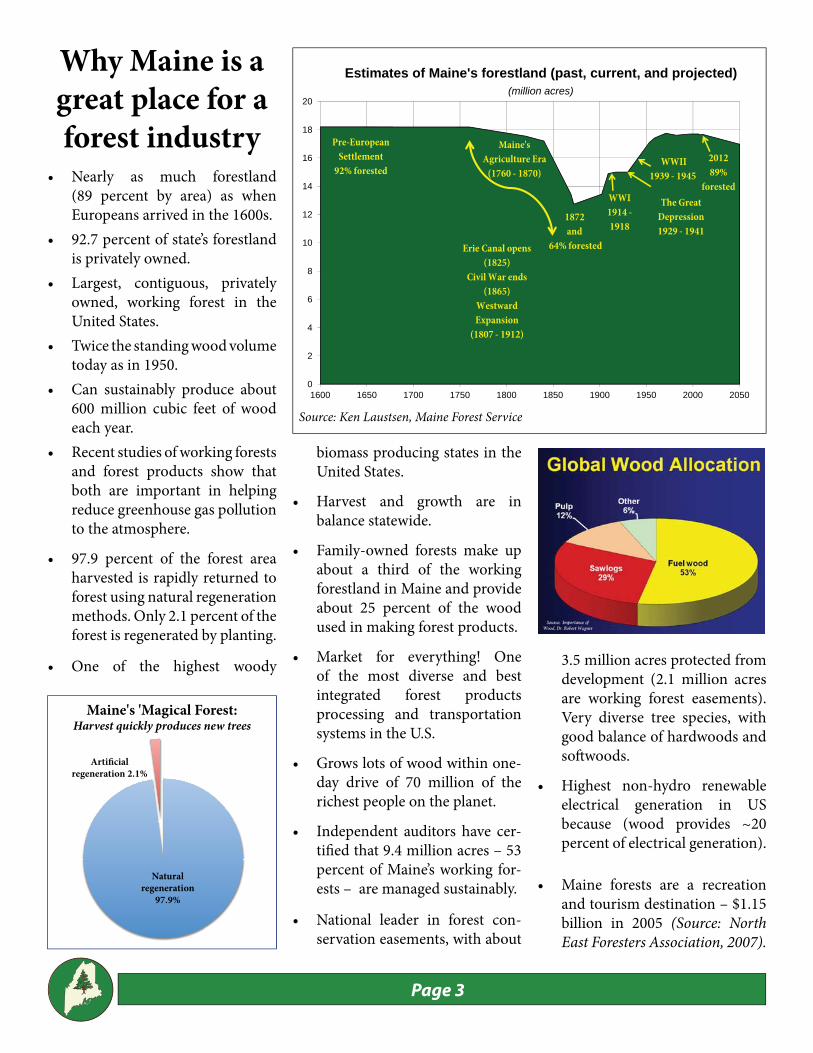
• Nearly as much forestland (89 percent by area) as when Europeans arrived in the 1600s.
• 92.7 percent of state’s forestland is privately owned.
• Largest, contiguous, privately owned, working forest in the United States.
• Twice the standing wood volume today as in 1950.
• Can sustainably produce about 600 million cubic feet of wood each year.
• Recent studies of working forests and forest products show that both are important in helping reduce greenhouse gas pollution to the atmosphere.
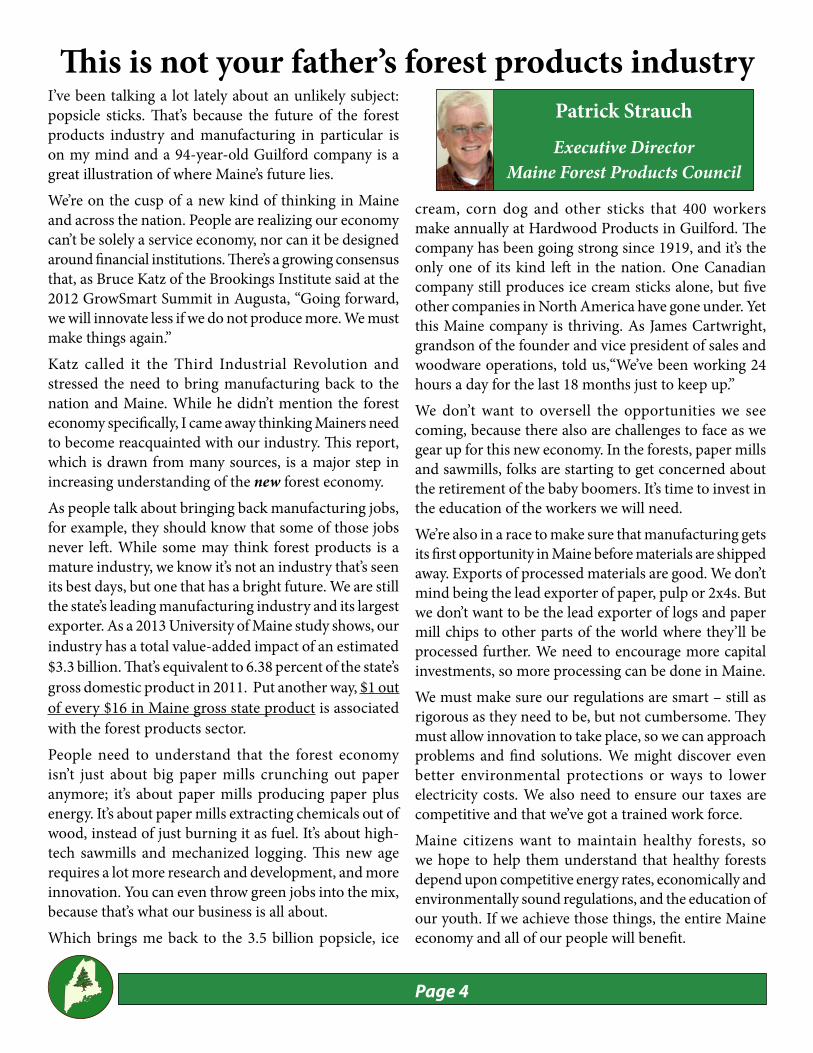
• 97.9 percent of the forest area harvested is rapidly returned to forest using natural regeneration methods. Only 2.1 percent of the forest is regenerated by planting.
• One of the highest woody
biomass producing states in the United States.
• Harvest and growth are in balance statewide.
• Family-owned forests make up about a third of the working forestland in Maine and provide about 25 percent of the wood used in making forest products.
• Market for everything! One of the most diverse and best integrated forest products processing and transportation systems in the U.S.
• Grows lots of wood within one-day drive of 70 million of the richest people on the planet.
• Independent auditors have cer-tifi ed that 9.4 million acres – 53 percent of Maine’s working for-ests – are managed sustainably.
• National leader in forest con-servation easements, with about
3.5 million acres protected from development (2.1 million acres are working forest easements). Very diverse tree species, with good balance of hardwoods and soft woods.
• Highest non-hydro renewable electrical generation in US because (wood provides ~20 percent of electrical generation).
• Maine forests are a recreation and tourism destination – $1.15 billion in 2005 (Source: North East Foresters Association, 2007).
8
10
12
14
16
18
20
Estimates of Maine's forestland (past, current, and projected)(million acres)
1872 and
64% forested
Pre-European Settlement
92% forested
Maine'sAgriculture Era
(1760 - 1870)
Erie Canal opens (1825)
Ci il W d
The Great Depression1929 - 1941
WWI1914 -1918
WWII 1939 - 1945
201289%
forested
0
2
4
6
8
1600 1650 1700 1750 1800 1850 1900 1950 2000 2050
Civil War ends (1865)
Westward Expansion
(1807 - 1912)
Why Maine is a great place for a forest industry
Source: Ken Laustsen, Maine Forest Service
Natural regeneration
97.9%
Artificial regeneration 2.1%
Maine's 'Magical Forest: Harvest quickly produces new trees
Page 4
I’ve been talking a lot lately about an unlikely subject: popsicle sticks. Th at’s because the future of the forest products industry and manufacturing in particular is on my mind and a 94-year-old Guilford company is a great illustration of where Maine’s future lies. We’re on the cusp of a new kind of thinking in Maine and across the nation. People are realizing our economy can’t be solely a service economy, nor can it be designed around fi nancial institutions. Th ere’s a growing consensus that, as Bruce Katz of the Brookings Institute said at the 2012 GrowSmart Summit in Augusta, “Going forward, we will innovate less if we do not produce more. We must make things again.”Katz called it the Third Industrial Revolution and stressed the need to bring manufacturing back to the nation and Maine. While he didn’t mention the forest economy specifi cally, I came away thinking Mainers need to become reacquainted with our industry. Th is report, which is drawn from many sources, is a major step in increasing understanding of the new forest economy. As people talk about bringing back manufacturing jobs, for example, they should know that some of those jobs never left . While some may think forest products is a mature industry, we know it’s not an industry that’s seen its best days, but one that has a bright future. We are still the state’s leading manufacturing industry and its largest exporter. As a 2013 University of Maine study shows, our industry has a total value-added impact of an estimated $3.3 billion. Th at’s equivalent to 6.38 percent of the state’s gross domestic product in 2011. Put another way, $1 out of every $16 in Maine gross state product is associated with the forest products sector.People need to understand that the forest economy isn’t just about big paper mills crunching out paper anymore; it’s about paper mills producing paper plus energy. It’s about paper mills extracting chemicals out of wood, instead of just burning it as fuel. It’s about high-tech sawmills and mechanized logging. Th is new age requires a lot more research and development, and more innovation. You can even throw green jobs into the mix, because that’s what our business is all about.Which brings me back to the 3.5 billion popsicle, ice
cream, corn dog and other sticks that 400 workers make annually at Hardwood Products in Guilford. Th e company has been going strong since 1919, and it’s the only one of its kind left in the nation. One Canadian company still produces ice cream sticks alone, but fi ve other companies in North America have gone under. Yet this Maine company is thriving. As James Cartwright, grandson of the founder and vice president of sales and woodware operations, told us,“We’ve been working 24 hours a day for the last 18 months just to keep up.” We don’t want to oversell the opportunities we see coming, because there also are challenges to face as we gear up for this new economy. In the forests, paper mills and sawmills, folks are starting to get concerned about the retirement of the baby boomers. It’s time to invest in the education of the workers we will need. We’re also in a race to make sure that manufacturing gets its fi rst opportunity in Maine before materials are shipped away. Exports of processed materials are good. We don’t mind being the lead exporter of paper, pulp or 2x4s. But we don’t want to be the lead exporter of logs and paper mill chips to other parts of the world where they’ll be processed further. We need to encourage more capital investments, so more processing can be done in Maine. We must make sure our regulations are smart – still as rigorous as they need to be, but not cumbersome. Th ey must allow innovation to take place, so we can approach problems and fi nd solutions. We might discover even better environmental protections or ways to lower electricity costs. We also need to ensure our taxes are competitive and that we’ve got a trained work force.Maine citizens want to maintain healthy forests, so we hope to help them understand that healthy forests depend upon competitive energy rates, economically and environmentally sound regulations, and the education of our youth. If we achieve those things, the entire Maine economy and all of our people will benefi t.
Patrick StrauchExecutive Director
Maine Forest Products Council
Th is is not your father’s forest products industry
Page 5
Economic contributions of Maine’s forest products sector
By Todd GabeProfessor of Economics,University of Maine
SUMMARY OF MAIN FINDINGS 1
• Th e forest products sector in Maine includes businesses, organizations and individuals involved in activities such as (but not limited to) logging and forestry, paper and related product manufacturing, sawmills and wood product manufacturing, wood furniture manufacturing, wood biomass power generation, maple syrup production, and activities of the Maine Forest Service.2
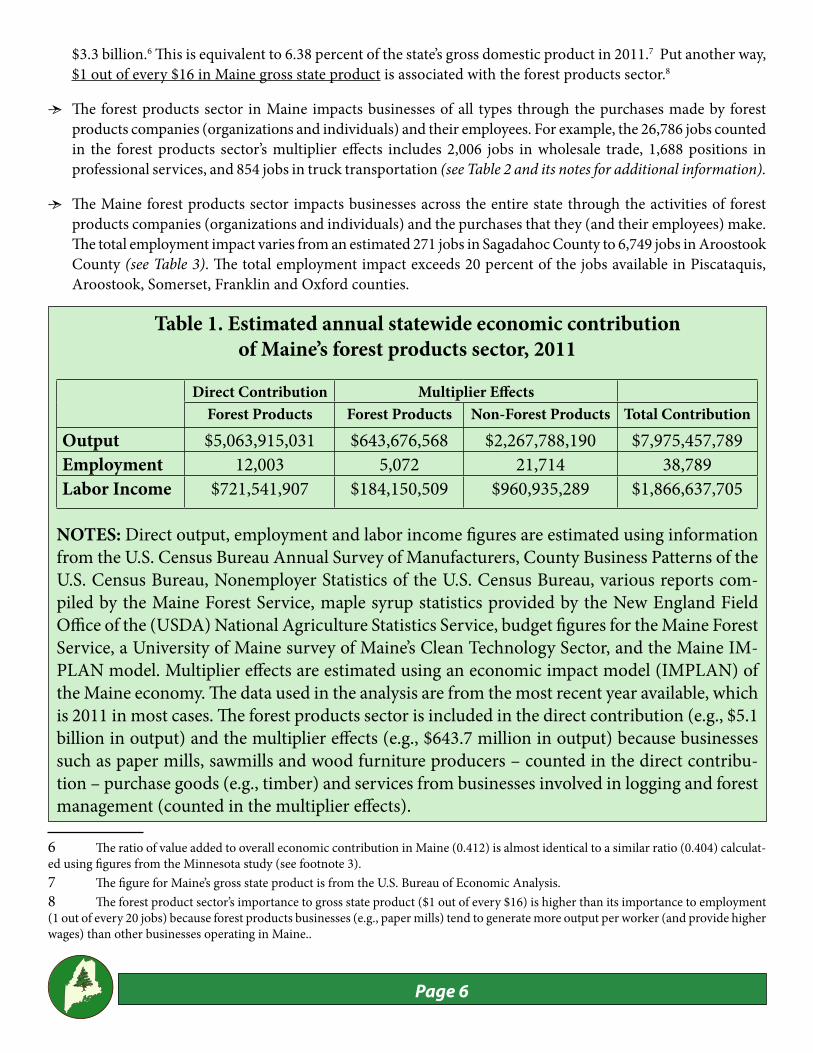
• Th e Maine forest products sector has a total annual (2011) statewide economic contribution, including multiplier eff ects, of an estimated $8.0 billion in output, 38,789 full and part-time jobs, and $1.9 billion in labor income.3 In the economic impact results shown in Table 1, the forest products sector is included in the direct contribution (e.g., $5.1 billion in output) and the multiplier eff ects (e.g., $643.7 million in output). Th is is because businesses such as paper mills, sawmills and wood furniture producers – counted in the direct contribution – purchase goods (e.g., timber) and services from businesses involved in logging and forest management (counted in the multiplier eff ects).
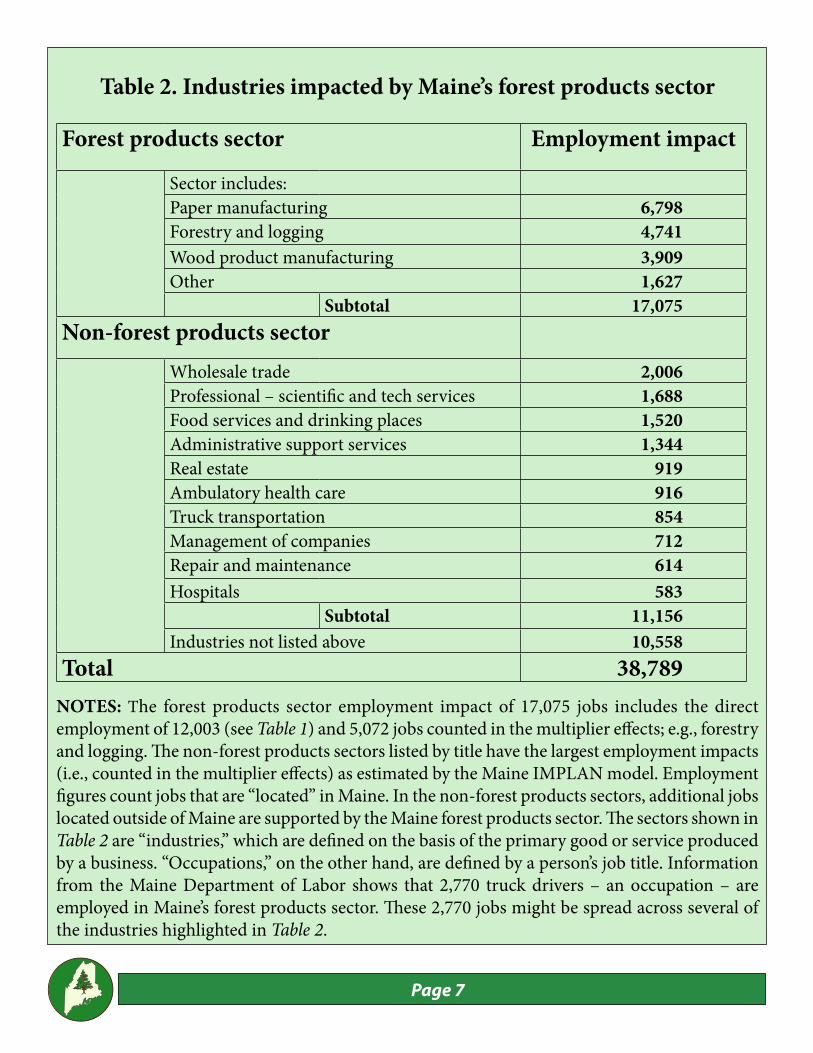
• Paper manufacturing is the largest segment of Maine’s forest products sector. Of the forest products sector’s direct contribution of $5.1 billion (shown in Table 1), paper manufacturing accounts for about $4.0 billion. Paper manufacturing also accounts for the largest number of jobs in Maine’s forest products sector (see Table 2).
• Th e total employment impact of 38,789 jobs is equivalent to 4.85 percent of the jobs in Maine.4 Put another way, roughly 1 out of every 20 jobs in Maine is associated with the forest products sector.
• Th e total economic contribution of Maine’s forest products sector is associated with an estimated (by the Maine IMPLAN model) fi scal impact of $302.2 million in state and local taxes.5
• Maine’s forest products sector has a total, including multiplier eff ects, value-added impact of an estimated
1 Th is analysis was requested by the Maine Forest Products Council.2 Industrial categories (NAICS codes) counted in the forest products sector include forestry and logging (NAICS 113), support activities for forestry (NAICS 1153), other electric power generation (NAICS 221119), wood product manufacturing (NAICS 321), paper manufacturing (NAICS 322), sawmill and woodworking machinery manufacturing (NAICS 33321), and subsectors of furniture and related products manufacturing (NAICS 337). Th e economic impact analysis accounts for other activities (e.g., maple syrup production, Maine Forest Service) that are not included in these industrial categories.3 Th e total output and employment impacts are estimated as 0.466 and 0.447 times the size of similar measures for Minnesota’s forest products sector. For more information about the Minnesota study, see: http://fi les.dnr.state.mn.us/forestry/um/economiccontributionMNforestproductsindustry2011.pdf.4 Th e 2011 total employment fi gure for Maine is from the U.S. Bureau of Economic Analysis.5 Th e state and local tax impact in Maine, as estimated by the IMPLAN model, is equivalent to 3.79 percent of the sector’s total (output) economic contribution. Th e percentage of the tax impact relative to the sector’s overall economic contribution is almost identical to the one (3.63 percent) calculated using fi gures from the Minnesota study, which also uses IMPLAN (see footnote 3).
Page 6
$3.3 billion.6 Th is is equivalent to 6.38 percent of the state’s gross domestic product in 2011.7 Put another way, $1 out of every $16 in Maine gross state product is associated with the forest products sector.8
• Th e forest products sector in Maine impacts businesses of all types through the purchases made by forest products companies (organizations and individuals) and their employees. For example, the 26,786 jobs counted in the forest products sector’s multiplier eff ects includes 2,006 jobs in wholesale trade, 1,688 positions in professional services, and 854 jobs in truck transportation (see Table 2 and its notes for additional information).
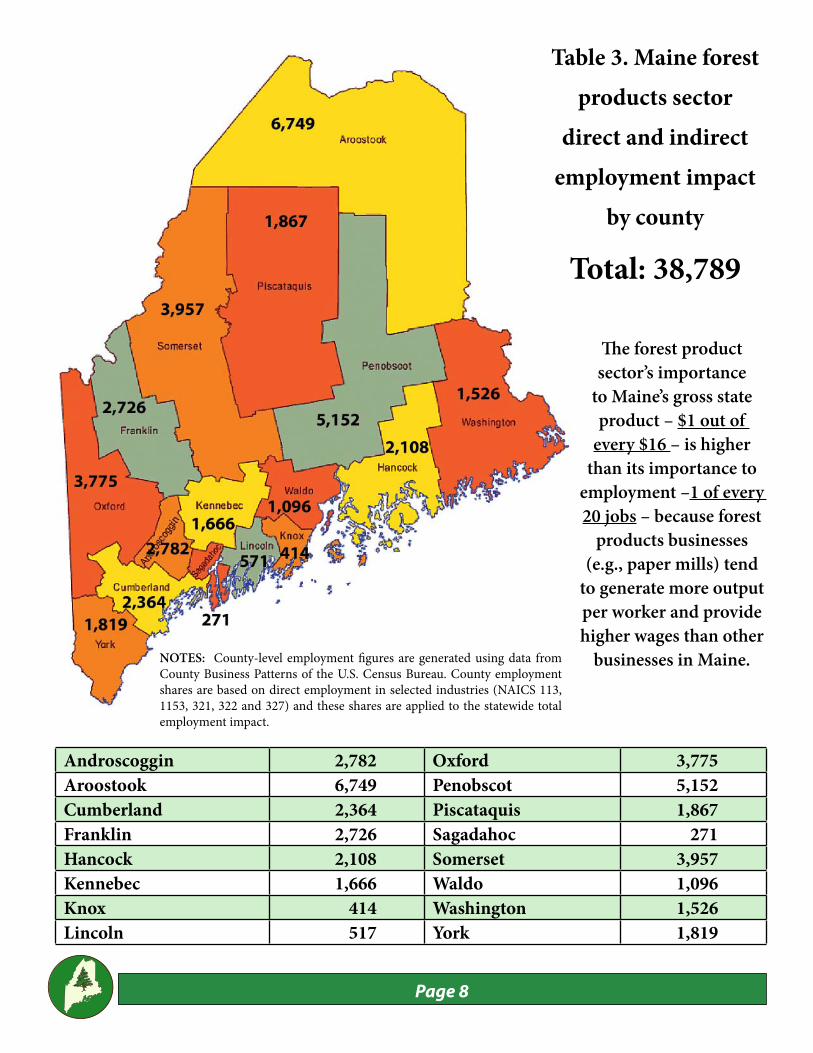
• Th e Maine forest products sector impacts businesses across the entire state through the activities of forest products companies (organizations and individuals) and the purchases that they (and their employees) make. Th e total employment impact varies from an estimated 271 jobs in Sagadahoc County to 6,749 jobs in Aroostook County (see Table 3). Th e total employment impact exceeds 20 percent of the jobs available in Piscataquis, Aroostook, Somerset, Franklin and Oxford counties.
6 Th e ratio of value added to overall economic contribution in Maine (0.412) is almost identical to a similar ratio (0.404) calculat-ed using fi gures from the Minnesota study (see footnote 3).7 Th e fi gure for Maine’s gross state product is from the U.S. Bureau of Economic Analysis.8 Th e forest product sector’s importance to gross state product ($1 out of every $16) is higher than its importance to employment (1 out of every 20 jobs) because forest products businesses (e.g., paper mills) tend to generate more output per worker (and provide higher wages) than other businesses operating in Maine..
Table 1. Estimated annual statewide economic contribution of Maine’s forest products sector, 2011
Direct Contribution Multiplier Eff ectsForest Products Forest Products Non-Forest Products Total Contribution
Output $5,063,915,031 $643,676,568 $2,267,788,190 $7,975,457,789Employment 12,003 5,072 21,714 38,789Labor Income $721,541,907 $184,150,509 $960,935,289 $1,866,637,705
NOTES: Direct output, employment and labor income fi gures are estimated using information from the U.S. Census Bureau Annual Survey of Manufacturers, County Business Patterns of the U.S. Census Bureau, Nonemployer Statistics of the U.S. Census Bureau, various reports com-piled by the Maine Forest Service, maple syrup statistics provided by the New England Field Offi ce of the (USDA) National Agriculture Statistics Service, budget fi gures for the Maine Forest Service, a University of Maine survey of Maine’s Clean Technology Sector, and the Maine IM-PLAN model. Multiplier eff ects are estimated using an economic impact model (IMPLAN) of the Maine economy. Th e data used in the analysis are from the most recent year available, which is 2011 in most cases. Th e forest products sector is included in the direct contribution (e.g., $5.1 billion in output) and the multiplier eff ects (e.g., $643.7 million in output) because businesses such as paper mills, sawmills and wood furniture producers – counted in the direct contribu-tion – purchase goods (e.g., timber) and services from businesses involved in logging and forest management (counted in the multiplier eff ects).
Page 7
Table 2. Industries impacted by Maine’s forest products sector
Forest products sector Employment impact
Sector includes:Paper manufacturing 6,798Forestry and logging 4,741Wood product manufacturing 3,909Other 1,627
Subtotal 17,075Non-forest products sector
Wholesale trade 2,006Professional – scientifi c and tech services 1,688Food services and drinking places 1,520Administrative support services 1,344Real estate 919Ambulatory health care 916Truck transportation 854Management of companies 712Repair and maintenance 614Hospitals 583
Subtotal 11,156Industries not listed above 10,558
Total 38,789NOTES: The forest products sector employment impact of 17,075 jobs includes the direct employment of 12,003 (see Table 1) and 5,072 jobs counted in the multiplier eff ects; e.g., forestry and logging. Th e non-forest products sectors listed by title have the largest employment impacts (i.e., counted in the multiplier eff ects) as estimated by the Maine IMPLAN model. Employment fi gures count jobs that are “located” in Maine. In the non-forest products sectors, additional jobs located outside of Maine are supported by the Maine forest products sector. Th e sectors shown in Table 2 are “industries,” which are defi ned on the basis of the primary good or service produced by a business. “Occupations,” on the other hand, are defi ned by a person’s job title. Information from the Maine Department of Labor shows that 2,770 truck drivers – an occupation – are employed in Maine’s forest products sector. Th ese 2,770 jobs might be spread across several of the industries highlighted in Table 2.
Page 8
Androscoggin 2,782 Oxford 3,775Aroostook 6,749 Penobscot 5,152Cumberland 2,364 Piscataquis 1,867Franklin 2,726 Sagadahoc 271Hancock 2,108 Somerset 3,957Kennebec 1,666 Waldo 1,096Knox 414 Washington 1,526Lincoln 517 York 1,819
Table 3. Maine forest products sector
direct and indirect employment impact
by county
Total: 38,789
NOTES: County-level employment fi gures are generated using data from County Business Patterns of the U.S. Census Bureau. County employment shares are based on direct employment in selected industries (NAICS 113, 1153, 321, 322 and 327) and these shares are applied to the statewide total employment impact.
Th e forest product sector’s importance
to Maine’s gross state product – $1 out of
every $16 – is higher than its importance to
employment –1 of every 20 jobs – because forest
products businesses (e.g., paper mills) tend
to generate more output per worker and provide higher wages than other
businesses in Maine.
Page 9
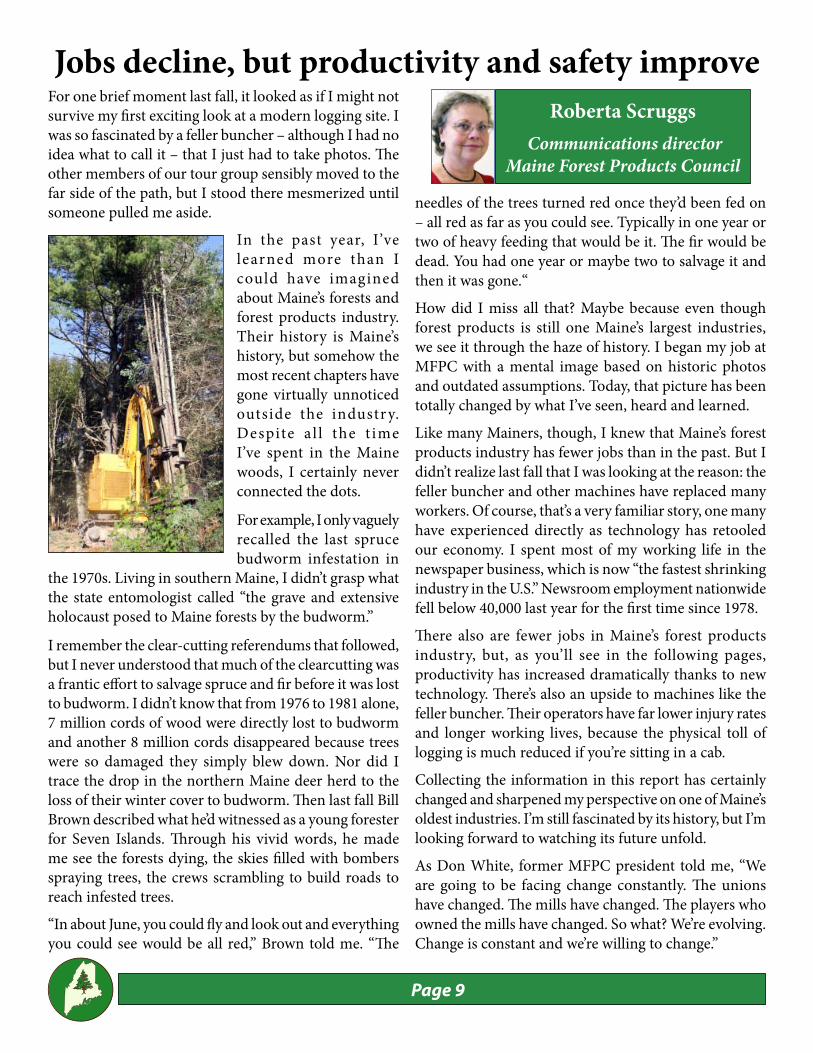
Roberta Scruggs Communications director
Maine Forest Products Council
For one brief moment last fall, it looked as if I might not survive my fi rst exciting look at a modern logging site. I was so fascinated by a feller buncher – although I had no idea what to call it – that I just had to take photos. Th e other members of our tour group sensibly moved to the far side of the path, but I stood there mesmerized until someone pulled me aside.
In the past year, I’ve learned more than I could have imagined about Maine’s forests and forest products industry. Their history is Maine’s history, but somehow the most recent chapters have gone virtually unnoticed outside the industry. Despite a l l the t ime I’ve spent in the Maine woods, I certainly never connected the dots.
For example, I only vaguely recalled the last spruce budworm infestation in
the 1970s. Living in southern Maine, I didn’t grasp what the state entomologist called “the grave and extensive holocaust posed to Maine forests by the budworm.”
I remember the clear-cutting referendums that followed, but I never understood that much of the clearcutting was a frantic eff ort to salvage spruce and fi r before it was lost to budworm. I didn’t know that from 1976 to 1981 alone, 7 million cords of wood were directly lost to budworm and another 8 million cords disappeared because trees were so damaged they simply blew down. Nor did I trace the drop in the northern Maine deer herd to the loss of their winter cover to budworm. Th en last fall Bill Brown described what he’d witnessed as a young forester for Seven Islands. Th rough his vivid words, he made me see the forests dying, the skies fi lled with bombers spraying trees, the crews scrambling to build roads to reach infested trees.
“In about June, you could fl y and look out and everything you could see would be all red,” Brown told me. “Th e
needles of the trees turned red once they’d been fed on – all red as far as you could see. Typically in one year or two of heavy feeding that would be it. Th e fi r would be dead. You had one year or maybe two to salvage it and then it was gone.“
How did I miss all that? Maybe because even though forest products is still one Maine’s largest industries, we see it through the haze of history. I began my job at MFPC with a mental image based on historic photos and outdated assumptions. Today, that picture has been totally changed by what I’ve seen, heard and learned.
Like many Mainers, though, I knew that Maine’s forest products industry has fewer jobs than in the past. But I didn’t realize last fall that I was looking at the reason: the feller buncher and other machines have replaced many workers. Of course, that’s a very familiar story, one many have experienced directly as technology has retooled our economy. I spent most of my working life in the newspaper business, which is now “the fastest shrinking industry in the U.S.” Newsroom employment nationwide fell below 40,000 last year for the fi rst time since 1978.
Th ere also are fewer jobs in Maine’s forest products industry, but, as you’ll see in the following pages, productivity has increased dramatically thanks to new technology. Th ere’s also an upside to machines like the feller buncher. Th eir operators have far lower injury rates and longer working lives, because the physical toll of logging is much reduced if you’re sitting in a cab.
Collecting the information in this report has certainly changed and sharpened my perspective on one of Maine’s oldest industries. I’m still fascinated by its history, but I’m looking forward to watching its future unfold.
As Don White, former MFPC president told me, “We are going to be facing change constantly. Th e unions have changed. Th e mills have changed. Th e players who owned the mills have changed. So what? We’re evolving. Change is constant and we’re willing to change.”
Jobs decline, but productivity and safety improve
Page 10
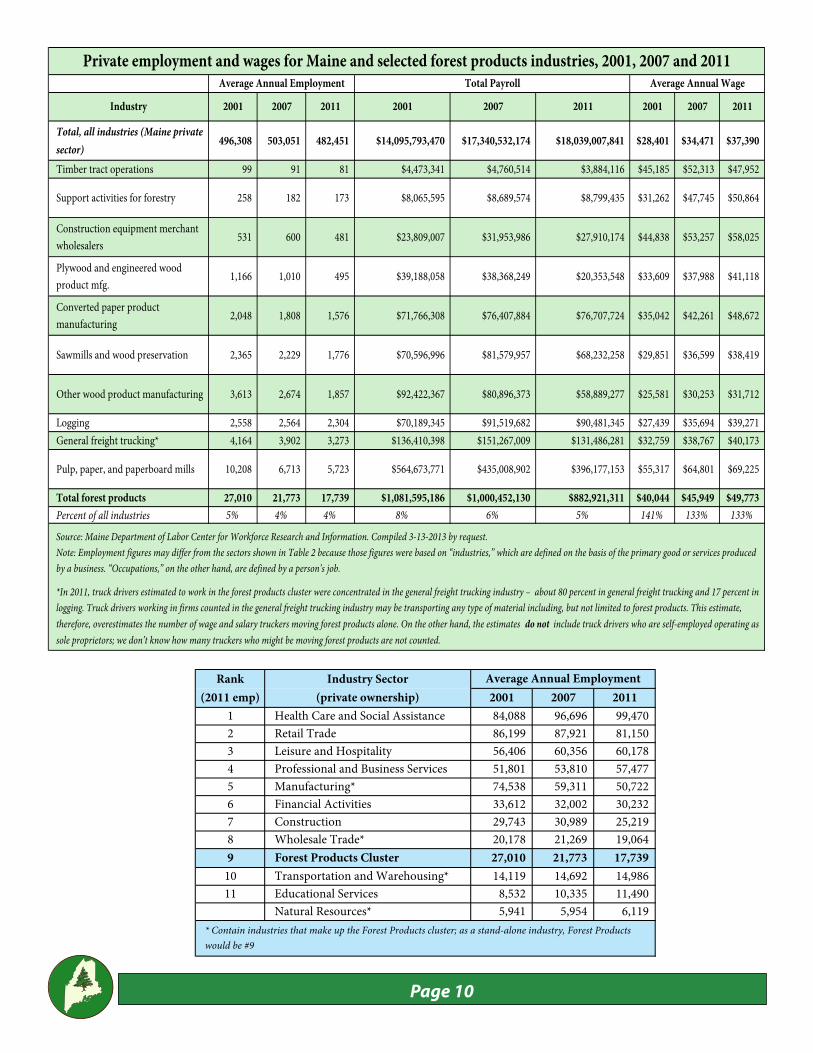
Total, all industries (Maine private sector)
496,308 503,051 482,451 $14,095,793,470 $17,340,532,174 $18,039,007,841 $28,401 $34,471 $37,390
Timber tract operations 99 91 81 $4,473,341 $4,760,514 $3,884,116 $45,185 $52,313 $47,952
Support activities for forestry 258 182 173 $8,065,595 $8,689,574 $8,799,435 $31,262 $47,745 $50,864
Construction equipment merchant wholesalers
531 600 481 $23,809,007 $31,953,986 $27,910,174 $44,838 $53,257 $58,025
Plywood and engineered wood product mfg.
1,166 1,010 495 $39,188,058 $38,368,249 $20,353,548 $33,609 $37,988 $41,118
Converted paper product manufacturing
2,048 1,808 1,576 $71,766,308 $76,407,884 $76,707,724 $35,042 $42,261 $48,672
Sawmills and wood preservation 2,365 2,229 1,776 $70,596,996 $81,579,957 $68,232,258 $29,851 $36,599 $38,419
Other wood product manufacturing 3,613 2,674 1,857 $92,422,367 $80,896,373 $58,889,277 $25,581 $30,253 $31,712
Logging 2,558 2,564 2,304 $70,189,345 $91,519,682 $90,481,345 $27,439 $35,694 $39,271General freight trucking* 4,164 3,902 3,273 $136,410,398 $151,267,009 $131,486,281 $32,759 $38,767 $40,173
Pulp, paper, and paperboard mills 10,208 6,713 5,723 $564,673,771 $435,008,902 $396,177,153 $55,317 $64,801 $69,225
Total forest products 27,010 21,773 17,739 $1,081,595,186 $1,000,452,130 $882,921,311 $40,044 $45,949 $49,773Percent of all industries 5% 4% 4% 8% 6% 5% 141% 133% 133%
*In 2011, truck drivers estimated to work in the forest products cluster were concentrated in the general freight trucking industry – about 80 percent in general freight trucking and 17 percent in logging. Truck drivers working in firms counted in the general freight trucking industry may be transporting any type of material including, but not limited to forest products. This estimate, therefore, overestimates the number of wage and salary truckers moving forest products alone. On the other hand, the estimates do not include truck drivers who are self-employed operating as sole proprietors; we don’t know how many truckers who might be moving forest products are not counted.
Source: Maine Department of Labor Center for Workforce Research and Information. Compiled 3-13-2013 by request.Note: Employment figures may differ from the sectors shown in Table 2 because those figures were based on “industries,” which are defined on the basis of the primary good or services produced by a business. “Occupations,” on the other hand, are defined by a person’s job.
Industry
Private employment and wages for Maine and selected forest products industries, 2001, 2007 and 2011Average Annual Employment Total Payroll Average Annual Wage
2001 2007 20112001 2007 2011 2001 2007 2011
2001 2007 20111 Health Care and Social Assistance 84,088 96,696 99,470 2 Retail Trade 86,199 87,921 81,150 3 Leisure and Hospitality 56,406 60,356 60,178 4 Professional and Business Services 51,801 53,810 57,477 5 Manufacturing* 74,538 59,311 50,722 6 Financial Activities 33,612 32,002 30,232 7 Construction 29,743 30,989 25,219 8 Wholesale Trade* 20,178 21,269 19,064 9 Forest Products Cluster 27,010 21,773 17,739
10 Transportation and Warehousing* 14,119 14,692 14,986 11 Educational Services 8,532 10,335 11,490
Natural Resources* 5,941 5,954 6,119
Industry Sector (private ownership)
Average Annual EmploymentRank(2011 emp)
* Contain industries that make up the Forest Products cluster; as a stand-alone industry, Forest Products would be #9
Page 11
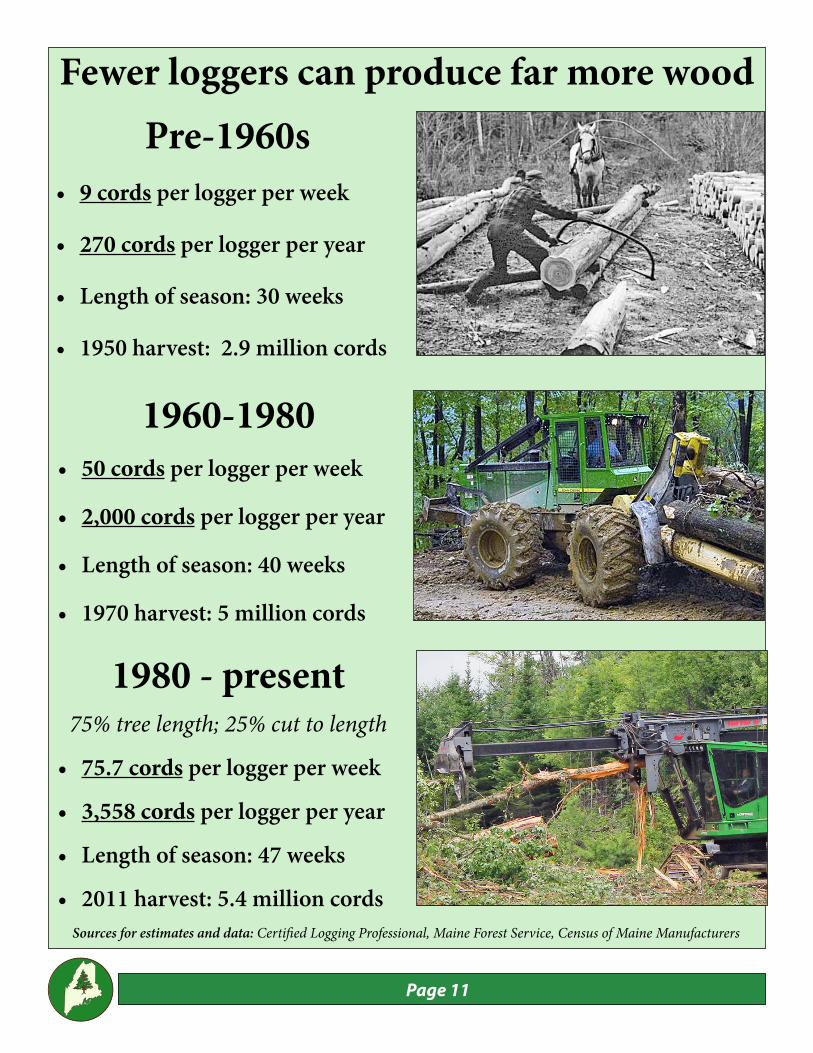
1980 - present75% tree length; 25% cut to length
• 75.7 cords per logger per week
• 3,558 cords per logger per year
• Length of season: 47 weeks
• 2011 harvest: 5.4 million cords
1960-1980• 50 cords per logger per week
• 2,000 cords per logger per year
• Length of season: 40 weeks
• 1970 harvest: 5 million cords
Pre-1960s• 9 cords per logger per week
• 270 cords per logger per year
• Length of season: 30 weeks
• 1950 harvest: 2.9 million cords
Sources for estimates and data: Certifi ed Logging Professional, Maine Forest Service, Census of Maine Manufacturers
Fewer loggers can produce far more wood
Page 12
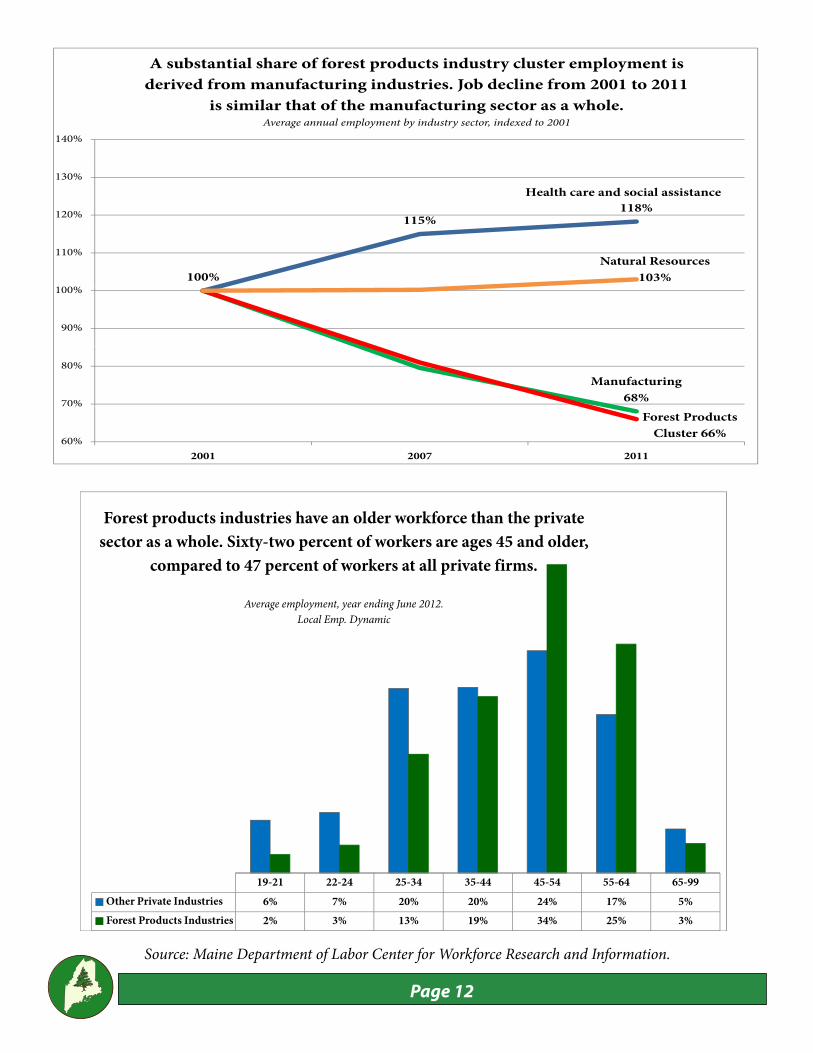
A substantial share of forest products industry cluster employment is derived from manufacturing industries. Job decline from 2001 to 2011
is similar that of the manufacturing sector as a whole
140%
is similar that of the manufacturing sector as a whole.Average annual employment by industry sector, indexed to 2001
115%118%120%
130%Health care and social assistance
100%Natural Resources
103%
110%
90%
100%
Manufacturing68%70%
80%
Forest Products Cluster 66%
60%
%
2001 2007 2011
Source: Maine Department of Labor Center for Workforce Research and Information.
Forest products industries have an older workforce than the private sector as a whole. Sixty-two percent of workers are ages 45 and older,
compared to 47 percent of workers at all private firms.
Average employment, year ending June 2012. Local Emp. Dynamic
19-21 22-24 25-34 35-44 45-54 55-64 65-99Other Private Industries 6% 7% 20% 20% 24% 17% 5%Forest Products Industries 2% 3% 13% 19% 34% 25% 3%
Page 13
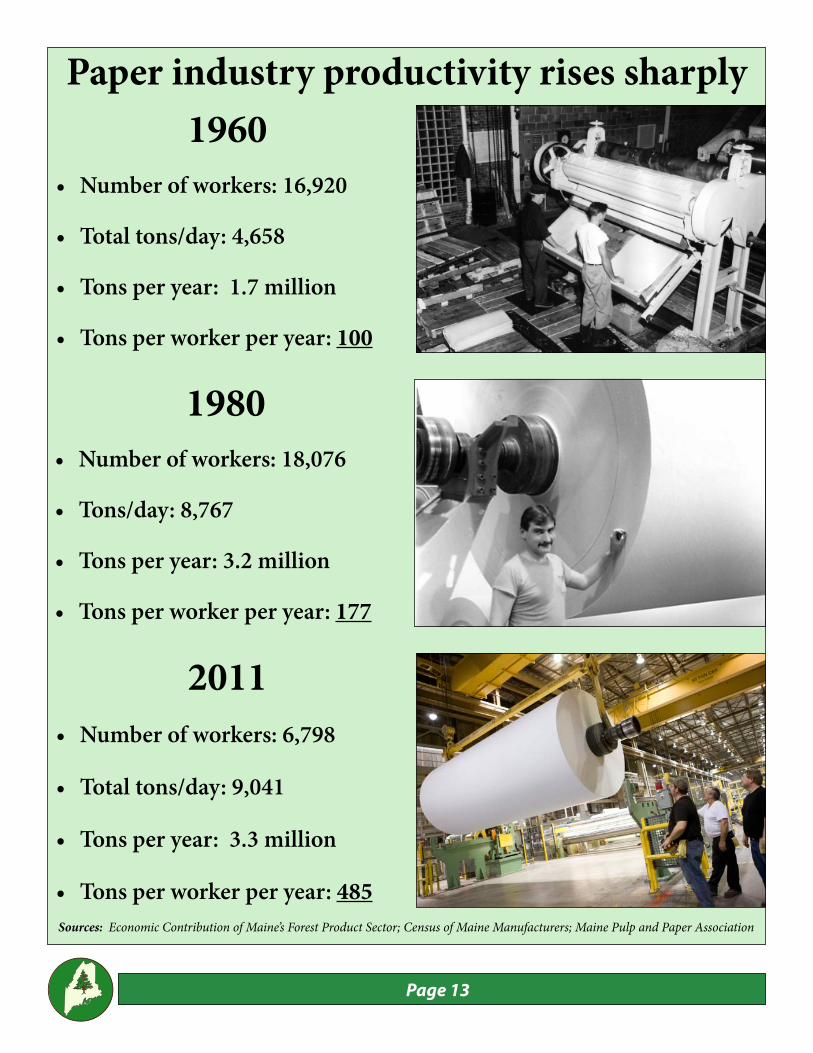
2011• Number of workers: 6,798
• Total tons/day: 9,041
• Tons per year: 3.3 million
• Tons per worker per year: 485
1980• Number of workers: 18,076
• Tons/day: 8,767
• Tons per year: 3.2 million
• Tons per worker per year: 177
1960• Number of workers: 16,920
• Total tons/day: 4,658
• Tons per year: 1.7 million
• Tons per worker per year: 100
Sources: Economic Contribution of Maine’s Forest Product Sector; Census of Maine Manufacturers; Maine Pulp and Paper Association
Paper industry productivity rises sharply
Page 14
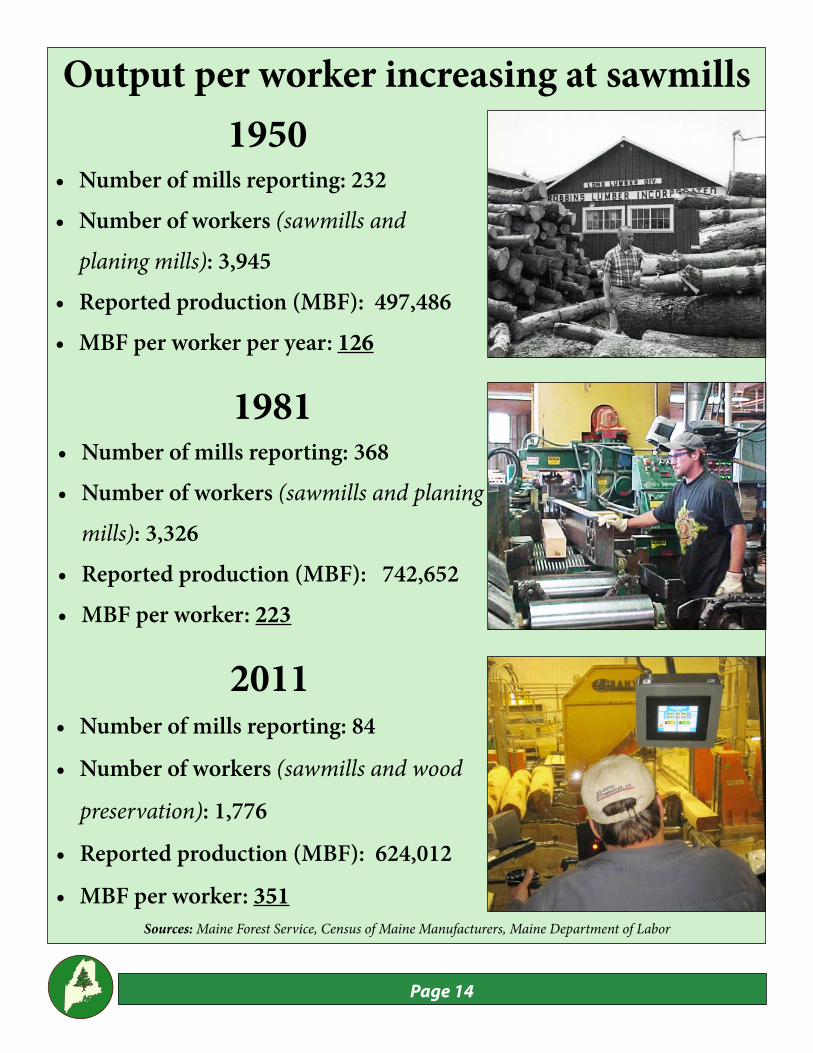
2011• Number of mills reporting: 84
• Number of workers (sawmills and wood
preservation): 1,776
• Reported production (MBF): 624,012
• MBF per worker: 351
1981• Number of mills reporting: 368• Number of workers (sawmills and planing
mills): 3,326• Reported production (MBF): 742,652• MBF per worker: 223
1950• Number of mills reporting: 232• Number of workers (sawmills and
planing mills): 3,945• Reported production (MBF): 497,486• MBF per worker per year: 126
Output per worker increasing at sawmills
Sources: Maine Forest Service, Census of Maine Manufacturers, Maine Department of Labor
Page 15
Doug DenicoDirector, Maine Forest Service
Th e State Forester is charged with protecting Maine’s forests from fi re and pests. Th is responsibility tends to make one a bit pessimistic about the future for good reason. We can’t aff ord the luxury of being wrong; we can hope for the best, but must prepare as if the worst could happen. At this time, our forests are very healthy and this is evident from factual information and feedback from professional forest managers.
Fortunately, the state is blessed with thousands of forest landowners and residents who have a very strong stewardship ethic and are interested in keeping our forests safe from all manner of threats (more on this later).
We not only have a healthy forest, but one that is hard at work producing fi ber for our manufacturing base. Maine is unique among northeastern states in that harvest and growth are nearly in balance, with a slight edge given to growth. Th is dynamic provides a good supply of young forest to replace mature forests before decline is well established. It is very likely that this unique balance contributes to Maine’s signifi cant net volumes of imported wood. Our manufacturing base has for years been taking advantage of surplus fi ber growth in adjacent states and provinces.
Fire protection aff orded our forests is of the highest order. While the incidence of fi res continues at a consistent level, the size of fi res has shrunk to about an acre per event. A number of factors have contributed to this trend including profi ciency, response time, use of local fi re departments, available federal equipment and harvest practices. A serious risk to maintaining this level of protection is the incidence of arson fi res. While arson is a minor component of fi re frequency, the average size of arson fi res is huge in comparison to other causes.
Th ere are a number of very serious introduced insect and disease pests either in Maine or at its borders. Names such as emerald ash borer, Asian longhorned beetle, winter moth, brown spruce longhorn beetle and hemlock adelgid are names that should be familiar to most.
Although the potential impact of these pests is huge, the actual losses we will experience vary between species and may be ameliorated by the management steps being taken (eradication, containment, and
development/deployment of biological control methods that are still in their initial phase of investigation).Some of the invasive pests that have been here for decades, such as gypsy moth, seem to be becoming naturalized and are causing less impact now than before. Others such as beech scale, white pine blister rust and balsam woolly adelgid continue to damage and/or kill trees, negatively impacting Maine’s forests. Th en there are native pests that periodically cause serious problems. White pine has been plagued for several years with pathogens that cause needle blight. Similarly, we are seeing expansion and intensifi cation of red pine shoot blight, which is killing trees in plantations across Maine.Our perennial visitor, the spruce budworm, is causing huge damage in Quebec and will appear in a few years. Tools used during the past epidemic must be reconfi gured if Maine is to have an eff ective control program.No list of threats would be complete without mentioning climate change, which is a factor in some of the pests mentioned above and threatens to have additional, as yet undetermined, impacts. While such change could have markedly diff erent results on our various tree species, the best opportunity to minimize negative impacts is to keep forests healthy through the application of sound silvicultural techniques.As stated before, a bit of pessimism is warranted from a public agency when all the potential risks to forest health are realized. Given the positive interest and active involvement of state agencies, and public and private entities, there is a sound basis for hope as well. Although funding for pest control is becoming more limited at the federal level, Maine and the rest of New England have been in the forefront of states joining together to share personnel and stretch dwindling fi nancial resources. Th is initiative is garnering support and demonstrating signifi cant initial success; a further indicator that Maine will weather coming challenges.
Maine has a resilient and healthy forest
Page 16
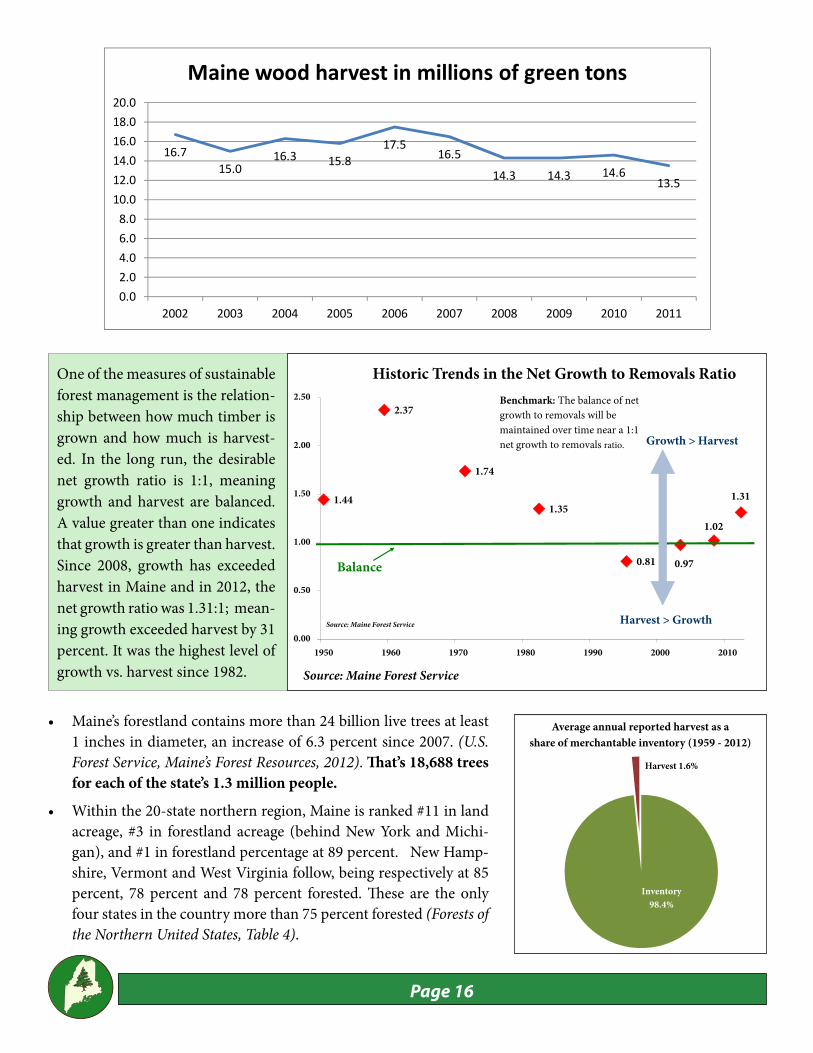
1.44
2.37
1.74
1.351.02
1.31
1.00
1.50
2.00
2.50
Historic Trends in the Net Growth to Removals Ratio
Growth > Harvest
Benchmark: The balance of net growth to removals will be maintained over time near a 1:1 net growth to removals ratio.
0.81 0.97
0.00
0.50
1950 1960 1970 1980 1990 2000 2010
Harvest > Growth
Balance
Source: Maine Forest Service
One of the measures of sustainable forest management is the relation-ship between how much timber is grown and how much is harvest-ed. In the long run, the desirable net growth ratio is 1:1, meaning growth and harvest are balanced. A value greater than one indicates that growth is greater than harvest. Since 2008, growth has exceeded harvest in Maine and in 2012, the net growth ratio was 1.31:1; mean-ing growth exceeded harvest by 31 percent. It was the highest level of growth vs. harvest since 1982.
• Maine’s forestland contains more than 24 billion live trees at least 1 inches in diameter, an increase of 6.3 percent since 2007. (U.S. Forest Service, Maine’s Forest Resources, 2012). Th at’s 18,688 trees for each of the state’s 1.3 million people.
• Within the 20-state northern region, Maine is ranked #11 in land acreage, #3 in forestland acreage (behind New York and Michi-gan), and #1 in forestland percentage at 89 percent. New Hamp-shire, Vermont and West Virginia follow, being respectively at 85 percent, 78 percent and 78 percent forested. Th ese are the only four states in the country more than 75 percent forested (Forests of the Northern United States, Table 4).
Source: Maine Forest Service
16.715.0
16.3 15.817.5
16.5
14.3 14.3 14.613.5
0.02.04.06.08.010.012.014.016.018.020.0
2002 2003 2004 2005 2006 2007 2008 2009 2010 2011
Maine wood harvest in millions of green tons
Average annual reported harvest as a share of merchantable inventory (1959 - 2012)y ( )
Harvest 1.6%
Inventory 98.4%
Page 17
To understand Maine’s Tree Growth program, you need to think of trees as a crop, just like corn or apples. But unlike food crops, trees take decades to mature to har-vest. Th e value of a mature woodlot just before harvest can be substantial, but its value aft er harvest is negligible and remains low for decades. So Tree Growth spreads property taxes evenly over the lifetime of the crop.
Th e state of Maine, like many other states, has long rec-ognized the necessity and desirability of encouraging landowners to practice good, long-term forest management. In 1953, the Legislature established the policy that forestland should be taxed on its productivity – on its ability to grow trees – rather than its potential value if con-verted to house lots or other developments. In 1970, citizens amended the Maine Constitution to allow current use taxation, meaning timberland is assessed on how the land is being used, rather than how it could potentially be used. A special study committee was ap-
pointed, which resulted in the Tree Growth Tax Law, declaring that “the public interest would be best served by encouraging for-est landowners to retain and improve their holdings of forest lands . . . in order to pro-tect this unique economic and recreational resource.”
Th e Tree Growth program is one of four “current use” programs – along with Farm-land, Open Space and Working Waterfront – enacted because it is in the public’s interest to encourage the preservation of farmland, open space, working forests and waterfronts.
Th ese programs are available to eligible property owners through municipalities. Any change in land use results in signifi cant penalties paid to the municipality. Every year municipalities apply for reimbursement from the state for 90 percent of the diff er-ence in valuation from local ad valorem for-estland rates and the Tree Growth rate.
Taxing land only on its ability to grow trees removes some of the economic pressures to convert forestland to other uses. So these lands grow timber, which provide jobs, in-come and taxes, and off er tremendous recre-ational opportunities. Th e program also pro-vides municipalities with a more dependable and stable source of revenues.
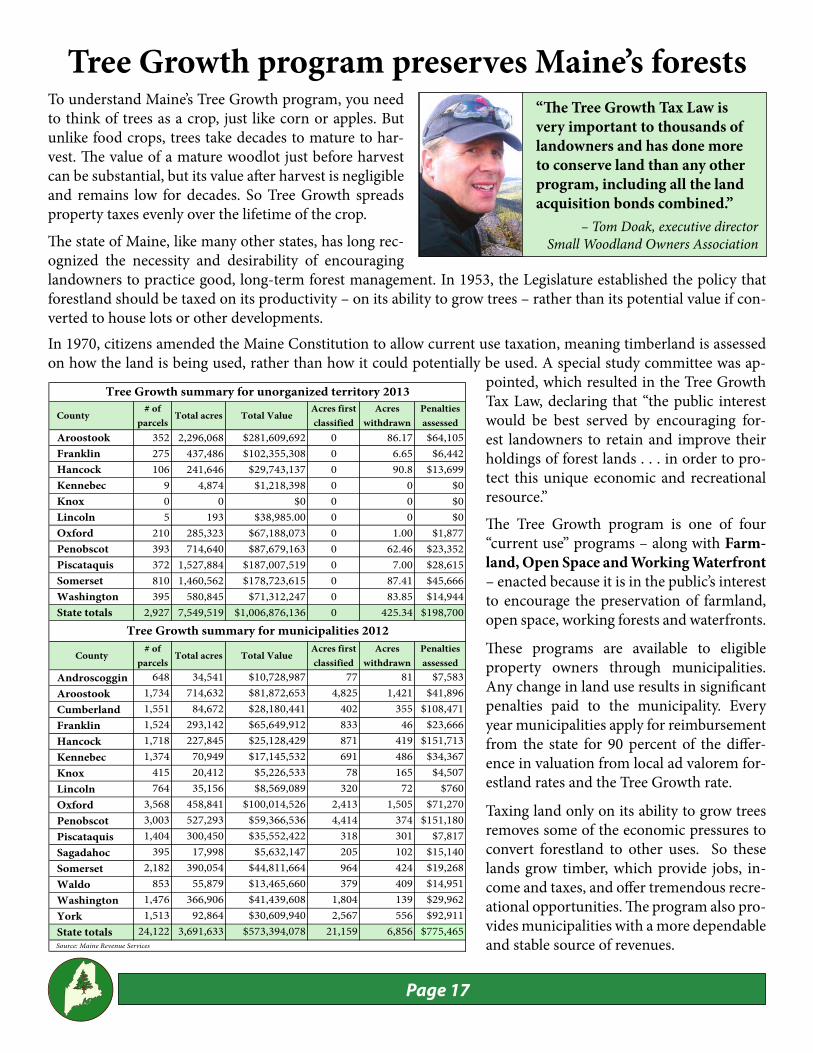
“Th e Tree Growth Tax Law is very important to thousands of landowners and has done more to conserve land than any other program, including all the land acquisition bonds combined.”
– Tom Doak, executive director Small Woodland Owners Association
Tree Growth program preserves Maine’s forests
County# of
parcelsTotal acres Total Value
Acres first classified
Acres withdrawn
Penalties assessed
Aroostook 352 2,296,068 $281,609,692 0 86.17 $64,105Franklin 275 437,486 $102,355,308 0 6.65 $6,442Hancock 106 241,646 $29,743,137 0 90.8 $13,699Kennebec 9 4,874 $1,218,398 0 0 $0Knox 0 0 $0 0 0 $0Lincoln 5 193 $38,985.00 0 0 $0Oxford 210 285,323 $67,188,073 0 1.00 $1,877Penobscot 393 714,640 $87,679,163 0 62.46 $23,352Piscataquis 372 1,527,884 $187,007,519 0 7.00 $28,615Somerset 810 1,460,562 $178,723,615 0 87.41 $45,666Washington 395 580,845 $71,312,247 0 83.85 $14,944State totals 2,927 7,549,519 $1,006,876,136 0 425.34 $198,700
County# of
parcelsTotal acres Total Value
Acres first classified
Acres withdrawn
Penalties assessed
Androscoggin 648 34,541 $10,728,987 77 81 $7,583Aroostook 1,734 714,632 $81,872,653 4,825 1,421 $41,896Cumberland 1,551 84,672 $28,180,441 402 355 $108,471Franklin 1,524 293,142 $65,649,912 833 46 $23,666Hancock 1,718 227,845 $25,128,429 871 419 $151,713Kennebec 1,374 70,949 $17,145,532 691 486 $34,367Knox 415 20,412 $5,226,533 78 165 $4,507Lincoln 764 35,156 $8,569,089 320 72 $760Oxford 3,568 458,841 $100,014,526 2,413 1,505 $71,270Penobscot 3,003 527,293 $59,366,536 4,414 374 $151,180Piscataquis 1,404 300,450 $35,552,422 318 301 $7,817Sagadahoc 395 17,998 $5,632,147 205 102 $15,140Somerset 2,182 390,054 $44,811,664 964 424 $19,268Waldo 853 55,879 $13,465,660 379 409 $14,951Washington 1,476 366,906 $41,439,608 1,804 139 $29,962York 1,513 92,864 $30,609,940 2,567 556 $92,911State totals 24,122 3,691,633 $573,394,078 21,159 6,856 $775,465
Tree Growth summary for unorganized territory 2013
Tree Growth summary for municipalities 2012
Source: Maine Revenue Services
Page 18
By Peter Triandafi llouVice president, woodlands
Huber Resources“Kingdoms for sale” read the Port-land Press Herald’s front page head-line on June 10, 2001. Th ere was much concern that wealthy buyers who were “less interested in feed-ing the mills than nourishing their souls or their wallets” would change northern Maine.While much of the working timber-land in central and southern Maine is composed of smaller woodlots owned by families, individuals and farmers, much of Maine’s northern timberlands are held in very large tracts by commercial owners. From the 1980s through the 1990s, most timberland owned by paper companies was sold to private in-vestors. Th ese investors represent pension funds, other institutional investors and wealthy individuals. Many fi rms have fi xed investment periods that require a sale in order to capture return on investment. Although investment fi rms were initially hailed as an alternative to industrial owners, this fi xed in-vestment length created suspicion in some circles, with predictions of fragmenting ownerships, increased development and poor silviculture.It’s been nearly two decades since this change in ownership took place and while some still claim things have changed for the worse, a look at the facts says otherwise. When one looks at the heart of the industrial forest of the unorganized territories – a mile beyond an orga-nized town or a paved public road
– the average rate of development as measured by LURC permits for new dwellings is one dwelling per township per decade. Th at’s 10 new dwellings per 24,000 acres per century. Deep woods development peaked in the late 1980s, well before all the paper company land was sold. During this period, new and tradi-tional landowners sold conservation easements on more than 3.5 million acres. Development is no longer al-lowed and the ability to subdivide is very limited. Th ese are not the ac-tions of entities seeking “higher and better” uses of forestland. Th e lands that were sold remain working for-ests that supply wood to consuming mills. Many were sold with supply agreements that run for decades and most are actively managed.Other facts bear this out. Th e acres enrolled in Maine’s Tree Growth program, has remained essentially unchanged over the past two de-cades. Th e peak acreage occurred in 1990 at 7,586,723 acres and the low in 1997 at 7,525,312 acres.
Landowners constantly made choic-es to drop out or join. Annual chang-es over the period range from a loss of 42,999 acres to a gain of 36,000 acres. Th e change in average parcel size in the unorganized territory – from 3,500 acres in 1988, to 2,570 acres in 2013 – refl ects increases in the number of landowner.Some raised the specter of reduced access, claiming that new owners would “lock the gates” for them-selves or paying customers. How-ever, there has been no signifi cant change in access policy through-out the north woods. Th e public is still welcome to recreate on the vast landscape of the north woods.Th ere is no doubt that a lot of tim-berland in northern Maine was sold by paper companies to other owners in the 1980s and 1990s. However, many of the forest managers remain in place and the vast majority of properties remain working forests that are open to the public. Maine’s unique mix of job-creating working forests with public access remains alive and well.
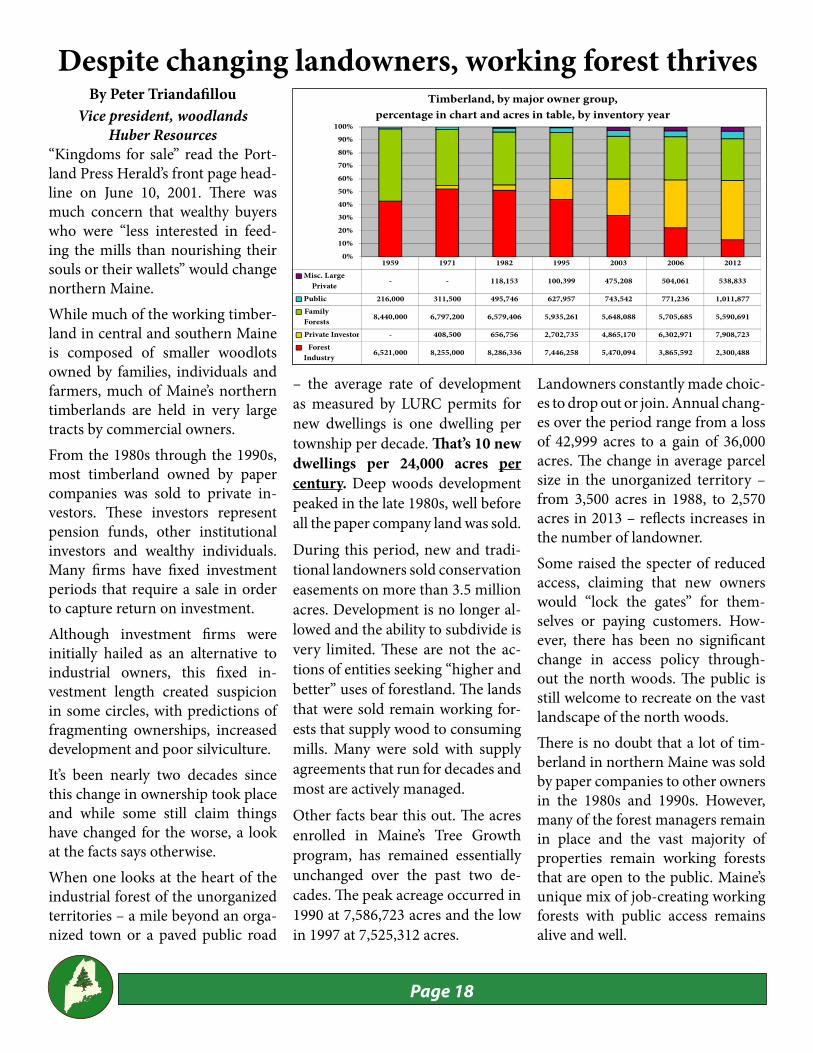
1959 1971 1982 1995 2003 2006 2012Misc. Large
Private - - 118,153 100,399 475,208 504,061 538,833
Public 216,000 311,500 495,746 627,957 743,542 771,236 1,011,877 Family Forests 8,440,000 6,797,200 6,579,406 5,935,261 5,648,088 5,705,685 5,590,691
Private Investor - 408,500 656,756 2,702,735 4,865,170 6,302,971 7,908,723 Forest
Industry 6,521,000 8,255,000 8,286,336 7,446,258 5,470,094 3,865,592 2,300,488
0%10%20%30%40%50%60%70%80%90%
100%
Timberland, by major owner group, percentage in chart and acres in table, by inventory year
Despite changing landowners, working forest thrives
Page 19
As Maine quietly marks the 20th anniversary of its reformed workers comp system, the logging industry has even more to celebrate.
“I think it’s safe to say that the current mechanical logging certifi ed CLP rate is probably the lowest there is in the country,” says Mike St. Peter, executive director of Maine’s Certifi ed Professional Logging (CLP) program.
Th e battle over workers comp raged through the 1980s and 1990s, even triggering a state government shutdown in 1991, when reforms were linked to passage of the state budget. But thanks to recommendations from a blue
ribbon commission in 1992, the new system began in January 1993.
Since then average workers comp rates have declined about 50 percent, but in Maine’s logging industry the savings and the improvements in safety are even more dramatic. Injuries have dropped sharply and workers comp rates have declined as much as 69 percent for some logging categories.
In 2011, workers comp cost $5.9 million less than it would have in 1993 –$1.2 million in savings for conventional logging and $4.7 million for mechanical logging.
“Th e CLP program was initiated back in 1991 because of exorbitant workers’ comp rates,” St. Peter said. “Th e folks within the industry got together and said, “Can we aff ect these high rates?” Th ey got state government, the insurance industry, logging contractors and forest products groups to get together and come up with a solution. And that solution was promoting safety training and education.”
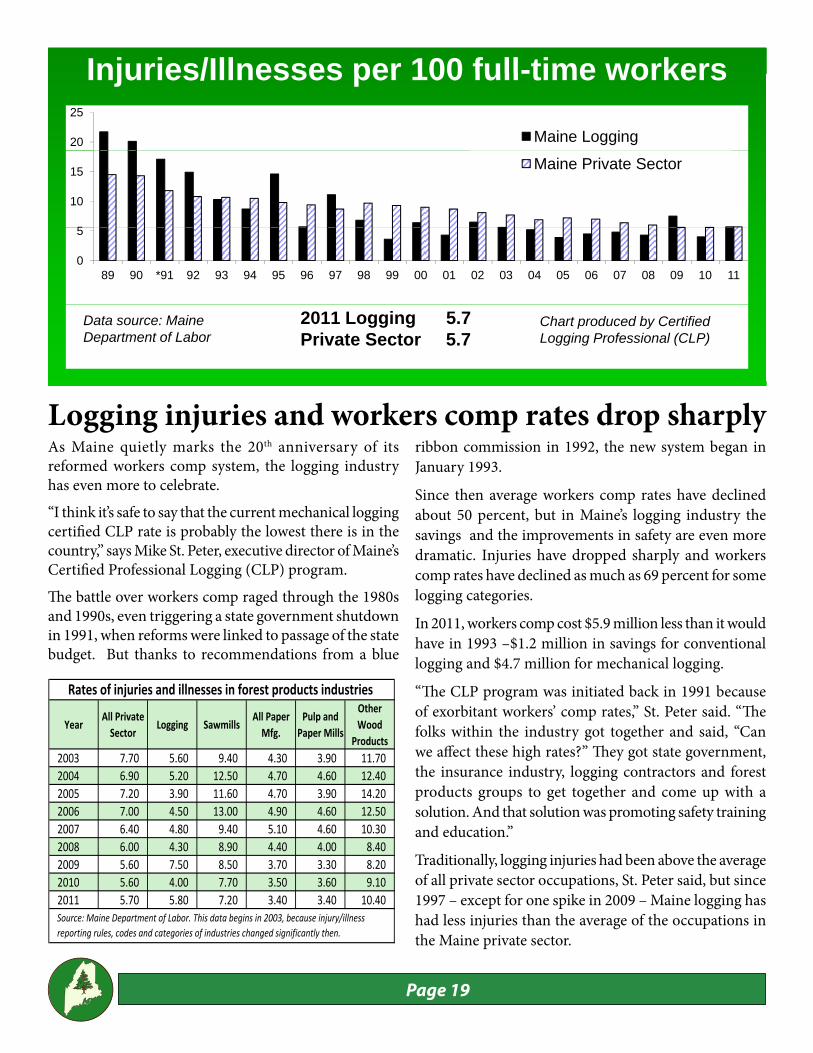
Traditionally, logging injuries had been above the average of all private sector occupations, St. Peter said, but since 1997 – except for one spike in 2009 – Maine logging has had less injuries than the average of the occupations in the Maine private sector.
Injuries/Illnesses per 100 full-time workersInjuries/Illnesses per 100 full-time workers
20
25
Maine Logging
5
10
15 Maine Private Sector
0
5
89 90 *91 92 93 94 95 96 97 98 99 00 01 02 03 04 05 06 07 08 09 10 11
Data source: Maine Department of Labor
2011 Logging 5.7 Private Sector 5.7
Chart produced by Certified Logging Professional (CLP)
Logging injuries and workers comp rates drop sharply
YearAll PrivateSector
Logging SawmillsAll PaperMfg.
Pulp andPaper Mills
OtherWood
Products2003 7.70 5.60 9.40 4.30 3.90 11.702004 6.90 5.20 12.50 4.70 4.60 12.402005 7.20 3.90 11.60 4.70 3.90 14.202006 7.00 4.50 13.00 4.90 4.60 12.502007 6.40 4.80 9.40 5.10 4.60 10.302008 6.00 4.30 8.90 4.40 4.00 8.402009 5.60 7.50 8.50 3.70 3.30 8.202010 5.60 4.00 7.70 3.50 3.60 9.102011 5.70 5.80 7.20 3.40 3.40 10.40Source: Maine Department of Labor. This data begins in 2003, because injury/illnessreporting rules, codes and categories of industries changed significantly then.
Rates of injuries and illnesses in forest products industries
Page 20
There are two major factors in safety improvement, St. Peter said. One is the strong emphasis on safety and education, not only through CLP, but by logging companies and contractors.
Th e other is big increase in the amount of mechanical logging, as opposed to conventional logging with chain saws and skidders.
“Certainly mechanization has been a big contributor to lowering the injury rates for the whole logging sector because there are less people under the (forest) canopy – they’re all in enclosed cabs,” St. Peter said. “So that’s certainly had an eff ect on injuries. But training, education and improved technology have all contributed to lower injury rates.”
When CLP started tracking workers comp rates in 1993, rates for both the certifi ed and non-certifi ed loggers were between 40 and 50 percent of payroll. As the certifi ed rate developed, there was a marked diff erence between the certifi ed and non certifi ed rate in the conventional sector.
Since 2005, those rates have pretty much been the same, St. Peter said, “and the reason for that is there’s virtually no longer any conventional loggers who are not certifi ed and trained. Th ere are a number of independent loggers that are certifi ed and non certifi ed out there, but they’re not refl ected in the workers comp rates because they are not on a payroll.”
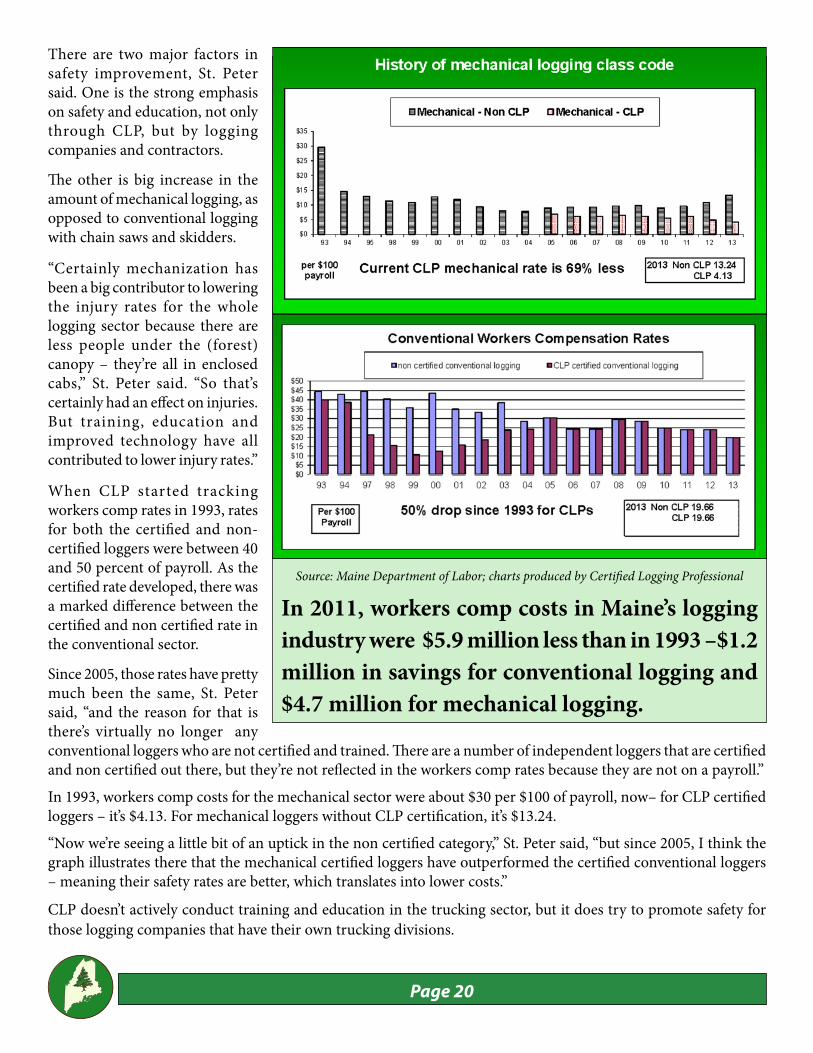
In 1993, workers comp costs for the mechanical sector were about $30 per $100 of payroll, now– for CLP certifi ed loggers – it’s $4.13. For mechanical loggers without CLP certifi cation, it’s $13.24.
“Now we’re seeing a little bit of an uptick in the non certifi ed category,” St. Peter said, “but since 2005, I think the graph illustrates there that the mechanical certifi ed loggers have outperformed the certifi ed conventional loggers – meaning their safety rates are better, which translates into lower costs.”
CLP doesn’t actively conduct training and education in the trucking sector, but it does try to promote safety for those logging companies that have their own trucking divisions.
In 2011, workers comp costs in Maine’s logging industry were $5.9 million less than in 1993 –$1.2 million in savings for conventional logging and $4.7 million for mechanical logging.
Source: Maine Department of Labor; charts produced by Certifi ed Logging Professional
Page 21
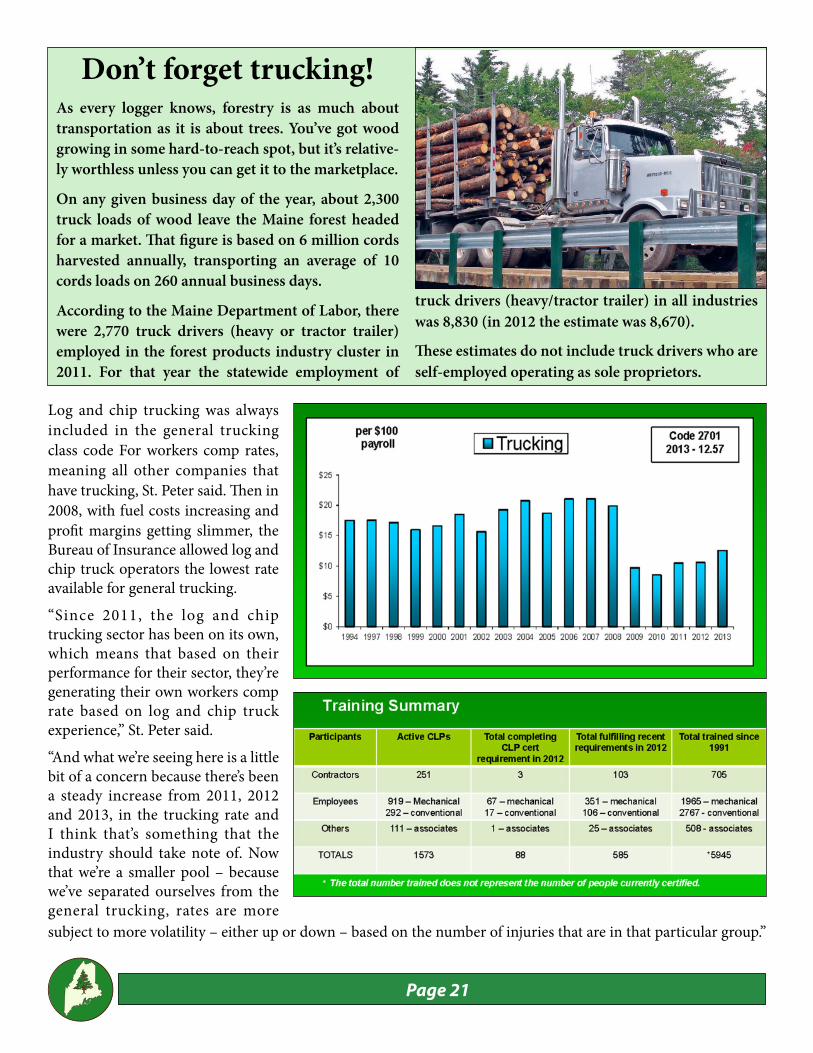
Log and chip trucking was always included in the general trucking class code For workers comp rates, meaning all other companies that have trucking, St. Peter said. Th en in 2008, with fuel costs increasing and profi t margins getting slimmer, the Bureau of Insurance allowed log and chip truck operators the lowest rate available for general trucking.
“Since 2011, the log and chip trucking sector has been on its own, which means that based on their performance for their sector, they’re generating their own workers comp rate based on log and chip truck experience,” St. Peter said.
“And what we’re seeing here is a little bit of a concern because there’s been a steady increase from 2011, 2012 and 2013, in the trucking rate and I think that’s something that the industry should take note of. Now that we’re a smaller pool – because we’ve separated ourselves from the general trucking, rates are more subject to more volatility – either up or down – based on the number of injuries that are in that particular group.”
Don’t forget trucking!As every logger knows, forestry is as much about transportation as it is about trees. You’ve got wood growing in some hard-to-reach spot, but it’s relative-ly worthless unless you can get it to the marketplace.
On any given business day of the year, about 2,300 truck loads of wood leave the Maine forest headed for a market. Th at fi gure is based on 6 million cords harvested annually, transporting an average of 10 cords loads on 260 annual business days.
According to the Maine Department of Labor, there were 2,770 truck drivers (heavy or tractor trailer) employed in the forest products industry cluster in 2011. For that year the statewide employment of
truck drivers (heavy/tractor trailer) in all industries was 8,830 (in 2012 the estimate was 8,670).
Th ese estimates do not include truck drivers who are self-employed operating as sole proprietors.
Page 22
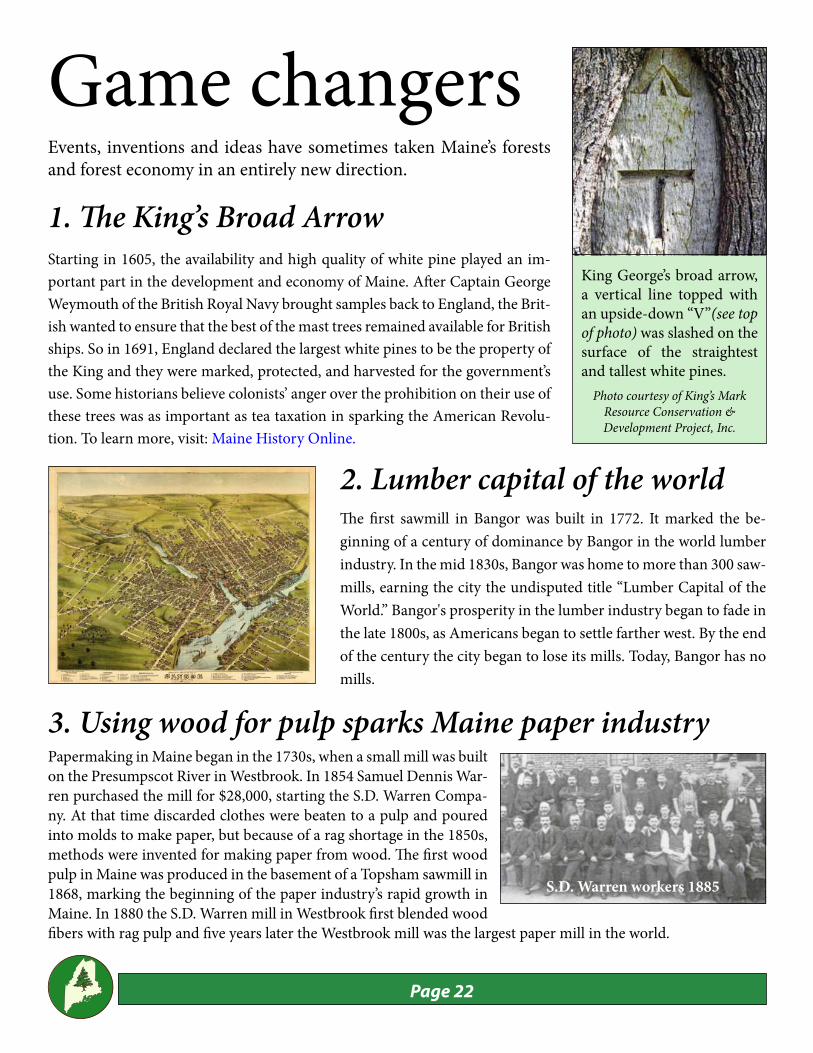
1. Th e King’s Broad ArrowStarting in 1605, the availability and high quality of white pine played an im-portant part in the development and economy of Maine. Aft er Captain George Weymouth of the British Royal Navy brought samples back to England, the Brit-ish wanted to ensure that the best of the mast trees remained available for British ships. So in 1691, England declared the largest white pines to be the property of the King and they were marked, protected, and harvested for the government’s use. Some historians believe colonists’ anger over the prohibition on their use of these trees was as important as tea taxation in sparking the American Revolu-tion. To learn more, visit: Maine History Online.
King George’s broad arrow, a vertical line topped with an upside-down “V”(see top of photo) was slashed on the surface of the straightest and tallest white pines.
Photo courtesy of King’s Mark Resource Conservation & Development Project, Inc.
Game changersEvents, inventions and ideas have sometimes taken Maine’s forests and forest economy in an entirely new direction.
Th e fi rst sawmill in Bangor was built in 1772. It marked the be-ginning of a century of dominance by Bangor in the world lumber industry. In the mid 1830s, Bangor was home to more than 300 saw-mills, earning the city the undisputed title “Lumber Capital of the World.” Bangor's prosperity in the lumber industry began to fade in the late 1800s, as Americans began to settle farther west. By the end of the century the city began to lose its mills. Today, Bangor has no mills.
2. Lumber capital of the world
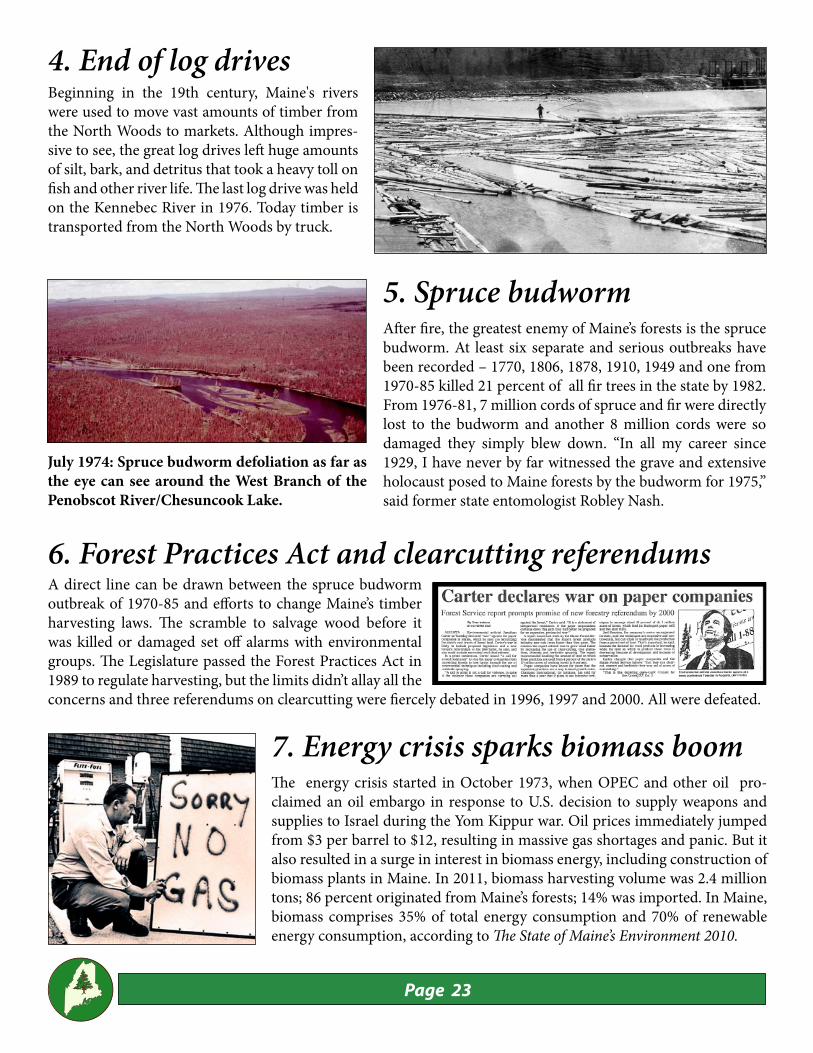
3. Using wood for pulp sparks Maine paper industryPapermaking in Maine began in the 1730s, when a small mill was built on the Presumpscot River in Westbrook. In 1854 Samuel Dennis War-ren purchased the mill for $28,000, starting the S.D. Warren Compa-ny. At that time discarded clothes were beaten to a pulp and poured into molds to make paper, but because of a rag shortage in the 1850s, methods were invented for making paper from wood. Th e fi rst wood pulp in Maine was produced in the basement of a Topsham sawmill in 1868, marking the beginning of the paper industry’s rapid growth in Maine. In 1880 the S.D. Warren mill in Westbrook fi rst blended wood fi bers with rag pulp and fi ve years later the Westbrook mill was the largest paper mill in the world.
S.D. Warren workers 1885
Page 23
7. Energy crisis sparks biomass boomTh e energy crisis started in October 1973, when OPEC and other oil pro-claimed an oil embargo in response to U.S. decision to supply weapons and supplies to Israel during the Yom Kippur war. Oil prices immediately jumped from $3 per barrel to $12, resulting in massive gas shortages and panic. But it also resulted in a surge in interest in biomass energy, including construction of biomass plants in Maine. In 2011, biomass harvesting volume was 2.4 million tons; 86 percent originated from Maine’s forests; 14% was imported. In Maine, biomass comprises 35% of total energy consumption and 70% of renewable energy consumption, according to Th e State of Maine’s Environment 2010.
4. End of log drivesBeginning in the 19th century, Maine's rivers were used to move vast amounts of timber from the North Woods to markets. Although impres-sive to see, the great log drives left huge amounts of silt, bark, and detritus that took a heavy toll on fi sh and other river life. Th e last log drive was held on the Kennebec River in 1976. Today timber is transported from the North Woods by truck.
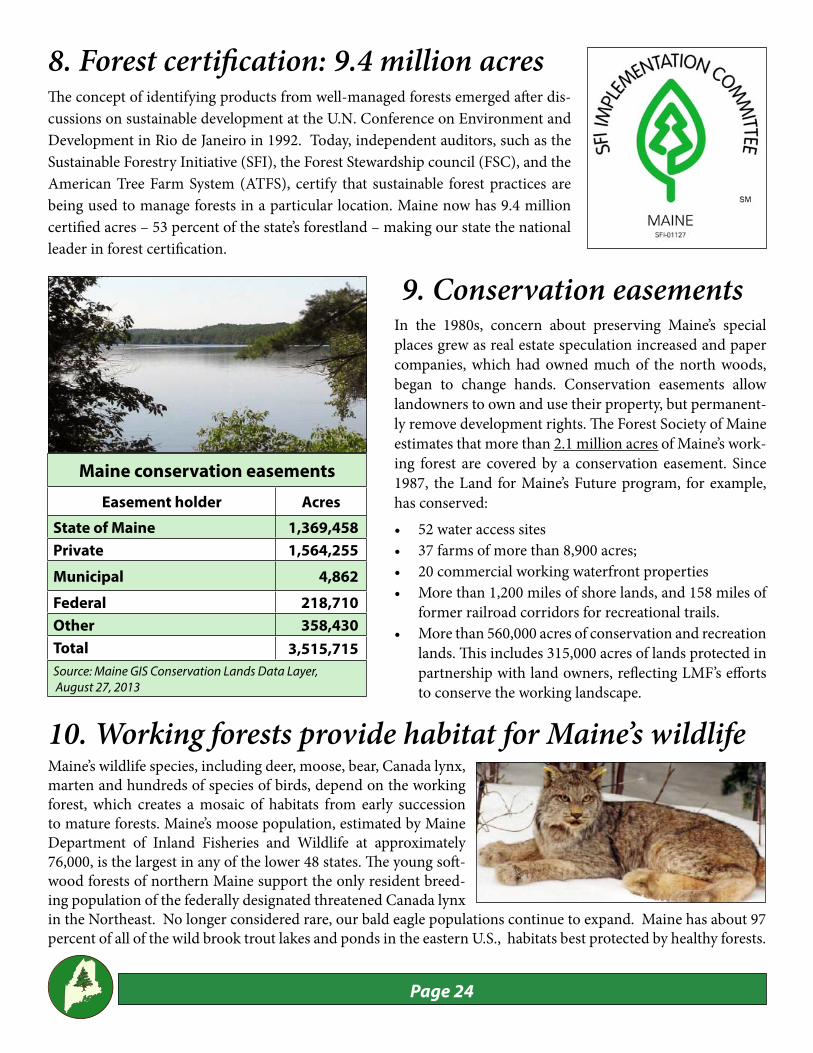
5. Spruce budwormAft er fi re, the greatest enemy of Maine’s forests is the spruce budworm. At least six separate and serious outbreaks have been recorded – 1770, 1806, 1878, 1910, 1949 and one from 1970-85 killed 21 percent of all fi r trees in the state by 1982. From 1976-81, 7 million cords of spruce and fi r were directly lost to the budworm and another 8 million cords were so damaged they simply blew down. “In all my career since 1929, I have never by far witnessed the grave and extensive holocaust posed to Maine forests by the budworm for 1975,” said former state entomologist Robley Nash.
July 1974: Spruce budworm defoliation as far as the eye can see around the West Branch of the Penobscot River/Chesuncook Lake.
6. Forest Practices Act and clearcutting referendumsA direct line can be drawn between the spruce budworm outbreak of 1970-85 and eff orts to change Maine’s timber harvesting laws. Th e scramble to salvage wood before it was killed or damaged set off alarms with environmental groups. Th e Legislature passed the Forest Practices Act in 1989 to regulate harvesting, but the limits didn’t allay all the concerns and three referendums on clearcutting were fi ercely debated in 1996, 1997 and 2000. All were defeated.
Page 24
8. Forest certifi cation: 9.4 million acresTh e concept of identifying products from well-managed forests emerged aft er dis-cussions on sustainable development at the U.N. Conference on Environment and Development in Rio de Janeiro in 1992. Today, independent auditors, such as the Sustainable Forestry Initiative (SFI), the Forest Stewardship council (FSC), and the American Tree Farm System (ATFS), certify that sustainable forest practices are being used to manage forests in a particular location. Maine now has 9.4 million certifi ed acres – 53 percent of the state’s forestland – making our state the national leader in forest certifi cation.
9. Conservation easementsIn the 1980s, concern about preserving Maine’s special places grew as real estate speculation increased and paper companies, which had owned much of the north woods, began to change hands. Conservation easements allow landowners to own and use their property, but permanent-ly remove development rights. Th e Forest Society of Maine estimates that more than 2.1 million acres of Maine’s work-ing forest are covered by a conservation easement. Since 1987, the Land for Maine’s Future program, for example, has conserved: • 52 water access sites• 37 farms of more than 8,900 acres;• 20 commercial working waterfront properties• More than 1,200 miles of shore lands, and 158 miles of
former railroad corridors for recreational trails. • More than 560,000 acres of conservation and recreation
lands. Th is includes 315,000 acres of lands protected in partnership with land owners, refl ecting LMF’s eff orts to conserve the working landscape.
10. Working forests provide habitat for Maine’s wildlifeMaine’s wildlife species, including deer, moose, bear, Canada lynx, marten and hundreds of species of birds, depend on the working forest, which creates a mosaic of habitats from early succession to mature forests. Maine’s moose population, estimated by Maine Department of Inland Fisheries and Wildlife at approximately 76,000, is the largest in any of the lower 48 states. Th e young soft -wood forests of northern Maine support the only resident breed-ing population of the federally designated threatened Canada lynx in the Northeast. No longer considered rare, our bald eagle populations continue to expand. Maine has about 97 percent of all of the wild brook trout lakes and ponds in the eastern U.S., habitats best protected by healthy forests.
Maine conservation easements
Easement holder Acres
State of Maine 1,369,458
Private 1,564,255
Municipal 4,862
Federal 218,710
Other 358,430
Total 3,515,715
Source: Maine GIS Conservation Lands Data Layer, August 27, 2013
Page 25
Looking at all the information about Maine’s forest economy in the preceding pages, I can’t help being proud and optimistic.
First, however, I must thank Dr. Todd Gabe, Universi-ty of Maine School of Economics, for his research; Dr. Robert Wagner, director of the Center for Research on Sustainable Forests and the Cooperative Forestry Re-search Unit, for making forest facts understandable to those outside our industry, and the Maine Forest Ser-vice, especially Ken Laustsen, for helping compile and check the information in Maine’s Forest Economy.We hope it’s useful to those who care about our forests and we’ll update as new information becomes available.
As Maine gradually emerges from an extended and very diffi cult economic downturn, I believe the state’s forest product industry is well positioned to benefi t, as is the Maine economy. Here are some of the forest economy facts and fi gures that stand out most strongly for me:
• Th e amount of forestland today is an astounding 97 percent of the pre-settlement forestland in 1600 – and with a much higher population.
• Th e ownership of Maine’s forest has changed, but by and large, the use as forestland has been constant.
• Maine leads the nation with 10.3 million acres of forestland that’s certifi ed as sustainably managed by the major sustainability certifi cation bodies (SFI, ATFS, FSC), assuring the people of Maine that we can sustainably grow and harvest trees while pro-tecting water quality, wildlife and so much more.
• Conservation easements covering 2.1 million acres of Maine’s working forest are further assurance of well-managed forests continuing into the future.
• For the past 22 years, Maine has harvested on av-erage 6.7 million cords each year, and since 2008 growth exceeds our harvest.
• Maine’s merchantable inventory today is nearly twice as much as it was in 1953, and continues to increase.
• Th ough the industry has fewer jobs today, those jobs are safer, utilize more technology and pay an aver-age wage 33 percent higher than the state average.
• Our aging workforce means good-paying, high-tech jobs are coming soon for you or your children.
• New uses of wood and wood bioproducts will ex-pand our industry’s economic contribution.
• Research shows that managed forests are carbon friendly, including a 2013 University of New Bruns-wick study (A Comprehensive Greenhouse Gas Bal-ance for a Forest Company Operating in Northeast North America) on J. D. Irving’s carbon dynamics.
So what do we need to insure Maine’s forest economy continues to thrive? Here are a few ideas:
• Provide incentives for expanding the manufactur-ing base, because a strong manufacturing sector provides outlets for wood, which preserves forests.
• Expand value-added processing in Maine to en-hance job growth and the overall economy.
• Increase primary and secondary processing mills.
• Protect the most eff ective conservation program in the state, the Tree Growth tax program.
• Enhance the image of forest sector jobs and increase training and educational opportunities.
Each forest sector has its own unique opportunities and challenges, but the potential exists to strengthen our industry as is being done in Canada and other states such as Wisconsin and Minnesota. All the elements are within reach to build a stronger forest economy.
Th e entrepreneurial spirit of those in our industry al-ready is capitalizing on opportunities, but we need help. State, federal and local offi cials can help by creating an environment where companies are encouraged to invest capital and not discouraged by an unpredictable regu-latory climate. Th e people of Maine can help by under-standing that Maine’s forests are healthy. Th ose of us who work in the forests products industry believe our future is bright. We hope this book helps everyone un-derstand our optimism.
Good reasons for optimism about our forest economyMark Doty
President of the Board
Maine Forest Products Council
20
SFI-00064
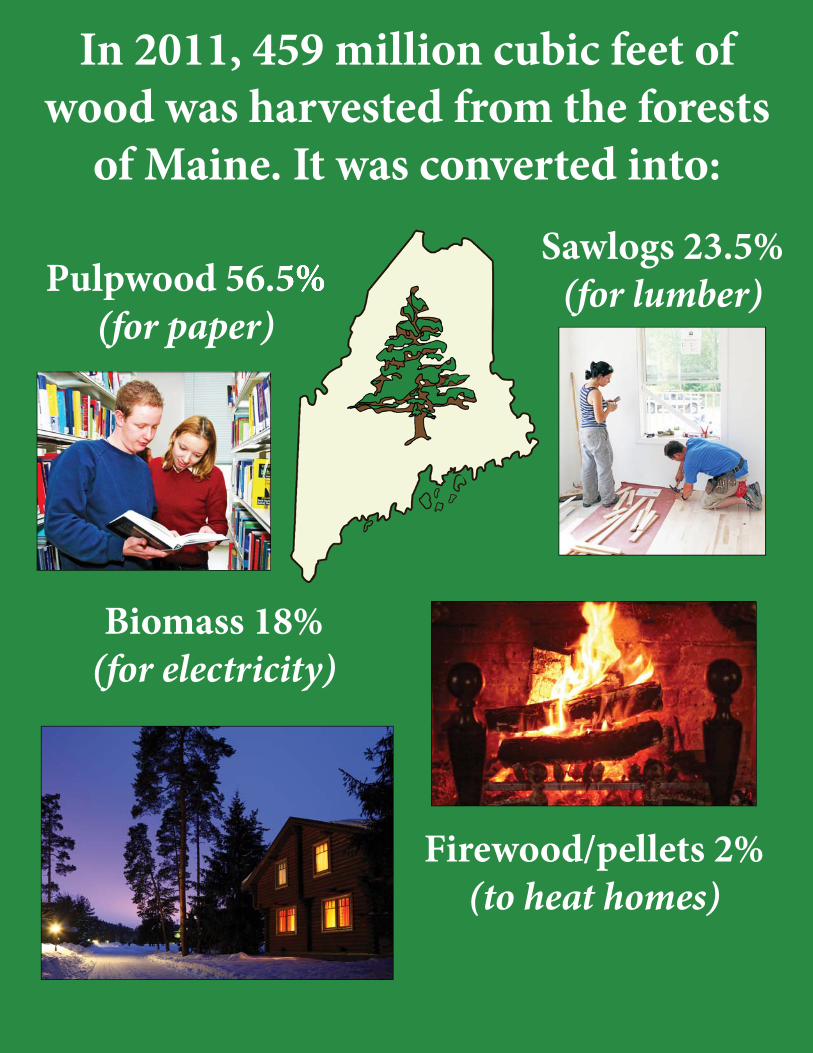
Sawlogs 23.5% (for lumber)Pulpwood 56.5%
(for paper)
In 2011, 459 million cubic feet of wood was harvested from the forests
of Maine. It was converted into:
Biomass 18% (for electricity)
Firewood/pellets 2% (to heat homes)
Recommended