This article was downloaded by: [University of Illinois Chicago]On: 27 October 2014, At: 20:57Publisher: Taylor & FrancisInforma Ltd Registered in England and Wales Registered Number: 1072954 Registeredoffice: Mortimer House, 37-41 Mortimer Street, London W1T 3JH, UK
Journal of Nuclear Science andTechnologyPublication details, including instructions for authors andsubscription information:http://www.tandfonline.com/loi/tnst20
Maintenance Management SupportSystems for Component Aging Estimationat Nuclear Power PlantsShunichi SHIMIZU a , Yasumasa ANDO b , Toshihiko MORIOKA b &Naoaki OKUZUMI ba Nuclear Engineering Laboratory , Toshiba Corp. , Ukishima-cho,Kawasaki-ku, Kawasaki , 210b Isogo Nuclear Engineering Center , Toshiba Corp. , Shinsugita-cho,Isogo-ku, Yokohama , 235Published online: 15 Mar 2012.
To cite this article: Shunichi SHIMIZU , Yasumasa ANDO , Toshihiko MORIOKA & Naoaki OKUZUMI (1991)Maintenance Management Support Systems for Component Aging Estimation at Nuclear Power Plants,Journal of Nuclear Science and Technology, 28:11, 1041-1057, DOI: 10.1080/18811248.1991.9731467
To link to this article: http://dx.doi.org/10.1080/18811248.1991.9731467
PLEASE SCROLL DOWN FOR ARTICLE
Taylor & Francis makes every effort to ensure the accuracy of all the information (the“Content”) contained in the publications on our platform. However, Taylor & Francis, ouragents, and our licensors make no representations or warranties whatsoever as to theaccuracy, completeness, or suitability for any purpose of the Content. Any opinions andviews expressed in this publication are the opinions and views of the authors, and arenot the views of or endorsed by Taylor & Francis. The accuracy of the Content should notbe relied upon and should be independently verified with primary sources of information.Taylor and Francis shall not be liable for any losses, actions, claims, proceedings, demands,costs, expenses, damages, and other liabilities whatsoever or howsoever caused arisingdirectly or indirectly in connection with, in relation to or arising out of the use of theContent.
This article may be used for research, teaching, and private study purposes. Anysubstantial or systematic reproduction, redistribution, reselling, loan, sub-licensing,systematic supply, or distribution in any form to anyone is expressly forbidden. Terms &Conditions of access and use can be found at http://www.tandfonline.com/page/terms-and-conditions
Journal of NUCLEAR SCIENCE and TECHi':OLOGY, 28[11], pp. 1041-1057 (November 1991).
TECHNICAL REPORT
Maintenance Management Support Systems for Component Aging Estimation
at Nuclear Power Plants
Shunichi SHIMIZU,
Nuclear Engineering Laboratory, Toshiba Corp.*
Yasumasa ANDO, Toshihiko MORIOKA and Naoaki OKUZUMI
!sago Nuclear Engineering Center, Toshiba Corp.**
Received October 8, 1990
1041
Maintenance Management Support Systems (MMSSs) for nuclear power plants have been developed using component aging estimation methods and decision tree analysis for maintenance planning. The former evaluates actual component reliability through statistical analysis on field maintenance data. The latter provides preventive maintenance (PM) planning guidance using heuristic expert knowledge and estimated reliability parameters.
The following aspects have been investigated: (1) A systematic and effective method of managing components/parts design information and
field maintenance data (2) A method for estimating component aging based on a statistical analysis of field main
tenance data (3) A method for providing PM planning guidance using estimated component reliability I
performance parameters and decision tree analysis. Based on these investigations, two MMSSs were developed. One deals with "general
maintenance data", which are common to all component types and are amenable to common data handling. The other system deals with "specific maintenance data", which are specific to an individual component type. Both systems provide PM planning guidance for PM cycles propriety and the PM work priority. The function of these systems were verified using simulated maintenance data.
KEYWORDS: nuclear power plants, reactor maintenance, maintenance management system, reactor components, aging estimation, reliability, performance, decision tree analysis, maintenance data, data processing, expert systems, statifltical analysis
I. INTRODUCTION
Preventive Maintenance (PM) planning in nuclear power plants has recently become very important due to the increasing number of power stations and their longer periods of operation. Preventive maintenance planning must include measures against component de-
gradation, while maintaining maximum component reliability and plant availability at minimum cost. This is a very complex task for plant personnel, since it requires making decisions based on a significant amount of field maintenance data and on a broad know* Ukishima.cho, Kawasaki-ku, Kawasaki 210. ** Shinsugita.cho, Isogo.ku, Yokohama 235.
-69-
Dow
nloa
ded
by [
Uni
vers
ity o
f Il
linoi
s C
hica
go]
at 2
0:57
27
Oct
ober
201
4
1042 TECHNICAL REPORT (S. Shimizu et al.) ]. Nucl. Sci. Techno!.,
ledge regarding design conditions, operating conditions, and maintainability of various components. Since component reliability decreases with degradation and increases with appropriate countermeasures, such as PM work or design modifications, it is necessary to take timely and effective measures based on the evaluation of actual component reliability.
To deal with this complex situation, several studies on component aging estimation techniques and Maintenance Management Support Systems (MMSSs) have been carried out for specific component types and plant systems <ll-<•l. These previous studies have mainly concentrated on evaluating failure, and have not evaluated normal or deterioration data yet. However, in order to enhance PM planning reliability, a wider spectrum of field maintenance data should be utilized. This includes not only failure data, but also deterioration data obtained during component overhaul, inspection and surveillance.
In order to develop more practical MMSSs, it is necessary to include the various kinds of field maintenance data mentioned above and to settle the following difficulties which are particularly pertinent in the nuclear power plant field :
(1) Enormous amounts of field maintenance data and technical information are obtained from a large number of components in a broad variety of types.
(2) Nuclear facility components are required to have greater reliability than those in other industries, so relatively little failure data are available.
(3) The decision making process in PM planning, as now carried out by experts based on their heuristic knowledge, has not yet been fully studied.
To settle these difficulties, there is a need to study the following aspects of PM planning support:
(1) A systematic and effective method for managing components/parts design information and field maintenance data
(2) A method for estimating component aging based on a statistical analysis of field maintenance data
(3) A method for providing PM planning guidance using estimated component reliability /performance parameters and decision tree analysis.
In line with this need, component aging estimation techniques were studied and two categories of field maintenance data management approaches were proposed<">, as described in Chap. II. One manages "general maintenance data", or common data which are independent from the individual component category. The other manages "specific maintenance data", or specific data dependent on individual component category. Two kinds of MMSS were then developed, corresponding to the above two approaches. The first, described in Chap. ill, is the Equipment and parts Maintenance Information Control System (EMICS).
The other, in Chap. IV, is the Control Rod Drive-PM Planning Support System (CRD
PMPSS). The purpose of these systems is to provide PM planning guidance through field maintenance data analysis.
The EMICS focuses on the management of general maintenance data, such as that covering normal/unscheduled replacements or inspections, records of all major components/ parts, and any degradation symptoms. It should be noted that these kinds of data do not take individual component categories into account, so the data can be collected and managed using common data handling techniques<•H•l.
The CRD-PMPSS, on the other hand, manages specific maintenance data which characterize individual components' performance, such as accelerated parts aging test data and component process data, e.g. flow rates and drive time(9).
In a previous paper, the development of EMICS was described< 1"l. In this paper, two systems EMICS and CRD-PMPSS are described to demonstrate the importance of the two data management approaches. The functions of both MMSSs are verified using simulated maintenance data.
ll. COMPONENT AGING ESTIMATION TECHNIQUES
In this chapter, a general description of
-70-
Dow
nloa
ded
by [
Uni
vers
ity o
f Il
linoi
s C
hica
go]
at 2
0:57
27
Oct
ober
201
4
Vol. 28, No. 11 (Nov. 1991) TECHNICAL REPORT (S. Shimizu et al.) 1043
component aging estimation techniques is given, followed by an explanation of the two MMSSs.
1. Component Aging Estimation In order to consider methods for estimating
component aging, a component aging model should be studied first.
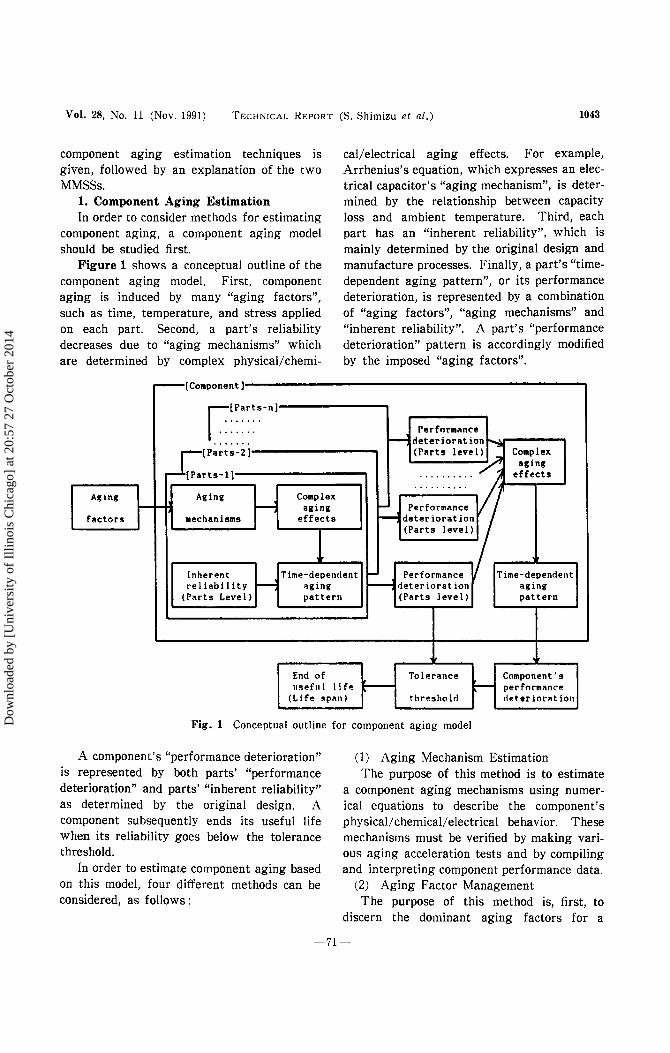
Figure 1 shows a conceptual outline of the component aging model. First, component aging is induced by many "aging factors", such as time, temperature, and stress applied on each part. Second, a part's reliability decreases due to "aging mechanisms" which are determined by complex physical/chemi-
cal/electrical aging effects. For example, Arrhenius's equation, which expresses an electrical capacitor's "aging mechanism", is determined by the relationship between capacity loss and ambient temperature. Third, each part has an "inherent reliability", which is mainly determined by the original design and manufacture processes. Finally, a part's "timedependent aging pattern", or its performance deterioration, is represented by a combination of "aging factors", "aging mechanisms" and "inherent reliability". A part's "performance deterioration" pattern is accordingly modified by the imposed "aging factors".
-----[Component]--------------------------------------------------~
~~~~~~~-n] rerform~tnce
[Parts-2]---------...., ~ deterior11t ion ...._'":11-.r-------....,
(Parts level) ~ Complex -'' aging
[ Parts-1]-------------.,
''''"::.::.· ~ ,,,,,,, Aging Aging
factors mechanisms - Complex
aging effects
1 ~ deterioration
(Parts level)
lnher~nt Tim~-dependent Performance ~deterioration
(Parts level)
Time-dependent aging pattern
reliability ~ aging (Parts Level) pattern
End of Tolerance Component's E-- perfnrm~ncP.
deterior~tion
nseful I if~ !----(Life sp~nl threshold
Fig. 1 Conceptual outline for component aging model
A component's "performance deterioration" is represented by both parts' "performance deterioration" and parts' "inherent reliability" as determined by the original design. A component subsequently ends its useful life when its reliability goes below the tolerance threshold.
In order to estimate component aging based on this model, four different methods can be considered, as follows :
(1) Aging Mechanism Estimation The purpose of this method is to estimate
a component aging mechanisms using numerical equations to describe the component's physical/chemical/electrical behavior. These mechanisms must be verified by making various aging acceleration tests and by compiling and interpreting component performance data.
(2) Aging Factor Management The purpose of this method is, first, to
discern the dominant aging factors for a
-71-
Dow
nloa
ded
by [
Uni
vers
ity o
f Il
linoi
s C
hica
go]
at 2
0:57
27
Oct
ober
201
4
1044 TECHNICAL REPORT (S. Shimizu et a/.) ]. Nucl. Sci. Techno! ..
component/part, such as ambient temperature, humidity, or stress, and, second, to manage their history and component's operating records.
(3) Performance Parameters Monitoring The purpose of this method is, first, to
determine the component performance parameters which well represent its deterioration, and, second, to monitor their deterioration patterns with respect to time.
(4) Reliability Parameters Evaluation The purpose of this method is to evaluate
the component reliability parameters based on statistical analysis of field maintenance data, including normal/unscheduled parts replacement/overhaul data, the time between replacements/overhauls, deterioration modes, and deterioration seriousness.
In the above four methods, (1) and (2) demand relatively high development costs to manage the aging factors and to verify the
developed aging models. Hence, these methods are applicable only for a few very important components at the current technological level. On the other hand, methods (3) and (4) can be applied to the estimation of component aging in relatively simple and practical ways. Therefore, in the present paper, methods (3) and (4) are examined.
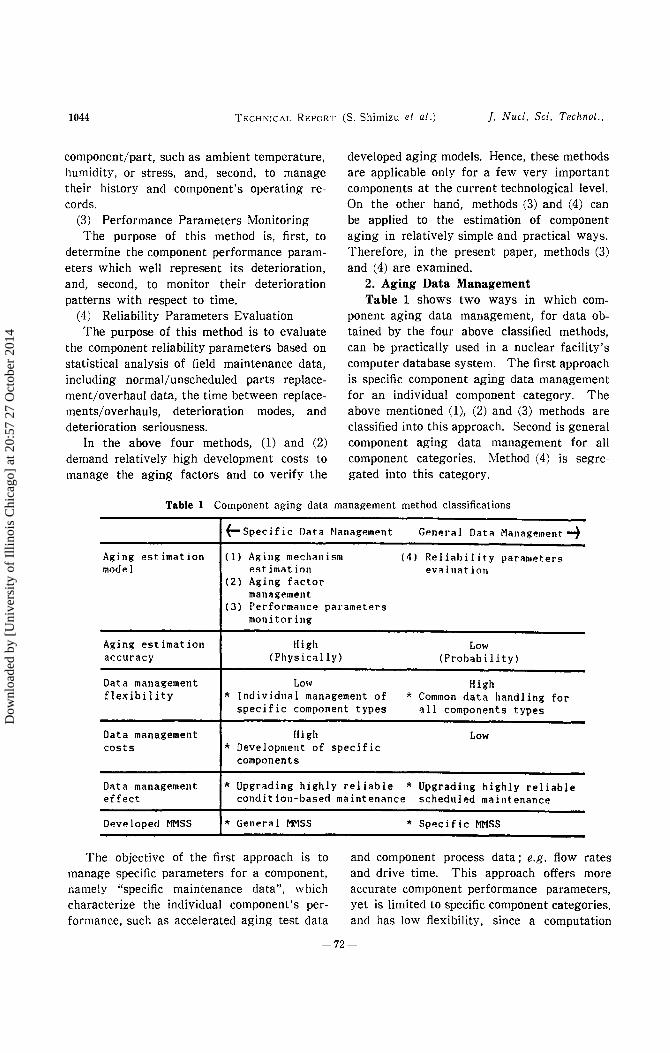
2. Aging Data Management Table 1 shows two ways in which com
ponent aging data management, for data obtained by the four above classified methods, can be practically used in a nuclear facility's computer database system. The first approach is specific component aging data management for an individual component category. The above mentioned (1), (2) and (3) methods are classified into this approach. Second is general component aging data management for all component categories. Method (4) is segregated into this category.
Table 1 Component aging data management method classifications
f- Specific Ll<1ta ~lanagement Gene1·a1 Data Management -7 Aging est ilnat ion ( 1) Aging mechanism (4) Reliability paramete1·s model estimation ev<~luation
(2) Aging factor management
(3) Perfot'mitnce pa1·ameters monitoring
Aging estimation High Low accut·acy (Physically) (Probability)
Data management LOI~ High flexibility * Individual man<~gement of * Common data handling for
specific component types all components types
Data management High Low costs * Development of specific
components
Data management * Upgrading highly reliable * Upgrading highly reliable effect condition-based maintenance scheduled maintenance
Developed ~1MSS * Generitl MMSS * Specific MMSS
The objective of the first approach is to manage specific parameters for a component, namely "specific maintenance data", which characterize the individual component's performance, such as accelerated aging test data
and component process data; e.g. flow rates and drive time. This approach offers more accurate component performance parameters, yet is limited to specific component categories, and has low flexibility, since a computation
-72-
Dow
nloa
ded
by [
Uni
vers
ity o
f Il
linoi
s C
hica
go]
at 2
0:57
27
Oct
ober
201
4
Vol. 28, No. 11 (Nov. 1991) TECHNICAL REPURT (S. Shimizu et a!.) 1045
method must be developed for each individual component category. This leads to high development costs.
The objective of the second approach is to manage a component's "general maintenance data", such as normal/unscheduled replacement data, overhaul/inspection data, and deterioration modes. This approach is based on a statistical analysis on field maintenance data, and provides component reliability parameters, such as failure rates, mean time between failures (MTBF), and failure distributions. This approach, therefore, has high flexibility, and also has the advantage of lower development costs.
the two component aging data management approaches mentioned above, two MMSSs, namely the EMICS and the CRD-PMPSS, will be explained in Chaps. III and IV.
ill. GENERAL MAINTENANCE
MANAGEMENT SUPPORT
SYSTEM
This chapter describes an outline of EMICS -an example of general maintenance data management.
1. EMICS System Outline
In order to validate the effectiveness of
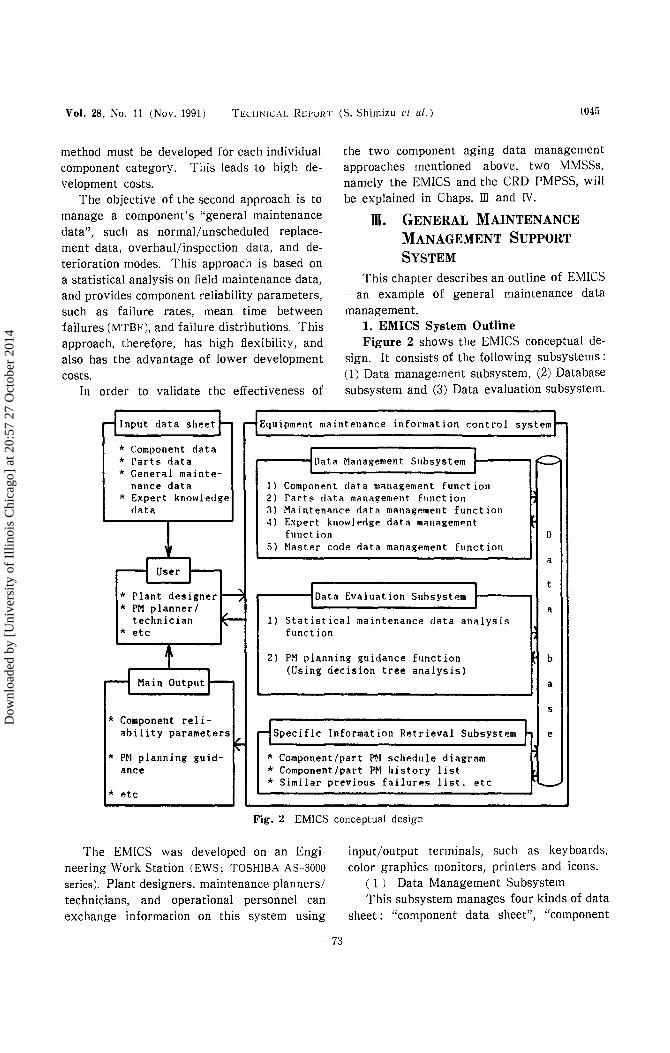
Figure 2 shows the EMICS conceptual design. It consists of the following subsystems: (1) Data management subsystem, (2) Database subsystem and (3) Data evaluation subsystem.
r1 Input data sheet} rlEquipment maintenance information control system~ * Component data I I * Parts data 1Data Management Subsystem I ,c::; * General mainte-
nance data l) Component data management function * Expert kn01~ledge 2) Parts data management function
d11ta 3) ~lainten11nce rl11ta management function 4) Expert know)Pcige data m111111gemPnt
function D 5) Naster code data management function
r-{ User l- a
~ I Evaluation Subsystem ~
t * Plant designer , 1oata * PM planner/
~ a
technician 1) Statistical maintenance data analysis * etc function
t 2) PM planning guidance function b
r4 Main Outpu~ (Using decision tree analysis)
a
s * Component reli-
rispecific Information Retrieval Subsystem ~ ability parameters~ e
* P~l planning guid- ~ * Component/part PN schedule diagram ance * Component/part PM history list
* Similar previous failures 1 i st. etc .............. * etc
Fig. 2 EMICS conceptual design
The EM!CS was developed on an Engineering Work Station (EWS; TOSHIBA AS-3000
series). Plant designers, maintenance planners/ technicians, and operational personnel can exchange information on this system using
input/output terminals, such as keyboards, color graphics monitors, printers and icons.
( 1) Data Management Subsystem This subsystem manages four kinds of data
sheet: "component data sheet", "component
-73-
Dow
nloa
ded
by [
Uni
vers
ity o
f Il
linoi
s C
hica
go]
at 2
0:57
27
Oct
ober
201
4
1046 TECHNICAL REPORT (S. Shimizu et a[.) j. Nucl. Sci. Techno!.,
parts data sheet", "general maintenance data sheet" and "expert knowledge data sheet". The last sheet is an extension of the Failure Mode, Effects and Criticality Analysis (FME/
CA) sheet. It not only manages failures and their consequences, but also contains broad PM planning information, such as failure detectability and the maintenability for each failure mode.
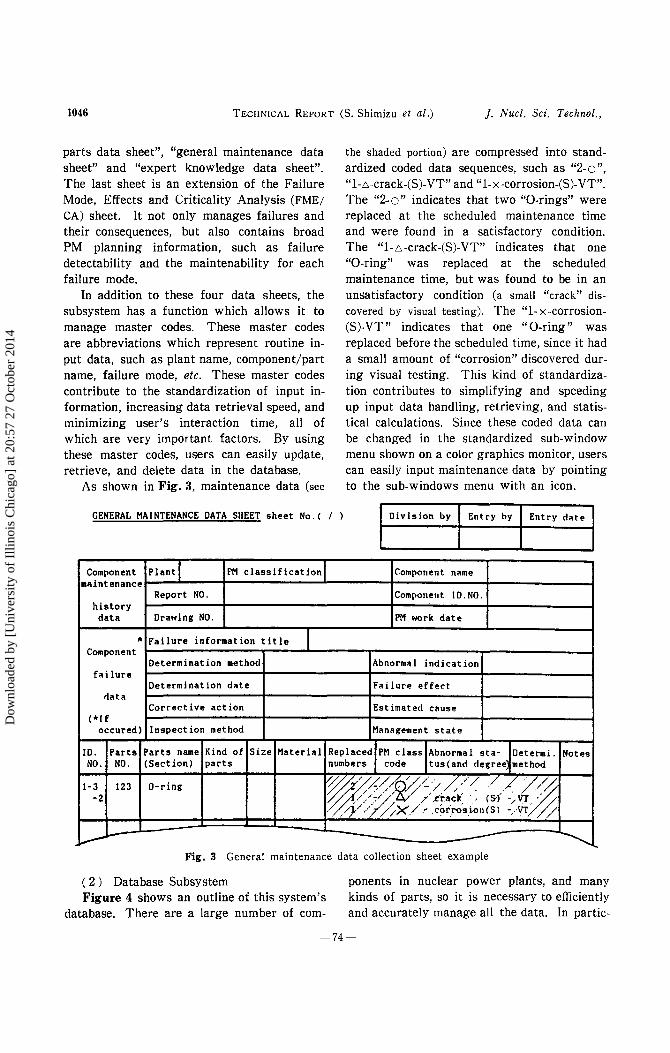
In addition to these four data sheets, the subsystem has a function which allows it to manage master codes. These master codes are abbreviations which represent routine input data, such as plant name, component/part name, failure mode, etc. These master codes contribute to the standardization of input information, increasing data retrieval speed, and minimizing user's interaction time, all of which are very important factors. By using these master codes, users can easily update, retrieve, and delete data in the database.
As shown in Fig. 3, maintenance data (see
the shaded portion) are compressed into standardized coded data sequences, such as "2-o", "1-,:,-crack-(S)-VT" and "1-x-corrosion-(S)-VT". The "2-o" indicates that two "0-rings" were replaced at the scheduled maintenance time and were found in a satisfactory condition. The "1-,:,-crack-(S)-VT" indicates that one "0-ring" was replaced at the scheduled maintenance time, but was found to be in an unsatisfactory condition (a small "crack" dis
covered by visual testing). The "1- x -corrosion(S)-VT" indicates that one "0-ring" was replaced before the scheduled time, since it had a small amount of "corrosion" discovered during visual testing. This kind of standardization contributes to simplifying and speeding up input data handling, retrieving, and statistical calculations. Since these coded data can be changed in the standardized sub-window menu shown on a color graphics monitor, users can easily input maintenance data by pointing to the sub-windows menu with an icon.
GENERAL MAINTENANCE DATA SIIEET sheet No.( I Division by Entry by Entry date
Component Plant I PM classification Component name maintenance
Report NO. Component ID.NO. history data Drawing NO. PM work date
* Failure information title I Component Determination method Abnormal indication
failure Determination date FailurP. effect
<lata Corrective action Estimated cause
(*If occured) Inspection method Management state
ID. Parts Parts name Kind of Size Material Replaced,PM class,Abnormal sta-e~Determi. Notes NO. NO. (Section) parts numbers code tus(and degree method
1-3 123 0-ring ~ / ~;:--<~(~~:~>~,>./:/( ./_./ ./<~ -2 ~/ ·)// · 7 .c·rack · (5-) - VT · ~
· /}// /;X/.• col'_ro'sion(S) <.vr;0/
~- -........ Fig. 3 General maintenance data collection sheet example
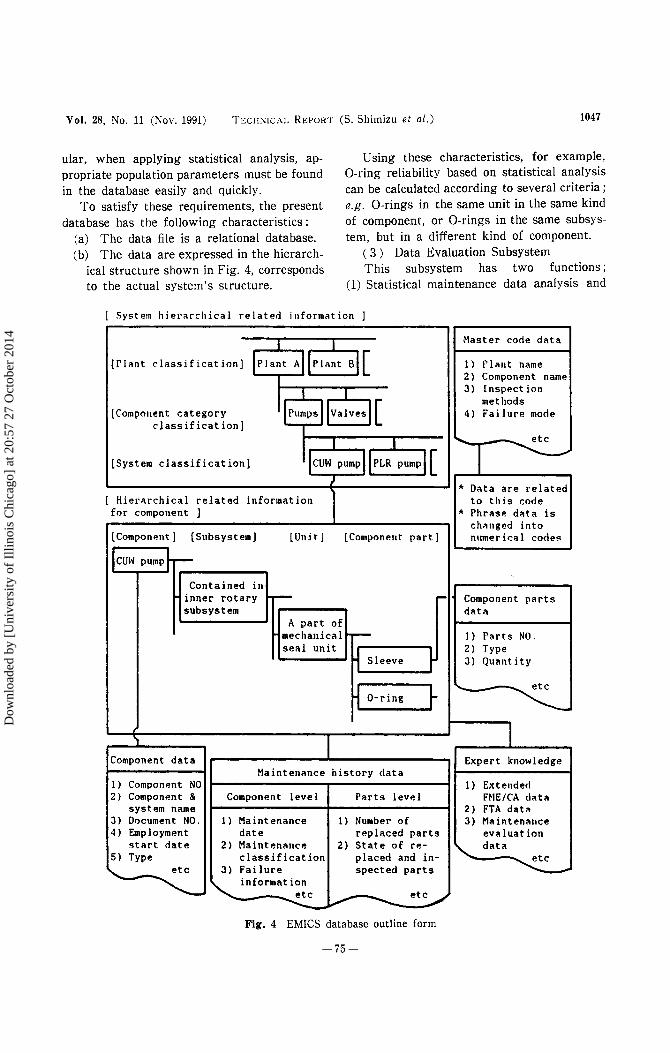
( 2 ) Database Subsystem Figure 4 shows an outline of this system's
database. There are a large number of com-
ponents in nuclear power plants, and many kinds of parts, so it is necessary to efficiently and accurately manage all the data. In partie-
-74-
Dow
nloa
ded
by [
Uni
vers
ity o
f Il
linoi
s C
hica
go]
at 2
0:57
27
Oct
ober
201
4
Vol. 28, No. 11 (Nov. 1991) Tscl!NICAL REPORT (S. Shimizu et al.) 1047
ular, when applying statistical analysis, appropriate population parameters must be found in the database easily and quickly.
To satisfy these requirements, the present database has the following characteristics:
(a) The data file is a relational database. (b) The data are expressed in the hierarch
ical structure shown in Fig. 4, corresponds to the actual system's structure.
Using these characteristics, for example, 0-ring reliability based on statistical analysis can be calculated according to several criteria ; e.g. 0-rings in the same unit in the same kind of component, or 0-rings in the same subsystem, but in a different kind of component.
( 3) Data Evaluation Subsystem This subsystem has two functions;
(1) Statistical maintenance data analysis and
[ System hierarchical related information ]
I I Master code data
(Plant classification] lrlant Allrhnt Bl[ 1) Plant name
I 2) Component name
'$ v,:.,.l[ 3) Inspection
methods [Component category 4) Failure mode
classification]
I I I ..... -~ l (System classification] 'lcuw pumpllrLR pump I [ * Data are related
[ HierArchical related information to this code for component l * PhrAse dllt a is
ch11nged into [Component] [Subsystem] [Unit] [Component part] numer it:-a I codes
lcm-1 pump1....-
Contained in inner rotary r-- r- Component parts subsystem dati\
A part of mechanical ~ 1) Parts NO. seal unit
H Sleeve 1 2) Type 3) Quantity
H 0-ring --~
'\ I Component data Expert knowledge
Maintenance history data 1) Component NO 1) Extended 2) Component & Component level Parts level HIE/CA data
system name 2) FTA dat11 3) Document NO. 1) Maintenance 1) Number of 3) Maintenance 4) Employment d~tte replaced parts evaluation
st11rt date 2) Maintenance 2) State of re- data 5) Type classification placed and in- etc
' etc 3) Failure spected parts -- ""-..._ information -- etc .......,-- etc -Fig. 4 EMICS database outline form
-75-
Dow
nloa
ded
by [
Uni
vers
ity o
f Il
linoi
s C
hica
go]
at 2
0:57
27
Oct
ober
201
4
104.8 TECHNICAL REPORT (S. Shimizu et al.) ]. Nucl. Sci. Techno!.,
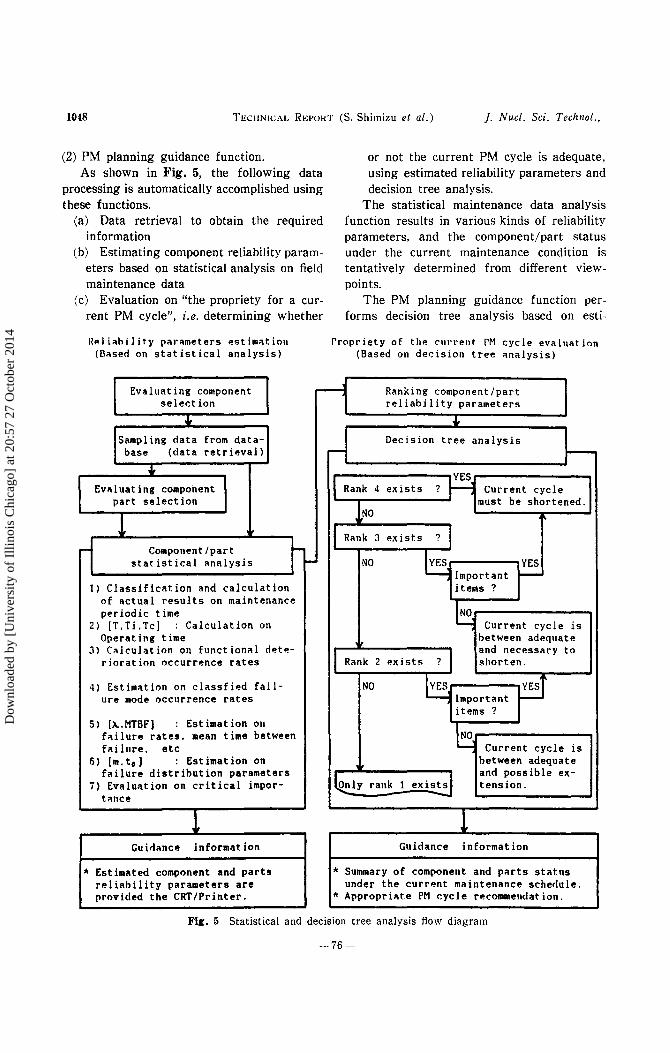
(2) PM planning guidance function. As shown in Fig. 5, the following data
processing is automatically accomplished using these functions.
(a) Data retrieval to obtain the required information
(b) Estimating component reliability parameters based on statistical analysis on field maintenance data
(c) Evaluation on "the propriety for a current PM cycle", i.e. determining whether
R~liahility parameters estimation (Oased on statistical analysis)
or not the current PM cycle is adequate, using estimated reliability parameters and decision tree analysis.
The statistical maintenance data analysis function results in various kinds of reliability parameters, and the component/part status under the current maintenance condition is tentatively determined from different viewpoints.
The PM planning guidance function performs decision tree analysis based on esti-
Propriety of the cunent r~t cyc-le evaluation (Based on decision tree analysis)
Evaluating component I n Ranking component/part I selection reliability parameters ,j, ,j,
Sampling data from data-l Decision tree analysis base (data retrieval)
,j, YES
Ev<ll uat i ng component I l Rank 4 exists ? Cut·rent cycle part selection
!No must be shortened.
! I Rank J exists ?
1-~ Component/part
t:5 statistical analysis NO YES Important t--
1) Classification and calculation items ? of actual results on maintenance
b periodic time 2) [T,Ti.Tc] : Calculation on Current cycle is
Operating time between adequate Jl Calculation on functional clete-
11 Rank 2 and necessary to
rioration occurrence rates exists ? shorten.
4) Estimation on classfied fail- NO 9 F ure mode occurrence rates ~mportant 1tems ?
5) [;~..,MTBF) : Estimation on
b failure rates, mean time between failure, etc Current cycle is
6) [m. t 0 ) : Estimation on between adequate failure distribution parameters
~ly rank 1 and possible ex-
7) Evaluation on critical impor- exists tension. tance ......
! ! GuidancP. information Guidance information
* Estimated component and parts * Summary of component and p<~rts status rP.liability parameters are under the current maintenance schedule. provided the CRT/Printer. * Appropriate PM cycle recommendation.
Fig. 5 Statistical and decision tree analysis flow diagram
-76-
Dow
nloa
ded
by [
Uni
vers
ity o
f Il
linoi
s C
hica
go]
at 2
0:57
27
Oct
ober
201
4
Vol. 28, No. 11 (Nov. 1991) TECIIN!CAL REPORT (S. Shimizu et al.) 1049
mated reliability parameters and decision logic rules. Decision logic rules evaluate component/ part aging states using the estimated reliability parameters. These rules are obtained from experts' heuristic knowledge regarding the judgment on component aging states, and are constructed in the form of a tree structure. This function also evaluates the propriety of the current PM cycle to improve PM maintenance work.
In addition, the present system has several other features, one being a specific information retrieval subsystem. In this subsystem,
the user can retrieve several kinds of specific information, such as component/part PM schedule diagrams/lists, similar previous failures, and failure mode lists (see Fig. 2) by inputting only a few keywords.
2. Basic Techniques ( 1 ) Statistical Analysis on General
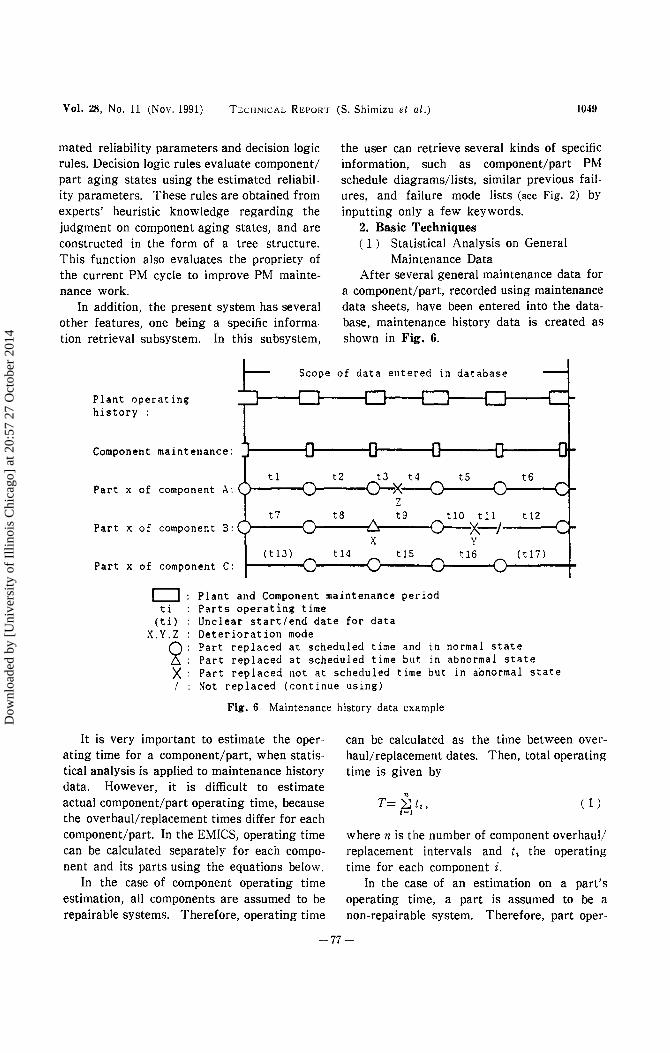
Maintenance Data After several general maintenance data for
a component/part, recorded using maintenance data sheets, have been entered into the database, maintenance history data is created as shown in Fig. 6.
Scope of data entered in database
Plant operating history :
Component maintenance:
Part x of component A:
t12 Part x of component B:
( t 13) (t 17) Part x of component C:
D ti
(ti}
X.Y.Z
2~ X I
Plant and Component maintenance period Parts operating time Unclear start/end date for data Deterioration mode Part replaced at scheduled time and in normal state Part replaced at scheduled time but in abnormal state Part replaced not at scheduled time but in abnormal state Not replaced (continue using)
Fig, 6 Maintenance history data example
It is very important to estimate the operating time for a component/part, when statistical analysis is applied to maintenance history data. However, it is difficult to estimate actual component/part operating time, because the overhaul/replacement times differ for each component/part. In the EMICS, operating time can be calculated separately for each component and its parts using the equations below.
can be calculated as the time between overhaul/replacement dates. Then, total operating time is given by
In the case of component operating time estimation, all components are assumed to be repairable systems. Therefore, operating time
( 1 )
where n is the number of component overhaul/ replacement intervals and ti the operating time for each component i.
In the case of an estimation on a part's operating time, a part is assumed to be a non-repairable system. Therefore, part oper-
-77-
Dow
nloa
ded
by [
Uni
vers
ity o
f Il
linoi
s C
hica
go]
at 2
0:57
27
Oct
ober
201
4
1050 TECHNICAL REPOR1 (S. Shimizu et al.) ]. Nucl. Sci. Techno!.,
ating time can be calculated as the time between replacement dates, and the total operating time is given by
( 2)
where n is the number of replacement intervals, t1 the normal period of use for each component part i, r the number of parts observed to have a failure/degradation, and tc the time between replacement and failure for each failed part c.
Using estimated total operating times, the failure rates and Mean Time Between Failures (MTBF) for components/parts can be evaluated. Estimation on intervals between upper and lower MTBF, based on the fixed time testing plan method, are obtained by a confidence limit calculation using X2-distribution. For example, the lower MTBF can be estimated as,
( 3)
where (MTBF)L is the MTBF for a one-tail lower confidence limit, T the total operating time, X2 the X2-distribution function, and a the significance level.
As shown in Eq. ( 3 ), the important parameter (MTBF)L can be calculated even if no failure data exists, which is quite beneficial since there are only a small amount of component/part failure data available for nuclear power plants.
In a study on component aging, estimating the failure distribution is also important when the time-dependent reliability features are to be understood. Weibull-distribution analysis is generally used to evaluate the component/ part failure distribution. This analysis can be applied when only limited failure data is available. Here, the distribution is expressed as
tm-1 ( t"' f(t)=m--exp --)
to to , ( 4)
where m is the shape parameter and to the scale parameters. The shape parameter indicates the component/part failure distribution characteristics, where m<l.O (initial failure),
m=l.O (random failure), m>l.O (wearout failure). The scale parameter indicates the estimated life span.
( 2 ) Decision Tree Analysis Outline Evaluating the current PM cycle propriety
should be based on component reliability parameters, such as those mentioned above as well as other information, e.g. failure mode, degree of failure, the rate of unscheduled maintenance work per total operating time, and so on. Further, the evaluation on the current PM cycle propriety should also be based on heuristic knowledge about the existing PM task, the degree of a component's importance, and technical specification limits. These evaluation are now carried out by experts' judgment, based on a combination of their heuristic knowledge and the component reliability parameters. Therefore, in order to provide appropriate PM planning guidances, it is necessary to develop a new method which can express the judgments in some regular form of rules. In the present study, decision tree analysis--one of decision making techniques -is applied to express the above judgments in the form of decision logic rules.
In the analysis method proposed, the estimated reliability parameters, as shown in Fig. 5, are ranked into four levels, corresponding to the current PM cycle propriety, as follows:
[Rank 4] Current PM cycle should be shortened.
[Rank 3] Current PM cycle is adequate. [Rank 2] Current PM cycle is between
adequate and may possibly be extended.
[Rank 1] Current PM cycle could be extended.
The choice of a particular rank is made by individual threshold values which are determined by experts. A ranking based on Weibull analysis, for example, is determined by comparing the estimated shape parameter (m) with the threshold values ([Rank 4] m> 1.8; [Rank 3] 1.8>m>l.3; [Rank 2] 1.3>m> 0.7; [Rank 1] 0.7>m). When the pertinent failure data amount is too small, then the corresponding rule is omitted from the deci-
-78-
Dow
nloa
ded
by [
Uni
vers
ity o
f Il
linoi
s C
hica
go]
at 2
0:57
27
Oct
ober
201
4
Vol. 28, No. 11 (Nov. 1991) TECHNICAL REPOI{T (5. Shimizu et al.) 1051
sion tree analysis. Threshold values for each estimated reli
ability parameter are also determined based on an expert's knowledge and stored in the database. Here, it should be noted that these threshold values must be carefully adjusted, in order to build up a reliable judgment on the PM cycle propriety.
3. Verification Results and Discussion The EMICS function was verified, using
both the above techniques and also extended FME/CA for the simulated maintenance data from 31 PM cycles of the same kind on 8 pump components. In the verification test, the calculation time was about 3 min, includ-
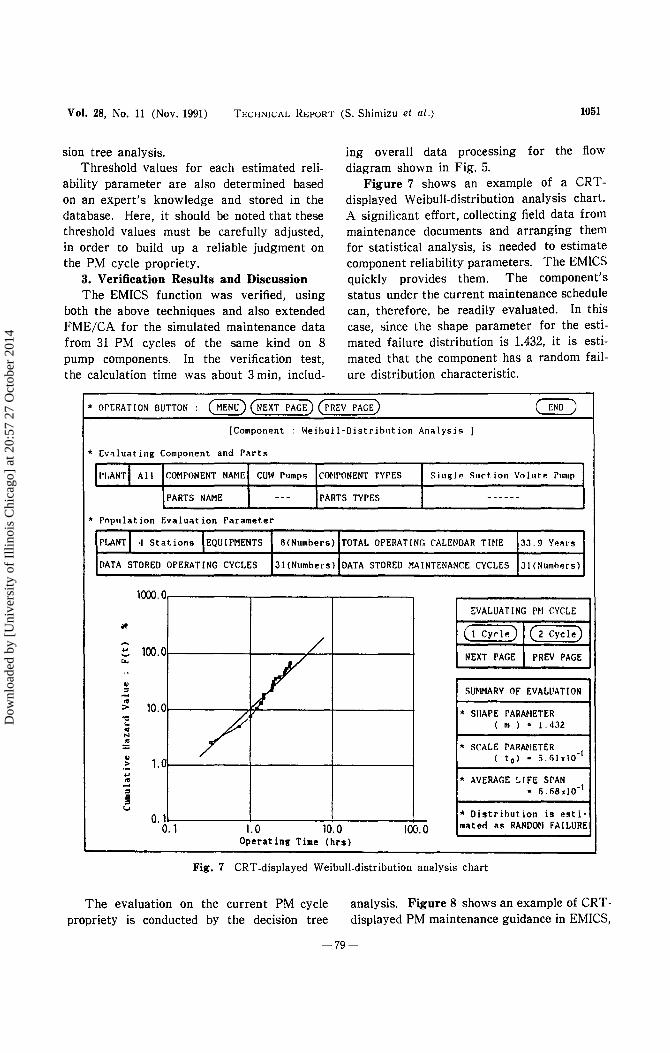
ing overall data processing for the flow diagram shown in Fig. 5.
Figure 7 shows an example of a CRTdisplayed Weibull-distribution analysis chart. A significant effort, collecting field data from maintenance documents and arranging them for statistical analysis, is needed to estimate component reliability parameters. The EMICS quickly provides them. The component's status under the current maintenance schedule can, therefore, be readily evaluated. In this case, since the shape parameter for the estimated failure distribution is 1.432, it is estimated that the component has a random failure distribution characteristic.
* OPERATION BUTTON : ~(NEXT PAGE) (rREV PAGE) ~ [Component : Weibull-Distribution An~ lysis l
* Ev~luatiug Component and Parts
I'I.ANTI All COMPONENT NAME CUI>! rump.; CONPONENT TYPES Sinl!le Snd ion Volutf! runop
PARTS NAME --- PARTS TYPES ------
* Population Evalu~tion Parameter
PLANTI 4 Stations IEQUIPMENTS 8(Numbers) TOTAL OPERATING CALENDAR THIE 33. 9 y.,~t·s
DATA STORED OPERATING CYCLES 31( Numbers l DATA STORED MAINTENANCE CYCLES Jl(NumhP.rs)
1CXX>.O EVALUATING PN CYCLE
¥1 ( 1 Cydf!) ( 2 Cycle)
~ / ~ 100.0 .... v NEXT PAGE PREV PAGE ..
~ SUNMARY OF EVALUATION <U > 10.0 "C
/ * SIIAPE PARMIETER .. ( m ) = I. 432
<U N
~ * SCALE PARMIETER .. 1.11 ( to> • 5.61x!O-l > ... * AVERAGE LIFE SPAN "' - • 6.68•10-l " II
" t.J
0.1 *Distribution is esti-0. 1 1.0 10.0 100.0 mater! as RANDON FAILURE
Operating Time (hrs)
Fig. 7 CRT-displayed Weibull-distribution analysis chart
The evaluation on the current PM cycle propriety is conducted by the decision tree
analysis. Figure 8 shows an example of CRTdisplayed PM maintenance guidance in EMICS,
-79-
Dow
nloa
ded
by [
Uni
vers
ity o
f Il
linoi
s C
hica
go]
at 2
0:57
27
Oct
ober
201
4
1052 TECHNICAL REPORT (S. Shimizu et a/.) ]. Nucl. Sci. Techno!.,
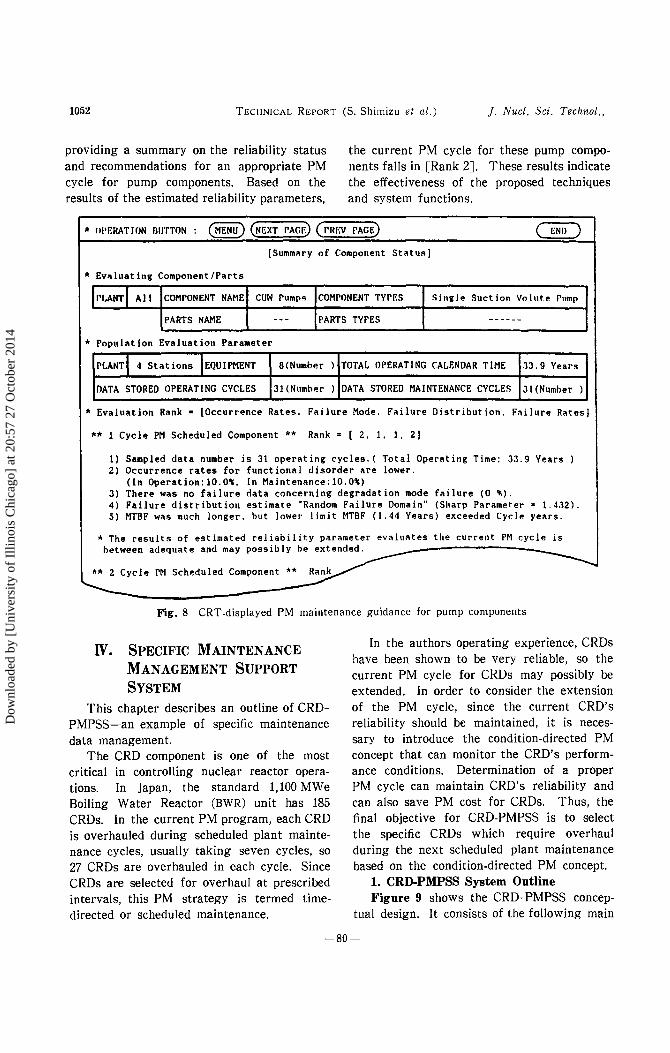
providing a summary on the reliability status and recommendations for an appropriate PM cycle for pump components. Based on the results of the estimated reliability parameters,
the current PM cycle for these pump components falls in [Rank 2]. These results indicate the effectiveness of the proposed techniques and system functions.
* UI'ERAT ION DUTTON : (MENU) (NEXT rAGE) ( PIUW PAGE)
[Summuy of Component Statu"]
* Ev~luating Component/Parts
II'I,ANTI All COMPONENT NAME cuw rump" COMPONENT TYPES Single Suction Volute rump
PARTS NAME --- PARTS TYPES ------
• Population Evaluation Parameter
PLANT! 4 Stations !EQUIPMENT 8(Number ) TOTAL OPERATING CALENDAR TIME .13. 9 Years
DATA STORED OPERATING CYCLES 31 (Number ) DATA STORED MAINTENANCE CYCLES 3l(Number )
*Evaluation Rank a [Occurrence Rates. Failure Mode. Failure Distribution. F<~ilure R~tes)
** 1 Cycle PM Scheduled Component ** Rank= [ 2. 1, 1, 2)
1) Sampled data number is 31 operating cycles. ( Total Operating Time: 33.9 Years ) 2) Occurrence rates for functional disorder are lower.
(In Operation:lO.O~. In Maintenance:lO.O%) 3) There was no failure data concerning degradation mode failure (0 ~). 4) Failure distribution estimate "Random Failure Domain" (Sharp Parameter s 1. 4.12). 5) MTBF was much longer, but lower· I imi t MTBF (I. 44 Years) exceeded Cyc I P. years.
* The results of estimated reliability parameter evaluates the current PM cycle is between adequate and may possibly be extended.
Fig. 8 CRT -displayed PM maintenance guidance for pump components
IV. SPECIFIC MAINTENANCE
MANAGEMENT SUPPORT
SYSTEM
This chapter describes an outline of CRDPMPSS-an example of specific maintenance data management.
The CRD component is one of the most critical in controlling nuclear reactor operations. In Japan, the standard 1,100 MWe Boiling Water Reactor (BWR) unit has 185 CRDs. In the current PM program, each CRD is overhauled during scheduled plant maintenance cycles, usually taking seven cycles, so 27 CRDs are overhauled in each cycle. Since CRDs are selected for overhaul at prescribed intervals, this PM strategy is termed timedirected or scheduled maintenance.
In the authors operating experience, CRDs have been shown to be very reliable, so the current PM cycle for CRDs may possibly be extended. In order to consider the extension of the PM cycle, since the current CRD's reliability should be maintained, it is necessary to introduce the condition-directed PM concept that can monitor the CRD's performance conditions. Determination of a proper PM cycle can maintain CRD's reliability and can also save PM cost for CRDs. Thus, the final objective for CRD-PMPSS is to select the specific CRDs which require overhaul during the next scheduled plant maintenance based on the condition-directed PM concept.
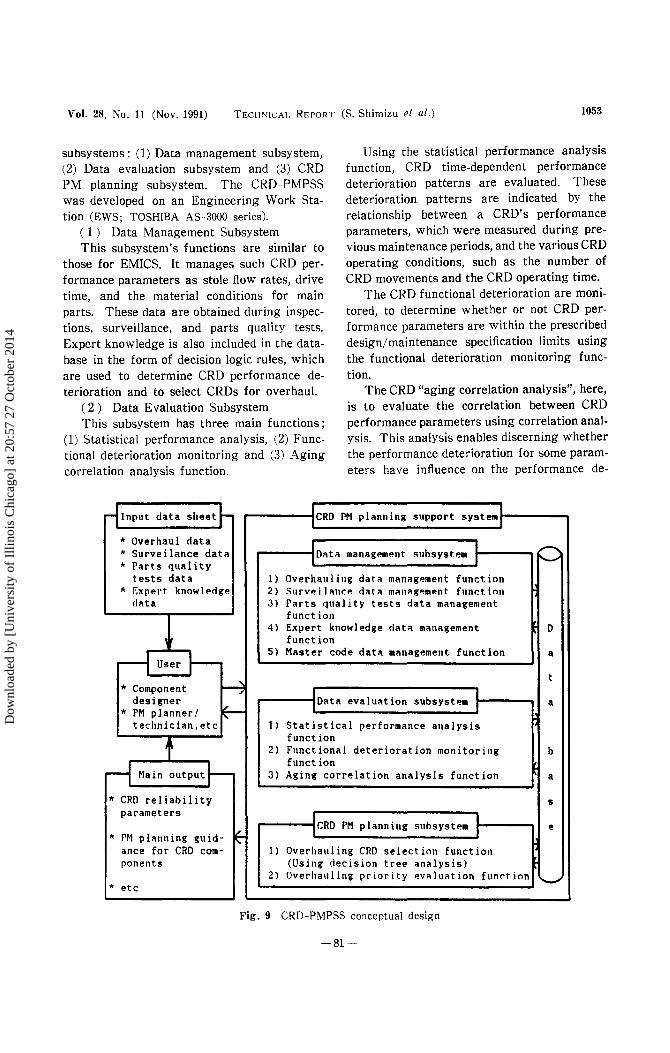
1. CRD-PMPSS System Outline Figure 9 shows the CRD-PMPSS concep
tual design. It consists of the following main
-80-
Dow
nloa
ded
by [
Uni
vers
ity o
f Il
linoi
s C
hica
go]
at 2
0:57
27
Oct
ober
201
4
Vol. 28, No. 11 (Nov. 1991) TEcH"'lCAL REPORT (S. Shimizu et a/.) 1053
subsystems: (1) Data management subsystem, (2) Data evaluation subsystem and (3) CRD PM planning subsystem. The CRD-PMPSS was developed on an Engineering Work Station (EWS; TOSHIBA AS-3000 series).
( 1) Data Management Subsystem This subsystem's functions are similar to
those for EMICS. It manages such CRD performance parameters as stole flow rates, drive time, and the material conditions for main parts. These data are obtained during inspections, surveillance, and parts quality tests. Expert knowledge is also included in the database in the form of decision logic rules, which are used to determine CRD performance deterioration and to select CRDs for overhaul.
( 2 ) Data Evaluation Subsystem This subsystem has three main functions;
(1) Statistical performance analysis, (2) Functional deterioration monitoring and (3) Aging correlation analysis function.
rl Input data sheet~ 1cRD I * Overhaul data
Using the statistical performance analysis function, CRD time-dependent performance deterioration patterns are evaluated. These deterioration patterns are indicated by the relationship between a CRD's performance parameters, which were measured during previous maintenance periods, and the various CRD operating conditions, such as the number of CRD movements and the CRD operating time.
The CRD functional deterioration are monitored, to determine whether or not CRD performance parameters are within the prescribed design/maintenance specification limits using the functional deterioration monitoring function.
The CRD "aging correlation analysis", here, is to evaluate the correlation between CRD performance parameters using correlation analysis. This analysis enables discerning whether the performance deterioration for some parameters have influence on the performance de-
PM planning support I system I
* Surveilance data I I ,....-.... 1oata management subsystem
1 * Parts quality ~
tests data 1) Overhauliug data management function * ExpP.rt know\PcigP. 2) SurvP.ilan~P. rlata managP.ruP.nt function
data 3) Parts quality tests data management
! function
4) Expert knowledge data management D function
~ User 1--- 5) Master code data management function a
~ t
* Component --; I subsystem : designer
~ 1oata evaluation a * PM planner/
technician, etc I' 1) Statistical performance analysis
t function
2) Functional deterioration monitoring b
r--1 Main output~ function
3) Aging correlation analysis function a
* CRD reliability s parameters I planning subsystem }
~ 1cRD PM e * PM planning guid-
ance for CRD com-~
1) Overhauling CRD selection function ponents (Using decision tree analysis)
2) Overhauling priority evaluation function * etc
Fig. 9 CRD-PMPSS conceptual design
-81-
Dow
nloa
ded
by [
Uni
vers
ity o
f Il
linoi
s C
hica
go]
at 2
0:57
27
Oct
ober
201
4
1054 TECHNICAL REPORT (S. Shimizu et a/.) ]. Nucl. Sci. Techno!.,
terioration for other parameters. The CRD aging correlation are evaluated using the aging correlation analysis function.
( 3 ) CRD PM Planning Subsystem This subsystem has two main functions;
(1) Overhaul CRD selection and (2) Overhaul priority evaluation function.
Using these two functions, this subsystem provides PM planning guidance for CRDs, which either are required or are recommended for overhaul during the next scheduled plant maintenance period, and also provides the reasons for their selection. This selection is implemented using decision logic rules and CRD performance ranking. The ranking is determined by comparing the threshold values, which are determined based on technical specifications or expert's heuristics, with the statistical analysis results for the CRD performance parameters.
2. Basic Techniques ( 1 ) Statistical Analysis on Specific
Maintenance Data The statistical analysis functions for the
data evaluation subsystem can provide various kinds of component performance parameters as shown in Figs. 10""' 12.
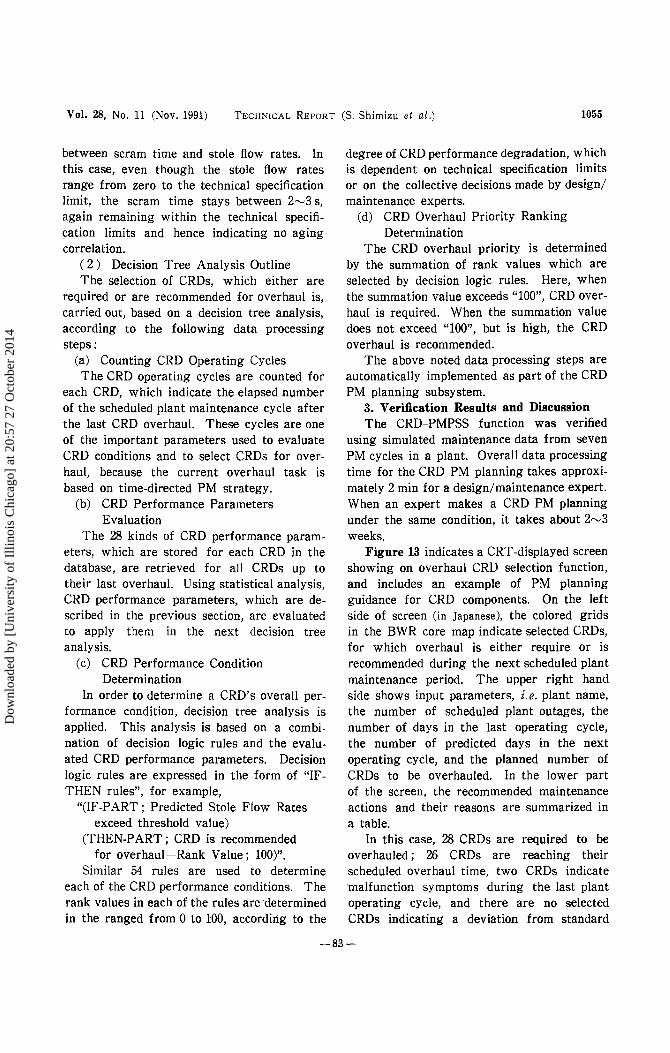
Figure 10 shows an example of a performance deterioration analysis, and indicates the time-dependent pattern for stole flow rates, one of the most important CRD performance parameters. All three predicted values, shown
20.0 Technical specification limits
------------------------t---c
~ I5.0 I 11axiau a~e~ace a1n1•W1 Linear recression line
.. . ~ • "' ~ I 0. 0
;;:
0.0 ~~--~-+--~~--~--~-+--~~ 1978 80 85 1988
Plant Maintenance history
Fig. 10 Performance deterioration analysis example (Stole flow rates timedependent pattern)
in Fig. 10, are determined by linear regression analysis. In this case, no functional deterioration is found in the CRD performance, because all predicted values fall within the technical specification limits for the next plant maintenance period (see the horizontal axis at 1987).
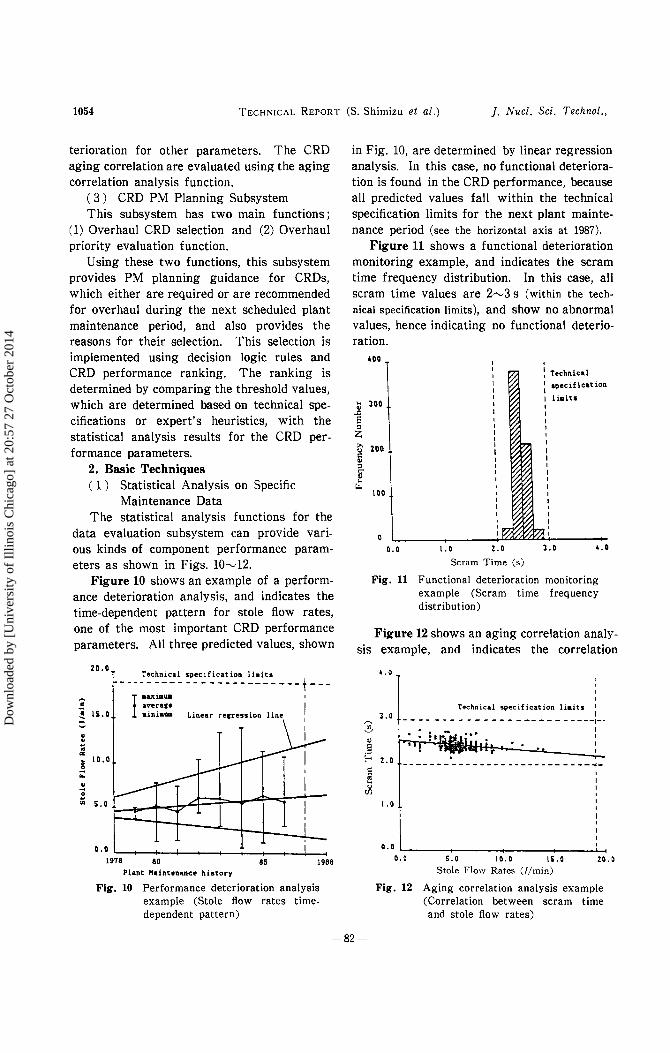
Figure 11 shows a functional deterioration monitoring example, and indicates the scram time frequency distribution. In this case, all scram time values are 2"-'3 s (within the tech
nical specification limits), and show no abnormal values, hence indicating no functional deterioration.
... Ql ~
E " z ;.. u 0: Ql
" Cl" Ql ... ~
400
Technical specification
300 liaits
zoo
100
0. 0 1.0 z. 0 3. 0 4.0
Scram Time (s)
Fig. 11 Functional deterioration monitoring example (Scram time frequency distribution)
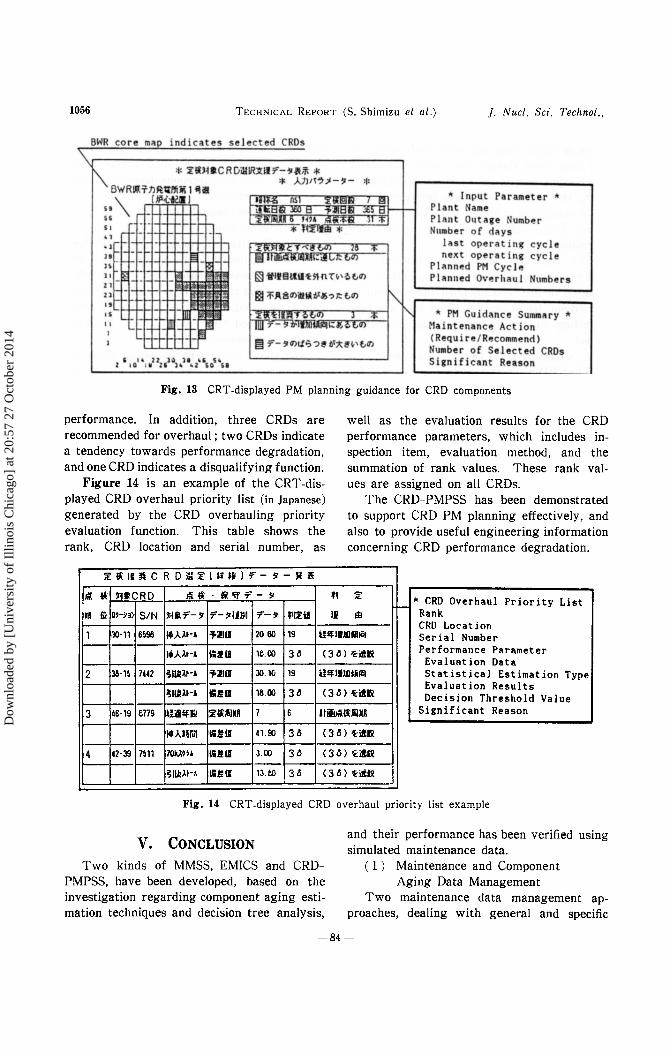
Figure 12 shows an aging correlation analysis example, and indicates the correlation
,....., ~ Ql
E ~ E "' ... u rn
4.0
3. 0
z. 0
1.0
I
Technical specification liaits I I -- -- -- - - - - - - - - - -- -- - - ----·-. ... -. :•.
I ~ .. .. I ,,
I I
---------------------------4-
0.0 ~----~-------+------~----~ 0. 0 s.o 10.0 15.0 20.0
Stole Flow Rates (l/min)
Fig. 12 Aging correlation analysis example (Correlation between scram time and stole flow rates)
-82-
Dow
nloa
ded
by [
Uni
vers
ity o
f Il
linoi
s C
hica
go]
at 2
0:57
27
Oct
ober
201
4
Vol. 28, No. 11 (Nov. 1991) TECHNICAL REPORT (S. Shimizu et al.) 1055
between scram time and stole flow rates. In this case, even though the stole flow rates range from zero to the technical specification limit, the scram time stays between 2""3 s, again remaining within the technical specification limits and hence indicating no aging correlation.
( 2 ) Decision Tree Analysis Outline The selection of CRDs, which either are
required or are recommended for overhaul is, carried out, based on a decision tree analysis, according to the following data processing steps:
(a) Counting CRD Operating Cycles The CRD operating cycles are counted for
each CRD, which indicate the elapsed number of the scheduled plant maintenance cycle after the last CRD overhaul. These cycles are one of the important parameters used to evaluate CRD conditions and to select CRDs for overhaul, because the current overhaul task is based on time-directed PM strategy.
(b) CRD Performance Parameters Evaluation
The 28 kinds of CRD performance parameters, which are stored for each CRD in the database, are retrieved for all CRDs up to their last overhaul. Using statistical analysis, CRD performance parameters, which are described in the previous section, are evaluated to apply them in the next decision tree analysis.
(c) CRD Performance Condition Determination
In order to determine a CRD's overall performance condition, decision tree analysis is applied. This analysis is based on a combination of decision logic rules and the evaluated CRD performance parameters. Decision logic rules are expressed in the form of "IFTHEN rules", for example,
"(IF-PART; Predicted Stole Flow Rates exceed threshold value)
(THEN-PART; CRD is recommended for overhaul-Rank Value; 100)".
Similar 54 rules are used to determine each of the CRD performance conditions. The rank values in each of the rules are determined in the ranged from 0 to 100, according to the
degree of CRD performance degradation, which is dependent on technical specification limits or on the collective decisions made by design/ maintenance experts.
(d) CRD Overhaul Priority Ranking Determination
The CRD overhaul priority is determined by the summation of rank values which are selected by decision logic rules. Here, when the summation value exceeds "100", CRD overhaul is required. When the summation value does not exceed "100", but is high, the CRD overhaul is recommended.
The above noted data processing steps are automatically implemented as part of the CRD PM planning subsystem.
3. Verification Results and Discussion The CRD-PMPSS function was verified
using simulated maintenance data from seven PM cycles in a plant. Overall data processing time for the CRD PM planning takes approximately 2 min for a design/maintenance expert. When an expert makes a CRD PM planning under the same condition, it takes about 2""3 weeks.
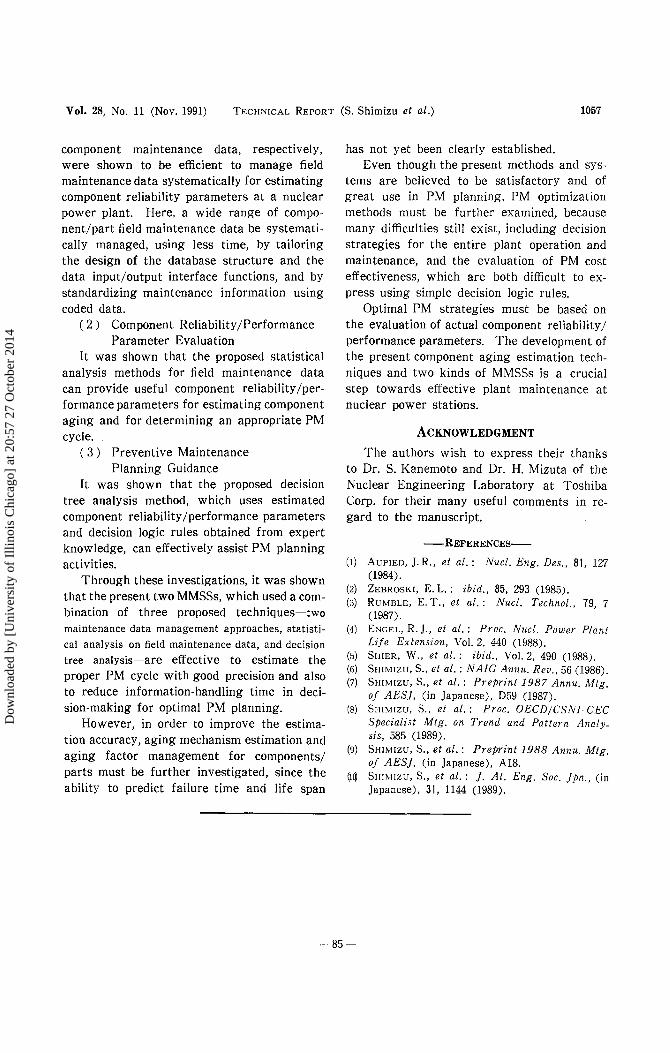
Figure 13 indicates a CRT-displayed screen showing on overhaul CRD selection function, and includes an example of PM planning guidance for CRD components. On the left side of screen (in Japanese), the colored grids in the BWR core map indicate selected CRDs, for which overhaul is either require or is recommended during the next scheduled plant maintenance period. The upper right hand side shows input parameters, i.e. plant name, the number of scheduled plant outages, the number of days in the last operating cycle, the number of predicted days in the next operating cycle, and the planned number of CRDs to be overhauled. In the lower part of the screen, the recommended maintenance actions and their reasons are summarized in a table.
In this case, 28 CRDs are required to be overhauled; 26 CRDs are reaching their scheduled overhaul time, two CRDs indicate malfunction symptoms during the last plant operating cycle, and there are no selected CRDs indicating a deviation from standard
-83-
Dow
nloa
ded
by [
Uni
vers
ity o
f Il
linoi
s C
hica
go]
at 2
0:57
27
Oct
ober
201
4
1056 TECHNICAL REPORT (S. Shimizu et a/.) ]. Nucl. Sci. Techno!.,
Fig. 13 CRT-displayed PM planning guidance for CRD components
performance. In addition, three CRDs are recommended for overhaul ; two CRDs indicate a tendency towards performance degradation, and one CRD indicates a disqualifying function.
Figure 14 is an example of the CRT-displayed CRD overhaul priority list (in Japanese)
generated by the CRD overhauling priority evaluation function. This table shows the rank, CRD location and serial number, as
:f f: II )( C R D i!! ~ I ll til l 7 - !i - Jt ~
If~ t* )'JI!CRD Jti.f:·fil'iff"-~
•J m o,_;13" SIN )~J.7-!i 7-!iliMIJ 7-!i n~i4
'~ II
well as the evaluation results for the CRD performance parameters, which includes inspection item, evaluation method, and the summation of rank values. These rank values are assigned on all CRDs.
The CRD-PMPSS has been demonstrated to support CRD PM planning effectively, and also to provide useful engineering information concerning CRD performance degradation.
= .c. * CRD Overhaul Priority List r-IB Rank
CRO Location 1 10·11 M96 Mo.A.Af-A i>JIII 20.60 19 Uif.IIMIIIICiJ Serial Number t- --
2 3/l-1~
3 46·19 -
4 42·39
Performance Parameter l •. A.Af-A C.! II 1e.oo 36 ( 3 6) '(:iltll! Evaluation Data
7U2 ~ILI!Af-A -JJJII 30.10 19 Uif.lllJOtillil Statistical Estimation Type
16.00 36 (36)'(:i!ll! Evaluation Results
~ILIIAI·-A ~UII Decision Threshold Value E779 Ui!i~El :llUJXft 7 6 I tiilu!i.lUIIIft Significant Reason
Mo.A.nr., tlil!ll 41.gj 36 ( 3 6) '(:i!ll!
7~11 1oum lUll 3.00 36 ( 3 ") ~i!ll!
~IIJiAf·A IIi.! II 13.1:0 36 ( 3 6) '(:iltll!
Fig. 14 CRT-displayed CRD overhaul priority list example
V. CONCLUSION and their performance has been verified using simulated maintenance data.
Two kinds of MMSS, EMICS and CRDPMPSS, have been developed, based on the investigation regarding component aging estimation techniques and decision tree analysis,
( 1 ) Maintenance and Component Aging Data Management
Two maintenance data management approaches, dealing with general and specific
-84-
Dow
nloa
ded
by [
Uni
vers
ity o
f Il
linoi
s C
hica
go]
at 2
0:57
27
Oct
ober
201
4
Vol. 28, No. 11 (Nov. 1991) TECHNICAL REPORT (S. Shimizu et al.) 1057
component maintenance data, respectively, were shown to be efficient to manage field maintenance data systematically for estimating component reliability parameters at a nuclear power plant. Here, a wide range of component/part field maintenance data be systematically managed, using less time, by tailoring the design of the database structure and the data input/output interface functions, and by standardizing maintenance information using coded data.
( 2 ) Component Reliability /Performance Parameter Evaluation
It was shown that the proposed statistical analysis methods for field maintenance data can provide useful component reliability /performance parameters for estimating component aging and for determining an appropriate PM cycle.
( 3) Preventive Maintenance Planning Guidance
It was shown that the proposed decision tree analysis method, which uses estimated component reliability /performance parameters and decision logic rules obtained from expert knowledge, can effectively assist PM planning activities.
Through these investigations, it was shown that the present two MMSSs, which used a combination of three proposed techniques-two maintenance data management approaches, statistical analysis on field maintenance data, and decision tree analysis-are effective to estimate the proper PM cycle with good precision and also to reduce information-handling time in decision-making for optimal PM planning.
However, in order to improve the estimation accuracy, aging mechanism estimation and aging factor management for components/ parts must be further investigated, since the ability to predict failure time and life span
has not yet been clearly established. Even though the present methods and sys
tems are believed to be satisfactory and of great use in PM planning, PM optimization methods must be further examined, because many difficulties still exist, including decision strategies for the entire plant operation and maintenance, and the evaluation of PM cost effectiveness, which are both difficult to express using simple decision logic rules.
Optimal PM strategies must be based on the evaluation of actual component reliability 1 performance parameters. The development of the present component aging estimation techniques and two kinds of MMSSs is a crucial step towards effective plant maintenance at nuclear power stations.
ACKNOWLEDGMENT
The authors wish to express their thanks to Dr. S. Kanemoto and Dr. H. Mizuta of the Nuclear Engineering Laboratory at Toshiba Corp. for their many useful comments in regard to the manuscript.
-REFERENCES-
(!) AUPIED, J. R., et al. : Nucl. Eng. Des., 81, 127 (1984).
(2) ZEBROSKI, E. L.: ibid., 85, 293 (1985). (3) RuMBLE, E. T., et al.: Nucl. Techno!., 79, 7
(1987). (4) ENGEL, R. ]., et al.: Proc. Nucl. Power Plant
Life Extension, Vol. 2, 440 (1988). (5) SillER, W., et al.: ibid., Vol. 2, 490 (1988). (6) SHIMIZU, S., et al.: NAIG Annu. Rev., 56 (1986). (7) SHIMIZU, S., et at.: ?rePrint 1987 Annu. Mtg.
of AES], (in Japanese), D59 (1987). (8) SmMIZU, S., et a!.: Proc. OECD;CSNI-CEC
Specialist Mtg. on Trend and Pattern Analysis, 585 (1989).
(9) SHIMIZU, S., et al.: ?reprint 1988 Annu. Mtg. of AES], (in Japanese), A18.
M SII!MIZU, S., et a!.: ]. At. Eng. Soc. ]pn., (in japanese), 31, 1144 (1989).
-85-
Dow
nloa
ded
by [
Uni
vers
ity o
f Il
linoi
s C
hica
go]
at 2
0:57
27
Oct
ober
201
4
Recommended