N 79/f
EMPLOYEE THEFT: THE RELATIONSHIP OF SHRINKAGE RATES TO JOB
SATISFACTION, STORE SECURITY, AND EMPLOYEE RELIABILITY
THESIS
Presented to the Graduate Council of the
University of North Texas in Partial
Fulfillment of the Requirements
For the Degree of
MASTER OF SCIENCE
By
W. Greg LaFosse
Denton, Texas
August, 1992
LaFosse, W. Greg, Employee Theft: The Relationship of
Shrinkage Rates to Job Satisfaction, Store Security, and
Employee Reliability. Master of Science (Industrial
Organizational Psychology), 101 pp., 3 tables, 6 figures,
references, 31 titles.
The correlation between employee theft and various
employee attitudes is investigated with 489 subjects from a
large discount store chain located in the southeastern
United States. Subjects completed two tests: Personnel
Decisions, Inc. 's Employment Inventory/Customer Service
Inventory which measures employee reliability and
orientation toward providing customer service; and the
Organization Responsiveness Questionnaire which measures
satisfaction and perceived store security. Individual
scores on the tests were correlated with a performance
rating form completed by the subject's supervisor. Scores
were computed for each store and correlated with inventory
shrinkage rates. Results revealed relatively weak
correlations for some variables. The multiple regression
analysis was unable to significantly predict any of the
criterion variables.
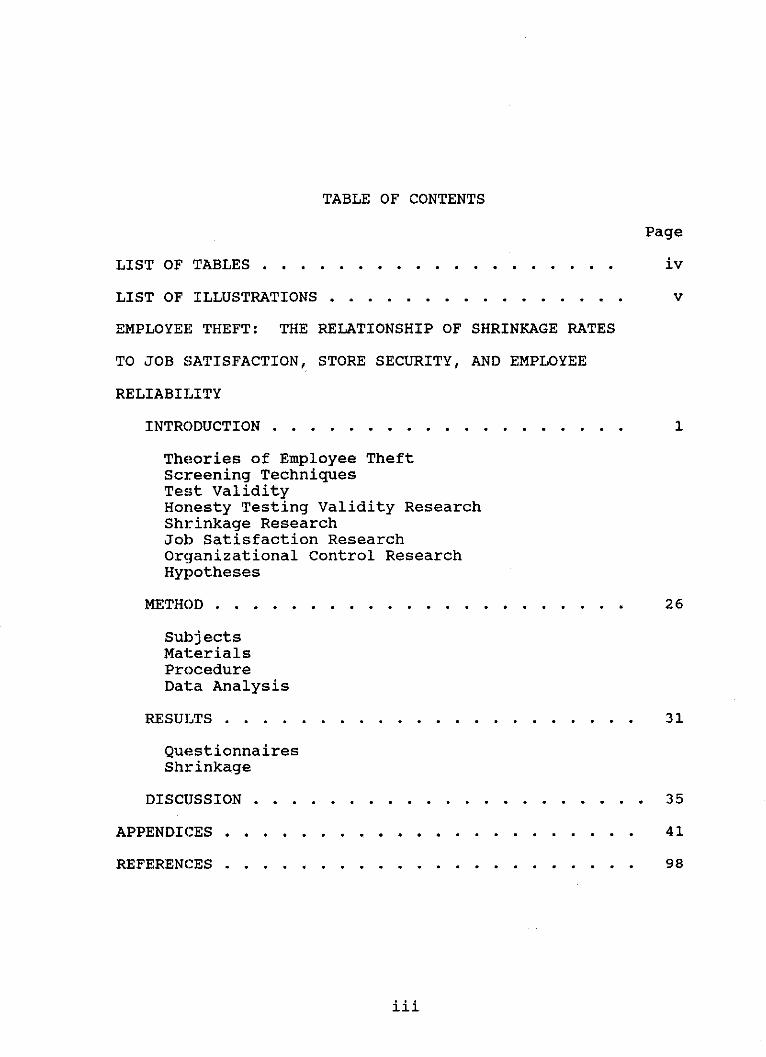
TABLE OF CONTENTS
Page
LIST OF TABLES...... . . . . . . ............ iv
LIST OF ILLUSTRATIONS . . .. . . . . . . . . . . . . v
EMPLOYEE THEFT: THE RELATIONSHIP OF SHRINKAGE RATES
TO JOB SATISFACTION, STORE SECURITY, AND EMPLOYEE
RELIABILITY
INTRODUCTION.. . . . . . ........ 1
Theories of Employee TheftScreening TechniquesTest ValidityHonesty Testing Validity ResearchShrinkage ResearchJob Satisfaction ResearchOrganizational Control ResearchHypotheses
METHOD .. ".. . . . . . . . .. . . . . . ....... 26
SubjectsMaterialsProcedureData Analysis
RESULTS . .. . .. . .. . . . . . . . . . . . . . 31
QuestionnairesShrinkage
DISCUSSION . . .... ......... 35
APPENDICES . .......... . . . . . . .. 41
REFERENCES..... .. .. .......... . . . . . . 98
iii
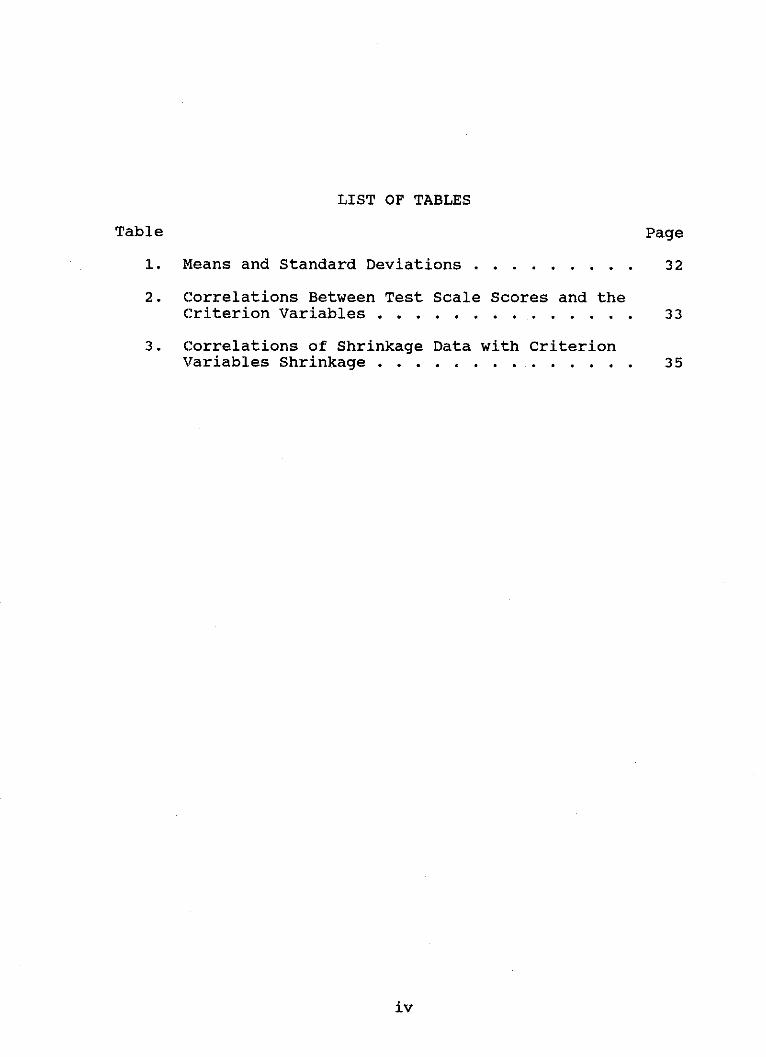
LIST OF TABLES
Table Page
1. Means and Standard Deviations . . . . . . . . . 32
2. Correlations Between Test Scale Scores and theCriterion Variables .............. 33
3. Correlations of Shrinkage Data with CriterionVariables Shrinkage ......................... 35
iv
LIST OF ILLUSTRATIONS
Figure Page
1. Percentage of subjects rated satisfactory onCustomer Service traits by the EI cutscore . . 92
2. Percentage of subjects rated satisfactory onCustomer Service traits by CSI cutscore . . .t 93
3. Percentage of subjects scoring in the top halfof EI behaviors by El outscore . . . . . . . . 94
4. Percentage of subjects scoring in the top halfof EI behaviors by CSI cutscore . . . . . . . . 95
5. Percentage of subjects scoring in the top halfof CSI behaviors by EI cutscore . . . . . . . . 96
6. Percentage of subjects scoring in the top halfof CSI behaviors by CSI cutscore . . . . . . . . 97
v
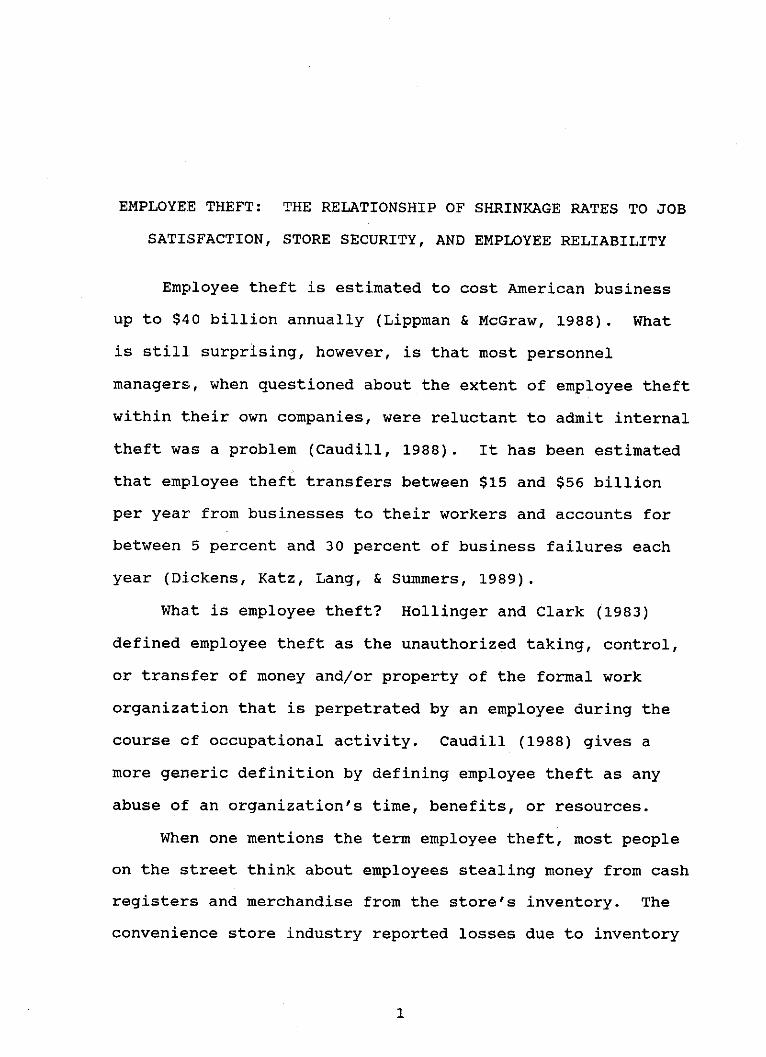
EMPLOYEE THEFT: THE RELATIONSHIP OF SHRINKAGE RATES TO JOB
SATISFACTION, STORE SECURITY, AND EMPLOYEE RELIABILITY
Employee theft is estimated to cost American business
up to $40 billion annually (Lippman & McGraw, 1988). What
is still surprising, however, is that most personnel
managers, when questioned about the extent of employee theft
within their own companies, were reluctant to admit internal
theft was a problem (Caudill, 1988). It has been estimated
that employee theft transfers between $15 and $56 billion
per year from businesses to their workers and accounts for
between 5 percent and 30 percent of business failures each
year (Dickens, Katz, Lang, & Summers, 1989).
What is employee theft? Hollinger and Clark (1983)
defined employee theft as the unauthorized taking, control,
or transfer of money and/or property of the formal work
organization that is perpetrated by an employee during the
course of occupational activity. Caudill (1988) gives a
more generic definition by defining employee theft as any
abuse of an organization's time, benefits, or resources.
When one mentions the term employee theft, most people
on the street think about employees stealing money from cash
registers and merchandise from the store's inventory. The
convenience store industry reported losses due to inventory
1
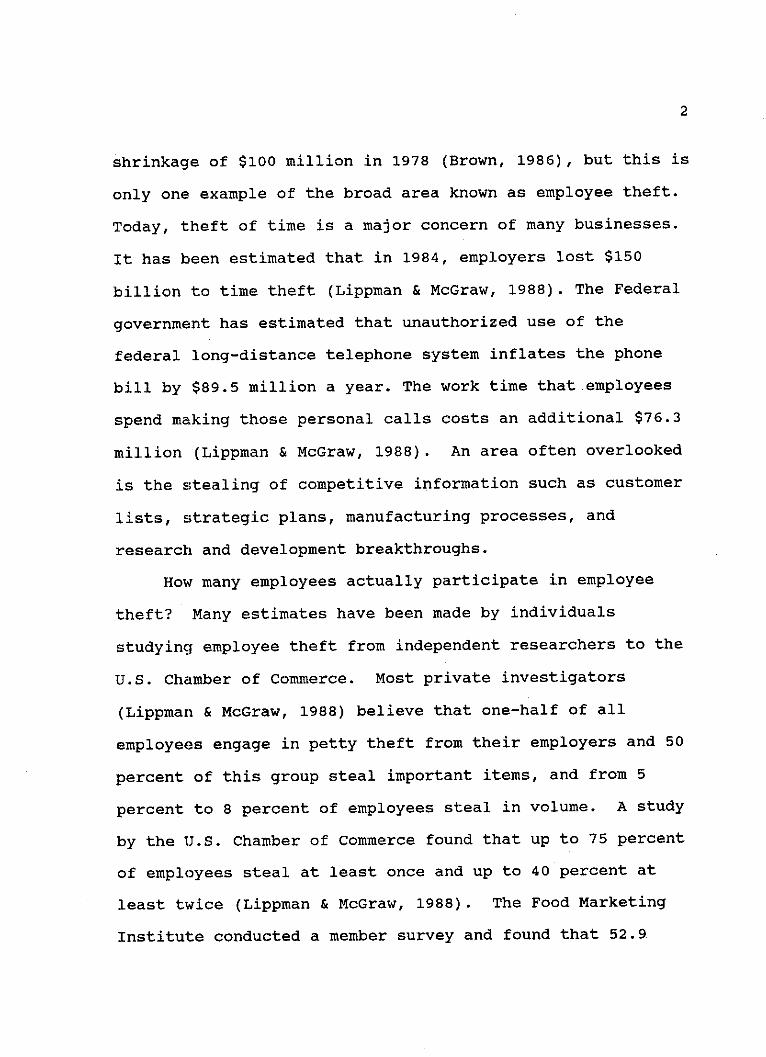
2
shrinkage of $100 million in 1978 (Brown, 1986), but this is
only one example of the broad area known as employee theft.
Today, theft of time is a major concern of many businesses.
It has been estimated that in 1984, employers lost $150
billion to time theft (Lippman & McGraw, 1988). The Federal
government has estimated that unauthorized use of the
federal long-distance telephone system inflates the phone
bill by $89.5 million a year. The work time that employees
spend making those personal calls costs an additional $76.3
million (Lippman & McGraw, 1988). An area often overlooked
is the stealing of competitive information such as customer
lists, strategic plans, manufacturing processes, and
research and development breakthroughs.
How many employees actually participate in employee
theft? Many estimates have been made by individuals
studying employee theft from independent researchers to the
U.S. Chamber of Commerce. Most private investigators
(Lippman & McGraw, 1988) believe that one-half of all
employees engage in petty theft from their employers and 50
percent of this group steal important items, and from 5
percent to 8 percent of employees steal in volume. A study
by the U.S. Chamber of Commerce found that up to 75 percent
of employees steal at least once and up .to 40 percent at
least twice (Lippman & McGraw, 1988). The Food Marketing
Institute conducted a member survey and found that 52.9
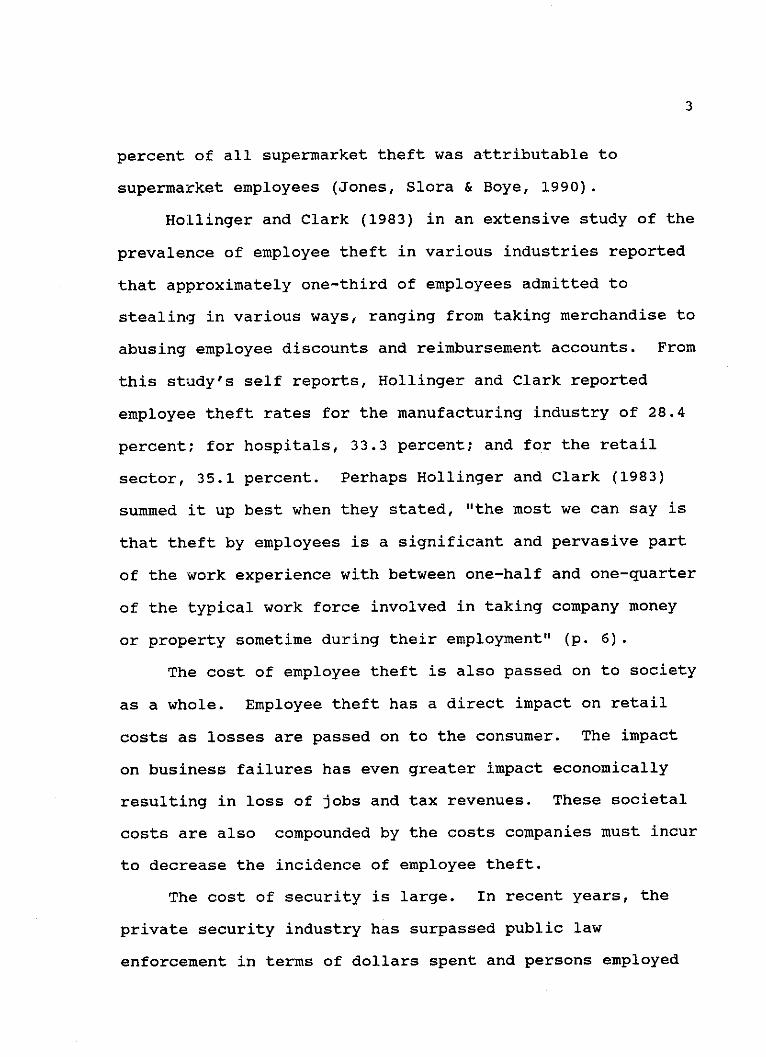
3
percent of all supermarket theft was attributable to
supermarket employees (Jones, Slora & Boye, 1990).
Hollinger and Clark (1983) in an extensive study of the
prevalence of employee theft in various industries reported
that approximately one-third of employees admitted to
stealing in various ways, ranging from taking merchandise to
abusing employee discounts and reimbursement accounts. From
this study's self reports, Hollinger and Clark reported
employee theft rates for the manufacturing industry of 28.4
percent; for hospitals, 33.3 percent; and for the retail
sector, 35.1 percent. Perhaps Hollinger and Clark (1983)
summed it up best when they stated, "the most we can say is
that theft by employees is a significant and pervasive part
of the work experience with between one-half and one-quarter
of the typical work force involved in taking company money
or property sometime during their employment" (p. 6).
The cost of employee theft is also passed on to society
as a whole. Employee theft has a direct impact on retail
costs as losses are passed on to the consumer. The impact
on business failures has even greater impact economically
resulting in loss of jobs and tax revenues. These societal
costs are also compounded by the costs companies must incur
to decrease the incidence of employee theft.
The cost of security is large. In recent years, the
private security industry has surpassed public law
enforcement in terms of dollars spent and persons employed
4
(Parilla, Hollinger & Clark, 1988). In fact, Dickens et al.
(1989) reported a 1987 study by Whitehurst which indicated
that U.s. business spends approximately $12 billion a year
on security products, personnel, and services. This figure
does not even cover the cost to companies which attempt to
screen employees during the preemployment phase. Today, an
estimated 5,000 to 6,000 business establishments use
integrity tests to screen and select job applicants for
nonmanagerial positions (Wiley & Rudley, 1991). Even
companies which only conduct thorough background checks can
end up spending about $150 per applicant (Brown & Pardue,
1985). Attempts to control and reduce losses due to
employee theft include three primary techniques: (a)
apprehension and prosecution of the thief, (b) institution
of security procedures and devices to make theft difficult
or its apprehension easier, and (c) screening employment
applicants in an attempt to identify those who might steal
if employed (Ash, 1971).
Theories of Employee Theft
Employee theft appears to be prevalent in our work
force, but why does an employee steal from their employer?
Hollinger and Clark (1983) identified five separate but
interrelated sets of hypotheses explaining employee theft:
external economic pressures, youth and work, opportunity,
job dissatisfaction, and social control. The most
frequently discussed theory regarding employee theft is
5
based on external economic pressures. This theory proposes
that the employees who steal have gotten themselves into
some type of financial problem. Employees choose taking
things from their employer as a way to get the required
resources to extricate themselves from various financial
dilemmas (Hollinger & Clark, 1983). This explanation is
widely accepted by the private security industry and others
who believe conventional theories of criminality can explain
employee theft.
A second hypotheses explaining employee theft is moral
laxity among a younger work force. The argument is made
that contemporary employees, especially the very young, are
not as hard working or honest as those of past generations
(Hollinger & Clark, 1983). The evidence collected for this
theory has generally been supportive. The experience of
Service Merchandise Company in 1984 is one example. That
year, of the employees caught stealing, 52 percent were
under the age of 21 and only 3 percent were over 40 years of
age (Lippman & McGraw, 1988). When asked why they stole, 52
percent said for "need" or "greed;" 16 percent for "no
reason" or "didn't know;" and 16 percent peer pressure,
opportunity, or because "it was easy." Hollinger and Clark
(1983) questioned whether this was due to a genuine
difference in morality or simply a by-product of the type of
work that is required of younger employees. Younger
employees tend to be in part-time or minimum wage positions
6
with little prestige or benefits. This situation does not
tend to foster company loyalty and could place the company
in a more vulnerable position.
A third hypothesis for employee theft is opportunity.
This theory is more pessimistic in that it is based on the
assumption that people are basically greedy and dishonest by
nature, with larcenous tendencies lurking only barely
beneath the surface (Hollinger & Clark, 1983). With this
theory the only way to reduce employee theft is to limit the
opportunity in the work place. This is usually accomplished
through increased security measures. Unfortunately, most
overt security controls are designed to catch shoplifters
not employees. This is primarily due to the fact employees
are aware of these controls and know how to avoid them.
Therefore, most security activities should seek to instill
the perception that internal theft will ultimately result in
apprehension and punishment (Parilla et al, 1988). Caudill
(1988) feels that misplaced trust by many supervisors
results in higher employee theft rates. The supervisors
trust employees with cash, records, keys and safe
combinations, thus giving employees an excellent, reasonably
risk-free opportunity to steal.
The final two theories look at the possible role the
organization plays in employee theft. While the preceding
theories have looked at the employees background or other
external conditions for an explanation of employee theft,
7
these theories propose that the victimized organization may
play a part in determining the level of theft behavior of
its own employees (Hollinger & Clark, 1983). The first of
these theories emphasizes the role of the employee's
perceived level of dissatisfaction with the job. Greenberg
(1990) claims that workers who believe that the rewards they
are receiving from the organization, relative to the
contributions they are making, are less than they should be
may respond by attempting to raise their outcomes, that is,
steal from their employers. Greenberg (1990) cited research
in the area of procedural justice which has shown the
perceptions of fair treatment and outcomes depend not only
on the relative level of one's outcomes but also on the
explanations given for those outcomes. He summarized
current research data which seemed to indicate that decision
outcomes and procedures were better accepted when (a) people
were assured that higher authorities were sensitive to their
viewpoints, (b) the decision was made without bias, (c) the
decision was applied consistently, (d) the decision was
carefully justified on the basis of adequate information,
(e) the decision makers communicated their ideas honestly,
and (f) persons influenced by the decisions were treated in
a courteous and civil manner.
The fifth hypothesis identified by Hollinger and Clark
(1983) is a social control theory of employee theft. Social
control theory suggests that employee theft exists due to
8
broadly shared informal and formal social structures that
have developed over time. Basically the work group, along
with supervisors, plays a controlling role by constraining
or encouraging theft behaviors. They, in effect, set the
limits on what is acceptable and define what activities
constitute employee theft (Taylor & Cangemi, 1979). These
work groups also can exercise informal sanctions on the
employee. This could actually serve as a form of deterrence
in that deviant work place behaviors can be prevented by the
threat of negative social sanctions by the work group.
Three critical variables must be in place for this to work:
certainty, severity, and celerity of punishment (Hollinger &
Clark, 1983). The perception of these three variables will
determine the employee's views on the likelihood of
sanctions if detected and punished. One could conclude that
employees who see the threat of sanctions as low should they
be detected will be more likely to become involved in
employee theft.
Screening Techniques
Many businesses have seen the need to screen applicants
for attitudes toward theft and have been doing so for many
years. Many techniques have developed over these years,
with three primary means most commonly used. These are the
use of polygraphs, background checks, and integrity tests.
Polygraphs are designed to measure a person's
physiological response to various questions and is commonly
9
referred to as a "lie detector test." The polygraph has
been around for many years, but its reliability has been
questioned from the onset (Waid & Orne, 1980; Honts, Hodes &
Raskin, 1985). Many states enacted their own polygraph laws
which limited the use of the polygraph. In 1988, under
pressure by various groups, the federal government enacted
legislation to limit the use of the polygraph. The Employee
Polygraph Protection Act (1988), which was signed into law
on June 27, 1988, prohibits private employers from requiring
or requesting preemployment polygraph exams. The act does
exempt security firms and firms manufacturing controlled
substances.
Polygraph exams are allowed for current employees, but
under very restricted circumstances. The test can be
administered as part of an ongoing investigation involving
economic loss or injury to the employer's business, such as
theft, embezzlement, or misappropriation. The employer must
document the circumstances which lead to the polygraph exam.
The employer must also inform the employee, in advance, of
the specific incident leading to the investigation, why the
employee is suspected and what questions will be asked. The
polygraph exam must last at least 90 minutes and the
examiner's conclusions must be in writing and based solely
on the test charts. The report can include no information
other than admissions, information, case facts, and
interpretation of the charts relevant to the purpose and
10
stated objectives of the test. The report can not include
recommendations concerning the employment of the examinee.
A copy of the report must be provided to the employee before
any adverse employment actions are taken. This act has
greatly reduced the use of the polygraph in the employment
setting and forced many companies to seek alternative means
of preemployment screening.
Background checks, a common practice in many
organizations, are conducted by telephone, mail and field
inquiries to former employers, credit bureaus, and police
agencies (Rosenbaum, 1976). But as Ash (1971) noted,
background checks are often incomplete and never detect the
previously unapprehended. Background checks and polygraphs
have similar disadvantages in that they lack standardized
procedures (Brown, Jones, Terris & Steffy, 1987). Ash
(1971) called background checks "at worst deceptive.. .ex-
employers are too frequently unwilling to commit themselves
in a written reference to an allegation that a previous
employee stole from them. The possible cost in libel suits
far outweigh the limited return on candor" (p. 162).
The third technique used by companies to screen
applicants are the integrity tests. These are often
referred to as "honesty tests." Many companies have gone to
using paper-and-pencil integrity tests as an alternative to
the polygraph. Compared to the polygraph, integrity tests
are relatively inexpensive and can be administered in the
11
personnel office. Three basic types. of integrity tests have
been identified: overt tests, personality-based tests, and
multidimensional assessment batteries (Arnold, Jones &
Harris, 1990).
The overt integrity test is designed to measure an
applicant's attitude to a wide range of counterproductive on-
the-job behaviors (Wiley & Rudley, 1991). These typically
have two sections: (a) dealing with attitudes toward theft
and other forms of dishonesty and (b) admissions of theft and
other illegal activities (Sackett, Burris & Callahan, 1989).
The first overt or "clear purpose" honesty test was
developed in 1942 by Dr. Gilbert Lee Betts, an educational
psychologist, during his service with the U.S. Army (Ash &
Maurice, 1988). Betts was given the task of screening out
Army recruits with criminal histories. This lead to the
development of the Biographical Case History (BCH) which
later was succeeded by the Life Experience Inventory. This
instrument consisted of many of the same questions used by
overt integrity tests today. Examples include: "How often do
you tell lies?"; "How much can most people be trusted?"; "Do
you feel you are very trustworthy?" (Ash & Maurice, 1988).
Some available tests of this kind are the London House
Personnel Selection Inventory, the Reid Report, and the
Stanton Survey.
The personality-based measures do not ask questions
which appear to bear directly on integrity (Wiley & Rudley,
12
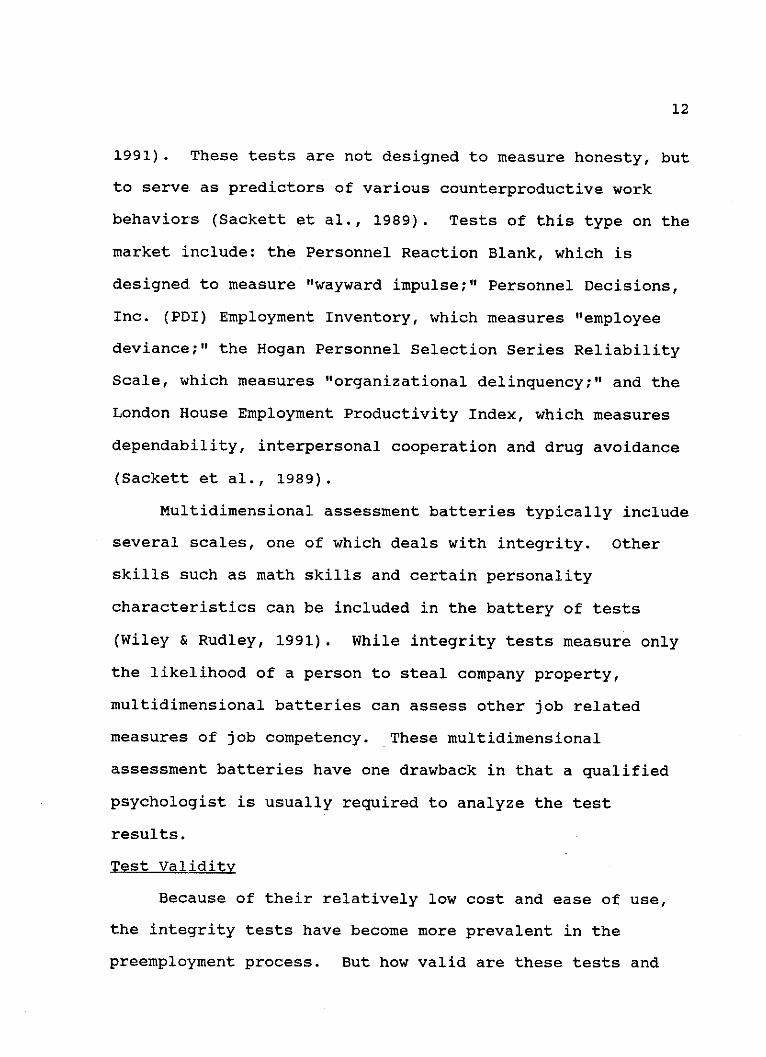
1991). These tests are not designed to measure honesty, but
to serve as predictors of various counterproductive work
behaviors (Sackett et al., 1989). Tests of this type on the
market include: the Personnel Reaction Blank, which is
designed to measure "wayward impulse;" Personnel Decisions,
Inc. (PDI) Employment Inventory, which measures "employee
deviance;" the Hogan Personnel Selection Series Reliability
Scale, which measures "organizational delinquency;" and the
London House Employment Productivity Index, which measures
dependability, interpersonal cooperation and drug avoidance
(Sackett et al., 1989).
Multidimensional assessment batteries typically include
several scales, one of which deals with integrity. Other
skills such as math skills and certain personality
characteristics can be included in the battery of tests
(Wiley & Rudley, 1991). While integrity tests measure only
the likelihood of a person to steal company property,
multidimensional batteries can assess other job related
measures of job competency. These multidimensional
assessment batteries have one drawback in that a qualified
psychologist is usually required to analyze the test
results.
Test Validity
Because of their relatively low cost and ease of use,
the integrity tests have become more prevalent in the
preemployment process. But how valid are these tests and
13
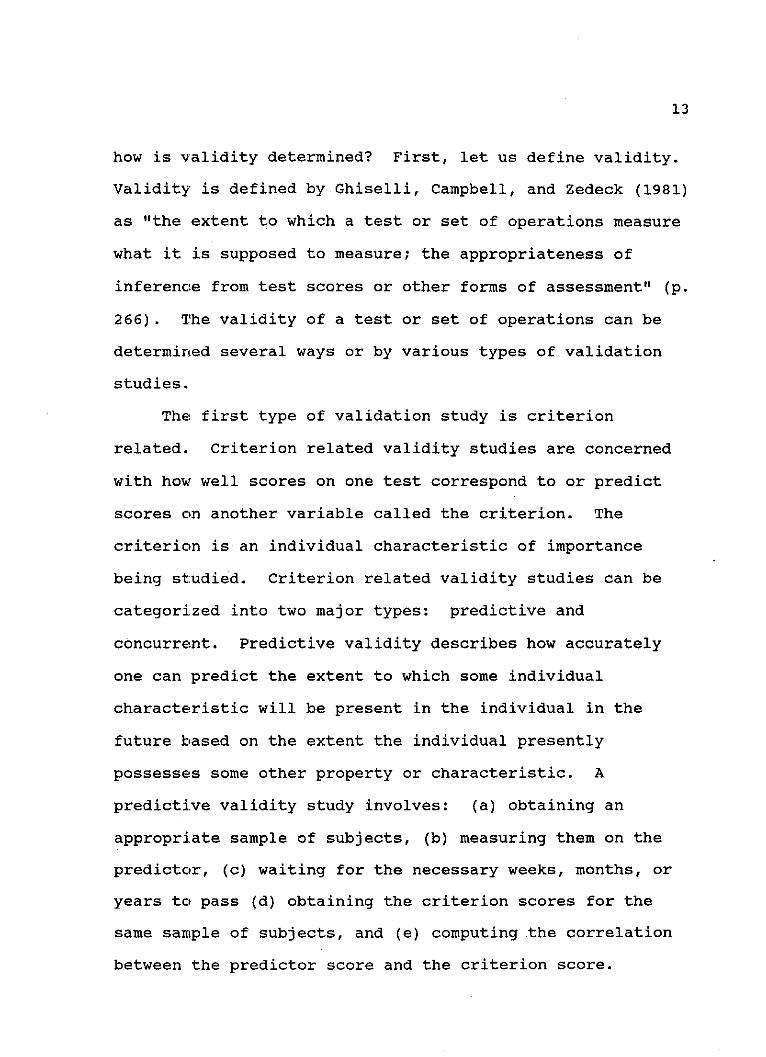
how is validity determined? First, let us define validity.
Validity is defined by Ghiselli, Campbell, and Zedeck (1981)
as "the extent to which a test or set of operations measure
what it is supposed to measure; the appropriateness of
inference from test scores or other forms of assessment" (p.
266). The validity of a test or set of operations can be
determined several ways or by various types of validation
studies.
The first type of validation study is criterion
related. Criterion related validity studies are concerned
with how well scores on one test correspond to or predict
scores on another variable called the criterion. The
criterion is an individual characteristic of importance
being studied. Criterion related validity studies can be
categorized into two major types: predictive and
concurrent. Predictive validity describes how accurately
one can predict the extent to which some individual
characteristic will be present in the individual in the
future based on the extent the individual presently
possesses some other property or characteristic. A
predictive validity study involves: (a) obtaining an
appropriate sample of subjects, (b) measuring them on the
predictor, (c) waiting for the necessary weeks, months, or
years to pass (d) obtaining the criterion scores for the
same sample of subjects, and (e) computing the correlation
between the predictor score and the criterion score.
14
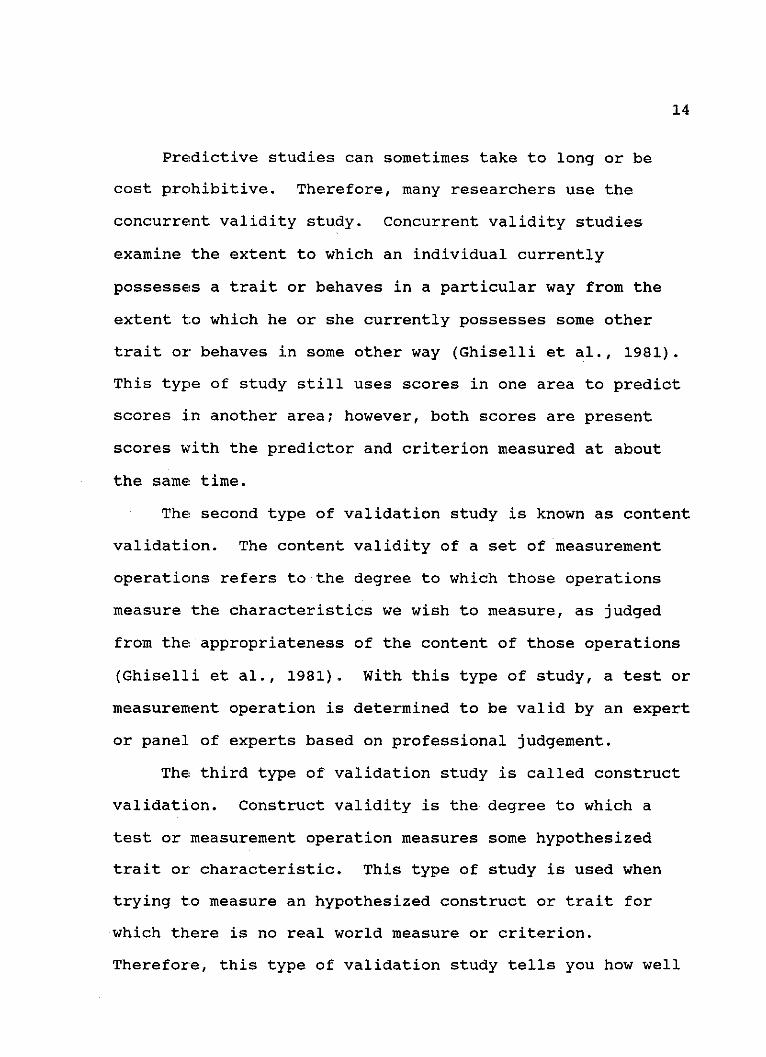
Predictive studies can sometimes take to long or be
cost prohibitive. Therefore, many researchers use the
concurrent validity study. Concurrent validity studies
examine the extent to which an individual currently
possesses a trait or behaves in a particular way from the
extent to which he or she currently possesses some other
trait or behaves in some other way (Ghiselli et al., 1981).
This type of study still uses scores in one area to predict
scores in another area; however, both scores are present
scores with the predictor and criterion measured at about
the same time.
The second type of validation study is known as content
validation. The content validity of a set of measurement
operations refers to the degree to which those operations
measure the characteristics we wish to measure, as judged
from the appropriateness of the content of those operations
(Ghiselli et al., 1981). With this type of study, a test or
measurement operation is determined to be valid by an expert
or panel of experts based on professional judgement.
The third type of validation study is called construct
validation. Construct validity is the degree to which a
test or measurement operation measures some hypothesized
trait or characteristic. This type of study is used when
trying to measure an hypothesized construct or trait for
which there is no real world measure or criterion.
Therefore, this type of validation study tells you how well
15
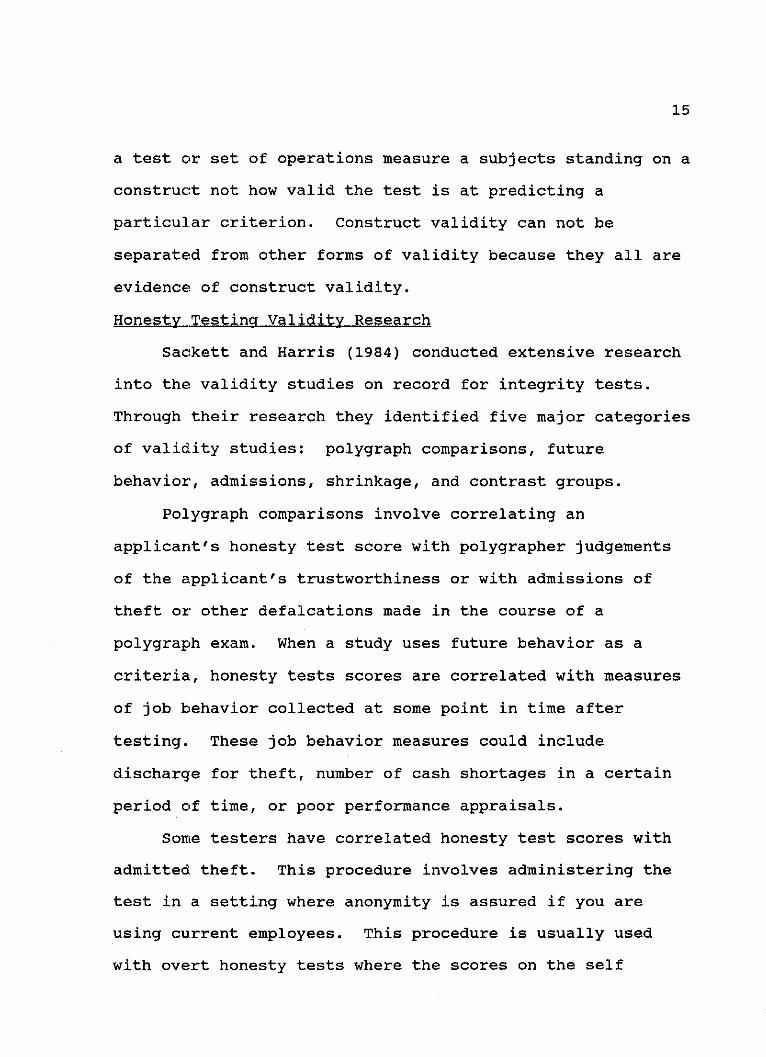
a test or set of operations measure a subjects standing on a
construct not how valid the test is at predicting a
particular criterion. Construct validity can not be
separated from other forms of validity because they all are
evidence of construct validity.
Honesty Testing Validity Research
Sackett and Harris (1984) conducted extensive research
into the validity studies on record for integrity tests.
Through their research they identified five major categories
of validity studies: polygraph comparisons, future
behavior, admissions, shrinkage, and contrast groups.
Polygraph comparisons involve correlating an
applicant's honesty test score with polygrapher judgements
of the applicant's trustworthiness or with admissions of
theft or other defalcations made in the course of a
polygraph exam. When a study uses future behavior as a
criteria, honesty tests scores are correlated with measures
of job behavior collected at some point in time after
testing. These job behavior measures could include
discharge for theft, number of cash shortages in a certain
period of time, or poor performance appraisals.
Some testers have correlated honesty test scores with
admitted theft. This procedure involves administering the
test in a setting where anonymity is assured if you are
using current employees. This procedure is usually used
with overt honesty tests where the scores on the self
16
admission section is compared to scores on other factors of
the test. When shrinkage is used, the store is the unit of
analysis, not the individual. Shrinkage rates are compared
to test scores or changes in shrinkage rates are compared
over time after the introduction of an integrity test to the
preemployment screening process to determine the influence
of the testing program. The use of contrast groups involves
obtaining mean test scores from two groups, one of which is
presumed to be dishonest and the other to represent the
general population. This procedure is often used to
determine the resistance of the test to efforts to "fake
good." If the test can adequately discriminate between the
two populations, it is considered valid and resistant to
fake good, as the dishonest population is usually considered
motivated to beat the test.
Although the Sackett and Harris (1984) review is
generally favorable, they noted additional research was
needed to determine the nature and structure of the
construct of honesty. Sackett, Burris, and Callahan (1989)
reviewed a larger number of validity studies and concluded
that a stronger case of validity could be made today as
opposed to when the first review was conducted in 1984.
The Office of Technology Assessment (OTA) also examined
a number of issues associated with the use of integrity
tests (Wiley & Rudley, 1991). They agreed that the quality
of the validity studies had increased over the last five
17
years, but basic methodological difficulties had not been
surmounted. These difficulties occur in three key areas.
The first area is the problem that dishonesty encompasses a
broad range of behaviors making it difficult to accurately
define. Second, it is difficult to accurately predict the
persons who are likely to engage in theft. And third, there
is disagreement among psychologists as whether honesty is an
individual trait, whether it is situationally determined or
whether it is a combination of both.
Shrinkage Research
Four areas of research will be discussed in more
detail: shrinkage rates, job satisfaction, organizational
control or security, and Customer Service. First, what is
shrinkage? Shrinkage refers to the value of all goods
missing through a variety of causes, including shoplifting,
vendors' theft, misplaced merchandise, bookkeeping errors,
and employees' theft (Brown & Pardue, 1985). Various
industries disagree on how much shrinkage is attributable to
employee theft. Dickens et al. (1989) reported that the
freight shipping and airport cargo handling industries
believe that 80 percent of all shipping losses are due to
employee theft. Lippman and McGraw (1988) reported a survey
conducted for the International Mass Retail Association, an
organization made up of mass merchandisers, department
stores and specialty shops. This report attributed more of
inventory losses to employee theft than to any other factor.
18
Employees were responsible for 43 percent of losses,
shoplifters for 30 percent, bookkeeping errors for 23
percent, and vendor theft for 4 percent. The results of the
survey showed total shrinkage for the 113 companies surveyed
amounted to 1.8 percent of sales.
Many studies have been conducted using shrinkage rates
as the criteria and have shown favorable results. Brown et
al. (1987) conducted a study with the use of the Personnel
Selection Inventory as part of a preemployment selection
process and its effect on shrinkage rates in a major home
improvement chain located primarily in the western United
States. In this study new employees were selected using the
Personnel Selection Inventory as part of the selection
criteria. The data, such as shrinkage rates and employees
caught for theft, were collected over a two year period and
compared to the data collected for the three years previous
to the implementation of the inventory. Their study showed
impressive results. Following the introduction of the
testing program, there was a 50 percent reduction in the
number of employees fired for theft, drug use, and violence.
The program also resulting in a savings in shrinkage losses
that amounted to $2.25 million in a two year period.
A 1985 study by Brown and Pardue looked at the effects
of an honesty testing program in a 53 unit chain of retail
drug stores located primarily in the southeastern United
States. This study involved the introduction of an honesty
19
testing program to the preemployment selection process.
Annual polygraphs had been given by the company in the past
and were continued through the three year duration of the
study. The findings of the study were significant and
consistent with other studies. Larger numbers of employees
passed their annual polygraph exams which the authors
contributed to the increased honesty of the work force.
They also reported a shrinkage drop of 1.7 points or 50
percent. This reduction resulted in a savings of $1.25
million to the chain.
A study involving the convenience store industry was
also conducted (Brown, 1986). This study was different from
the previously discussed studies in that the honesty test
(Personnel Selection Inventory) was used to assess current
employees. The subjects were 248 current employees in 74
stores in eight regional areas of a major convenience store
chain located primarily in the northeast United States.
Scores on the test were averaged by region and compared to
the total dollar amount recovered from employee theft. The
study found a significant correlation between regional
honesty test scores, tolerance toward theft, and average
dollar amount recovered per store, an indication of theft
activity. The results showed that those regions with less
tolerance toward theft reported the average dollar amount
recovered per store as $91.38 while the regions with more
tolerance toward theft reported an average of $679.41. This
20
study revealed that honesty test usage on current employees
can be used has an effective assessment instrument and could
be a source of useful information for the organization.
Jones, Slora and Boye (1990) conducted a survey in the
supermarket industry. Six large, nationally-based
supermarket chains participated in the study. Two of the
supermarket chains were currently using a professionally
developed paper-and-pencil preemployment integrity test.
The other four chains did not use published preemployment
integrity tests and served as the control group.
Significant results were obtained. Stores which used
integrity tests reported annual amounts taken by the average
employee as $716 while stores in the control group reported
$1,403. The authors could not attribute the theft reduction
to the testing program, but did conclude the testing program
was a contributing factor. The authors felt the theft
occurring in the stores using integrity tests could be due
to two factors: (a) employees hired before the testing
program began, and (b) implications that the testing program
was incomplete. They did feel, however, that the testing
program fostered a more honest and dependable work force by
screening out a portion of those individuals which were
likely to engage in employee theft. This resulted in a more
productive and profitable organization.
21
Job Satisfaction Research
The area of job satisfaction has received a great deal
of research attention over the years. Many researchers have
studied the behavioral effects of job dissatisfaction, but
the majority of the research has centered on the withdrawal
of the individual employee from the organization (Hollinger
& Clark, 1983). These studies have concentrated on the
effects of job dissatisfaction with such dependent variables
as turnover and absenteeism (Porter & Steers, 1973; Smith,
1977). Very few empirical studies have been conducted using
employee theft as the dependent variable. Only two
empirical studies were available.
Mangione and Quinn (1973) studied the association
between perceived level of job satisfaction and
counterproductive job behaviors. Their study is based on
data collected from the 1972-1973 Quality of Employment
Survey conducted by the University of Michigan. This study
concluded that general job satisfaction was significantly
correlated to counterproductive behavior but only for men 30
years old or older.
An extensive study by Hollinger and Clark (1983)
involved administering a survey constructed primarily of
items used in the University of Michigan's 1972-1973 Quality
of Employment Survey, to employees in three industrial
sectors: retail, hospital, and manufacturing. They found a
significant relationship between worker job dissatisfaction
22
and property and production deviance. Unlike Mangione and
Quinn (1973), their findings suggest that all age groups of
employees who are dissatisfied with their job situation,
especially the young worker, are significantly more likely
to become involved in employee theft.
Organizational Control Research
The third research area to be discussed involves the
effect of perceived store security or certainty of
detection. This area addresses the social control theories
of employee theft and seeks to determine what effect an
employee's perception of the threat of detection has on
employee theft rates. Also implied in this research is,
"what can the organization do to influence this perception?"
Recent empirical research on employee theft indicates
that employees are less likely to engage in employee theft
if they feel the threat of apprehension is great (Hollinger
& Clark, 1983). If this is correct, organizations can
attempt to adjust their employees perceptions on the threat
of detection in an attempt to lower employee theft rates.
This must be done carefully in order to avoid any negative
impact on the organizational climate. If the employees feel
the atmosphere on the job is like a "police state," their
job satisfaction levels could drop resulting in lower
productivity and efficiency.
The Zale Corporation used a shrinkage newsletter called
"Shrink Stoppers" to its employees as a way of stressing how
23
important employee theft detection is to the organization.
The newsletter included information on shrinkage rates, $30
million for 1990, and recent apprehensions of employees and
a brief statement of how the incident was handled. Zale,
like many other retail organizations, also offered their
employees incentives to turn in fellow employees who are
engaged in employee theft. These programs usually include
some type of monetary reward. Very little empirical
research has been conducted in this area.
Hypotheses
In the study to be conducted, we will attempt to define
the relationship between employee theft, as determined by
inventory shrinkage rates, and three independent variables:
(a) perceived level of job satisfaction, (b) perceived
store security or certainty of detection, (c) employee
reliability. The first two variables will be determined by
scores on the Organization Responsiveness Questionnaire
which was developed from questions asked in the University
of Michigan's 1972 - 1973 Quality of Employment Survey and
Hollinger and Clark's 1978 to 1980 study of employee
deviance. Employee reliability is determined by PDI"s
Employment Inventory/Customer Service Inventory. In
addition, the three tests involved will be validated by
correlating the scores on the three tests with job
performance ratings.
24
This study will examine several hypotheses. The first
hypothesis of this study predicts a significant positive
relationship exists between scores on the Employment
Inventory Performance (EI-PS) scale and the PDI Performance
Rating form. If this hypothesis holds true, subjects who
score high on the EI-Performance scale should be those
employees who were rated as good workers by their
supervisors on the PDI Performance Rating form. The
correlation between these two scores will be a reflection of
the validity of the EI-Performance scale.
The second hypothesis suggests a significant positive
relationship between scores on the ORQ-Job Satisfaction
scale and the Performance Rating form. If this hypothesis
is correct, employees who score high on-this scale are more
satisfied with their job and, therefore, more productive at
work and will be rated higher by their supervisor on the job
performance ratings.
The third hypothesis predicts a significant positive
relationship between scores on the ORQ-Perceived Security
scale and the Performance Rating forms. If employees have
higher scores in this scale, they perceive the threat of
detection if caught stealing as great and should, therefore,
be less likely to steal from there employer and should be
perceived as better employees by their bosses resulting in
higher performance ratings.
25
The last three hypotheses do not address individuals.
The store is the unit of analysis. Individual scores are
averaged across the store to provide the store score.
The fourth hypothesis predicts a significant negative
relationship between the store score on the EI-Performance
scale and inventory shrinkage data reflected as a percentage
of sales. If this is true, stores with higher EI-
Performance scale scores will have better, performance
oriented employees who would be less likely to engage in
employee theft and the stores, therefore, have
correspondingly low inventory shrinkage rates.
The fifth hypothesis predicts a significant negative
correlation between scores on the ORQ-Job Satisfaction scale
and inventory shrinkage data. This would assume that stores
with higher job satisfaction scores have more employees who
are satisfied with their jobs and should also be more
motivated to do a good, effective job for their employers.
This should reduce the incidence of employee theft in these
stores resulting in lower inventory shrink rates.
The sixth hypothesis suggests that stores who have
employees who perceive the threat of detection as high
should they steal from their employers should have
correspondingly lower inventory shrinkage rates. This would
be reflected by stores with higher scores on the ORQ-
Perceived Security scale having significantly lower
inventory shrinkage rates.
26
METHOD
Subjects
Subjects consisted of 489 employees of a major retail
chain of 546 stores located primarily in the southeastern
United States. All employees of a random sample of 249
stores in the chain were subjects (see Appendix A for store
list and organization consent).
Materials
In this study, three types of materials were used. The
first two types were designed and administered to collect
data on the subjects. These two types are: (a) tests
designed to measure the employees' attitudes, and (b)
performance rating forms completed by the supervisor. The
third type of material is shrinkage data. This is archival
data from the chain represented as a percentage of sales.
Tests. The Organization Responsiveness Questionnaire
(ORQ) consists of 36 questions designed to yield scores in
two areas: perceived level of job satisfaction and
perceived level of organizational security. The survey
consists of questions used in the University of Michigan's
1972 - 1973 Quality of Employment Survey and Hollinger and
Clark's 1978 to 1980 study of employee deviance. The survey
was modified by eliminating questions that did not fit the
retail setting of the chain of stores (see Appendix B). No
reliability information was available for the ORQ.
27
The Employment Inventory (EI) which includes a Customer
Service Inventory (CSI) were developed by Personnel
Decisions, Incorporated and consists of 145 questions. The
Employment Inventory (EI) yields scores in two areas:
performance and tenure. Paajanen (1988) presented
reliability data for the EI. Estimates for the test-retest
reliability are: performance, .78-.89; and tenure, .68-.77;
and frankness, .84-.90. The Customer Service Inventory
(CSI) yields a score for orientation toward providing
customer service. The tests are given as one unit and
includes a six item test taking "frankness" scale which is
designed to detect random or careless responding (see
Appendix C and D).
Performance Rating Form. The Personnel Decisions,
Incorporated (PDI) Employee Rating Form is composed of three
parts. Part I is designed to solicit performance
evaluations of a general nature. The first question is
designed to determine the accuracy of the evaluation by
asking the rater how familiar he is with the employee's day-
to-day job performance. The second question asks the
evaluator "Based on what you know, would you hire this
employee again?"
Part II consists of 16 questions in which the evaluator
is asked to evaluate the employee's overall performance
compared to the average employee. Five scales are used,
ranging from "well above average" to "well below average."
28
Part III consists of 30 questions in which the
evaluator is asked to rate the frequency the employee
exhibits each behavior. Five scales are used, ranging from
"never" to "always" (see Appendix E). These 30 behaviors
were identified by a group of store managers and
administrative staff using a Job Analysis Questionnaire
provided by PDI. The top 30 behaviors based on frequency
and importance were included on the rating form.
The data collected were correlated with 10 criterion
variables from the PDI rating form: Rehire, Customer
Service Traits, Employment Inventory Traits, Overall
Customer Service Orientation, Overall Job Performance,
Traits, Customer Service Behaviors, Employment Inventory
Behaviors, Overall Behaviors, and Overall performance
rating. The criterion variables and their corresponding
rating form questions are listed in Appendix J.
Shrinkage Data. Inventory shrinkage data were
collected by the retail chain on a continuing basis. This
usually resulted in each store being completely inventoried
at least twice a year. This data is collected as a
percentage of store sales.
Procedure
The Organization Responsiveness Questionnaire (ORQ) and
the composite Employment Inventory/Customer Service
Inventory (EI/CSI) were mailed to all employees of the 249
store sample. Supervisors of the employees completed the
29
PDI Employee Rating Form for each employee involved in the
study. The tests and rating forms were delivered to each
subject by company mail. The tests and forms were
accompanied by written instructions and an envelope in which
they were to be returned to PDI. The Rating Forms were
mailed to each store manager and the discount chain
distributed the rating forms to its 34 District Managers to
evaluate each of the store managers.
Four different packets of material were mailed
depending on the status of the participant. District
Managers received a packet which included a cover letter
from the retail chain's Executive Vice-President (see
Appendix F), a cover letter with instructions from the
researcher (see Appendix G), a rating guidelines sheet (see
Appendix H), enough PDI Performance Rating forms for each
store manager in their district, and a postage paid return
envelope. Store managers with employees participating in
the study received a packet of material which included a
cover letter from the retail chain's Executive Vice-
President (see Appendix F), a cover letter with instructions
from the researcher (see Appendix G), a rating guidelines
sheet, enough PDI Performance Rating forms for each store
employee, an ORQ, an EI/CSI, an answer sheet, and a postage
paid return envelope.
Store managers without employees participating in the
study received a packet of material containing a cover
30
letter from the retail chain's Executive Vice-President (see
Appendix F), a cover letter with instructions from the
researcher (see Appendix G), an ORQ, an EI/CSI, an answer
sheet, and a postage paid return envelope. Store employees
who participated in the study received a packet of material
containing a cover letter from the retail chain's Executive
Vice-President (see Appendix F), a cover letter with
instructions from the researcher (see Appendix G), an ORQ,
an EI/CSI, an answer sheet, and a postage paid envelope.
The EI, CSI and ORQ were computer scored by PDI.
Individual scores were computed for each test. Scores on
the each test were correlated with the job performance
rating yielding a validity coefficient for the CSI, EI and
ORQ. Individual scores on the ORQ, EI, and CSI were
averaged across each store to yield an average store score
for each dimension measured. These average store scores
were correlated with the current inventory shrinkage data of
the store.
Data Analysis
This study involved correlating scores on the
satisfaction, perceived security, employee reliability, and
customer service scales with the performance rating forms.
These correlations generated allow us to make inferences
about the relationships between the independent and
dependent variables.
31
In addition, multiple regression was performed allowing
us to look at the effects, if any, the variables may have
in combination with each other. This may allow for better
predictions.
RESULTS
Questionnaires
Of the 1850 packets of materials mailed, 895 rating
forms and 739 test answer sheets were returned. This is a
48 percent and 40 percent return rate respectively. Of the
rating forms and answer sheets returned, a positive match of
completed answer sheets to rating forms resulted in a total
sample size of 582. Of the 582 matches, 93 were invalid due
to unanswered questions or rating forms showing a lack of
familiarity by the rater. This left a total of 489 valid
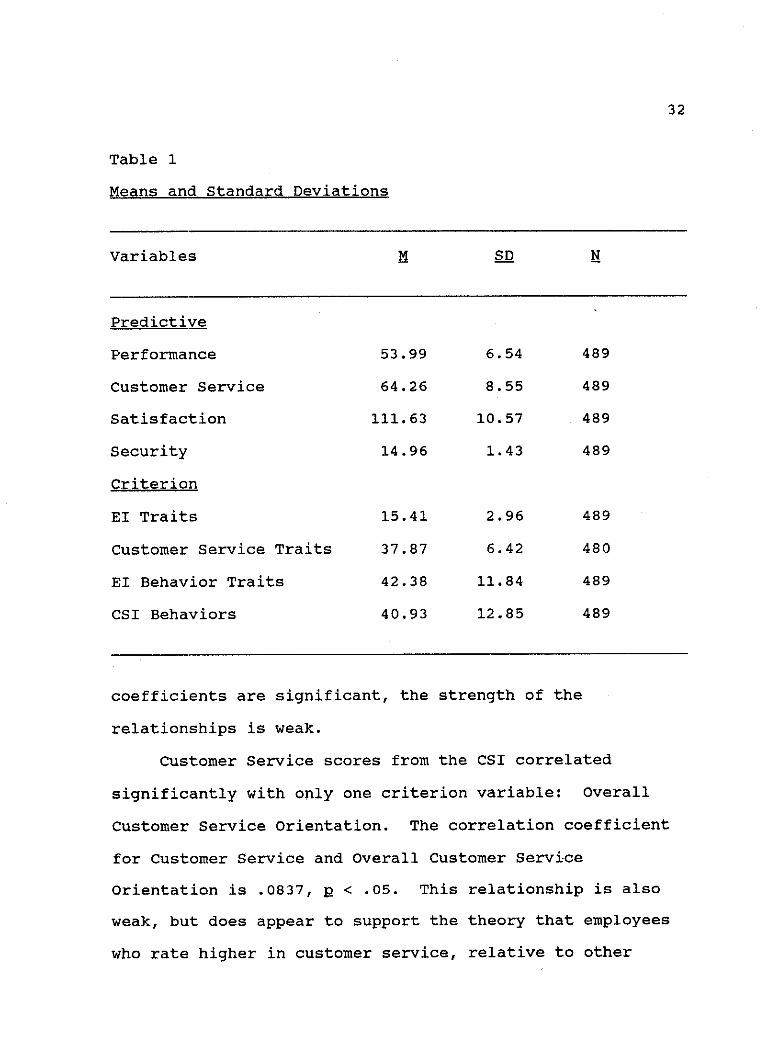
matches. Table 1 lists the means and standard deviations
for the predictor varialbes.
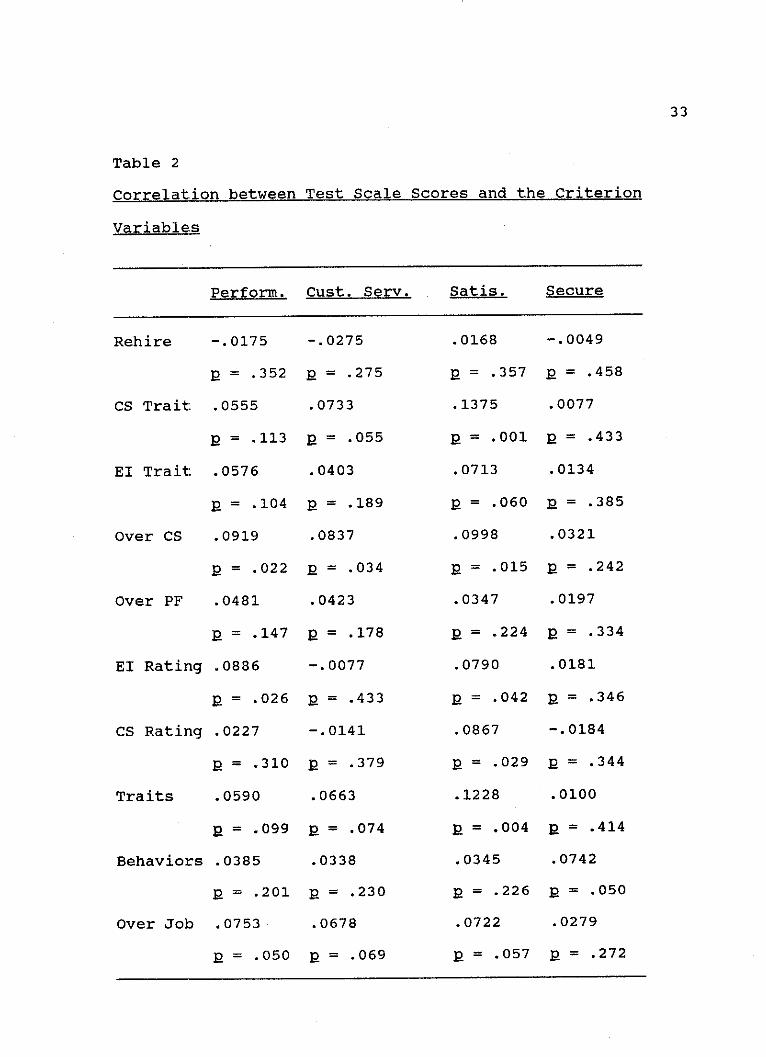
Pearson correlations were computed for the subscale
scores and the criterion variables. Table 2 lists the
correlations obtained in the study. From the table, it is
evident that Performance (EI scale) correlates with three
criterion variables. The Performance correlation
coefficient for Overall Customer Service Orientation score
is .1919, p < .05. Performance correlated with the
Employment Inventory Behavior ratings .0886, p < .05.
Lastly, the correlation coefficient for Performance and
Overall Job Performance is .0753, p < .05. While all these
32
Table 1
Means and Standard Deviations
Variables M SD N
Predictive
Performance 53.99 6.54 489
Customer Service 64.26 8.55 489
Satisfaction 111.63 10.57 489
Security 14.96 1.43 489
Criterion
EI Traits 15.41 2.96 489
Customer Service Traits 37.87 6.42 480
EI Behavior Traits 42.38 11.84 489
CSI Behaviors 40.93 12.85 489
coefficients are significant, the strength of the
relationships is weak.
Customer Service scores from the CSI correlated
significantly with only one criterion variable: Overall
Customer Service Orientation. The correlation coefficient
for Customer Service and Overall Customer Service
Orientation is .0837, p < .05. This relationship is also
weak, but does appear to support the theory that employees
who rate higher in customer service, relative to other
33
Table 2
Correlation between Test Scale Scores and the Criterion
Variables
Perform. Cust. Serve. Satis. Secure
Rehire
CS Trait
EI Trait
Over CS
Over PF
EI Rating
CS Rating
Traits
Behaviors
Over Job
-. 0175
p = .352
.0555
p = .113
.0576
p = .104
.0919
p = .022
.0481
p = .147
.0886
p = .026
.0227
p = .310
.0590
p = .099
.0385
p = .201
.0753-
p = .050
-. 0275
p = .275
.0733
p = .055
.0403
p = .189
.0837
p = .034
.0423
p = .178
-. 0077
p = .433
-. 0141
p = .379
.0663
p = .074
.0338
p = .230
.0678
p = .069
.0168
p = .357
.1375
p = .001
.0713
p = .060
.0998
p = .015
.0347
p = .224
.0790
p = .042
.0867
p = .029
.1228
p = .004
.0345
p = .226
.0722
p = .057
-. 0049
p = .458
.0077
p = .433
.0134
p = .385
.0321
p = .242
.0197
p = .334
.0181
p = .346
-. 0184
p = .344
.0100
p = .414
.0742
p = .050
.0279
p = .272
34
employees, also score higher on the CSI Customer Service
scale.
The ORQ Satisfaction score correlated significantly
with five of the criterion variables. The correlation
coefficient between Satisfaction and Customer Service Traits
is .1375, p < .001. Satisfaction also correlated
significantly with Overall Customer Service Orientation,
.0998, p < .05; Employment Inventory Behavior ratings,
.0790, p < .05; Customer Service Behavior ratings, .0867, p
< .05; and Overall Traits, .1228, p < .01. These
relationships, although weak, tend to support the hypothesis
that employees who are more satisfied at work tend to
provide better customer service and display more productive
behaviors at work.
The ORQ-Perceived Security score only correlated
significantly with Overall Behaviors, .0742, p < .05.
Although the relationship is weak, this does tend to support
the hypothesis that employees who perceive the threat of
detection as great exhibit better overall job behaviors.
The multiple regression analysis produced no
statistically significant results. The multiple regression
analysis revealed no significant results when predicting any
of the criterion variables.
Shrinkage
Scores on the EI/CSI and ORQ were correlated with the
inventory shrinkage of the stores. Individual scores were
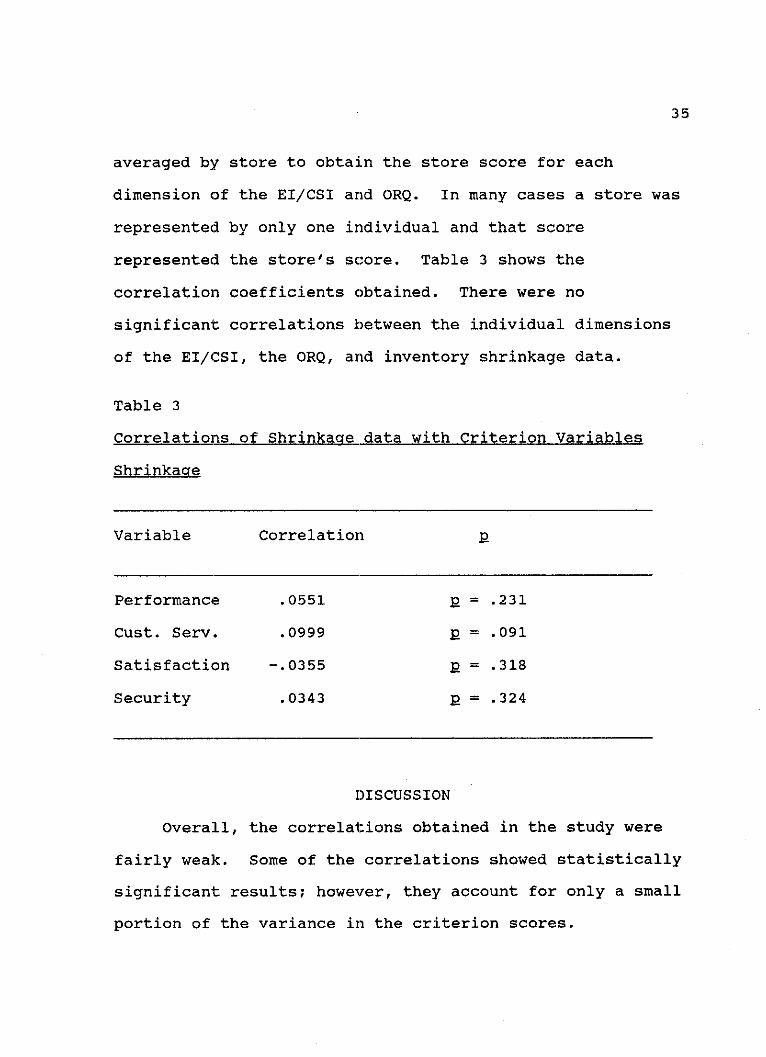
35
averaged by store to obtain the store score for each
dimension of the EI/CSI and ORQ. In many cases a store was
represented by only one individual and that score
represented the store's score. Table 3 shows the
correlation coefficients obtained. There were no
significant correlations between the individual dimensions
of the EI/CSI, the ORQ, and inventory shrinkage data.
Table 3
Correlations of Shrinkage data with Criterion Variables
Shrinkage
Variable Correlation p
Performance .0551 p = .231
Cust. Serve. .0999 p = .091
Satisfaction -. 0355 p = .318
Security .0343 p = .324
DISCUSSION
Overall, the correlations obtained in the study were
fairly weak. Some of the correlations showed statistically
significant results; however, they account for only a small
portion of the variance in the criterion scores.
36
A possible reason for the results may be the sample
size. The study originally began with a fairly large
sample. The return rate and matching process resulted in a
restriction of range. Many of the stores have small work
forces, usually no more than three employees per store
including the store manager. When the return rate dropped
the sample size, many stores were represented by only one
subject, if any at all. This may have resulted in
homogeneity of the sample. In fact, the standard deviations
for the sample was considerably different from the national
norms. In Table 1, the standard devision for the
Performance scale for this study was 6.5. The national norm
is 8.0. The standard devision for the Customer Service
scale for this study was 8.47 compared to 10.0 for the
national norm. In addition, the standard deviation for
perceived security was extremely low at 1.43.
Because of this range restriction, correlations for the
Performance scale and the Customer Service scale were
corrected using the formula suggested by Cascio (1987).
However, only moderate increases were reflected in the data.
Satisfaction and Security scales could not be corrected for
range restriction because the standard deviation for an
unrestricted sample was unavailable.
This restriction of range may account for the lack of
significant correlations, particularly with the shrinkage
data. Many store scores were reflected by one subject.
37
Chances are, if these subjects took the time to complete and
return the questionnaires, they are conscientious and not
the primary source of shrinkage in the store. In addition,
there is also some question as to how accurately shrinkage
data reflects employee theft. Additional research should
look at the shrinkage rate of the stores that had surveys
returned versus stores without returned surveys. This type
of data could reflect on the sample of stores showing
whether a heterogenous sample of stores was obtained.
Even though the correlations found were weak, the
EI/CSI does appear to have practical applications in the
work place. It appears to provide a better way of finding
applicants which will be more likely to display the
behaviors desired for the job.
Some examples of the EI/CSI's ability to discriminate
between employees are described here. The technique used to
describe this data was developed by PDI.
For example, in Figure 1 (Appendix K), 52.4 percent of
the retail chain's current employees are rated as "above
average" or "well above average" on the Customer Service
Traits. Of those that passed the EI, 65.2 percent were
rated as "above average" or "well above average," a
difference of 9.8 percent.
Figures 2 through 6 (Appendix K) show that employees
who pass the Performance and Customer Service cutoff scores
at the national norms were more often rated as above average
38
or well above average performers. The EI/CSI does show
promise as an instrument for use in the preemployment
setting. Other studies conducted by PDI in various work
settings have resulted in more significant results.
Correlations for the ORQ satisfaction and security
scales were also weak. However, the satisfaction scale
correlated significantly with 5 of the 10 criterion
variables. These correlations were in the predicted
direction, however, they account for only a small portion of
the variance in the criterion scores (Hollinger & Clark,
1983; Mangione & Quinn, 1975).
The security scale correlated significantly with only
one variable: overall behaviors. These data are in the
predicted direction. The significant correlation only
accounts for a small portion of the variance. Researchon
perceived security (Parilla et al., 1988; Hollinger & Clark,
1983) has shown stronger perceived security resulting in
lower shrinkage rates. The studies' results, however, show
only a minimal effect. The results were in observable job
behaviors. Before an organization considers increasing the
perception of store security, they should consider other
side effects of the policy. The negative effects (decreased
productivity, perceived "police state") may negate the
possible effect on employee theft. Many organizations use
the perception of strong store security as a means of
39
deterring employee theft and its impact on job behaviors
needs further clarification.
Many factors contributed to the weak correlations found
in the study. The response rate resulted in restriction of
range. One possible way to have overcome this problem would
have been to administer the tests at each store location.
This was not financially feasible for the retail chain or
for the researcher, but would have increased the
heterogeneity of the sample.
Another factor which effected the response rate and the
matching process involved the data files received from the
organization. Many included inaccurate data which resulted
in questionnaires being mailed to employees who had already
left employment with the company. This also severely
hampered the matching process as well with many
questionnaires and rating forms rejected because they could
not be matched accurately. Much of the demographic data
(e.g., age, tenure, manager versus nonmanager) were lost due
to poor records from the organization and turnover. Tighter
control of these data is strongly urged for future studies.
Even though the correlations obtained in this study are
weak, they strongly suggest the need for follow-up studies.
Studies following the employees in this study and their
turnover could be compared over time with their scores on
the tenure scale of the EI/CSI. The area of employee theft
is difficult to measure. So few employees are ever caught
40
stealing from their employers and self reports are often
unreliable. Because shrinkage rates are also influenced by
such factors as shoplifting and inventory accounting errors,
it because difficult to determine what portion is
attributable to employee theft. This throws uncontrollable
variables into the study which become difficult to
eliminate. The results of this study suggest that in order
to accurately predict employee theft, new methods of
predicting employees who will steal from the organization
need to be developed. In addition, new means for measuring
employee theft within the organization need to be
identified. The variables studied in this experiment didn't
appear to account for a major portion of the variance. In
reality, so many factors may influence attitudes toward
employee theft that no one factor can be identified as a
major predictor of employee theft. But, as the cost of
employee theft continues to rise in today's businesses and
government regulations continue to define what is and is not
acceptable in the preemployment setting, the need to find
accurate meaningful ways to lower employee theft rates will
continue to influence business climates and the area of
Industrial/Organizational Psychology.

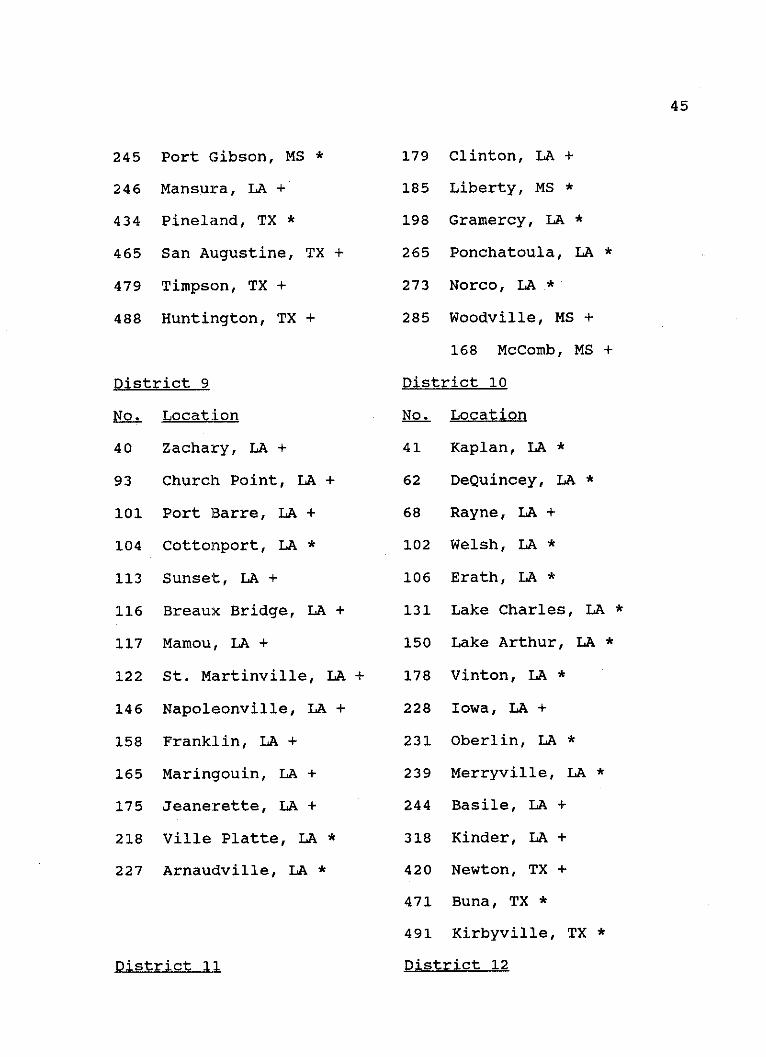
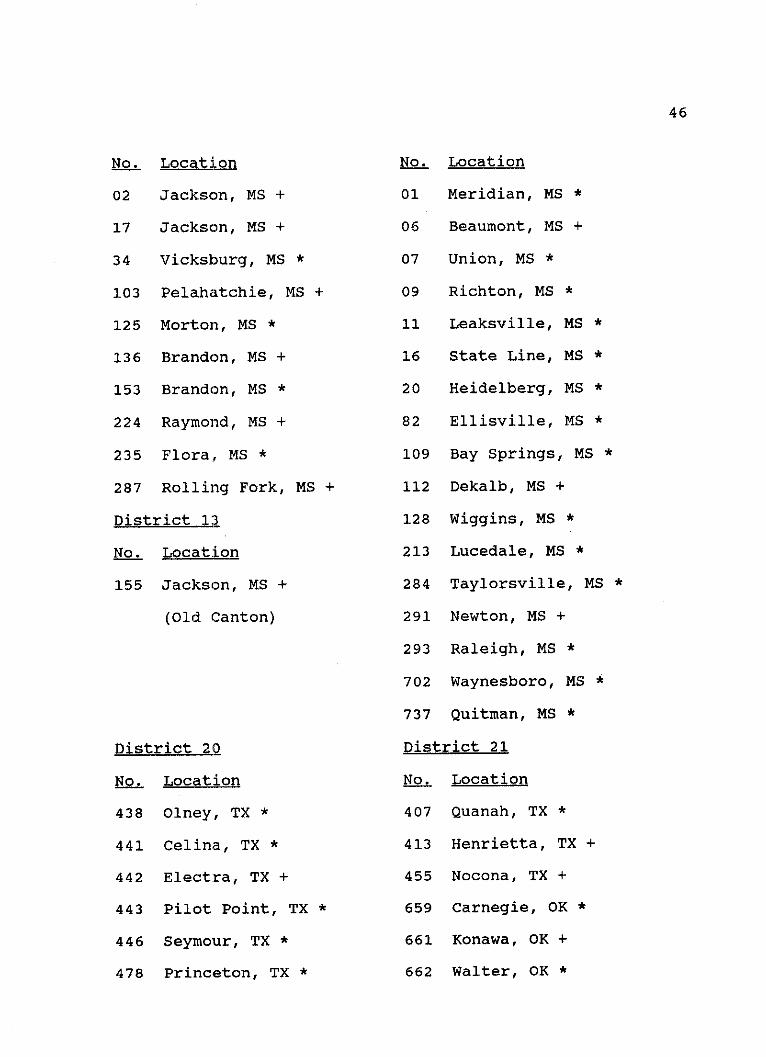
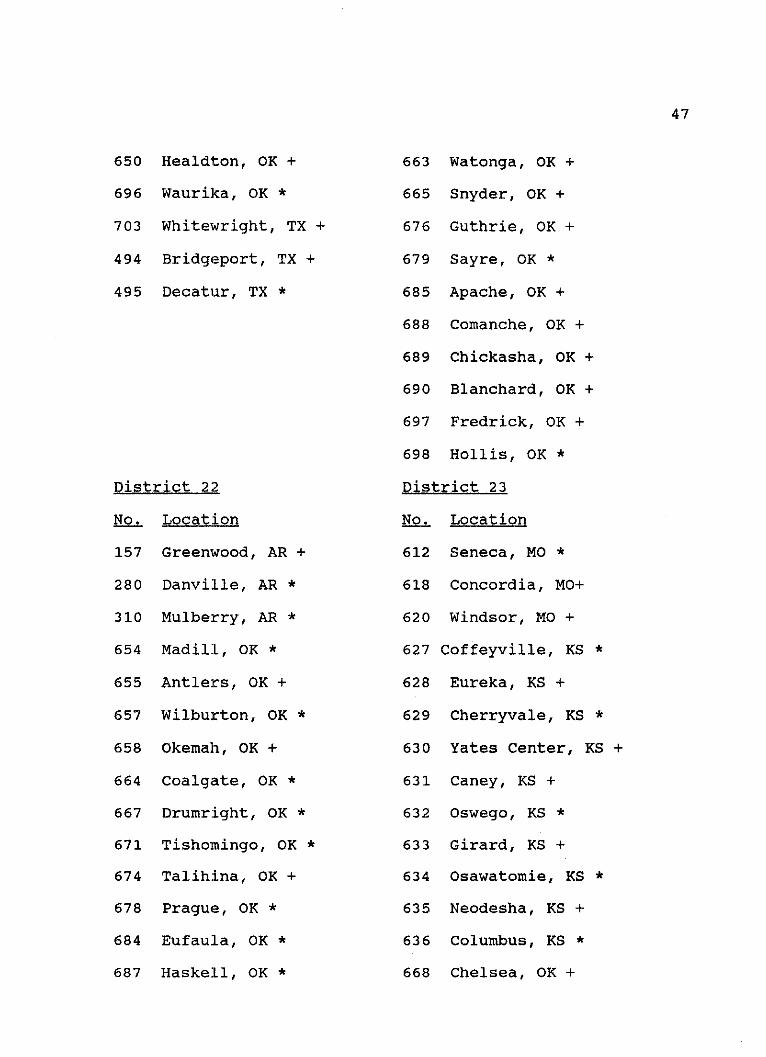
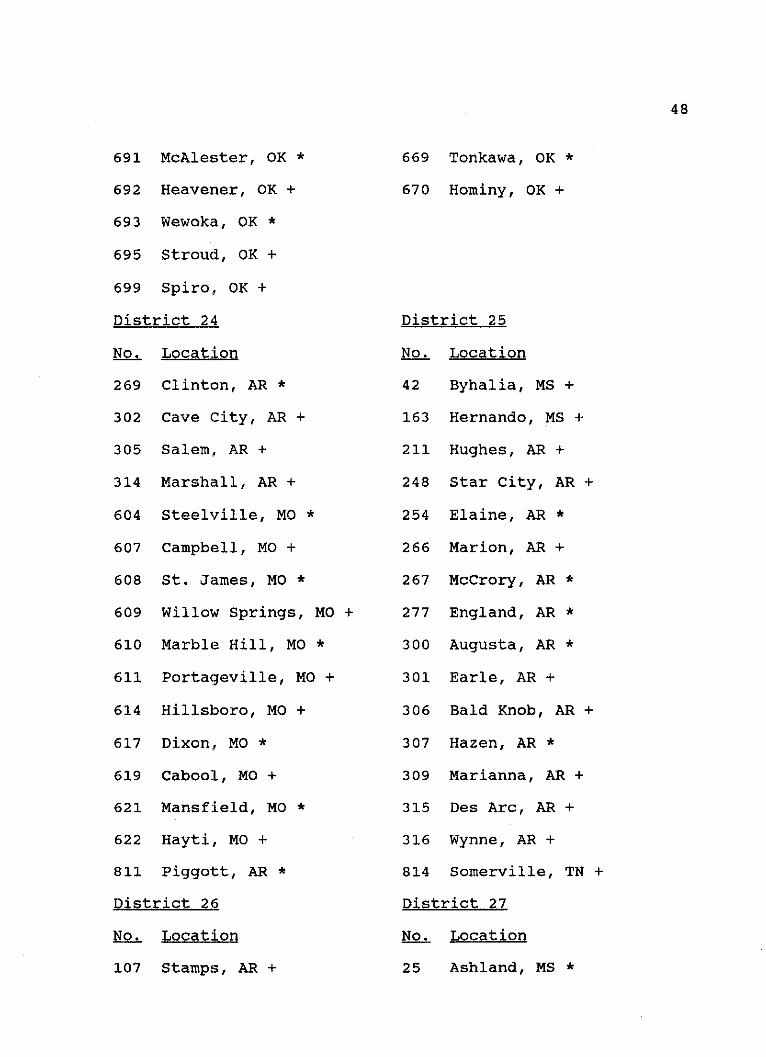
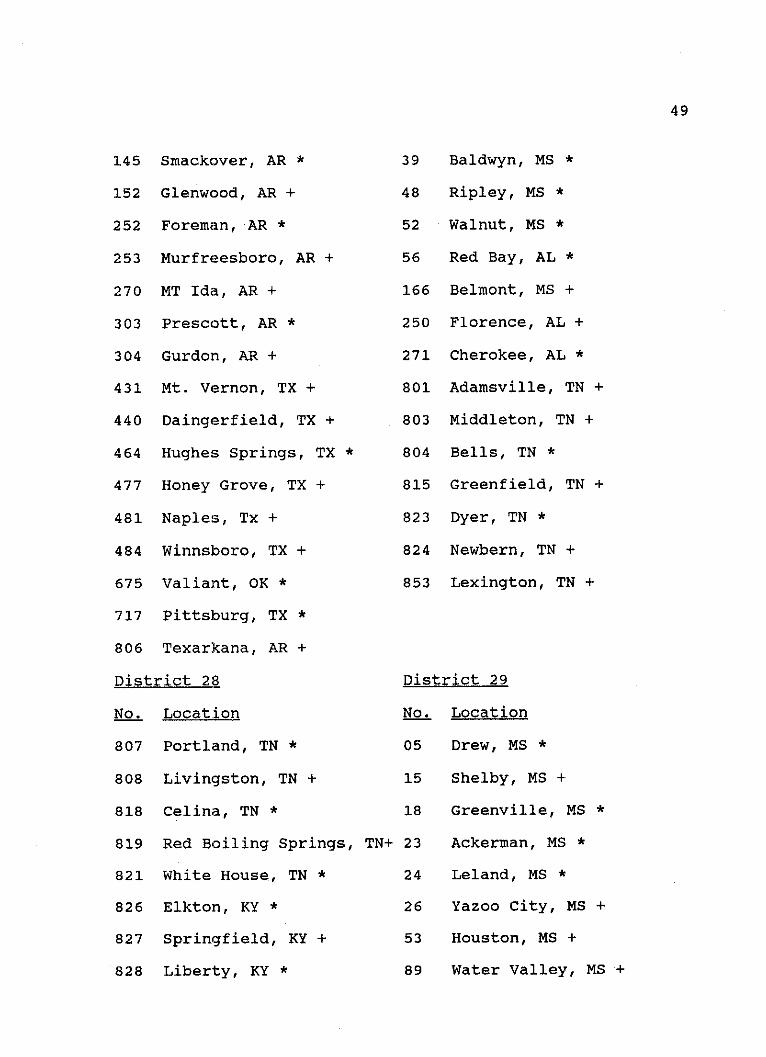
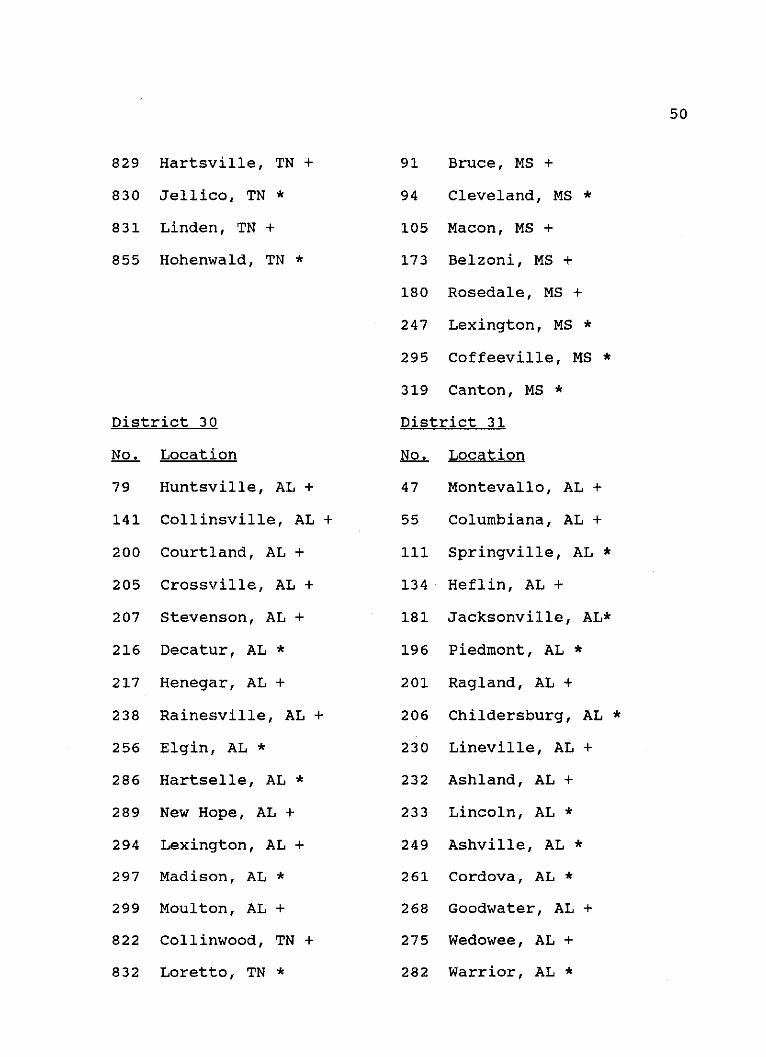
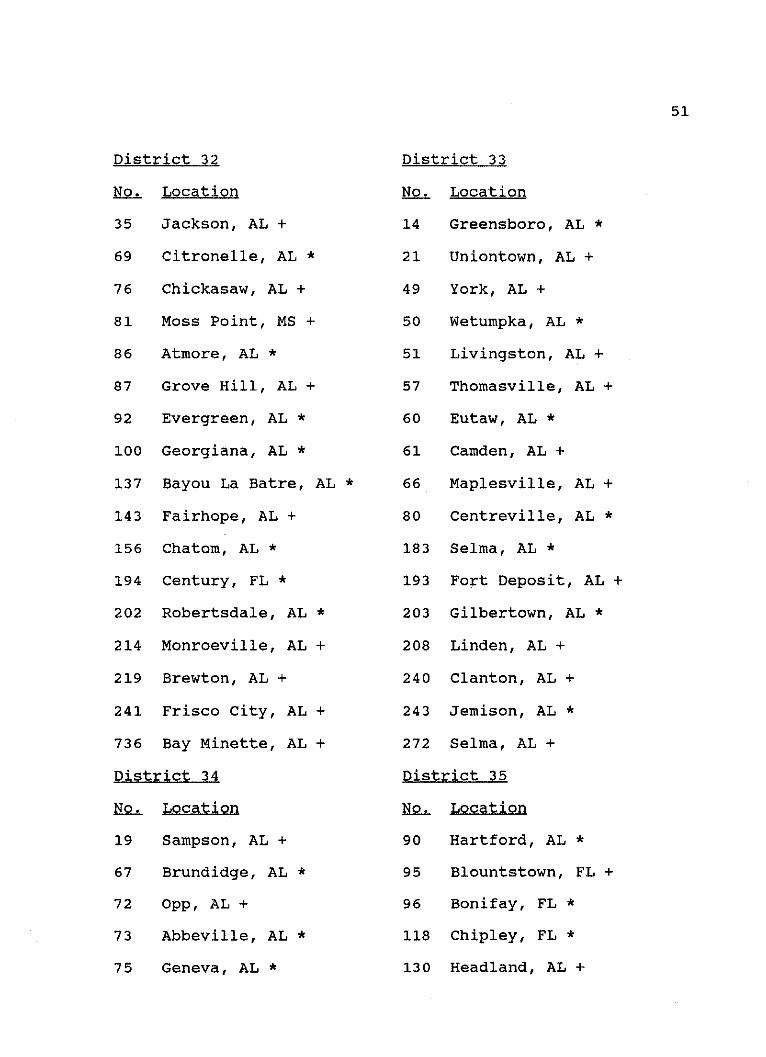
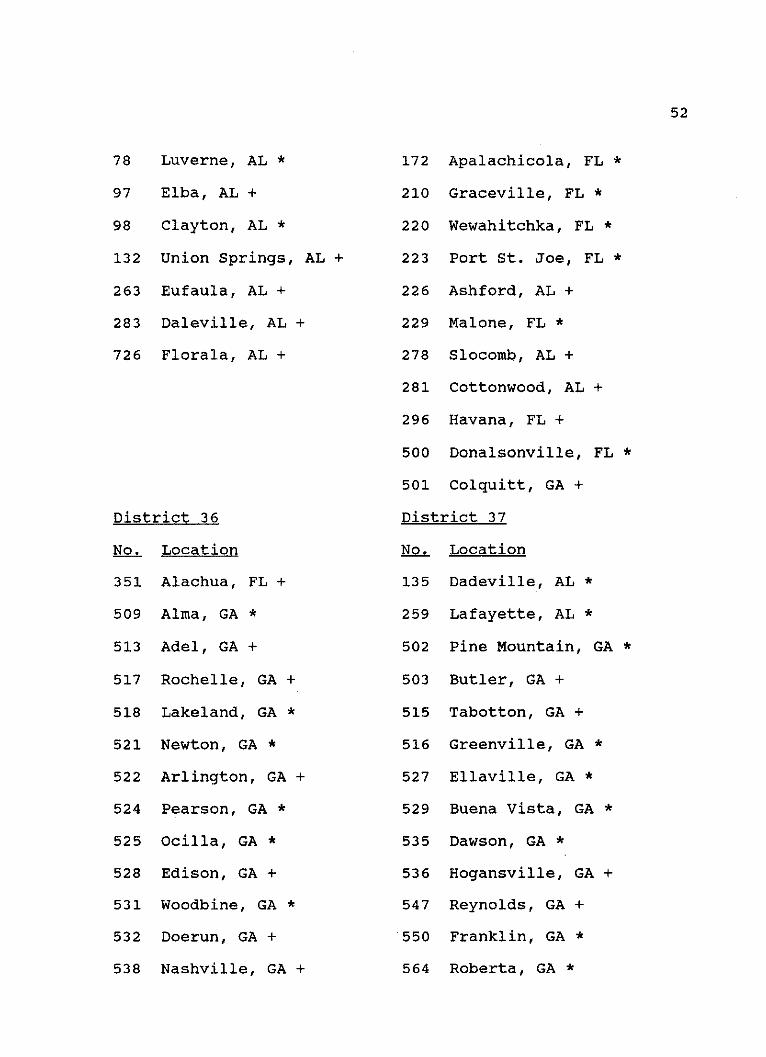
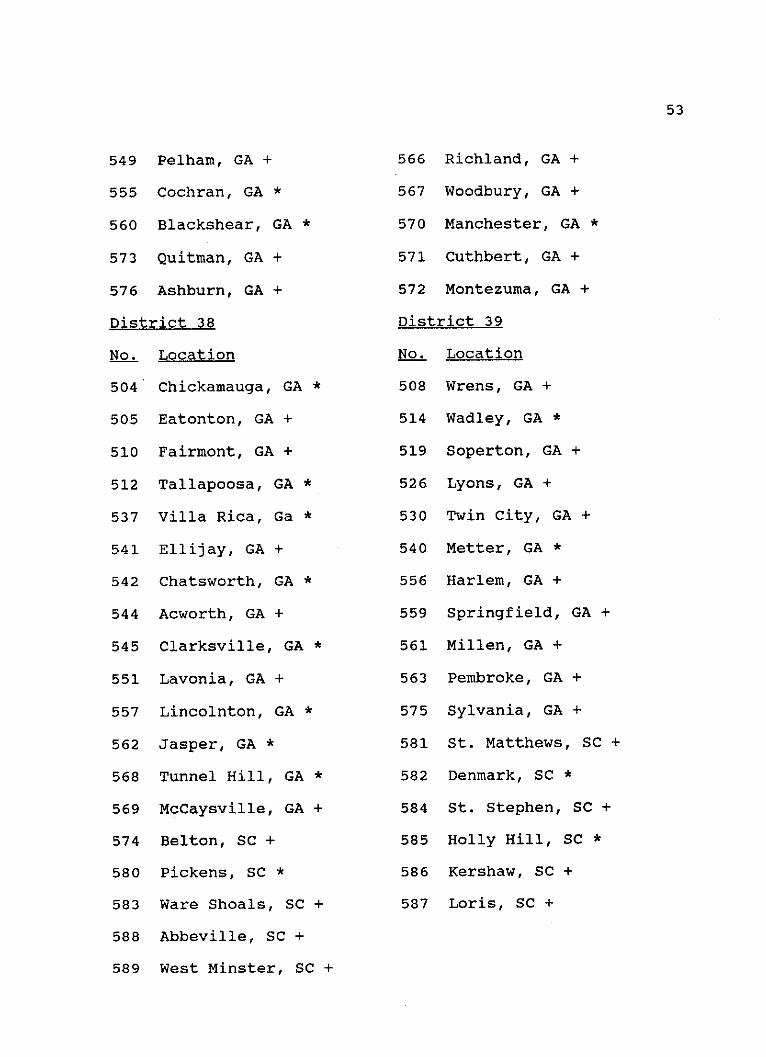
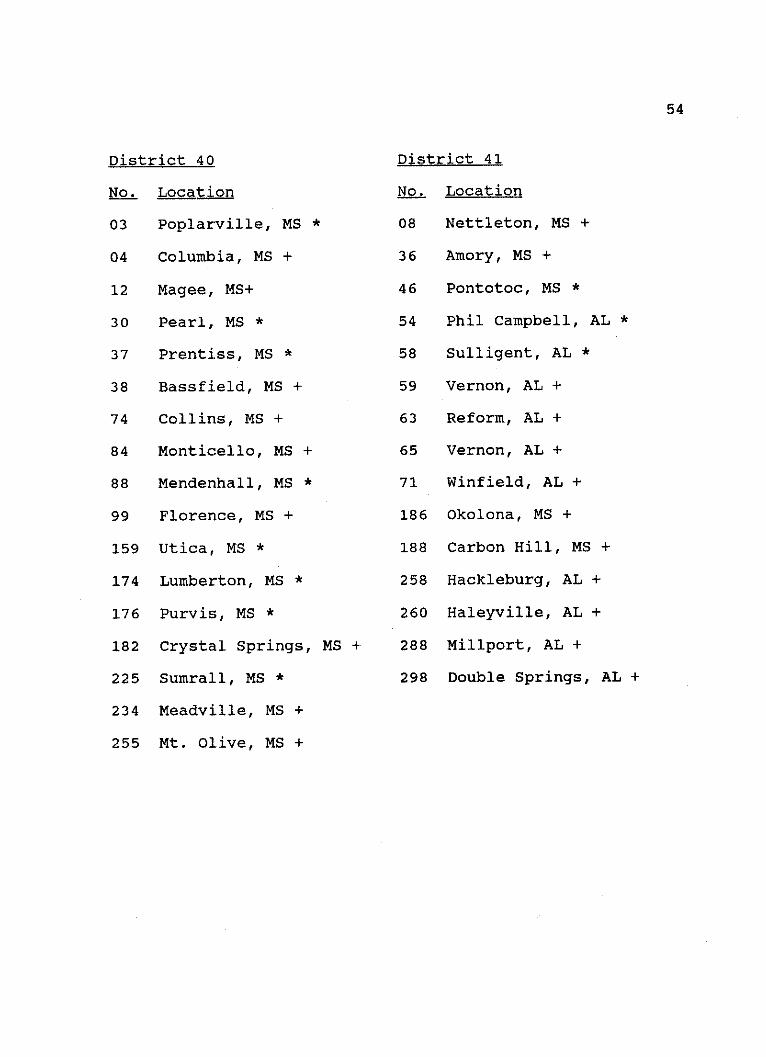
APPENDIX A
STORE LOCATION BY DISTRICT AND STORE NUMBER
41
42
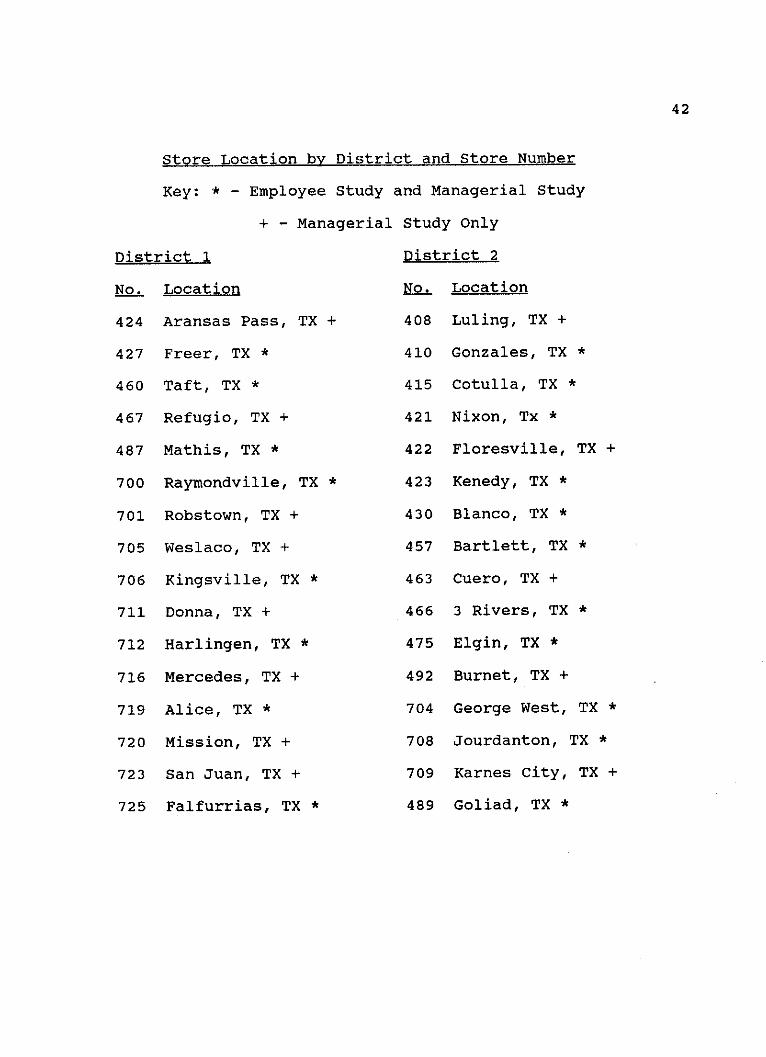
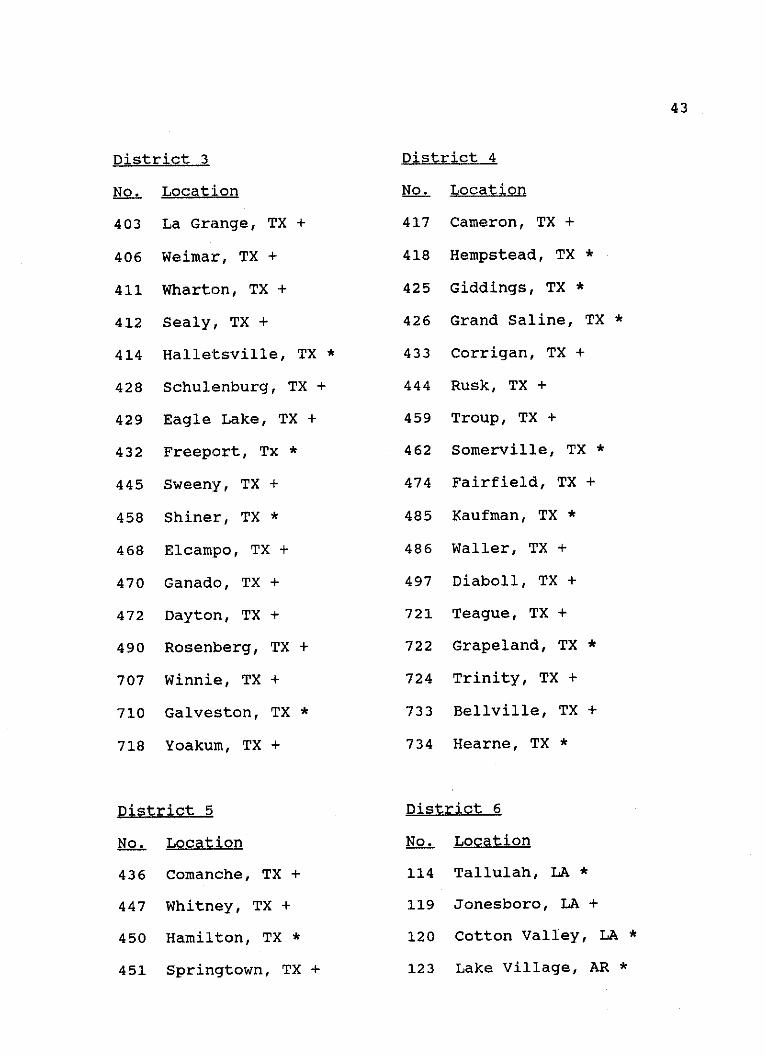
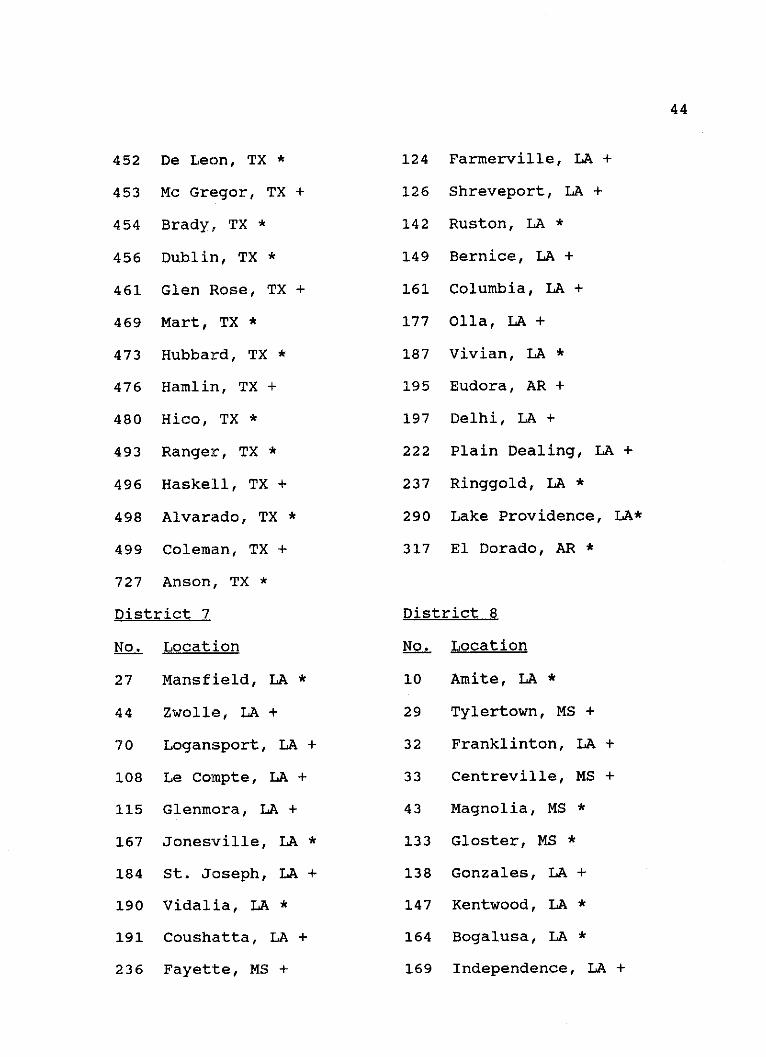
Store Location by District and Store Number
Key: * - Employee Study and Managerial Study
+ - Managerial Study Only
District 2 _District 2
No. Location No Location
424 Aransas Pass, TX + 408 Luling, TX +
427 Freer, TX * 410 Gonzales, TX *
460 Taft, TX * 415 Cotulla, TX *
467 Refugio, TX + 421 Nixon, Tx *
487 Mathis, TX * 422 Floresville, TX +
700 Raymondville, TX * 423 Kenedy, TX *
701 Robstown, TX + 430 Blanco, TX *
705 Weslaco, TX + 457 Bartlett, TX *
706 Kingsville, TX * 463 Cuero, TX +
711 Donna, TX + 466 3 Rivers, TX *
712 Harlingen, TX * 475 Elgin, TX *
716 Mercedes, TX + 492 Burnet, TX +
719 Alice, TX * 704 George West, TX *
720 Mission, TX + 708 Jourdanton, TX *
723 San Juan, TX + 709 Karnes City, TX +
725 Falfurrias, TX * 489 Goliad, TX *
District 3
No. Location
403 La Grange, TX +
406 Weimar, TX +
411 Wharton, TX +
412 Sealy, TX +
414 Halletsville, TX *
428 Schulenburg, TX +
429 Eagle Lake, TX +
432 Freeport, Tx *
445 Sweeny, TX +
458 Shiner, TX *
468 Elcampo, TX +
470 Ganado, TX +
472 Dayton, TX +
490 Rosenberg, TX +
707 Winnie, TX +
710 Galveston, TX *
718 Yoakum, TX +
District 5
No. Location
436 Comanche, TX +
447 Whitney, TX +
450 Hamilton, TX *
451 Springtown, TX +
District 4
No. Location
417 Cameron, TX +
418 Hempstead, TX *
425 Giddings, TX *
426 Grand Saline, TX *
433 Corrigan, TX +
444 Rusk, TX +
459 Troup, TX +
462 Somerville, TX *
474 Fairfield, TX +
485 Kaufman, TX *
486 Waller, TX +
497 Diaboll, TX +
721 Teague, TX +
722 Grapeland, TX *
724 Trinity, TX +
733 Bellville, TX +
734 Hearne, TX *
District 6
No. Location
114 Tallulah, LA *
119 Jonesboro, LA +
120 Cotton Valley, LA *
123 Lake Village, AR *
43
452 De Leon, TX *
453 Mc Gregor, TX +
454 Brady, TX *
456 Dublin, TX *
461 Glen Rose, TX +
469 Mart, TX *
473 Hubbard, TX *
476 Hamlin, TX +
480 Hico, TX *
493 Ranger, TX *
496 Haskell, TX +
498 Alvarado, TX *
499 Coleman, TX +
727 Anson, TX *
District 7
No. Location
27 Mansfield, LA *
44 Zwolle, LA +
70 Logansport, LA +
108 Le Compte, LA +
115 Glenmora, LA +
167 Jonesville, LA *
184 St. Joseph, LA +
190 Vidalia, LA *
191 Coushatta, LA +
236 Fayette, MS +
124
126
142
149
161
177
187
195
197
222
237
290
317
Farmerville, LA +
Shreveport, LA +
Ruston, LA *
Bernice, LA +
Columbia, LA +
Olla, LA +
Vivian, LA *
Eudora, AR +
Delhi, LA +
Plain Dealing, LA +
Ringgold, LA *
Lake Providence, LA*
El Dorado, AR *
District 8
No. Location
10 Amite, LA *
29 Tylertown, MS +
32 Franklinton, LA +
33 Centreville, MS +
43 Magnolia, MS *
133 Gloster, MS *
138 Gonzales, LA +
147 Kentwood, LA *
164 Bogalusa, LA *
169 Independence, LA +
44
245 Port Gibson, MS *
246 Mansura, LA +
434 Pineland, TX *
465 San Augustine, TX +
479 Timpson, TX +
488 Huntington, TX +
District 9
No. Location
40 Zachary, LA +
93 Church Point, LA +
101 Port Barre, LA +
104 Cottonport, LA *
113 Sunset, LA +
116 Breaux Bridge, LA +
117 Mamou, LA +
122 St. Martinville, LA +
146 Napoleonville, LA +
158 Franklin, LA +
165 Maringouin, LA +
175 Jeanerette, LA +
218 Ville Platte, LA *
227 Arnaudville, LA *
District 11
179 Clinton, LA +
185 Liberty, MS *
198 Gramercy, LA *
265 Ponchatoula, LA *
273 Norco, LA *
285 Woodville, MS +
168 McComb, MS +
District 10
No. Location
41 Kaplan, LA *
62 DeQuincey, LA *
68 Rayne, LA +
102 Welsh, LA *
106 Erath, LA *
131 Lake Charles, LA *
150 Lake Arthur, LA *
178 Vinton, LA *
228 Iowa, LA +
231 Oberlin, LA *
239 Merryville, LA *
244 Basile, LA +
318 Kinder, LA +
420 Newton, TX +
471 Buna, TX *
491 Kirbyville, TX *
District 12
45
No. Location
02 Jackson, MS +
17 Jackson, MS +
34 Vicksburg, MS *
103 Pelahatchie, MS +
125 Morton, MS *
136 Brandon, MS +
153 Brandon, MS *
224 Raymond, MS +
235 Flora, MS *
287 Rolling Fork, MS +
District 13
No. Location
155 Jackson, MS +
(Old Canton)
District 20
No. Location
438 Olney, TX *
441 Celina, TX *
442 Electra, TX +
443 Pilot Point, TX *
446 Seymour, TX *
478 Princeton, TX *
No. Location
01 Meridian, MS *
06 Beaumont, MS +
07 Union, MS *
09 Richton, MS *
11 Leaksville, MS *
16 State Line, MS *
20 Heidelberg, MS *
82 Ellisville, MS *
109 Bay Springs, MS *
112 Dekalb, MS +
128 Wiggins, MS *
213 Lucedale, MS *
284 Taylorsville, MS *
291 Newton, MS +
293 Raleigh, MS *
702 Waynesboro, MS *
737 Quitman, MS *
District 21
No. Location
407 Quanah, TX *
413 Henrietta, TX +
455 Nocona, TX +
659 Carnegie, OK *
661 Konawa, OK +
662 Walter, OK *
46
650
696
703
494
495
Healdton, OK +
Waurika, OK *
Whitewright, TX +
Bridgeport, TX +
Decatur, TX *
District 22
No. Location
157 Greenwood, AR +
280 Danville, AR *
310 Mulberry, AR *
654 Madill, OK *
655 Antlers, OK +
657 Wilburton, OK *
658 Okemah, OK +
664 Coalgate, OK *
667 Drumright, OK *
671 Tishomingo, OK *
674 Talihina, OK +
678 Prague, OK *
684 Eufaula, OK *
687 Haskell, OK *
663 Watonga, OK +
665 Snyder, OK +
676 Guthrie, OK +
679 Sayre, OK *
685 Apache, OK +
688 Comanche, OK +
689 Chickasha, OK +
690 Blanchard, OK +
697 Fredrick, OK +
698 Hollis, OK *
District 23
No. Location
612 Seneca, MO *
618 Concordia, MO+
620 Windsor, MO +
627 Coffeyville, KS *
628 Eureka, KS +
629 Cherryvale, KS *
630 Yates Center, KS +
631 Caney, KS +
632 Oswego, KS *
633 Girard, KS +
634 Osawatomie, KS *
635 Neodesha, KS +
636 Columbus, KS *
668 Chelsea, OK +
47
691 McAlester, OK *
692 Heavener, OK +
693 Wewoka, OK *
695 Stroud, OK +
699 Spiro, OK +
District 24
No. Location
269 Clinton, AR *
302 Cave City, AR +
305 Salem, AR +
314 Marshall, AR +
604 Steelville, MO *
607 Campbell, MO +
608 St. James, MO *
609 Willow Springs, MO +
610 Marble Hill, MO *
611 Portageville, MO +
614 Hillsboro, MO +
617 Dixon, MO *
619 Cabool, MO +
621 Mansfield, MO *
622 Hayti, MO +
811 Piggott, AR *
District 26
No. Location
107 Stamps, AR +
669
670
Tonkawa, OK *
Hominy, OK +
District 25
No. Location
42 Byhalia, MS +
163 Hernando, MS +
211 Hughes, AR +
248 Star City, AR +
254 Elaine, AR *
266 Marion, AR +
267 McCrory, AR *
277 England, AR *
300 Augusta, AR *
301 Earle, AR +
306 Bald Knob, AR +
307 Hazen, AR *
309 Marianna, AR +
315 Des Arc, AR +
316 Wynne, AR +
814 Somerville, TN +
District 27
No. Location
25 Ashland, MS *
48
145 Smackover, AR *
152 Glenwood, AR +
252 Foreman, AR *
253 Murfreesboro, AR +
270 MT Ida, AR +
303 Prescott, AR *
304 Gurdon, AR +
431 Mt. Vernon, TX +
440 Daingerfield, TX +
464 Hughes Springs, TX *
477 Honey Grove, TX +
481 Naples, Tx +
484 Winnsboro, TX +
675 Valiant, OK *
717 Pittsburg, TX *
806 Texarkana, AR +
District 28
No. Location
807 Portland, TN *
808 Livingston, TN +
818 Celina, TN *
819 Red Boiling Springs, TN+
821 White House, TN *
826 Elkton, KY *
827 Springfield, KY +
828 Liberty, KY *
39
48
52
56
166
250
271
801
803
804
815
823
824
853
Baldwyn, MS *
Ripley, MS *
Walnut, MS *
Red Bay, AL *
Belmont, MS +
Florence, AL +
Cherokee, AL *
Adamsville, TN +
Middleton, TN +
Bells, TN *
Greenfield, TN +
Dyer, TN *
Newbern, TN +
Lexington, TN +
District 29
No. Location
05 Drew, MS *
15 Shelby, MS +
18 Greenville, MS *
23 Ackerman, MS *
24 Leland, MS *
26 Yazoo City, MS +
53 Houston, MS +
89 Water Valley, MS +
49
829 Hartsville, TN +
830 Jellico, TN *
831 Linden, TN +
855 Hohenwald, TN *
District 30
No. Location
79 Huntsville, AL +
141 Collinsville, AL +
200 CourtLand, AL +
205 Crossville, AL +
207 Stevenson, AL +
216 Decatur, AL *
217 Henegar, AL +
238 Rainesville, AL +
256 Elgin, AL *
286 Hartselle, AL *
289 New Hope, AL +
294 Lexington, AL +
297 Madison, AL *
299 Moulton, AL +
822 Collinwood, TN +
832 Loretto, TN *
91 Bruce, MS +
94 Cleveland, MS *
105 Macon, MS +
173 Belzoni, MS +
180 Rosedale, MS +
247 Lexington, MS *
295 Coffeeville, MS *
319 Canton, MS *
District 31
No. Location
47 Montevallo, AL +
55 Columbiana, AL +
111 Springville, AL *
134 Heflin, AL +
181 Jacksonville, AL*
196 Piedmont, AL *
201 Ragland, AL +
206 Childersburg, AL *
230 Lineville, AL +
232 Ashland, AL +
233 Lincoln, AL *
249 Ashville, AL *
261 Cordova, AL *
268 Goodwater, AL +
275 Wedowee, AL +
282 Warrior, AL *
50
District 32
No. Location
35 Jackson, AL +
69 Citronelle, AL *
76 Chickasaw, AL +
81 Moss Point, MS +
86 Atmore, AL *
87 Grove Hill, AL +
92 Evergreen, AL *
100 Georgiana, AL *
137 Bayou La Batre, AL *
143 Fairhope, AL +
156 Chatom, AL *
194 Century, FL *
202 Robertsdale, AL *
214 Monroeville, AL +
219 Brewton, AL +
241 Frisco City, AL +
736 Bay Minette, AL +
District 34
No. Location
19 Sampson, AL +
67 Brundidge, AL *
72 Opp, AL +
73 Abbeville, AL *
75 Geneva, AL *
District 33
No. Location
14 Greensboro, AL *
21 Uniontown, AL +
49 York, AL +
50 Wetumpka, AL *
51 Livingston, AL +
57 Thomasville, AL +
60 Eutaw, AL *
61 Camden, AL +
66 Maplesville, AL +
80 Centreville, AL *
183 Selma, AL *
193 Fort Deposit, AL +
203 Gilbertown, AL *
208 Linden, AL +
240 Clanton, AL +
243 Jemison, AL *
272 Selma, AL +
District 35
No. Location
90 Hartford, AL *
95 Blountstown, FL +
96 Bonifay, FL *
118 Chipley, FL *
130 Headland, AL +
51
78
97
98
132
263
283
726
Luverne, AL *
Elba, AL +
Clayton, AL *
Union Springs, AL +
Eufaula, AL +
Daleville, AL +
Florala, AL +
District 36
No. Location
351 Alachua, FL +
509 Alma, GA *
513 Adel, GA +
517 Rochelle, GA +
518 Lakeland, GA *
521 Newton, GA *
522 Arlington, GA H
524 Pearson, GA *
525 Ocilla, GA *
528 Edison, GA +
531 Woodbine, GA *
532 Doerun, GA +
538 Nashville, GA
+
172 Apalachicola, FL *
210 Graceville, FL *
220 Wewahitchka, FL *
223 Port St. Joe, FL *
226 Ashford, AL +
229 Malone, FL *
278 Slocomb, AL +
281 Cottonwood, AL +
296 Havana, FL +
500 Donalsonville, FL *
501 Colquitt, GA +
District 37
No. Location
135 Dadeville, AL *
259 Lafayette, AL *
502 Pine Mountain, GA *
503 Butler, GA +
515 Tabotton, GA +
516 Greenville, GA *
527 Ellaville, GA *
529 Buena Vista, GA *
535 Dawson, GA *
536 Hogansville, GA +
547 Reynolds, GA +
550 Franklin, GA *
564 Roberta, GA *
52
+
549 Pelham, GA +
555 Cochran, GA *
560 Blackshear, GA *
573 Quitman, GA +
576 Ashburn, GA +
District 38
No. Location
504 Chickamauga, GA *
505 Eatonton, GA +
510 Fairmont, GA +
512 Tallapoosa, GA *
537 Villa Rica, Ga *
541 Ellijay, GA +
542 Chatsworth, GA *
544 Acworth, GA +
545 Clarksville, GA *
551 Lavonia, GA +
557 Lincointon, GA *
562 Jasper, GA *
568 Tunnel Hill, GA *
569 McCaysville, GA +
574 Belton, SC +
580 Pickens, SC *
583 Ware Shoals, SC +
588 Abbeville, SC +
589 West Minster, SC +
566 Richland, GA +
567 Woodbury, GA +
570 Manchester, GA *
571 Cuthbert, GA +
572 Montezuma, GA +
District 39
No. Location
508 Wrens, GA +
514 Wadley, GA *
519 Soperton, GA +
526 Lyons, GA +
530 Twin City, GA +
540 Metter, GA *
556 Harlem, GA +
559 Springfield, GA +
561 Millen, GA +
563 Pembroke, GA +
575 Sylvania, GA +
581 St. Matthews, SC +
582 Denmark, SC *
584 St. Stephen, SC +
585 Holly Hill, SC *
586 Kershaw, SC +
587 Loris, SC +
53
District 40
No. Location
03 Poplarville, MS *
04 Columbia, MS +
12 Magee, MS+
30 Pearl, MS *
37 Prentiss, MS *
38 Bassfield, MS +
74 Collins, MS +
84 Monticello, MS +
88 Mendenhall, MS *
99 Florence, MS +
159 Utica, MS *
174 Lumberton, MS *
176 Purvis, MS *
182 Crystal Springs, MS +
225 Sumrall, MS *
234 Meadville, MS +
255 Mt. Olive, MS +
District 41
No. Location
08 Nettleton, MS +
36 Amory, MS +
46 Pontotoc, MS *
54 Phil Campbell, AL *
58 Sulligent, AL *
59 Vernon, AL +
6:3 Reform, AL +
65 Vernon, AL +
71 Winfield, AL +
186 Okolona, MS +
188 Carbon Hill, MS +
258 Hackleburg, AL +
260 Haleyville, AL +
288 Millport, AL +
298 Double Springs, AL +
54

APPENDIX B
THE ORGANIZATION RESPONSIVENESS QUESTIONNAIRE
55
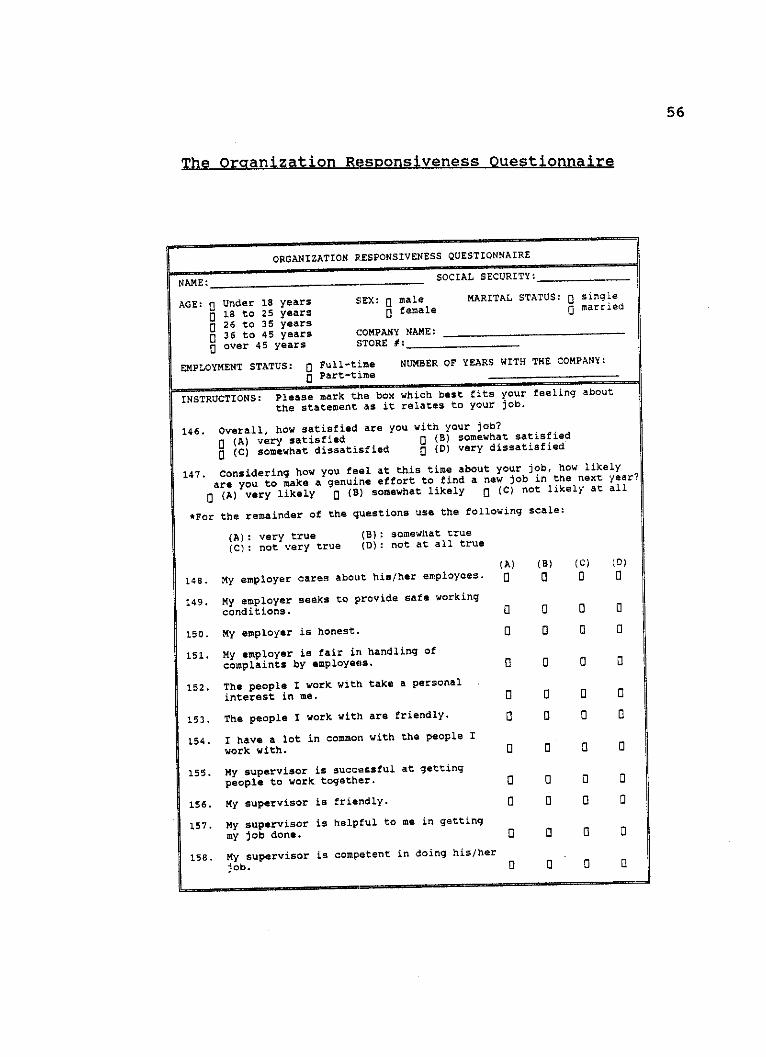
56
The Organization Responsiveness Questionnaire
ORGANIZATION RESPONSIVENESS QUESTIONNAIRE
NAME: SOCIAL SECURITY:
AGE: C1Under 18 years SEX: g male MARITAL STATUS: s single
18 to 25 years female QmarriedC 26 to 35 years
36 to 45 years COMPANY NAME:
over 45 years STORE #:
EMPLOYMENT STATUS: o Full-time NUMBER OF YEARS WITH THE COMPANY:
Part-time
INSTRUCTIONS: Please mark the box which best fits your feeling about
the statement as it relates to your job.
146. Overall, how satisfied are you with your job?
o (A) very satisfied 0 (B) somewhat satisfied
o (C) somewhat dissatisfied 0 (D) very dissatisfied
147. Considering how you feel at this time about your job, how likely
are you to make a genuine effort to find a new job in the next year?
0 (A) very likely 0 (B) somewhat likely a (C) not likely at all
*For the remainder of the
(A) : very true(C): not very true
questions use the following scale:
(B): somewhat true(D) : not at all true
148. My employer cares about his/her employees.
149. My employer seeks to provide safe working
conditions.
150. My employer is honest.
151. My employer is fair in handling of
complaints by employees.
152. The people I work with take a personal
interest in me.
153. The people I work with are friendly.
154. 1 have a lot in common with the people I
work with.
155. My supervisor is successful at getting
people to work together.
156. My supervisor is friendly.
157. My supervisor is helpful to me in getting
my job done.
158. My supervisor is competent in doing his/her
job.
(A) (B) (C) (D)
0 0 0 9
0
0
0
0
0
0
0
0
0 0 0 0
0
0
0
0
0
0
0
0
0 0 0 0
0
0
0
0
0
0
0 0 0 0
0 0 0 0
I
00
.. ,.... rtr nr+rrrr TTV.
i
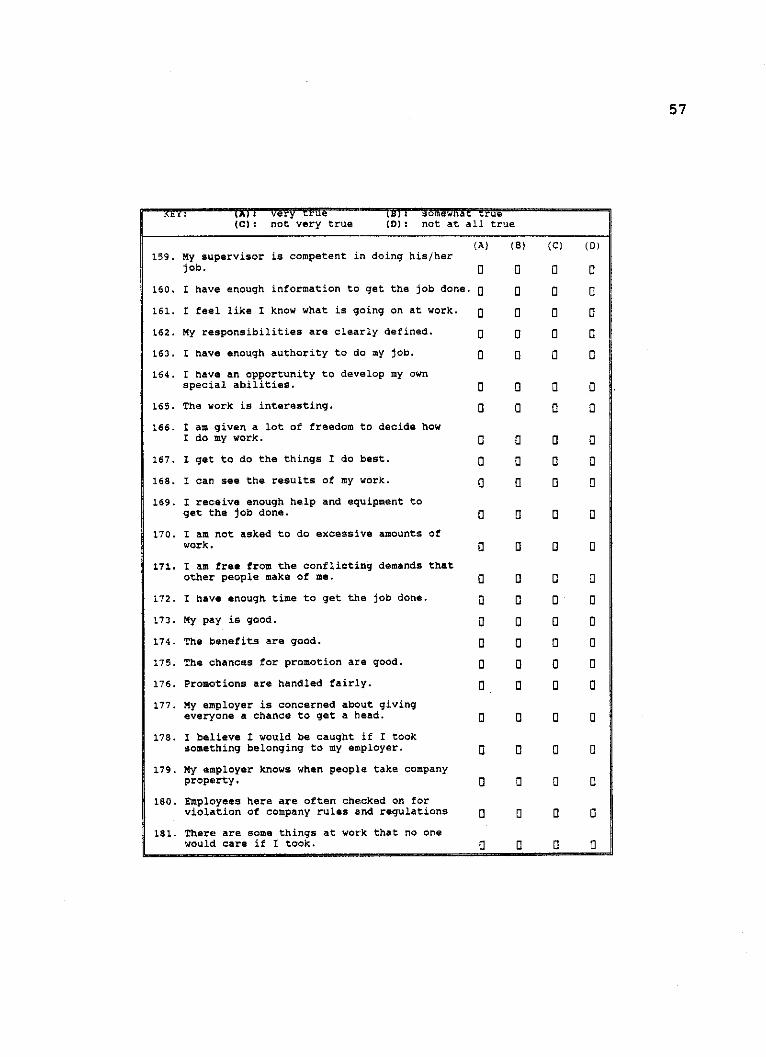
-: very true (): somewnat true(C): not very true (D): not at all true
(A) (B) (C) (D)159. My supervisor is competent in doing his/her
job.
160. I have enough information to get the job done.
161. I feel like I know what is going on at work.
162. My responsibilities are clearly defined.
163. I have enough authority to do my job.
164. I have an opportunity to develop my ownspecial abilities.
165. The work is interesting.
166. I am given a lot of freedom to decide howI do my work.
167. 1 get to do the things I do best.
168. 1 can see the results of my work.
169. 1 receive enough help and equipment toget the job done.
170. 1 am not asked to do excessive amounts ofwork.
171. I am free from the conflicting demands thatother people make of me.
172. 1 have enough time to get the job done.
173. My pay is good.
174. The benefits are good.
175. The chances for promotion are good.
176. Promotions are handled fairly.
177. My employer is concerned about givingeveryone a chance to get a head.
178. 1 believe I would be caught if I tooksomething belonging to my employer.
179. My employer knows when people take companyproperty.
180. Employees here are often checked on forviolation of company rules and regulations
181. There are some things at work that no onewould care if I took.
0
0
0
0
0
0
0
0
0
0
0
0
0
0
0
0
0
0
0
0
0
0
0
0
0
0
0
0
0
0
0
0
0
0
0
0
0
0
0
0
0 0 0 0
a 0 0 0
U
0
0
0
0
0
0
0
0
0
0
0
0
0
0
0
0
0
0
0
0
0
0
0
0 0 0 0
0 0 0 0
0 0 0 0
0 0 0 0
0 0 0 0
57

APPENDIX C
EMPLOYMENT INVENTORY/CUSTOMER SERVICE INVENTORY
58
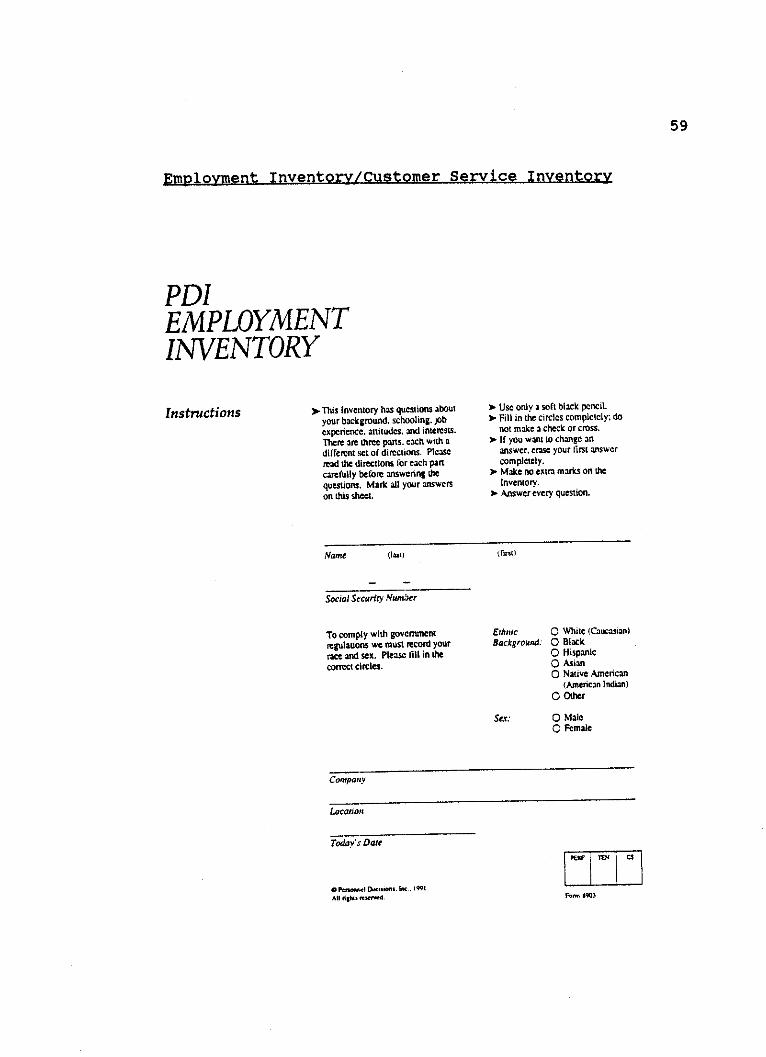
59
fployment Inventory/Customer Service Inventory
PDIEMPLOYMENTINVENTORY
> This Inventory has questions aboutyour background. schooling, jobexperience, attitudes. and interests.There are three pans. each with adifferent set of directions. Pleaseread the directions for each partcarefully before answering thequestions. Mark all your answerson this sheet.
* Use only a soft black pencil.> Fill in the circles completely; do
not make a check or cross.* If you want to change an
answer. erase your tirst answercompletely.
* Make no extra marks on theInventory.
s Answer every question.
Name (last (firso
Social Security Number
To comply with governmentregulations we must record yourrace and sex. Please lilt in thecorrect circles.
Ethnic 0 White (Caucasian)Background: 0 Black
o Hispanico Asiano Native American
(American Indian)O other
Sex: 0 Male0 Female
Company
Location
Today's Date
O Personnel Decissons. Inc., 1991All nigts tescrd.
PERF
LwCl
frm #903
Instructions
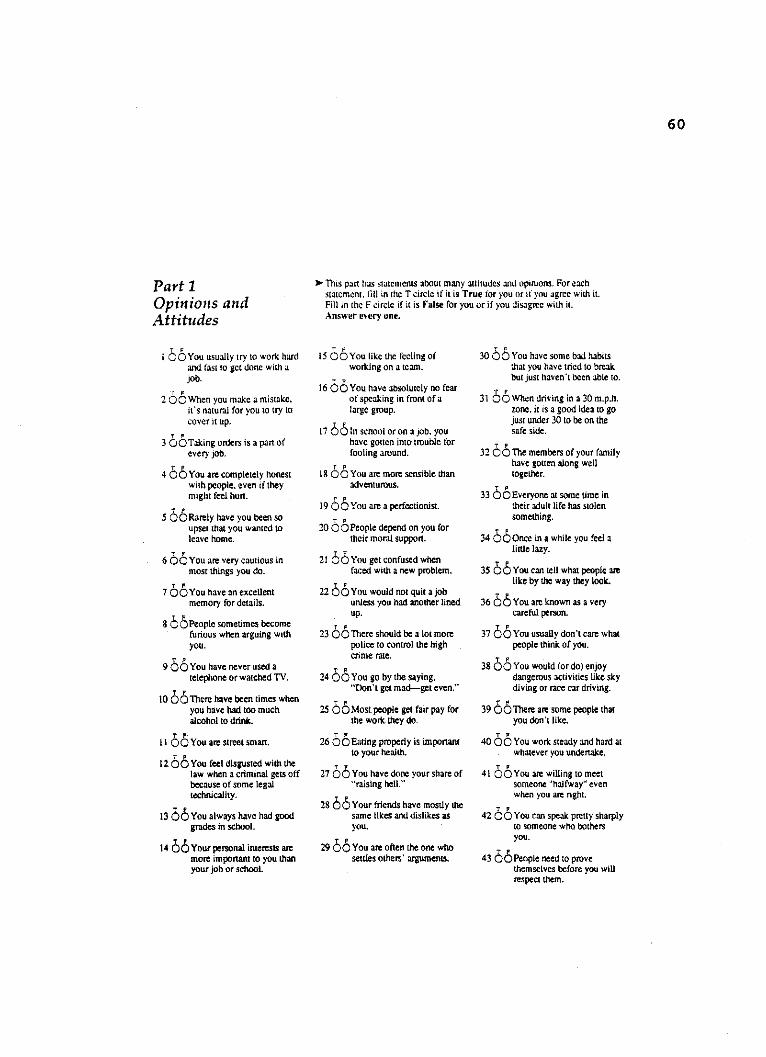
Part 1Opinions andAttitudes
> This part has statements about many attitudes and opinions. For eachstatement. till in the T circle if it is True for you or if you agree with it.Fill in the F circle ifit is False for you or if you disagree with it.Answer every one.
1 00 You usually try to work hardand fast to get done with ajob.
2 00 When you make a mistake,it's natural for you to try tocover it up.
3 OoQTaking orders is a part ofevery job.
4 0 0 You are completely honestwith people. even if theymight feel hurt.
T F5 0ORarely have you been so
upset that you wanted toleave home.
6 00 You are very cautious inmost things you do.
7 OYou have an excellentmemory for details.
8 0 People sometimes becomefurious when arguing withyou.
9 00 You have never used atelephone or watched TV.
T F10 0 0 There have been times whenyou have had too muchalcohol to drink.
I1 00 You are street smart.
12 00 You feel disgusted with thelaw when a criminal gets offbecause of some legaltechnicality.
13 00 You always have had goodgrades in school.
14 00 Your personal interests aremore important to you thanyour job or school.
15 00 You like the feeling ofworking on a team.
T ,16 OO You have absolutely no fear
of speaking in front of alarge group.
SF17 O Oin school or on a job, you
have gotten into trouble forfooling around.
18 00 You are more sensible thanadventurous.
19 OO You are a perfectionist.T F
20 O O People depend on you fortheir moral support.
T F21 O You get confused whenfaced with a new problem.
22 OO You would not quit a jobunless you had another linedup.
23 00 There should be a lot morepolice to control the highcrime rate.
24 00 You go by the saying,"Don't get mad-get even."
2.5 6 Most people get fair pay forthe work they do.
26 0 Eating properly is importantto your health.
T F27 00 You have done your share of
"raising hell."T F
same likes and dislikes asyou.
T F29 00 You are often the one who
settles others' arguments.
30 0 0 You have some bad habitsthat you have tried to breakbut just haven't been able to.
- F31 00 When driving in a 30 m.p.h.
zone. it is a good idea to gojust under 30 to be on thesafe side.
V ,32 OOThe members of your family
have gotten along welltogether.
33 00 Everyone at some time intheir adult life has stolensomething.
34 00 Once in a while you feel alittle lazy.
35 OOYou can tell what people arelike by the way they look.
36 00 You are known as a verycareful person.
37 00 You usually don't care whatpeople think of you.
TPF38 00 You would (or do) enjoy
dangerous activities like skydiving or race car driving.
39 6 There are some people thatyou don't like.
40 6 6 You work steady and hard atwhatever you undertake.
T F41 0 You are willing to meet
someone "halfway" evenwhen you are right.
T P42 00 You can speak pretty sharply
to someone who bothersyou.
T ,43 00 People need to prove
themselves before you willrespect them.
60
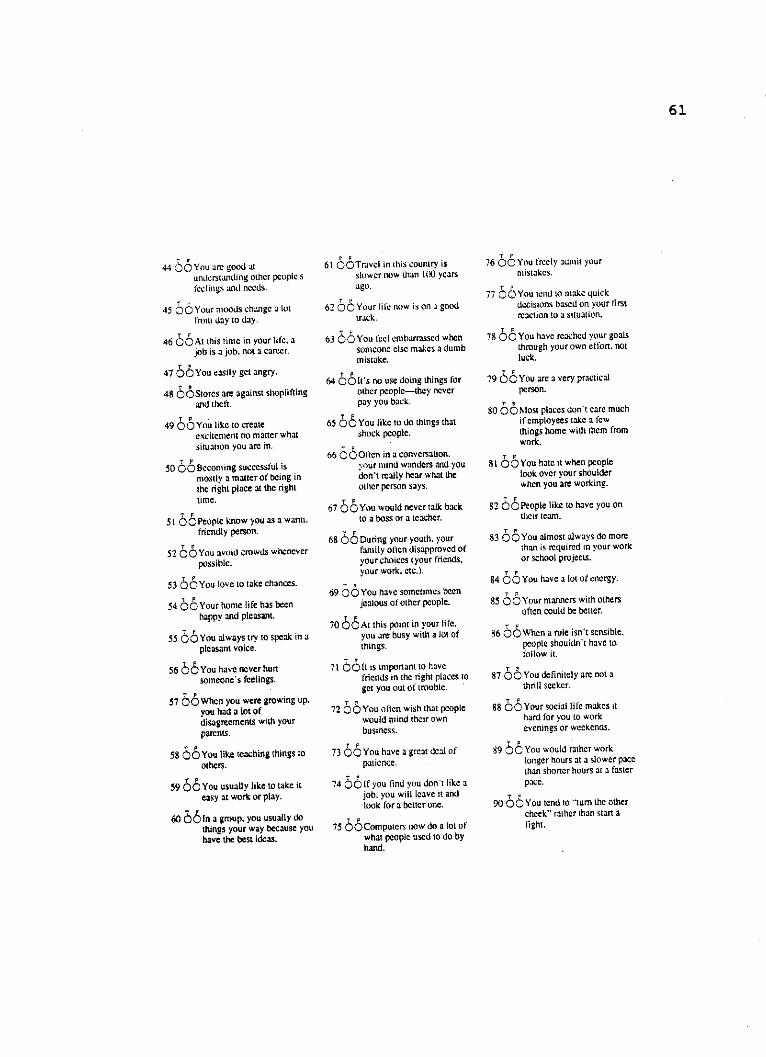
4400 You are good atunderstanding other people'sfeelings and needs.
45 00 Your moods change a lotfront day to day.
TF
46 QOAt this time in your life, ajob is a job, not a career.
TF
47 00 You easily get angry.
48 O Stores are against shopliftingand theft.
T F49 0 You like to create
excitement no matter whatsituation you are in.
50 00 Becoming successful ismostly a matter of being inthe right place at the righttime.
5 0 CPeople know you as a warm.friendly person.
52 00 You avoid crowds wheneverpossible.
53 0 You love to take chances.
54 6 0 Your home life has beenhappy and pleasant.
55 (D6 You always try to speak in apleasant voice.
56 60 You have never hurtsomeone's feelings.
T F.57 660When you were growing up.
you had a lot ofdisagreements with yourparents.
58 OCYou like teaching things toothers.
59 66 You usually like to take iteasy at work or play.
60 60In a group, you usually dothings your way because youhave the best ideas.
61 O6Travel in this country isslower now than l00 yearsago.
62 d0 Your lile now is on a goodtrack.
63 00 You feel embarrassed whensomeone else makes a dumbmistake.
64 O QIt's no use doing things forother people-they neverpay you back.
65 OOYou like to do things thatshock people.
T F66 00O often in a conversation.
'our mind wanders and you
don't really hear what theother person says.
T F67 0 You would never talk back
to a boss or a teacher.
68 06 During your youth, yourfamily often disapproved ofyour choices (your friends,your work, etc.).
TF,
69 00 You have sometimes beenjealous of other people.
TF,
70 OQOAt this point in your life.you are busy with a lot ofthings.
T F
71 O QIt is important to havefriends in the right places toget you out of trouble.
72 0 0 You often wish that peoplewould mind their ownbusiness.
73 00You have a great deal ofpatience.
74 66 If you find you don't like ajob. you will leave it andlook fora better one.
Ta,
75 OoComputers now do a lot ofwhat people used to do byhand.
76 00 You freely admit your
mistakes.
77 o6 You tend to make quickdecisions based on your lirstreaction to a situation.
rF
78 00 You have reached your goalsthrough your own effort, notluck.
79 6 0 You are a very practicalperson.
80 06 Most places don't care muchif employees take a fewthings home with them fromwork.
r 6 You hate it when peoplelook over your shoulderwhen you are working.
82 Q JPeople like to have you ontheir team.
T F83 0 6 You almost always do more
than is required in your workor school projects.
84 OOYou have a lot of energy.TF
85 66 Your manners with othersoften could be better.
TF86 b0wthen a rule isn't sensible,
people shouldn't have tofollow it.
T F87 0 0 You definitely are not a
thrill seeker.
88 00Your social life makes ithard for you to workevenings or weekends.
89 00 You would rather worklonger hours at a slower pacethan shorter hours at a fasterpace.
90 0 You tend to 'turn the othercheek" rather than start alight.
61
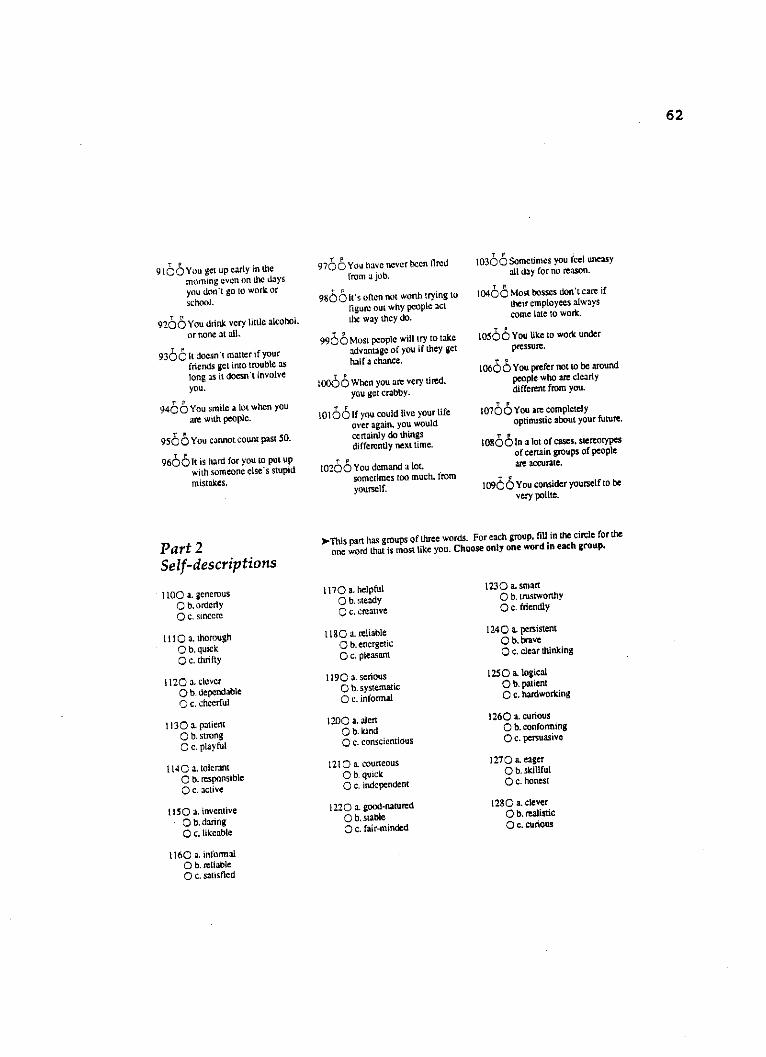
9100 You get up early in themorning even on the daysyou don't go to work orschool,
9200 You drink very little alcohol,or none at all.
9300 It doesn't matter if yourfriends get into trouble aslong as it doesn't involveyou.
TF9400 You simile a lot when you
are with people.
950 0 You cannot count past 50.
9600 It is hard for you to put upwith someone else's stupidmistakes.
.T.F9700p You have never becn fired
from a job.
9800 It's often not worth trying tofigure out why people actthe way they do.
9900 Most people will try to takeadvantage of you if they gethalf a chance.
10000 When you are very tired.you get crabby.
10100 If you could live your lifeover again. you wouldcertainly do things
differently next time.TP'
10200 You demand a lot.sometimes too much. fromyourself.
1030 0 Sometimes you feel uneasy
all day forrno reason.
10400 Most bosses don't care iftheir employees alwayscome late to work.
10500 You like to work underpressure.
1060 You prefer not to be aroundpeople who are clearlydifferent from you.
10700 You are completelyoptimistic about your future.
10800 In a lot of cases. stereotypes
of certain groups of peopleare accurate.
10900 You consider yourself to bevery polite.
Part 2Self-descriptions
1100 a. generous0 b.orderly0 c. sincere
1110 a. thorough0 b.quick0 c. thrifty
1120 a. clever0 b. dependable0 c. cheerful
1130 a. patient0 b. strong0 c. playful
1140 a. tolerant0 b. responsible0 c. active
1150 a. inventive0 b.daring0 c. likeable
1160 a. informal0 b. reliable0 c. satisfied
>This part has groups of three words. For each group. till in the circle for the
one word that is most like you. Choose only one word in each group.
1170 a. helpful0 b. steady0 c. creative
1180 a. reliable0 b. energetic0 c. pleasant
1190 a. serious0 b. systematic0 c. informal
1200 a. alertO b.kind0 c. conscientious
1210 a. courteous0 b. quick
0 c. independent
1220 a. good-natured0 b. stableC c. fair-minded
1230 a. smart0 b. trustworthy0 c. friendly
1240 a. persistent0 b. brave0 c. clear thinking
1250 a. logical0 b. patient0 c. hardworking
1260 a. curious0 b. conforming0 c. persuasive
1270 a. eager0 b. skillful0 c. honest
1280 a. clever
0 b. realistic0 c. curious
62
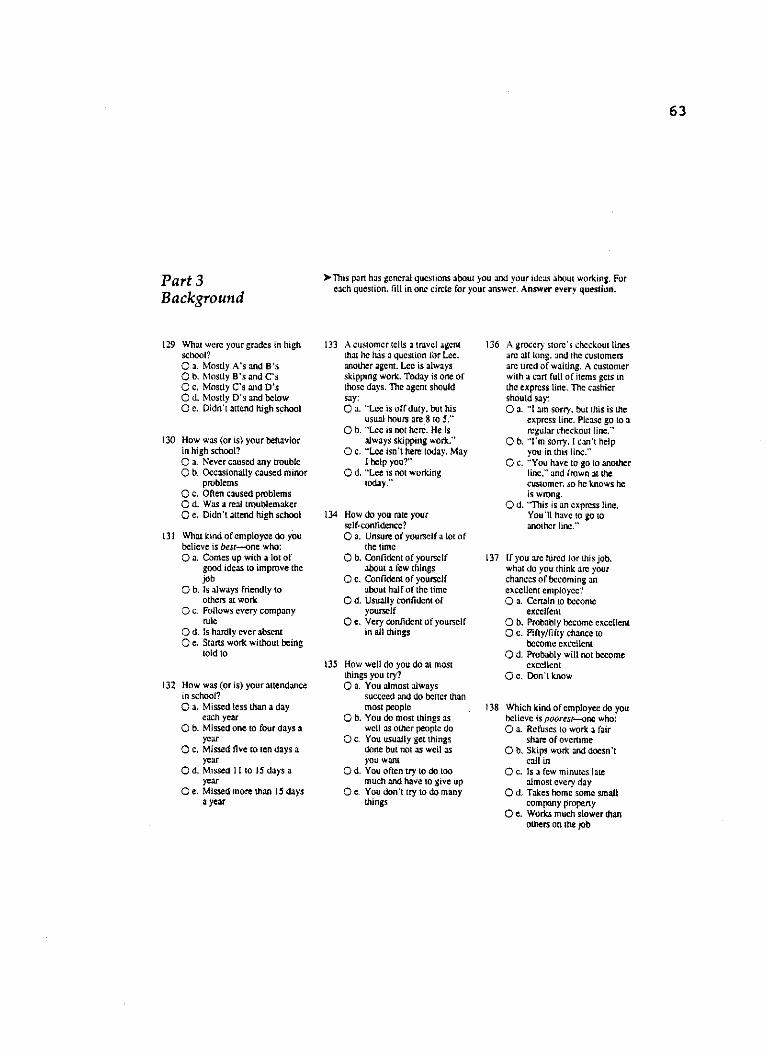
Part 3Background
>'This part has general questions about you and your ideas about working. Foreach question. fill in one circle for your answer. Answer every question.
129 What were your grades in highschool?o a. Mostly A's and B'so b. Mostly B's and C'so c. Mostly C's and D'so d. Mostly D's and belowo e. Didn't attend high school
130 How was (or is) your behaviorin high school?o a. Never caused any troubleo b. Occasionally caused minor
problemso c. Often caused problemso d. Was a real troublemakero e. Didn't attend high school
131 What kind of employee do youbelieve is best-one who:o a. Comes up with a lot of
good ideas to improve thejob
o b. Is always friendly toothers at work
o c. Follows every companyrule
o d. Is hardly ever absento e. Starts work without being
told to
132 How was (or is) your attendancein school?o a. Missed less than a day
each year0 b. Missed one to four days a
yearo c. Missed five to ten days a
yearo d. Missed 11to 15 days a
yearo e. Missed more than 15 days
a year
133 A customer tells a travel agentthat he has a question for Lee,another agent. Lee is alwaysskipping work. Today is one ofthose days. The agent shouldsay:o a. "Lee is off duty, but his
usual hours are 8 to 5."O b. "Lee is not here. He is
always skipping work."o c. "Lee isn't here today. May
I help you?"o d. "Lee is not working
today."
134 How do you rate yourself-confidence?o a. Unsure of yourself a lot of
the timeo b. Confident of yourself
about a few thingso c. Confident of yourself
about half of the timeo d. Usually confident of
yourselfo e. Very confident of yourself
in all things
135 How well do you do at mostthings you try?o a. You almost always
succeed and do better thanmost people
o b. You do most things aswell as other people do
o c. You usually get thingsdone but not as well asyou want
o d. You often try to do toomuch and have to give up
o e. You don't try to do manythings
136 A grocery store's checkout linesare all long, and the customersare tired of waiting. A customerwith a cart full of items gets inthe express line. The cashiershould say:Q a. "I am sorry.but this is the
express line. Please go to aregular checkout line."
0 b. "I'm sorry, I can't helpyou in this line."
o c. "You have to go to anotherline." and frown at thecustomer, so he knows heis wrong.
o d. "This is an express line.You'll have to go toanother line."
137 If you are hired for this job.what do you think are yourchances of becoming anexcellent employee!o a. Certain to become
excellento b. Probably become excellento c. Fifty/fifty chance to
become excellentO d. Probably will not become
excellent0 e. Don't know
138 Which kind of employee do youbelieve is poorest-one who:o a. Refuses to work a fair
share of overtimeo b. Skips work and doesn't
call ino c. Is a few minutes late
almost every dayo d. Takes home some small
company propertyo e. Works much slower than
others on the job
63
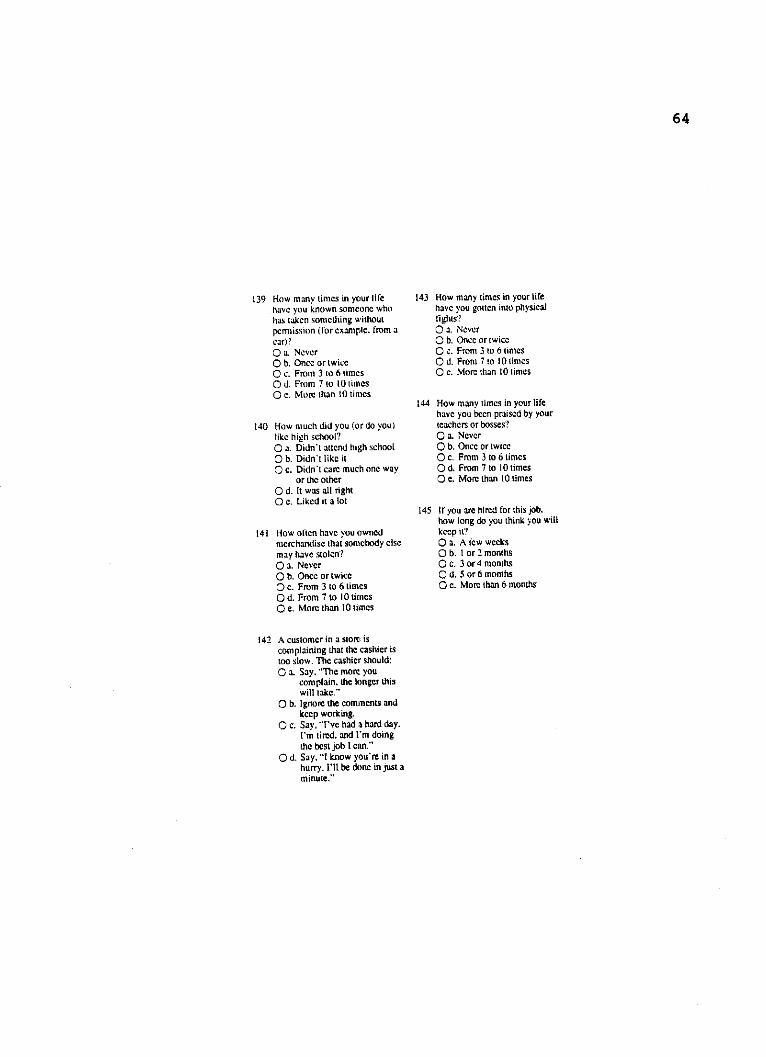
[39 How many times in your lifehave you known someone whohas taken something withoutpermission (for example. from acar)?o a. Nevero b. Once or twiceo c. From 3 to 6 times0 d. From 7 to timeso e. More than 10 times
140 How much did you (or do you)like high school?o a. Didn't attend high schoolo b. Didn't like ito c. Didn't care much one way
or the othero d. It was all rightC e. Liked it a lot
141 How often have you ownedmerchandise that somebody elsemay have stolen?o a. Nevero b. Once or twiceo c. From 3 to 6 timeso d. From 7 to 10 timeso e. More than 10 times
142 A customer in a store iscomplaining that the cashier istoo slow. The cashier should:o a. Say. "The more you
complain, the longer thiswill take."
o b. Ignore the comments andkeep working.
C c. Say."I've had a hard day.I'm tired, and I'm doingthe best job I can."
C d. Say,"I know you're in ahurry. I'll be done in just aminute."
143 How many times in your lifehave you gotten into physicalfights?o a. Nevero b. Once or twiceO c. From 3 to 6 timesC d. From 7 to 10 timeso e. More than 10 times
144 How many times in your lifehave you been praised by yourteachers or bosses?o a. Nevero b. Once or twiceo c. From 3to 6 times0Cd. From 7 to 10timesC e. More than 10 times
145 If you are hired for this job,how long do you think you willkeep it?C a. Afew weekso b. 1 or 2 months0 c. 3 or 4 monthsC d. 5 or 6 monthsC e. More than 6 months
64

APPENDIX D
ANSWER SHEET
65
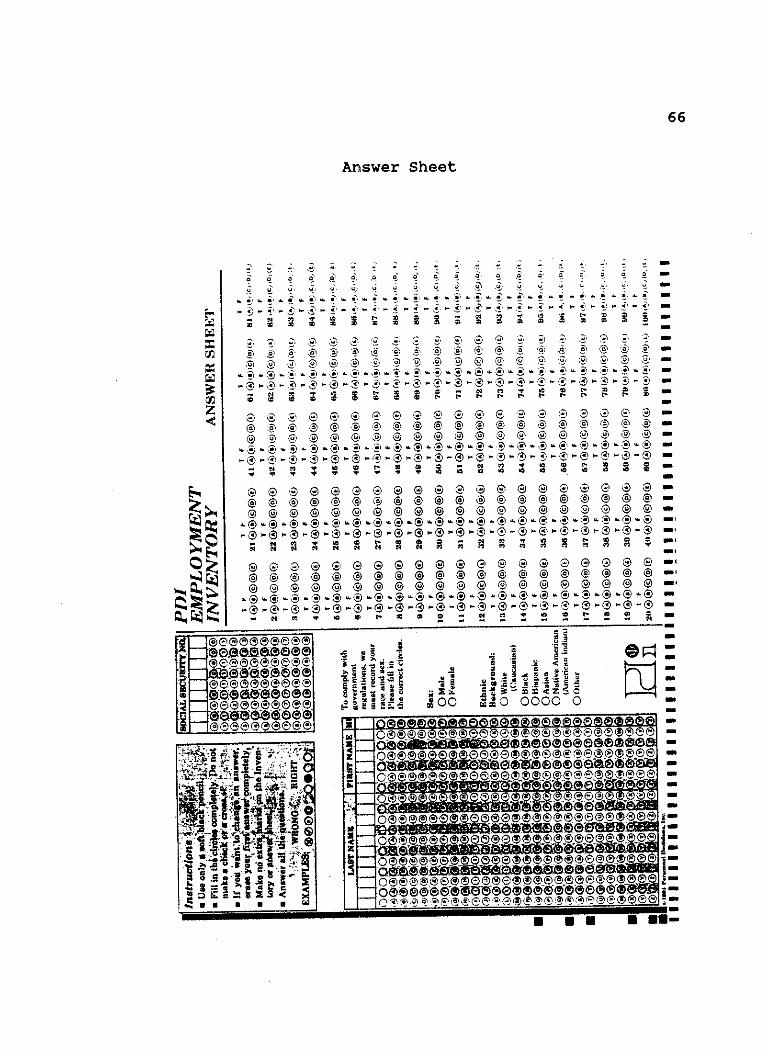
66
Answer Sheet
a Q 6 ala aa a C6 6 6 6 6 a a a.6 -~ V- l u, UJ L J U J" U J ii U U 6J UJ
U U U U 4U 2 & . 2 2 %@
4 - - @ -- ,-.-. - - -at 6' a a a a a a e o &' 6 aa a
- -@ 3' -- -
0 0 ® s 0 ® _ o o -
oooo--0--00@@--0-@@ --- 4 @ -0 2 tt 2 2 2 N 2'- 0 2 - ""
O 0 0 0 0 0 0 0 0 0 0 0 0 0 0 0 0 0 0 0 -
-® ® 0 ® - - - - - -- 0 -0-0-00-00'- N 2 ' 0 2 - e * 0 2 : - N . 2 '9 0 *
N 4 NWN1 Nf N N I N N N , 2 2 2 0 2 2 211 2 2 2 t 1 '9, i
ti U ~ c; C" c 1 CIS fl. i]; )-t
0 0 0 0 0 10y0l0t0_0 0 0 0 0 0J0f0t 0 0 0 -I
ii. V0V"t0 0i. 0 0t . A.0 0 . 0 0v 1r 0 0 0 . 0 0 i .I 0 0 4 4 011i 0 ! 0 -rtIi0-, 0si 0 0 0 0 0,'' 0 0" 0rt 0 0 0r ' 0r - 0 0,s}r- 0 0 0o. 0 -e , Ia 2 2 wt o W ') r 2 .. .,
[ .,-+..-0-0-X0-10-01r -' 5 (
NQ 9 0 2 N 2 ' 0 tIj tr ii !1 1 , 1A 1IV i i y 10.l0M Wi "+t1 . /2~s3 . 400 IL) . 1,N ( t 1 4 .1 Ni
neeeaee@@e
01 000
- eeae®() we
~1 ~~ o e e e
'Iilo4tqEE U U U CE
14emeee
~~ w MI
e .
X c -o o "" ' E .nP -
A *n t U. m'st* ==4
0 I Z00 A0 0000 0
N OS@- fliaee~e@@®O6GfSF -z 00600 r z®00(e®@®®O®®®®0® -
Qc~us. - En®.®®@®s®S®®®®Kw -
- -
w
o®®@@0®@*.* jmooseee eoesoeooeosoee1Ito®®®®o®®®®®e®®os®®0600®e~ ®®-S ame t eS&S@0es@a0oosei
m_ -i---
MI)
Iz
44
! i - ....
i
wr r.+.r.ri r
... --
. ... - -
67
1ZCWc.id.T d a U ® ME-
*.33.*..
5 -
-7J{ G-
*-
* 2 Cr-C CO-
t.- C' . . .. .t - l
DAG, x
@ @ @ c@ @a@s@
o c; e @
- * -
4- -
- se-
t0 0 CD "3 0 N 0 0D03 -N N N N 0 N0 0
0 0 a lo: 0 ;0 t '0 J0 0 sc1 o a;0 0 (0 0
_ --
L.;-
- - -,t rR -
. i < 5<" t rt r< ! ' 4 -<<
a) a' a . o a i; 5 ... o n a
.. .c.- .$ ."[_5 " aC - 4. t rN, ,Na_ r -r ; r" a : .. a +-< .
2"a " r 2t r < " '

APPENDIX E
EMPLOYEE RATING FORM
68
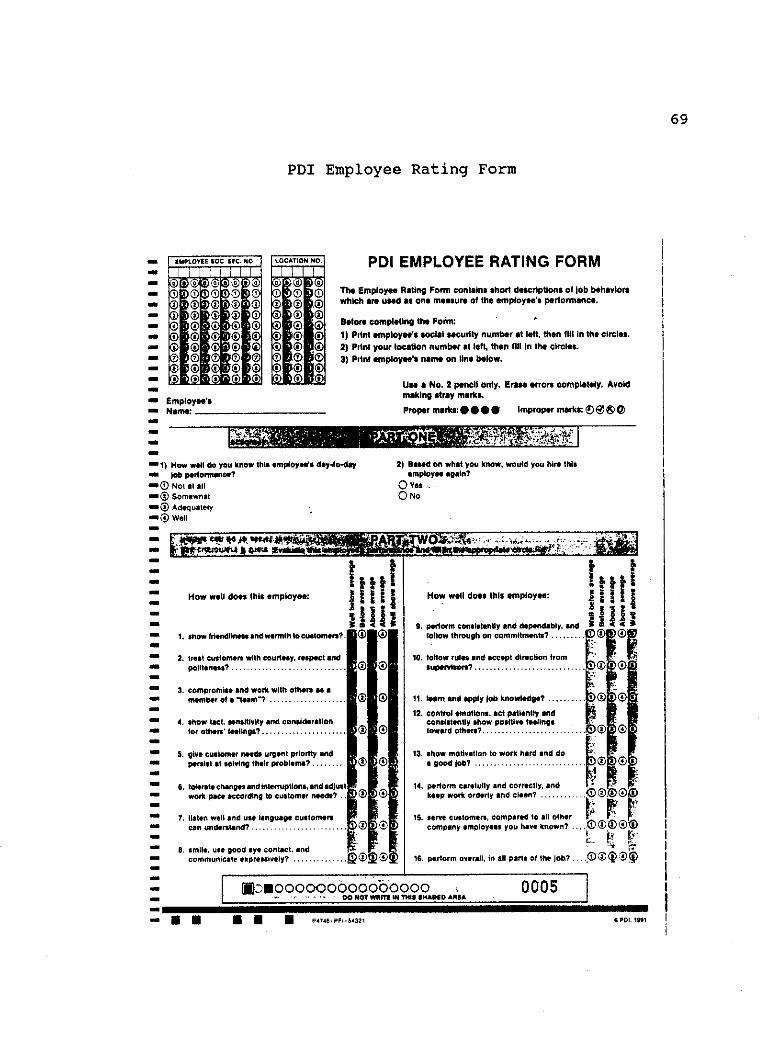
69
PDI Employee Rating Form
-. EMPLOYEE SOC.SEC NO LOCATION NO. PDI EMPLOYEE RATING FORM- a e® a aa a- ' 0; 0The Employee Rating Form contains short descriptions of job be
- 20( ® which are used as one measure of the employee's performance.- a (t@ Si S a Si S- (D ® 0 Before completing the Form:
- ,* ®®.() j) 1) Print employee's social security number at left, then illi In the- 2) Print your location number at left, then fill In the circles.- 03) Print employee's name on line below.- 0 0 0 ' 0- Use a No. 2 pencil only. Erase errors completely.-" Employee's making stray marks.-. Name:-Proper marks: 9 Improper marks: ®D
-N h t
haviors
circles.
Avoid
M 1) Now well do you know this employee's day.Ao-day- job performance?
0as Not at all0 Somewhat
-s Adequately0 Well
How well does this employee: J
1. show friendliness and warmth to customers?
2. treat customers with courtesy, respect andpoliteness? .............................
3. compromise and work with others as amember of a "team"? ...................
4. show tact, sensitivity and considerationfor others' feelings?.....................
5. give customer needs urgent priority andpersist at solving their problems? ........
6. tolerate changes andinterruptions,andadjustwork pace according to customer needs? .
7. listen well and use language customerscan understand? .....................
8. smile, use good eye contact, andcommunicate expressively? ...............
.1
.r
(''
c!
2) Based on what you know, would you hire thisemployee again?
o Yeso No
* .oRfl~OPftUINttt'
'I "
sea
I:J®)
co
How well does this employee: I
9. perform consistently and dependably, and 4follow through on commitments? . r. . j g
10. follow rules and accept direction fromsupervisors?......................v a
11. learn and apply job knowledge? . 0.12. control emotions, act patiently and
consistently show positive feelingstoward others?................... (D0 ®0s
13. show motivation to work hard and doa good job? ...................
14. perform carefully and correctly, andkeep work orderly and clean? .......... 00Q® e,
15. serve customers, compared to all othercompany employees you have known? .. 00000
16. perform overall, In all parts of the lob? . .. 0I() 3Ci
0005- U U U Urr U P47 it4e-PFI-5r4321 rr .spot. lastwrrrr, r T r +r ri ii
,.ooooooooooooooo00 NOT wITE IN TIa5 sNAM 0 AREA
I.,....
.
.x
r1!
I""
ms
. "
-m 0 0 a m 0 P4746 -PF i-5$4321 9PoI. 1991
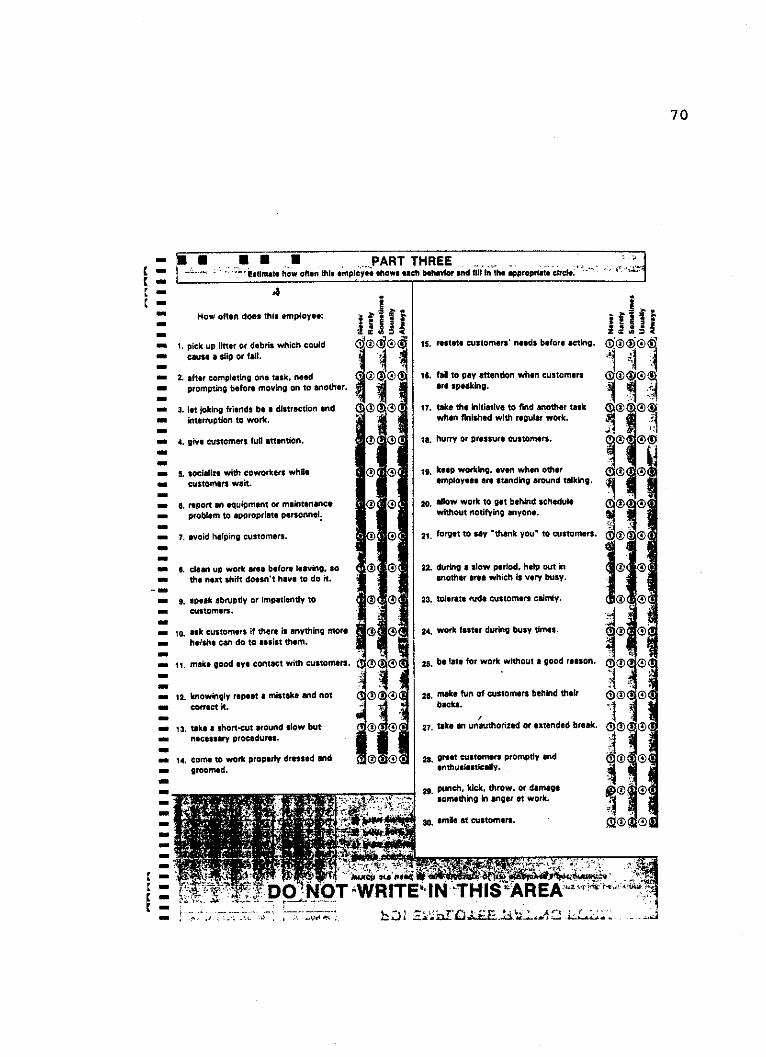
70
- E EU 3 . PART THREE- ,... .tEstimate how often this employee shows each behavior and fil In the appropriate cIrcle.
-" Novw often does this employee:
- 1. pick up litter or debris which could- cause a slip or fall.
- 2. after completing one task, need- prompting before moving on to another.a- 3. let joking friends be a distraction and- interruption to work.
- r 4. give customers full attention.
ma5. socialite with coworkers while
.. customers wait.
- a. report an equipment or maintenance.. problem to appropriate personnel.a- 7. avoid helping customers.
S as. clean up work area before leaving, so"" the next shift doesn't have to do it.
-. e . speak abruptly or impatiently to- customers.
-. 10. ask customers if there is anything more-r heishe can do to assist them.
- 11. make good eye contact with customers.
. 12. knowingly repeat a mistake and not- correct it.
r 13. take a short-cut around slow but-r necessary procedures.
-" 14. come to work properly dressed and-. groomed.
rrr
r y if re^ae
I 4JC
cc@ CCU
s ,
.L
f O
@C0s
@0C
00
wa@0
1015
15. restate customers' needs before acting.
18. fail to pay attention when customersare speaking.
17. take the initiative to find another taskwhen finished with regular work.
is. hurry or pressure customers.
1g. keep working, even when otheremployees are standing around talking.
20. allow work to get behind schedulewithout notifying anyone.
21. forget to say "thank you" to customers.
22. during a slow period, help out inanother area which is very busy.
23. tolerate rude customers calmly.
24. work faster during busy times.
25. be late for work without a good reason.
26. make fun of customers behind theirbacks.
27. take an unauthorized or extended break.
28. great customers promptly andenthusiastically.
29. punch, kick, throw. or damagesomething in anger at work.
30. smie at customers.
SO-
IM
I 00VSDO s ®
-. 4.«_:1DO%'1OT WRITE 1N THIS'AREA~-+ .... ~ i t iL t ..Ct . $... w..L.. -....f.ta .._.-¬1Yst2..
[C
I

APPENDIX F
COVER LETTERS FROM THE EXECUTIVE VICE-PRESIDENT
71
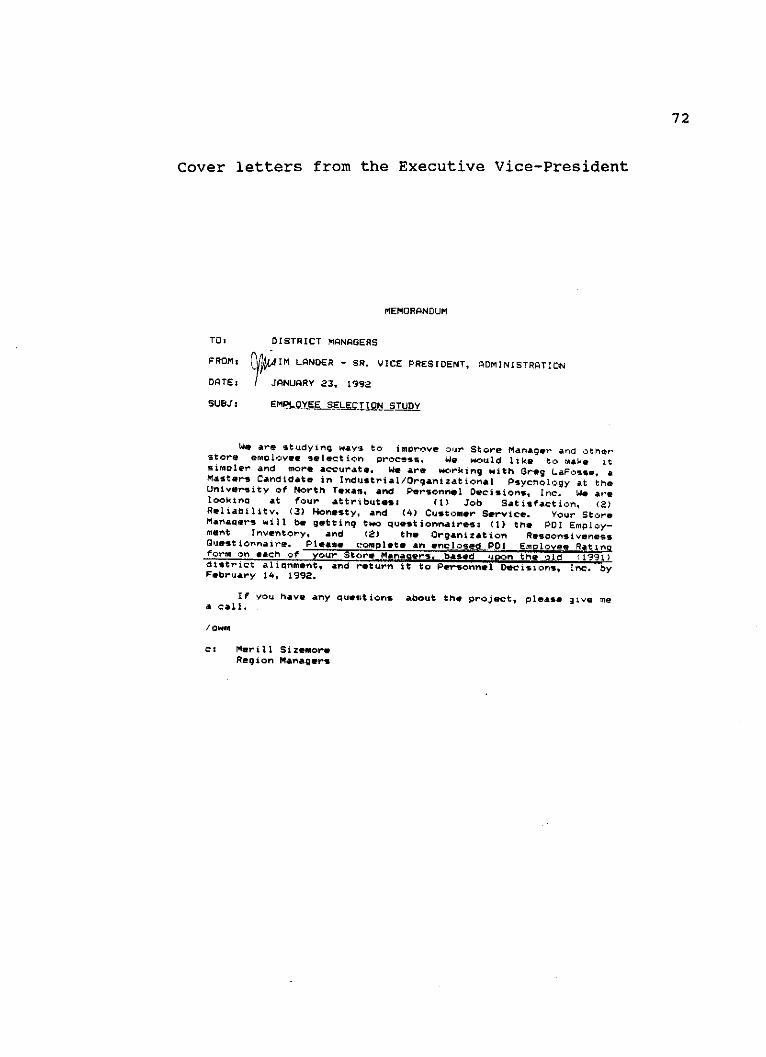
72
Cover letters from the Executive Vice-President
MEMORANDUM
TO: DISTRICT MANAGERS
FROM: 0/p IM LANDER - SR. VICE PRESIDENT, ADMINISTRATION
DATE: JANUARY 23. 1992
SUBJ: EMPLOYEESELECTION STUDY
We are studying ways to improve our Store Manager and otherstore emolovee selection process. We would like to make itsimpler and more accurate. We are working with Greg LaFosse, aMasters Candidate in Industrial/Organizational Psychology at theUniversity of North Texas, and Personnel Decisions, Inc. We arelooking at four attributes: (1) Job Satisfaction, (2)Reliability. (3) Honesty,, and (4) Customer Service. Your StoreManagers will be getting two questionnaires: (I) the PDI Employ-ment Inventory, and (2) the Organization ResponsivenessQuestionnaire. Please complete an enclosed PDI Employee Ratingform on each of your Store MaanAger based.upon the (9991)district alignment, and return it to Personnel Decisions, Inc. byFebruary 14, 1992.
If you have any questions about the project, please give mea call.
c: Merill SizemoreRegion Managers
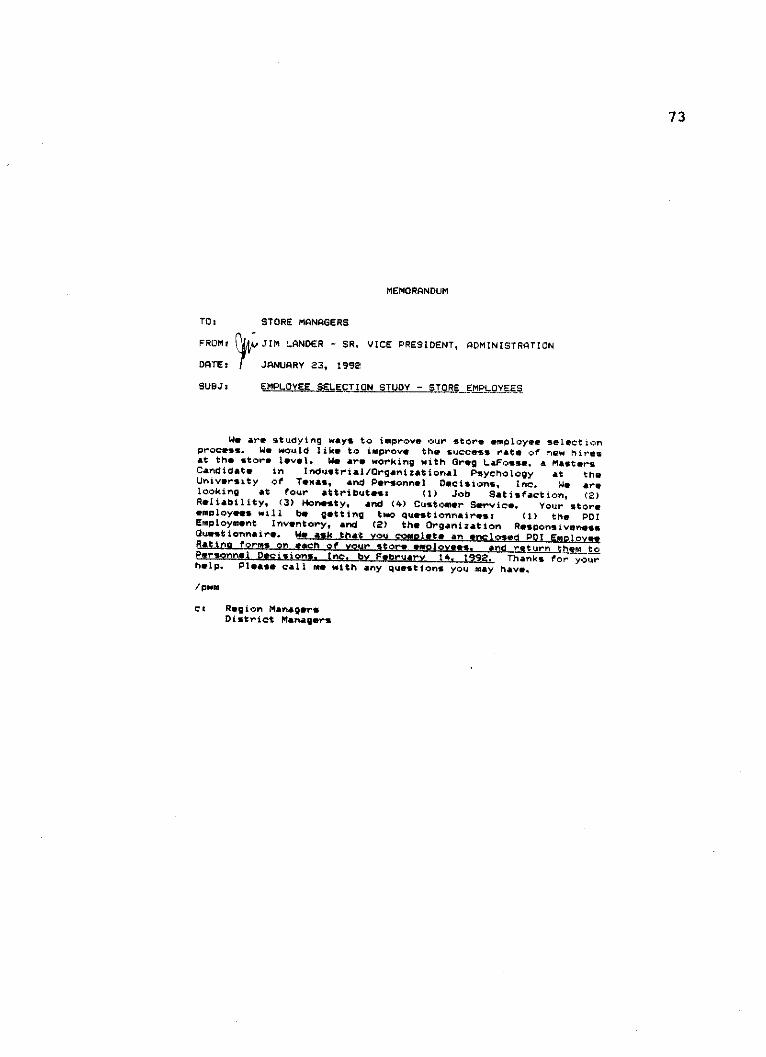
73
MEMORANDUM
TO: STORE MANAGERS
FROM: JIM LANDER - SR. VICE PRESIDENT, ADMINISTRATION
DATE: JANUARY 23, 1992
SUIJ: EMPLOYEE SELECTION STUDY - STORE EMPLOYEES
We are studying ways to improve our store employee selectionprocess. We would like to improve the success rate of new hiresat the store level. We are working with Greg LaFosse, a MastersCandidate in Industrial/Organizational Psychology at theUniversity of Texas, and Personnel Decisions, Inc. We arelooking at four attributes: (1) Job Satisfaction, (2)Reliability, (3) Honesty, and (4) Customer Service. Your storeemployees will be getting two questionnaires: (1) the PDIEmployment Inventory, and (2) the Organization ResponsivenessQuestionnaire. We ask that you cemp1eta an enc1osed pt lEmoyeeRt n forms n each of ur torea o2e4s and return them toPersonnel Deisions. Inc. by February 14, 1992. Thanks for yourhelp. Please call me with any questions you may have.
/ pwm
c: Region ManagersDistrict Managers
74
MEMORANDUM
TO: STORE MANAGERS
FROM: t'JIM LANDER - SR. VICE PRESIDENT, ADMINISTRATION
DATE: JANUARY 23, 1992
SUBJ: STORE MANAGER SELECTION STUDY
We are studying ways to improve our Store Manager Selection
process. We would like to simplify the process, and at the same
time, improve our rate of successful new hires. We are workingwith Greg LaFosse, a Masters Candidate in Industrial/Organi-
zational Psychology at the University of North Texas, and
Personnel Decisions, Inc. We would like you to participate with
us in this study. Please complete the enclosed PDI Emloyment
Inventory and the Oranization Resonsiveness Questionnaire, and
mail them to PD! by February .14 1992. Thanks for your help.
Call me if you have any questions about this project.
/ pwm
c: Region ManagersDistrict Managers
75
MEMORANDUM
TO: STORE EMPLOYEES
FROM: M LANDER - SR. VICE PRESIDENT, ADMINISTRATION
DATE: 1 JANUARY 23, 1992
SUEIJ: EMPLOYEE SELECT I IN STUDY
We are seeking ways to improve our store employee selectionprocess, with a goal of improving success rate of new hires. Weare working with Greg LaFosse, a Masters Candidate inIndustrial/Organizational Psychology at the University of NorthTexas and Personnel Decisions Inc. We are asking for your helpby completing the enclosed P0I Employment Inventory and theOrganization Responsiveness Questionnaire, and return them in the
enclosed envelope to Personnel Decisions, Inc. by February 14,1992. Your individual responses will be kept confidential byP01. We appreciate your help. Please call me, if you have any
quest ions.
/pwm
c: District ManagersRegion Managers

APPENDIX G
COVER LETTERS FROM THE RESEARCHER
76
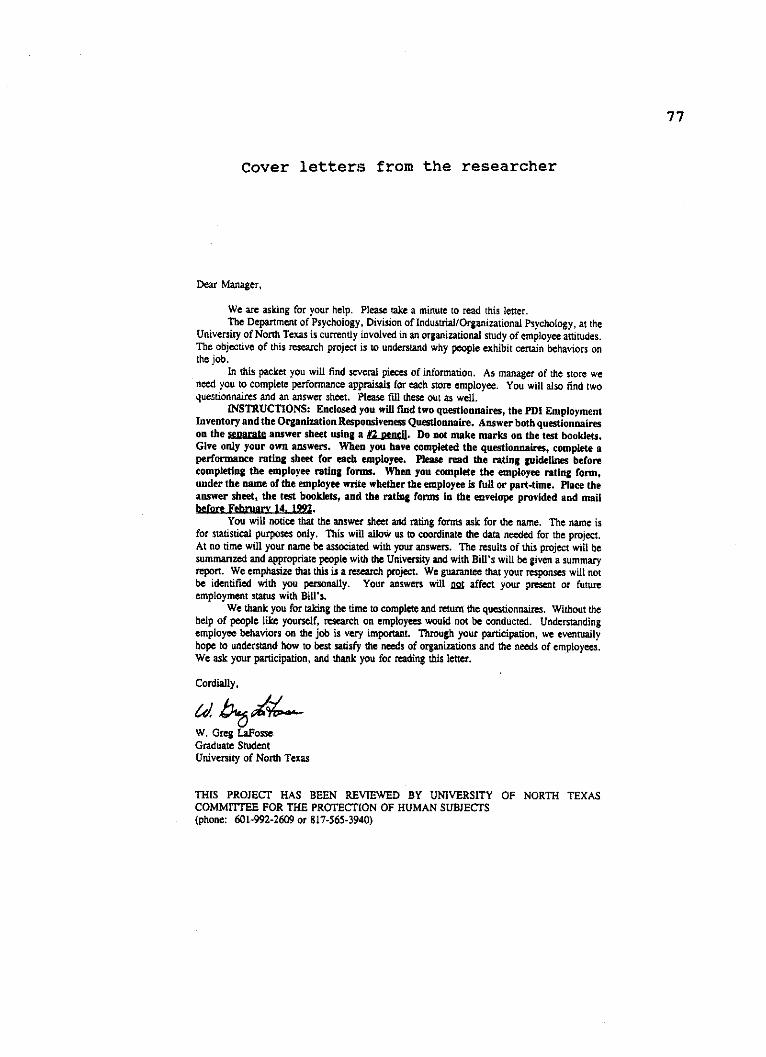
77
Cover letters from the researcher
Dear Manager,
We are asking for your help. Please take a minute to read this letter.The Department of Psychology, Division of Industrial/Organizational Psychology, at the
University of North Texas is currently involved in an organizational study of employee attitudes.The objective of this research project is to understand why people exhibit certain behaviors onthe job.
In this packet you will find several pieces of information. As manager of the store weneed you to complete performance appraisals for each store employee. You will also find twoquestionnaires and an answer sheet. Please fill these out as well.
INSTRUCTIONS: Enclosed you will find two questionnaires, the PD1 EmploymentInventory and the Organization Responsiveness Questionnaire. Answer both questionnaireson the separate answer sheet using a #2 pencil. Do not make marks on the test booklets.Give only your own answers. When you have completed the questionnaires, complete aperformance rating sheet for each employee. Please read the rating guidelines beforecompleting the employee rating forms. When you complete the employee rating form,under the name of the employee write whether the employee is full or part-time. Place theanswer sheet, the test booklets, and the rating forms in the envelope provided and mailbefore February 14. 1992.
You will notice that the answer sheet and rating forms ask for the name. The name isfor statistical purposes only. This will allow us to coordinate the data needed for the project.At no time will your name be associated with your answers. The results of this project will besummarized and appropriate people with the University and with Bill's will be given a summaryreport. We emphasize that this is a research project. We guarantee that your responses will notbe identified with you personally. Your answers will ngt affect your present or futureemployment status with Bill's.
We thank you for taking the time to complete and return the questionnaires. Without thehelp of people like yourself, research on employees would not be conducted. Understandingemployee behaviors on the job is very important. Through your participation, we eventuallyhope to understand how to best satisfy the needs of organizations and the needs of employees.We ask your participation, and thank you for reading this letter.
Cordially,
W. Greg LaFosseGraduate StudentUniversity of North Texas
THIS PROJECT HAS BEEN REVIEWED BY UNIVERSITY OF NORTH TEXASCOMMITTEE FOR THE PROTECTION OF HUMAN SUBJECTS(phone: 601-992-2609 or 817-565-3940)
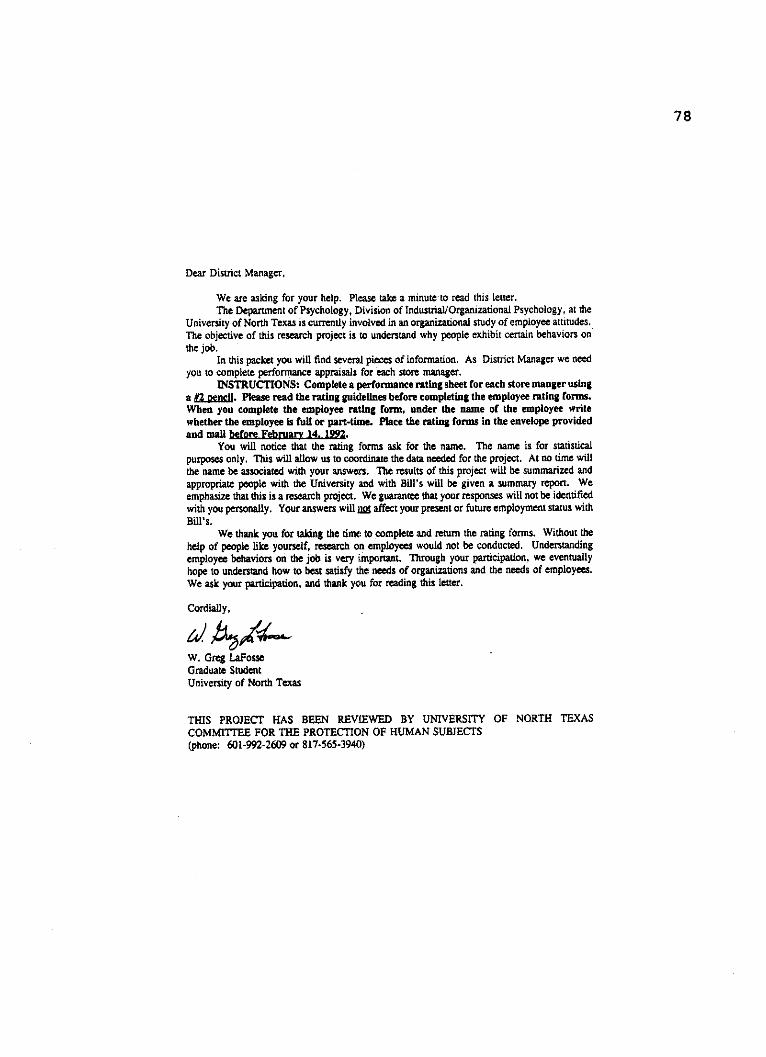
78
Dear District Manager,
We are asking for your help. Please take a minute to read this letter.The Department of Psychology, Division of Industrial/Organizational Psychology, at the
University of North Texas is currently involved in an organizational study of employee attitudes.The objective of this research project is to understand why people exhibit certain behaviors onthe job.
In this packet you will find several pieces of information. As District Manager we needyou to complete performance appraisals for each store manager.
INSTRUCTIONS: Complete a performance rating sheet for each store manger usinga IZgsslI. Please read the rating guidelines before completing the employee rating forms.When you complete the employee rating form, under the name of the employee writewhether the employee is full or part-time. Place the rating forms in the envelope providedand mail before February 14. 1992.
You will notice that the rating forms ask for the name. The name is for statisticalpurposes only. This will allow us to coordinate the data needed for the project. At no time willthe name be associated with your answers. The results of this project will be summarized andappropriate people with the University and with Bill's will be given a summary report. Weemphasize that this is a research project. We guarantee that your responses will not be identifiedwith you personally. Your answers will ngj affect your present or future employment status withBill's.
We thank you for taking the time to complete and return the rating forms. Without thehelp of people like yourself, research on employees would not be conducted. Understandingemployee behaviors on the job is very important. Through your participation, we eventuallyhope to understand how to best satisfy the needs of organizations and the needs of employees.We ask your participation, and thank you for reading this letter.
Cordially,
W. Greg LaFosseGraduate StudentUniversity of North Texas
THIS PROJECT HAS BEEN REVIEWED BY UNIVERSITY OF NORTH TEXASCOMMITTEE FOR THE PROTECTION OF HUMAN SUBJECTS(phone: 601-992-2609 or 817-565-3940)
79
Dear Manager,
We are asking for your help. Please take a minute to read this letter.The Department of Psychology, Division of Industrial/Organizational Psychology, at the
University of North Texas is currently involved in an organizational study of employee attitudes.The objective of this research project is to understand why people exhibit certain behaviors onthe job.
INSTRUCTIONS: Enclosed you will find two questionnaires, the PDI EmploymentInventory and the Organization Responsiveness Questionnaire. Answer both questionnaireson the scanralz answer sheet using a ,3anciJ. Do not make marks on the test booklets.Give only your own answers. When you have completed the questionnaires, place theanswer sheet and the test booklets in the envelope provided and mail before February 14,
You will notice that the answer sheet asks for your name. The name is for statisticalpurposes only. This will allow us to coordinate the data needed for the project. At no time willyour name be associated with your answers. The results of this project will be summarized andappropriate people with the University and with Bill's will be given a summary report. Weemphasize that this is a research project. We guarantee that your responses will not be identifiedwith you personally. Your answers will ,gi affect your present or future employment status withBill's.
We thank you for taking the time to complete and return the questionnaires. Without thehelp of people like yourself, research on employees would not be conducted. Understandingemployee behaviors on the job is very important. Through your participation, we eventuallyhope to understand how to best satisfy the needs of organizations and the needs of employees.We ask your participation, and thank you for reading this letter.
Cordially,
W. Greg LaFosseGraduate StudentUniversity of North Texas
THIS PROJECT HAS BEEN REVIEWED BY UNIVERSITY OF NORTH TEXAS
COMMITTEE FOR THE PROTECTION OF HUMAN SUBJECTS(phone: 601-992-2609 or 817-565-3940)
80
Dear Employee,
We are asking for your help. Please take a minute to read this letter.
The Department of Psychology, Division of Industrial/Organizational Psychology, at the
University of North Texas is currently involved in an organizational study of employee attitudes.
The objective of this research project is to understand why people exhibit certain behaviors on
the job.INSTRUCTIONS: Enclosed you will find two questionnaires, the PDI Employment
Inventory and the OrganizationResponsiveness Questionnaire. Answer both questionnaires
on the seumrti answer sheet using a #2 enci. Do not make marks on the test booklets.
Give only your own answers. When you have completed the questionnaires, place the
answer sheet and the test booklets in the envelope provided and mail before February 14.
1M.You will notice that the answer sheet asks for your name. The name is for statistical
purposes only. This will allow us to coordinate the data needed for the project. At no time will
your name be associated with your answers. The results of this project will be summarized and
appropriate people with the University and with Bill's will be given a summary report. We
emphasize that this is a research project. We guarantee that your responses will not be identified
with you personally. Your answers will n affect your present or future employment status with
Bill's.We thank you for taking the time to complete and return the questionnaires. Without the
help of people like yourself, research on employees would not be conducted. Understanding
employee behaviors on the job is very important. Through your participation, we eventually
hope to understand how to best satisfy the needs of organizations and the needs of employees.
We ask your participation, and thank you for reading this letter.
Cordially,
W. Greg LaFosseGraduate StudentUniversity of North Texas
THIS PROJECT HAS BEEN REVIEWED BY UNIVERSITY OF NORTH TEXAS
COMMITTEE FOR THE PROTECTION OF HUMAN SUBJECTS
(phone: 601-992-2609 or 817-565-3940)

APPENDIX H
RATING GUIDELINES SHEET
81
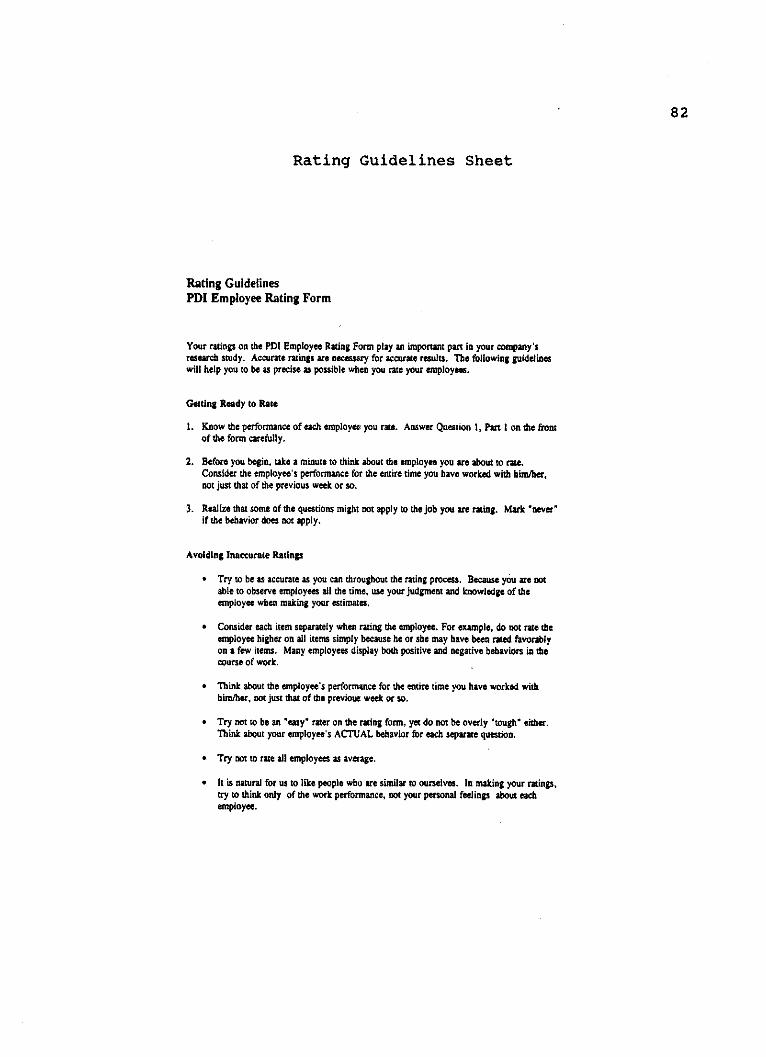
82
Rating Guidelines Sheet
Rating GuidelinesPDI Employee Rating Form
Your ratings on the PDI Employee Rating Form play an important part in your company'sresearch study. Accurate ratings are necessary for accurate results. The following guidelineswill help you to be as precise as possible when you rate your employees.
Getting Ready to Rate
1. Know the performance of each employee you rate. Answer Question 1, Part 1 on the frontof the form carefully.
2. Before you begin, take a minute to think about the employee you are about to rate.Consider the employee's performance for the entire time you have worked with him/her,not just that of the previous week or so.
3. Realize that some of the questions might not apply to the job you are rating. Mark 'never"if the behavior does not apply.
Avoiding Inaccurate Ratings
9 Try to be as accurate as you can throughout the rating process. Because you are notable to observe employees all the time, use your judgment and knowledge of theemployee when making your estimates.
" Consider each item separately when rating the employee. For example, do not rate theemployee higher on all items simply because he or she may have been rated favorablyon a few items. Many employees display both positive and negative behaviors in thecourse of work.
* Think about the employee's performance for the entire time you have worked withhim/her, not just that of the previous week or so.
* Try not to be an "easy" rater on the rating form, yet do not be overly "tough" either.Think about your employee's ACTUAL behavior for each separate question.
* Try not to rate all employees as average.
* It is natural for us to like people who are similar to ourselves. In making your ratings,try to think only of the work performance, not your personal feelings about eachemployee.

APPENDIX I
DIMENSIONS OF CUSTOMER SERVICE AS MEASURED BY THE EI/CSI
83
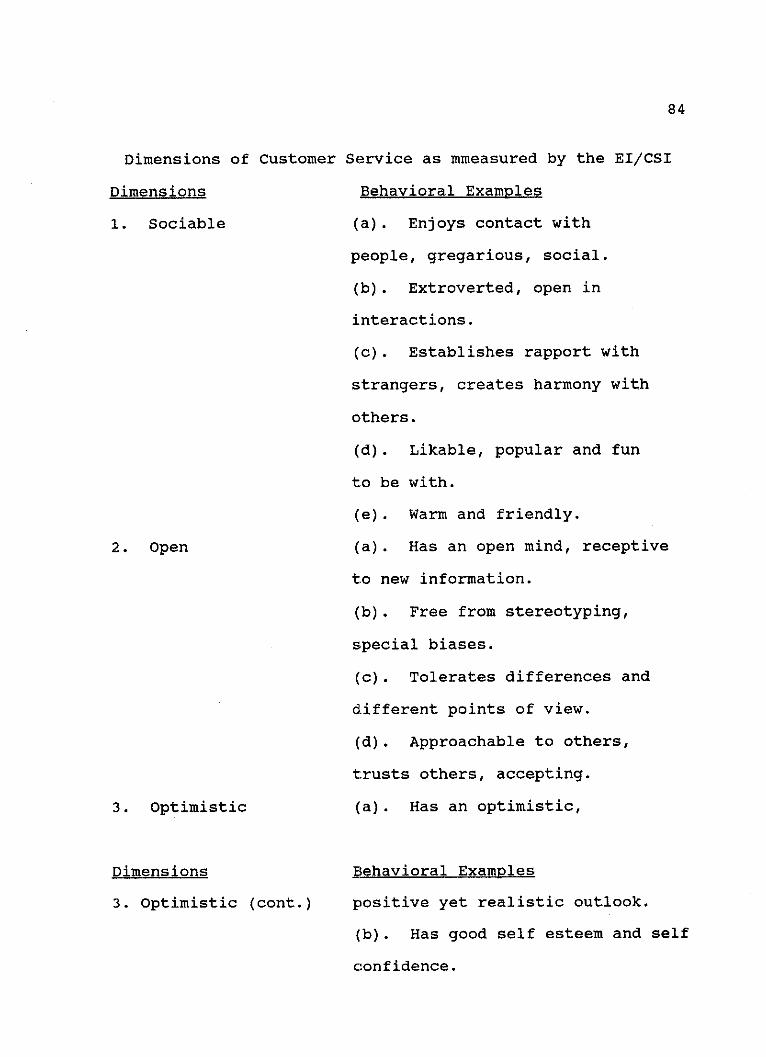
84
Dimensions of Customer
Dimensions
1. Sociable
2. Open
3. Optimistic
Dimensions
3. Optimistic (cont.)
Service as mmeasured by the EI/CSI
Behavioral Examples
(a). Enjoys contact with
people, gregarious, social.
(b). Extroverted, open in
interactions.
(c). Establishes rapport with
strangers, creates harmony with
others.
(d). Likable, popular and fun
to be with.
(e). Warm and friendly.
(a). Has an open mind, receptive
to new information.
(b) . Free from stereotyping,
special biases.
(c) . Tolerates differences and
different points of view.
(d). Approachable to others,
trusts others, accepting.
(a). Has an optimistic,
Behavioral Examples
positive yet realistic outlook.
(b). Has good self esteem and self
confidence.
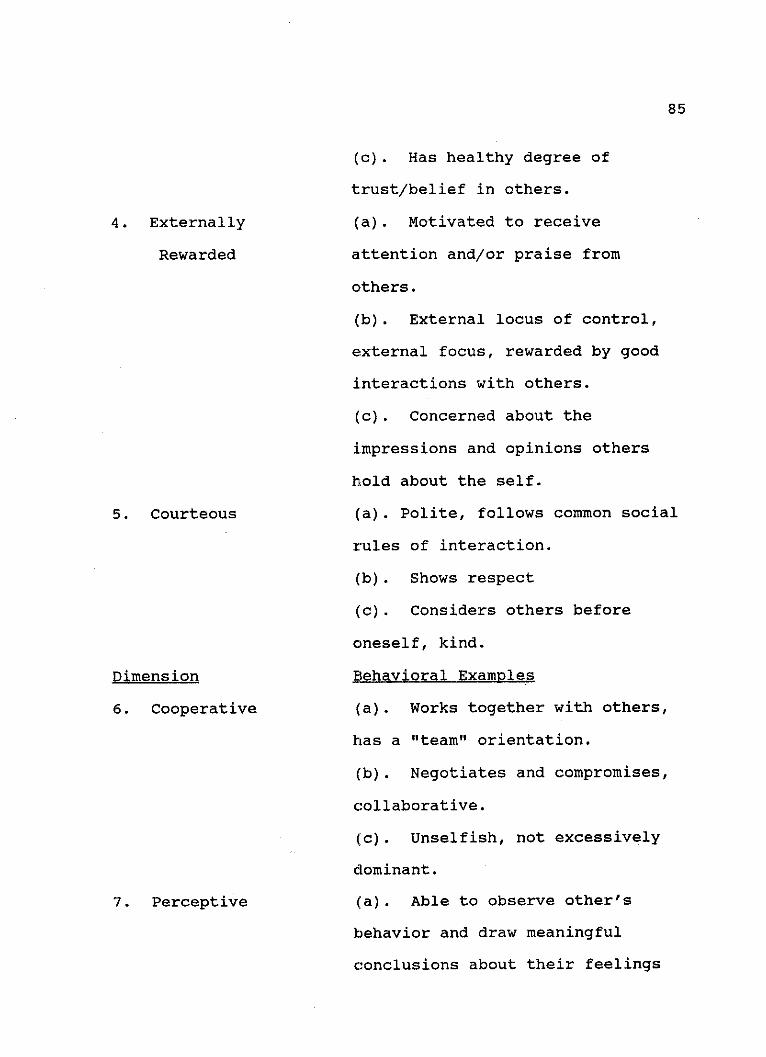
85
4. Externally
Rewarded
5. Courteous
Dimension
6. Cooperative
7. Perceptive
(c). Has healthy degree of
trust/belief in others.
(a). Motivated to receive
attention and/or praise from
others.
(b) . External locus of control,
external focus, rewarded by good
interactions with others.
(c). Concerned about the
impressions and opinions others
hold about the self.
(a). Polite, follows common social
rules of interaction.
(b). Shows respect
(c). Considers others before
oneself, kind.
Behavioral Examples
(a) . Works together with others,
has a "team" orientation.
(b). Negotiates and compromises,
collaborative.
(c). Unselfish, not excessively
dominant.
(a). Able to observe other's
behavior and draw meaningful
conclusions about their feelings
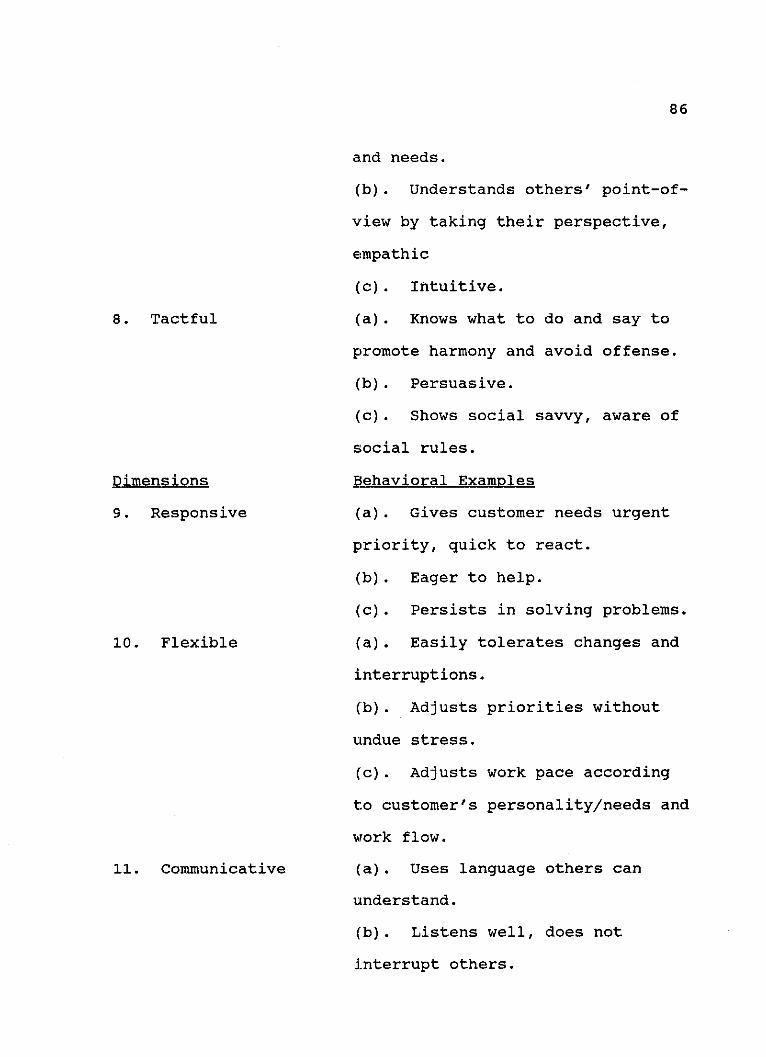
86
8. Tactful
Dimensions
9. Responsive
10. Flexible
11. Communicative
and needs.
(b). Understands others' point-of-
view by taking their perspective,
empathic
(c). Intuitive.
(a). Knows what to do and say to
promote harmony and avoid offense.
(b). Persuasive.
(c). Shows social savvy, aware of
social rules.
Behavioral Examples
(a). Gives customer needs urgent
priority, quick to react.
(b). Eager to help.
(c). Persists in solving problems.
(a). Easily tolerates changes and
interruptions.
(b). Adjusts priorities without
undue stress.
(c). Adjusts work pace according
to customer's personality/needs and
work flow.
(a). Uses language others can
understand.
(b). Listens well, does not
interrupt others.
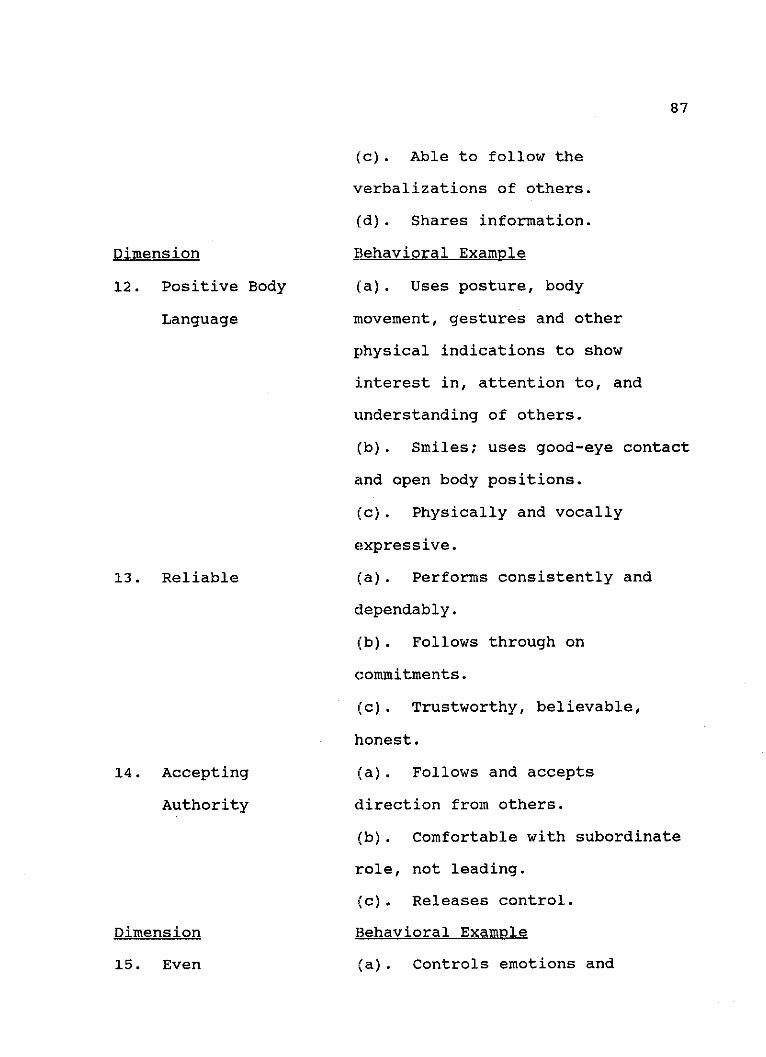
87
Dimension
12. Positive Body
Language
13. Reliable
14. Accepting
Authority
Dimension
15. Even
(c). Able to follow the
verbalizations of others.
(d). Shares information.
Behavioral Example
(a). Uses posture, body
movement, gestures and other
physical indications to show
interest in, attention to, and
understanding of others.
(b). Smiles; uses good-eye contact
and open body positions.
(c). Physically and vocally
expressive.
(a). Performs consistently and
dependably.
(b). Follows through on
commitments.
(c). Trustworthy, believable,
honest.
(a). Follows and accepts
direction from others.
(b). Comfortable with subordinate
role, not leading.
(c). Releases control.
Behavioral Example
(a). Controls emotions and
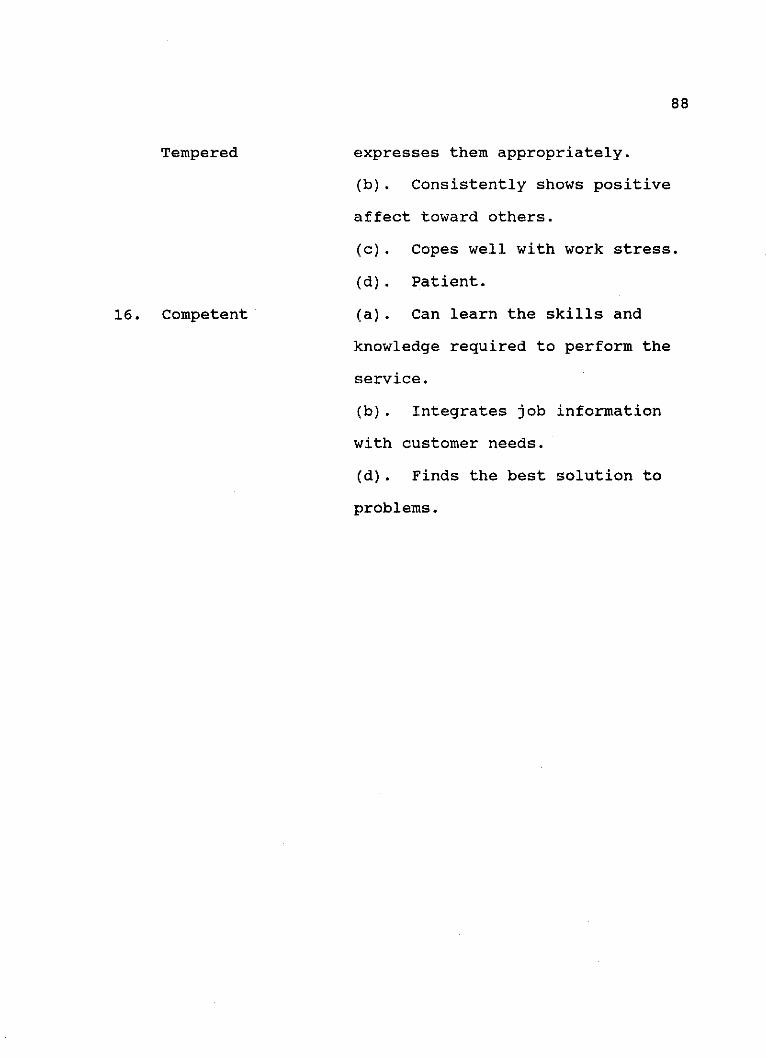
88
Tempered
16. Competent
expresses them appropriately.
(b). Consistently shows positive
affect toward others.
(c). Copes well with work stress.
(d). Patient.
(a). Can learn the skills and
knowledge required to perform the
service.
(b). Integrates job information
with customer needs.
(d). Finds the best solution to
problems.

APPENDIX J
CRITERION VARIABLE AND CORRESPONDING RATING FORM
89
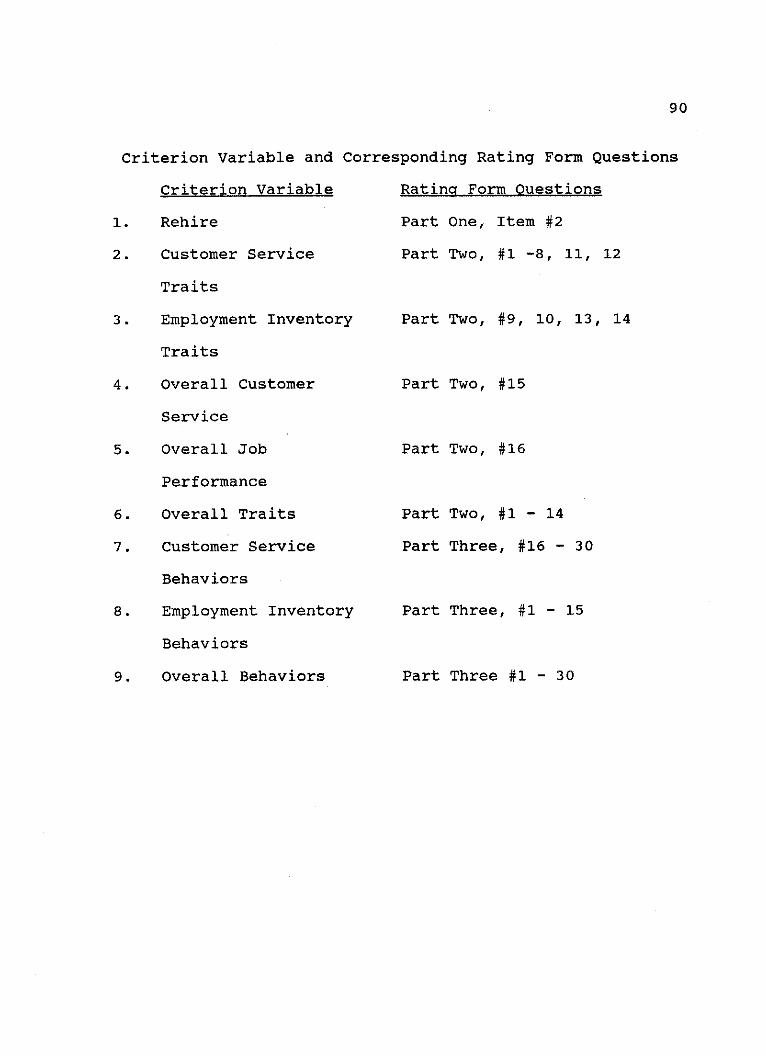
90
Criterion Variable and Corresponding Rating Form Questions
Criterion Variable Rating Form Questions
1. Rehire Part One, Item #2
2. Customer Service Part Two, #1 -8, 11, 12
Traits
3. Employment Inventory Part Two, #9, 10, 13, 14
Tra its
4. Overall Customer Part Two, #15
Service
5. Overall Job Part Two, #16
Performance
6. Overall Traits Part Two, #1 - 14
7. Customer Service Part Three, #16 - 30
Behaviors
8. Employment Inventory Part Three, #1 - 15
Behaviors
9. Overall Behaviors Part Three #1 - 30

APPENDIX K
FIGURES
91
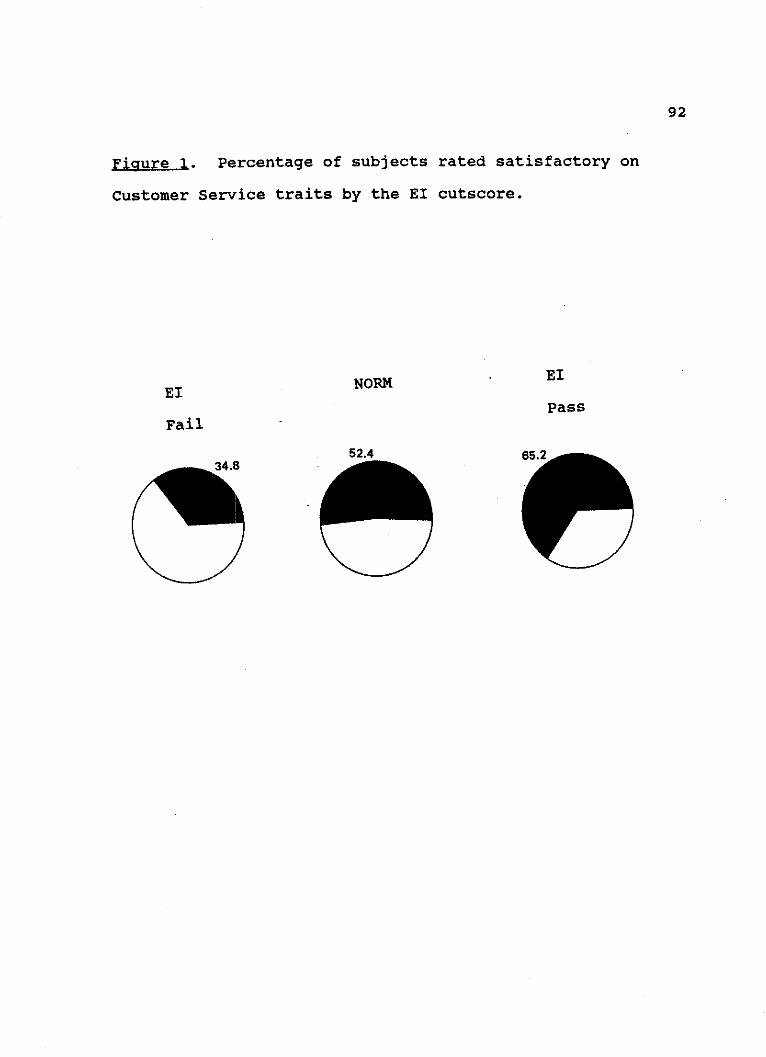
92
Figure 1. Percentage of subjects rated satisfactory on
Customer Service traits by the EI cutscore.
NORMEI
Fail
EI
Pass
52.4
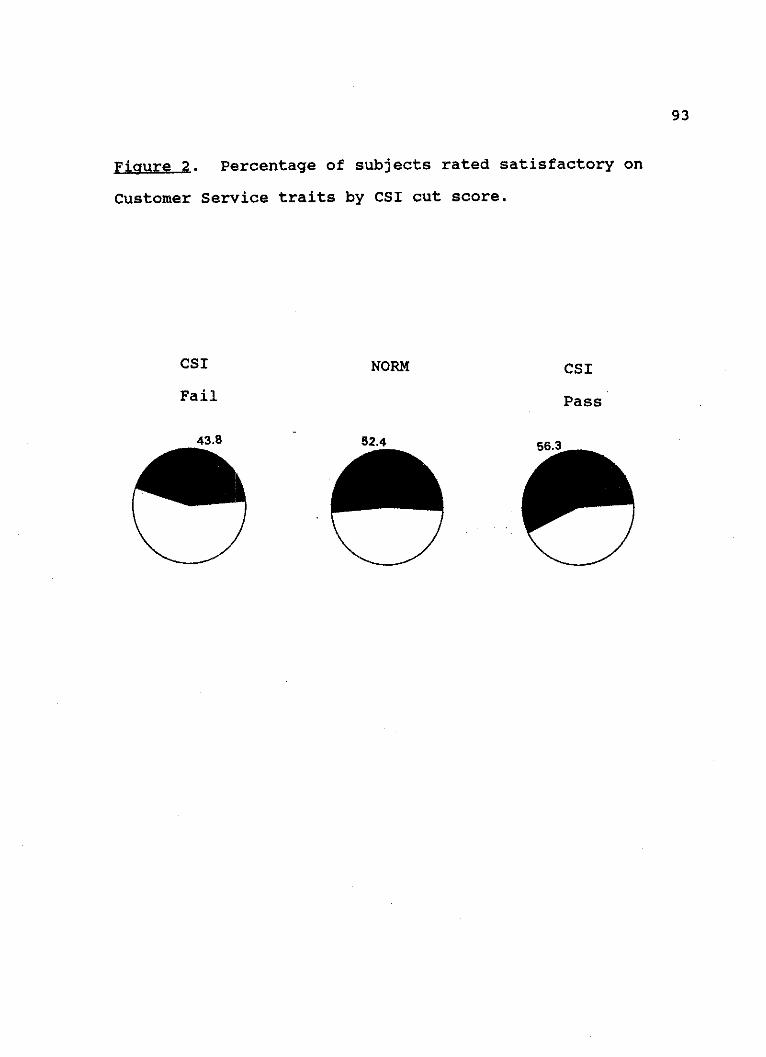
93
Figure 2. Percentage of subjects rated satisfactory on
Customer Service traits by CSI cut score.
CS'
Fail
NORM CSI
Pass
52.4
77 171)
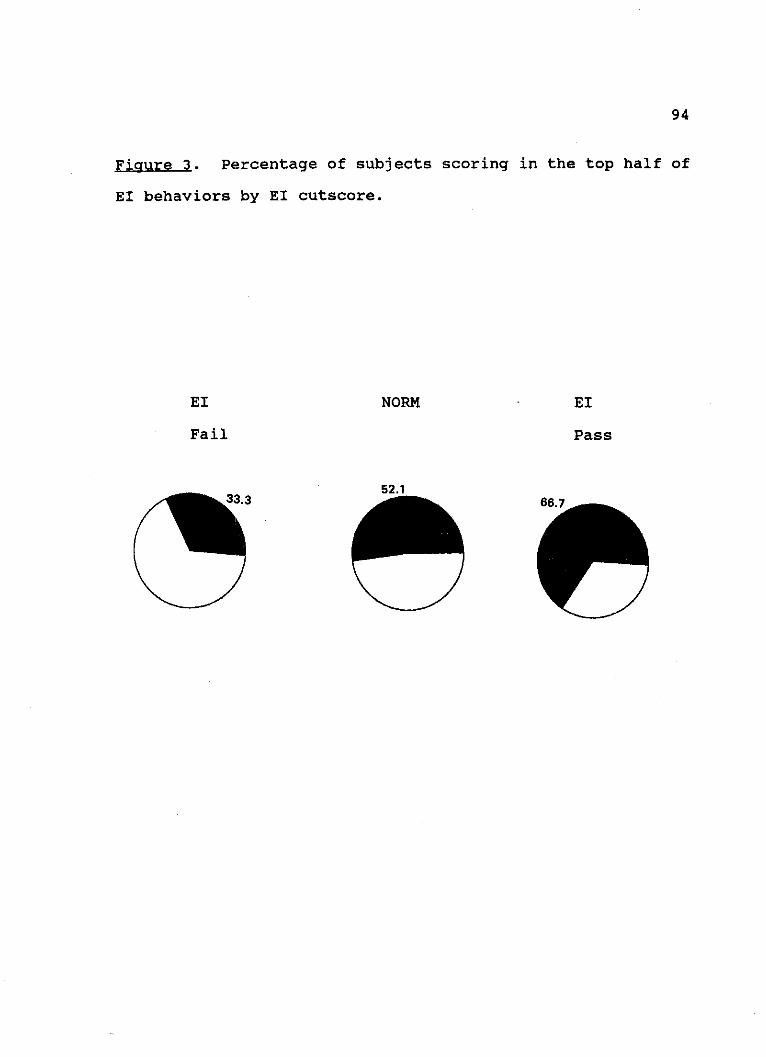
94
Figure 3. Percentage of subjects scoring in the top half of
EI behaviors by EI cutscore.
EI NORM El
PassFail
52.1
'K(
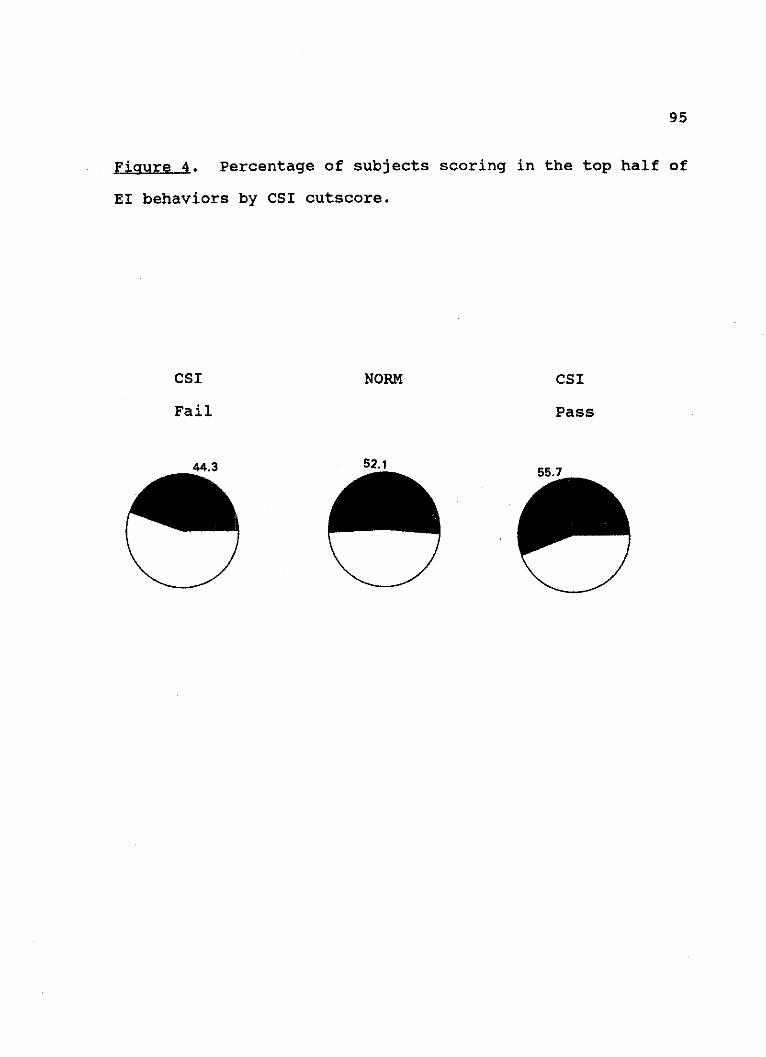
95
Figure 4. Percentage of subjects scoring in the top half of
EI behaviors by CSI cutscore.
CsI NORM
Fail
CSI
Pass
44.3 52.1 55.7
lll-
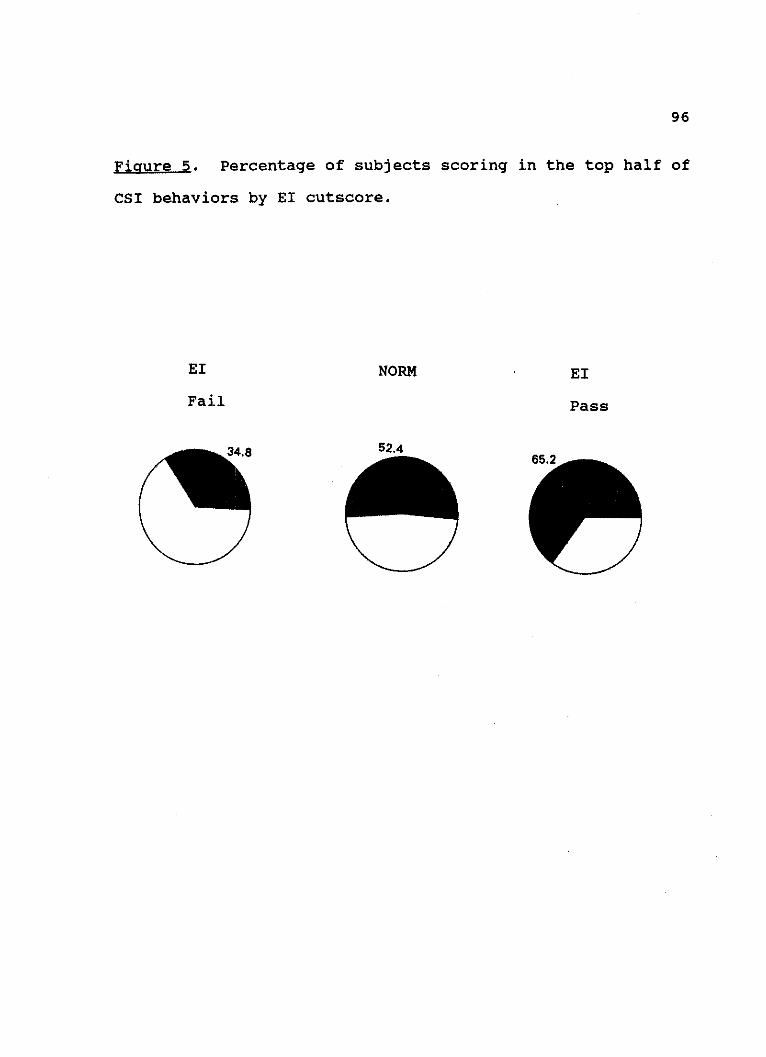
96
Figure 5. Percentage of subjects scoring in the top half of
CSI behaviors by EI cutscore.
EI NORM EI
Fail Pass
52.4
......................
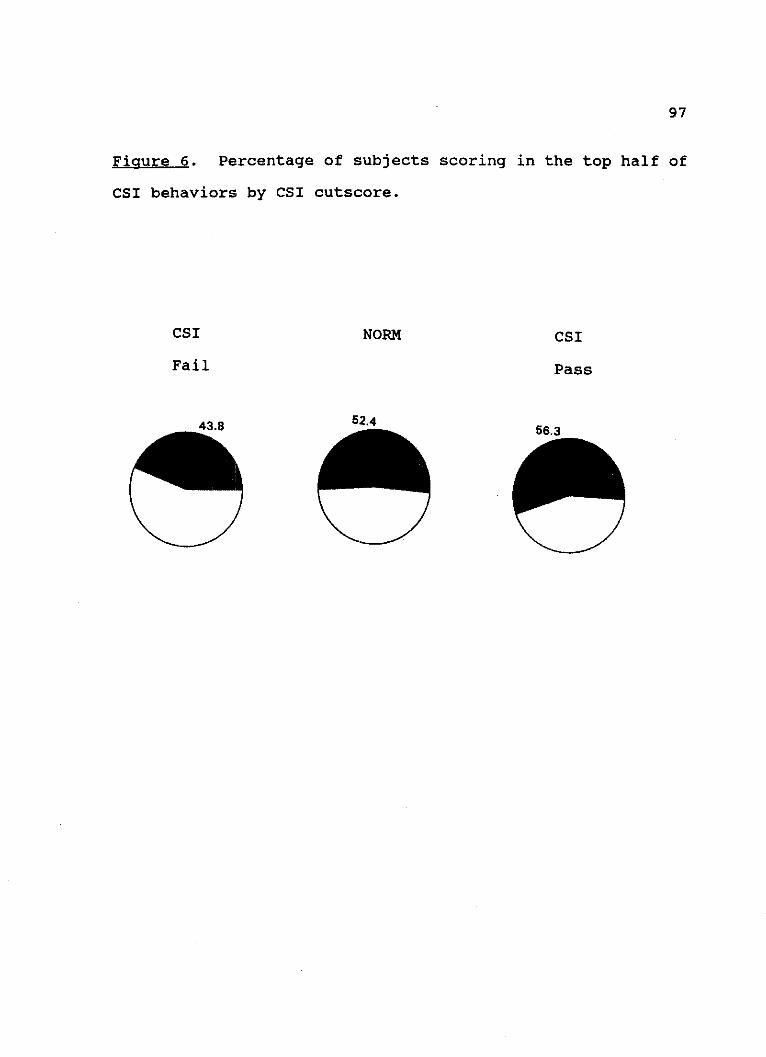
97
Figure 6. Percentage of subjects scoring in the top half of
CSI behaviors by CSI cutscore.
CSI
Fail
43.8
NORM CsI
Pass
52.456.3
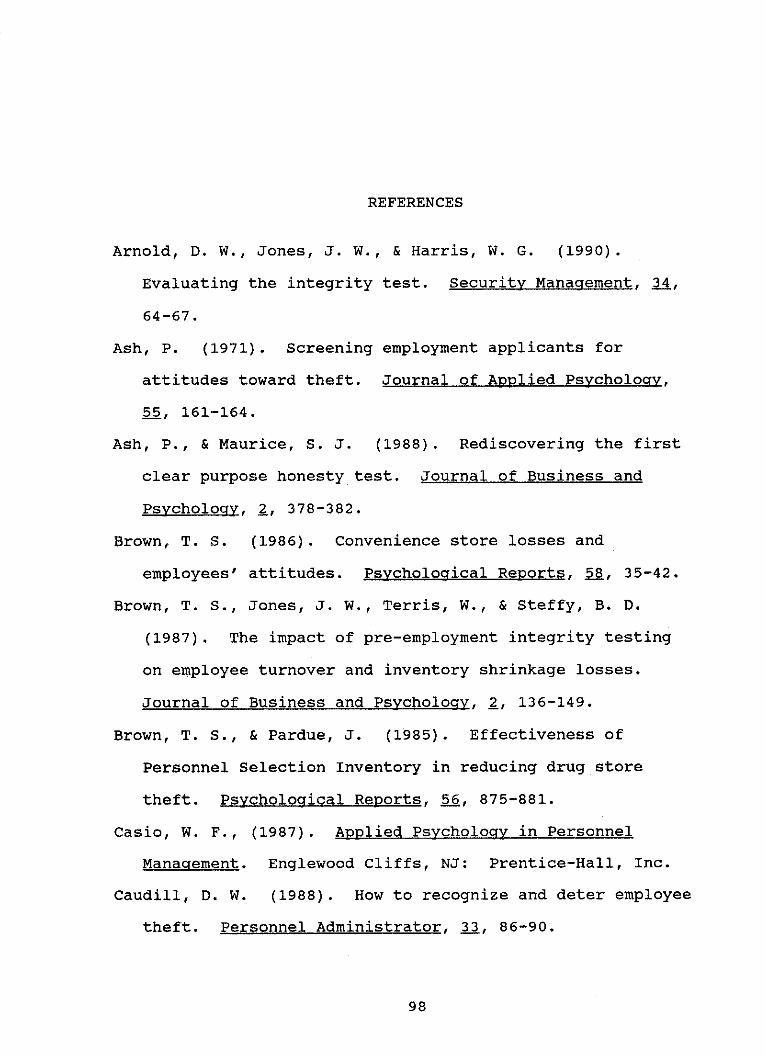
REFERENCES
Arnold, D. W., Jones, J. W., & Harris, W. G. (1990).
Evaluating the integrity test. Security Management, 34,
64-67.
Ash, P. (1971). Screening employment applicants for
attitudes toward theft. Journal of Applied Psychology,
55, 161-164.
Ash, P., & Maurice, S. J. (1988). Rediscovering the first
clear purpose honesty test. Journal of Business and
Psychology, 2, 378-382.
Brown, T. S. (1986). Convenience store losses and
employees' attitudes. Psychological Reports, 8, 35-42.
Brown, T. S., Jones, J. W., Terris, W., & Steffy, B. D.
(1987). The impact of pre-employment integrity testing
on employee turnover and inventory shrinkage losses.
Journal of Business and Psychology, 2, 136-149.
Brown, T. S., & Pardue, J. (1985). Effectiveness of
Personnel Selection Inventory in reducing drug store
theft. Psychological Reports, 56, 875-881.
Casio, W. F., (1987). Applied Psychology in Personnel
Management. Englewood Cliffs, NJ: Prentice-Hall, Inc.
Caudill, D. W. (1988). How to recognize and deter employee
theft. Personnel Administrator, 33, 86-90.
98
99
Dickens, W. T., Katz, L. F., Lang, K., & Summers, L. H.
(1989). Employee crime and the monitoring puzzle.
Journal of Labor Economics, 7, 331-347.
Employee Polygraph Protection Act of 1988, 29 U.S.C. 2001-
2009 (1988).
Ghiselli, E. E., Campbell, J. P., & Zedeck, S. (1981).
Measurement Theory for the Behavioral Sciences. San
Francisco, CA: W. H. Freeman and Company.
Greenberg, J. (1990). Employee theft as a reaction to
underpayment inequity: The hidden cost of pay cuts.
Journal of Applied Psychology, 25, 561-568.
Hollinger, R. C., & Clark, J. B. (1983). Theft by
Employees. Lexington, MA: Lexington Books.
Honts, C. IR., Hodes, R. L., & Brown, D. C. (1985). Effects
of physical countermeasures on the physiological
detection of theft. Journal of Applied Psychology, 70,
177-187.
Jones, J. W., Slora, K. B., & Boye, M. W. (1990). Theft
reduction through personnel selection: A control group
design in the supermarket industry. Journal of Business
and Psychology, 5, 275-279.
Lippman, M., & McGraw, W. R. (1988). Employee theft: A
$40 billion industry. The Annals of the American Academy
of Political and Social Science, 498, 51-59.
100
Mangione, T. W., & Quinn, R. P. (1975). Job satisfaction,
counterproductive behavior, and drug use at work.
Journal of Applied Psychology, 60, 114-116.
McNemar, Q. (1969). Psychological Statistics. New York,
NY: John Wiley and Sons, Inc.
Paajanen, G. E. (1990). For better customer service, select
the right employees. Chain Store Age Executive, 66, 96.
Parilla, P. F., Hollinger, R. C., & Clark, J. P. (1988).
Organizational control of deviant behavior: The case of
employee theft. Social Science Quarterly, 9, 261-280.
Payne, S. L., & Pettingill, B. (1983). Theft perceptions.
Personnel Administrator, 28, 102-111.
Personnel Decisions, Incorporated. (1985). Development and
validation of the PDI employment inventory. Minneapolis,
MN: Author.
Personnel Decisions, Incorporated. (1991). Test manual for
the PDI customer service inventory. Unpublished
manuscript.
Porter, L. W. & Steers, R. M. (1977). Organizational work
and personal factors in employee turnover and
absenteeism. Psychological Bulletin, 80, 151-176.
Rosenbaum, R. W. (1976). Predictability of employee theft
using weighted application blanks. Journal of Applied
Psychology, 61, 94-98.
101
Sackett, P. R., Burris, L. R., & Callahan, C. (1989).
Integrity testing for personnel selection: An update.
Personnel Psychology, 42, 491-529.
Sackett, P. R., & Harris, M. M. (1984). Honesty testing
for Personnel Selection: A review and critique.
Personnel Psychology, 37, 221-245.
Smith, F. J. (1977). Work attitudes as predictors of
attendance on a specific day. Journal of Applied
Psychol6gy, 2f, 16-19.
Taylor, W. L., & Cangemi, J. P. (1979). Employee theft and
organizational climate. Personnel Journal, 58, 686-688,
714.
Waid, W. M., & Orne, M. T. (1980). Individual differences
in electrodermal liability and the detection of
information and deception. Journal of Applied
Psychology, _, 1-8.
Wiley, C., & Rudley, D. L. (1991). Managerial issues and
responsibilities in the use of integrity tests. Labor
Law Journal, 42, 152-159.
Recommended