NCEE 2010-4009 U.S. DEPARTMENT OF EDUCATION
Middle School Mathematics Professional Development Impact Study Findings After the First Year of Implementation

Middle School Mathematics Professional Development Impact Study Findings After the First Year of Implementation April 2010 Michael S. Garet Andrew J. Wayne Fran Stancavage James Taylor Kirk Walters Mengli Song Seth Brown Steven Hurlburt American Institutes for Research Pei Zhu Susan Sepanik Fred Doolittle MDRC Elizabeth Warner Project Officer Institute of Education Sciences NCEE 2010-4009 U.S. DEPARTMENT OF EDUCATION
U.S. Department of Education Arne Duncan Secretary Institute of Education Sciences John Q. Easton Director National Center for Education Evaluation and Regional Assistance John Q. Easton Acting Commissioner April 2010 This report was prepared for the Institute of Education Sciences under Contract No. ED-04-CO-0025/0005. The project officer was Elizabeth Warner in the National Center for Education Evaluation and Regional Assistance.
IES evaluation reports present objective information on the conditions of implementation and impacts of the programs being evaluated. IES evaluation reports do not include conclusions or recommendations or views with regard to actions policymakers or practitioners should take in light of the findings in the reports.
This report is in the public domain. Authorization to reproduce it in whole or in part is granted. While permission to reprint this publication is not necessary, the citation should be: Garet, M., Wayne, A., Stancavage, F., Taylor, J., Walters, K., Song, M., Brown, S., Hurlburt, S., Zhu, P., Sepanik, S., and Doolittle, F. (2010). Middle School Mathematics Professional Development Impact Study: Findings After the First Year of Implementation (NCEE 2010-4009). Washington, DC: National Center for Education Evaluation and Regional Assistance, Institute of Education Sciences, U.S. Department of Education.
To order copies of this report,
•
•
•
Write to ED Pubs, Education Publications Center, U.S. Department of Education, P.O. Box 22207, Alexandria, VA 22304.
Call in your request toll free to 1-877-4ED-Pubs. If 877 service is not yet available in your area, call 800-872-5327. Those who use a telecommunications device for the deaf (TDD) or a teletypewriter (TTY) should call 800-437-0833.
Fax your request to 703-605-6794 or order online at www.edpubs.gov.
This report also is available on the IES website at http://ncee.ed.gov.
Upon request, this report is available in alternate formats such as Braille, large print, audiotape, or computer diskette. For more information, please contact the Department’s Alternate Format Center at 202-205-8113.
iii
ACKNOWLEDGMENTS
This study represents a collaborative effort of school districts, schools, teachers, researchers, and professional development providers. We appreciate the willingness of the school districts, schools, and teachers to join the study, participate in the professional development, and respond to requests for data, feedback, and access to classrooms. We were also fortunate to have the advice of our Expert Advisory Panel: Sybilla Beckmann, University of Georgia; Julian Betts, University of California, San Diego; Doug Carnine, University of Oregon; Mark Dynarski, Mathematica Policy Research; Lynn Fuchs, Vanderbilt University; Russell Gersten, Instructional Research Group; Kenneth Koedinger, Carnegie Mellon University; Brian Rowan, University of Michigan; John Woodward, School of Education, University of Puget Sound; and Hung-Hsi Wu, University of California, Berkeley. We also appreciated the advice of Hyman Bass, University of Michigan, and others associated with the Learning Mathematics for Teaching project. We also appreciated the advice of W. James Lewis, University of Nebraska – Lincoln, and Andrew Porter, University of Pennsylvania. We also benefitted from the informed feedback on the study’s statistical analyses and report from the following people at the American Institutes for Research (AIR) and MDRC: Howard Bloom, Gordon Berlin, George Bohrnstedt, Matthew Gushta, Rob Ivry, Pamela Morris, Marie-Andree Somers, Gary Phillips, and Shelley Rappaport.
We would like to thank all those who provided the professional development during the study, including the facilitators at America’s Choice and Pearson Achievement Solutions, as well as the members of the treatment team who provided monitoring support—Steve Leinwand and Meredith Ludwig. We also thank those who served as site coordinators: Midori Hargrave, Jack Rickard, and several staff who served in these roles in the first year of implementation. We also thank Delphinia Brown, Suzannah Herrmann, and Amber Noel for coordinating the classroom observations and data processing, and Edith Tuazon and for her support of those efforts and assistance with project communications. We appreciated the excellent assistance of Jeanette Moses in multiple roles across the project. We also thank Lynne Blankenship and the conference staff for all their support in managing many of the study’s professional development activities; Collin Payne for his excellent research assistance with the student records; all of the staff at REDA International, Inc., MDRC, Westat, and AIR who helped us collect and process data throughout the study; and the AIR and MDRC staff who helped us start the study up during the early years: Robert Ivry, Stephanie Safran, Kristin Porter, and Christian Geckeler. Finally, we would like to thank our report editors, Holly Baker, Lisa Knight, Patti Louthian, and Sharon Smith, who helped make the report useful and understandable.


v
DISCLOSURE OF POTENTIAL CONFLICTS OF INTEREST1
The research team for this study consisted of a prime contractor, American Institutes for Research (AIR), and three subcontractors, MDRC, REDA International, Inc., and Westat, Inc. None of these organizations or their key staff has financial interests that could be affected by findings from the Middle School Mathematics Professional Development Impact Study. No one on the 10-member Expert Advisory Panel, convened by the research team annually to provide advice and guidance, has financial interests that could be affected by findings from the evaluation.
1 Contractors carrying out research and evaluation projects for IES frequently need to obtain expert advice and technical assistance from individuals and entities whose other professional work may not be entirely independent of or separable from the particular tasks they are carrying out for the IES contractor. Contractors endeavor not to put such individuals or entities in positions in which they could bias the analysis and reporting of results, and their potential conflicts of interest are disclosed.

vii
CONTENTS
Acknowledgments ................................................................................................................... iii
Disclosure of Potential Conflicts of Interest ............................................................................. v
Executive Summary ............................................................................................................... xvii Middle School Mathematics Professional Development Impact Study.............................................. xvii Overview of the PD Program ....................................................................................................................... xix Study Design ....................................................................................................................................................... xx
Study Sample ................................................................................................................................................. xx Data Collection and Outcome Measures ............................................................................................. xxiii Analytic Approaches ................................................................................................................................. xxiv
Study Findings After One Year of Treatment .......................................................................................... xxv Implementation Findings for First Year of Treatment ...................................................................... xxv Impact Findings After One Year of Treatment .................................................................................. xxv Examining Additional Questions Related to the Impact Findings .............................................. xxviii
Summary ........................................................................................................................................................... xxix
Chapter 1. Overview of the Study .............................................................................................. 1 Motivation for the Study.................................................................................................................................... 1 Research Context ................................................................................................................................................. 2 Overview of the PD Program .......................................................................................................................... 3 Theory of Action ................................................................................................................................................. 4 Organization of This Report ............................................................................................................................ 6
Chapter 2. Study Design and Its Realization ............................................................................ 7 Study Design ......................................................................................................................................................... 7 Recruitment and Sample Characteristics ........................................................................................................ 9
Recruitment ...................................................................................................................................................... 9 Sample Characteristics ................................................................................................................................. 10
Data Collection .................................................................................................................................................. 12 Random Assignment of Participating Schools and Definitions of Analysis Samples ....................... 16
Random Assignment .................................................................................................................................... 16 Teacher Samples ........................................................................................................................................... 17 Student Samples ............................................................................................................................................ 18
Equivalence of Baseline Characteristics Between Treatment and Control Groups ........................... 18 Analytical Approaches ...................................................................................................................................... 23
Statistical Models for Estimating Impact ................................................................................................ 24 Understanding the Impact Tables ............................................................................................................. 25 Statistical Power ............................................................................................................................................ 26 Treatment of Missing Data ........................................................................................................................ 26 Weighting Used in Impact Analysis ......................................................................................................... 26
viii
Chapter 3. Design and Implementation of the PD Program .................................................. 29 Design of the PD Program ............................................................................................................................. 29
Summer Institute and Seminar Series ...................................................................................................... 30 Coaching ......................................................................................................................................................... 32
Implementation of the PD Program ............................................................................................................. 33 Professional Development Facilitators .................................................................................................... 34 Implementation of the Institute and Seminars ...................................................................................... 34 Implementation of the Coaching .............................................................................................................. 39 Teacher Participation in the PD Program .............................................................................................. 43
Comparison of the Professional Development Experienced by Treatment and Control Groups ............................................................................................................................................... 44
Chapter 4. Impact of the PD Program After the First Year of Implementation ..................... 47 Impact on Teacher Knowledge ...................................................................................................................... 47 Impact on Instructional Practice.................................................................................................................... 48 Impact on Student Achievement ................................................................................................................... 50 Impact by PD Provider .................................................................................................................................... 51 Impact by Mathematics Curriculum .............................................................................................................. 55 Summary .............................................................................................................................................................. 58
Chapter 5. Exploratory Analyses ............................................................................................. 59 Teacher Turnover During the First Implementation Year ...................................................................... 59 Differential Effects Based on Baseline Teacher Knowledge .................................................................. 60 Differential Effects Based on Student Baseline Achievement ................................................................ 63 Relationships Among Teacher Knowledge, Instructional Practice, and Student Achievement ...... 64 Summary .............................................................................................................................................................. 68
References................................................................................................................................ 69
Appendix A. Data Collection ................................................................................................. A-1 Implementation Form .................................................................................................................................... A-1 Coach Log ......................................................................................................................................................... A-1 Teacher Knowledge Test ............................................................................................................................... A-2 Classroom Observation Protocol ................................................................................................................ A-4 Teacher Surveys ............................................................................................................................................... A-7 Student Achievement Test ............................................................................................................................ A-9 Response Rates ............................................................................................................................................. A-14
Appendix B. Details of the Study Samples and Analytic Approaches .................................. B-1 Similarity of School and Teacher Samples to Broader Populations..................................................... B-1 Teacher Samples Referenced in the Report .............................................................................................. B-3 Student Samples Referenced in the Report ............................................................................................... B-5 Supplementary Baseline Equivalence Tests ............................................................................................. B-13 Technical Notes on Analytic Approaches ............................................................................................... B-42
ix
Appendix C. Supplemental Information on the Design and Implementation of the PD Program .............................................................................................................................. C-1 Scheduled Coverage of Mathematics Topics ............................................................................................ C-1 Content and Structure of America’s Choice’s Institute and Seminar Series ...................................... C-3 Content and Structure of Pearson Achievement Solutions’ Institute and Seminar Series ............. C-5 Duration of Institutes and Seminars by PD Provider ............................................................................. C-8 Variation in Coaching Received ................................................................................................................... C-8 Participation by PD Provider ..................................................................................................................... C-10 Unstandardized Service Contrast Results ................................................................................................ C-11
Appendix D. Supporting Tables and Figures for Impact Analyses ...................................... D-1 Robustness Checks for Impact Estimates ................................................................................................ D-1 Variation in the Impact of the PD Program Across Districts ............................................................. D-5 Unadjusted Means and Standard Deviations of Outcome Measures for Treatment and Control Groups .................................................................................................................................... D-8
Appendix E. Exploratory Analyses: Approaches and Additional Results ............................ E-1 Minimum Detectable Effect Sizes (MDES) for Interaction Tests ....................................................... E-1 Treatment Effect and Baseline Teacher Knowledge............................................................................... E-2 Relationships Among Teacher Knowledge, Instructional Practice, and Student Achievement ................................................................................................................................................E-10
x
EXHIBITS
Exhibit 1-1. Theory of Action ............................................................................................................................... 5
Exhibit 2-1. Instructional Practice Scales Used in Main Impact Analyses ................................................ 15
Exhibit A-1. Instructional Practice Scales Used in Impact Analyses ....................................................... A-7
Exhibit A-2. PD Characteristics Scales Used in Analysis of Service Contrast ....................................... A-8
Exhibit B-1. Teacher Turnover During the 2007–2008 School Year ...................................................... B-5
Exhibit B-2. Student Turnover During the 2007–2008 School Year ....................................................... B-8
Exhibit B-3. Student Baseline Analysis Sample in Fall 2007 .................................................................... B-10
Exhibit B-4. Student Impact Analysis Sample in Spring 2008 ................................................................. B-11
Exhibit B-5. Outcome Domains, Measures, Subgroups, and Types of Tests for the Middle School Mathematics PD Impact Study .................................................................................................. B-48
FIGURES
Figure ES-1. First-Year Impact of the PD Program on Teacher Knowledge ...................................... xxvi
Figure ES-2. First-Year Impact of the PD Program on Instructional Practice ................................... xxvii
Figure A-1. Test Duration for Student Test Administrations, by Test Wave ..................................... A-12
Figure A-2. Distribution of Standard Errors by Total RIT Score on Fall 2007 NWEA Rational Number Test ............................................................................................................................................... A-13
Figure D-1. First-Year Impact of the PD Program on Teacher Knowledge: Total Score, by District ............................................................................................................................................................ D-6
Figure D-2. First-Year Impact of the PD Program on Instructional Practice: Teacher Elicits Student Thinking Scale, by District ......................................................................................................... D-6
Figure D-3. First-Year Impact of the PD Program on Instructional Practice: Teacher Uses Representations Scale, by District ............................................................................................................ D-7
Figure D-4. First-Year Impact of the PD Program on Instructional Practice: Teacher Focuses on Mathematical Reasoning Scale, by District ...................................................................................... D-7
Figure D-5. First-Year Impact of the PD Program on Student Mathematics Achievement: Total Score, by District ............................................................................................................................... D-8
xi
TABLES
Table ES-1. Allocation of the 12 Study Districts Across PD Providers and Across Mathematics Curricula .................................................................................................................................. xxi
Table ES-2. Number of Schools, Teachers, and Students in Spring 2008 Impact Analysis Sample, Overall and Treatment Status ...................................................................................................... xxi
Table ES-3. School Background Characteristics for Study Sample Schools and Eligible Schools in Large Districts ........................................................................................................................... xxii
Table ES-4. Teacher Background Characteristics for Study Sample Teachers and Teachers in Eligible Schools in Large Districts ........................................................................................................... xxiii
Table 2-1. Allocation of the 12 Study Districts Across PD Providers and Across Mathematics Curricula .............................................................................................................................................................. 9
Table 2-2. School Background Characteristics for Study Sample Schools and Eligible Schools in Large Districts ............................................................................................................................................. 11
Table 2-3. Teacher Background Characteristics for Study Sample Teachers and Teachers in Eligible Schools in Large Districts .............................................................................................................. 12
Table 2-4. Overview of Data Collection Timing ............................................................................................ 13
Table 2-5. Number of Schools, Teachers, and Students in Spring 2008 Impact Analysis Sample, Overall and by Treatment Status ................................................................................................. 17
Table 2-6. School Background Characteristics, by Treatment Status ......................................................... 20
Table 2-7. Teacher Background Characteristics, by Treatment Status: Teacher Baseline Analysis Sample ............................................................................................................................................... 21
Table 2-8. Student Background Characteristics, by Treatment Status: Student Baseline Analysis Sample ............................................................................................................................................................... 23
Table 2-9. Minimum Detectable Effect Sizes (MDES) for Core Outcomes ........................................... 27
Table 3-1. Percentage of Planned PD Time Used (Duration) and Approximate Hours of Teacher Institutes and Seminars Covering Specific Content Areas .................................................... 35
Table 3-2. Mean Reallocated Hours and Percentage of Planned Segments Omitted and Abbreviated, Overall and by PD Provider ................................................................................................ 36
Table 3-3. Percentage of Teacher Institutes and Seminar Days on Which Features of the PD Matched the Plan, Averaged Across Days and Districts, Overall and by PD Provider ................. 38
Table 3-4. Percentage of Planned Coaching Time Implemented (Duration), Overall and by PD Provider ............................................................................................................................................................. 39
Table 3-5. Percentage of Coaching Visits With Specified Features and Time Spent in Coaching With These Features ....................................................................................................................................... 41
Table 3-6. Percentage of Coaching Visits With Specified Features and Time Spent in Coaching With These Features, by PD Provider ....................................................................................................... 42
Table 3-7. Percentage of Implemented Hours of the PD Attended by the Average Treatment Teacher .............................................................................................................................................................. 43
xii
Table 3-8. Treatment and Control Group Contrasts in Hours of Participation in Mathematics Workshops or Institutes Lasting More Than a Half-Day on Mathematics and Coaching ............ 45
Table 3-9. Treatment and Control Group Contrasts on PD Features ....................................................... 46
Table 4-1. First-Year Impact of the PD Program on Teacher Knowledge .............................................. 48
Table 4-2. First-Year Impact of the PD Program on Instructional Practice ............................................ 49
Table 4-3. First-Year Impact of the PD Program on Student Mathematics Achievement ................... 50
Table 4-4. First-Year Impact of the PD Program on Teacher Knowledge, Instructional Practice, and Student Mathematics Achievement, by PD Provider—America’s Choice ............... 52
Table 4-5. First-Year Impact of the PD Program on Teacher Knowledge, Instructional Practice, and Student Mathematics Achievement, by PD Provider—Pearson Achievement Solutions ............................................................................................................................................................ 54
Table 4-6. First-Year Impact of the PD Program on Teacher Knowledge, Instructional Practice, and Student Mathematics Achievement, by Mathematics Curriculum—CMP ................ 56
Table 4-7. First-Year Impact of the PD Program on Teacher Knowledge, Instructional Practice, and Student Mathematics Achievement, by Mathematics Curriculum—Glencoe/PH Mathematics ................................................................................................................................... 57
Table 5-1. First-Year Differences between Treatment and Control Groups on Teacher Knowledge, Instructional Practice, and Student Mathematics Achievement, for the Stable Teachers and Students of Stable Teachers Subgroups ........................................................................... 61
Table 5-2. Effects of the Interaction Between Treatment Status and Baseline Teacher Knowledge on First-Year Teacher and Student Outcomes .................................................................. 62
Table 5-3. Effects of the Interaction Between Treatment Status and Baseline Student Achievement on First-Year Student Achievement .................................................................................. 64
Table 5-4. First-Year Standardized Regression Coefficients for the Relationships Between Teacher Knowledge and Student Achievement and Between Instructional Practice and Student Achievement ..................................................................................................................................... 66
Table A-1. Distribution of Items on NWEA Rational Number Test ................................................... A-10
Table A-2. Average Test Duration (Minutes) for NWEA Rational Number Test, by Treatment Status and Test Wave ................................................................................................................................ A-11
Table A-3. Response Rates for All Student and Teacher Measures, by Treatment Status ............... A-15
Table B-1. School Background Characteristics for Study Sample Schools, Eligible Schools in Large Districts, and the National Population ......................................................................................... B-2
Table B-2. Teacher Background Characteristics for Study Sample Teachers, Teachers in Eligible Schools in Large Districts, and the National Population ...................................................... B-3
Table B-3. Student Background Characteristics for Fall Expanded Student Sample: Differences Between Students Included and Not Included in the Student Baseline Analysis Sample ........................................................................................................................................................... B-12
xiii
Table B-4. Student Background Characteristics for Spring Expanded Student Sample: Differences Between Students Included and Not Included in the Student Impact Analysis Sample ........................................................................................................................................................... B-13
Table B-5. School Background Characteristics, by Treatment Status and PD Provider—America’s Choice ........................................................................................................................................ B-15
Table B-6. Teacher Background Characteristics, by Treatment Status and PD Provider—America’s Choice: Teacher Baseline Analysis Sample ........................................................................ B-16
Table B-7. Student Background Characteristics, by Treatment Status and PD Provider—America’s Choice: Student Baseline Analysis Sample ......................................................................... B-17
Table B-8. School Background Characteristics, by Treatment Status and PD Provider—Pearson Achievement Solutions .............................................................................................................. B-18
Table B-9. Teacher Background Characteristics, by Treatment Status and PD Provider—Pearson Achievement Solutions: Teacher Baseline Analysis Sample .............................................. B-19
Table B-10. Student Background Characteristics, by Treatment Status and PD Provider—Pearson Achievement Solutions: Student Baseline Analysis Sample .............................................. B-20
Table B-11. School Background Characteristics, by Treatment Status and Mathematics Curriculum—CMP ...................................................................................................................................... B-21
Table B-12. Teacher Background Characteristics, by Treatment Status and Mathematics Curriculum—CMP: Teacher Baseline Analysis Sample ..................................................................... B-22
Table B-13. Student Background Characteristics, by Treatment Status and Mathematics Curriculum—CMP: Student Baseline Analysis Sample ...................................................................... B-23
Table B-14. School Background Characteristics, by Treatment Status and Mathematics Curriculum—Glencoe/PH Mathematics ..................................................................................................... B-24
Table B-15. Teacher Background Characteristics, by Treatment Status and Mathematics Curriculum—Glencoe/PH Mathematics: Baseline Analysis Sample .................................................... B-25
Table B-16. Student Background Characteristics, by Treatment Status and Mathematics Curriculum—Glencoe/PH Mathematics: Student Baseline Analysis Sample ..................................... B-26
Table B-17. Teacher Background Characteristics for the Stable Teachers Subgroup, by Treatment Status ......................................................................................................................................... B-27
Table B-18. Student Background Characteristics for the Students of Stable Teachers Subgroup, by Treatment Status ............................................................................................................... B-28
Table B-19. Student Background Characteristics, by Treatment Status: Fall Expanded Student Sample ........................................................................................................................................................... B-29
Table B-20. Teacher Background Characteristics, by Treatment Status: Teacher Impact Analysis Sample ........................................................................................................................................... B-30
Table B-21. Student Background Characteristics, by Treatment Status: Student Impact Analysis Sample ........................................................................................................................................... B-31
Table B-22. Teacher Background Characteristics, by Treatment Status and PD Provider—America’s Choice: Teacher Impact Analysis Sample .......................................................................... B-32
xiv
Table B-23. Student Background Characteristics, by Treatment Status and PD Provider—America’s Choice: Student Impact Analysis Sample ........................................................................... B-33
Table B-24. Teacher Background Characteristics, by Treatment Status and PD Provider—Pearson Achievement Solutions: Teacher Impact Analysis Sample ................................................ B-34
Table B-25. Student Background Characteristics, by Treatment Status and PD Provider—Pearson Achievement Solutions: Student Impact Analysis Sample ................................................ B-35
Table B-26. Teacher Background Characteristics, by Treatment Status and Mathematics Curriculum—CMP: Teacher Impact Analysis Sample ....................................................................... B-36
Table B-27. Student Background Characteristics, by Treatment Status and Mathematics Curriculum—CMP: Student Impact Analysis Sample ........................................................................ B-37
Table B-28. Teacher Background Characteristics, by Treatment Status and Mathematics Curriculum—Glencoe/PH Mathematics: Teacher Impact Analysis Sample ...................................... B-38
Table B-29. Student Background Characteristics, by Treatment Status and Mathematics Curriculum—Glencoe/PH Mathematics: Student Impact Analysis Sample ....................................... B-39
Table B-30. Teacher Background Characteristics for the Stable Teachers Subgroup, by Treatment Status ......................................................................................................................................... B-40
Table B-31. Student Background Characteristics for the Students of Stable Teachers Subgroup, by Treatment Status ............................................................................................................... B-41
Table B-32. Student Background Characteristics, by Treatment Status: Spring Expanded Student Sample ............................................................................................................................................ B-42
Table B-33. Missing Data for Teacher and Student Background Characteristics Used as Covariates in the Impact Models, Impact Analysis Sample .............................................................. B-46
Table C-1. Percentage of the School Year Explicitly Allocated to Rational Number Topics, by District ............................................................................................................................................................. C-2
Table C-2. Percentage of Planned PD Time Utilized (Duration) and Approximate Hours of Teacher Institutes and Seminars Covering Specific Content Areas, by PD Provider ................... C-8
Table C-3. Percentage of Planned Coaching Time Implemented (Duration), by Provider and Number of Treatment Teachers Coached .............................................................................................. C-9
Table C-4. Percentage of Implemented Hours of the PD Attended by the Average Treatment Teacher, by PD Provider—America’s Choice ..................................................................................... C-10
Table C-5. Percentage of Implemented Hours of the PD Attended by the Average Treatment Teacher, by PD Provider—Pearson Achievement Solutions ........................................................... C-10
Table C-6. Treatment and Control Group Contrasts on PD Features (unstandardized) .................. C-11
Table D-1. First-Year Impact of the PD Program on Teacher Knowledge, Without Covariates .... D-2
Table D-2. First-Year Impact of the PD Program on Instructional Practice, Without Covariates ...................................................................................................................................................... D-3
Table D-3. First-Year Impact of the PD Program on Student Mathematics Achievement, Without Covariates ...................................................................................................................................... D-4
xv
Table D-4. First-Year Impact of the PD Program on Student Mathematics Achievement, With Teacher Covariates ...................................................................................................................................... D-4
Table D-5. First-Year Impact of the PD Program on Student Mathematics Achievement, Using Teacher as Middle Level of Multi-level Model .......................................................................... D-5
Table D-6. Unadjusted Means and Standard Deviations for Teacher Knowledge, Instructional Practice, and Student Mathematics Achievement ................................................................................. D-9
Table D-7. Unadjusted Means and Standard Deviations for Teacher Knowledge, Instructional Practice, and Student Mathematics Achievement, by PD Provider—America’s Choice .......... D-10
Table D-8. Unadjusted Means and Standard Deviations for Teacher Knowledge, Instructional Practice, and Student Mathematics Achievement, by PD Provider—Pearson Achievement Solutions ....................................................................................................................................................... D-11
Table D-9. Unadjusted Means and Standard Deviations for Teacher Knowledge, Instructional Practice, and Student Mathematics Achievement, by Mathematics Curriculum—CMP ........... D-12
Table D-10. Unadjusted Means and Standard Deviations for Teacher Knowledge, Instructional Practice, and Student Mathematics Achievement, by Mathematics Curriculum—Glencoe/PH Mathematics .................................................................................................... D-13
Table E-1. First-Year Minimum Detectable Effect Sizes (MDES) for Interaction Between Treatment Status and Baseline Teacher Knowledge and Interaction Between Treatment Status and Student Achievement ............................................................................................................... E-2
Table E-2. Detailed Results for the Effects of the Interaction Between Treatment Status and Baseline Teacher Knowledge on First-Year Teacher and Student Outcomes ................................ E-5
Table E-4. Detailed Results for the Effects of the Linear and Quadratic Interaction Between Treatment Status and Baseline Teacher Knowledge on First-Year Teacher and Student Outcomes, Augmented Model 2 ............................................................................................................... E-8
Table E-5. Detailed Results for the Effects of the Interaction Between Treatment Status and Baseline Student Achievement on First-Year Student Outcomes ..................................................... E-9
Table E-6. First-Year Variance Decomposition of Standardized Student Spring Total NWEA Test Scores by Data Structure Level .......................................................................................................E-13

xvii
EXECUTIVE SUMMARY
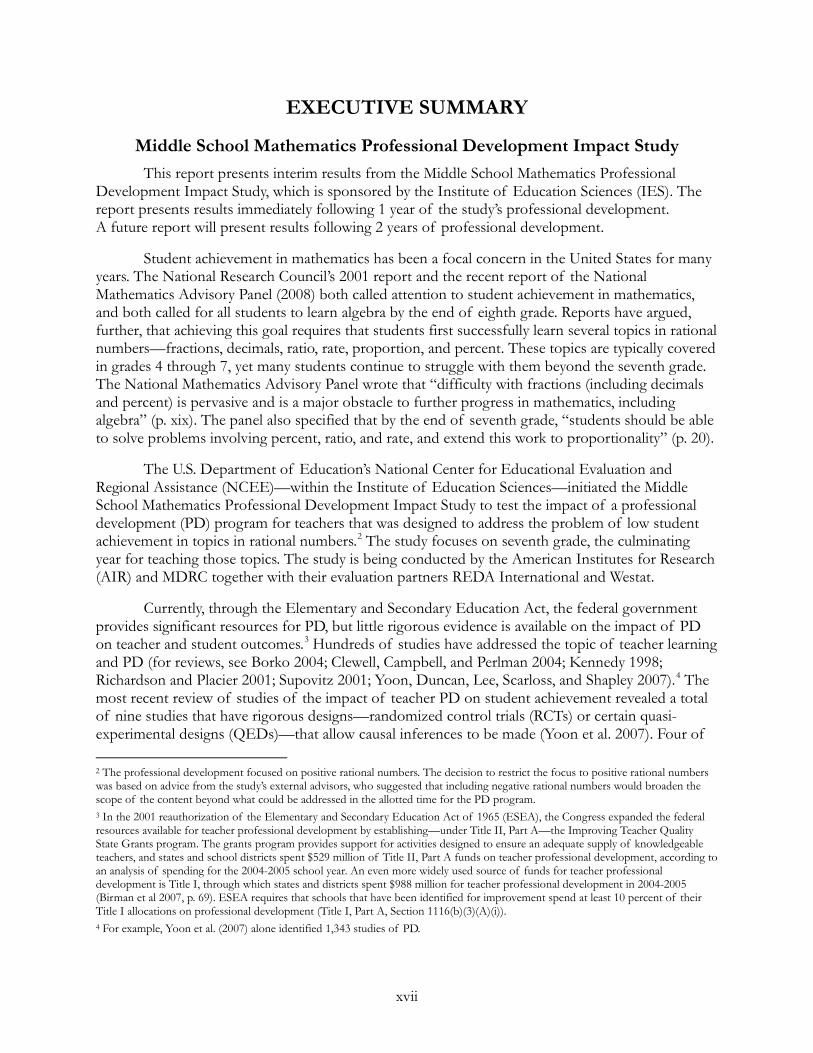
Middle School Mathematics Professional Development Impact Study This report presents interim results from the Middle School Mathematics Professional
Development Impact Study, which is sponsored by the Institute of Education Sciences (IES). The report presents results immediately following 1 year of the study’s professional development. A future report will present results following 2 years of professional development.
Student achievement in mathematics has been a focal concern in the United States for many years. The National Research Council’s 2001 report and the recent report of the National Mathematics Advisory Panel (2008) both called attention to student achievement in mathematics, and both called for all students to learn algebra by the end of eighth grade. Reports have argued, further, that achieving this goal requires that students first successfully learn several topics in rational numbers—fractions, decimals, ratio, rate, proportion, and percent. These topics are typically covered in grades 4 through 7, yet many students continue to struggle with them beyond the seventh grade. The National Mathematics Advisory Panel wrote that “difficulty with fractions (including decimals and percent) is pervasive and is a major obstacle to further progress in mathematics, including algebra” (p. xix). The panel also specified that by the end of seventh grade, “students should be able to solve problems involving percent, ratio, and rate, and extend this work to proportionality” (p. 20).
The U.S. Department of Education’s National Center for Educational Evaluation and Regional Assistance (NCEE)—within the Institute of Education Sciences—initiated the Middle School Mathematics Professional Development Impact Study to test the impact of a professional development (PD) program for teachers that was designed to address the problem of low student achievement in topics in rational numbers.2
Currently, through the Elementary and Secondary Education Act, the federal government provides significant resources for PD, but little rigorous evidence is available on the impact of PD on teacher and student outcomes.
The study focuses on seventh grade, the culminating year for teaching those topics. The study is being conducted by the American Institutes for Research (AIR) and MDRC together with their evaluation partners REDA International and Westat.
3 Hundreds of studies have addressed the topic of teacher learning and PD (for reviews, see Borko 2004; Clewell, Campbell, and Perlman 2004; Kennedy 1998; Richardson and Placier 2001; Supovitz 2001; Yoon, Duncan, Lee, Scarloss, and Shapley 2007).4
2 The professional development focused on positive rational numbers. The decision to restrict the focus to positive rational numbers was based on advice from the study’s external advisors, who suggested that including negative rational numbers would broaden the scope of the content beyond what could be addressed in the allotted time for the PD program.
The most recent review of studies of the impact of teacher PD on student achievement revealed a total of nine studies that have rigorous designs—randomized control trials (RCTs) or certain quasi-experimental designs (QEDs)—that allow causal inferences to be made (Yoon et al. 2007). Four of
3 In the 2001 reauthorization of the Elementary and Secondary Education Act of 1965 (ESEA), the Congress expanded the federal resources available for teacher professional development by establishing—under Title II, Part A—the Improving Teacher Quality State Grants program. The grants program provides support for activities designed to ensure an adequate supply of knowledgeable teachers, and states and school districts spent $529 million of Title II, Part A funds on teacher professional development, according to an analysis of spending for the 2004-2005 school year. An even more widely used source of funds for teacher professional development is Title I, through which states and districts spent $988 million for teacher professional development in 2004-2005 (Birman et al 2007, p. 69). ESEA requires that schools that have been identified for improvement spend at least 10 percent of their Title I allocations on professional development (Title I, Part A, Section 1116(b)(3)(A)(i)). 4 For example, Yoon et al. (2007) alone identified 1,343 studies of PD.
xviii
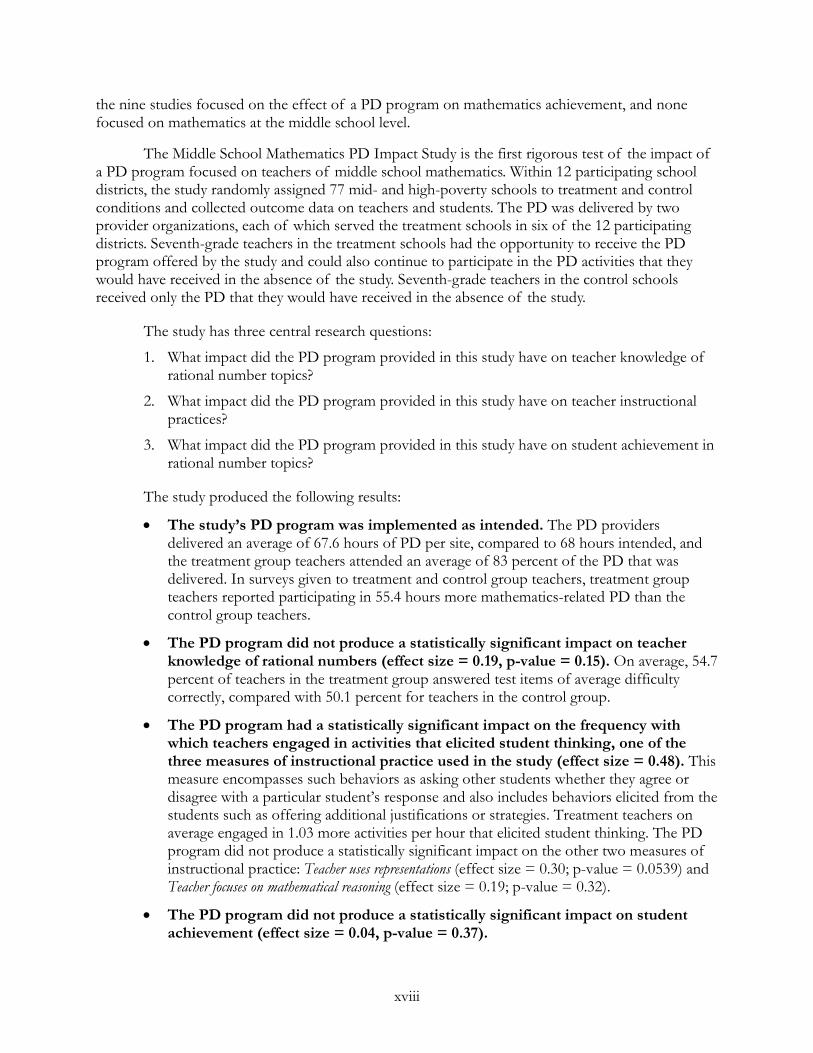
the nine studies focused on the effect of a PD program on mathematics achievement, and none focused on mathematics at the middle school level.
The Middle School Mathematics PD Impact Study is the first rigorous test of the impact of a PD program focused on teachers of middle school mathematics. Within 12 participating school districts, the study randomly assigned 77 mid- and high-poverty schools to treatment and control conditions and collected outcome data on teachers and students. The PD was delivered by two provider organizations, each of which served the treatment schools in six of the 12 participating districts. Seventh-grade teachers in the treatment schools had the opportunity to receive the PD program offered by the study and could also continue to participate in the PD activities that they would have received in the absence of the study. Seventh-grade teachers in the control schools received only the PD that they would have received in the absence of the study.
The study has three central research questions:
1. What impact did the PD program provided in this study have on teacher knowledge of rational number topics?
2. What impact did the PD program provided in this study have on teacher instructional practices?
3. What impact did the PD program provided in this study have on student achievement in rational number topics?
The study produced the following results:
•
•
•
•
The study’s PD program was implemented as intended. The PD providers delivered an average of 67.6 hours of PD per site, compared to 68 hours intended, and the treatment group teachers attended an average of 83 percent of the PD that was delivered. In surveys given to treatment and control group teachers, treatment group teachers reported participating in 55.4 hours more mathematics-related PD than the control group teachers.
The PD program did not produce a statistically significant impact on teacher knowledge of rational numbers (effect size = 0.19, p-value = 0.15). On average, 54.7 percent of teachers in the treatment group answered test items of average difficulty correctly, compared with 50.1 percent for teachers in the control group.
The PD program had a statistically significant impact on the frequency with which teachers engaged in activities that elicited student thinking, one of the three measures of instructional practice used in the study (effect size = 0.48). This measure encompasses such behaviors as asking other students whether they agree or disagree with a particular student’s response and also includes behaviors elicited from the students such as offering additional justifications or strategies. Treatment teachers on average engaged in 1.03 more activities per hour that elicited student thinking. The PD program did not produce a statistically significant impact on the other two measures of instructional practice: Teacher uses representations (effect size = 0.30; p-value = 0.0539) and Teacher focuses on mathematical reasoning (effect size = 0.19; p-value = 0.32).
The PD program did not produce a statistically significant impact on student achievement (effect size = 0.04, p-value = 0.37).
xix
Overview of the PD Program The PD program delivered in this study was designed to develop teachers’ capability to teach
positive rational number topics effectively. The PD program consisted of 68 contact hours, all addressing rational number topics, which is more PD in mathematics than most mathematics teachers typically receive in a single year.5,6 The PD included a 3-day summer institute and a series of 1-day follow-up seminars held during the school year, with in-school coaching following each seminar day. Within that structure, the specification of the PD program was guided by the literature, which is largely based on correlational research and practitioner experience.7
Within each topic in rational numbers, the PD program focused on two aspects of teachers’ content knowledge. The first, common knowledge of mathematics (CK), is the knowledge of topics in rational numbers that students should ideally have after completing the seventh grade. This knowledge includes computational or procedural skills, conceptual understanding, and problem-solving skills in rational number topics.
The second aspect of teachers’ content knowledge emphasized in the PD, specialized knowledge of mathematics for teaching (SK), is additional knowledge of rational numbers that may be useful for teaching rational number topics. For example, SK includes identifying the key mathematical understanding within a topic or problem, identifying common errors that occur in student work, and choosing useful representations and explanations when teaching rational numbers.
The summer institute and seminars blended activities intended to develop specialized knowledge of mathematics for teaching and to strengthen common knowledge of mathematics. The institutes and seminars were designed to use multiple delivery formats to provide teachers a variety of learning opportunities. The planned PD activities included opportunities for teachers to solve mathematics problems individually and in groups, make short oral presentations to explain how they solved problems, receive feedback on how they solved and presented their solutions, engage in discussions about the most common student misconceptions associated with topics in rational numbers, and plan lessons that they would teach during the follow-up coaching visits.
The primary purpose of the coaching component of the PD program was to help teachers apply material covered in the institutes and seminars to their classroom instruction. The coaching component was designed to consist of 10 days of coaching provided through five 2-day visits to each school. During the coaching visits at each school, the facilitators focused their activities on the school’s seventh-grade mathematics teachers. Each 2-day coaching visit was designed to occur immediately after one of the 5 seminar days and to link to the preceding seminar, using both individual and group activities.
5 Sixty-eight hours is the number of contact hours provided during the first year of the PD program, which is the focus of this report. Additional contact hours were provided in the second year of the PD program. 6 A national survey of teachers completed in 2005–2006 found that 11 percent of elementary teachers and 22 percent of secondary teachers assigned to teach mathematics participated in professional development in mathematics lasting more than 24 hours (U.S. Department of Education 2009, p. 95). 7 In the nine rigorous studies identified by Yoon et al. (2007), the variation in the features of the PD programs that were tested was not sufficient to draw conclusions about the characteristics of the PD programs that were effective. For example, across the nine studies, all PD programs were delivered in the form of a workshop or a summer institute, along with some form of follow-up support.
xx
Using the common structure, content, and other parameters described above, two providers selected through a competitive process delivered the PD program: America’s Choice and Pearson Achievement Solutions. Both providers built on their existing materials that addressed topics in rational numbers. Facilitator guides were refined through a year-long pilot and review process. The study’s external advisors reviewed both providers’ facilitator guides, focusing on the accuracy, appropriateness, and coherence of the mathematics content presented to teachers.
Study Design The Middle School Mathematics PD Impact Study was conducted in 12 districts. The study
used an experimental design with random assignment of schools to treatment and control conditions within each participating district. The difference in outcomes between the treatment schools and the control schools can be interpreted as the effect of the study’s PD model relative to “business as usual” in each participating district.
Study Sample
The study focused on districts using one of three specific mathematics curricula so that the PD could be designed to be relevant to the curricula that teachers were using in their classrooms. The three curricula were identified by determining the most commonly used curricula in the districts that met the study’s size criteria. The most commonly used curricula fell into two categories. The sample was therefore constructed to form two parallel substudies of the same design but in different curricular contexts.8
Each of the two PD providers—America’s Choice and Pearson Achievement Solutions—was assigned to work with 6 of the 12 districts participating in the study. Providers were assigned to districts to balance the allocation of districts using Glencoe/PH Mathematics and CMP across providers.
One substudy took place in 6 districts using either Glencoe McGraw-Hill Mathematics: Applications and Concepts or Prentice Hall Mathematics (referred to jointly as Glencoe/PH Mathematics); a parallel substudy took place in 6 districts using Connected Mathematics (CMP). The two categories of curricula differ in organization, lesson components, instructional approaches supported, and content emphasized, so the impact of the PD may differ by curriculum type.
9
Twelve eligible districts in nine states agreed to participate in the study. Each district provided 4 to 8 study schools, producing a total sample size of 77 schools. Within these schools, the spring 2008 analysis sample included 195 teachers and 11,479 students, distributed across treatment and control groups as shown in Table ES-2.
Thus, as shown in Table ES-1, the 6 districts using Glencoe/PH Mathematics were split between the two providers (three for America’s Choice and three for Pearson Achievement Solutions), and the six districts using CMP were similarly split, so that the effect of the PD in either curricular context would be derived from the services of both organizations.
8 Although the study was conducted in two identifiable curricular contexts, the study is not designed to test the effectiveness of the mathematics curricula used in the participating districts. Rather, it is a study of the impact of the specific PD program used. 9 Note that the assignment of districts to providers was not random. Among the districts using Glencoe and PH Mathematics, we assigned the three districts using Glencoe to America’s Choice and the three districts using PH Mathematics to Pearson Achievement Solutions on the basis of providers’ prior experiences working with those curricula. Among the districts using CMP, we took into account the geographic proximity of provider staff to the study districts.
xxi
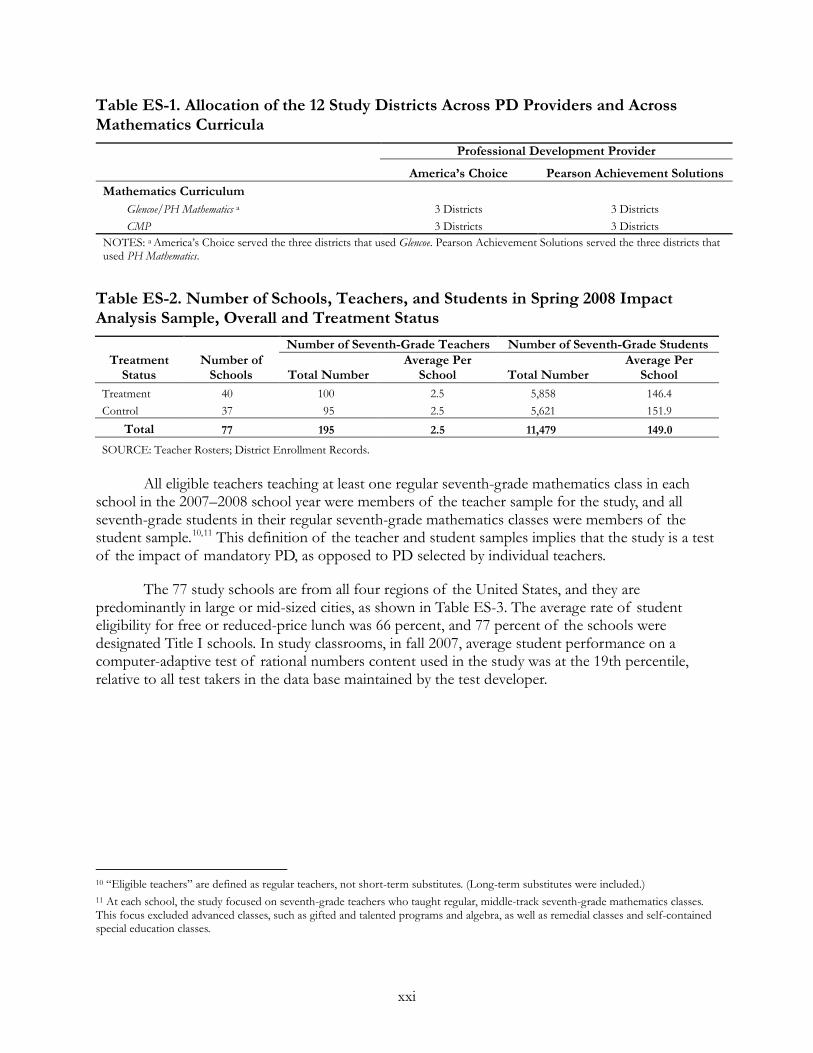
Table ES-1. Allocation of the 12 Study Districts Across PD Providers and Across Mathematics Curricula
Professional Development Provider
America’s Choice Pearson Achievement Solutions Mathematics Curriculum
Glencoe/PH Mathematics a 3 Districts 3 Districts CMP 3 Districts 3 Districts
NOTES: a America’s Choice served the three districts that used Glencoe. Pearson Achievement Solutions served the three districts that used PH Mathematics.
Table ES-2. Number of Schools, Teachers, and Students in Spring 2008 Impact Analysis Sample, Overall and Treatment Status
Treatment Status
Number of Schools
Number of Seventh-Grade Teachers Number of Seventh-Grade Students
Total Number Average Per
School Total Number Average Per
School Treatment 40 100 2.5 5,858 146.4 Control 37 95 2.5 5,621 151.9
Total 77 195 2.5 11,479 149.0
SOURCE: Teacher Rosters; District Enrollment Records.
All eligible teachers teaching at least one regular seventh-grade mathematics class in each school in the 2007–2008 school year were members of the teacher sample for the study, and all seventh-grade students in their regular seventh-grade mathematics classes were members of the student sample.10,11
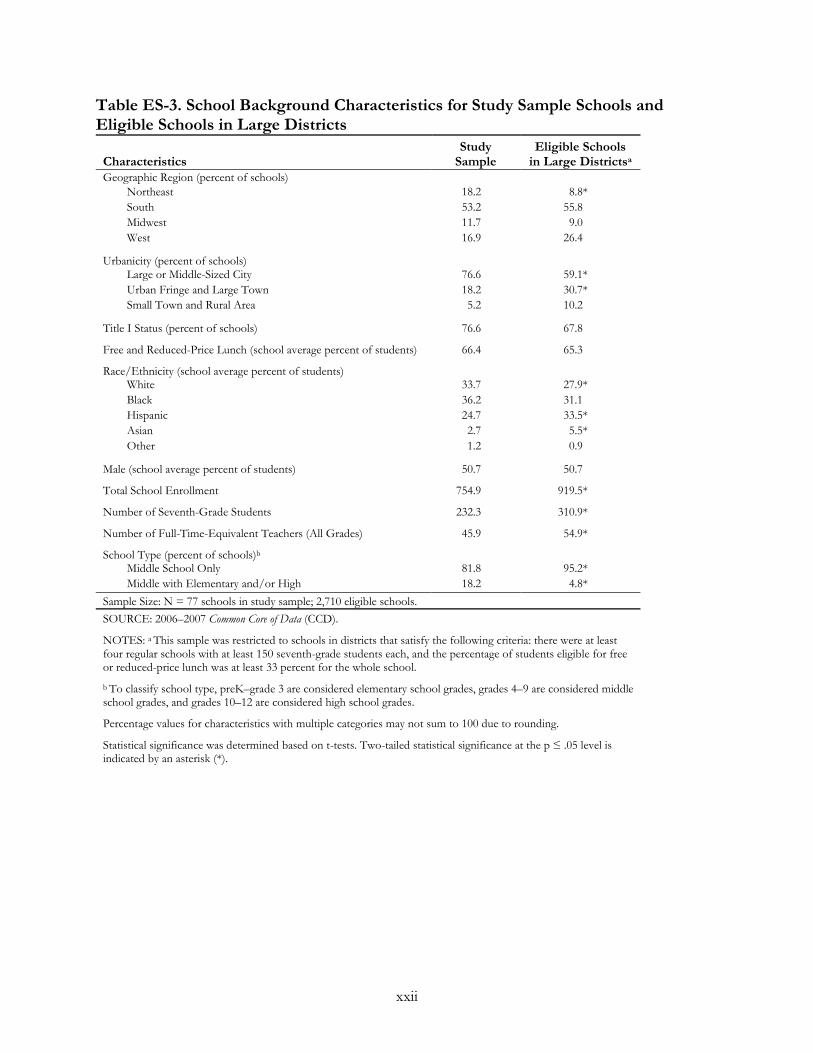
The 77 study schools are from all four regions of the United States, and they are predominantly in large or mid-sized cities, as shown in Table ES-3. The average rate of student eligibility for free or reduced-price lunch was 66 percent, and 77 percent of the schools were designated Title I schools. In study classrooms, in fall 2007, average student performance on a computer-adaptive test of rational numbers content used in the study was at the 19th percentile, relative to all test takers in the data base maintained by the test developer.
This definition of the teacher and student samples implies that the study is a test of the impact of mandatory PD, as opposed to PD selected by individual teachers.
10 “Eligible teachers” are defined as regular teachers, not short-term substitutes. (Long-term substitutes were included.) 11 At each school, the study focused on seventh-grade teachers who taught regular, middle-track seventh-grade mathematics classes. This focus excluded advanced classes, such as gifted and talented programs and algebra, as well as remedial classes and self-contained special education classes.
xxii
Table ES-3. School Background Characteristics for Study Sample Schools and Eligible Schools in Large Districts
Characteristics Study
Sample Eligible Schools
in Large Districtsa Geographic Region (percent of schools)
Northeast 18.2 8.8* South 53.2 55.8 Midwest 11.7 9.0 West 16.9 26.4
Urbanicity (percent of schools)
Large or Middle-Sized City 76.6 59.1* Urban Fringe and Large Town 18.2 30.7* Small Town and Rural Area 5.2 10.2
Title I Status (percent of schools) 76.6 67.8
Free and Reduced-Price Lunch (school average percent of students) 66.4 65.3
Race/Ethnicity (school average percent of students)
White 33.7 27.9* Black 36.2 31.1 Hispanic 24.7 33.5* Asian 2.7 5.5* Other 1.2 0.9
Male (school average percent of students) 50.7 50.7
Total School Enrollment 754.9 919.5*
Number of Seventh-Grade Students 232.3 310.9*
Number of Full-Time-Equivalent Teachers (All Grades) 45.9 54.9*
School Type (percent of schools)b
Middle School Only 81.8 95.2* Middle with Elementary and/or High 18.2 4.8*
Sample Size: N = 77 schools in study sample; 2,710 eligible schools. SOURCE: 2006–2007 Common Core of Data (CCD).
NOTES: a This sample was restricted to schools in districts that satisfy the following criteria: there were at least four regular schools with at least 150 seventh-grade students each, and the percentage of students eligible for free or reduced-price lunch was at least 33 percent for the whole school.
b To classify school type, preK–grade 3 are considered elementary school grades, grades 4–9 are considered middle school grades, and grades 10–12 are considered high school grades.
Percentage values for characteristics with multiple categories may not sum to 100 due to rounding.
Statistical significance was determined based on t-tests. Two-tailed statistical significance at the p ≤ .05 level is indicated by an asterisk (*).
xxiii
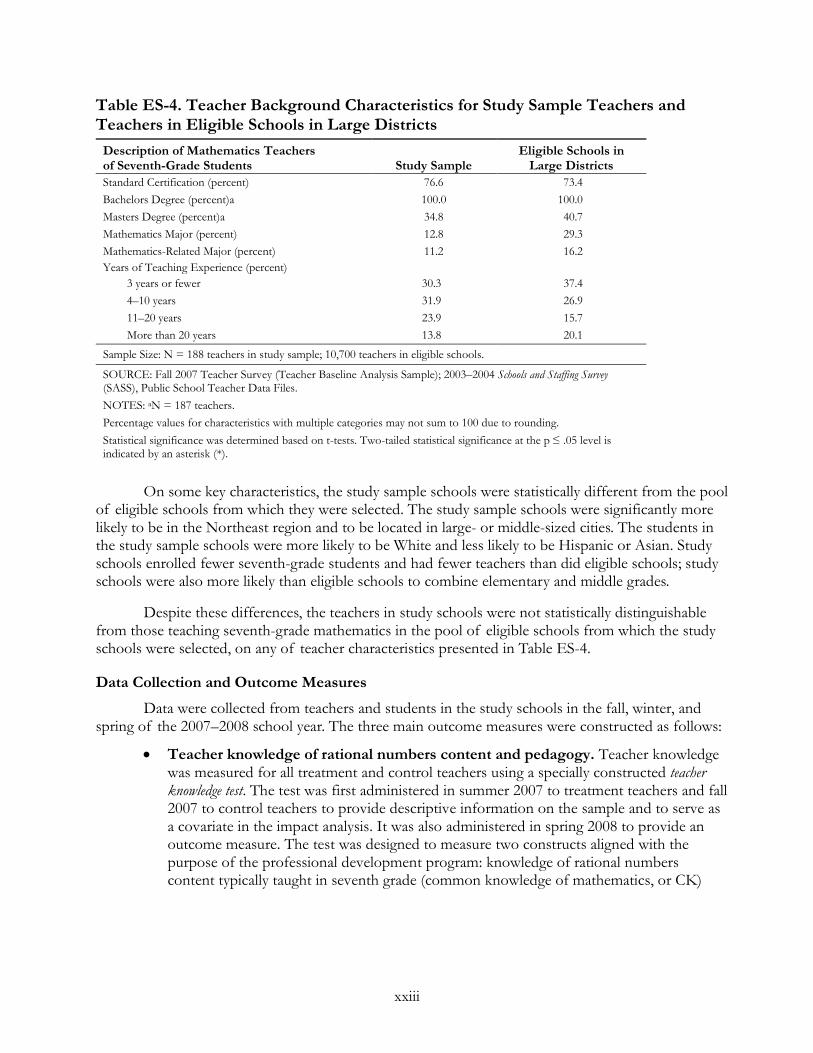
Table ES-4. Teacher Background Characteristics for Study Sample Teachers and Teachers in Eligible Schools in Large Districts
Description of Mathematics Teachers of Seventh-Grade Students Study Sample
Eligible Schools in Large Districts
Standard Certification (percent) 76.6 73.4 Bachelors Degree (percent)a 100.0 100.0 Masters Degree (percent)a 34.8 40.7 Mathematics Major (percent) 12.8 29.3 Mathematics-Related Major (percent) 11.2 16.2 Years of Teaching Experience (percent)
3 years or fewer 30.3 37.4 4–10 years 31.9 26.9 11–20 years 23.9 15.7 More than 20 years 13.8 20.1
Sample Size: N = 188 teachers in study sample; 10,700 teachers in eligible schools.
SOURCE: Fall 2007 Teacher Survey (Teacher Baseline Analysis Sample); 2003–2004 Schools and Staffing Survey (SASS), Public School Teacher Data Files. NOTES: aN = 187 teachers. Percentage values for characteristics with multiple categories may not sum to 100 due to rounding. Statistical significance was determined based on t-tests. Two-tailed statistical significance at the p ≤ .05 level is indicated by an asterisk (*).
On some key characteristics, the study sample schools were statistically different from the pool
of eligible schools from which they were selected. The study sample schools were significantly more likely to be in the Northeast region and to be located in large- or middle-sized cities. The students in the study sample schools were more likely to be White and less likely to be Hispanic or Asian. Study schools enrolled fewer seventh-grade students and had fewer teachers than did eligible schools; study schools were also more likely than eligible schools to combine elementary and middle grades.
Despite these differences, the teachers in study schools were not statistically distinguishable from those teaching seventh-grade mathematics in the pool of eligible schools from which the study schools were selected, on any of teacher characteristics presented in Table ES-4.
Data Collection and Outcome Measures
Data were collected from teachers and students in the study schools in the fall, winter, and spring of the 2007–2008 school year. The three main outcome measures were constructed as follows:
• Teacher knowledge of rational numbers content and pedagogy. Teacher knowledge was measured for all treatment and control teachers using a specially constructed teacher knowledge test. The test was first administered in summer 2007 to treatment teachers and fall 2007 to control teachers to provide descriptive information on the sample and to serve as a covariate in the impact analysis. It was also administered in spring 2008 to provide an outcome measure. The test was designed to measure two constructs aligned with the purpose of the professional development program: knowledge of rational numbers content typically taught in seventh grade (common knowledge of mathematics, or CK)
xxiv
and additional knowledge that may be useful for teaching rational number topics (specialized knowledge of mathematics for teaching, or SK).12
•
•
Teachers’ instructional practices. To measure instructional practice for treatment and control teachers, one classroom observation was conducted for each teacher after the treatment teachers in that district had had at least 5 of the 8 scheduled days of institutes and seminars. The observations produced three primary measures of instructional practice, which documented the frequency with which the teacher employed several key behaviors encouraged by the PD program.
13
Student achievement in rational numbers. A customized, computer-adaptive student achievement test was constructed for the study by the Northwest Evaluation Association (NWEA). The test developed for this study was restricted to positive rational numbers content and drew on a customized item base that contained nearly 1,200 rational numbers items abstracted from the larger NWEA item bank of scaled, operational items.
The first measure, Teacher elicits student thinking, encompassed such behaviors as asking other students whether they agree or disagree with a particular student’s response and also included behaviors elicited from the students such as offering additional justifications or strategies. The second measure, Teacher uses representations, counted the number of times the teacher displayed and explained a visual representation of mathematics, such as number lines or ratio tables, as well as the number of different types of representations the teacher used. The third measure, Teacher focuses on mathematical reasoning, counted the number of times that the teacher asked questions such as Why does this procedure work? Why does my answer make sense? or Why isn’t 3/4 a reasonable answer to this problem?
14
We also surveyed teachers to gather data on their backgrounds and on the amount and type of PD in mathematics they participated in during the study period. Study staff obtained information on the implementation of the PD by observing the institute and seminars and by reviewing logs maintained by coaches that recorded the nature of each coach interaction with each teacher.
Analytic Approaches
The basic analytic strategy for assessing the impact of the PD program was to compare outcomes for schools that were randomly assigned within each district to each of the two study conditions. Because we used nested data, three-level models (with students nested within teachers’ classrooms nested within schools) were used to estimate the impact of professional development on student achievement and two-level models (with teachers nested within schools) were used to
12 Each form included 24 multiple-choice or short-response items, equally divided between CK and SK and equally divided between the two major domains of rational numbers on which the PD focused: (1) fractions and decimals and (2) ratio, rate, proportion, and percent. 13 These measures, although related to the goals of the PD program, do not provide comprehensive coverage of the behaviors the PD hoped to affect. Some desired behaviors did not lend themselves to observation in the course of a single class session (e.g., continuity, follow-up), and others could not be rated reliably by our observers, who did not have specific expertise in mathematics and mathematics teaching. We did not attempt to measure the accuracy of the mathematics presented or the quality of the teacher’s actions. 14 Each individual student was presented with 30 items from the customized item base, chosen adaptively from four topic areas: fractions (11 items), decimals (4 items), percents (4 items), and ratios/proportions (11 items). Within each topic area, items were selected for presentation in a manner that ensured distribution across the cognitive categories of concepts, operations, and applications. To aid interpretation of the total score results, NWEA also constructed customized, seventh-grade norms by reanalyzing data from its Growth Research Database—a large data base compiled from NWEA testing.
xxv
estimate the impact on the teacher measures. The impact model used the sample of teachers and students present in the study schools as of the spring 2008 data collection period. The estimates provide an intent-to-treat analysis of the impact of the PD program because they reflect impact on the targeted (or “intended”) sample, whether or not all eligible teachers in the treatment schools participated fully in the PD provided.
Study Findings After One Year of Treatment Implementation Findings for First Year of Treatment
•
•
Across the study’s 12 districts, the average number of hours of institutes, seminars, and coaching delivered was 67.6 hours—approximately the number intended. During the institutes and seminars, the PD providers delivered an average of 45.2 hours of professional development, 94 percent of the intended 48 hours. During the coaching, the treatment group teachers received an average of 4.5 hours of coaching per 2-day coaching visit, 112 percent of the intended 4 hours per visit. Almost 84 percent of the coaching hours were spent on topics that were a focus of the study’s PD program.
The treatment group teachers attended an average of 83 percent of the implemented hours of the study-provided PD program and reported participating in 55.4 hours more mathematics-related PD than the control group teachers. Institute and seminar attendance records and coach logs recorded the extent of participation in the study-provided PD program. When asked to report on all mathematics-related PD received between summer and spring—including both study-provided PD and PD not related to the study—treatment group teachers reported receiving significantly more hours of mathematics-related institutes, seminars, and coaching than control group teachers (76.5 hours compared with 21.2 hours).
Impact Findings After One Year of Treatment
Impact on Teachers’ Knowledge of Rational Number Topics and How to Teach Rational Number Topics
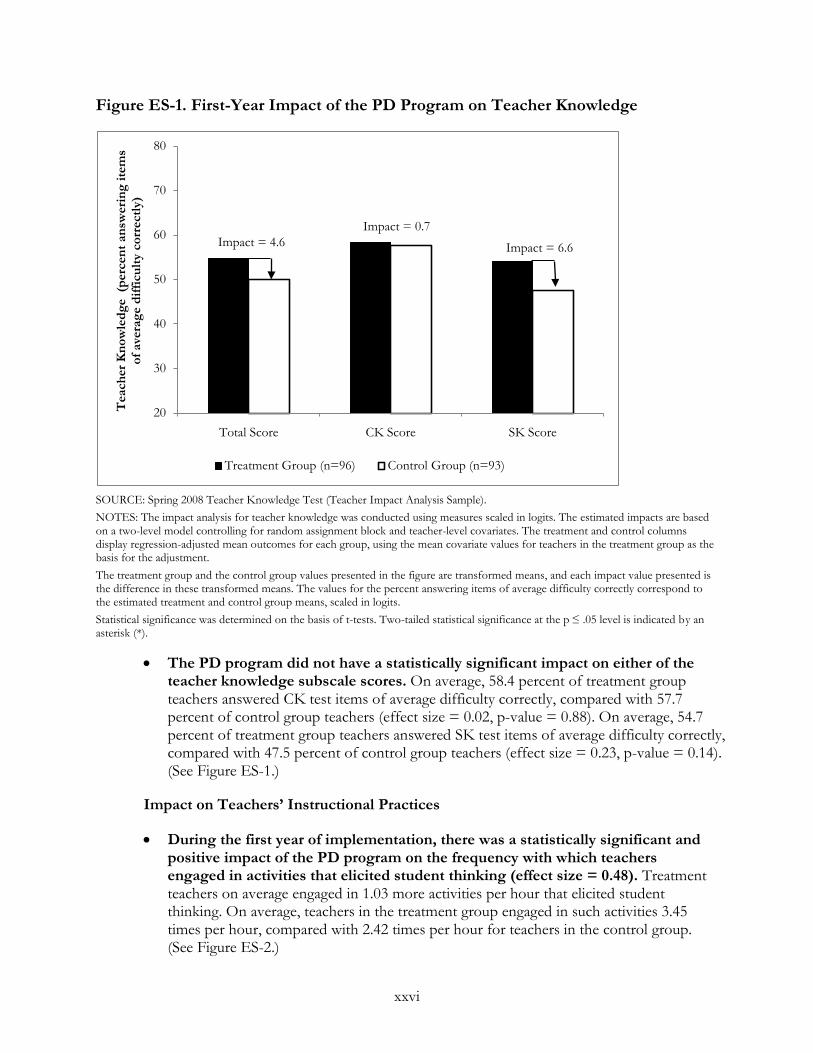
• During the first year of implementation, the PD program did not have a statistically significant impact on overall teacher knowledge (effect size = 0.19, p-value = 0.15). On average, 54.7 percent of teachers in the treatment group answered test items of average difficulty correctly, compared with 50.1 percent for teachers in the control group. (See Figure ES-1.) To put these results into context, the study also administered the teacher knowledge test to the PD provider staff (i.e., the staff who delivered the institutes, seminars, and coaching). On average, 92.7 percent of the PD provider staff answered test items of average difficulty correctly.15
15 As described in Chapter 2, the difficulty level of the teacher knowledge test was intentionally aligned with the average knowledge level of the study population. The much higher performance of the PD facilitators on this same instrument provides perspective on the estimated size of the knowledge gain that was effected by the PD program.
xxvi
Figure ES-1. First-Year Impact of the PD Program on Teacher Knowledge
20
30
40
50
60
70
80
Total Score CK Score SK Score
Tea
cher
Kno
wle
dge
(per
cent
ans
wer
ing
item
s of
ave
rage
diff
icul
ty c
orre
ctly
)
Treatment Group (n=96) Control Group (n=93)
Impact = 0.7
Impact = 6.6Impact = 4.6
SOURCE: Spring 2008 Teacher Knowledge Test (Teacher Impact Analysis Sample). NOTES: The impact analysis for teacher knowledge was conducted using measures scaled in logits. The estimated impacts are based on a two-level model controlling for random assignment block and teacher-level covariates. The treatment and control columns display regression-adjusted mean outcomes for each group, using the mean covariate values for teachers in the treatment group as the basis for the adjustment. The treatment group and the control group values presented in the figure are transformed means, and each impact value presented is the difference in these transformed means. The values for the percent answering items of average difficulty correctly correspond to the estimated treatment and control group means, scaled in logits. Statistical significance was determined on the basis of t-tests. Two-tailed statistical significance at the p ≤ .05 level is indicated by an asterisk (*).
• The PD program did not have a statistically significant impact on either of the teacher knowledge subscale scores. On average, 58.4 percent of treatment group teachers answered CK test items of average difficulty correctly, compared with 57.7 percent of control group teachers (effect size = 0.02, p-value = 0.88). On average, 54.7 percent of treatment group teachers answered SK test items of average difficulty correctly, compared with 47.5 percent of control group teachers (effect size = 0.23, p-value = 0.14). (See Figure ES-1.)
Impact on Teachers’ Instructional Practices
• During the first year of implementation, there was a statistically significant and positive impact of the PD program on the frequency with which teachers engaged in activities that elicited student thinking (effect size = 0.48). Treatment teachers on average engaged in 1.03 more activities per hour that elicited student thinking. On average, teachers in the treatment group engaged in such activities 3.45 times per hour, compared with 2.42 times per hour for teachers in the control group. (See Figure ES-2.)
xxvii
Figure ES-2. First-Year Impact of the PD Program on Instructional Practice
0
0.5
1
1.5
2
2.5
3
3.5
Elicits Student Thinking Uses Representations Focuses on Math Reasoning
Inst
ruct
iona
l Pra
ctic
e (e
vent
rate
per
hou
r)
Treatment Group (n=93) Control Group (n=86)
Impact = 1.03*
Impact = 0.56
Impact = 0.08
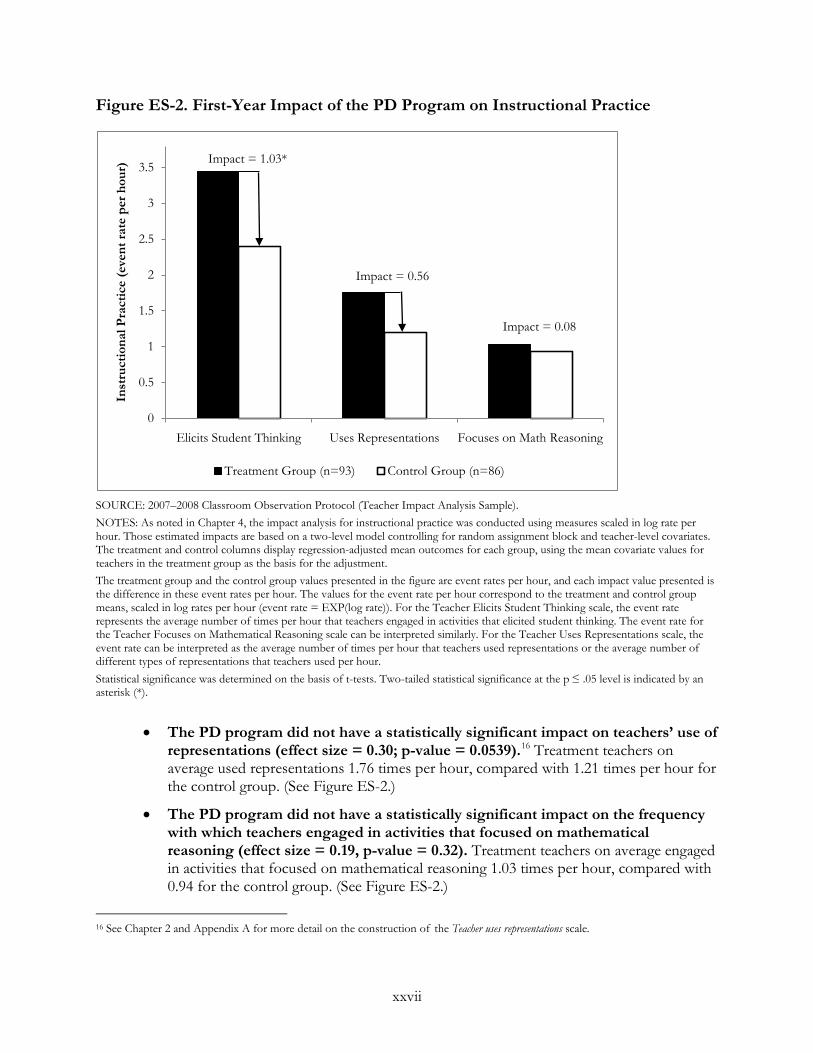
SOURCE: 2007–2008 Classroom Observation Protocol (Teacher Impact Analysis Sample). NOTES: As noted in Chapter 4, the impact analysis for instructional practice was conducted using measures scaled in log rate per hour. Those estimated impacts are based on a two-level model controlling for random assignment block and teacher-level covariates. The treatment and control columns display regression-adjusted mean outcomes for each group, using the mean covariate values for teachers in the treatment group as the basis for the adjustment. The treatment group and the control group values presented in the figure are event rates per hour, and each impact value presented is the difference in these event rates per hour. The values for the event rate per hour correspond to the treatment and control group means, scaled in log rates per hour (event rate = EXP(log rate)). For the Teacher Elicits Student Thinking scale, the event rate represents the average number of times per hour that teachers engaged in activities that elicited student thinking. The event rate for the Teacher Focuses on Mathematical Reasoning scale can be interpreted similarly. For the Teacher Uses Representations scale, the event rate can be interpreted as the average number of times per hour that teachers used representations or the average number of different types of representations that teachers used per hour. Statistical significance was determined on the basis of t-tests. Two-tailed statistical significance at the p ≤ .05 level is indicated by an asterisk (*).
•
•
The PD program did not have a statistically significant impact on teachers’ use of representations (effect size = 0.30; p-value = 0.0539).16
The PD program did not have a statistically significant impact on the frequency with which teachers engaged in activities that focused on mathematical reasoning (effect size = 0.19, p-value = 0.32). Treatment teachers on average engaged in activities that focused on mathematical reasoning 1.03 times per hour, compared with 0.94 for the control group. (See Figure ES-2.)
Treatment teachers on average used representations 1.76 times per hour, compared with 1.21 times per hour for the control group. (See Figure ES-2.)
16 See Chapter 2 and Appendix A for more detail on the construction of the Teacher uses representations scale.
xxviii
Impact on Student Achievement in Rational Numbers
•
•
During the first year of implementation, the PD program did not have a statistically significant impact on average student achievement as measured by the Total scale score (effect size = 0.04, p-value = 0.37). Students in treatment schools on average scored 217.11 scale score points, compared with 216.59 for the control group.
The PD program did not have a statistically significant impact on either of the student achievement subscale scores. On the Fractions and decimals score, students in treatment schools on average scored 215.53 scale score points, compared with 215.01 scale score points for students in control schools (effect size = 0.03, p-value = 0.38). On the Ratio and proportion score, students in treatment schools on average scored 218.65 scale score points, compared with 218.18 scale score points for students in control schools (effect size = 0.03, p-value = 0.46).
Examining Additional Questions Related to the Impact Findings
We examined several additional questions related to the impact findings using nonexperimental analyses. Specifically, we examined whether teacher turnover during the school year might alter the interpretation of the impact findings, because teachers who began after the beginning of the school year did not have access to all of the PD. We also examined whether outcomes may have differed if the PD had targeted teachers with low or high levels of prior knowledge, or on students with low or high levels of prior achievement. Finally, we examined whether the knowledge or practices emphasized in the PD appear to be related to student achievement, irrespective of teachers’ treatment status. The study was not designed to provide a rigorous test of these questions, so the results should be viewed as suggestive.
•
•
Teacher Turnover. Some teachers in the treatment group participated in nearly all the PD, whereas others participated in only some of the PD. Teachers who remained in their schools from the fall baseline data collection to the end of the school year had access to more of the PD than those teachers who came later in the school year. We compared outcomes for treatment teachers who remained in their schools from the fall baseline data collection to the spring impact data collection with outcomes for control teachers who remained in their schools over this same period. Overall, 91 percent of the teachers in the impact analyses were present in the fall; the remaining 9 percent arrived sometime later in the year. Analyses focused on the subsample of “stable” teachers and their students yielded results similar to those for the full study sample. These nonexperimental results suggest that, despite its consequences for access to the PD, teacher turnover does not appear to alter the observed impact findings.
Baseline Teacher Knowledge. A second question is whether the PD program may have been more or less effective for teachers who began the study with different levels of baseline knowledge. Teachers with high levels of baseline knowledge may have found the PD too easy; teachers with low levels of baseline knowledge may have found the PD too hard. Nonexperimental analyses did not show a statistically significant association between teachers’ initial knowledge levels and treatment-control differences in teacher knowledge, their instructional practice, or student achievement, which suggests that targeting the PD to teachers with a particular level of mathematics knowledge would be unlikely to alter the findings.
xxix
•
•
Baseline Student Achievement. A third question is whether the PD program may have been more or less effective for students who began the year with different levels of baseline achievement. Students of different initial achievement levels might have had different needs. Nonexperimental analyses indicated that the PD program did not appear to be more or less effective for students with low or high initial achievement, which suggests that targeting the PD to teachers with students of a particular mathematics skill level would be unlikely to alter the findings.
Teacher Knowledge, Instructional Practice, and Student Achievement. A final question is whether the study’s outcome measures captured aspects of teacher knowledge and instructional practice that are associated with student achievement. Correlational analyses show no statistically significant relationships linking the teacher knowledge measures and instructional practice measures to student achievement, although most of the coefficients were positive and consistent in magnitude with associations reported in the literature.
Summary In summary, the study’s results indicate that, during the first year of implementation, the PD
program did not have a statistically significant impact on teacher knowledge. It had a significant positive impact on the frequency with which teachers engaged in activities intended to elicit student thinking, one of the study’s three measures of instructional practice, but it did not have a statistically significant impact on the other two measures of instruction. The PD program did not have a statistically significant impact on student achievement in rational numbers.
Nonexperimental analyses conducted to supplement the main impact analyses suggest that the main results were not affected by teacher turnover during the implementation year. The nonexperimental analyses did not provide evidence of differential effectiveness for teachers with different levels of baseline knowledge or students with different levels of baseline achievement.
These results should be interpreted in the context of the study’s design, the settings in which the PD was delivered, and the study’s measures. The study was designed to examine the impact of the PD program as implemented by two providers in 12 districts. On average, students in the study schools entered seventh grade substantially below grade level, scoring at the 19th percentile on the study’s measure of achievement in rational numbers. While one strength of the study is that it assessed the impact of the PD program on teacher knowledge and instruction, the instructional practice measures focused only on the frequency with which teachers engaged in specific practices, not the quality with which the practices were implemented. Further, although the study met the targets set for statistical power, the sample size and the reliability of the teacher measures limited the precision of the estimated effects on teacher knowledge and instruction.
The results reported here are based on a single year of implementation of the PD program, in the 2007-2008 school year. During the 2008–2009 school year, in 6 of the 12 study districts, teachers in schools randomly assigned to the treatment condition were provided with the opportunity to participate in a second year of PD focused on rational numbers. The next report from the Middle School Mathematics PD Impact Study will provide evidence on the impact of the full, two-year PD program.

1
CHAPTER 1. OVERVIEW OF THE STUDY
This report presents interim results from the Middle School Mathematics Professional Development Impact Study, which is sponsored by the Institute of Education Sciences (IES). The report presents results immediately following 1 year of the study’s professional development. A future report will present results following 2 years of professional development.
The study is being conducted by the American Institutes for Research (AIR) and MDRC together with their evaluation partners REDA International and Westat. The teacher professional development on which the study focuses was delivered by America’s Choice and Pearson Achievement Solutions.
This chapter provides background information and an overview of the study. It first presents the motivation and research context for the study and then provides an overview of the professional development on which the study focuses. It concludes by presenting the theory of action and outlining the remainder of the report.
Motivation for the Study Student achievement in mathematics has been a focal concern in the United States for many
years. The National Research Council’s 2001 report and the recent report of the National Mathematics Advisory Panel (2008) both called attention to student achievement in mathematics, and both called for all students to learn algebra by the end of eighth grade.
Reports have argued, further, that achieving this goal requires that students first successfully learn several topics in rational numbers—fractions, decimals, ratio, rate, proportion, and percent. These topics are typically covered in grades 4 through 7, yet many students continue to struggle with them beyond the seventh grade. The National Mathematics Advisory Panel wrote that “difficulty with fractions (including decimals and percent) is pervasive and is a major obstacle to further progress in mathematics, including algebra” (p. xix). The panel also specified that by the end of grade 7, “students should be able to solve problems involving percent, ratio, and rate, and extend this work to proportionality” (p. 20).
One source of this problem may be deficits in teachers’ knowledge. A recent study of elementary teachers showed that their mathematics knowledge correlated with their student’s gains in mathematics (Hill, Rowan, and Ball 2005). Another study examined rational number knowledge among 136 pre-service elementary teachers, 26 of whom were undergraduate mathematics majors. Tirosh, Fischbein, Graeber, and Wilson (1999) found that although most pre-service teachers were successful in adding, subtracting, and multiplying fractions, many had difficulty with dividing fractions. These prospective teachers also demonstrated weak conceptual understanding and had trouble constructing representations of key concepts. For example, 43 percent of their sample claimed that there is no number between 1/5 and 1/4, and very few were able to go beyond area model representations of fractions to construct set models, number lines, or ratio models.17
17 See also Newton (2008).
2
No studies have focused on middle school mathematics teachers’ knowledge of rational number topics. However, national survey data show that in 2003–2004, some 66.6 percent of public school teachers assigned to teach seventh-grade mathematics did not hold a degree in mathematics.18
To improve teachers’ knowledge and skill, federal policymakers have committed significant resources to teacher professional development. In the 2001 reauthorization of the Elementary and Secondary Education Act of 1965 (ESEA), Congress expanded the federal resources available for teacher professional development by establishing—under Title II, Part A—the Improving Teacher Quality State Grants program. The grants program provides support for activities designed to ensure an adequate supply of knowledgeable teachers, and states and school districts spent $529 million of Title II, Part A funds on teacher professional development, according to an analysis of spending for the 2004–2005 school year. A more widely used source of funds for teacher professional development is Title I, through which states and districts spent $988 million for teacher professional development in 2004–2005 (Birman et al. 2007, p. 69). ESEA requires that schools that have been identified for improvement spend at least 10 percent of their Title I allocations on professional development (Title I, Part A, Section 1116(b)(3)(A)(i)).
One recent study administered a mathematics test to a random sample of middle school mathematics teachers in the United States and found that those teaching in low-income schools had lower levels of mathematics knowledge than their peers in more affluent schools (Hill 2007).
Research Context The U.S. Department of Education’s National Center for Educational Evaluation and
Regional Assistance (NCEE)—within the Institute of Education Sciences—initiated the Middle School Mathematics Professional Development (PD) Impact Study to test the effect of a professional development (PD) program for teachers that was designed to address the problem of low student achievement in topics in rational numbers.19
Currently, little rigorous evidence is available on the impact of PD on teacher and student outcomes. Over the past decade, hundreds of studies have addressed the topic of teacher learning and PD (for reviews, see Borko 2004; Clewell, Campbell, and Perlman 2004; Kennedy 1998; Richardson and Placier 2001; Supovitz 2001; Yoon, et al. 2007).
The study focused on seventh grade, the culminating year for teaching those topics.
20
The Middle School Mathematics PD Impact Study is the first rigorous test of the impact of a PD program focused on teachers of middle school mathematics. Within 12 participating school districts, the study randomly assigned 77 mid- and high-poverty schools to treatment and control
The most recent review of studies of the impact of teacher PD on student achievement revealed a total of nine studies that have rigorous designs—randomized control trials (RCTs) or certain quasi-experimental designs (QEDs)—that allow causal inferences to be made (Yoon et al. 2007). Four of the nine studies focused on the effect of a PD program on mathematics achievement, and none focused on mathematics at the middle school level.
18 Authors’ tabulations from the 2003-2004 Schools and Staffing Survey. 19 The professional development focused on positive rational numbers. The decision to restrict the focus to positive rational numbers was based on advice from the study’s external advisors, who suggested that including negative rational numbers would broaden the scope of the content beyond what could be addressed in the allotted time for the PD program. 20 For example, Yoon et al. (2007) alone identified 1,343 studies of PD.
3
conditions and collected outcome data on teachers and students. The study has three central research questions:
1. What impact did the PD program provided in this study have on teacher knowledge of rational number topics?
2. What impact did the PD program provided in this study have on teacher instructional practices?
3. What impact did the PD program provided in this study have on student achievement in rational number topics?
Overview of the PD Program The PD program delivered in this study was designed to develop teachers’ capability to teach
positive rational number topics effectively. AIR held a competition in November 2005 to identify organizations to provide PD that would meet the study’s requirements. In February 2006, AIR selected the PD providers—America’s Choice and Pearson Achievement Solutions—who adapted their existing materials that addressed topics in rational numbers.
To design the PD program, the PD providers followed a common set of guidelines regarding the structure of the PD program, the knowledge to be developed, and key aspects of the delivery of the PD. The PD program included a 3-day summer institute (18 hours per teacher), five 1-day seminars held during the school year (30 hours per teacher), and 10 days of intensive in-school coaching (20 hours per teacher). The in-school coaching sessions occurred immediately after each seminar and were scheduled to the extent possible to align with periods in which rational number topics were being covered in the districts’ seventh-grade mathematics curriculum. The total intended dosage of 68 hours of PD in rational number topics is higher than the dosage of mathematics-related PD that most mathematics teachers typically receive in a single year.21
The PD program focused on rational number topics—specifically, fractions, decimals, ratio, rate, proportion, and percent. Within each topic, the PD program focused on two aspects of teachers’ content knowledge. The first, common knowledge of mathematics (CK), is the knowledge of topics in rational numbers that students should ideally have after completing the seventh grade.
22 This knowledge includes computational or procedural skills, conceptual understanding, and problem-solving skills, all of which are believed to be mutually reinforcing and important skills for mathematics teachers to emphasize.23
The second aspect of teachers’ content knowledge emphasized in the PD, specialized knowledge of mathematics for teaching (SK), is additional knowledge of rational numbers that may
The PD sought to strengthen teachers’ CK.
21 A national survey of teachers completed in 2005–2006 found that 11 percent of elementary teachers and 22 percent of secondary mathematics teachers participated in professional development in mathematics lasting more than 24 hours (U.S. Department of Education 2009, p. 95). 22 Recent literature on teacher knowledge refers to a type of knowledge called common content knowledge, or CCK (Hill et al. 2008; Hill, Rowan, and Ball 2005; Hill 2007). This study’s term, common knowledge of mathematics (CK), has the same meaning. 23 The National Mathematics Advisory Panel (2008) asserted that “computational fluency and conceptual understanding are mutually supportive” (p. 26). Later, the Panel noted that “the curriculum should make explicit connections between intuitive understanding and formal problem solving involving fractions” (p. 29). See also see also Pashler et al. (2007).
4
be useful for teaching rational number topics.24
The specification of key aspects of the delivery of the PD program was guided by the literature, which is largely based on correlational research and practitioner experience, so the choice of the delivery format for the PD program tested in this study is in part speculative.
For example, SK includes identifying the key mathematical understanding within a topic or problem, identifying common errors that occur in student work, and selecting representations and explanations that are useful when teaching rational numbers. The National Mathematics Advisory Panel (2008, p. 29) noted that instruction should use appropriate representations to support student learning in rational numbers, and a recent review suggested that using a number line helps students understand topics in rational numbers (Pashler et al. 2007). Hill et al. (2005), using data on elementary school instruction from the Study of Instructional Improvement, found that a knowledge measure similar to our measure of SK was related to student achievement gains in mathematics.
25
1. Opportunities for active learning. PD that engages teachers in the learning process through observation, discussion, practice, and reflection (Garet et al. 2001; Lieberman 1996; Loucks-Horsley et al. 1998)
The three key aspects of delivery and associated claims in the literature were as follows:
2. Incorporation into daily work. PD activities that are incorporated in teachers’ daily school work, such as coaching, mentoring, and in-school discussion groups (Garet et al. 2001; Hargreaves and Fullan 1992; Little 1993; Stiles, Loucks-Horsley, and Hewson 1996)
3. Collective participation. PD that includes groups of teachers from the same school, the same department within the school, or the same grade level in the school (Ball 1996; Elmore 2002; Knapp 1997; Talbert and McLaughlin 1993)
Chapter 3 provides more detailed descriptions of each PD provider’s approach to the summer institute, seminars, and coaching.
Theory of Action Exhibit 1-1 presents a simplified theory of action for the study. The three boxes
representing the study outcomes—teacher knowledge, instructional practice, and student achievement—each contain a list of the measures used in the analyses. The arrows connecting the boxes posit several relationships among the PD, teacher knowledge, instructional practice, and student achievement:
24 Recent literature on teacher knowledge defines an overall domain called content knowledge for teaching of mathematics (CKT-M), which includes four subdomains: common content knowledge, specialized content knowledge, knowledge of content and teaching, and knowledge of content and students (Hill et al. 2008; Hill, Rowan, and Ball 2005; Hill 2007). This study’s term, specialized mathematics knowledge for teaching (SK), is an amalgam of the latter three subdomains. Note that SK is not equivalent to what Shulman (1986) called pedagogical content knowledge. 25 In the nine rigorous studies identified by Yoon et al. (2007), the variation in the features of the PD programs that were tested was not sufficient to draw conclusions about the characteristics of the PD programs that were effective. For example, across the nine studies, all PD programs were delivered in the form of a workshop or a summer institute, along with some form of follow-up support.
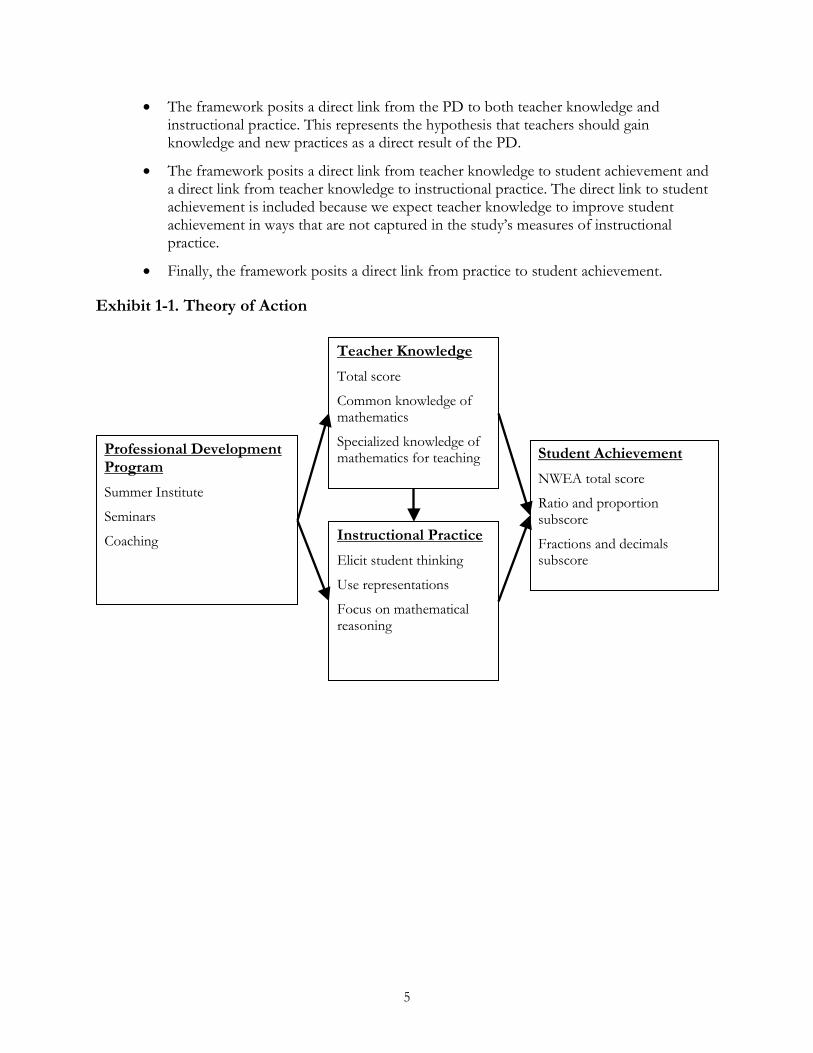
5
•
•
•
The framework posits a direct link from the PD to both teacher knowledge and instructional practice. This represents the hypothesis that teachers should gain knowledge and new practices as a direct result of the PD.
The framework posits a direct link from teacher knowledge to student achievement and a direct link from teacher knowledge to instructional practice. The direct link to student achievement is included because we expect teacher knowledge to improve student achievement in ways that are not captured in the study’s measures of instructional practice.
Finally, the framework posits a direct link from practice to student achievement.
Exhibit 1-1. Theory of Action
Professional Development Program Summer Institute
Seminars
Coaching
Instructional Practice Elicit student thinking
Use representations
Focus on mathematical reasoning
Student Achievement NWEA total score
Ratio and proportion subscore
Fractions and decimals subscore
Teacher Knowledge Total score
Common knowledge of mathematics
Specialized knowledge of mathematics for teaching
6
Organization of This Report This report presents the study’s findings after 1 year of implementing the PD in the
treatment schools. A subsequent report will present findings after 2 years of implementing the PD.26
Chapter 2 of this report describes the study design and its realization, including a description of the sample and tests of baseline equivalence of the treatment and control groups on observed characteristics. Chapter 3 describes the design and implementation of the PD program and the extent of service contrast between the treatment and control groups. The remaining two chapters describe our findings:
•
•
Chapter 4 addresses the impact of the PD program on teacher knowledge, instructional practice, and student mathematics achievement.
Chapter 5 provides several nonexperimental analyses that explore additional questions related to the impact findings.
The appendices provide more detail on the measures used, the study design, the implementation of the PD, and the impact of the PD. A final appendix provides more information about the nonexperimental analyses.
26 During the second year of the study, the sample will include 6 of the 12 districts that participated in the first year of the study. Within those 6 districts, a second year of PD was delivered in the schools randomly assigned to the treatment condition in the first year.
7
CHAPTER 2. STUDY DESIGN AND ITS REALIZATION
This chapter describes key features of the study design and its realization. The first sections describe the study design, the process of recruiting districts and schools, and the sample characteristics. After describing the study’s data collections, the chapter describes the random assignment process and the analysis samples and provides tests of the equivalence of treatment and control groups. A final section describes our approach to the impact analyses presented in Chapters 4 and 5.
Study Design The Middle School Mathematics PD Impact Study was conducted in 12 districts. The study
used an experimental design with random assignment of schools to treatment and control conditions within each participating district. The difference in outcomes between the treatment schools and the control schools can be interpreted as the effect of the study’s PD model relative to “business as usual” in each participating district.
Control condition. Seventh-grade teachers in the control schools received the professional development that they would have received in the absence of the study—that is, business as usual.
Treatment condition. Seventh-grade teachers in the treatment schools had the opportunity to receive the PD program offered by the study and also could continue to participate in business as usual.
At each school, the study focused on seventh-grade teachers who taught regular, middle-track seventh-grade mathematics classes. This focus excluded advanced classes, such as gifted and talented programs and algebra, as well as remedial classes and self-contained special education classes. All who taught or were students in a qualifying course were considered study participants. This definition of the teacher and student samples makes the study a test of the impact of mandatory PD, as opposed to PD selected by individual teachers.
The study focused on districts using one of three specific mathematics curricula so that the PD could be designed to be relevant to teachers using those curricula. The three curricula were identified by determining the most commonly used curricula in the districts that met the study’s size criteria (see the subsection on recruitment below). The most commonly used curricula fell into two categories. The sample was therefore constructed to form two parallel substudies of the same design but in different curricular contexts.27
27 Although the study was conducted in two identifiable curricular contexts, the reader should bear in mind that the study is not designed to test the effectiveness of the mathematics curricula used in the participating districts. Rather, it is a study of the impact of the specific PD program used.
One substudy took place in six districts using either Glencoe McGraw-Hill Mathematics: Applications and Concepts or Prentice Hall Mathematics (referred to jointly as Glencoe/PH Mathematics); a parallel substudy took place in six districts using Connected Mathematics (CMP). Among the features that distinguish the two categories of curricula are the following:
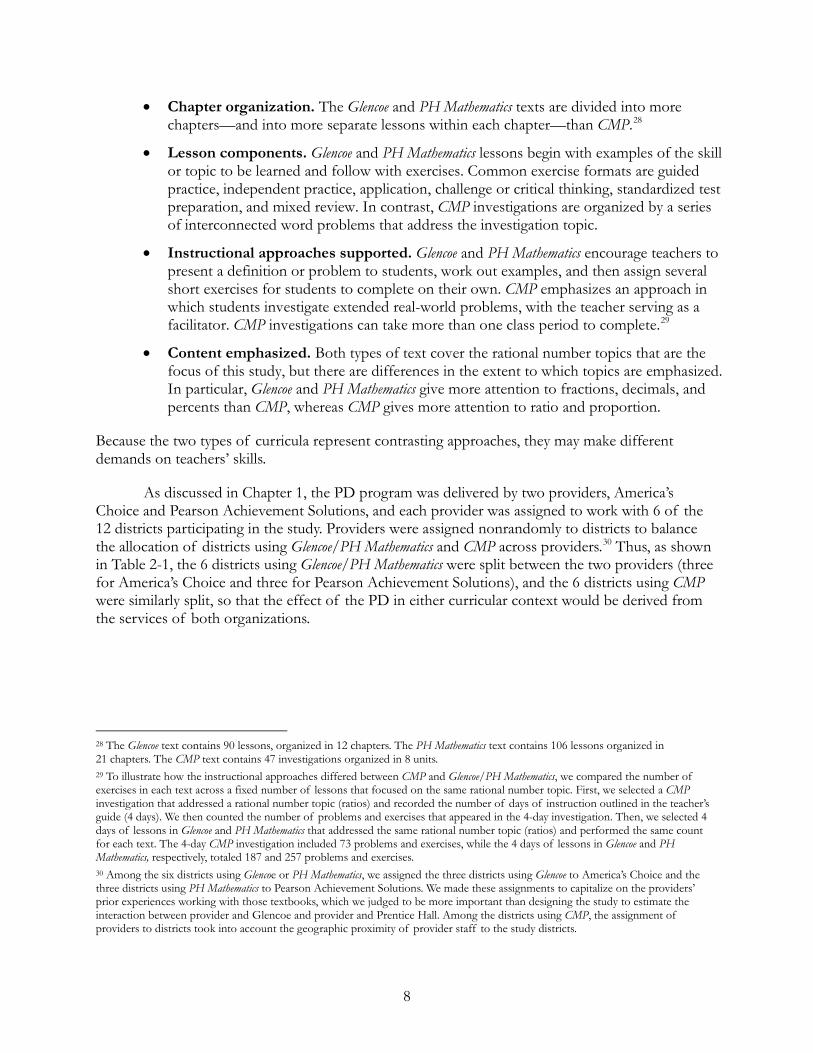
8
•
•
•
•
Chapter organization. The Glencoe and PH Mathematics texts are divided into more chapters—and into more separate lessons within each chapter—than CMP.28
Lesson components. Glencoe and PH Mathematics lessons begin with examples of the skill or topic to be learned and follow with exercises. Common exercise formats are guided practice, independent practice, application, challenge or critical thinking, standardized test preparation, and mixed review. In contrast, CMP investigations are organized by a series of interconnected word problems that address the investigation topic.
Instructional approaches supported. Glencoe and PH Mathematics encourage teachers to present a definition or problem to students, work out examples, and then assign several short exercises for students to complete on their own. CMP emphasizes an approach in which students investigate extended real-world problems, with the teacher serving as a facilitator. CMP investigations can take more than one class period to complete.29
Content emphasized. Both types of text cover the rational number topics that are the focus of this study, but there are differences in the extent to which topics are emphasized. In particular, Glencoe and PH Mathematics give more attention to fractions, decimals, and percents than CMP, whereas CMP gives more attention to ratio and proportion.
Because the two types of curricula represent contrasting approaches, they may make different demands on teachers’ skills.
As discussed in Chapter 1, the PD program was delivered by two providers, America’s Choice and Pearson Achievement Solutions, and each provider was assigned to work with 6 of the 12 districts participating in the study. Providers were assigned nonrandomly to districts to balance the allocation of districts using Glencoe/PH Mathematics and CMP across providers.30
Thus, as shown in Table 2-1, the 6 districts using Glencoe/PH Mathematics were split between the two providers (three for America’s Choice and three for Pearson Achievement Solutions), and the 6 districts using CMP were similarly split, so that the effect of the PD in either curricular context would be derived from the services of both organizations.
28 The Glencoe text contains 90 lessons, organized in 12 chapters. The PH Mathematics text contains 106 lessons organized in 21 chapters. The CMP text contains 47 investigations organized in 8 units. 29 To illustrate how the instructional approaches differed between CMP and Glencoe/PH Mathematics, we compared the number of exercises in each text across a fixed number of lessons that focused on the same rational number topic. First, we selected a CMP investigation that addressed a rational number topic (ratios) and recorded the number of days of instruction outlined in the teacher’s guide (4 days). We then counted the number of problems and exercises that appeared in the 4-day investigation. Then, we selected 4 days of lessons in Glencoe and PH Mathematics that addressed the same rational number topic (ratios) and performed the same count for each text. The 4-day CMP investigation included 73 problems and exercises, while the 4 days of lessons in Glencoe and PH Mathematics, respectively, totaled 187 and 257 problems and exercises. 30 Among the six districts using Glencoe or PH Mathematics, we assigned the three districts using Glencoe to America’s Choice and the three districts using PH Mathematics to Pearson Achievement Solutions. We made these assignments to capitalize on the providers’ prior experiences working with those textbooks, which we judged to be more important than designing the study to estimate the interaction between provider and Glencoe and provider and Prentice Hall. Among the districts using CMP, the assignment of providers to districts took into account the geographic proximity of provider staff to the study districts.
9
Table 2-1. Allocation of the 12 Study Districts Across PD Providers and Across Mathematics Curricula
Professional Development Provider
America’s Choice Pearson Achievement
Solutions Mathematics Curriculum
Glencoe/PH Mathematics a 3 Districts 3 Districts CMP 3 Districts 3 Districts
NOTES: a America’s Choice served the three districts that used Glencoe. Pearson Achievement Solutions served the three districts that used PH Mathematics.
Recruitment and Sample Characteristics Recruitment
The 12 districts were identified and recruited through a multistage process. In the first stage, we used information from the 2003–2004 Common Core of Data (CCD, National Center for Education Statistics) to identify districts throughout the nation that operated four or more schools meeting the study criteria.31
In the second stage, the resulting list of 311 districts was narrowed to 40 districts. Among the 311 districts, initial contact efforts focused on the 167 districts containing 6 or more eligible schools. We identified the three curricula that were most commonly used (as noted above) and then focused on the districts that had been using one of those three curricula as the core seventh-grade mathematics program in most of their schools during the 2006–2007 year. We further focused on districts that did not provide districtwide PD in mathematics instruction of the same type and level of intensity as that being provided by the study.
To be included, a school had to have at least 150 students in the seventh grade, so that there would likely be more than one teacher assigned to teach seventh-grade mathematics, and a school had to have 33 percent or more of all students eligible for free or reduced-price lunch, so that the sample would be relevant to federal education programs, which tend to target low-income students.
32
In the third stage, study staff held informational conference calls with officials in the 40 districts identified in stage two and subsequently visited the 21 districts that expressed interest in participating in the study. A second visit was conducted in each district to present information to principals at eligible middle schools. After a final informational meeting in Washington, DC, the study team secured final commitments from district officials and principals in 12 study districts, located in nine states. The number of study schools in each district varied from 4 to 8, for a total of 77 schools.
Contact efforts were subsequently expanded to include those districts with four or five eligible schools, until a sample of 40 eligible districts was identified.
31 To identify eligible districts within states that did not appear in the 2003–2004 CCD (i.e., New York, Tennessee, and Kentucky), the study team examined district websites and held conversations with consultants. 32 Districts that provided professional development in mathematics instruction that targeted teachers of students in grades other than seventh, involved fewer than 10 hours of training, was attended by individual teachers rather than teams of teachers from the same schools, or focused on topics such as classroom management rather than the theory and practices of mathematics instruction were eligible for the study. Districts that assigned mathematics coaches to support the entire teaching staff of one or more schools or to support teachers of students in the seventh grade were eligible for the study, provided that the district’s coaching would not create scheduling problems or excess burden for teachers participating in the study.
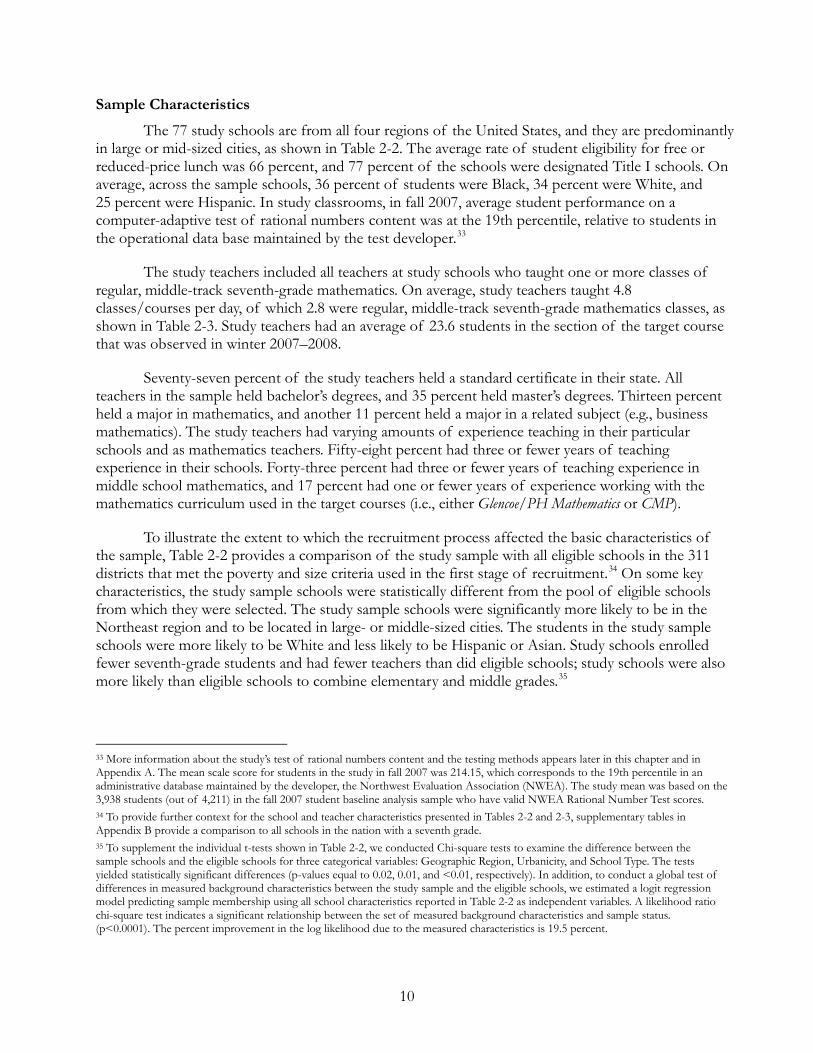
10
Sample Characteristics
The 77 study schools are from all four regions of the United States, and they are predominantly in large or mid-sized cities, as shown in Table 2-2. The average rate of student eligibility for free or reduced-price lunch was 66 percent, and 77 percent of the schools were designated Title I schools. On average, across the sample schools, 36 percent of students were Black, 34 percent were White, and 25 percent were Hispanic. In study classrooms, in fall 2007, average student performance on a computer-adaptive test of rational numbers content was at the 19th percentile, relative to students in the operational data base maintained by the test developer.33
The study teachers included all teachers at study schools who taught one or more classes of regular, middle-track seventh-grade mathematics. On average, study teachers taught 4.8 classes/courses per day, of which 2.8 were regular, middle-track seventh-grade mathematics classes, as shown in Table 2-3. Study teachers had an average of 23.6 students in the section of the target course that was observed in winter 2007–2008.
Seventy-seven percent of the study teachers held a standard certificate in their state. All teachers in the sample held bachelor’s degrees, and 35 percent held master’s degrees. Thirteen percent held a major in mathematics, and another 11 percent held a major in a related subject (e.g., business mathematics). The study teachers had varying amounts of experience teaching in their particular schools and as mathematics teachers. Fifty-eight percent had three or fewer years of teaching experience in their schools. Forty-three percent had three or fewer years of teaching experience in middle school mathematics, and 17 percent had one or fewer years of experience working with the mathematics curriculum used in the target courses (i.e., either Glencoe/PH Mathematics or CMP).
To illustrate the extent to which the recruitment process affected the basic characteristics of the sample, Table 2-2 provides a comparison of the study sample with all eligible schools in the 311 districts that met the poverty and size criteria used in the first stage of recruitment.34 On some key characteristics, the study sample schools were statistically different from the pool of eligible schools from which they were selected. The study sample schools were significantly more likely to be in the Northeast region and to be located in large- or middle-sized cities. The students in the study sample schools were more likely to be White and less likely to be Hispanic or Asian. Study schools enrolled fewer seventh-grade students and had fewer teachers than did eligible schools; study schools were also more likely than eligible schools to combine elementary and middle grades.35
33 More information about the study’s test of rational numbers content and the testing methods appears later in this chapter and in Appendix A. The mean scale score for students in the study in fall 2007 was 214.15, which corresponds to the 19th percentile in an administrative database maintained by the developer, the Northwest Evaluation Association (NWEA). The study mean was based on the 3,938 students (out of 4,211) in the fall 2007 student baseline analysis sample who have valid NWEA Rational Number Test scores.
34 To provide further context for the school and teacher characteristics presented in Tables 2-2 and 2-3, supplementary tables in Appendix B provide a comparison to all schools in the nation with a seventh grade. 35 To supplement the individual t-tests shown in Table 2-2, we conducted Chi-square tests to examine the difference between the sample schools and the eligible schools for three categorical variables: Geographic Region, Urbanicity, and School Type. The tests yielded statistically significant differences (p-values equal to 0.02, 0.01, and <0.01, respectively). In addition, to conduct a global test of differences in measured background characteristics between the study sample and the eligible schools, we estimated a logit regression model predicting sample membership using all school characteristics reported in Table 2-2 as independent variables. A likelihood ratio chi-square test indicates a significant relationship between the set of measured background characteristics and sample status. (p<0.0001). The percent improvement in the log likelihood due to the measured characteristics is 19.5 percent.
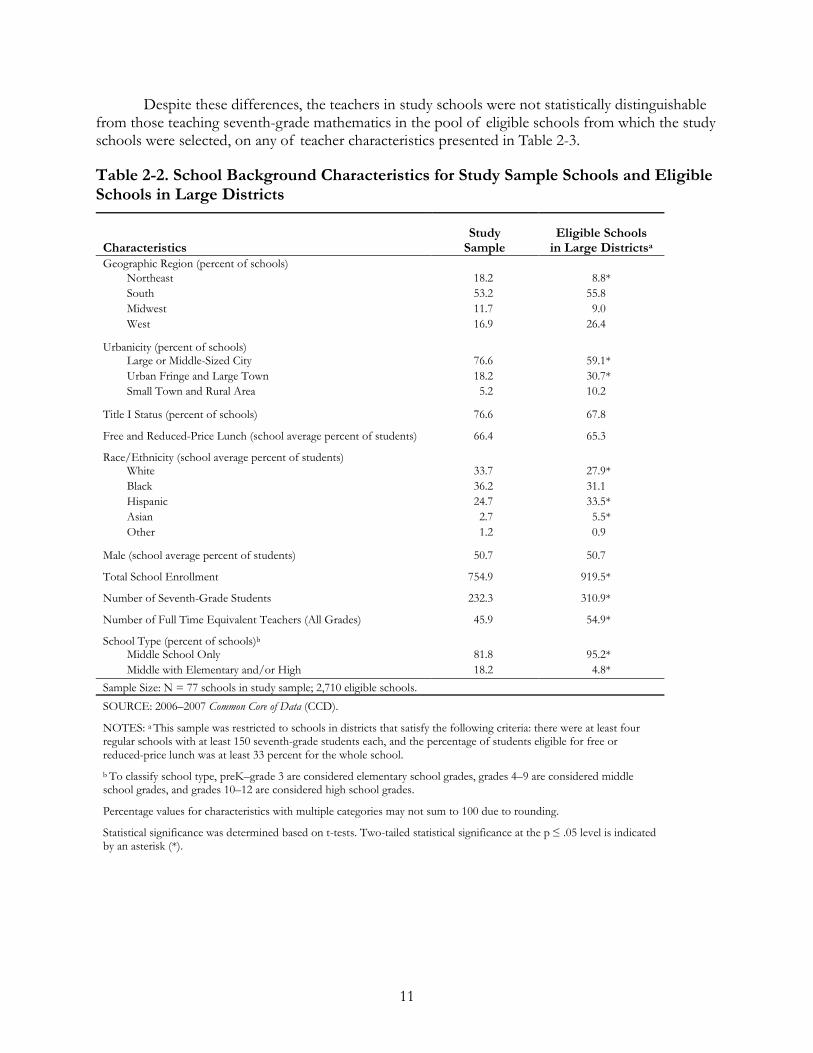
11
Despite these differences, the teachers in study schools were not statistically distinguishable from those teaching seventh-grade mathematics in the pool of eligible schools from which the study schools were selected, on any of teacher characteristics presented in Table 2-3.
Table 2-2. School Background Characteristics for Study Sample Schools and Eligible Schools in Large Districts
Characteristics Study
Sample Eligible Schools
in Large Districtsa Geographic Region (percent of schools)
Northeast 18.2 8.8* South 53.2 55.8 Midwest 11.7 9.0 West 16.9 26.4
Urbanicity (percent of schools)
Large or Middle-Sized City 76.6 59.1* Urban Fringe and Large Town 18.2 30.7* Small Town and Rural Area 5.2 10.2
Title I Status (percent of schools) 76.6 67.8
Free and Reduced-Price Lunch (school average percent of students) 66.4 65.3
Race/Ethnicity (school average percent of students)
White 33.7 27.9* Black 36.2 31.1 Hispanic 24.7 33.5* Asian 2.7 5.5* Other 1.2 0.9
Male (school average percent of students) 50.7 50.7
Total School Enrollment 754.9 919.5*
Number of Seventh-Grade Students 232.3 310.9*
Number of Full Time Equivalent Teachers (All Grades) 45.9 54.9*
School Type (percent of schools)b
Middle School Only 81.8 95.2* Middle with Elementary and/or High 18.2 4.8*
Sample Size: N = 77 schools in study sample; 2,710 eligible schools. SOURCE: 2006–2007 Common Core of Data (CCD).
NOTES: a This sample was restricted to schools in districts that satisfy the following criteria: there were at least four regular schools with at least 150 seventh-grade students each, and the percentage of students eligible for free or reduced-price lunch was at least 33 percent for the whole school. b To classify school type, preK–grade 3 are considered elementary school grades, grades 4–9 are considered middle school grades, and grades 10–12 are considered high school grades.
Percentage values for characteristics with multiple categories may not sum to 100 due to rounding.
Statistical significance was determined based on t-tests. Two-tailed statistical significance at the p ≤ .05 level is indicated by an asterisk (*).
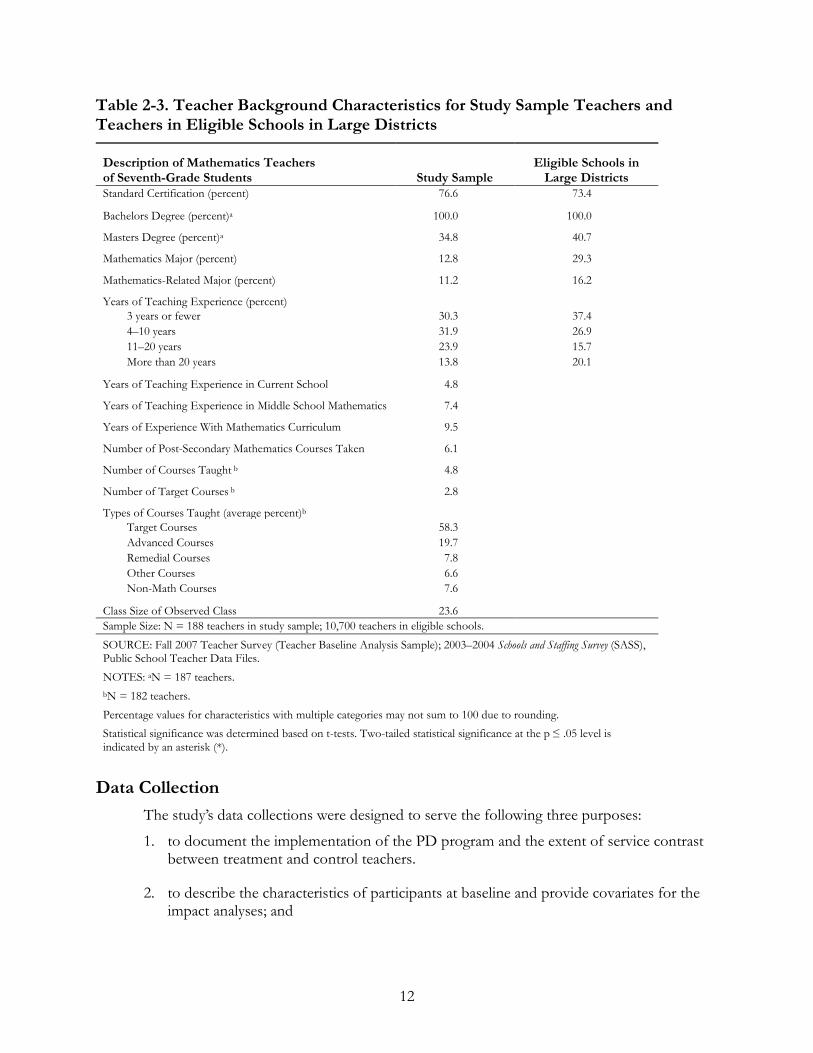
12
Table 2-3. Teacher Background Characteristics for Study Sample Teachers and Teachers in Eligible Schools in Large Districts
Description of Mathematics Teachers of Seventh-Grade Students Study Sample
Eligible Schools in Large Districts
Standard Certification (percent) 76.6 73.4
Bachelors Degree (percent)a 100.0 100.0
Masters Degree (percent)a 34.8 40.7
Mathematics Major (percent) 12.8 29.3
Mathematics-Related Major (percent) 11.2 16.2
Years of Teaching Experience (percent) 3 years or fewer 30.3 37.4 4–10 years 31.9 26.9 11–20 years 23.9 15.7 More than 20 years 13.8 20.1
Years of Teaching Experience in Current School 4.8
Years of Teaching Experience in Middle School Mathematics 7.4
Years of Experience With Mathematics Curriculum 9.5
Number of Post-Secondary Mathematics Courses Taken 6.1
Number of Courses Taught b 4.8
Number of Target Courses b 2.8
Types of Courses Taught (average percent)b Target Courses 58.3 Advanced Courses 19.7 Remedial Courses 7.8 Other Courses 6.6 Non-Math Courses 7.6
Class Size of Observed Class 23.6
Sample Size: N = 188 teachers in study sample; 10,700 teachers in eligible schools.
SOURCE: Fall 2007 Teacher Survey (Teacher Baseline Analysis Sample); 2003–2004 Schools and Staffing Survey (SASS), Public School Teacher Data Files.
NOTES: aN = 187 teachers. bN = 182 teachers.
Percentage values for characteristics with multiple categories may not sum to 100 due to rounding. Statistical significance was determined based on t-tests. Two-tailed statistical significance at the p ≤ .05 level is indicated by an asterisk (*).
Data Collection
The study’s data collections were designed to serve the following three purposes:
1. to document the implementation of the PD program and the extent of service contrast between treatment and control teachers.
2. to describe the characteristics of participants at baseline and provide covariates for the impact analyses; and
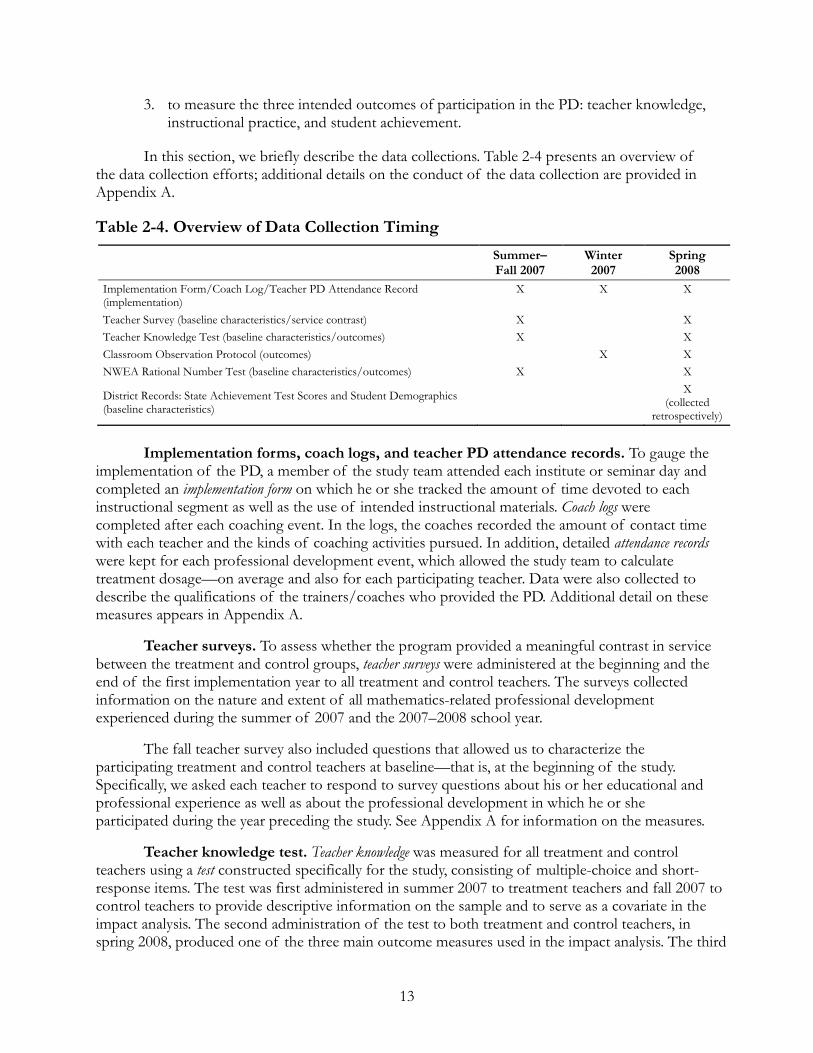
13
3. to measure the three intended outcomes of participation in the PD: teacher knowledge, instructional practice, and student achievement.
In this section, we briefly describe the data collections. Table 2-4 presents an overview of the data collection efforts; additional details on the conduct of the data collection are provided in Appendix A.
Table 2-4. Overview of Data Collection Timing Summer–
Fall 2007 Winter 2007
Spring 2008
Implementation Form/Coach Log/Teacher PD Attendance Record (implementation)
X X X
Teacher Survey (baseline characteristics/service contrast) X X Teacher Knowledge Test (baseline characteristics/outcomes) X X Classroom Observation Protocol (outcomes) X X NWEA Rational Number Test (baseline characteristics/outcomes) X X
District Records: State Achievement Test Scores and Student Demographics (baseline characteristics)
X (collected
retrospectively)
Implementation forms, coach logs, and teacher PD attendance records. To gauge the
implementation of the PD, a member of the study team attended each institute or seminar day and completed an implementation form on which he or she tracked the amount of time devoted to each instructional segment as well as the use of intended instructional materials. Coach logs were completed after each coaching event. In the logs, the coaches recorded the amount of contact time with each teacher and the kinds of coaching activities pursued. In addition, detailed attendance records were kept for each professional development event, which allowed the study team to calculate treatment dosage—on average and also for each participating teacher. Data were also collected to describe the qualifications of the trainers/coaches who provided the PD. Additional detail on these measures appears in Appendix A.
Teacher surveys. To assess whether the program provided a meaningful contrast in service between the treatment and control groups, teacher surveys were administered at the beginning and the end of the first implementation year to all treatment and control teachers. The surveys collected information on the nature and extent of all mathematics-related professional development experienced during the summer of 2007 and the 2007–2008 school year.
The fall teacher survey also included questions that allowed us to characterize the participating treatment and control teachers at baseline—that is, at the beginning of the study. Specifically, we asked each teacher to respond to survey questions about his or her educational and professional experience as well as about the professional development in which he or she participated during the year preceding the study. See Appendix A for information on the measures.
Teacher knowledge test. Teacher knowledge was measured for all treatment and control teachers using a test constructed specifically for the study, consisting of multiple-choice and short-response items. The test was first administered in summer 2007 to treatment teachers and fall 2007 to control teachers to provide descriptive information on the sample and to serve as a covariate in the impact analysis. The second administration of the test to both treatment and control teachers, in spring 2008, produced one of the three main outcome measures used in the impact analysis. The third

14
administration took place in spring 2009 and will provide an outcome measure for the report findings in year 2.The test was designed to measure knowledge of rational number topics in a manner that was consistent with the purpose of the professional development program, which sought to increase teachers’ understanding in the domain of positive rational numbers and to improve how they prepared for and delivered lessons focused on rational number topics. Both the test and the PD were organized around 12 key understandings, half in fractions and decimals and half in ratio, rate, proportion, and percent. In addition, the test addressed two types of knowledge that were targeted by the PD: half of the items on each form focused on common knowledge of mathematics (CK) and half focused on specialized knowledge of mathematics for teaching (SK). The CK items addressed the teacher’s ability to understand concepts and carry out operations in the area of rational numbers, as typically taught in seventh grade. The SK items addressed the more specialized mathematical knowledge that may be useful when teaching rational numbers content at this grade level.
Three IRT-based scores were computed for each participant: a total score, a CK score, and an SK score. The scores were calculated using the logit metric, and thus each teacher’s score represents the log of the odds of correctly answering a test item of average difficulty. To provide a more meaningful metric, the logit scores for the treatment and control groups are also presented in this report as the percentage of teachers who could correctly answer a test item of average difficulty, where “average difficulty” is defined as the average difficulty of the 72 items used on the teacher test.
To maximize the precision of the estimates of the treatment and control group means, the test was designed to align with the level of knowledge of our study population. That is, the test was designed so that items of average difficulty could be answered correctly by about half of the teachers at baseline. The test accomplished this goal. The average score in logits was approximately zero, and a logit score of zero means that the average teacher in the study had a 50-50 chance of getting an item of average difficulty correct on the teacher knowledge test.36
Classroom observation protocol. To measure instructional practice for treatment and control teachers, observations were conducted in teachers’ classrooms. The design called for each treatment and each control teacher to be observed once. The observation window for each district was timed to coincide with rational numbers instruction and to occur after the treatment teachers in that district had had at least 5 of the 8 scheduled days of institutes and seminars. The earliest observations were conducted in November 2007 and the latest were conducted in April 2008.
The observations addressed aspects of mathematics instruction that were related to the goals of the PD and that could be rated reliably by professional research staff without expertise in mathematics instruction. The observations thus do not provide comprehensive coverage of all aspects of teaching that the PD hoped to effect, such as the mathematical accuracy of the teaching. The observations produced three scales that measured the frequency with which the teacher employed particular behaviors.37
36 The test was not designed to evaluate teachers as passing or failing against a standard and should not be interpreted as such. Rather, as explained above, it was designed to maximize the precision of the estimates of the treatment and control group means.
The three scales were Teacher elicits student thinking, Teacher uses representations, and Teacher focuses on mathematical reasoning. All the behaviors that contribute to the scales used in the impact analysis are listed in Exhibit 2-1. Teacher elicits student thinking encompassed such
37 Some desired behaviors did not lend themselves to observation in the course of a single class session (e.g., continuity, follow-up), whereas others could not be rated reliably by our observers, who did not have specific expertise in mathematics and mathematics teaching.
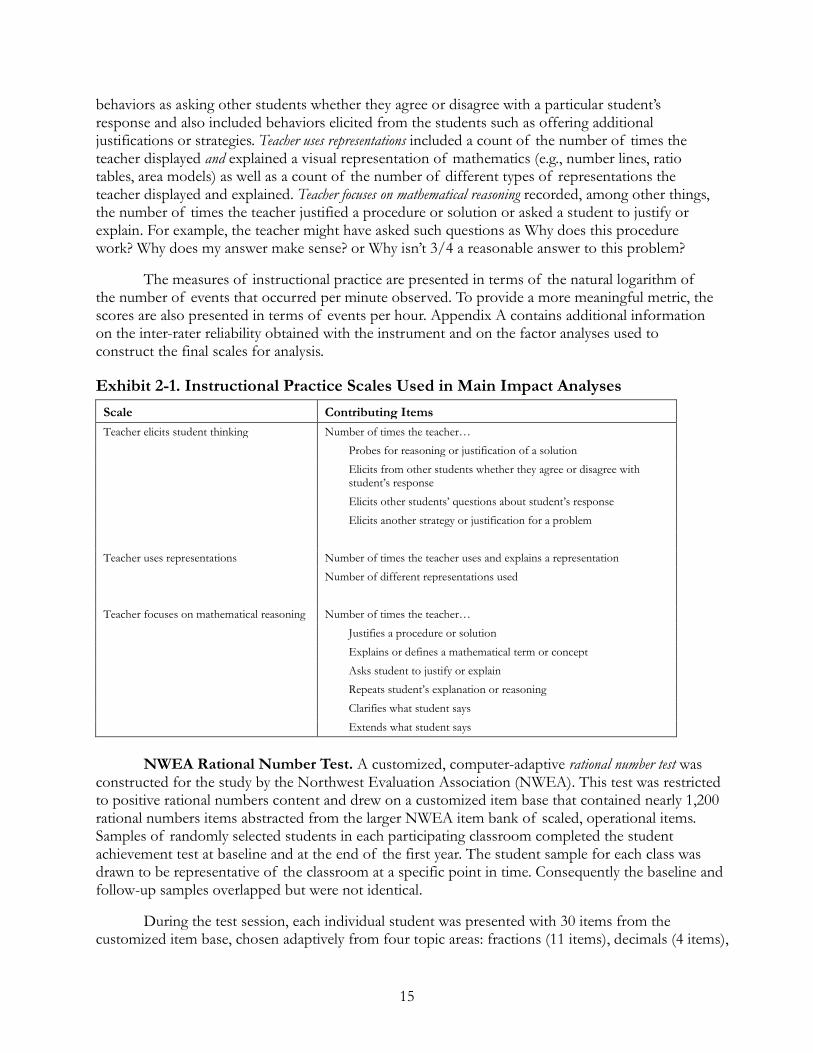
15
behaviors as asking other students whether they agree or disagree with a particular student’s response and also included behaviors elicited from the students such as offering additional justifications or strategies. Teacher uses representations included a count of the number of times the teacher displayed and explained a visual representation of mathematics (e.g., number lines, ratio tables, area models) as well as a count of the number of different types of representations the teacher displayed and explained. Teacher focuses on mathematical reasoning recorded, among other things, the number of times the teacher justified a procedure or solution or asked a student to justify or explain. For example, the teacher might have asked such questions as Why does this procedure work? Why does my answer make sense? or Why isn’t 3/4 a reasonable answer to this problem?
The measures of instructional practice are presented in terms of the natural logarithm of the number of events that occurred per minute observed. To provide a more meaningful metric, the scores are also presented in terms of events per hour. Appendix A contains additional information on the inter-rater reliability obtained with the instrument and on the factor analyses used to construct the final scales for analysis.
Exhibit 2-1. Instructional Practice Scales Used in Main Impact Analyses Scale Contributing Items Teacher elicits student thinking Number of times the teacher… Probes for reasoning or justification of a solution
Elicits from other students whether they agree or disagree with student’s response
Elicits other students’ questions about student’s response
Elicits another strategy or justification for a problem
Teacher uses representations Number of times the teacher uses and explains a representation
Number of different representations used Teacher focuses on mathematical reasoning Number of times the teacher…
Justifies a procedure or solution
Explains or defines a mathematical term or concept
Asks student to justify or explain Repeats student’s explanation or reasoning
Clarifies what student says
Extends what student says
NWEA Rational Number Test. A customized, computer-adaptive rational number test was
constructed for the study by the Northwest Evaluation Association (NWEA). This test was restricted to positive rational numbers content and drew on a customized item base that contained nearly 1,200 rational numbers items abstracted from the larger NWEA item bank of scaled, operational items. Samples of randomly selected students in each participating classroom completed the student achievement test at baseline and at the end of the first year. The student sample for each class was drawn to be representative of the classroom at a specific point in time. Consequently the baseline and follow-up samples overlapped but were not identical.
During the test session, each individual student was presented with 30 items from the customized item base, chosen adaptively from four topic areas: fractions (11 items), decimals (4 items),
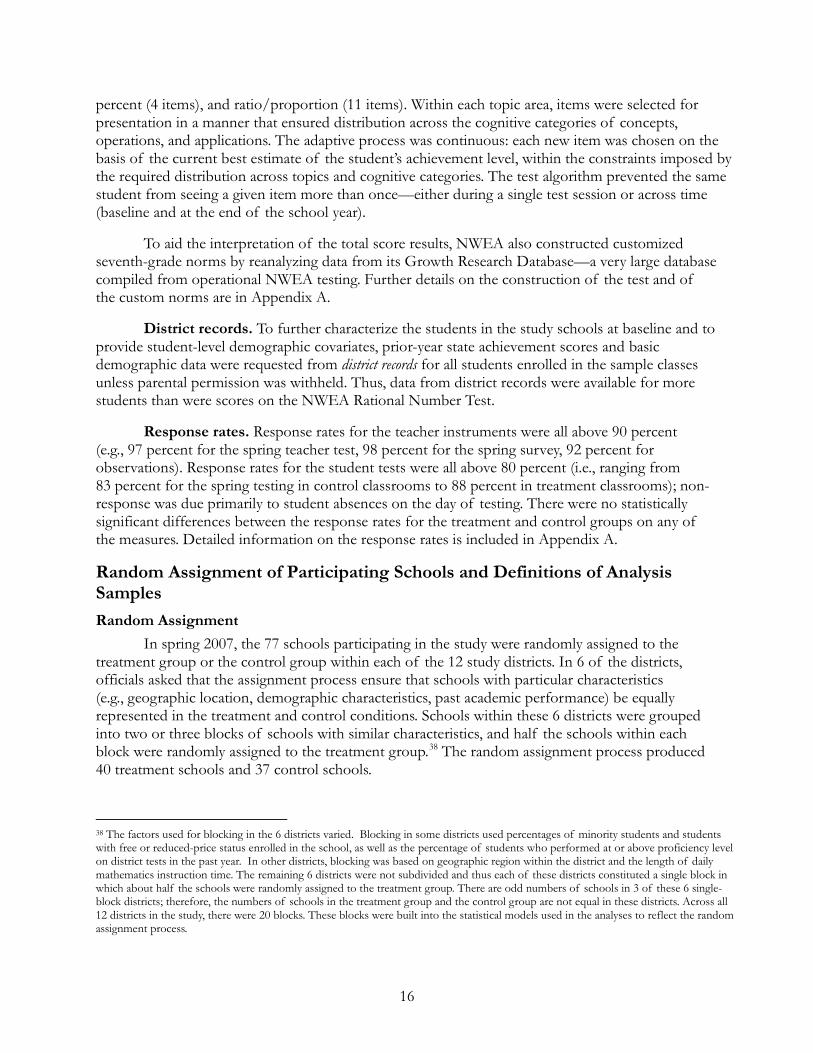
16
percent (4 items), and ratio/proportion (11 items). Within each topic area, items were selected for presentation in a manner that ensured distribution across the cognitive categories of concepts, operations, and applications. The adaptive process was continuous: each new item was chosen on the basis of the current best estimate of the student’s achievement level, within the constraints imposed by the required distribution across topics and cognitive categories. The test algorithm prevented the same student from seeing a given item more than once—either during a single test session or across time (baseline and at the end of the school year).
To aid the interpretation of the total score results, NWEA also constructed customized seventh-grade norms by reanalyzing data from its Growth Research Database—a very large database compiled from operational NWEA testing. Further details on the construction of the test and of the custom norms are in Appendix A.
District records. To further characterize the students in the study schools at baseline and to provide student-level demographic covariates, prior-year state achievement scores and basic demographic data were requested from district records for all students enrolled in the sample classes unless parental permission was withheld. Thus, data from district records were available for more students than were scores on the NWEA Rational Number Test.
Response rates. Response rates for the teacher instruments were all above 90 percent (e.g., 97 percent for the spring teacher test, 98 percent for the spring survey, 92 percent for observations). Response rates for the student tests were all above 80 percent (i.e., ranging from 83 percent for the spring testing in control classrooms to 88 percent in treatment classrooms); non-response was due primarily to student absences on the day of testing. There were no statistically significant differences between the response rates for the treatment and control groups on any of the measures. Detailed information on the response rates is included in Appendix A.
Random Assignment of Participating Schools and Definitions of Analysis Samples
Random Assignment In spring 2007, the 77 schools participating in the study were randomly assigned to the
treatment group or the control group within each of the 12 study districts. In 6 of the districts, officials asked that the assignment process ensure that schools with particular characteristics (e.g., geographic location, demographic characteristics, past academic performance) be equally represented in the treatment and control conditions. Schools within these 6 districts were grouped into two or three blocks of schools with similar characteristics, and half the schools within each block were randomly assigned to the treatment group.38
38 The factors used for blocking in the 6 districts varied. Blocking in some districts used percentages of minority students and students with free or reduced-price status enrolled in the school, as well as the percentage of students who performed at or above proficiency level on district tests in the past year. In other districts, blocking was based on geographic region within the district and the length of daily mathematics instruction time. The remaining 6 districts were not subdivided and thus each of these districts constituted a single block in which about half the schools were randomly assigned to the treatment group. There are odd numbers of schools in 3 of these 6 single-block districts; therefore, the numbers of schools in the treatment group and the control group are not equal in these districts. Across all 12 districts in the study, there were 20 blocks. These blocks were built into the statistical models used in the analyses to reflect the random assignment process.
The random assignment process produced 40 treatment schools and 37 control schools.
17
Once schools were randomly assigned, all eligible teachers teaching at least one regular seventh-grade mathematics class in each school in the 2007–2008 school year became members of the teacher sample for the study, and all seventh-grade students in their regular seventh-grade mathematics classes (e.g., not in classes for students with special education needs) became members of the student sample.39
Table 2-5. Number of Schools, Teachers, and Students in Spring 2008 Impact Analysis Sample, Overall and by Treatment Status
Teachers and students in the study sample in the fall of the 2007–2008 school year did not always remain in the sample for the full year. Teachers who left their schools or were reassigned to noneligible classes were replaced by other teachers, who took their “teaching slot” in the study sample. Similarly, some students left the sample, and other students entered the sample by transferring into an eligible class. Therefore, the teacher and student samples that characterized the study at baseline were not identical to the samples measured at the end of the first year of implementation. The spring 2008 school, teacher, and student samples are broken down into treatment and control groups in Table 2-5. The teacher and student samples are discussed in more detail below.
Treatment Status
Number of Schools
Number of Seventh-Grade Teachers Number of Seventh-Grade Students
Total Number Average Per
School Total Number Average Per
School Treatment 40 100 2.5 5,858 146.4 Control 37 95 2.5 5,621 151.9
Total 77 195 2.5 11,479 149.0 SOURCE: Teacher Rosters; District Enrollment Records.
Teacher Samples
At the beginning of the fall 2007 semester, 193 eligible teachers were teaching regular mathematics classes during the fall data collection window.40
During the 2007–2008 school year, some teachers left the study schools (or transferred out of regular mathematics classes) and were replaced by new incoming teachers.
These 193 teachers are considered the teacher baseline analysis sample of the study, and their information is used in all baseline analyses. Among the teachers in the baseline sample, 100 were in treatment schools and 93 were in control schools.
41
By the end of spring 2008, among the teachers who taught eligible class sections in the previous fall, 8 percent were no longer teaching eligible class sections. Of the original 193 teachers from the fall, 178 teachers (90 from treatment schools and 88 from control schools) were still teaching eligible classes in the same study schools. They were in the study throughout the first implementation year and thus had the best chance of receiving the full amount of the professional
By the end of the spring 2008 semester, there were 195 eligible seventh-grade mathematics teachers in all study schools, with 100 from treatment group schools and 95 from control group schools. They constitute the teacher impact analysis sample of the study and are used in all impact analyses.
39 “Eligible teachers” are defined as regular teachers, not short-term substitutes. (Long-term substitutes were included.) 40 This window began with the summer institutes and ended 10 weeks into the school year—keyed to each district’s school start date. In a few cases, more than one teacher taught the same classes for different portions of the baseline window. In those cases, the teacher who taught for the greater portion of the window was selected for the sample. 41 Exhibit B-1 in Appendix B demonstrates the movement of teachers in and out of the study sample.
18
development program provided by the study. These teachers make up the stable teacher subgroup of the teacher impact analysis sample.
Student Samples
All eligible students in the study schools were considered members of the student sample. However, because of logistical and budgetary constraints, it was not possible for the study to administer the computer-based NWEA rational number test to all these students. Instead, the study team randomly selected a representative sample of eligible students from each regular mathematics class to take the baseline NWEA rational number tests at the beginning of the fall semester and a representative sample of students to take the follow-up test at the end of the spring semester of the 2007–2008 school year.42,43
District record data were collected for all students in regular seventh-grade mathematics classes who were on the fall or the spring student rosters, whose parents had consented to the study, and for whom the district was able to provide data. (These students make up the fall expanded student sample and the spring expanded student sample.) These expanded student samples are used in some supplementary analyses in this report.
These samples are referred to as the student baseline analysis sample and the student impact analysis sample, respectively.
44 Appendix B provides more detail on how the student samples were formed.
Equivalence of Baseline Characteristics Between Treatment and Control Groups The background characteristics of schools, teachers, and students in the treatment group
and the control group were compared to determine whether random assignment resulted in two groups that were equivalent on all observed characteristics at the beginning of the study. P-values based on t-tests for the treatment effect are reported for all baseline equivalence tests.45 Tables 2-6, 2-7, and 2-8 confirm that there were no statistically significant differences in the baseline characteristics of the treatment and control groups.46
In addition to tests for differences in each variable, we conducted a Chi-square test for all school-level variables, another test for all teacher-
42 Students who were sampled for potential testing were evaluated by school personnel to determine whether testing was appropriate. Some students in regular mathematics classes had disabilities or English learner status, which might have precluded them from meaningful participation in testing under the conditions offered by the study. When school personnel determined that these students could not participate meaningfully, the students were removed from the sample. 43 See Appendix B for detailed descriptions of the student sampling procedures used in the fall and the spring. Appendix B also describes the movement of students in and out of the study sample between the fall and spring student data collection. 44 See Appendix Table B-3 for a comparison of the baseline analysis sample and fall expanded sample, and B-4 for a comparison of the impact analysis sample and spring expanded sample. 45 Some of the baseline variables are dichotomous (proportions) – for example, whether or not a teacher majored in mathematics during college. Although z-tests or chi-square tests are generally used to test differences in proportions between two independent groups, this was not appropriate because the design involves both blocking and clustering. Thus, we conducted the tests of baseline equivalence for dichotomous variables using the linear multi-level model we used for continuous variables. We considered using a multi-level logit model taking blocking and clustering into account, but in many instances, all cases in a block had the same value for the variable being tested (e.g. in some blocks, none of the teachers were mathematics majors), and thus a logit model cannot be estimated. To test the validity of the linear multi-level model, baseline equivalence tests using both the linear model and the logit model were compared where it was possible to estimate a logit model. In these cases, the results produced by the logit model were similar to the results produced by the linear model. 46 Similar baseline equivalence tests were conducted for each of the subgroups defined by provider and mathematics curriculum, and for stable teachers. There were no statistically significant differences between treatment and control groups within any of the subgroups. See Appendix B for details.
19
level variables, and another test for all student-level variables. These tests also indicate that there was no overall difference in the background characteristics of the treatment and control groups.47,48
Any systematic turnover in the study sample over the course of the first implementation year that is correlated with treatment status could lead to an unbalanced sample for the impact analyses. To address this concern, we conducted an analysis of the equivalence of the treatment and control group participants included in the impact analysis samples. The results in Appendix B show that for the teacher impact analysis sample and the student impact analysis sample at the end of the first implementation year, there were no statistically significant treatment-control differences in observed background characteristics.
49,50
Overall Chi-square tests also indicate that there was no overall baseline difference between the treatment group and the control group teachers or students included in the impact analyses. The p-values of the tests using the teacher-level variables and the school-level variables were 0.55 and 0.41, respectively.
47 For each of the three tables presented here, many hypothesis tests were conducted. Conducting multiple tests increases the probability of concluding that a particular background difference is statistically significant when, in fact, the true difference is zero. In particular, we would expect to see a “false positive” for every 20 hypotheses conducted. For this reason, we conducted an overall likelihood ratio Chi-square test to test for a systematic, or overall, difference between the characteristics of the treatment and control groups. (The test was based on a logit regression, predicting treatment status based on the measured variables.) The p-values for the Chi-square test at school, teacher, and student levels are 0.95, 0.23, and 0.85, respectively. 48 In addition, the study team also tested the equivalence in student baseline characteristics between the treatment and control groups for the fall expanded student sample. There was no statistically significant difference between the treatment and control groups for this sample. Detailed results are presented in Appendix B (Table B-19). 49 Because there was no school attrition during the first program year, this exercise was not necessary for the school sample. 50 Similar tests were conducted for each of the subgroups defined by PD provider and curriculum, and for stable teachers (see discussion in the next section for subgroups). There were no statistically significant differences between treatment and control groups within any of the subgroups. See Appendix B for details.
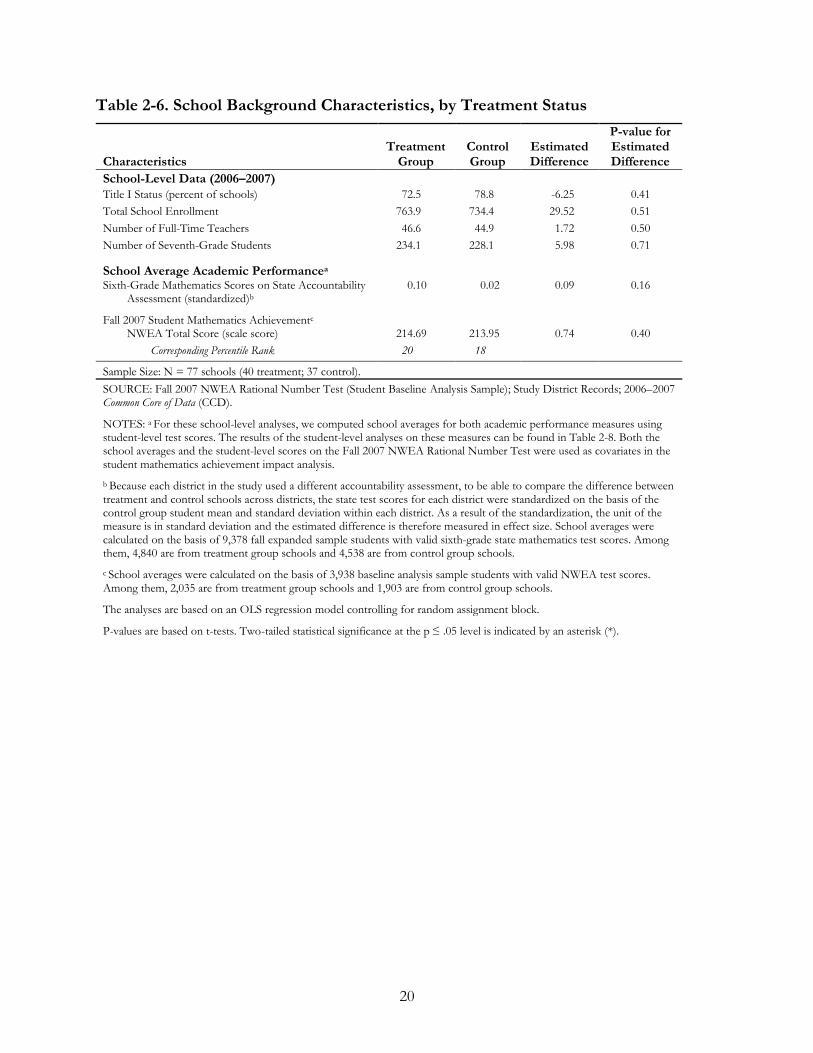
20
Table 2-6. School Background Characteristics, by Treatment Status
Characteristics Treatment
Group Control Group
Estimated Difference
P-value for Estimated Difference
School-Level Data (2006–2007) Title I Status (percent of schools) 72.5 78.8 -6.25 0.41 Total School Enrollment 763.9 734.4 29.52 0.51 Number of Full-Time Teachers 46.6 44.9 1.72 0.50 Number of Seventh-Grade Students 234.1 228.1 5.98 0.71
School Average Academic Performancea
Sixth-Grade Mathematics Scores on State Accountability Assessment (standardized)b
0.10 0.02 0.09 0.16
Fall 2007 Student Mathematics Achievementc
NWEA Total Score (scale score) 214.69 213.95 0.74 0.40 Corresponding Percentile Rank 20 18
Sample Size: N = 77 schools (40 treatment; 37 control). SOURCE: Fall 2007 NWEA Rational Number Test (Student Baseline Analysis Sample); Study District Records; 2006–2007 Common Core of Data (CCD).
NOTES: a For these school-level analyses, we computed school averages for both academic performance measures using student-level test scores. The results of the student-level analyses on these measures can be found in Table 2-8. Both the school averages and the student-level scores on the Fall 2007 NWEA Rational Number Test were used as covariates in the student mathematics achievement impact analysis. b Because each district in the study used a different accountability assessment, to be able to compare the difference between treatment and control schools across districts, the state test scores for each district were standardized on the basis of the control group student mean and standard deviation within each district. As a result of the standardization, the unit of the measure is in standard deviation and the estimated difference is therefore measured in effect size. School averages were calculated on the basis of 9,378 fall expanded sample students with valid sixth-grade state mathematics test scores. Among them, 4,840 are from treatment group schools and 4,538 are from control group schools. c School averages were calculated on the basis of 3,938 baseline analysis sample students with valid NWEA test scores. Among them, 2,035 are from treatment group schools and 1,903 are from control group schools.
The analyses are based on an OLS regression model controlling for random assignment block.
P-values are based on t-tests. Two-tailed statistical significance at the p ≤ .05 level is indicated by an asterisk (*).
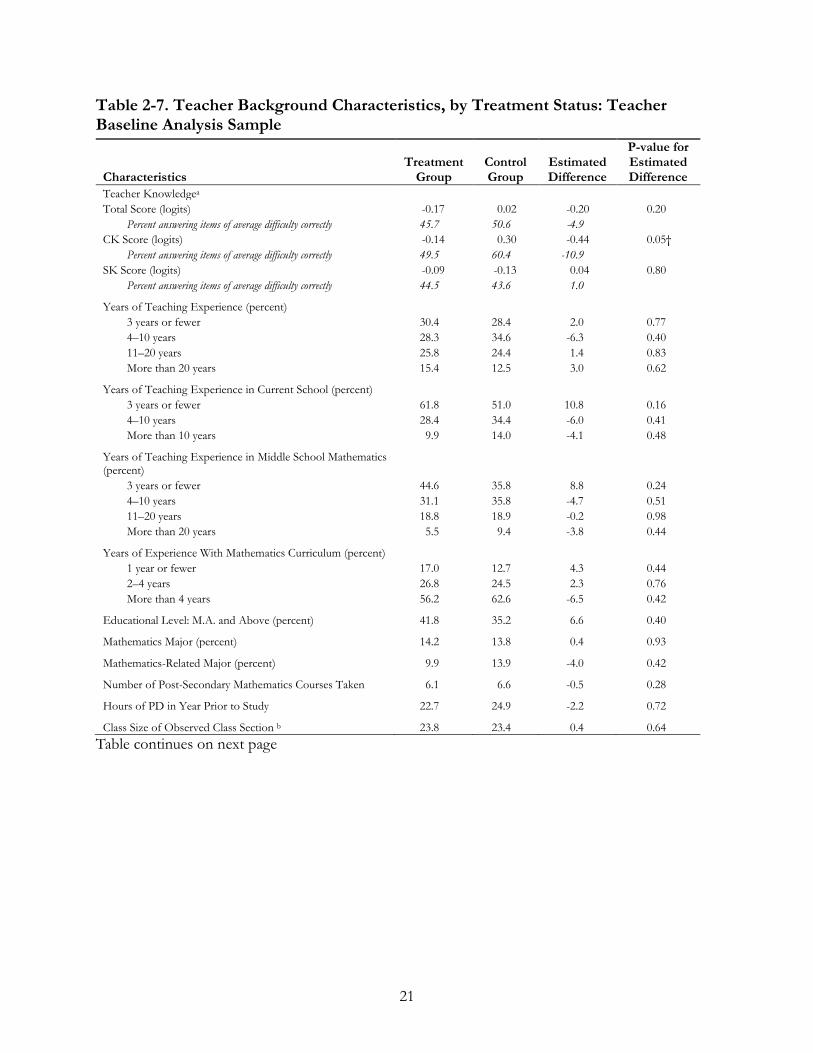
21
Table 2-7. Teacher Background Characteristics, by Treatment Status: Teacher Baseline Analysis Sample
Characteristics Treatment
Group Control Group
Estimated Difference
P-value for Estimated Difference
Teacher Knowledgea Total Score (logits) -0.17 0.02 -0.20 0.20
Percent answering items of average difficulty correctly 45.7 50.6 -4.9 CK Score (logits) -0.14 0.30 -0.44 0.05†
Percent answering items of average difficulty correctly 49.5 60.4 -10.9 SK Score (logits) -0.09 -0.13 0.04 0.80
Percent answering items of average difficulty correctly 44.5 43.6 1.0
Years of Teaching Experience (percent) 3 years or fewer 30.4 28.4 2.0 0.77 4–10 years 28.3 34.6 -6.3 0.40 11–20 years 25.8 24.4 1.4 0.83 More than 20 years 15.4 12.5 3.0 0.62
Years of Teaching Experience in Current School (percent) 3 years or fewer 61.8 51.0 10.8 0.16 4–10 years 28.4 34.4 -6.0 0.41 More than 10 years 9.9 14.0 -4.1 0.48
Years of Teaching Experience in Middle School Mathematics (percent)
3 years or fewer 44.6 35.8 8.8 0.24 4–10 years 31.1 35.8 -4.7 0.51 11–20 years 18.8 18.9 -0.2 0.98 More than 20 years 5.5 9.4 -3.8 0.44
Years of Experience With Mathematics Curriculum (percent) 1 year or fewer 17.0 12.7 4.3 0.44 2–4 years 26.8 24.5 2.3 0.76 More than 4 years 56.2 62.6 -6.5 0.42
Educational Level: M.A. and Above (percent) 41.8 35.2 6.6 0.40
Mathematics Major (percent) 14.2 13.8 0.4 0.93
Mathematics-Related Major (percent) 9.9 13.9 -4.0 0.42
Number of Post-Secondary Mathematics Courses Taken 6.1 6.6 -0.5 0.28
Hours of PD in Year Prior to Study 22.7 24.9 -2.2 0.72
Class Size of Observed Class Section b 23.8 23.4 0.4 0.64 Table continues on next page
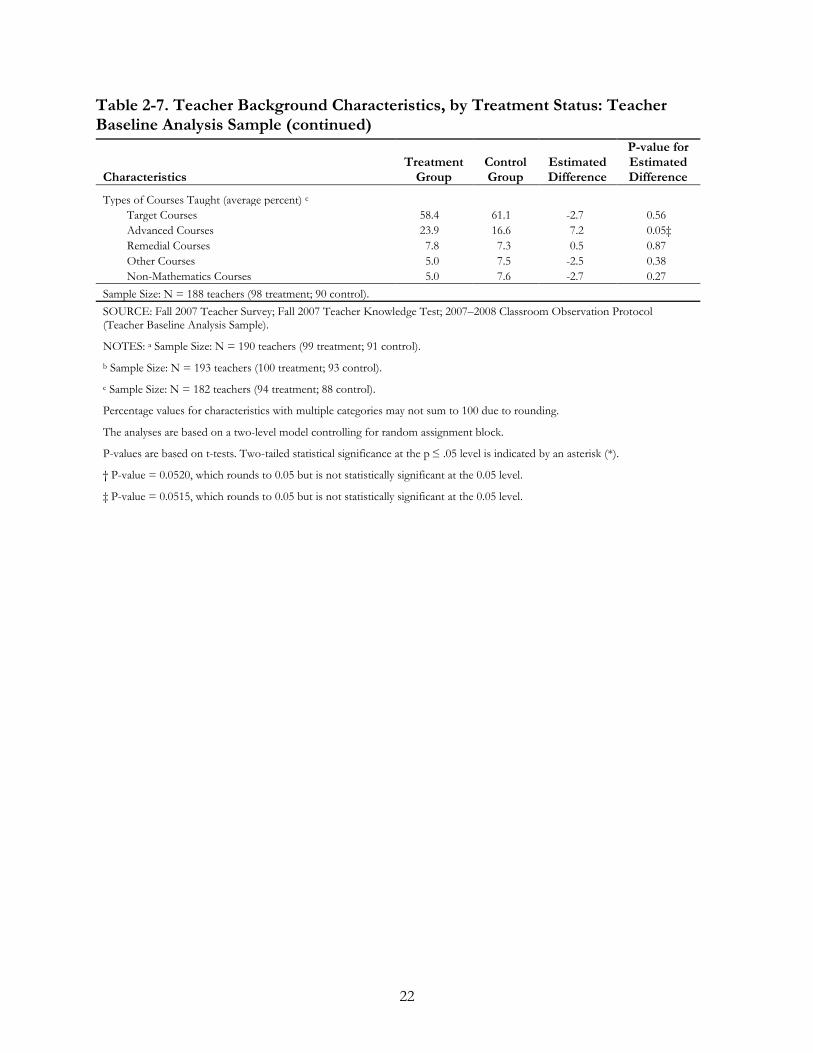
22
Table 2-7. Teacher Background Characteristics, by Treatment Status: Teacher Baseline Analysis Sample (continued)
Characteristics Treatment
Group Control Group
Estimated Difference
P-value for Estimated Difference
Types of Courses Taught (average percent) c Target Courses 58.4 61.1 -2.7 0.56 Advanced Courses 23.9 16.6 7.2 0.05‡ Remedial Courses 7.8 7.3 0.5 0.87 Other Courses 5.0 7.5 -2.5 0.38 Non-Mathematics Courses 5.0 7.6 -2.7 0.27
Sample Size: N = 188 teachers (98 treatment; 90 control). SOURCE: Fall 2007 Teacher Survey; Fall 2007 Teacher Knowledge Test; 2007–2008 Classroom Observation Protocol (Teacher Baseline Analysis Sample).
NOTES: a Sample Size: N = 190 teachers (99 treatment; 91 control).
b Sample Size: N = 193 teachers (100 treatment; 93 control). c Sample Size: N = 182 teachers (94 treatment; 88 control).
Percentage values for characteristics with multiple categories may not sum to 100 due to rounding.
The analyses are based on a two-level model controlling for random assignment block.
P-values are based on t-tests. Two-tailed statistical significance at the p ≤ .05 level is indicated by an asterisk (*).
† P-value = 0.0520, which rounds to 0.05 but is not statistically significant at the 0.05 level.
‡ P-value = 0.0515, which rounds to 0.05 but is not statistically significant at the 0.05 level.
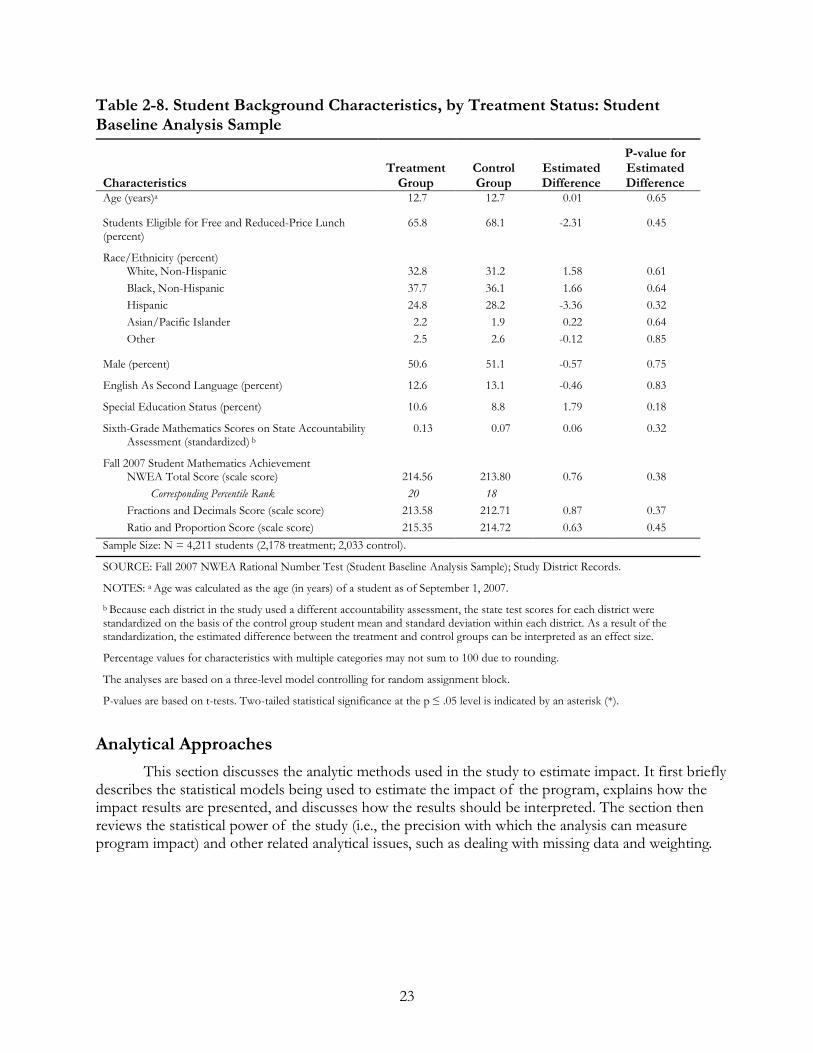
23
Table 2-8. Student Background Characteristics, by Treatment Status: Student Baseline Analysis Sample
Characteristics Treatment
Group Control Group
Estimated Difference
P-value for Estimated Difference
Age (years)a 12.7 12.7 0.01 0.65
Students Eligible for Free and Reduced-Price Lunch (percent)
65.8 68.1 -2.31 0.45
Race/Ethnicity (percent)
White, Non-Hispanic 32.8 31.2 1.58 0.61 Black, Non-Hispanic 37.7 36.1 1.66 0.64 Hispanic 24.8 28.2 -3.36 0.32 Asian/Pacific Islander 2.2 1.9 0.22 0.64 Other 2.5 2.6 -0.12 0.85
Male (percent) 50.6 51.1 -0.57 0.75
English As Second Language (percent) 12.6 13.1 -0.46 0.83
Special Education Status (percent) 10.6 8.8 1.79 0.18
Sixth-Grade Mathematics Scores on State Accountability Assessment (standardized) b
0.13 0.07 0.06 0.32
Fall 2007 Student Mathematics Achievement
NWEA Total Score (scale score) 214.56 213.80 0.76 0.38 Corresponding Percentile Rank 20 18
Fractions and Decimals Score (scale score) 213.58 212.71 0.87 0.37 Ratio and Proportion Score (scale score) 215.35 214.72 0.63 0.45
Sample Size: N = 4,211 students (2,178 treatment; 2,033 control).
SOURCE: Fall 2007 NWEA Rational Number Test (Student Baseline Analysis Sample); Study District Records.
NOTES: a Age was calculated as the age (in years) of a student as of September 1, 2007. b Because each district in the study used a different accountability assessment, the state test scores for each district were standardized on the basis of the control group student mean and standard deviation within each district. As a result of the standardization, the estimated difference between the treatment and control groups can be interpreted as an effect size.
Percentage values for characteristics with multiple categories may not sum to 100 due to rounding.
The analyses are based on a three-level model controlling for random assignment block.
P-values are based on t-tests. Two-tailed statistical significance at the p ≤ .05 level is indicated by an asterisk (*).
Analytical Approaches
This section discusses the analytic methods used in the study to estimate impact. It first briefly describes the statistical models being used to estimate the impact of the program, explains how the impact results are presented, and discusses how the results should be interpreted. The section then reviews the statistical power of the study (i.e., the precision with which the analysis can measure program impact) and other related analytical issues, such as dealing with missing data and weighting.
24
Statistical Models for Estimating Impact51
The basic strategy for the impact analysis was to estimate the difference in outcomes between the treatment and control groups, adjusting for the blocking used in random assignment and for covariates measured at baseline. To obtain the impact estimates, we pooled the data for all 12 districts in a single analysis treating the districts as fixed effects.52 Separate program impact estimates were obtained for each district and then averaged across the study’s 12 districts, weighting each district’s estimate in proportion to the number of treatment schools in the sample from the district.53
The study focuses on three outcome domains: teacher knowledge, instructional practice, and student achievement. For outcomes that were measured at the teacher level, a two-level hierarchical linear model was used, with teachers nested within schools. To improve the precision of the impact estimates, the model included a set of baseline characteristics of the teachers as covariates.
Findings in this report therefore represent the impact on the performance of teachers and students in the average treatment school in the 12 study districts. The results do not necessarily reflect what the treatment effect would be in the wider population of districts from which those in the study were selected.
•
•
For teacher knowledge outcomes, in addition to the baseline teacher knowledge total scores, the model included the following covariates: teacher’s experience, teacher’s education level, undergraduate mathematics major or not, and number of postsecondary mathematics and mathematics education courses a teacher had taken. These variables were included because they are considered likely to be related to teacher knowledge and instructional behavior.
For instructional practice outcomes, the model included the covariates used for the teacher knowledge model, as well as the average class size and the teacher’s years of experience with the current curriculum. Baseline measures of instructional practice were not collected.
For the student achievement outcomes, a three-level hierarchical model was used, with students nested within teachers’ classrooms and classrooms nested within schools. The covariates in the student achievement model included a single school-level covariate—the school average baseline (fall 2007–2008) NWEA test score54
The impact analyses were conducted using the full sample of teachers and students present in the study schools as of the spring 2008 data collection period. To determine whether the impact observed was specific to one of the two PD providers, or to one of the two curricular contexts, impact was also estimated for subgroups of districts defined by the provider of the professional
—as well as the following student-level covariates: fall baseline achievement scores, gender, age, race/ethnicity, students’ ESL/LEP status, special education status, and free or reduced-price lunch status.
51 For more detailed information about the statistical models, see Appendix B. 52 Schools, classes, and students were treated as random effects. 53 This approach used the data for all 12 districts in a single analysis, assuming a common set of school-, teacher-, and student-level error terms across districts. This method allowed us to examine how the impact of the PD program varied across districts and whether these differences are statistically significant. 54 This school average baseline NWEA test score variable was calculated using all valid and usable fall student NWEA test scores.
25
development (America’s Choice or Pearson Achievement Solutions) and the subgroups defined by the mathematics curriculum used in the district (Glencoe/PH Mathematics or CMP). Note that by not randomly assigning PD providers or curricula, the study design does not allow one to assess differences in effectiveness between the two PD providers, or between the two curricular contexts, because any observed differences in impact may be due to differences in district characteristics.55
The impact estimates provide an “intent to treat” analysis of the impact of the program; the estimates reflect the program impact on all teachers and students in the targeted classrooms in the study schools, even though some of those teachers did not teach for the entire school year and some did not take full advantage of the opportunity to participate in the study-provided PD. Additional analyses reported in Chapter 5 focus on outcomes among the “stable” teachers, who remained in the study schools from fall to spring. Because the stable teacher analysis uses a subsample that was determined after the PD program started, the analysis is nonexperimental and should be interpreted with caution. The results of the stable teachers analysis represent an estimate of what we might have observed had all teachers remained “stable” throughout the first year of the study.
Understanding the Impact Tables
Mean outcome levels. Throughout the report, when a table is presented to report the estimated impact of the mathematics professional development program, the regression-adjusted mean outcome levels for the treatment and the control groups are reported to provide context for interpreting the estimated impact. The program impact was estimated using the impact models described above, which used all available observations from both the treatment group and the control group. The mean outcome levels were calculated for the treatment and control groups using the same impact regression models (Black et al. 2008; Garet et al. 2008).
In calculating the regression-adjusted mean outcome levels for the treatment and control groups, the means were adjusted using the observed mean covariate values for the treatment group in the estimated impact model. In other words, means for both groups were “regression adjusted” using the treatment group’s observed means as a common set of baseline covariate values. By adjusting on the basis of the observed mean covariate values for the treatment group, the tables report the following:
•
•
the regression-adjusted mean outcome levels for schools randomly assigned to the treatment group, which equal the observed mean outcome levels for treatment schools; and
the regression-adjusted mean outcome levels for schools randomly assigned to the control group, using the observed mean covariate values for the treatment group as the basis for the adjustment.
The reported mean outcome level for the control group represents how the treatment group schools would have performed had they not been randomly assigned to the control group. In other words, it represents the counterfactual.
55 As discussed earlier in this chapter, districts were not randomly assigned to PD providers or to curricula. Therefore, the districts served by one provider (or curriculum) could differ systematically from the districts served by the other provider (or curriculum), on both observable characteristics and other characteristics.
26
In the impact tables and the relevant text in the report, the observed mean outcome for the treatment group is referred to as the “treatment group,” and the regression-adjusted mean outcome for the control group is referred to as the “control group.”
Statistical Power
A common way to represent statistical precision is as a minimum detectable effect (MDE), which is the smallest true effect that an estimator has a “good chance” of detecting (Bloom 1995). We use the standard convention of defining a minimum detectable effect as the smallest true impact that has an 80 percent chance of being found to be statistically significant at the 5 percent level of statistical significance for a two-tailed test. When a minimum detectable effect is expressed as a standardized effect size (in standard deviation units), it is referred to as a minimum detectable effect size (MDES).56
Table 2-9 reports MDES estimates for the program impact on the teacher and student outcomes for the full study sample and for five subgroups. These findings are based on available data from the first year of program implementation instead of on the assumptions that guided the study design. That is, they represent the realized precision of the study.
For the full sample, the MDES for teacher knowledge and instructional practice ranged from 0.36 to 0.54 standard deviations. The minimum detectable effect sizes for student mathematics achievement ranged from 0.11 to 0.12 standard deviations, consistent with the MDES of 0.13 standard deviation calculated at the design stage of the study. Minimum detectable effect sizes for subgroups are larger because the sample sizes are smaller for subgroups than for the full sample.
Treatment of Missing Data
Teachers or students with missing outcome measures were dropped from the impact analysis for which they lacked data. In cases with missing covariate measures, the missing data were replaced with zeros and a dichotomous variable indicating the missing status of a given covariate for each observation was added to the impact analysis model.
Weighting Used in Impact Analysis
Because random assignment was conducted separately within each of the 12 participating school districts, the study comprised 12 separate random assignment experiments. The separate impact estimates for each district were averaged to obtain an overall impact estimate, using the number of treatment schools in each district as a weight in computing the average. Therefore, the overall impact estimates represent the program impact for an average treatment school.
For teacher-level outcomes, every teacher within a district was weighted equally (i.e., an implicit weight of 1 was applied for each teacher). For student-level outcomes (e.g., student achievement test scores), each student in the sample was weighted equally. Because equal numbers of students were sampled from each class, weighting each student equally is approximately equivalent to weighting each sampled class equally.57
56 Throughout this report, the standard deviations of the outcome measure for the control group members are used in calculating effect sizes.
57 For a detailed discussion of student sampling, see Appendix B.
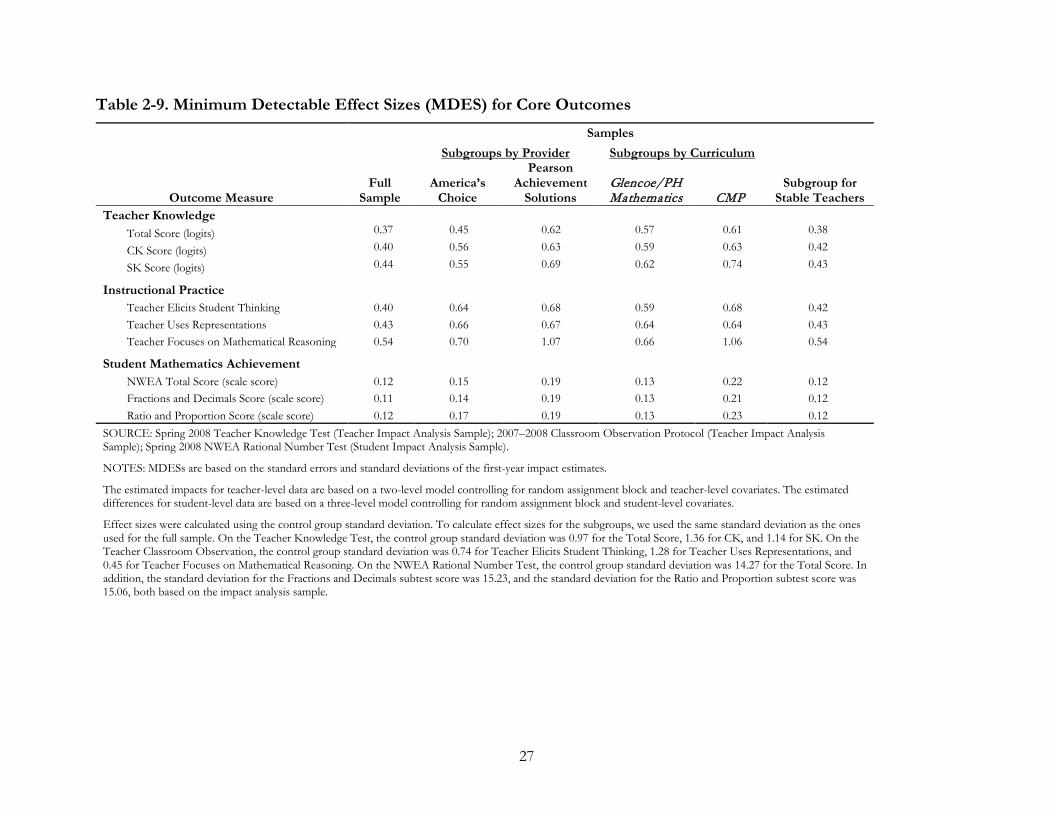
27
Table 2-9. Minimum Detectable Effect Sizes (MDES) for Core Outcomes
Outcome Measure
Samples Subgroups by Provider
Subgroup for Stable Teachers
Subgroups by Curriculum
Full Sample
America’s
Choice
Pearson Achievement
Solutions Glencoe/PH Mathematics CMP
Teacher Knowledge Total Score (logits) 0.37 0.45 0.62 0.57 0.61 0.38
CK Score (logits) 0.40 0.56 0.63 0.59 0.63 0.42
SK Score (logits) 0.44 0.55 0.69 0.62 0.74 0.43
Instructional Practice Teacher Elicits Student Thinking 0.40 0.64 0.68 0.59 0.68 0.42 Teacher Uses Representations 0.43 0.66 0.67 0.64 0.64 0.43 Teacher Focuses on Mathematical Reasoning 0.54 0.70 1.07 0.66 1.06 0.54
Student Mathematics Achievement NWEA Total Score (scale score) 0.12 0.15 0.19 0.13 0.22 0.12 Fractions and Decimals Score (scale score) 0.11 0.14 0.19 0.13 0.21 0.12 Ratio and Proportion Score (scale score) 0.12 0.17 0.19 0.13 0.23 0.12
SOURCE: Spring 2008 Teacher Knowledge Test (Teacher Impact Analysis Sample); 2007–2008 Classroom Observation Protocol (Teacher Impact Analysis Sample); Spring 2008 NWEA Rational Number Test (Student Impact Analysis Sample).
NOTES: MDESs are based on the standard errors and standard deviations of the first-year impact estimates.
The estimated impacts for teacher-level data are based on a two-level model controlling for random assignment block and teacher-level covariates. The estimated differences for student-level data are based on a three-level model controlling for random assignment block and student-level covariates.
Effect sizes were calculated using the control group standard deviation. To calculate effect sizes for the subgroups, we used the same standard deviation as the ones used for the full sample. On the Teacher Knowledge Test, the control group standard deviation was 0.97 for the Total Score, 1.36 for CK, and 1.14 for SK. On the Teacher Classroom Observation, the control group standard deviation was 0.74 for Teacher Elicits Student Thinking, 1.28 for Teacher Uses Representations, and 0.45 for Teacher Focuses on Mathematical Reasoning. On the NWEA Rational Number Test, the control group standard deviation was 14.27 for the Total Score. In addition, the standard deviation for the Fractions and Decimals subtest score was 15.23, and the standard deviation for the Ratio and Proportion subtest score was 15.06, both based on the impact analysis sample.

29
CHAPTER 3. DESIGN AND IMPLEMENTATION OF THE PD PROGRAM
This chapter describes the content and structure of each component of the professional development program, examines the implementation of the PD program, and compares the mathematics PD experienced by treatment and control teachers during the implementation year. How, and how well, the PD program was implemented is an important factor in understanding the impact that the program had on teachers and students.
Design of the PD Program The PD program delivered in this study was designed to increase teachers’ capability to teach
positive rational number topics effectively. The program included a 3-day summer institute (18 hours per teacher), five 1-day seminars held during the school year (30 hours per teacher), and 10 days of intensive in-school coaching (20 hours per teacher), providing a total intended dosage of 68 hours of PD per teacher. The intended dosage of 68 hours of content-focused PD is higher than the dosage of content-focused PD most mathematics teachers typically receive in a single year.58
During the 8 days of summer institutes and seminars in each district, facilitators worked with a group of teachers that included the seventh-grade mathematics teachers, the mathematics teacher leaders or department chairs, and the resource teachers who worked with the seventh-grade mathematics teachers in all treatment schools in the district. The number of seventh-grade teachers across the 12 district training groups ranged from 3 to 10 participants and averaged 7; the total number of participants (i.e., seventh-grade teachers, teacher leaders, and resource teachers) in the training groups ranged from 4 to 19 and averaged 11.
The five 1-day seminars and 2-day coaching visits held during the school year were coupled such that each 2-day coaching visit was scheduled to begin no later than the third school day after the associated seminar. Furthermore, the seminars and coaching visits were scheduled to the extent possible to align with periods in which rational number topics were being covered in the districts’ seventh-grade mathematics curriculum. Districts differed in the amount of time devoted to rational number content, in the order in which topics were covered in the curriculum, and in the timing of this content during the school year. Hence, the sequencing and timing of the seminars varied by district. According to district curriculum pacing guides for the 2007–2008 school year, on average, for the 12 study districts, topics in positive rational numbers were the planned topic of instruction for 31 percent of the school year; across the districts, the time spent on rational number content ranged from 15 percent of the school year in the district that planned to spend the least time on rational numbers to 54 percent in the district that planned to spend the most time.59
Within the domain of rational numbers, the program design focused on fractions, decimals, ratio, rate, proportion, and percent. Across the 8 institute and seminar days, the program was designed to provide equal coverage to fractions and decimals (4 days) and ratio, rate, proportion, and
58 As noted in Chapter 1, a national survey of teachers completed in 2005–2006 found that 11 percent of elementary teachers and 22 percent of secondary mathematics teachers participated in professional development in mathematics lasting more than 24 hours (U.S. Department of Education 2009, p. 95). 59 Appendix C summarizes the percentages of the school year allocated to rational number topics and the scheduled coverage of mathematics topics on the basis of the pacing guides for each district.
30
percent (4 days), and to emphasize the 12 key understandings in rational numbers that were discussed in Chapter 2 and Appendix A.
For each rational number topic area, the PD program was designed to address both common knowledge of mathematics and specialized knowledge of mathematics for teaching.60
Two providers selected through a competitive process delivered the PD program: America’s Choice and Pearson Achievement Solutions. The study design required both PD providers to deliver the same intended dosage and to adhere to a common set of objectives, rational number topics, and PD features, described in more detail below. But because the providers built on their existing materials addressing topics in rational numbers, the providers differed in how they planned to structure teacher learning activities and present the content to teachers.
To address the common knowledge goals, the program design emphasized using precise definitions and the properties and rationales underlying common procedures used with rational numbers. To address the specialized knowledge goals, the PD emphasized developing teachers’ explanations of rational number concepts and procedures, identifying and addressing persistent student misconceptions, and using representations of rational number concepts in teaching. The design called for modeling and practicing relevant pedagogical techniques as a means to develop teachers’ skills in implementing specific mathematics teaching strategies. The pedagogical techniques that received the most attention were eliciting and responding to student thinking, using charts to keep track of particular student misconceptions, and using strategies for summarizing the core mathematical ideas of a lesson.
The next two sections provide more detailed descriptions of the institute and seminar component and the coaching component of the PD program and the specific approaches planned by each PD provider.
Summer Institute and Seminar Series
The summer institute and seminars blended activities intended to develop specialized knowledge of mathematics for teaching and strengthen common knowledge of mathematics. Each PD provider prepared a facilitator guide describing the provider’s plans for the institutes and seminars. The guides provided plans for each institute and seminar day, dividing each day into 6 to 12 segments and specifying the mathematical content, activities, and suggested timing for each PD segment. A complete list of the summer institute and seminar segment topics appears in Appendix C. Facilitator guides were refined through a year-long pilot and review process. The study’s external advisors reviewed both providers’ facilitator guides, focusing on the accuracy, appropriateness, and coherence of the mathematics content presented to teachers.61
The institutes and seminars were designed to use multiple delivery formats to provide teachers a variety of learning opportunities. The planned PD activities included opportunities for teachers to solve mathematics problems individually and in groups, make short oral presentations to explain how they solved problems, receive feedback on how they solved and presented their solutions, engage in discussions about the most common student misconceptions associated with
60 “Common knowledge of mathematics” and “specialized knowledge of mathematics for teaching” are terms used throughout this report. They are initially defined in Chapter 1. 61 The review process drew on materials on rational numbers developed by mathematicians Sybilla Beckman, James Milgram, and Hung-Hsi Wu, specifically Beckman (2005), Milgram (2005), and Wu (2002a, 2002b, 2005).
31
topics in rational numbers, and plan lessons that they would teach during the follow-up coaching visits.
During each PD segment, teachers were to be provided specific preplanned participant materials from the facilitator’s guide, such as mathematics problem sets and worksheets, templates for planning and reflecting on lessons and monitoring student thinking, journals and handouts for teacher reflection, and supplemental readings in rational number content and pedagogy. At the end of each PD segment, facilitators were to summarize what was taught. Each day of the PD program was designed to provide opportunities to link the content of the PD to the seventh-grade mathematics textbooks being used in the districts in which the study was conducted. Although both PD providers’ facilitator guides incorporated the overall design features described above, the providers’ planned PD differed in some specific elements.
America’s Choice
In America’s Choice PD segments, teachers were asked to solve sets of mathematics problems. Teachers worked on the problem sets individually or in small groups, followed by structured discussions led by the facilitator. The problem sets were designed to lay the groundwork for or reinforce the definitions of mathematical concepts and to illustrate common student misconceptions. The facilitator guide and training provided explicit guidance about how to direct the discussions of the problem sets, including examples of questions to ask teachers and mathematics concepts to emphasize during the summary portion of each segment.
America’s Choice also introduced several specific representations designed to help teachers convey rational number topics, including the number line, double number line, ratio table, area models, set models, and strip diagram. The facilitators explained how teachers should use the representations with students, and the AC problem sets offered opportunities for teachers to practice using them.
During the 3 institute days, America’s Choice also introduced “questioning strategies” that teachers could use to elicit student thinking. These questioning strategies included asking a student to restate another student’s reasoning, asking a student to apply his or her own reasoning to another student’s reasoning, and using the “Say More” technique, in which teachers asked individual students to say more about an answer or explanation. During the seminar days, teachers were introduced to additional questioning strategies and continued to practice the questioning strategies introduced during the summer institute. Within the seminars, teachers (individually and with feedback from the facilitator) were given time to work on a rational number lesson linked to their textbook to be used on the follow-up days of coaching that began no later than three days after the seminars.
Pearson Achievement Solutions
Pearson Achievement Solutions used a single problem or task to structure each PD segment. Each task was designed to elicit multiple approaches, which were intended to fuel extended discussions about the core ideas, common student approaches, and potential misconceptions associated with each task. Like America’s Choice, the Pearson Achievement Solutions facilitators had guidance regarding the types of questions to ask and key ideas to emphasize during these discussions. However, the Pearson Achievement Solutions tasks were more open-ended, and facilitators were told to use their expertise to determine how to structure the discussions and to
32
determine whether to extend the length of a PD segment to address teachers’ responses. The Pearson Achievement Solutions facilitator guide and training incorporated a summary statement for each PD segment for the institute days, but the guide did not specify how long the summary provided to teachers should last. The facilitator guide did not explicitly specify segment summaries for seminar days.
For some segments, the problem used to structure the segment was designed to elicit multiple representations of rational number concepts, and these problems provided the basis for the discussion of the representations. Facilitators were expected to address the number line, ratio table, area model, and set model.
Pearson Achievement Solutions organized its coverage of the rational numbers content by focusing the summer institute on deepening teachers’ understanding of three “big ideas” about rational numbers: (1) “numbers represent quantities,” (2) “rational numbers are about division,” and (3) “a ratio shows a comparison by division.” Within the seminars, facilitators gave teachers a problem that formed the basis of a lesson they would insert into the curriculum and teach during the subsequent coaching visit. Pearson Achievement Solutions designed each problem to elicit multiple student approaches to a particular rational number concept and to reveal potential student misconceptions. After teachers worked on the problem and considered various ways their students were likely to approach the problem, they collaboratively planned how they would teach the lesson according to a lesson format developed by Pearson Achievement Solutions. The lesson format had four sections: identifying the mathematical goal(s) of the lesson, monitoring and classifying student approaches to the task, providing a summary statement of the core mathematics of the lesson, and developing formative assessment questions.
Coaching
The primary purpose of the coaching component of the PD program was to help teachers apply material covered in the institutes and seminars to their classroom instruction. The coaching component was designed to consist of 10 days of coaching provided through five 2-day visits to each school. Each 2-day coaching visit was scheduled to begin no later than the third school day after 1 of the 5 seminar days and was designed to link to the preceding seminar.62
Each provider prepared a coaching manual or coaching plan that described the structure and focus of each day’s coaching activities. According to the manual or plan, facilitators were expected to use both individual and group delivery formats and a range of coaching activities, including planning, observing, instructing, and debriefing. Like the summer institute and seminars, however, the two providers structured their coaching activities differently.
America’s Choice
According to the America’s Choice coaching plan, coaches were expected to work with teachers on whatever lesson the teachers were planning to teach according to the district pacing plan. Although the coach visits were scheduled to occur when teachers were teaching rational
62 As explained earlier in this chapter, both providers used their districts’ curricular pacing guides to schedule the seminars—and the coaching visits coupled with each seminar—when teachers planned to teach rational number topics.
33
number content, variation in teachers’ progress through the curriculum made it possible for some of the America’s Choice coaching days to take place when teachers were teaching other topics.
America’s Choice planned to engage in different individual and group coaching activities on each of the five 2-day coaching visits. During the first 2-day coaching visit, the facilitator observed a teacher teaching a typical lesson, modeled a lesson for the teacher, and then met with the teacher to discuss the strengths and weaknesses of both lessons. On the second coaching visit, the facilitator worked with the teacher to practice using the mathematical discussion techniques first with small groups of students and then with the whole class. The third coaching visit emphasized teachers’ use of a tool for monitoring student understanding of the main mathematics ideas in the lesson that was designed to help teachers organize and prioritize student approaches. The fourth coaching visit focused on peer observations, in which one or more teachers used an observation tool that focused on a prespecified set of student behaviors as they observed another teacher. The fifth and final coaching visit was designed to have pairs of teachers co-plan and co-teach a lesson and debrief with the facilitator afterward.
Pearson Achievement Solutions
Unlike America’s Choice, whose coaching model was designed to work with whatever topics teachers were teaching according to the district pacing guide, the Pearson Achievement Solutions approach focused on rational number lessons that used a problem provided by the PD provider during each of the seminars. Each lesson was planned collaboratively during the preceding seminar, and teachers were asked to insert it into the curriculum for the coaching visit.
According to the Pearson Achievement Solutions coaching plan, on the first day of the 2-day coaching visit at each school, the facilitator was expected to observe each teacher as he or she taught the planned lesson. Then, in an after-school group meeting, the facilitator led a discussion about how the lesson was implemented across the classrooms. The collegial meeting was designed to focus on how the content was presented, how students responded to end-of-lesson assessment questions, and what the next lesson should look like after the teacher had reflected upon the current lesson. On the second day of the 2-day coaching visit, the teachers implemented the lesson they planned during the after-school meeting. They also participated in a shorter group debriefing meeting with the facilitator, who summarized the main ideas in the lessons taught during the second day of the visit and encouraged teachers to think about how they could use the material discussed during the 2-day visit in future lessons. The Pearson Achievement Solutions coaching plan emphasized observation, collaborative planning, and group debriefing focused on common lessons; it did not emphasize facilitator modeling instruction or co-teaching in the classroom.
Implementation of the PD Program This section describes the facilitators who delivered the PD and documents the degree to
which the PD was delivered as planned. To describe the staff who delivered the PD program, the study collected information on facilitators’ qualifications and training. To document the implementation of the PD program, study staff observed each summer institute and seminar day and collected logs of coaching activities. In addition, the number of hours of teacher participation (dosage) was calculated from daily attendance sheet data and coach logs.
Implementation was measured using common metrics for both providers across all 12 participating districts. However, as discussed above, the two providers planned somewhat different

34
approaches. (See page 30 for differences in provider approaches to the institutes and seminars and page 31 for differences in provider approaches to coaching.) Thus, we report separate results for each provider, and we refer to the providers’ planned approaches to the PD in discussing the results.
Professional Development Facilitators
Ten facilitators (6 for America’s Choice and 4 for Pearson Achievement Solutions) delivered the institutes, seminars, and coaching in the 12 study districts. A pair of facilitators led the institutes and seminars in each district. Each pair of facilitators split up to conduct the coaching, with one facilitator assigned to half the treatment schools in the district and the other assigned to the other half, to ensure that all the coaching visits could be conducted shortly after the seminar day.
Eight of the 10 facilitators had an undergraduate degree or concentration in mathematics or mathematics education, and all 10 facilitators were certified to teach secondary mathematics. Eight facilitators held master’s degrees, and five of the eight master’s degrees were in mathematics education. The remaining three master’s degrees were in technology, administration, and curriculum. The facilitators had 7 to 39 years of experience teaching mathematics and 2 to 16 years of experience providing professional development. As might be expected, the facilitators were able to answer correctly many of the items from the teacher knowledge test that had been challenging for the teachers in the study population at the beginning of the study. The facilitators had a higher average total score on the study’s teacher knowledge test than did the study teachers. On average, 92.7 percent of the PD provider staff answered test items of average difficulty correctly, compared with 45.7 percent of teachers in the treatment group and 50.6 percent of teachers in the control group, as measured at baseline.63, 64
The facilitators working with each provider participated in week-long summer training programs taught by the provider’s lead developer, who created and compiled the PD program materials. The training sessions provided time for the facilitators to become familiar with the key goals and structure of the professional development, read the facilitator and participant materials, work through the activities and problem sets, and practice delivering segments.
Implementation of the Institute and Seminars
As described above, each provider prepared an agenda and a facilitator guide for each institute and seminar day, specifying the planned duration, the content to be covered, the delivery formats, the participant materials to be used, and other aspects of the day. To measure the degree to which the institute and seminars were implemented as planned, study staff observed all 96 days of professional development (i.e., 8 days in each of 12 districts), completing a detailed, closed-ended observation protocol tailored to each day’s training agenda topics and activities. Study staff used the form to record information about each agenda section of the PD day. The observations focused on seven dimensions of the PD: the duration of each planned segment; whether each planned segment was covered or skipped; the delivery formats (e.g., individual, small group, whole group, and teacher presentation); the use of participant materials; the extent to which main ideas of each segment were summarized; the extent to which links were made to the mathematics curriculum used in the study 63 The differences are statistically significant. Two-tailed t-tests indicate that both p-values are <0.01. 64 As described in Chapter 2, the difficulty level of the teacher knowledge test was intentionally aligned with the average knowledge level of the study population. The much higher performance of the PD facilitators on this same instrument provides perspective on the estimated size of the knowledge gain that was effected by thePD program.
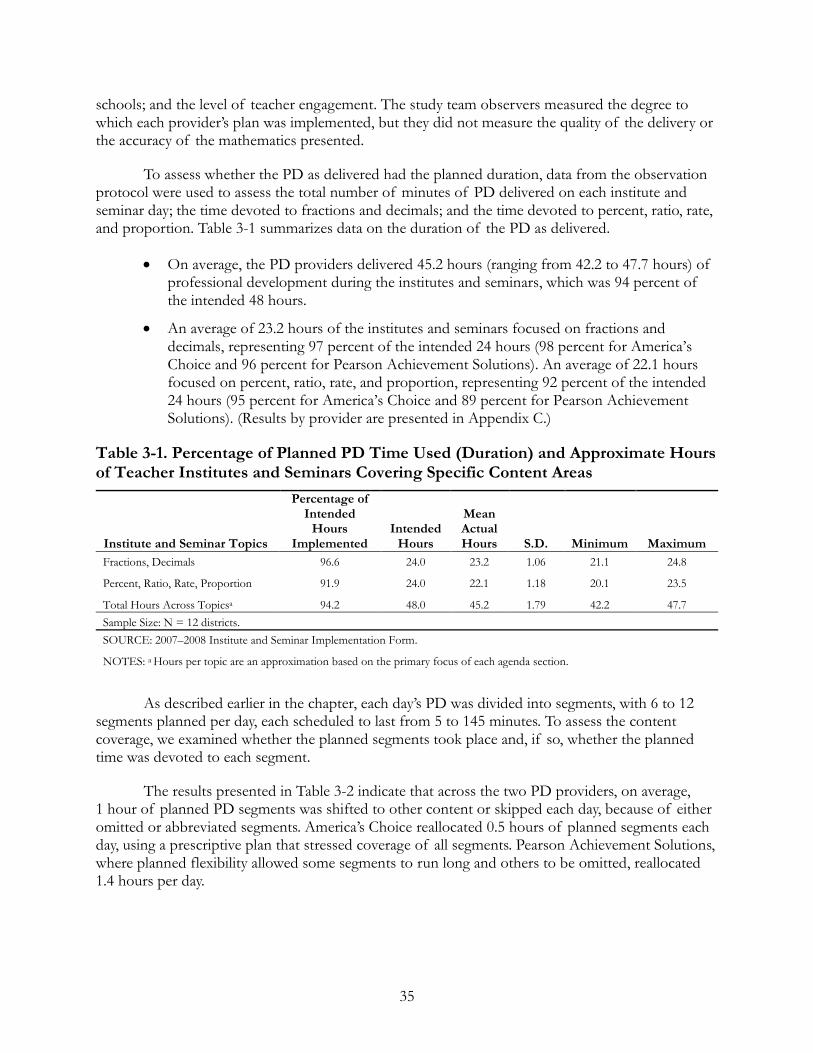
35
schools; and the level of teacher engagement. The study team observers measured the degree to which each provider’s plan was implemented, but they did not measure the quality of the delivery or the accuracy of the mathematics presented.
To assess whether the PD as delivered had the planned duration, data from the observation protocol were used to assess the total number of minutes of PD delivered on each institute and seminar day; the time devoted to fractions and decimals; and the time devoted to percent, ratio, rate, and proportion. Table 3-1 summarizes data on the duration of the PD as delivered.
•
•
On average, the PD providers delivered 45.2 hours (ranging from 42.2 to 47.7 hours) of professional development during the institutes and seminars, which was 94 percent of the intended 48 hours.
An average of 23.2 hours of the institutes and seminars focused on fractions and decimals, representing 97 percent of the intended 24 hours (98 percent for America’s Choice and 96 percent for Pearson Achievement Solutions). An average of 22.1 hours focused on percent, ratio, rate, and proportion, representing 92 percent of the intended 24 hours (95 percent for America’s Choice and 89 percent for Pearson Achievement Solutions). (Results by provider are presented in Appendix C.)
Table 3-1. Percentage of Planned PD Time Used (Duration) and Approximate Hours of Teacher Institutes and Seminars Covering Specific Content Areas
Institute and Seminar Topics
Percentage of Intended
Hours Implemented
Intended Hours
Mean Actual Hours S.D. Minimum Maximum
Fractions, Decimals 96.6 24.0 23.2 1.06 21.1 24.8
Percent, Ratio, Rate, Proportion 91.9 24.0 22.1 1.18 20.1 23.5
Total Hours Across Topicsa 94.2 48.0 45.2 1.79 42.2 47.7 Sample Size: N = 12 districts. SOURCE: 2007–2008 Institute and Seminar Implementation Form.
NOTES: a Hours per topic are an approximation based on the primary focus of each agenda section.
As described earlier in the chapter, each day’s PD was divided into segments, with 6 to 12
segments planned per day, each scheduled to last from 5 to 145 minutes. To assess the content coverage, we examined whether the planned segments took place and, if so, whether the planned time was devoted to each segment.
The results presented in Table 3-2 indicate that across the two PD providers, on average, 1 hour of planned PD segments was shifted to other content or skipped each day, because of either omitted or abbreviated segments. America’s Choice reallocated 0.5 hours of planned segments each day, using a prescriptive plan that stressed coverage of all segments. Pearson Achievement Solutions, where planned flexibility allowed some segments to run long and others to be omitted, reallocated 1.4 hours per day.
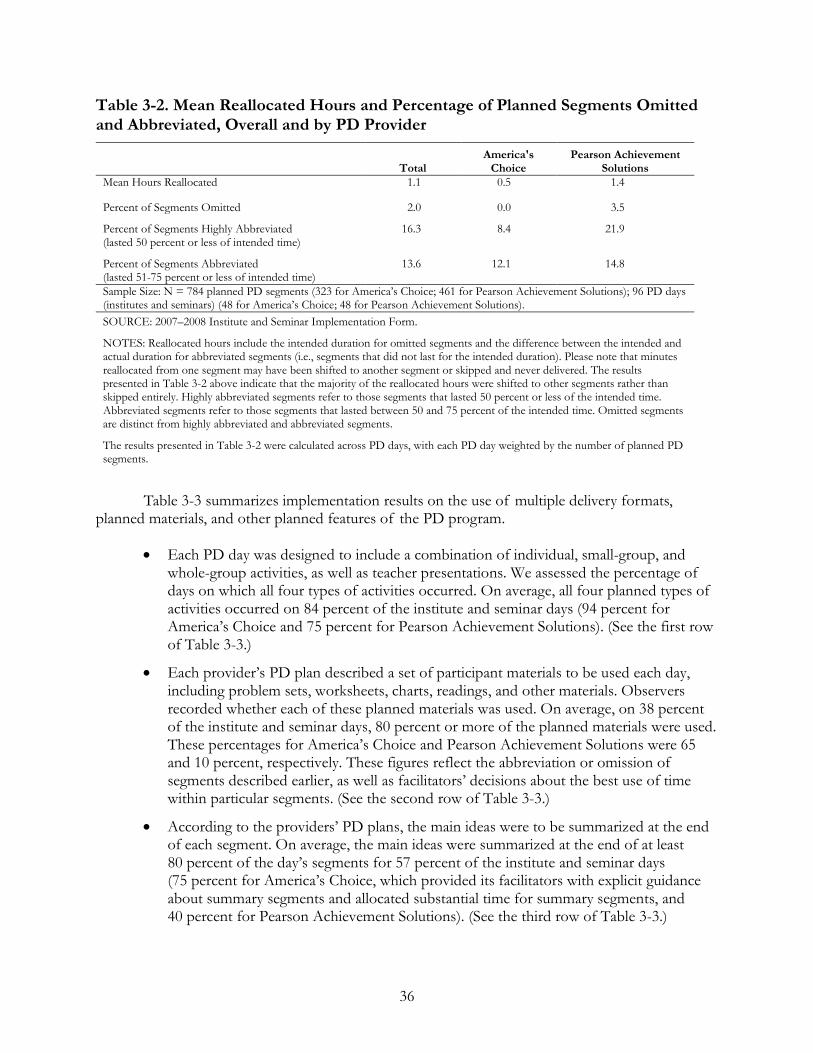
36
Table 3-2. Mean Reallocated Hours and Percentage of Planned Segments Omitted and Abbreviated, Overall and by PD Provider
Total
America's Choice
Pearson Achievement Solutions
Mean Hours Reallocated 1.1 0.5 1.4
Percent of Segments Omitted 2.0 0.0 3.5
Percent of Segments Highly Abbreviated (lasted 50 percent or less of intended time)
16.3 8.4 21.9
Percent of Segments Abbreviated (lasted 51-75 percent or less of intended time)
13.6 12.1 14.8
Sample Size: N = 784 planned PD segments (323 for America’s Choice; 461 for Pearson Achievement Solutions); 96 PD days (institutes and seminars) (48 for America’s Choice; 48 for Pearson Achievement Solutions). SOURCE: 2007–2008 Institute and Seminar Implementation Form.
NOTES: Reallocated hours include the intended duration for omitted segments and the difference between the intended and actual duration for abbreviated segments (i.e., segments that did not last for the intended duration). Please note that minutes reallocated from one segment may have been shifted to another segment or skipped and never delivered. The results presented in Table 3-2 above indicate that the majority of the reallocated hours were shifted to other segments rather than skipped entirely. Highly abbreviated segments refer to those segments that lasted 50 percent or less of the intended time. Abbreviated segments refer to those segments that lasted between 50 and 75 percent of the intended time. Omitted segments are distinct from highly abbreviated and abbreviated segments.
The results presented in Table 3-2 were calculated across PD days, with each PD day weighted by the number of planned PD segments.
Table 3-3 summarizes implementation results on the use of multiple delivery formats,
planned materials, and other planned features of the PD program.
•
•
•
Each PD day was designed to include a combination of individual, small-group, and whole-group activities, as well as teacher presentations. We assessed the percentage of days on which all four types of activities occurred. On average, all four planned types of activities occurred on 84 percent of the institute and seminar days (94 percent for America’s Choice and 75 percent for Pearson Achievement Solutions). (See the first row of Table 3-3.)
Each provider’s PD plan described a set of participant materials to be used each day, including problem sets, worksheets, charts, readings, and other materials. Observers recorded whether each of these planned materials was used. On average, on 38 percent of the institute and seminar days, 80 percent or more of the planned materials were used. These percentages for America’s Choice and Pearson Achievement Solutions were 65 and 10 percent, respectively. These figures reflect the abbreviation or omission of segments described earlier, as well as facilitators’ decisions about the best use of time within particular segments. (See the second row of Table 3-3.)
According to the providers’ PD plans, the main ideas were to be summarized at the end of each segment. On average, the main ideas were summarized at the end of at least 80 percent of the day’s segments for 57 percent of the institute and seminar days (75 percent for America’s Choice, which provided its facilitators with explicit guidance about summary segments and allocated substantial time for summary segments, and 40 percent for Pearson Achievement Solutions). (See the third row of Table 3-3.)
37
•
•
The PD providers planned to make explicit links on each institute and seminar day between the PD content and the specific seventh-grade mathematics curriculum used in the study schools. The percentage of institute and seminar days on which at least 15 minutes was devoted to making explicit links to the curriculum65
Finally, we examined the overall level of teacher engagement for each day of the PD.
was, on average, 60 percent (79 percent for America’s Choice, which drew on lessons from the existing curriculum, and 42 percent for Pearson Achievement Solutions, which inserted lessons specially developed for the PD program that were not part of the existing curriculum). (See the fourth row of Table 3-3.)
66
On 96 percent of the institute and seminar days, at least 80 percent of the participating teachers were engaged in the PD for each of the PD providers. (See the final row of Table 3-3.)
65 The extent to which the PD made explicit links to the curriculum materials, standards, or assessments used by teachers in the district was determined on the basis of the cumulative total time spent per day on these links. The form and coding guide asked observers to indicate whether no time, less than 5 minutes, between 5 and 15 minutes, between 15 and 30 minutes, or more than 30 minutes was spent making such links during the day. 66 The implementation form included an item on teacher engagement that had five possible responses: 20 percent or less, 40 percent, 60 percent, 80 percent, or 100 percent of participating teachers were actively engaged for the majority of the day. Observers received a coding guide and were trained in its use. Observers were to record teacher engagement at least four times across the day. Teachers were to be counted as actively engaged if they were watching the facilitator, working problems, listening to or contributing to the discussion. To be actively engaged, teachers did not need to be enthusiastic, just attentive.
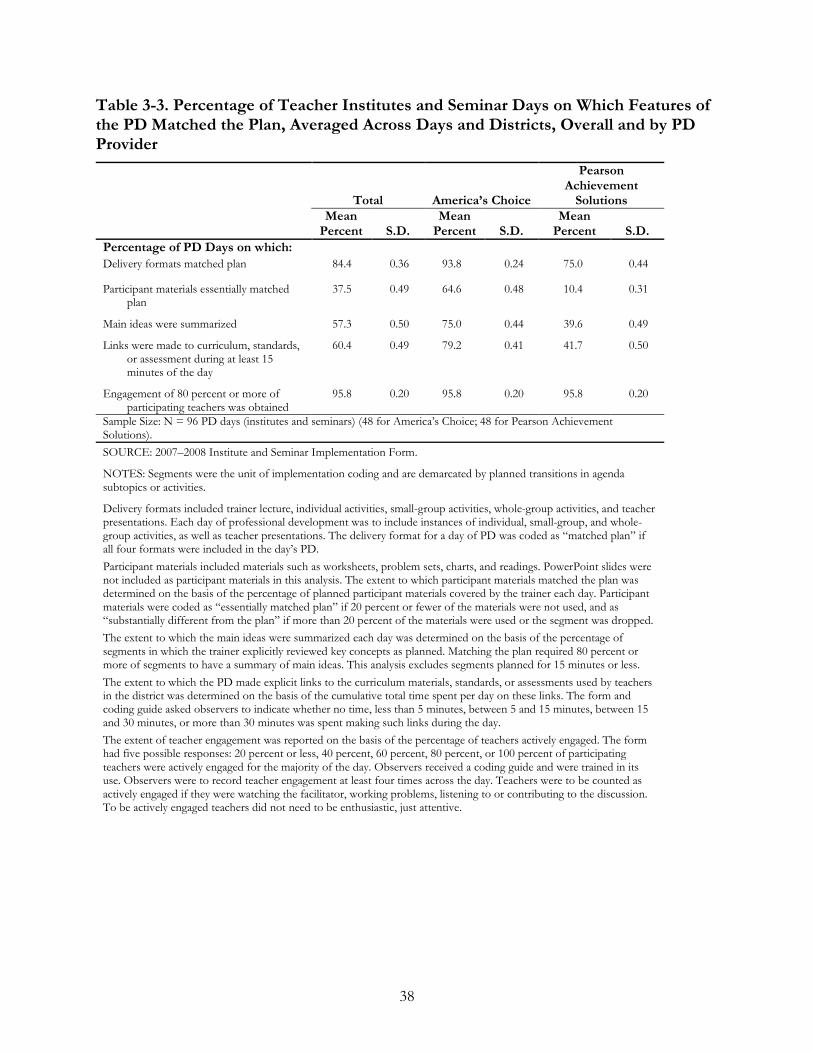
38
Table 3-3. Percentage of Teacher Institutes and Seminar Days on Which Features of the PD Matched the Plan, Averaged Across Days and Districts, Overall and by PD Provider
Total America’s Choice
Pearson Achievement
Solutions Mean
Percent S.D. Mean
Percent S.D. Mean
Percent S.D. Percentage of PD Days on which: Delivery formats matched plan 84.4 0.36 93.8 0.24 75.0 0.44
Participant materials essentially matched plan
37.5 0.49 64.6 0.48 10.4 0.31
Main ideas were summarized 57.3 0.50 75.0 0.44 39.6 0.49
Links were made to curriculum, standards, or assessment during at least 15 minutes of the day
60.4 0.49 79.2 0.41 41.7 0.50
Engagement of 80 percent or more of participating teachers was obtained
95.8 0.20 95.8 0.20 95.8 0.20
Sample Size: N = 96 PD days (institutes and seminars) (48 for America’s Choice; 48 for Pearson Achievement Solutions). SOURCE: 2007–2008 Institute and Seminar Implementation Form.
NOTES: Segments were the unit of implementation coding and are demarcated by planned transitions in agenda subtopics or activities.
Delivery formats included trainer lecture, individual activities, small-group activities, whole-group activities, and teacher presentations. Each day of professional development was to include instances of individual, small-group, and whole-group activities, as well as teacher presentations. The delivery format for a day of PD was coded as “matched plan” if all four formats were included in the day’s PD. Participant materials included materials such as worksheets, problem sets, charts, and readings. PowerPoint slides were not included as participant materials in this analysis. The extent to which participant materials matched the plan was determined on the basis of the percentage of planned participant materials covered by the trainer each day. Participant materials were coded as “essentially matched plan” if 20 percent or fewer of the materials were not used, and as “substantially different from the plan” if more than 20 percent of the materials were used or the segment was dropped. The extent to which the main ideas were summarized each day was determined on the basis of the percentage of segments in which the trainer explicitly reviewed key concepts as planned. Matching the plan required 80 percent or more of segments to have a summary of main ideas. This analysis excludes segments planned for 15 minutes or less. The extent to which the PD made explicit links to the curriculum materials, standards, or assessments used by teachers in the district was determined on the basis of the cumulative total time spent per day on these links. The form and coding guide asked observers to indicate whether no time, less than 5 minutes, between 5 and 15 minutes, between 15 and 30 minutes, or more than 30 minutes was spent making such links during the day. The extent of teacher engagement was reported on the basis of the percentage of teachers actively engaged. The form had five possible responses: 20 percent or less, 40 percent, 60 percent, 80 percent, or 100 percent of participating teachers were actively engaged for the majority of the day. Observers received a coding guide and were trained in its use. Observers were to record teacher engagement at least four times across the day. Teachers were to be counted as actively engaged if they were watching the facilitator, working problems, listening to or contributing to the discussion. To be actively engaged teachers did not need to be enthusiastic, just attentive.
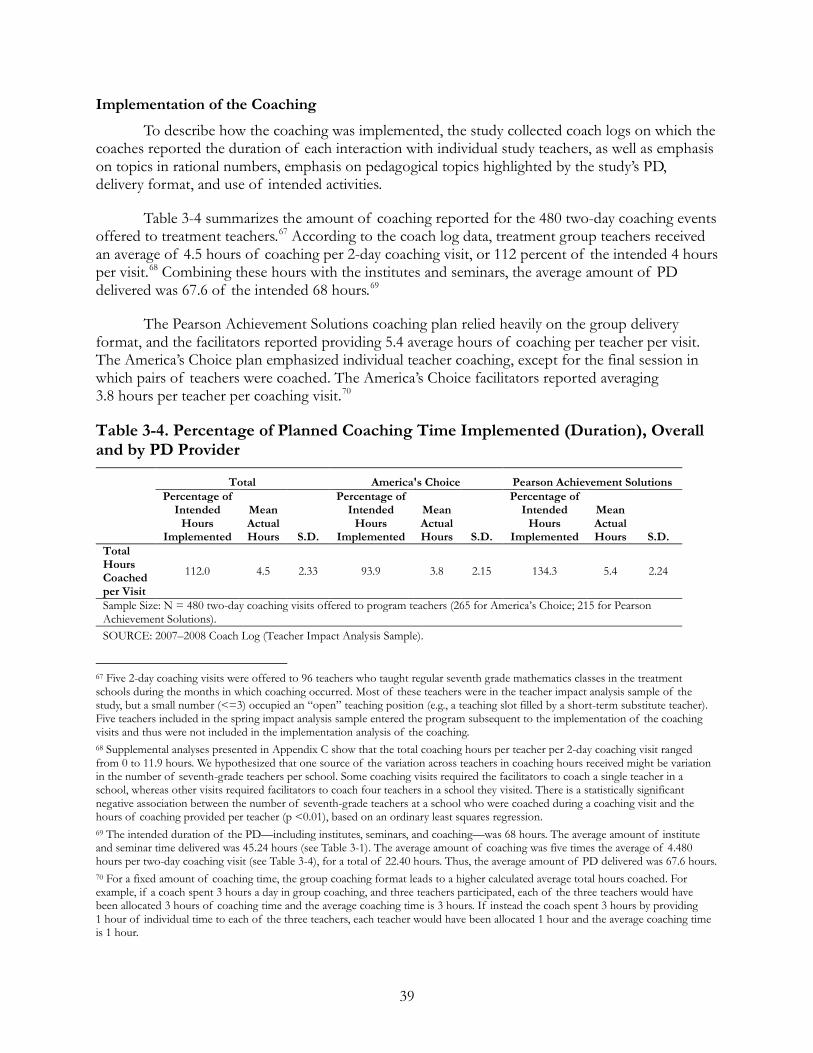
39
Implementation of the Coaching
To describe how the coaching was implemented, the study collected coach logs on which the coaches reported the duration of each interaction with individual study teachers, as well as emphasis on topics in rational numbers, emphasis on pedagogical topics highlighted by the study’s PD, delivery format, and use of intended activities.
Table 3-4 summarizes the amount of coaching reported for the 480 two-day coaching events offered to treatment teachers.67 According to the coach log data, treatment group teachers received an average of 4.5 hours of coaching per 2-day coaching visit, or 112 percent of the intended 4 hours per visit.68 Combining these hours with the institutes and seminars, the average amount of PD delivered was 67.6 of the intended 68 hours.69
The Pearson Achievement Solutions coaching plan relied heavily on the group delivery format, and the facilitators reported providing 5.4 average hours of coaching per teacher per visit. The America’s Choice plan emphasized individual teacher coaching, except for the final session in which pairs of teachers were coached. The America’s Choice facilitators reported averaging 3.8 hours per teacher per coaching visit.
70
Table 3-4. Percentage of Planned Coaching Time Implemented (Duration), Overall and by PD Provider
Total America's Choice Pearson Achievement Solutions Percentage of
Intended Hours
Implemented
Mean Actual Hours S.D.
Percentage of Intended
Hours Implemented
Mean Actual Hours S.D.
Percentage of Intended
Hours Implemented
Mean Actual Hours S.D.
Total Hours Coached per Visit
112.0 4.5 2.33 93.9 3.8 2.15 134.3 5.4 2.24
Sample Size: N = 480 two-day coaching visits offered to program teachers (265 for America’s Choice; 215 for Pearson Achievement Solutions). SOURCE: 2007–2008 Coach Log (Teacher Impact Analysis Sample).
67 Five 2-day coaching visits were offered to 96 teachers who taught regular seventh grade mathematics classes in the treatment schools during the months in which coaching occurred. Most of these teachers were in the teacher impact analysis sample of the study, but a small number (<=3) occupied an “open” teaching position (e.g., a teaching slot filled by a short-term substitute teacher). Five teachers included in the spring impact analysis sample entered the program subsequent to the implementation of the coaching visits and thus were not included in the implementation analysis of the coaching. 68 Supplemental analyses presented in Appendix C show that the total coaching hours per teacher per 2-day coaching visit ranged from 0 to 11.9 hours. We hypothesized that one source of the variation across teachers in coaching hours received might be variation in the number of seventh-grade teachers per school. Some coaching visits required the facilitators to coach a single teacher in a school, whereas other visits required facilitators to coach four teachers in a school they visited. There is a statistically significant negative association between the number of seventh-grade teachers at a school who were coached during a coaching visit and the hours of coaching provided per teacher (p <0.01), based on an ordinary least squares regression. 69 The intended duration of the PD—including institutes, seminars, and coaching—was 68 hours. The average amount of institute and seminar time delivered was 45.24 hours (see Table 3-1). The average amount of coaching was five times the average of 4.480 hours per two-day coaching visit (see Table 3-4), for a total of 22.40 hours. Thus, the average amount of PD delivered was 67.6 hours. 70 For a fixed amount of coaching time, the group coaching format leads to a higher calculated average total hours coached. For example, if a coach spent 3 hours a day in group coaching, and three teachers participated, each of the three teachers would have been allocated 3 hours of coaching time and the average coaching time is 3 hours. If instead the coach spent 3 hours by providing 1 hour of individual time to each of the three teachers, each teacher would have been allocated 1 hour and the average coaching time is 1 hour.
40
Features of the 2-day coaching visits, as reported by the coaches, are described in Table 3-5, and separate results for each PD provider are reported in Table 3-6.
•
•
•
•
On average, coaches covered topics in rational numbers in 84 percent of the coaching visits, and teachers received an average of 3.6 hours of coaching on rational numbers content and an average of 0.8 hour of coaching on other mathematical content per 2-day coaching visit. America’s Choice, which planned to adapt the coaching to whatever topics the teachers were teaching at the time of the coaching visit, focused on rational numbers content during 74 percent of visits and also focused on other mathematical content during 57 percent of visits. Pearson Achievement Solutions, which focused coaching visits on specially developed rational number lessons that facilitators asked teachers to insert into the curriculum, reported that 96 percent of visits covered rational numbers content and 6 percent covered other mathematical content.
Overall, “Common student misunderstandings” and “Using representations” were the most common pedagogical foci, featured in 86 percent and 84 percent of the coaching visits, respectively. Those were also the most common foci for America’s Choice coaches, who featured those foci in 79 percent and 80 percent of visits, respectively, which was consistent with their plans. The most common foci for Pearson Achievement Solutions coaches were “Common student misunderstandings” and “Connections among mathematical concepts,” featured in 94 percent and 98 percent of coaching visits, respectively, which was consistent with their focus on “big ideas” in the summer institute.
Overall, the coaching was delivered using a mix of individual and group formats, with 88 percent of 2-day visits including one-on-one coaching and 73 percent of visits including coaching as part of a group. America’s Choice coaches, who planned to use just one of the two formats on each 2-day visit, reported using one-on-one coaching and group coaching on 82 percent and 57 percent of the visits, respectively. Pearson Achievement Solutions coaches, who planned to use both delivery formats on each 2-day visit, reported using one-on-one coaching and group coaching on 95 percent and 92 percent of the visits, respectively. 71
Overall, debriefing after a lesson, observing teachers’ instruction, and planning lessons were the most common activities used, featured in, respectively, 92 percent, 83 percent, and 83 percent of coaching visits that teachers received, on average. (These percentages were 86, 70, and 76 for America’s Choice and 100, 99, and 91 for Pearson Achievement Solutions, respectively, reflecting the fact that the America’s Choice coaching plan called for a different combination of coaching activities during each 2-day visit, whereas the Pearson Achievement Solutions plan called for a common set of observation, collaborative planning, and group debriefing activities during each visit.)
71 To further understand the findings in Table 3-6 on delivery format, we conducted an additional analysis, dividing the coaching visits into mutually exclusive categories—one-on-one coaching only; group coaching; and dual-format coaching. The results indicate that 61 percent of coaching visits conducted by America’s Choice featured a single delivery format (43 percent used individual coaching only and 18 percent, group coaching only) compared with 13 percent of coaching visits led by Pearson Achievement Solutions (8 percent used individual coaching only and 5 percent, group coaching only). Thirty-nine percent of America’s Choice coaching visits and 87 percent of Pearson Achievement Solutions coaching visits featured a dual delivery format.
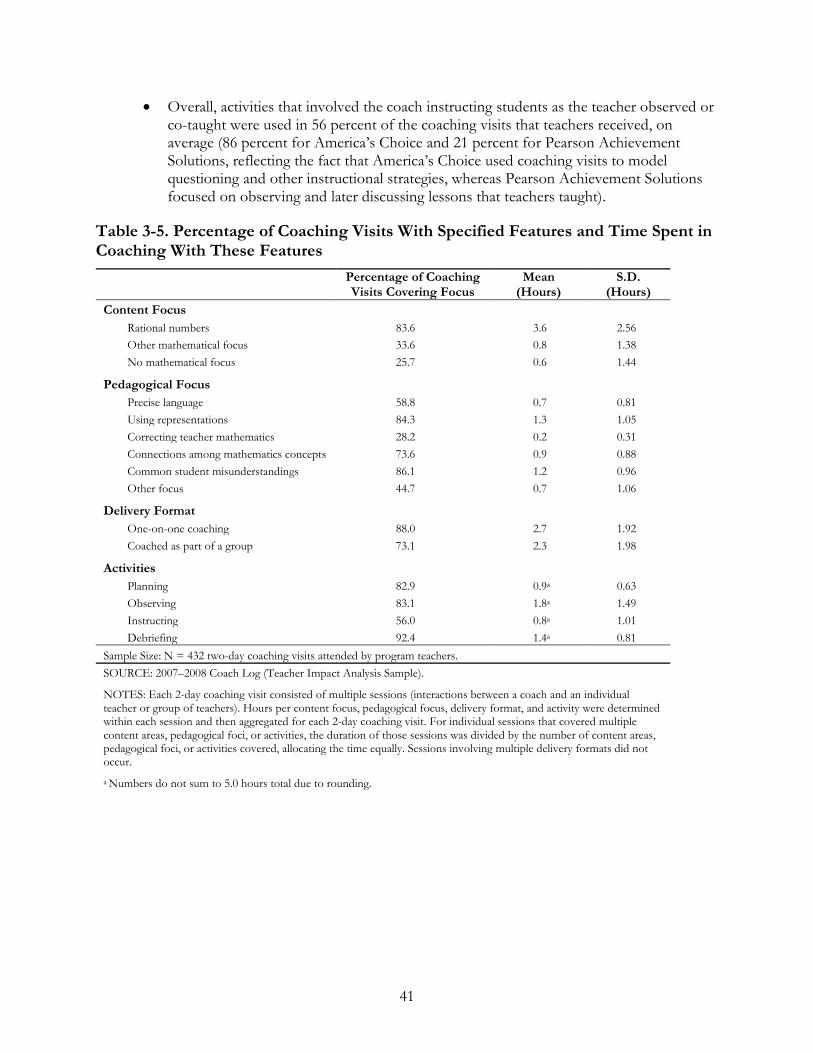
•
41
Overall, activities that involved the coach instructing students as the teacher observed or co-taught were used in 56 percent of the coaching visits that teachers received, on average (86 percent for America’s Choice and 21 percent for Pearson Achievement Solutions, reflecting the fact that America’s Choice used coaching visits to model questioning and other instructional strategies, whereas Pearson Achievement Solutions focused on observing and later discussing lessons that teachers taught).
Table 3-5. Percentage of Coaching Visits With Specified Features and Time Spent in Coaching With These Features
Percentage of Coaching Visits Covering Focus
Mean (Hours)
S.D. (Hours)
Content Focus Rational numbers 83.6 3.6 2.56 Other mathematical focus 33.6 0.8 1.38 No mathematical focus 25.7 0.6 1.44
Pedagogical Focus Precise language 58.8 0.7 0.81 Using representations 84.3 1.3 1.05 Correcting teacher mathematics 28.2 0.2 0.31 Connections among mathematics concepts 73.6 0.9 0.88 Common student misunderstandings 86.1 1.2 0.96 Other focus 44.7 0.7 1.06
Delivery Format One-on-one coaching 88.0 2.7 1.92 Coached as part of a group 73.1 2.3 1.98
Activities Planning 82.9 0.9a 0.63 Observing 83.1 1.8a 1.49 Instructing 56.0 0.8a 1.01 Debriefing 92.4 1.4a 0.81
Sample Size: N = 432 two-day coaching visits attended by program teachers. SOURCE: 2007–2008 Coach Log (Teacher Impact Analysis Sample).
NOTES: Each 2-day coaching visit consisted of multiple sessions (interactions between a coach and an individual teacher or group of teachers). Hours per content focus, pedagogical focus, delivery format, and activity were determined within each session and then aggregated for each 2-day coaching visit. For individual sessions that covered multiple content areas, pedagogical foci, or activities, the duration of those sessions was divided by the number of content areas, pedagogical foci, or activities covered, allocating the time equally. Sessions involving multiple delivery formats did not occur.
a Numbers do not sum to 5.0 hours total due to rounding.
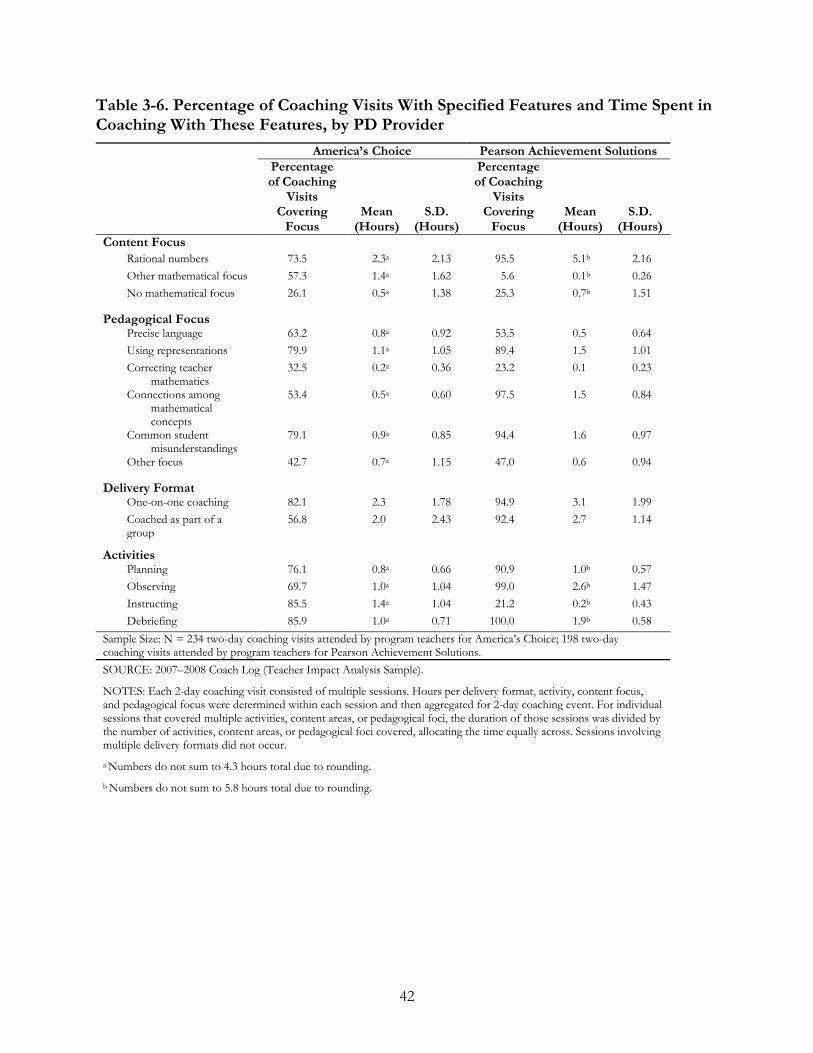
42
Table 3-6. Percentage of Coaching Visits With Specified Features and Time Spent in Coaching With These Features, by PD Provider
America’s Choice Pearson Achievement Solutions Percentage of Coaching
Visits Covering
Focus Mean
(Hours) S.D.
(Hours)
Percentage of Coaching
Visits Covering
Focus Mean
(Hours) S.D.
(Hours) Content Focus
Rational numbers 73.5 2.3a 2.13 95.5 5.1b 2.16 Other mathematical focus 57.3 1.4a 1.62 5.6 0.1b 0.26 No mathematical focus 26.1 0.5a 1.38 25.3 0.7b 1.51
Pedagogical Focus
Precise language 63.2 0.8a 0.92 53.5 0.5 0.64 Using representations 79.9 1.1a 1.05 89.4 1.5 1.01 Correcting teacher
mathematics 32.5 0.2a 0.36 23.2 0.1 0.23
Connections among mathematical concepts
53.4 0.5a 0.60 97.5 1.5 0.84
Common student misunderstandings
79.1 0.9a 0.85 94.4 1.6 0.97
Other focus 42.7 0.7a 1.15 47.0 0.6 0.94
Delivery Format
One-on-one coaching 82.1 2.3 1.78 94.9 3.1 1.99 Coached as part of a group
56.8 2.0 2.43 92.4 2.7 1.14
Activities
Planning 76.1 0.8a 0.66 90.9 1.0b 0.57 Observing 69.7 1.0a 1.04 99.0 2.6b 1.47 Instructing 85.5 1.4a 1.04 21.2 0.2b 0.43 Debriefing 85.9 1.0a 0.71 100.0 1.9b 0.58
Sample Size: N = 234 two-day coaching visits attended by program teachers for America’s Choice; 198 two-day coaching visits attended by program teachers for Pearson Achievement Solutions. SOURCE: 2007–2008 Coach Log (Teacher Impact Analysis Sample).
NOTES: Each 2-day coaching visit consisted of multiple sessions. Hours per delivery format, activity, content focus, and pedagogical focus were determined within each session and then aggregated for 2-day coaching event. For individual sessions that covered multiple activities, content areas, or pedagogical foci, the duration of those sessions was divided by the number of activities, content areas, or pedagogical foci covered, allocating the time equally across. Sessions involving multiple delivery formats did not occur.
a Numbers do not sum to 4.3 hours total due to rounding. b Numbers do not sum to 5.8 hours total due to rounding.
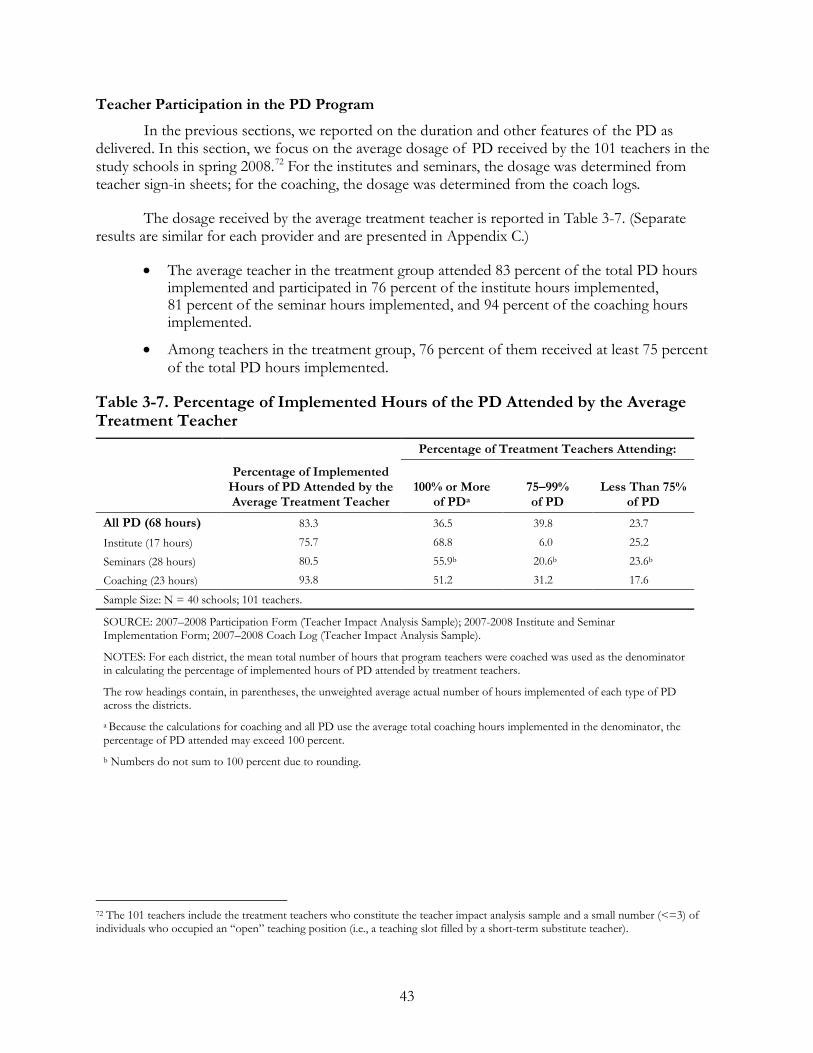
43
Teacher Participation in the PD Program
In the previous sections, we reported on the duration and other features of the PD as delivered. In this section, we focus on the average dosage of PD received by the 101 teachers in the study schools in spring 2008.72
The dosage received by the average treatment teacher is reported in Table 3-7. (Separate results are similar for each provider and are presented in Appendix C.)
For the institutes and seminars, the dosage was determined from teacher sign-in sheets; for the coaching, the dosage was determined from the coach logs.
•
•
The average teacher in the treatment group attended 83 percent of the total PD hours implemented and participated in 76 percent of the institute hours implemented, 81 percent of the seminar hours implemented, and 94 percent of the coaching hours implemented.
Among teachers in the treatment group, 76 percent of them received at least 75 percent of the total PD hours implemented.
Table 3-7. Percentage of Implemented Hours of the PD Attended by the Average Treatment Teacher
Percentage of Implemented Hours of PD Attended by the Average Treatment Teacher
Percentage of Treatment Teachers Attending:
100% or More of PDa
75–99% of PD
Less Than 75% of PD
All PD (68 hours) 83.3 36.5 39.8 23.7
Institute (17 hours) 75.7 68.8 6.0 25.2
Seminars (28 hours) 80.5 55.9b 20.6b 23.6b
Coaching (23 hours) 93.8 51.2 31.2 17.6
Sample Size: N = 40 schools; 101 teachers.
SOURCE: 2007–2008 Participation Form (Teacher Impact Analysis Sample); 2007-2008 Institute and Seminar Implementation Form; 2007–2008 Coach Log (Teacher Impact Analysis Sample).
NOTES: For each district, the mean total number of hours that program teachers were coached was used as the denominator in calculating the percentage of implemented hours of PD attended by treatment teachers.
The row headings contain, in parentheses, the unweighted average actual number of hours implemented of each type of PD across the districts. a Because the calculations for coaching and all PD use the average total coaching hours implemented in the denominator, the percentage of PD attended may exceed 100 percent. b Numbers do not sum to 100 percent due to rounding.
72 The 101 teachers include the treatment teachers who constitute the teacher impact analysis sample and a small number (<=3) of individuals who occupied an “open” teaching position (i.e., a teaching slot filled by a short-term substitute teacher).
44
Comparison of the Professional Development Experienced by Treatment and Control Groups
In addition to the PD program provided by the study to teachers in treatment schools, teachers in both the treatment and control groups could have participated in the other PD provided in their district. Thus, it would be possible for teachers in the treatment group to attend fewer nonstudy PD opportunities than control group teachers, thus reducing the treatment-control contrast in the PD experiences of teachers. To assess whether the PD program as implemented for the study resulted in the intended service contrast between treatment and control groups, we relied on data from the teacher surveys administered in fall 2007 and spring 2008, which asked teachers in both groups to report the number of hours they spent in all workshops or institutes lasting more than a half-day on mathematics and coaching or mentoring related to mathematics during summer 2007 and the 2007–2008 school year.73
As intended, teachers in treatment schools reported experiencing more hours of mathematics PD workshops/institutes and coaching than teachers in control schools. (See Table 3-8.) Specifically, relative to the control group, treatment teachers reported receiving 12.2 more hours of institutes and seminars during summer 2007, when the intended treatment dosage was 18 hours, and receiving 30.3 more hours of institutes and seminars during the 2007–2008 school year, when the intended treatment dosage was 30 hours. (All reported differences were statistically significant.)
In addition, the institutes and seminars received by the treatment teachers significantly more often emphasized topics in rational numbers; more often emphasized pedagogical topics that were part of the PD, or less often emphasized those that were not part of the PD; and more often involved collective participation. (See Table 3-9. All reported differences were statistically significant.)
Analysis of teacher-reported mathematics-related coaching shows that relative to the control group, the treatment group teachers received an average of 6.2 more hours of coaching during the 2007–2008 school year, when the intended dosage was 20 hours. The discrepancy between the intended hours of coaching and the hours reported by the treatment teachers may have occurred because the survey item used to capture teacher participation in workshops or institutes and coaching or mentoring also asked teachers to report participation in “other” forms of PD. This “other” category included as one of several illustrative examples “participated in teacher study groups, networks, or collaborations supporting PD in mathematics,” which could be viewed as an appropriate place to record the group coaching activities provided to the treatment group. Relative to the control group, the treatment group teachers received an average of 7.2 more hours of these “other” forms of PD during the 2007–2008 school year.
In addition, compared with control group teachers, treatment group teachers received coaching that more often used elements of the PD treatment’s coaching cycle (i.e., plan, observe, and debrief) and that more often involved the teacher observing coaches and other teachers. (See Table 3-9. All reported differences were statistically significant.) 73 To estimate the program effect on hours of mathematics PD received, we formulated a two-level model paralleling the models used for the impact analyses for teacher knowledge and instructional practice described in Chapter 2 but including only covariates for treatment group by district and an indicator for block.
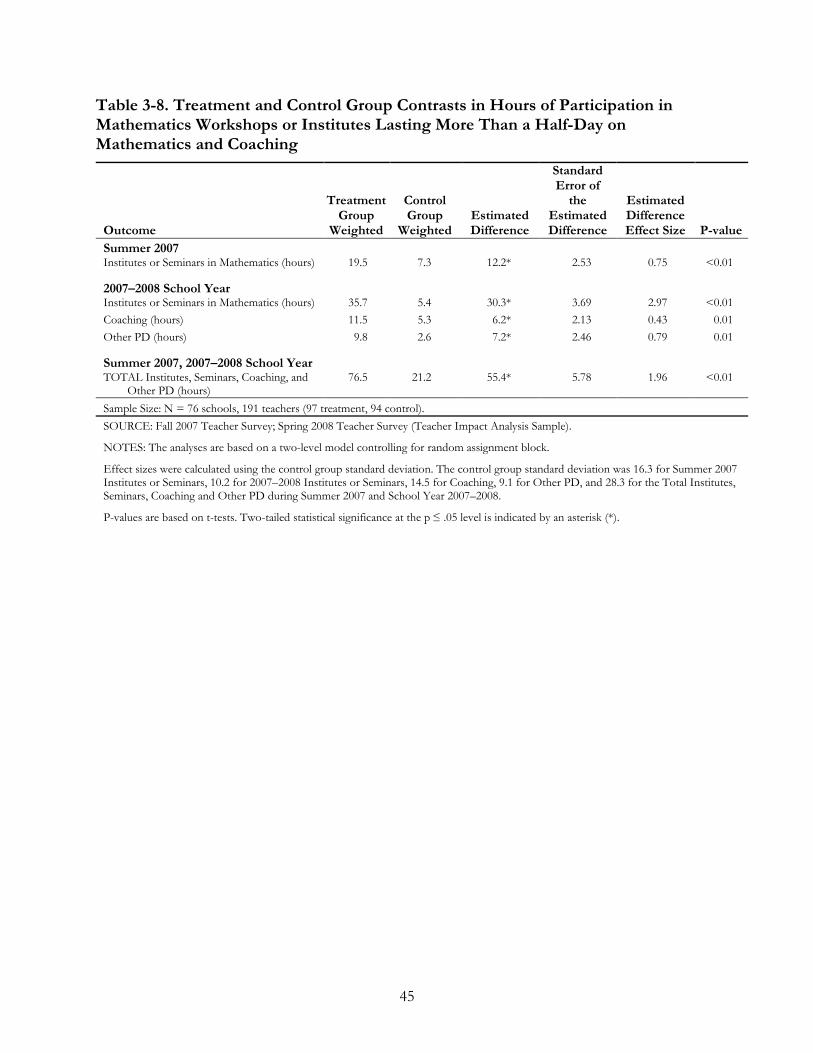
45
Table 3-8. Treatment and Control Group Contrasts in Hours of Participation in Mathematics Workshops or Institutes Lasting More Than a Half-Day on Mathematics and Coaching
Outcome
Treatment Group
Weighted
Control Group
Weighted Estimated Difference
Standard Error of
the Estimated Difference
Estimated Difference Effect Size P-value
Summer 2007 Institutes or Seminars in Mathematics (hours) 19.5 7.3 12.2* 2.53 0.75 <0.01
2007–2008 School Year
Institutes or Seminars in Mathematics (hours) 35.7 5.4 30.3* 3.69 2.97 <0.01 Coaching (hours) 11.5 5.3 6.2* 2.13 0.43 0.01 Other PD (hours) 9.8 2.6 7.2* 2.46 0.79 0.01
Summer 2007, 2007–2008 School Year
TOTAL Institutes, Seminars, Coaching, and Other PD (hours)
76.5 21.2 55.4* 5.78 1.96 <0.01
Sample Size: N = 76 schools, 191 teachers (97 treatment, 94 control). SOURCE: Fall 2007 Teacher Survey; Spring 2008 Teacher Survey (Teacher Impact Analysis Sample).
NOTES: The analyses are based on a two-level model controlling for random assignment block.
Effect sizes were calculated using the control group standard deviation. The control group standard deviation was 16.3 for Summer 2007 Institutes or Seminars, 10.2 for 2007–2008 Institutes or Seminars, 14.5 for Coaching, 9.1 for Other PD, and 28.3 for the Total Institutes, Seminars, Coaching and Other PD during Summer 2007 and School Year 2007–2008.
P-values are based on t-tests. Two-tailed statistical significance at the p ≤ .05 level is indicated by an asterisk (*).
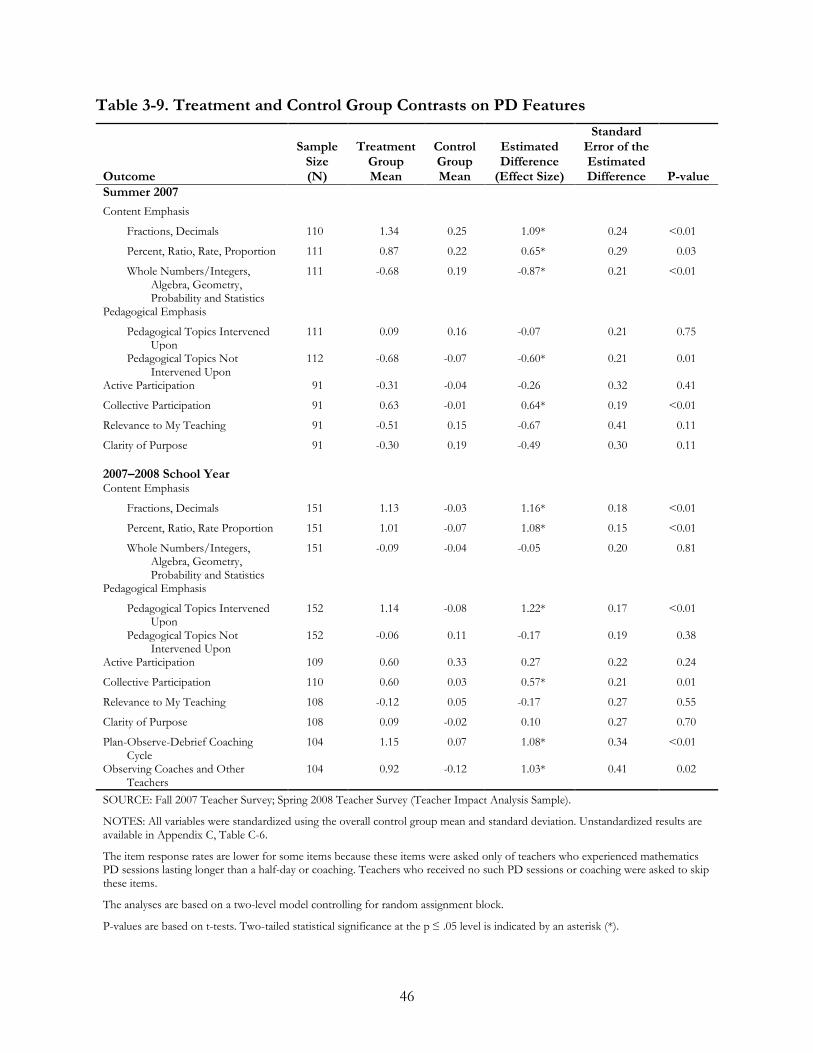
46
Table 3-9. Treatment and Control Group Contrasts on PD Features
Outcome
Sample Size (N)
Treatment Group Mean
Control Group Mean
Estimated Difference
(Effect Size)
Standard Error of the Estimated Difference P-value
Summer 2007
Content Emphasis
Fractions, Decimals 110 1.34 0.25 1.09* 0.24 <0.01
Percent, Ratio, Rate, Proportion 111 0.87 0.22 0.65* 0.29 0.03
Whole Numbers/Integers, Algebra, Geometry, Probability and Statistics
111 -0.68 0.19 -0.87* 0.21 <0.01
Pedagogical Emphasis
Pedagogical Topics Intervened Upon
111 0.09 0.16 -0.07 0.21 0.75
Pedagogical Topics Not Intervened Upon
112 -0.68 -0.07 -0.60* 0.21 0.01
Active Participation 91 -0.31 -0.04 -0.26 0.32 0.41
Collective Participation 91 0.63 -0.01 0.64* 0.19 <0.01
Relevance to My Teaching 91 -0.51 0.15 -0.67 0.41 0.11
Clarity of Purpose 91 -0.30 0.19 -0.49 0.30 0.11
2007–2008 School Year
Content Emphasis
Fractions, Decimals 151 1.13 -0.03 1.16* 0.18 <0.01
Percent, Ratio, Rate Proportion 151 1.01 -0.07 1.08* 0.15 <0.01
Whole Numbers/Integers, Algebra, Geometry, Probability and Statistics
151 -0.09 -0.04 -0.05 0.20 0.81
Pedagogical Emphasis
Pedagogical Topics Intervened Upon
152 1.14 -0.08 1.22* 0.17 <0.01
Pedagogical Topics Not Intervened Upon
152 -0.06 0.11 -0.17 0.19 0.38
Active Participation 109 0.60 0.33 0.27 0.22 0.24
Collective Participation 110 0.60 0.03 0.57* 0.21 0.01
Relevance to My Teaching 108 -0.12 0.05 -0.17 0.27 0.55
Clarity of Purpose 108 0.09 -0.02 0.10 0.27 0.70
Plan-Observe-Debrief Coaching Cycle
104 1.15 0.07 1.08* 0.34 <0.01
Observing Coaches and Other Teachers
104 0.92 -0.12 1.03* 0.41 0.02
SOURCE: Fall 2007 Teacher Survey; Spring 2008 Teacher Survey (Teacher Impact Analysis Sample).
NOTES: All variables were standardized using the overall control group mean and standard deviation. Unstandardized results are available in Appendix C, Table C-6.
The item response rates are lower for some items because these items were asked only of teachers who experienced mathematics PD sessions lasting longer than a half-day or coaching. Teachers who received no such PD sessions or coaching were asked to skip these items.
The analyses are based on a two-level model controlling for random assignment block.
P-values are based on t-tests. Two-tailed statistical significance at the p ≤ .05 level is indicated by an asterisk (*).
47
CHAPTER 4. IMPACT OF THE PD PROGRAM AFTER
THE FIRST YEAR OF IMPLEMENTATION
Chapter 3 described the PD program tested and reported on its implementation, noting the differences between the PD providers. This chapter examines whether the PD had an impact on the three types of outcomes that were the focus of the study: teacher knowledge, teacher instructional practice, and student achievement. The results for the full study sample are reported first, followed by the results for the subgroups of districts defined by the PD provider and for the subgroups of districts defined by the type of mathematics curriculum used in the district.
As explained in Chapter 2, the study randomly assigned schools to treatment and control groups, and all impact estimates are based on an intent-to-treat analysis that includes all teachers in the sample schools at the time of outcome data collection, along with their students.74
The impact tables in this chapter report the effect size, standard error, and p-value for each impact estimate. The effect size indicates the magnitude of the estimated effect, calculated as a proportion of the standard deviation of the outcome measure for the control group. The standard error indicates the magnitude of the uncertainty about the true mean of each impact, given the number of schools, teachers, and students involved in the analysis. The p-value indicates the chance of obtaining an impact as large as the estimated impact if in fact there were no true impact. Results are considered statistically significant if the p-value is 0.05 or lower, indicating that there would be no more than a 5 percent chance of obtaining an impact if there were no true effect. Results that are not statistically significant may have occurred because of chance and thus do not provide strong evidence about the impact of the treatments.
Thus, the impact estimates reflect the impact of assignment to the treatment and control conditions. However, not all teachers who taught in the treatment and control schools at the time of outcome data collection had the opportunity to receive a full dose of the PD program. In Chapter 5, we discuss a nonexperimental analysis focusing on teachers who were present throughout the study.
Impact on Teacher Knowledge
The PD program did not produce a statically significant impact on teachers’ total score on the teacher knowledge test in the first year of implementation. On average, 54.7 percent of teachers in the treatment group answered test items of average difficulty correctly, compared with 50.1 percent of teachers in the control group. To put these results into context, the study also administered the teacher knowledge test to the PD provider staff (i.e., the staff who deliver the institutes, seminars, and coaching). On average, 92.7 percent of the PD provider staff answered test items of average
Table 4-1 presents the impacts of the PD program on the teacher knowledge measures.75,76
74 For more information on the models used to estimate the impacts presented in this chapter, see Chapter 2 and Appendix B. 75 The regression model used in this table is described by Equation B-1 in Appendix B. 76 For more information on the content tested on the teacher knowledge test and on its scaling, see Chapter 2 and Appendix A.
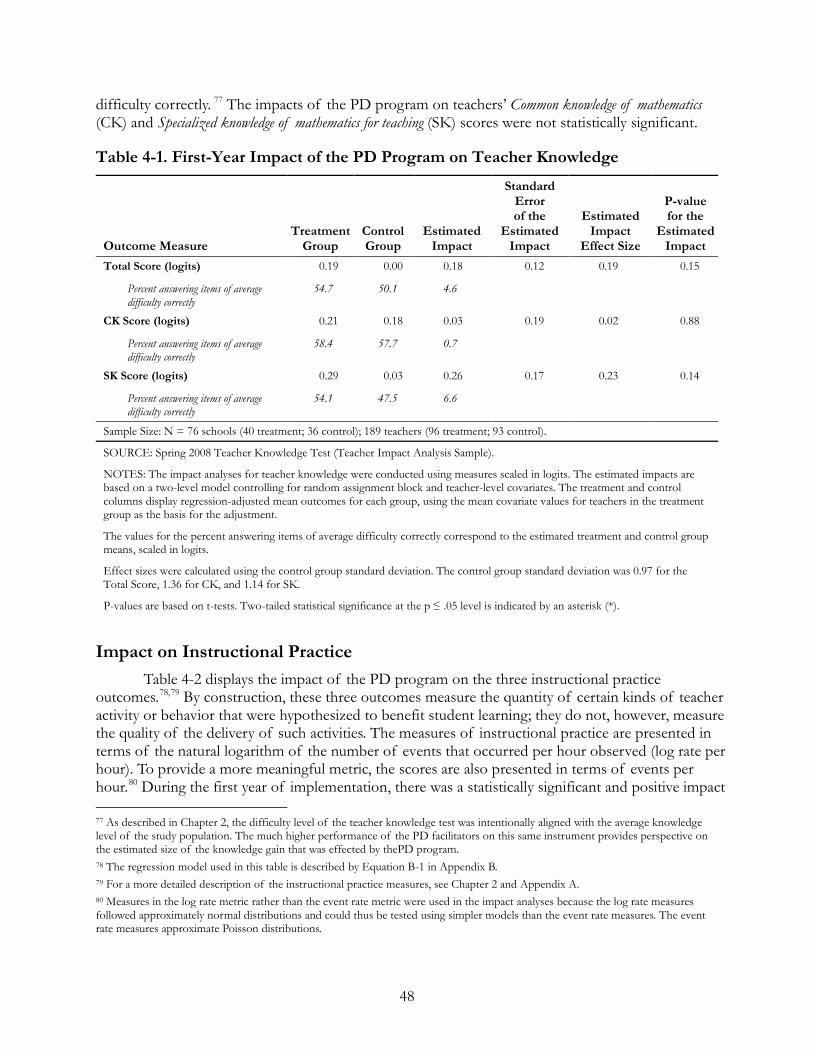
48
difficulty correctly. 77 The impacts of the PD program on teachers’ Common knowledge of mathematics (CK) and Specialized knowledge of mathematics for teaching (SK) scores were not statistically significant.
Table 4-1. First-Year Impact of the PD Program on Teacher Knowledge
Outcome Measure Treatment
Group Control Group
Estimated Impact
Standard Error of the
Estimated Impact
Estimated Impact
Effect Size
P-value for the
Estimated Impact
Total Score (logits) 0.19 0.00 0.18 0.12 0.19 0.15
Percent answering items of average difficulty correctly
54.7 50.1 4.6
CK Score (logits) 0.21 0.18 0.03 0.19 0.02 0.88
Percent answering items of average difficulty correctly
58.4 57.7 0.7
SK Score (logits) 0.29 0.03 0.26 0.17 0.23 0.14
Percent answering items of average difficulty correctly
54.1 47.5 6.6
Sample Size: N = 76 schools (40 treatment; 36 control); 189 teachers (96 treatment; 93 control).
SOURCE: Spring 2008 Teacher Knowledge Test (Teacher Impact Analysis Sample).
NOTES: The impact analyses for teacher knowledge were conducted using measures scaled in logits. The estimated impacts are based on a two-level model controlling for random assignment block and teacher-level covariates. The treatment and control columns display regression-adjusted mean outcomes for each group, using the mean covariate values for teachers in the treatment group as the basis for the adjustment.
The values for the percent answering items of average difficulty correctly correspond to the estimated treatment and control group means, scaled in logits.
Effect sizes were calculated using the control group standard deviation. The control group standard deviation was 0.97 for the Total Score, 1.36 for CK, and 1.14 for SK.
P-values are based on t-tests. Two-tailed statistical significance at the p ≤ .05 level is indicated by an asterisk (*).
Impact on Instructional Practice
Table 4-2 displays the impact of the PD program on the three instructional practice outcomes.78,79 By construction, these three outcomes measure the quantity of certain kinds of teacher activity or behavior that were hypothesized to benefit student learning; they do not, however, measure the quality of the delivery of such activities. The measures of instructional practice are presented in terms of the natural logarithm of the number of events that occurred per hour observed (log rate per hour). To provide a more meaningful metric, the scores are also presented in terms of events per hour.80
77 As described in Chapter 2, the difficulty level of the teacher knowledge test was intentionally aligned with the average knowledge level of the study population. The much higher performance of the PD facilitators on this same instrument provides perspective on the estimated size of the knowledge gain that was effected by thePD program.
During the first year of implementation, there was a statistically significant and positive impact
78 The regression model used in this table is described by Equation B-1 in Appendix B. 79 For a more detailed description of the instructional practice measures, see Chapter 2 and Appendix A. 80 Measures in the log rate metric rather than the event rate metric were used in the impact analyses because the log rate measures followed approximately normal distributions and could thus be tested using simpler models than the event rate measures. The event rate measures approximate Poisson distributions.
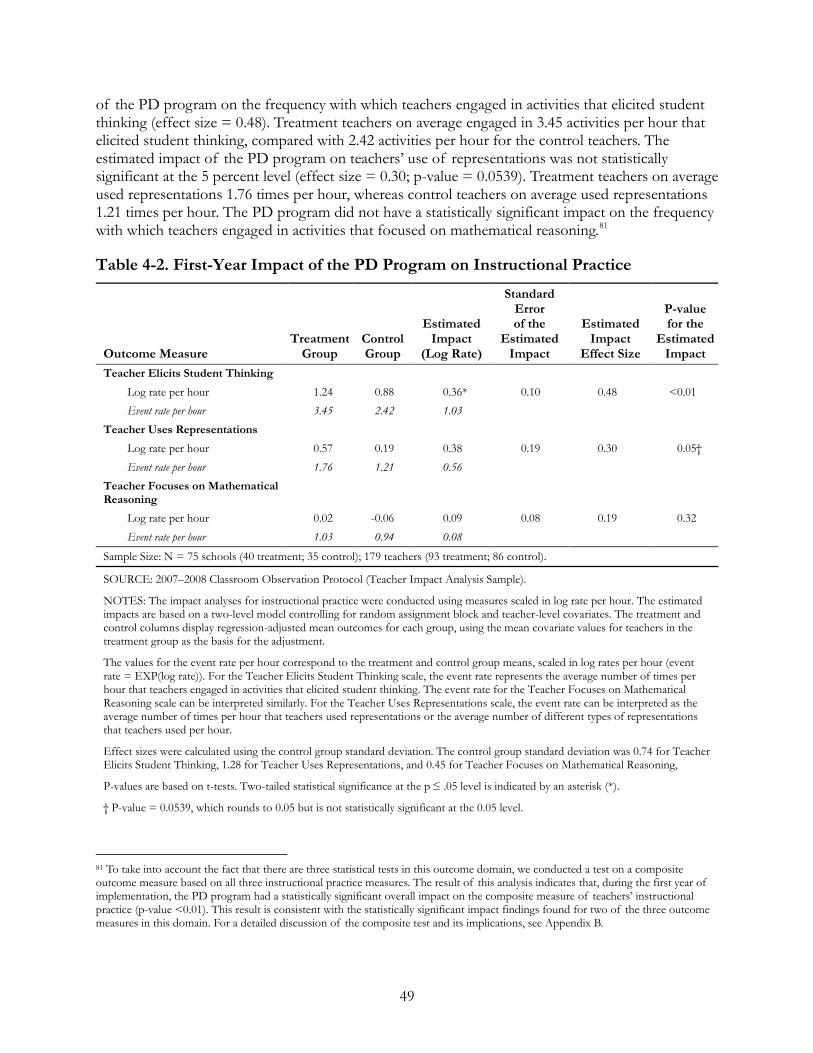
49
of the PD program on the frequency with which teachers engaged in activities that elicited student thinking (effect size = 0.48). Treatment teachers on average engaged in 3.45 activities per hour that elicited student thinking, compared with 2.42 activities per hour for the control teachers. The estimated impact of the PD program on teachers’ use of representations was not statistically significant at the 5 percent level (effect size = 0.30; p-value = 0.0539). Treatment teachers on average used representations 1.76 times per hour, whereas control teachers on average used representations 1.21 times per hour. The PD program did not have a statistically significant impact on the frequency with which teachers engaged in activities that focused on mathematical reasoning.81
Table 4-2. First-Year Impact of the PD Program on Instructional Practice
Outcome Measure Treatment
Group Control Group
Estimated Impact
(Log Rate)
Standard Error of the
Estimated Impact
Estimated Impact
Effect Size
P-value for the
Estimated Impact
Teacher Elicits Student Thinking
Log rate per hour 1.24 0.88 0.36* 0.10 0.48 <0.01 Event rate per hour 3.45 2.42 1.03
Teacher Uses Representations Log rate per hour 0.57 0.19 0.38 0.19 0.30 0.05†
Event rate per hour 1.76 1.21 0.56 Teacher Focuses on Mathematical Reasoning
Log rate per hour 0.02 -0.06 0.09 0.08 0.19 0.32
Event rate per hour 1.03 0.94 0.08
Sample Size: N = 75 schools (40 treatment; 35 control); 179 teachers (93 treatment; 86 control).
SOURCE: 2007–2008 Classroom Observation Protocol (Teacher Impact Analysis Sample).
NOTES: The impact analyses for instructional practice were conducted using measures scaled in log rate per hour. The estimated impacts are based on a two-level model controlling for random assignment block and teacher-level covariates. The treatment and control columns display regression-adjusted mean outcomes for each group, using the mean covariate values for teachers in the treatment group as the basis for the adjustment.
The values for the event rate per hour correspond to the treatment and control group means, scaled in log rates per hour (event rate = EXP(log rate)). For the Teacher Elicits Student Thinking scale, the event rate represents the average number of times per hour that teachers engaged in activities that elicited student thinking. The event rate for the Teacher Focuses on Mathematical Reasoning scale can be interpreted similarly. For the Teacher Uses Representations scale, the event rate can be interpreted as the average number of times per hour that teachers used representations or the average number of different types of representations that teachers used per hour.
Effect sizes were calculated using the control group standard deviation. The control group standard deviation was 0.74 for Teacher Elicits Student Thinking, 1.28 for Teacher Uses Representations, and 0.45 for Teacher Focuses on Mathematical Reasoning,
P-values are based on t-tests. Two-tailed statistical significance at the p ≤ .05 level is indicated by an asterisk (*).
† P-value = 0.0539, which rounds to 0.05 but is not statistically significant at the 0.05 level.
81 To take into account the fact that there are three statistical tests in this outcome domain, we conducted a test on a composite outcome measure based on all three instructional practice measures. The result of this analysis indicates that, during the first year of implementation, the PD program had a statistically significant overall impact on the composite measure of teachers’ instructional practice (p-value <0.01). This result is consistent with the statistically significant impact findings found for two of the three outcome measures in this domain. For a detailed discussion of the composite test and its implications, see Appendix B.
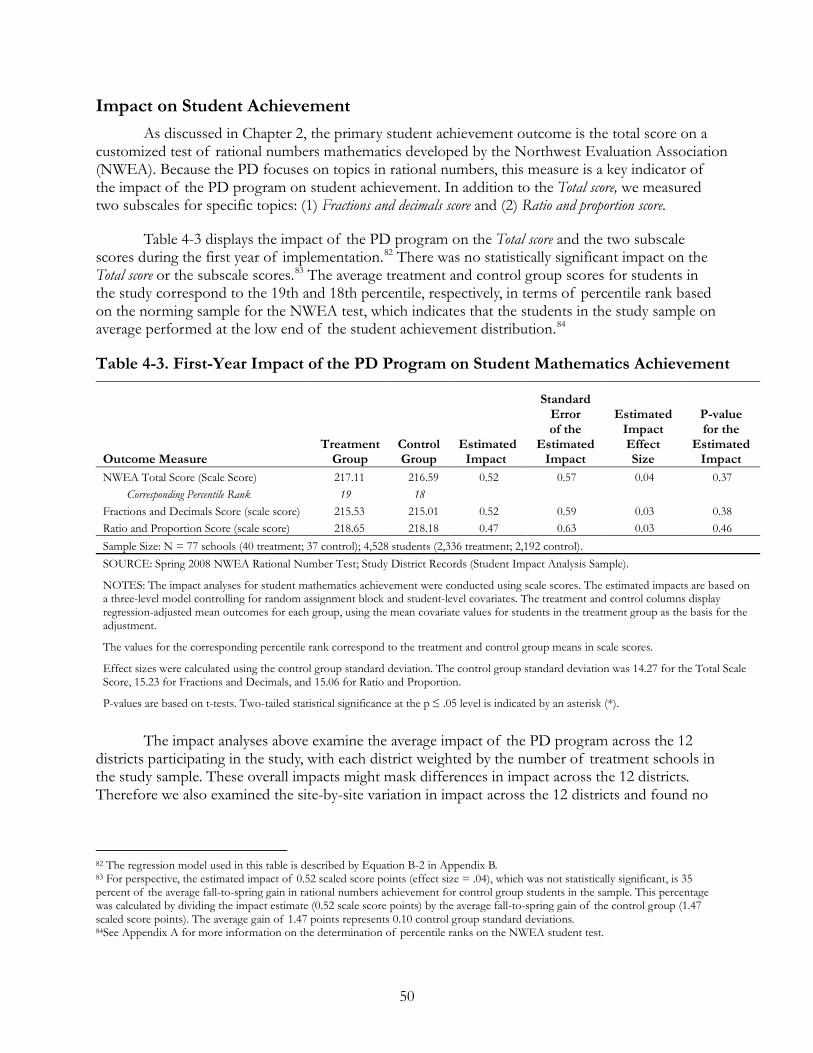
50
Impact on Student Achievement As discussed in Chapter 2, the primary student achievement outcome is the total score on a
customized test of rational numbers mathematics developed by the Northwest Evaluation Association (NWEA). Because the PD focuses on topics in rational numbers, this measure is a key indicator of the impact of the PD program on student achievement. In addition to the Total score, we measured two subscales for specific topics: (1) Fractions and decimals score and (2) Ratio and proportion score.
Table 4-3 displays the impact of the PD program on the Total score and the two subscale scores during the first year of implementation.82 There was no statistically significant impact on the Total score or the subscale scores.83 The average treatment and control group scores for students in the study correspond to the 19th and 18th percentile, respectively, in terms of percentile rank based on the norming sample for the NWEA test, which indicates that the students in the study sample on average performed at the low end of the student achievement distribution.84
Table 4-3. First-Year Impact of the PD Program on Student Mathematics Achievement
Outcome Measure Treatment
Group Control Group
Estimated Impact
Standard Error of the
Estimated Impact
Estimated Impact Effect Size
P-value for the
Estimated Impact
NWEA Total Score (Scale Score) 217.11 216.59 0.52 0.57 0.04 0.37 Corresponding Percentile Rank 19 18
Fractions and Decimals Score (scale score) 215.53 215.01 0.52 0.59 0.03 0.38 Ratio and Proportion Score (scale score) 218.65 218.18 0.47 0.63 0.03 0.46 Sample Size: N = 77 schools (40 treatment; 37 control); 4,528 students (2,336 treatment; 2,192 control). SOURCE: Spring 2008 NWEA Rational Number Test; Study District Records (Student Impact Analysis Sample).
NOTES: The impact analyses for student mathematics achievement were conducted using scale scores. The estimated impacts are based on a three-level model controlling for random assignment block and student-level covariates. The treatment and control columns display regression-adjusted mean outcomes for each group, using the mean covariate values for students in the treatment group as the basis for the adjustment.
The values for the corresponding percentile rank correspond to the treatment and control group means in scale scores.
Effect sizes were calculated using the control group standard deviation. The control group standard deviation was 14.27 for the Total Scale Score, 15.23 for Fractions and Decimals, and 15.06 for Ratio and Proportion.
P-values are based on t-tests. Two-tailed statistical significance at the p ≤ .05 level is indicated by an asterisk (*).
The impact analyses above examine the average impact of the PD program across the 12
districts participating in the study, with each district weighted by the number of treatment schools in the study sample. These overall impacts might mask differences in impact across the 12 districts. Therefore we also examined the site-by-site variation in impact across the 12 districts and found no
82 The regression model used in this table is described by Equation B-2 in Appendix B. 83 For perspective, the estimated impact of 0.52 scaled score points (effect size = .04), which was not statistically significant, is 35 percent of the average fall-to-spring gain in rational numbers achievement for control group students in the sample. This percentage was calculated by dividing the impact estimate (0.52 scale score points) by the average fall-to-spring gain of the control group (1.47 scaled score points). The average gain of 1.47 points represents 0.10 control group standard deviations. 84See Appendix A for more information on the determination of percentile ranks on the NWEA student test.
51
statistically significant variation across districts for all outcome measures. This indicates that the average impact findings reported here were not driven by any unusual sites.85
Impact by PD Provider
The PD program in this study was delivered to the treatment schools by two providers: America’s Choice (AC) and Pearson Achievement Solutions (PAS). Each provider was responsible for implementing the PD program in six school districts. As discussed in detail in Chapter 3, although the study design required both providers to address the same topics in rational numbers, the providers differed in how they organized and presented the material to teachers. In what follows, we assess the impact of the PD program separately for the subgroup of districts assigned to America’s Choice and for the subgroup assigned to Pearson Achievement Solutions. The impact estimates for each provider subgroup are experimental, based on the random assignment of schools to treatment and control within the provider’s districts. However, it is not appropriate to directly compare the impact findings between the two provider subgroups, because the study districts were not randomly assigned to the providers. Thus any observed differences in impact findings between the two subgroups may be due to differences in district characteristics. The sample size for each subgroup is about half that of the overall sample. Thus the minimum detectable effects sizes (MDES) for America‘s Choice are 0.15 for the student achievement measure, 0.64 to 0.70 for the instructional practice measures, and 0.45 for the teacher knowledge measure. The MDES for Pearson Achievement Solutions are 0.19, 0.67 to 1.07, and 0.62 for the respective measures.86
Table 4-4 presents the impact of the PD program on teacher knowledge, instructional practice, and student mathematics achievement for districts that received PD from America’s Choice.
87
•
•
•
None of the impacts on the teacher knowledge measures (Total score, CK score, and SK score) was statistically significant. The Total score effect size was 0.31 (p-value = 0.06), and the SK score effect size was 0.32 (p-value = 0.10).
The PD program showed statistically significant impacts on two of the three measures of instructional practice: the Teacher elicits student thinking scale (effect size = 0.63) and the Teacher uses representations scale (effect size = 0.60). The PD program did not have a statistically significant impact on the third measure, Teacher focuses on mathematical reasoning.
The PD program also did not have a statistically significant impact on students’ Total scale score, or on the Fractions and decimals score or the Ratio and proportion score.
85 Exhibits D-1 to D-5 in Appendix D graphically illustrate the impact estimates and 95 percent confidence intervals for the main outcome measures in the study by site. These figures provide a visual representation of the variability in impacts as well as the uncertainty in the estimate for each district. Statistical tests suggested no statistically significant variations across sites. The p-values for these tests are 0.75 for Total knowledge, 0.69 for CK, 0.45 for SK; 0.94 for Teacher focuses on mathematical reasoning, 0.30 for Teacher elicits student thinking, and 0.17 for Teacher uses representations; 0.89 for the Total scale score, 0.89 for the Fractions and decimals score, and 0.81 for the Ratio and proportion score. 86 See Chapter 2, Table 2-9. 87 The regression models used in this table are described by Equations B-1(for teacher outcomes) and B-2 (for student outcomes) in Appendix B.
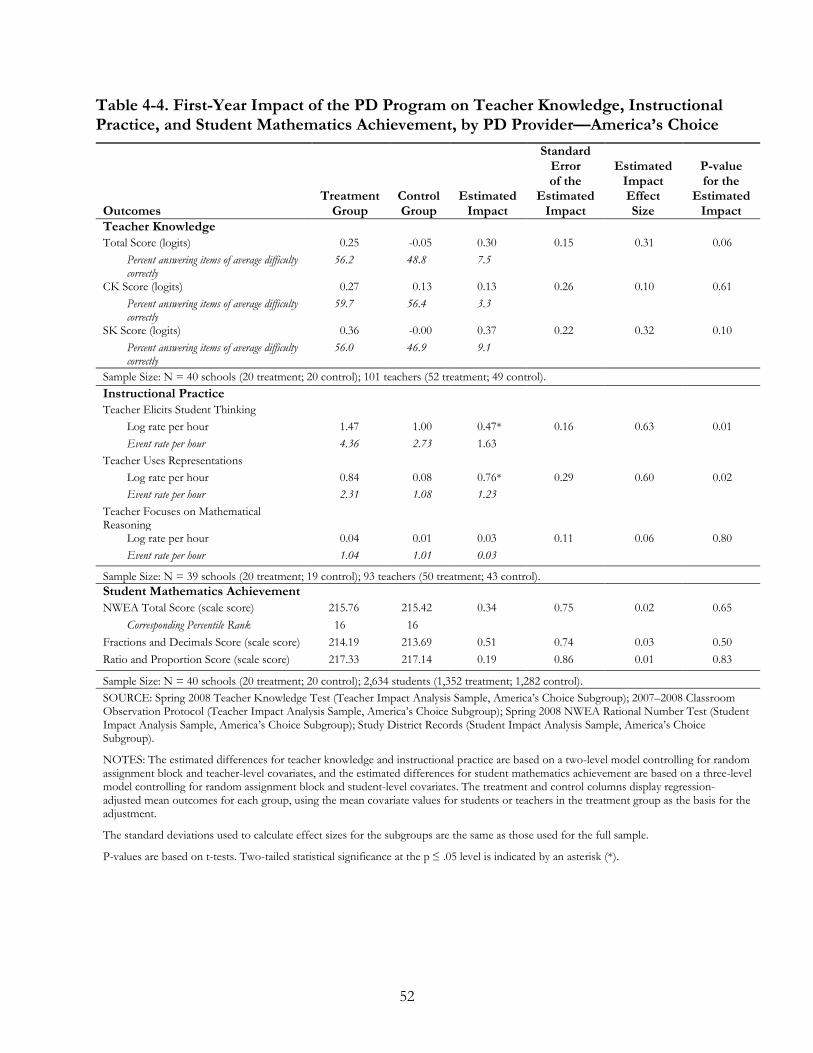
52
Table 4-4. First-Year Impact of the PD Program on Teacher Knowledge, Instructional Practice, and Student Mathematics Achievement, by PD Provider—America’s Choice
Outcomes Treatment
Group Control Group
Estimated Impact
Standard Error of the
Estimated Impact
Estimated Impact Effect Size
P-value for the
Estimated Impact
Teacher Knowledge Total Score (logits) 0.25 -0.05 0.30 0.15 0.31 0.06
Percent answering items of average difficulty correctly
56.2 48.8 7.5
CK Score (logits) 0.27 0.13 0.13 0.26 0.10 0.61 Percent answering items of average difficulty correctly
59.7 56.4 3.3
SK Score (logits) 0.36 -0.00 0.37 0.22 0.32 0.10 Percent answering items of average difficulty correctly
56.0 46.9 9.1
Sample Size: N = 40 schools (20 treatment; 20 control); 101 teachers (52 treatment; 49 control). Instructional Practice Teacher Elicits Student Thinking
Log rate per hour 1.47 1.00 0.47* 0.16 0.63 0.01 Event rate per hour 4.36 2.73 1.63
Teacher Uses Representations Log rate per hour 0.84 0.08 0.76* 0.29 0.60 0.02 Event rate per hour 2.31 1.08 1.23
Teacher Focuses on Mathematical Reasoning
Log rate per hour 0.04 0.01 0.03 0.11 0.06 0.80 Event rate per hour 1.04 1.01 0.03
Sample Size: N = 39 schools (20 treatment; 19 control); 93 teachers (50 treatment; 43 control). Student Mathematics Achievement NWEA Total Score (scale score) 215.76 215.42 0.34 0.75 0.02 0.65
Corresponding Percentile Rank 16 16 Fractions and Decimals Score (scale score) 214.19 213.69 0.51 0.74 0.03 0.50 Ratio and Proportion Score (scale score) 217.33 217.14 0.19 0.86 0.01 0.83
Sample Size: N = 40 schools (20 treatment; 20 control); 2,634 students (1,352 treatment; 1,282 control). SOURCE: Spring 2008 Teacher Knowledge Test (Teacher Impact Analysis Sample, America’s Choice Subgroup); 2007–2008 Classroom Observation Protocol (Teacher Impact Analysis Sample, America’s Choice Subgroup); Spring 2008 NWEA Rational Number Test (Student Impact Analysis Sample, America’s Choice Subgroup); Study District Records (Student Impact Analysis Sample, America’s Choice Subgroup).
NOTES: The estimated differences for teacher knowledge and instructional practice are based on a two-level model controlling for random assignment block and teacher-level covariates, and the estimated differences for student mathematics achievement are based on a three-level model controlling for random assignment block and student-level covariates. The treatment and control columns display regression-adjusted mean outcomes for each group, using the mean covariate values for students or teachers in the treatment group as the basis for the adjustment.
The standard deviations used to calculate effect sizes for the subgroups are the same as those used for the full sample.
P-values are based on t-tests. Two-tailed statistical significance at the p ≤ .05 level is indicated by an asterisk (*).
53
Table 4-5 presents the impact of the PD program on teacher knowledge, instructional practice, and student mathematics achievement for districts that received PD from Pearson Achievement Solutions.88
•
•
•
The estimated impact on teachers’ Total knowledge was not statistically significant. In addition, the Pearson Achievement Solutions PD did not have a significant impact on the teacher knowledge subscale scores.
For instructional practice, the estimated impacts on Teacher focuses on mathematical reasoning, Teacher elicits student thinking, and Teacher uses representations were all statistically insignificant.
The PD did not have a statistically significant impact on the student achievement Total scale score or on either of the two subscale scores.
88 The regression models used in this table are described by Equations B-1(for teacher outcomes) and B-2 (for student outcomes) in Appendix B.
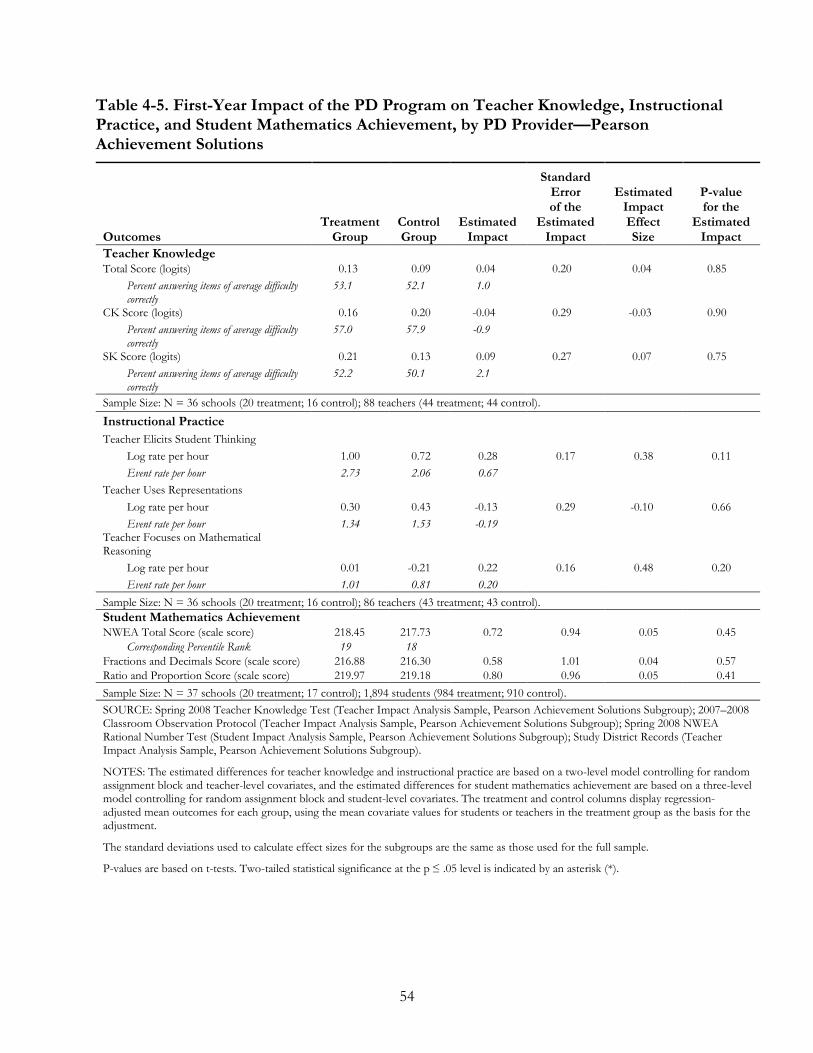
54
Table 4-5. First-Year Impact of the PD Program on Teacher Knowledge, Instructional Practice, and Student Mathematics Achievement, by PD Provider—Pearson Achievement Solutions
Outcomes Treatment
Group Control Group
Estimated Impact
Standard Error of the
Estimated Impact
Estimated Impact Effect Size
P-value for the
Estimated Impact
Teacher Knowledge Total Score (logits) 0.13 0.09 0.04 0.20 0.04 0.85
Percent answering items of average difficulty correctly
53.1 52.1 1.0
CK Score (logits) 0.16 0.20 -0.04 0.29 -0.03 0.90 Percent answering items of average difficulty correctly
57.0 57.9 -0.9
SK Score (logits) 0.21 0.13 0.09 0.27 0.07 0.75 Percent answering items of average difficulty correctly
52.2 50.1 2.1
Sample Size: N = 36 schools (20 treatment; 16 control); 88 teachers (44 treatment; 44 control).
Instructional Practice
Teacher Elicits Student Thinking Log rate per hour 1.00 0.72 0.28 0.17 0.38 0.11 Event rate per hour 2.73 2.06 0.67
Teacher Uses Representations Log rate per hour 0.30 0.43 -0.13 0.29 -0.10 0.66 Event rate per hour 1.34 1.53 -0.19
Teacher Focuses on Mathematical Reasoning
Log rate per hour 0.01 -0.21 0.22 0.16 0.48 0.20 Event rate per hour 1.01 0.81 0.20
Sample Size: N = 36 schools (20 treatment; 16 control); 86 teachers (43 treatment; 43 control). Student Mathematics Achievement NWEA Total Score (scale score) 218.45 217.73 0.72 0.94 0.05 0.45
Corresponding Percentile Rank 19 18 Fractions and Decimals Score (scale score) 216.88 216.30 0.58 1.01 0.04 0.57 Ratio and Proportion Score (scale score) 219.97 219.18 0.80 0.96 0.05 0.41 Sample Size: N = 37 schools (20 treatment; 17 control); 1,894 students (984 treatment; 910 control). SOURCE: Spring 2008 Teacher Knowledge Test (Teacher Impact Analysis Sample, Pearson Achievement Solutions Subgroup); 2007–2008 Classroom Observation Protocol (Teacher Impact Analysis Sample, Pearson Achievement Solutions Subgroup); Spring 2008 NWEA Rational Number Test (Student Impact Analysis Sample, Pearson Achievement Solutions Subgroup); Study District Records (Teacher Impact Analysis Sample, Pearson Achievement Solutions Subgroup).
NOTES: The estimated differences for teacher knowledge and instructional practice are based on a two-level model controlling for random assignment block and teacher-level covariates, and the estimated differences for student mathematics achievement are based on a three-level model controlling for random assignment block and student-level covariates. The treatment and control columns display regression-adjusted mean outcomes for each group, using the mean covariate values for students or teachers in the treatment group as the basis for the adjustment.
The standard deviations used to calculate effect sizes for the subgroups are the same as those used for the full sample.
P-values are based on t-tests. Two-tailed statistical significance at the p ≤ .05 level is indicated by an asterisk (*).
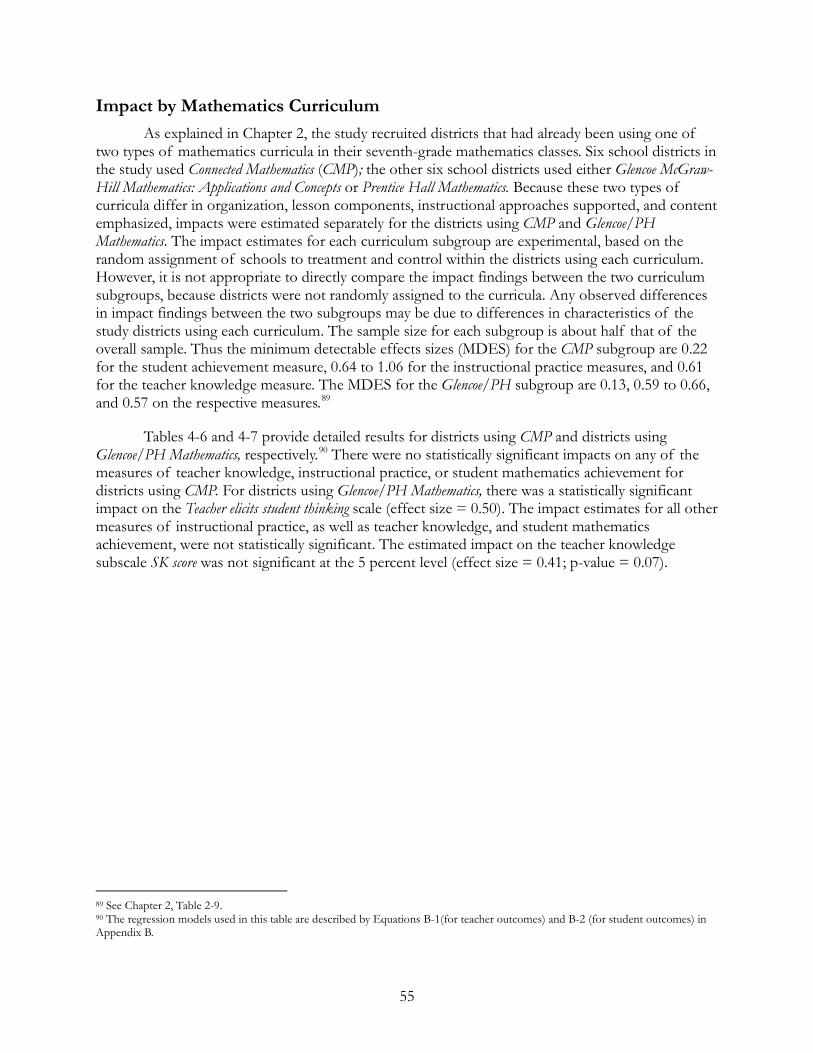
55
Impact by Mathematics Curriculum As explained in Chapter 2, the study recruited districts that had already been using one of
two types of mathematics curricula in their seventh-grade mathematics classes. Six school districts in the study used Connected Mathematics (CMP); the other six school districts used either Glencoe McGraw-Hill Mathematics: Applications and Concepts or Prentice Hall Mathematics. Because these two types of curricula differ in organization, lesson components, instructional approaches supported, and content emphasized, impacts were estimated separately for the districts using CMP and Glencoe/PH Mathematics. The impact estimates for each curriculum subgroup are experimental, based on the random assignment of schools to treatment and control within the districts using each curriculum. However, it is not appropriate to directly compare the impact findings between the two curriculum subgroups, because districts were not randomly assigned to the curricula. Any observed differences in impact findings between the two subgroups may be due to differences in characteristics of the study districts using each curriculum. The sample size for each subgroup is about half that of the overall sample. Thus the minimum detectable effects sizes (MDES) for the CMP subgroup are 0.22 for the student achievement measure, 0.64 to 1.06 for the instructional practice measures, and 0.61 for the teacher knowledge measure. The MDES for the Glencoe/PH subgroup are 0.13, 0.59 to 0.66, and 0.57 on the respective measures.89
Tables 4-6 and 4-7 provide detailed results for districts using CMP and districts using Glencoe/PH Mathematics, respectively.
90
There were no statistically significant impacts on any of the measures of teacher knowledge, instructional practice, or student mathematics achievement for districts using CMP. For districts using Glencoe/PH Mathematics, there was a statistically significant impact on the Teacher elicits student thinking scale (effect size = 0.50). The impact estimates for all other measures of instructional practice, as well as teacher knowledge, and student mathematics achievement, were not statistically significant. The estimated impact on the teacher knowledge subscale SK score was not significant at the 5 percent level (effect size = 0.41; p-value = 0.07).
89 See Chapter 2, Table 2-9. 90 The regression models used in this table are described by Equations B-1(for teacher outcomes) and B-2 (for student outcomes) in Appendix B.
56
Table 4-6. First-Year Impact of the PD Program on Teacher Knowledge, Instructional Practice, and Student Mathematics Achievement, by Mathematics Curriculum—CMP
Outcomes Treatment
Group Control Group
Estimated Impact
Standard Error of the
Estimated Impact
Estimated Impact Effect Size
P-value for the
Estimated Impact
Teacher Knowledge Total Score (logits) 0.39 0.40 -0.01 0.20 -0.01 0.97
Percent answering items of average difficulty correctly
59.7 59.8 -0.2
CK Score (logits) 0.43 0.67 -0.23 0.29 -0.17 0.43 Percent answering items of average difficulty correctly
63.6 68.9 -5.2
SK Score (logits) 0.46 0.43 0.03 0.29 0.03 0.92 Percent answering items of average difficulty correctly
58.3 57.5 0.8
Sample Size: N = 35 schools (19 treatment; 16 control); 86 teachers (42 treatment; 44 control).
Instructional Practice
Teacher Elicits Student Thinking Log rate per hour 1.59 1.33 0.26 0.17 0.36 0.14 Event rate per hour 4.91 3.77 1.14
Teacher Uses Representations Log rate per hour 0.52 0.12 0.40 0.28 0.32 0.16 Event rate per hour 1.69 1.13 0.56
Teacher Focuses on Mathematical Reasoning
Log rate per hour 0.03 -0.02 0.05 0.16 0.12 0.75 Event rate per hour 1.03 0.98 0.05
Sample Size: N = 35 schools (19 treatment; 16 control); 82 teachers (40 treatment; 42 control). Student Mathematics Achievement NWEA Total Score (scale score) 219.23 218.75 0.48 1.08 0.03 0.66
Corresponding Percentile Rank 20 19 Fractions and Decimals Score (scale score) 217.47 217.30 0.18 1.08 0.01 0.87 Ratio and Proportion Score (scale score) 220.98 220.26 0.72 1.15 0.05 0.54 Sample Size: N = 36 schools (19 treatment; 17 control); 1,918 students (949 treatment; 969 control). SOURCE: Spring 2008 Teacher Knowledge Test (Teacher Impact Analysis Sample, CMP Subgroup); 2007–2008 Classroom Observation Protocol (Teacher Impact Analysis Sample, CMP Subgroup); Spring 2008 NWEA Rational Number Test (Student Impact Analysis Sample, CMP Subgroup); Study District Records (Student Impact Analysis Sample, CMP Subgroup).
NOTES: The estimated differences for teacher knowledge and instructional practice are based on a two-level model controlling for random assignment block and teacher-level covariates, and the estimated differences for student mathematics achievement are based on a three-level model controlling for random assignment block and student-level covariates. The treatment and control columns display regression-adjusted mean outcomes for each group, using the mean covariate values for students or teachers in the treatment group as the basis for the adjustment.
The standard deviations used to calculate effect sizes for the subgroups are the same as those used for the full sample.
P-values are based on t-tests. Two-tailed statistical significance at the p ≤ .05 level is indicated by an asterisk (*).
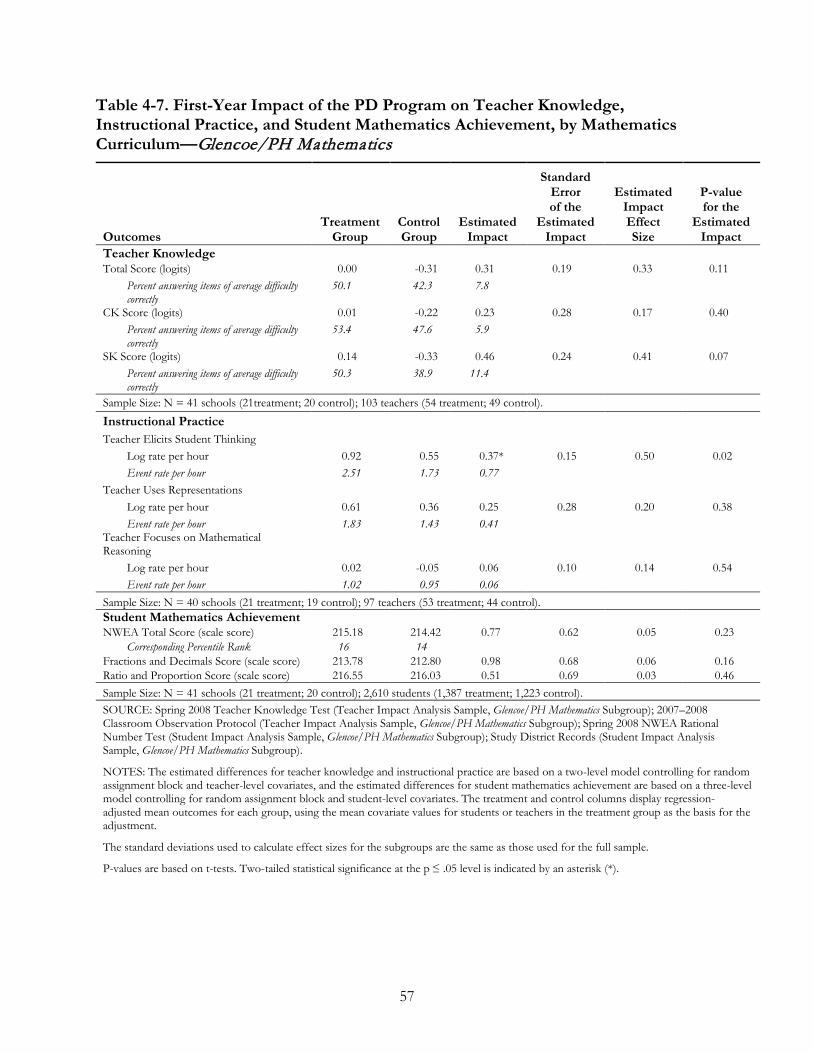
57
Table 4-7. First-Year Impact of the PD Program on Teacher Knowledge, Instructional Practice, and Student Mathematics Achievement, by Mathematics Curriculum—Glencoe/PH Mathematics
Outcomes Treatment
Group Control Group
Estimated Impact
Standard Error of the
Estimated Impact
Estimated Impact Effect Size
P-value for the
Estimated Impact
Teacher Knowledge Total Score (logits) 0.00 -0.31 0.31 0.19 0.33 0.11
Percent answering items of average difficulty correctly
50.1 42.3 7.8
CK Score (logits) 0.01 -0.22 0.23 0.28 0.17 0.40 Percent answering items of average difficulty correctly
53.4 47.6 5.9
SK Score (logits) 0.14 -0.33 0.46 0.24 0.41 0.07 Percent answering items of average difficulty correctly
50.3 38.9 11.4
Sample Size: N = 41 schools (21treatment; 20 control); 103 teachers (54 treatment; 49 control).
Instructional Practice
Teacher Elicits Student Thinking Log rate per hour 0.92 0.55 0.37* 0.15 0.50 0.02 Event rate per hour 2.51 1.73 0.77
Teacher Uses Representations Log rate per hour 0.61 0.36 0.25 0.28 0.20 0.38 Event rate per hour 1.83 1.43 0.41
Teacher Focuses on Mathematical Reasoning
Log rate per hour 0.02 -0.05 0.06 0.10 0.14 0.54 Event rate per hour 1.02 0.95 0.06
Sample Size: N = 40 schools (21 treatment; 19 control); 97 teachers (53 treatment; 44 control). Student Mathematics Achievement NWEA Total Score (scale score) 215.18 214.42 0.77 0.62 0.05 0.23
Corresponding Percentile Rank 16 14 Fractions and Decimals Score (scale score) 213.78 212.80 0.98 0.68 0.06 0.16 Ratio and Proportion Score (scale score) 216.55 216.03 0.51 0.69 0.03 0.46 Sample Size: N = 41 schools (21 treatment; 20 control); 2,610 students (1,387 treatment; 1,223 control). SOURCE: Spring 2008 Teacher Knowledge Test (Teacher Impact Analysis Sample, Glencoe/PH Mathematics Subgroup); 2007–2008 Classroom Observation Protocol (Teacher Impact Analysis Sample, Glencoe/PH Mathematics Subgroup); Spring 2008 NWEA Rational Number Test (Student Impact Analysis Sample, Glencoe/PH Mathematics Subgroup); Study District Records (Student Impact Analysis Sample, Glencoe/PH Mathematics Subgroup).
NOTES: The estimated differences for teacher knowledge and instructional practice are based on a two-level model controlling for random assignment block and teacher-level covariates, and the estimated differences for student mathematics achievement are based on a three-level model controlling for random assignment block and student-level covariates. The treatment and control columns display regression-adjusted mean outcomes for each group, using the mean covariate values for students or teachers in the treatment group as the basis for the adjustment.
The standard deviations used to calculate effect sizes for the subgroups are the same as those used for the full sample.
P-values are based on t-tests. Two-tailed statistical significance at the p ≤ .05 level is indicated by an asterisk (*).
58
Summary This chapter reported the impact of the PD program during the first year of
implementation, focusing on three sets of outcomes: teachers’ knowledge of rational number content and pedagogy, teachers’ instructional practice, and student achievement in rational numbers. The results indicate that the PD program did not have a statistically significant impact on teacher knowledge. It had a significant positive impact on the frequency with which teachers engaged in activities intended to elicit student thinking, one of the study’s three measures of instructional practice, but it did not have a statistically significant impact on the other two measures of instruction. The PD program did not have a statistically significant impact on student achievement in rational numbers.
These results should be interpreted in the context of the study’s settings, measures, and statistical power. The study examined the impact of the PD program as implemented by two providers in 12 districts. On average, students in the study schools entered 7th grade substantially below grade level, scoring at the 19th percentile on the study’s measure of achievement in rational numbers. One strength of the study is that it assessed the impact of the PD program on teacher knowledge and instruction, in addition to student achievement. The instructional practice measures, however, focused only on the frequency with which teachers engaged in specific practices, not the quality with which the practices were implemented. Further, although the study met the targets set for statistical power, the sample size and the reliability of the teacher measures limited the precision of the estimated effects on teacher knowledge and instruction.
The results reported here are based on a single year of implementation of the PD program, in the 2007-2008 school year. During the 2008–2009 school year, in 6 of the 12 study districts, teachers in schools randomly assigned to the treatment condition were provided with the opportunity to participate in a second year of PD focused on rational numbers. The next report from the Middle School Mathematics PD Impact Study will provide evidence on the impact of the full, two-year PD program.
59
CHAPTER 5. EXPLORATORY ANALYSES
The impact results reported in Chapter 4 indicate that the PD program we studied produced a positive and statistically significant impact on one measure of teacher instructional practices, but it did not produce a statistically significant impact on teacher knowledge or on student achievement in rational numbers.
To add to the experimental results, this chapter explores additional questions that can be examined using nonexperimental methods. The study was not designed to provide a rigorous test of the questions we explore in this chapter, so the results presented here should be viewed as suggestive. The chapter examines whether the impact results may have been influenced by teacher turnover; whether the impact results may have varied for teachers with differing levels of baseline knowledge; whether the impact on student achievement may have varied for students with differing levels of baseline achievement; and whether the hypothesized mediating variables (teacher knowledge and instructional practice) are related to student achievement as anticipated in the study’s theory of action.
Teacher Turnover During the First Implementation Year During the first implementation year, some teachers who had been participants in the study
were reassigned to ineligible classes or left their schools, and they were replaced by new teachers who, because they arrived at their schools after the school year had begun, did not have the opportunity to participate in the full PD treatment. To explore whether the impact results may have been influenced by teacher turnover, we conducted an analysis of stable teachers—a subgroup of teachers who were in the study throughout the first implementation year—as well as the students of stable teachers.91
Overall, by the end of spring 2008, among the 193 teachers in the fall sample, 91 percent were still teaching eligible mathematics classes in the same study schools. This yielded a stable teacher subgroup of 178 teachers—90 from treatment schools and 88 from control schools. As shown in Tables B-30 and B-31 in Appendix B, there was no systematic treatment-control difference in the observed school, teacher, and student characteristics of the stable teacher subgroup.
Because the treatment could have influenced the turnover pattern of teachers and consequently the composition of the stable teacher subgroup, these analyses should be viewed as nonexperimental.
The results of this analysis, reported in Table 5-1,92
The stable teacher results for the instructional practice outcomes also largely parallel those for the full teacher sample. The program produced statistically significant differences between the
indicate that the PD program did not produce a statistically significant difference between the stable teachers in the treatment group and those in the control group on their Total score, CK score, or SK score. This parallels the results for the full sample of teachers.
91 The definition of the stable teacher sample is provided in Chapter 2, and further detail appears in Appendix B. 92 The regression models used in this table are described by Equations B-1(for teacher outcomes) and B-2 (for student outcomes) in Appendix B.

60
stable teachers in the treatment group and those in the control group on two practice outcomes—Teacher elicits student thinking and Teacher uses representations—with effect sizes and p-values similar to those reported in Chapter 4 for the full sample, although the p-value for the full sample impact on Teacher uses representations was not statistically significant (p-value = 0.0539). Finally, paralleling the results for the full sample of teachers, the program did not produce a statistically significant treatment-control difference for students of stable teachers on the NWEA rational number test Total scale score or the subscale scores.
This result is not surprising given that 91 percent of the teachers in the study sample were stable during the first implementation year. We expect more teacher turnover between the first and second implementation years because teachers tend to switch grade levels and move in and out of schools during the summer.
Differential Effects Based on Baseline Teacher Knowledge Teachers varied in their level of baseline knowledge of rational numbers content and
pedagogy, and it is possible that the PD program was differentially effective for teachers with different levels of knowledge. For example, if the PD was too challenging for teachers with lower starting levels, teachers with better knowledge at the start of the program may have benefitted more from the PD program than teachers who began with lower levels of knowledge. Or, conversely, teachers with higher starting levels may have benefited less from it because the PD program was too easy for them.
To examine the possibility of differential effectiveness for teachers with different levels of baseline knowledge, we estimated models that contain the main effect of the treatment, baseline teacher knowledge, and the interaction between the two.93 The estimated coefficient for this interaction term provides information on whether the PD program affected teachers differentially, depending on their initial levels of knowledge. The nested structure of the model and the other control variables in the model are the same as those of the basic impact models used in Chapter 4.94
These analyses necessarily focus on the sample of teachers with nonmissing baseline teacher measures and should therefore be viewed as nonexperimental.
93 Note that in taking this approach, we implicitly assume that the relationship between the magnitude of the treatment impact and the baseline teacher knowledge test total score is linear. 94 See Appendix E for details of the models used in this analysis.
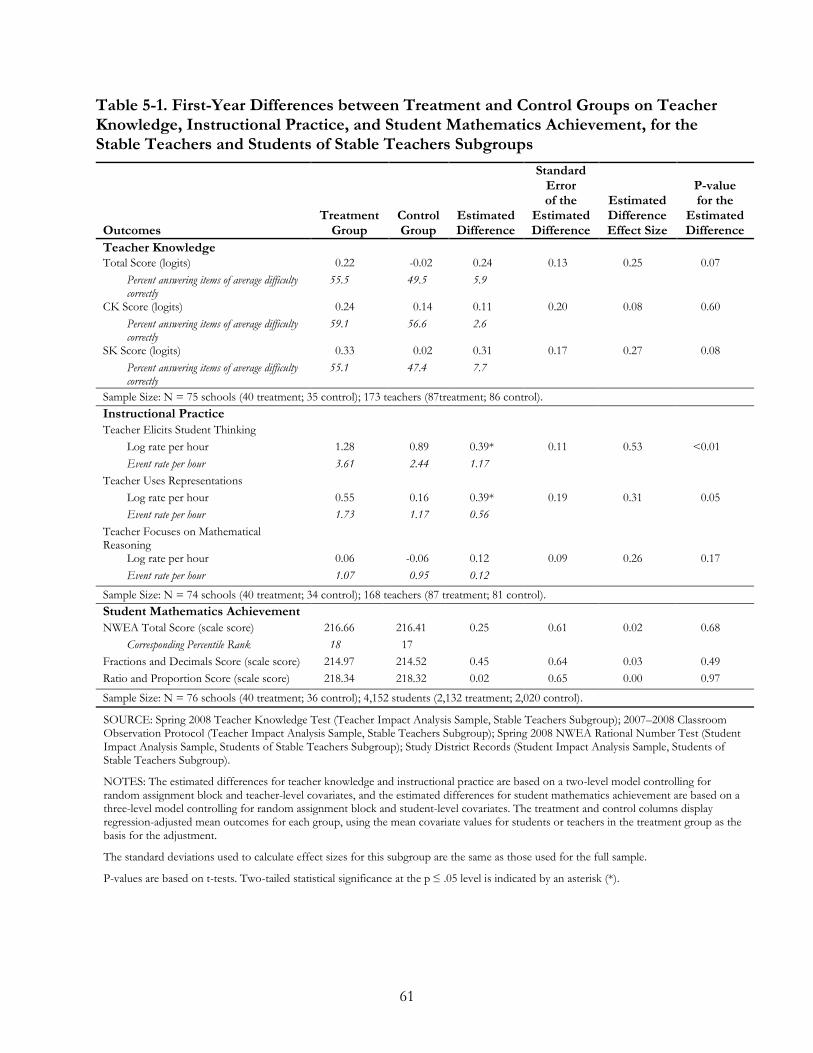
61
Table 5-1. First-Year Differences between Treatment and Control Groups on Teacher Knowledge, Instructional Practice, and Student Mathematics Achievement, for the Stable Teachers and Students of Stable Teachers Subgroups
Outcomes Treatment
Group Control Group
Estimated Difference
Standard Error of the
Estimated Difference
Estimated Difference Effect Size
P-value for the
Estimated Difference
Teacher Knowledge Total Score (logits) 0.22 -0.02 0.24 0.13 0.25 0.07
Percent answering items of average difficulty correctly
55.5 49.5 5.9
CK Score (logits) 0.24 0.14 0.11 0.20 0.08 0.60 Percent answering items of average difficulty correctly
59.1 56.6 2.6
SK Score (logits) 0.33 0.02 0.31 0.17 0.27 0.08 Percent answering items of average difficulty correctly
55.1 47.4 7.7
Sample Size: N = 75 schools (40 treatment; 35 control); 173 teachers (87treatment; 86 control). Instructional Practice Teacher Elicits Student Thinking
Log rate per hour 1.28 0.89 0.39* 0.11 0.53 <0.01 Event rate per hour 3.61 2.44 1.17
Teacher Uses Representations Log rate per hour 0.55 0.16 0.39* 0.19 0.31 0.05 Event rate per hour 1.73 1.17 0.56
Teacher Focuses on Mathematical Reasoning
Log rate per hour 0.06 -0.06 0.12 0.09 0.26 0.17 Event rate per hour 1.07 0.95 0.12
Sample Size: N = 74 schools (40 treatment; 34 control); 168 teachers (87 treatment; 81 control). Student Mathematics Achievement NWEA Total Score (scale score) 216.66 216.41 0.25 0.61 0.02 0.68
Corresponding Percentile Rank 18 17 Fractions and Decimals Score (scale score) 214.97 214.52 0.45 0.64 0.03 0.49 Ratio and Proportion Score (scale score) 218.34 218.32 0.02 0.65 0.00 0.97
Sample Size: N = 76 schools (40 treatment; 36 control); 4,152 students (2,132 treatment; 2,020 control).
SOURCE: Spring 2008 Teacher Knowledge Test (Teacher Impact Analysis Sample, Stable Teachers Subgroup); 2007–2008 Classroom Observation Protocol (Teacher Impact Analysis Sample, Stable Teachers Subgroup); Spring 2008 NWEA Rational Number Test (Student Impact Analysis Sample, Students of Stable Teachers Subgroup); Study District Records (Student Impact Analysis Sample, Students of Stable Teachers Subgroup).
NOTES: The estimated differences for teacher knowledge and instructional practice are based on a two-level model controlling for random assignment block and teacher-level covariates, and the estimated differences for student mathematics achievement are based on a three-level model controlling for random assignment block and student-level covariates. The treatment and control columns display regression-adjusted mean outcomes for each group, using the mean covariate values for students or teachers in the treatment group as the basis for the adjustment.
The standard deviations used to calculate effect sizes for this subgroup are the same as those used for the full sample.
P-values are based on t-tests. Two-tailed statistical significance at the p ≤ .05 level is indicated by an asterisk (*).
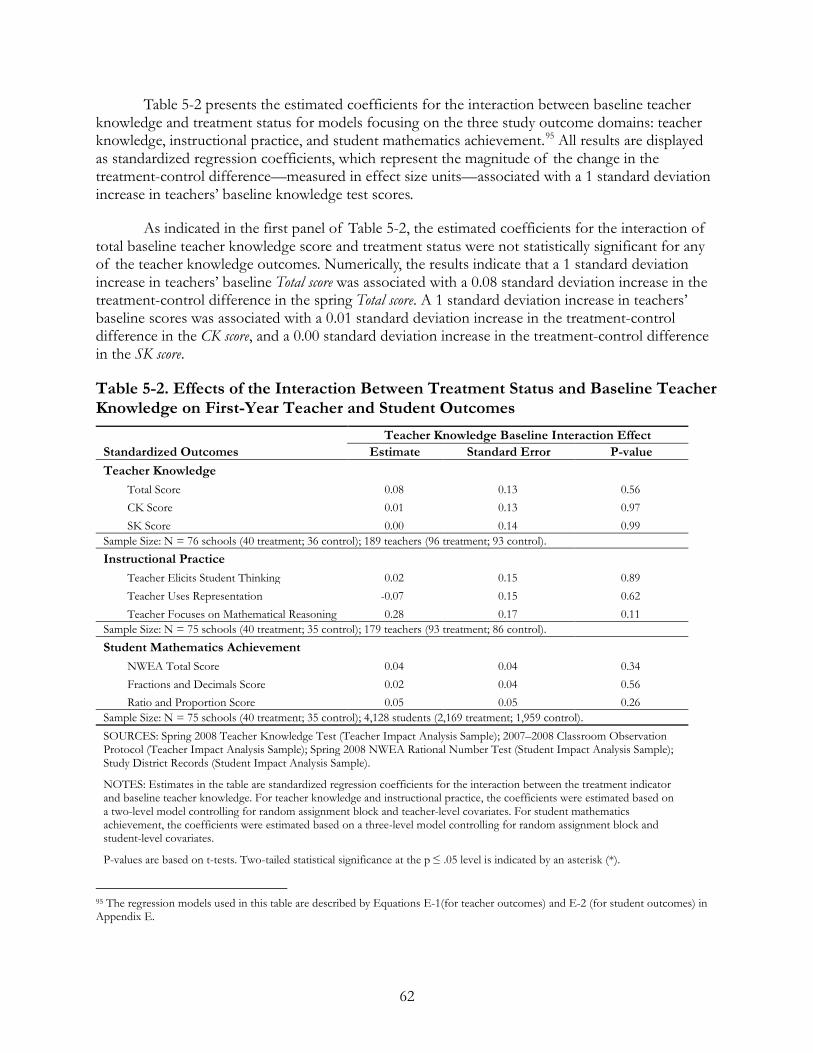
62
Table 5-2 presents the estimated coefficients for the interaction between baseline teacher knowledge and treatment status for models focusing on the three study outcome domains: teacher knowledge, instructional practice, and student mathematics achievement.95
As indicated in the first panel of Table 5-2, the estimated coefficients for the interaction of total baseline teacher knowledge score and treatment status were not statistically significant for any of the teacher knowledge outcomes. Numerically, the results indicate that a 1 standard deviation increase in teachers’ baseline Total score was associated with a 0.08 standard deviation increase in the treatment-control difference in the spring Total score. A 1 standard deviation increase in teachers’ baseline scores was associated with a 0.01 standard deviation increase in the treatment-control difference in the CK score, and a 0.00 standard deviation increase in the treatment-control difference in the SK score.
All results are displayed as standardized regression coefficients, which represent the magnitude of the change in the treatment-control difference—measured in effect size units—associated with a 1 standard deviation increase in teachers’ baseline knowledge test scores.
Table 5-2. Effects of the Interaction Between Treatment Status and Baseline Teacher Knowledge on First-Year Teacher and Student Outcomes
Standardized Outcomes Teacher Knowledge Baseline Interaction Effect
Estimate Standard Error P-value Teacher Knowledge
Total Score 0.08 0.13 0.56 CK Score 0.01 0.13 0.97 SK Score 0.00 0.14 0.99
Sample Size: N = 76 schools (40 treatment; 36 control); 189 teachers (96 treatment; 93 control). Instructional Practice
Teacher Elicits Student Thinking 0.02 0.15 0.89 Teacher Uses Representation -0.07 0.15 0.62 Teacher Focuses on Mathematical Reasoning 0.28 0.17 0.11
Sample Size: N = 75 schools (40 treatment; 35 control); 179 teachers (93 treatment; 86 control). Student Mathematics Achievement
NWEA Total Score 0.04 0.04 0.34 Fractions and Decimals Score 0.02 0.04 0.56 Ratio and Proportion Score 0.05 0.05 0.26
Sample Size: N = 75 schools (40 treatment; 35 control); 4,128 students (2,169 treatment; 1,959 control). SOURCES: Spring 2008 Teacher Knowledge Test (Teacher Impact Analysis Sample); 2007–2008 Classroom Observation Protocol (Teacher Impact Analysis Sample); Spring 2008 NWEA Rational Number Test (Student Impact Analysis Sample); Study District Records (Student Impact Analysis Sample).
NOTES: Estimates in the table are standardized regression coefficients for the interaction between the treatment indicator and baseline teacher knowledge. For teacher knowledge and instructional practice, the coefficients were estimated based on a two-level model controlling for random assignment block and teacher-level covariates. For student mathematics achievement, the coefficients were estimated based on a three-level model controlling for random assignment block and student-level covariates.
P-values are based on t-tests. Two-tailed statistical significance at the p ≤ .05 level is indicated by an asterisk (*).
95 The regression models used in this table are described by Equations E-1(for teacher outcomes) and E-2 (for student outcomes) in Appendix E.
63
The second panel of the table shows that the estimated coefficients for the interaction of total baseline teacher knowledge score and treatment status were not statistically significant for any of the three instructional practice outcomes. The estimated relationships between baseline teacher knowledge level and the treatment-control differences on instructional practice measures were 0.02, -0.07, and 0.28 standard deviations for Teacher elicits student thinking, Teacher uses representations, and Teacher focuses on mathematical reasoning, respectively.
The last panel of the table shows that the estimated interactions between baseline teacher knowledge and treatment status were not statistically significant for any of the student achievement outcome measures. The estimated values were 0.04, 0.02, and 0.05 standard deviations for the spring NWEA rational number test Total score and its two subscale scores, respectively.
Overall, none of the estimated coefficients for the interactions between baseline teacher knowledge and teacher and student outcomes was statistically significant. These results may suggest that teachers with better knowledge at the start of the program, and their students, were not affected by the PD program any more or less than teachers who began with lower levels of knowledge.
Differential Effects Based on Student Baseline Achievement It is possible that the impact of the PD program depended on students’ initial level of
achievement. For example, students at different skill levels might have had different needs, which were differentially emphasized in the PD. To assess this possibility, we re-estimated the student impact model, including the main effect for the PD program, baseline student test scores, and the interaction between the two.96
Only students with both fall and spring NWEA test scores were used in this analysis. Given the sampling procedure for student testing (described in Chapter 2 and Appendix B), about 60 percent of the students with spring NWEA test scores had a valid fall test score. Because this analysis uses a selected sample of students, it should be considered nonexperimental and its results cannot be interpreted as causal.
The estimated coefficient for this interaction term provides indications for whether the difference between treatment and control group spring student achievement varies with students’ pre-program achievement level. A statistically significant and positive (or negative) estimate would indicate that students with higher initial test scores benefitted more (or less) from the program.
97
Table 5-3 shows the estimated coefficients for the interaction term.
98
96 In this model, we assume that the relationship between baseline student test scores and the treatment effect is linear.
Like the results in Table 5-2, those reported here are standardized regression coefficients. The results show that the interaction between baseline student achievement and their treatment status was not statistically significant for the overall achievement outcome or for the two achievement subscale scores—Fractions and decimals score and Ratio and proportion score. The results indicate that a 1 standard deviation
97 Given the study design, the statistical tests for the interaction terms have limited power. Column 2 in Table E-1 from Appendix E reports the MDES for these tests. 98 The regression models used in this table are described by Equations E-3(for teacher outcomes) and E-4 (for student outcomes) in Appendix E.
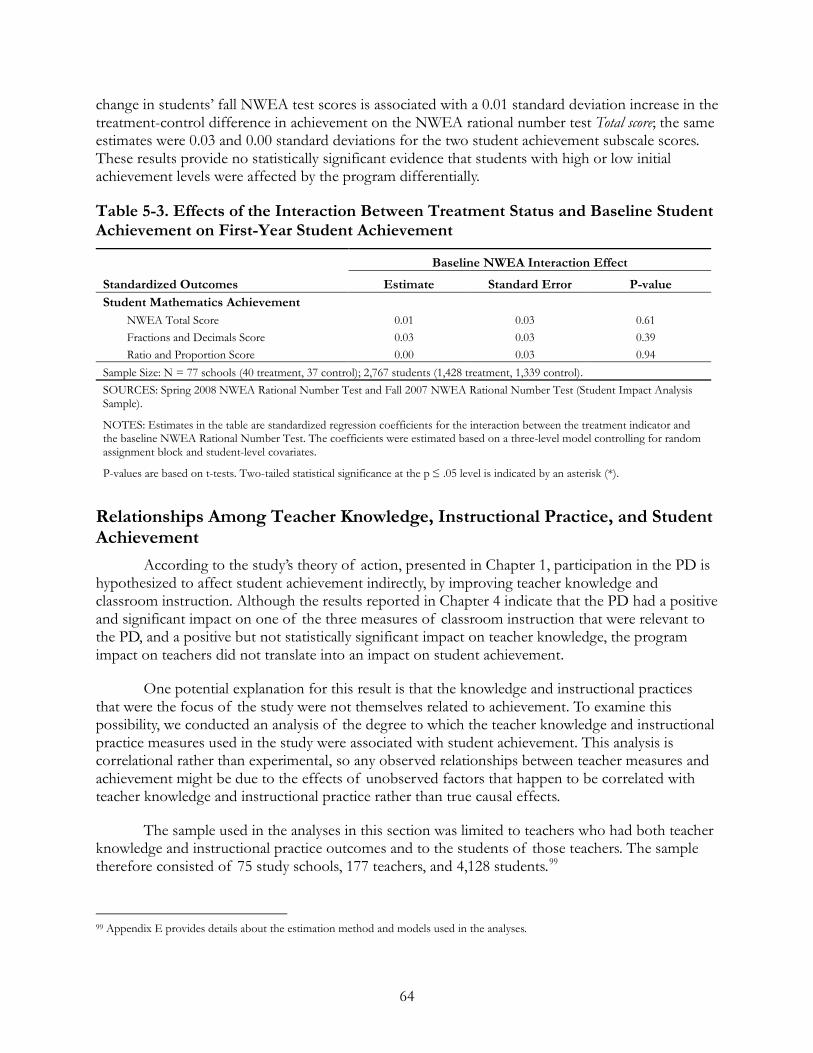
64
change in students’ fall NWEA test scores is associated with a 0.01 standard deviation increase in the treatment-control difference in achievement on the NWEA rational number test Total score; the same estimates were 0.03 and 0.00 standard deviations for the two student achievement subscale scores. These results provide no statistically significant evidence that students with high or low initial achievement levels were affected by the program differentially.
Table 5-3. Effects of the Interaction Between Treatment Status and Baseline Student Achievement on First-Year Student Achievement
Standardized Outcomes
Baseline NWEA Interaction Effect
Estimate Standard Error P-value Student Mathematics Achievement
NWEA Total Score 0.01 0.03 0.61 Fractions and Decimals Score 0.03 0.03 0.39 Ratio and Proportion Score 0.00 0.03 0.94
Sample Size: N = 77 schools (40 treatment, 37 control); 2,767 students (1,428 treatment, 1,339 control). SOURCES: Spring 2008 NWEA Rational Number Test and Fall 2007 NWEA Rational Number Test (Student Impact Analysis Sample).
NOTES: Estimates in the table are standardized regression coefficients for the interaction between the treatment indicator and the baseline NWEA Rational Number Test. The coefficients were estimated based on a three-level model controlling for random assignment block and student-level covariates.
P-values are based on t-tests. Two-tailed statistical significance at the p ≤ .05 level is indicated by an asterisk (*).
Relationships Among Teacher Knowledge, Instructional Practice, and Student Achievement
According to the study’s theory of action, presented in Chapter 1, participation in the PD is hypothesized to affect student achievement indirectly, by improving teacher knowledge and classroom instruction. Although the results reported in Chapter 4 indicate that the PD had a positive and significant impact on one of the three measures of classroom instruction that were relevant to the PD, and a positive but not statistically significant impact on teacher knowledge, the program impact on teachers did not translate into an impact on student achievement.
One potential explanation for this result is that the knowledge and instructional practices that were the focus of the study were not themselves related to achievement. To examine this possibility, we conducted an analysis of the degree to which the teacher knowledge and instructional practice measures used in the study were associated with student achievement. This analysis is correlational rather than experimental, so any observed relationships between teacher measures and achievement might be due to the effects of unobserved factors that happen to be correlated with teacher knowledge and instructional practice rather than true causal effects.
The sample used in the analyses in this section was limited to teachers who had both teacher knowledge and instructional practice outcomes and to the students of those teachers. The sample therefore consisted of 75 study schools, 177 teachers, and 4,128 students.99
99 Appendix E provides details about the estimation method and models used in the analyses.
65
As an initial step in the analysis, we examined the extent to which student achievement varied across the teachers in the sample schools, since teacher knowledge and instructional practice can be related to student achievement only to the extent that student achievement varies among teachers. After controlling for student demographics and prior achievement, as well as teacher education and experience, 5 percent of the variation in student achievement remained at the teacher level (p-value < 0.01), indicating that there is variability in student achievement across teachers (see Appendix E for further details of this analysis).
To analyze the association between the study’s measures of teacher knowledge and instructional practice and student achievement in rational numbers, we added these teacher variables to the impact model. Here the teacher variables were used in place of the treatment status indicator. The variables we examined include the total teacher knowledge score100 and a summary index for instructional practice.101
Table 5-4 reports the estimated correlation between the teacher knowledge and instructional practice variables and student achievement.
Separate analyses were also conducted including the CK and SK subscale scores for teacher knowledge and the three practice measures that were the focus of the PD program.
102
It includes the estimated coefficients for the teacher knowledge and instructional practice variables, as well as the relevant statistical test information, including the standard error for each estimated coefficient, in parentheses, and the corresponding p-values for a two-tailed t-test, in brackets. All results reported in the table are standardized: each coefficient represents the magnitude of the change in achievement (in effect size using student-level standard deviation units) associated with a 1 standard deviation change in each of the independent variables, controlling for the other independent variables and covariates included in the model.
100 These teacher knowledge measures are the average of the fall and spring teacher knowledge scores. The average is used in this analysis because it best represents the level of teacher knowledge that students were exposed to during the course of the year. 101 See Appendix B, part 4, for the creation of this variable and its purpose. 102 The regression models used in this table are described by Equations E-7 to E-9 in Appendix E.
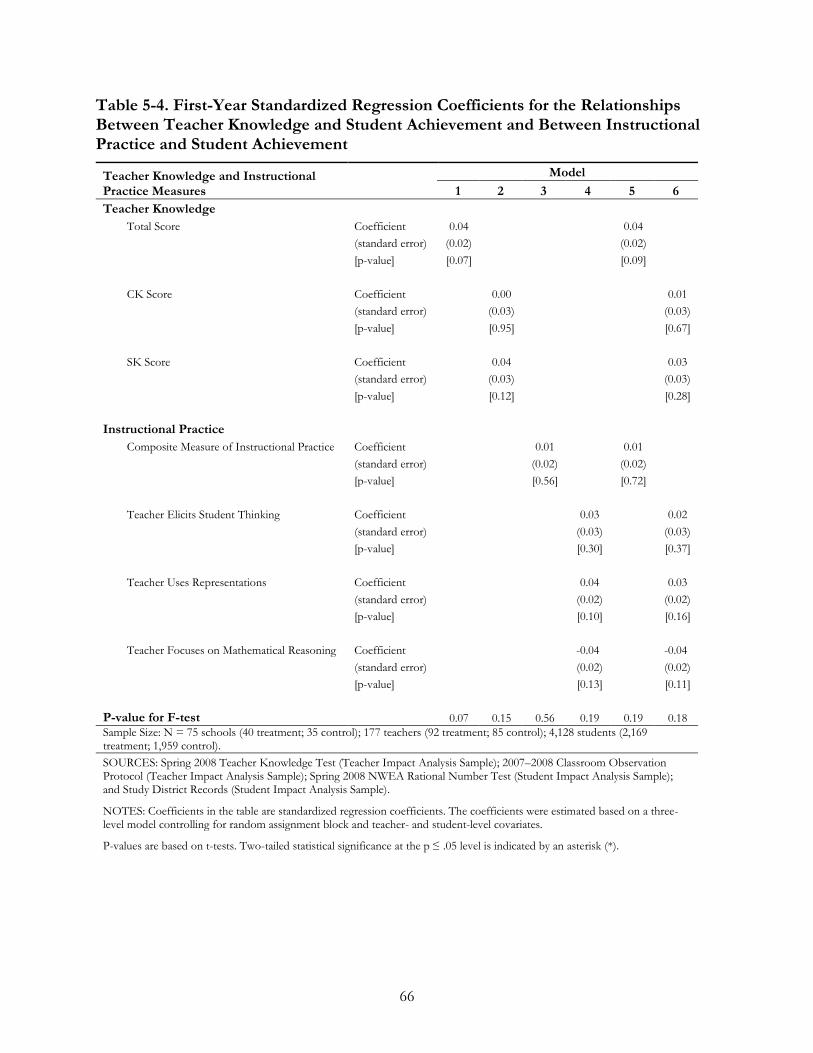
66
Table 5-4. First-Year Standardized Regression Coefficients for the Relationships Between Teacher Knowledge and Student Achievement and Between Instructional Practice and Student Achievement
Teacher Knowledge and Instructional Practice Measures
Model 1 2 3 4 5 6
Teacher Knowledge Total Score Coefficient 0.04 0.04
(standard error) (0.02) (0.02) [p-value] [0.07] [0.09]
CK Score Coefficient 0.00 0.01 (standard error) (0.03) (0.03) [p-value] [0.95] [0.67]
SK Score Coefficient 0.04 0.03 (standard error) (0.03) (0.03) [p-value] [0.12] [0.28] Instructional Practice
Composite Measure of Instructional Practice Coefficient 0.01 0.01 (standard error) (0.02) (0.02) [p-value] [0.56] [0.72]
Teacher Elicits Student Thinking Coefficient 0.03 0.02
(standard error) (0.03) (0.03) [p-value] [0.30] [0.37]
Teacher Uses Representations Coefficient 0.04 0.03 (standard error) (0.02) (0.02) [p-value] [0.10] [0.16]
Teacher Focuses on Mathematical Reasoning Coefficient -0.04 -0.04
(standard error) (0.02) (0.02) [p-value] [0.13] [0.11] P-value for F-test 0.07 0.15 0.56 0.19 0.19 0.18 Sample Size: N = 75 schools (40 treatment; 35 control); 177 teachers (92 treatment; 85 control); 4,128 students (2,169 treatment; 1,959 control). SOURCES: Spring 2008 Teacher Knowledge Test (Teacher Impact Analysis Sample); 2007–2008 Classroom Observation Protocol (Teacher Impact Analysis Sample); Spring 2008 NWEA Rational Number Test (Student Impact Analysis Sample); and Study District Records (Student Impact Analysis Sample).
NOTES: Coefficients in the table are standardized regression coefficients. The coefficients were estimated based on a three-level model controlling for random assignment block and teacher- and student-level covariates.
P-values are based on t-tests. Two-tailed statistical significance at the p ≤ .05 level is indicated by an asterisk (*).
67
Columns 1 and 2 report the estimated standardized regression coefficients between teacher knowledge and student achievement. None of the estimated coefficients was statistically significant. As shown in column 1, the estimated association between the teacher knowledge measure Total score and student achievement was 0.04 (p-value = 0.07), suggesting that students in a classroom taught by a teacher scoring 1 standard deviation above average on teacher knowledge scored 0.04 standard deviations above average on the NWEA test.103
The estimated standardized regression coefficients between instructional practice measures and student achievement are shown in columns 3 and 4. In column 3, the estimated relationship between the summary measure of instructional practice and student achievement is not statistically significant (the magnitude was 0.01 standard deviations). The estimated relationships between the three individual instructional practice measures and student achievement were also not statistically significant (column 4). More specifically, two of the three measures that were the focus of the PD program—Teacher elicits student thinking and Teacher uses representations—were not statistically significant, with estimated associations of 0.03 and 0.04 standard deviations, respectively. The estimated relationship between the third measure—Teacher focuses on mathematical reasoning—and student achievement was also not statistically significant (the magnitude was –0.04 standard deviations).
Column 2 shows the association between teachers’ CK score and SK score and student achievement. The estimated association between CK score and student achievement was 0.00 (p-value = 0.95), and the association between teacher SK score and student achievement was 0.04 (p-value = 0.12).
The models reported in the last two columns of the table controlled for the teacher knowledge and instructional practice measures simultaneously, to account for potential correlations between these two sets of teacher measures. The conditional associations among teacher knowledge, instructional practice, and student achievement are similar to those estimated separately.
There are different possible explanations for the findings shown in Table 5-4. The aspects of teaching practice on which the PD program and the instructional practice measures focused may not be related to student performance in mathematics. Alternatively, the measures may have been inadequate. They were constructed to capture the quantity, not the quality, of the measured practices, and, in theory, the quality with which a teacher exhibited these practices is important. In addition, the measure of classroom practice was based on one observation per teacher. As shown in Raudenbush et al. (2008), variation across lessons can contribute to measurement error, which attenuates the estimated relationship between two variables. Finally, the sample size may not have provided sufficient power to detect associations of the magnitude occurring in the population.104
103 The magnitude of the association between teacher knowledge and student achievement is similar in magnitude to correlations that have been reported in the literature. For example, a study by Clotfelter, Ladd, and Vigdor (2006) found that the associations between teacher licensure test scores and fifth-grade students’ mathematics achievement were 0.01 to 0.02 standard deviations. Hill et al. (2005) reported that first- and third-grade students gained roughly 0.05 standard deviations on the Terra Nova mathematics tests for every standard deviation difference in teachers’ specialized content knowledge. Rockoff et al. (2008) found that a 1 standard deviation increase in teachers’ scores on a test of mathematics knowledge for teaching is associated with a statistically significant (p-value = 0.02) increase of about 0.03 standard deviations in students’ mathematics achievement.
104 The minimum detectable effect size (MDES) for the association between teacher knowledge (Total score) and student achievement was 0.06, and the MDES for the association between CK score or SK score and achievement was 0.08. The MDES for the association between the composite measure of instructional practice and achievement was also 0.06, and the MDES for each of the three specific practice measures and achievement was 0.07.
68
Summary This chapter reported the results of a variety of non-experimental analyses. Analyses to
examine the potential effects of teacher turnover on the study results, based on teachers who taught in the study schools for the full year, produced results similar to the experimental impact results for the full sample of teachers. Analyses to examine potential differences in the effectiveness of the PD for teachers with different levels of baseline teacher knowledge showed no statistically significant relationships. Analyses to examine potential differences in the effectiveness of the PD for students with different levels of baseline achievement also showed no statistically significant relationships.
Finally, analyses to examine the relationship between the study’s measures of teacher knowledge, instruction, and student achievement produced no statistically significant associations, although most of the estimated coefficients were positive and consistent in magnitude with associations reported in the literature. The estimated relationships should be interpreted in the context of several aspects of the study. In particular, the power to detect associations between teacher measures and student achievement was affected by the study’s sample size. In addition, the magnitude of the estimated associations could have been affected by the reliability of the teacher knowledge test and by the fact that the instructional practice measures were based on only one classroom observation per teacher and focused on the frequency with which teachers engaged in several practices encouraged by the PD but not the overall quality of instruction.
69
REFERENCES
Ball, D.L. “Teacher Learning and the Mathematics Reforms: What We Think We Know and What We Need to Learn.” Phi Delta Kappan, 1996, 77(7): 500–508.
Beckman, S. Mathematics for Elementary Teachers. New York: Pearson Addison Wesley, 2005.
Birman, B., Le Floch, K.C., Klekotka, A., Ludwig, M., Taylor, J., Walters, K., et al. State and Local Implementation of the No Child Left Behind Act: Vol. 2. Teacher quality under NCLB: Interim report. Washington, DC: U.S. Department of Education; Office of Planning, Evaluation and Policy Development; Policy and Program Studies Service, 2007.
Black, A.R., Doolittle, F., Zhu, P., Unterman, R., and Grossman, J.B. The Evaluation of Enhanced Academic Instruction in After-School Programs: Findings After the First Year of Implementation (NCEE 2008-4021). Washington, DC: U.S. Department of Education, Institute of Education Sciences, National Center for Education Evaluation and Regional Assistance, 2008.
Bloom, H.S. “Minimum Detectable Effects: A Simple Way to Report the Statistical Power of Experimental Designs.” Evaluation Review, 1995, 19(5): 547–556.
Borko, H. “Professional Development and Teacher Learning: Mapping the Terrain.” Educational Researcher, 2004, 33(8): 3–15.
Clewell, B.C., Campbell, P.B., and Perlman, L. Review of Evaluation Studies of Mathematics and Science Curricula and Professional Development Models. Submitted to the GE Foundation. Washington, DC: The Urban Institute, 2004.
Clotfelter, C.T., Ladd, H.F., and Vigdor, J.L. Teacher-Student Matching and the Assessment of Teacher Effectiveness (Working Paper No. 11936). Cambridge, MA: National Bureau of Economic Research (NBER), 2006.
Elmore, R. Bridging the Gap Between Standards and Achievement: The Imperative for Professional Development in Education. Washington, DC: Albert Shanker Institute, 2002. Available online at: http://www.ashankerinst.org/Downloads/Bridging_Gap.pdf.
Garet, M., Cronen, S., Eaton, M., Kurki, A., Ludwig, M., Jones, W., et al. The Impact of Two Professional Development Interventions on Early Reading Instruction and Achievement (NCEE 2008-4030). Washington, DC: U.S. Department of Education, Institute of Education Sciences, National Center for Education Evaluation and Regional Assistance, 2008.
Garet, M., Porter, A., Desimone, L., Birman, B., and Yoon, K.S. “What Makes Professional Development Effective? Results From a National Sample of Teachers.” American Educational Research Journal, 2001, 38(4): 915–945.
Hanushek, E.A., Kain, J.F., O’Brien, D.M., and Rivkin, S.G. The Market for Teacher Quality (Working Paper No. 11154). Cambridge, MA: National Bureau of Economic Research (NBER), 2005.
Hargreaves, A., and Fullan, M.G. Understanding Teacher Development. London: Cassell, 1992.
Hill, H., Rowan, B., and Ball, D. “Effects of Teachers’ Mathematical Knowledge for Teaching on Student Achievement.” American Educational Research Journal, 2005, 42(2): 371–406.
Hill, H.C. “Mathematical Knowledge of Middle School Teachers: Implications for the No Child Left Behind Policy Initiative.” Educational Evaluation and Policy Analysis, 2007, 29(2): 95–114.
70
Hill, H.C., Blunk, M.L., Charalambous, C.Y., Lewis, J.M., Phelps, G.C., Sleep, L. and Ball, D.L. “Mathematical Knowledge for Teaching and the Mathematical Quality of Instruction: An Exploratory Study,” Cognition and Instruction, 2008, 26: 4,430–511.
Kane, T., and Staiger, D.O. Estimating Teacher Impacts on Student Achievement: An Experimental Evaluation (Working Paper 14607). Cambridge, MA: National Bureau of Economic Research (NBER), 2008.
Kennedy, M. Form and Substance of Inservice Teacher Education (Research monograph no. 13). Madison: University of Wisconsin–Madison, National Institute for Science Education, 1998.
Knapp, M.S. “Between Systemic Reforms and the Mathematics and Science Classroom: The Dynamics of Innovation, Implementation, and Professional Learning.” Review of Educational Research, 1997, 67(2): 227–266.
Lieberman, A. (Ed.). “Practices That Support Teacher Development: Transforming Conceptions of Professional Learning.” In M. W. McLaughlin and I. Oberman (Eds.), Teacher Learning: New Policies, New Practices. New York: Teachers College Press, 1996: 185–201.
Little, J.W. “Teachers’ Professional Development in a Climate of Educational Reform.” Educational Evaluation and Policy Analysis, 1993, 15(2): 129–151.
Loucks-Horsley, S., Hewson, P.W., Love, N., and Stiles, K.E. Designing Professional Development for Teachers of Science and Mathematics. Thousand Oaks, CA: Corwin Press, Inc., 1998.
Milgram, R.J. The Mathematics Pre-Service Teachers Need to Know. Stanford, CA: Stanford University, Department of Mathematics, 2005.
National Mathematics Advisory Panel. Foundations for Success: The Final Report of the National Mathematics Advisory Panel. Washington, DC: U.S. Department of Education, 2008.
National Research Council. Adding It Up: Helping Children Learn Mathematics. J. Kilpatrick, J. Swafford, and B. Findell (Eds). Mathematics Learning Study Committee, Center for Education, Division of Behavioral and Social Sciences and Education. Washington, DC: National Academy Press, 2001.
Newton, K.J. “An Extensive Analysis of Elementary Preservice Teachers Knowledge of Fractions.” American Educational Research Journal, 2008, 45(4): 1080–1110.
Northwest Evaluation Association. Technical Manual for Use With Measures of Academic Progress and Achievement Level Tests. Lake Oswego, OR: NWEA, 2003.
Northwest Evaluation Association. Reliability and Validity Estimates: NWEA Achievement Level Tests and Measures of Academic Progress. Lake Oswego, OR: NWEA, 2004.
Pashler, H., Bain, P., Bottge, B., Graesser, A., Koedinger, K., McDaniel, M., and Metcalfe, J. Organizing Instruction and Study to Improve Student Learning (NCER 2007-2004). Washington, DC: U.S. Department of Education, Institute of Education Sciences, National Center for Education Research, 2007. Available online at: http://ncer.ed.gov.
Puma, M.J., Olsen, R.B., Bell, S.H., and Price, C. What to Do When Data Are Missing in Group Randomized Controlled Trials (NCEE 2009-0049). Washington, DC: U.S. Department of Education, Institute of Education Sciences, National Center for Education Evaluation and Regional Assistance, 2009.
71
Raudenbush, S.W., Martinez A., Bloom H., Zhu P., and Lin, F. An Eight-Step Paradigm for Studying the Reliability of Group-Level Measures (Working paper). New York: William T. Grant Foundation, 2008. Available online at: http://www.wtgrantfoundation.org/usr_doc/Raudenbush_et_al_June_30_2008.pdf.
Richardson, V., and Placier, P. “Teacher Change.” In V. Richardson (Ed.), Handbook of Research on Teaching (4th Ed.). New York: Macmillan, 2001: 905–947.
Rockoff, J.E. “The Impact of Individual Teachers on Student Achievement: Evidence From Panel Data.” The American Economic Review, 2004, 94(2): 247–252.
Rockoff, J.E., Jacob, B., Kane, T., and Staiger, D. Can You Recognize an Effective Teacher when you Recruit One? (Working Paper No. 14485). Cambridge, MA: National Bureau of Economic Research (NBER), 2008.
Shulman, L.S. “Those Who Understand: Knowledge Growth in Teaching.” Educational Researcher, February 1986: 4–14.
Sireci, S.G., Thissen, D., and Wainer, H. “On the Reliability of Testlet-Based Tests.” Journal of Educational Measurement, 1991, 28(3): 234–247.
Stiles, K., Loucks-Horsley, S., and Hewson, P. Principles of Effective Professional Development for Mathematics and Science Education: A Synthesis of Standards (NISE Brief, Vol. 1). Madison, WI: National Institutes for Science Education, 1996.
Supovitz, J.A. “Translating Teaching Practice into Improved Student Performance.” In S. H. Fuhrman (Ed.), From the Capitol to the Classroom: Standards-Based Reform in the States (100th Yearbook of the National Society for the Study of Education, Part II). Chicago: University of Chicago Press, 2001: 81–98.
Talbert, J.E., and McLaughlin, M.W. “Understanding Teaching in Context.” In D.K. Cohen, M.W. McLaughlin, and J.E. Talbert (Eds.), Teaching for Understanding: Challenges for Policy and Practice. San Francisco, CA: Jossey-Bass, Inc., 1993: 167–206.
Tirosh, D., Fischbein, E., Graeber, A.O., and Wilson, J.W. Prospective Elementary Teachers’ Conceptions of Rational Numbers, 1999. Available online at: http://jwilson.coe.uga.edu/Texts.Folder/tirosh/Pros.El.Tchrs.html.
U.S. Department of Education, Office of Planning, Evaluation and Policy Development, Policy and Program Studies Service. State and Local Implementation of the No Child Left Behind Act, Volume VIII—Teacher Quality Under NCLB: Final Report. Washington, DC: 2009.
Wu, H. Chapter 1: Whole Numbers, 2002a. Available online at: http://math.berkeley.edu/~wu/.
Wu, H. Chapter 2: Fractions, 2002b. Available online at: http://math.berkeley.edu/~wu/.
Wu, H. Key Mathematical Ideas in Grades 5–8, 2005. Available online at: http://math.berkeley.edu/~wu/.
Yoon, K.S., Duncan, T., Lee, S. W.-Y., Scarloss, B., and Shapley, K. Reviewing the Evidence on How Teacher Professional Development Affects Student Achievement (Issues & Answers Report, No. 033). Washington, DC: U.S. Department of Education, Institute of Education Sciences, National Center for Education Evaluation and Regional Assistance, Regional Educational Laboratory Southwest, 2007.

APPENDIX A DATA COLLECTION

A-1
APPENDIX A. DATA COLLECTION
This appendix provides additional detail on the data collection activities described in Chapter 2. Information is provided on the six instruments used in the study—the implementation form, coach log, teacher knowledge test, classroom observation protocol, teacher survey, and student achievement test. Procedures for developing the instruments and for training the data collectors are also described, as are the response rates achieved.
Implementation Form
To gauge the implementation of the PD, a member of the study team attended each institute or seminar day and completed a form on which he or she tracked the amount of time devoted to each instructional segment as well as the use of intended instructional materials. The forms for each institute or seminar day were customized on the basis of the planned agenda, PowerPoint slides, and handouts so that the observer was able to cross check the presentation against the plan. In addition, the observer noted (1) whether the facilitator “closed” each segment by reviewing the main learning goals or mathematical points of the segment and (2) the extent to which the facilitator created links to the curriculum by discussing the district’s text and/or standards. Because the observers were not experts in PD or mathematics, they were not asked to judge the quality of the presentation, but simply to record what was done.
The implementation form was developed on the basis of a similar form used in an earlier study of PD in reading conducted by AIR and MDRC (Garet et al. 2008). The form was pilot tested during the planning year, when the PD was also undergoing pilot testing. Observers were provided with 1 hour of training and detailed written guidance on how to implement the form. The reliability of the implementation form was not formally assessed.
Coach Log
After each coaching event, coaches completed logs in which they recorded the amount of contact time with each teacher and the kinds of coaching activities pursued. Over the course of the coaching event, the coaches were expected to record the starting and stopping time of each separate coaching activity and the names of the teachers participating in that activity. They then checked precoded boxes to indicate the nature of the activity (e.g., planning a lesson, co-teaching a lesson, conducting a peer observation), the mathematical focus of the activity, and the pedagogical focus of the activity.
Like the implementation form, the coach log was developed on the basis of a similar form used in an earlier study of PD in reading (Garet et al. 2008). The coaches were provided with instructions for completing the logs, and the definitions of the code categories were discussed. As the coach logs were received from the field, they were reviewed for completeness and clarity, and research staff followed up with coaches as necessary.

A-2
Teacher Knowledge Test
The teacher knowledge test was developed by AIR specifically for this study. The test addresses 12 key understandings related to positive rational numbers. These 12 key understandings, which informed the development of the PD program as well as the development of the teacher knowledge test, are listed in the text box below. Six of the key understandings are in the general area of fractions and decimals, and 6 are in the general area of ratios, rates, proportions, and percents.
Key Understandings Measured in Teacher Knowledge Test
• • • • • • • • • • • •
Defining fraction as a number and the meaning of the numerator and denominator. Equivalent fractions and the role of a/a Adding, subtracting, and ordering fractions and the role of common denominators Multiplying and dividing fractions and the role of the reciprocal and inverse operations Decimals are an extension of place value Rational numbers can be expressed as fractions, decimals, percents, or ratios Ratios are comparisons by division Rates are special cases of ratios Percents are ratios Additive vs. multiplicative relationships Proportions are equivalent ratios Direct and inverse proportional relations
Every item in the teacher knowledge test was designed to measure either common
knowledge of mathematics (CK) or specialized knowledge of mathematics for teaching (SK) associated with one of these key understandings. CK items address the teacher’s ability to understand concepts and carry out operations in the area of positive rational numbers, as typically taught in seventh grade. SK items are intended to measure the more specialized knowledge required to successfully teach positive rational numbers content at this grade level, including knowledge associated with planning instruction, delivering instruction, and assessing student understanding. Sample CK and SK items are presented below. At baseline, the average teacher in the study sample had an approximately three-quarters chance of answering each of these sample items correctly.105
105 The probability for a given teacher to answer a particular item correctly was computed as follows: probability = EXP(D)/(1+EXP(D)), where D is the difference between the teacher’s knowledge score and the item’s difficulty derived from IRT scaling.
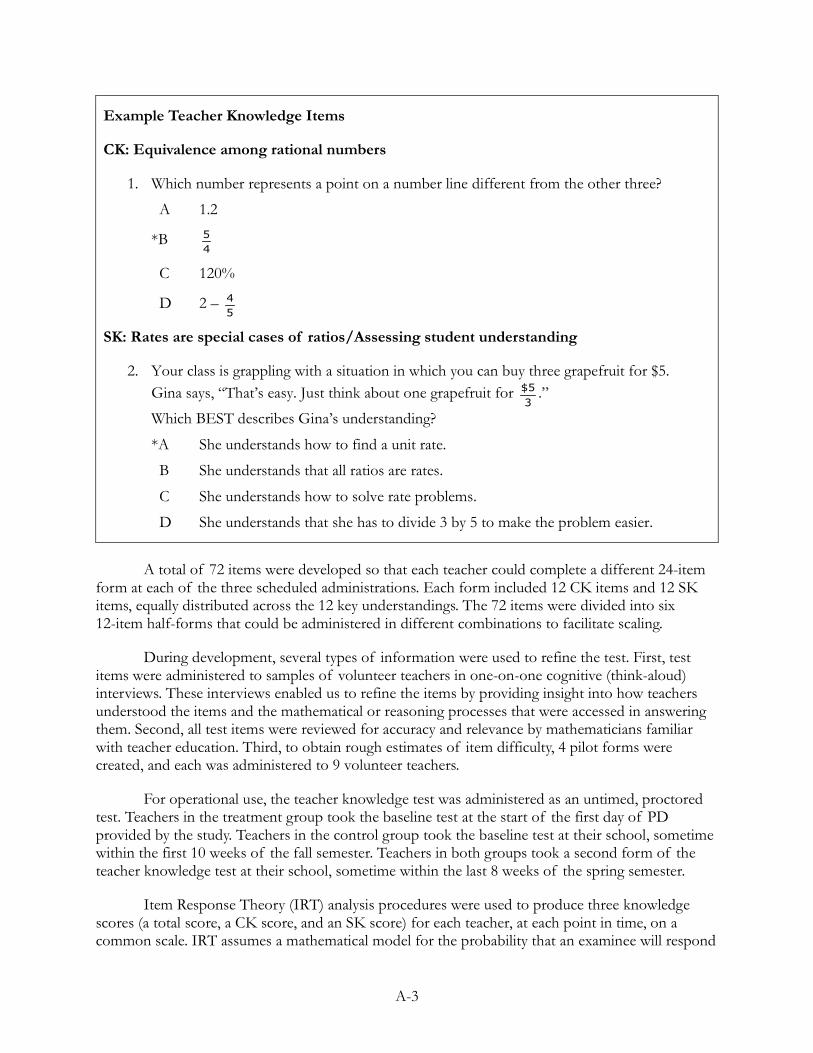
A-3
Example Teacher Knowledge Items
CK: Equivalence among rational numbers
1. Which number represents a point on a number line different from the other three?
A 1.2
*B 45
C 120%
D 2 – 54
SK: Rates are special cases of ratios/Assessing student understanding
2. Your class is grappling with a situation in which you can buy three grapefruit for $5. Gina says, “That’s easy. Just think about one grapefruit for
35$ .”
Which BEST describes Gina’s understanding?
*A She understands how to find a unit rate.
B She understands that all ratios are rates.
C She understands how to solve rate problems.
D She understands that she has to divide 3 by 5 to make the problem easier.
A total of 72 items were developed so that each teacher could complete a different 24-item
form at each of the three scheduled administrations. Each form included 12 CK items and 12 SK items, equally distributed across the 12 key understandings. The 72 items were divided into six 12-item half-forms that could be administered in different combinations to facilitate scaling.
During development, several types of information were used to refine the test. First, test items were administered to samples of volunteer teachers in one-on-one cognitive (think-aloud) interviews. These interviews enabled us to refine the items by providing insight into how teachers understood the items and the mathematical or reasoning processes that were accessed in answering them. Second, all test items were reviewed for accuracy and relevance by mathematicians familiar with teacher education. Third, to obtain rough estimates of item difficulty, 4 pilot forms were created, and each was administered to 9 volunteer teachers.
For operational use, the teacher knowledge test was administered as an untimed, proctored test. Teachers in the treatment group took the baseline test at the start of the first day of PD provided by the study. Teachers in the control group took the baseline test at their school, sometime within the first 10 weeks of the fall semester. Teachers in both groups took a second form of the teacher knowledge test at their school, sometime within the last 8 weeks of the spring semester.
Item Response Theory (IRT) analysis procedures were used to produce three knowledge scores (a total score, a CK score, and an SK score) for each teacher, at each point in time, on a common scale. IRT assumes a mathematical model for the probability that an examinee will respond
A-4
correctly to a specific test question, given the examinee's overall performance and the characteristics of the question. When different examinees complete different blocks of items, IRT scoring accounts for the relative difficulty of the items. Individual teacher scores are thus not affected by variations in the average difficulty of the items on a given test form.
Classical test theory–based reliability indices, such as Cronbach’s alpha, are not appropriate for the teacher knowledge test given the spiraling of forms. (As noted above, at each administration, each teacher was administered a subset of the total item pool based on his or her assigned test form.) The reliability coefficient for the instrument was, therefore, calculated as the marginal reliability, ρ (Sireci, Thissen, and Wainer 1991). This statistic is equivalent in interpretation to classical internal consistency estimates of reliability, an upper-bound estimate of true reliability. The marginal reliability estimates for the teacher knowledge test were ρ = 0.74 (Overall), ρ =0.65 (CK), and ρ =0.56 (SK), which are sufficient for the purposes of this study, which draws comparisons between groups of teachers (i.e., between treatment and control teachers).
Although there is no normative information on how a representative sample of teachers would perform on the teacher knowledge test, there is some limited evidence that the test is measuring the intended constructs. First, when the test was administered to the trainers responsible for delivering the PD program, the trainers scored significantly higher than the teachers participating in the study, as reported in Chapter 3. Second, baseline scores on the teacher knowledge test were significantly correlated (r = 0.256; p < .01) with teachers’ self-reports of number of mathematics courses taken.
Classroom Observation Protocol
To measure instructional practice for treatment and control teachers, we conducted observations in teachers’ classrooms. The design called for each teacher to be observed once. The observation window for each district was timed to coincide with rational numbers instruction and to occur after at least 5 of the 8 scheduled days of institutes and seminars for that district had been provided by the study. The earliest districts were observed in November 2007, and the latest were observed in April 2008. Observations were conducted by study staff members who were not experts in mathematics instruction. Observers received 1 week of initial training and approximately 8 hours of follow-up training on the observation instrument and associated coding guide. The training included practice and calibration using both videotaped and live classes.
Each teacher was observed for a single class period. The observer used a protocol in which the frequency of a number of observable teacher behaviors was tabulated for each 3-minute segment of instructional time. In addition, the observer recorded the primary instructional context in which the teacher was acting during each interval (whole class, small group, pair work, or individual student work). Some aspects of instruction were recorded for the class period as a whole, rather than for each 3-minute interval. Specifically, the observer recorded the use of different representations through a list of yes/no questions and rated the class period on several dimensions of general pedagogy and student engagement using a combination of yes/no and 4-point Likert
A-5
scale items.106
Ten percent of the sampled class sessions were observed by two observers to allow an estimation of inter-rater reliability (IRR). The second rater was always one of the core staff who was responsible for the development of the protocol and training. To calculate IRR, the two observers were compared on each of the 57 counts or ratings included in the protocol. For the count variables, the criterion for determining agreement differed depending on the count. For variables in which the second rater recorded a count of 4 or fewer, the raters were judged to be in agreement if the number recorded by the first rater was within 1 of the number recorded by the second rater. For variables on which the second rater recorded a count of more than 4, the raters were judged to be in agreement if the number recorded by the first rater was within 25 percent of the number recorded by the second rater. For the yes/no variables, the observers had to agree exactly, and for the 4-point Likert scale variables, the observers had to be within 1 scale point of each other. Each class session then received a total IRR score that equaled the percentage of variables on which the two observers were in agreement. The average IRR score across the 20 class sessions included in the IRR analysis was 85 percent agreement.
In total, 57 aspects of instruction were counted or rated in each classroom observation.
The observation data were organized into scales using exploratory factor analyses, and the reliability of the scales was evaluated using confirmatory factor analysis. Count data are typically modeled using a Poisson model, and Poisson models can be used as the basis for factor analysis by assuming that the observed counts for the items included on the protocol are a function of one or more underlying rates (latent factors), which vary across teachers. We used the Mplus software package, which can handle Poisson model data appropriately, to conduct the exploratory factor analysis of the count data. To examine the reliability of the count-data scales, we used the Hierarchical Generalized Linear Models (HGLM) procedure available in the HLM software program. HGLM can estimate Poisson measurement models, and it can generate reliability estimates of the latent scale that are analogous to Cronbach’s alpha, the most commonly used measure of internal consistency for composite scales.
Specifically, the reliability of a given instructional practice scale identified through exploratory factor analysis of count data was assessed using a two-level HGLM model, where items (level 1) comprising the scale are nested within teachers (level 2). Such a model is analogous to a multilevel Rasch model in that the measurement model at level 1 is based on the idea that the observed outcome (i.e., the count) of a given item for a particular teacher is a function of the teacher’s true score on an underlying factor (i.e., the true scale score) and the item’s difficulty (i.e., the propensity of occurrence). We did not include schools as level 3, because doing so would render the reliability estimates of the teacher scale scores incomparable to those typically reported by other
106 The yes/no questions on the protocol included 13 pertaining to representations (e.g., whether the teacher referred to a number line), and 6 pertaining to general pedagogical techniques (e.g., whether the teacher stated the lesson objective at the beginning of the class period). The 15 Likert scale items on the protocol were designed to measure the degree to which teachers monitored student understanding, made productive use of class time, and engaged students. Each Likert scale item has four response options: 1 = not at all, 2 = minimally, 3 = strongly, and 4 = extremely. The 6 yes/no questions pertaining to general pedagogical techniques and the 15 Likert scale items captured aspects of instruction that were not the focus of the PD and therefore were not discussed in this report.
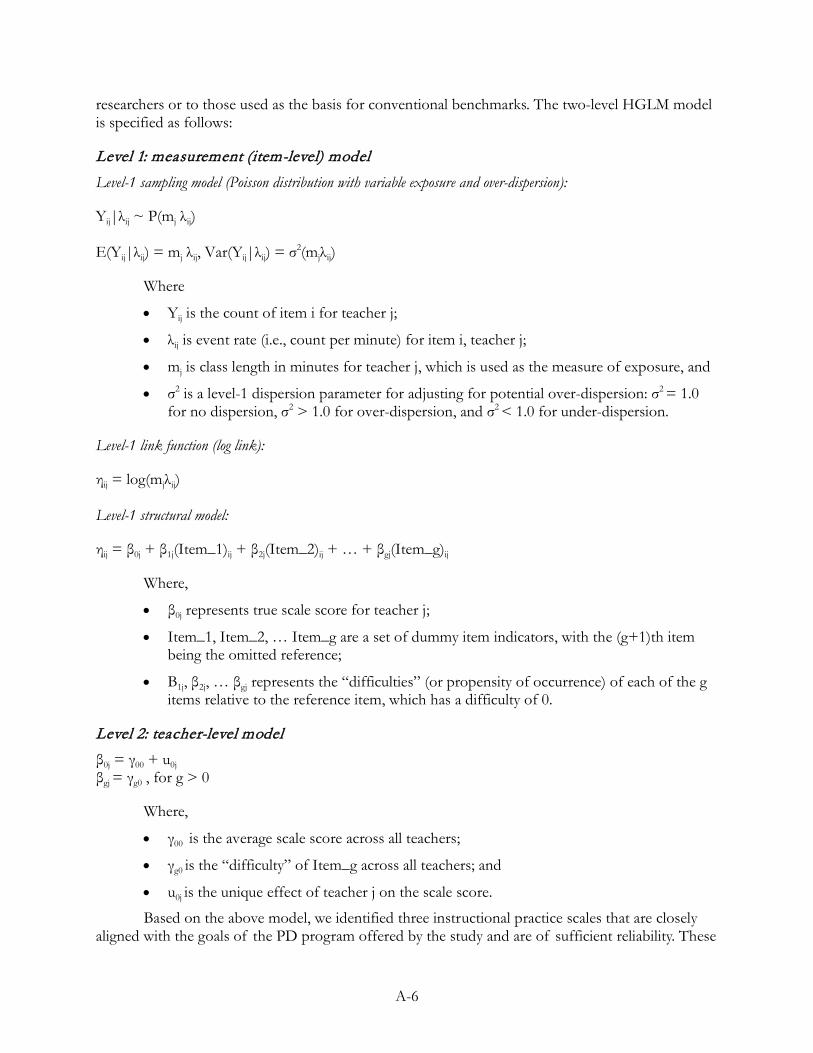
A-6
researchers or to those used as the basis for conventional benchmarks. The two-level HGLM model is specified as follows:
Level 1: measurement (item-level) model Level-1 sampling model (Poisson distribution with variable exposure and over-dispersion):
Yij|λij ~ P(mj λij) E(Yij|λij) = mj λij, Var(Yij|λij) = σ2(mjλij)
Where
•
•
•
•
Yij is the count of item i for teacher j;
λij is event rate (i.e., count per minute) for item i, teacher j;
mj is class length in minutes for teacher j, which is used as the measure of exposure, and
σ2 is a level-1 dispersion parameter for adjusting for potential over-dispersion: σ2 = 1.0 for no dispersion, σ2 > 1.0 for over-dispersion, and σ2 < 1.0 for under-dispersion.
Level-1 link function (log link):
ηij = log(mjλij) Level-1 structural model:
ηij = β0j + β1j(Item_1)ij + β2j(Item_2)ij + … + βgj(Item_g)ij
Where,
•
•
•
β0j represents true scale score for teacher j;
Item_1, Item_2, … Item_g are a set of dummy item indicators, with the (g+1)th item being the omitted reference;
Β1j, β2j, … βgj represents the “difficulties” (or propensity of occurrence) of each of the g items relative to the reference item, which has a difficulty of 0.
Level 2: teacher-level model β0j = γ00 + u0j
βgj = γg0 , for g > 0
Where,
•
•
•
γ00 is the average scale score across all teachers;
γg0 is the “difficulty” of Item_g across all teachers; and
u0j is the unique effect of teacher j on the scale score.
Based on the above model, we identified three instructional practice scales that are closely aligned with the goals of the PD program offered by the study and are of sufficient reliability. These
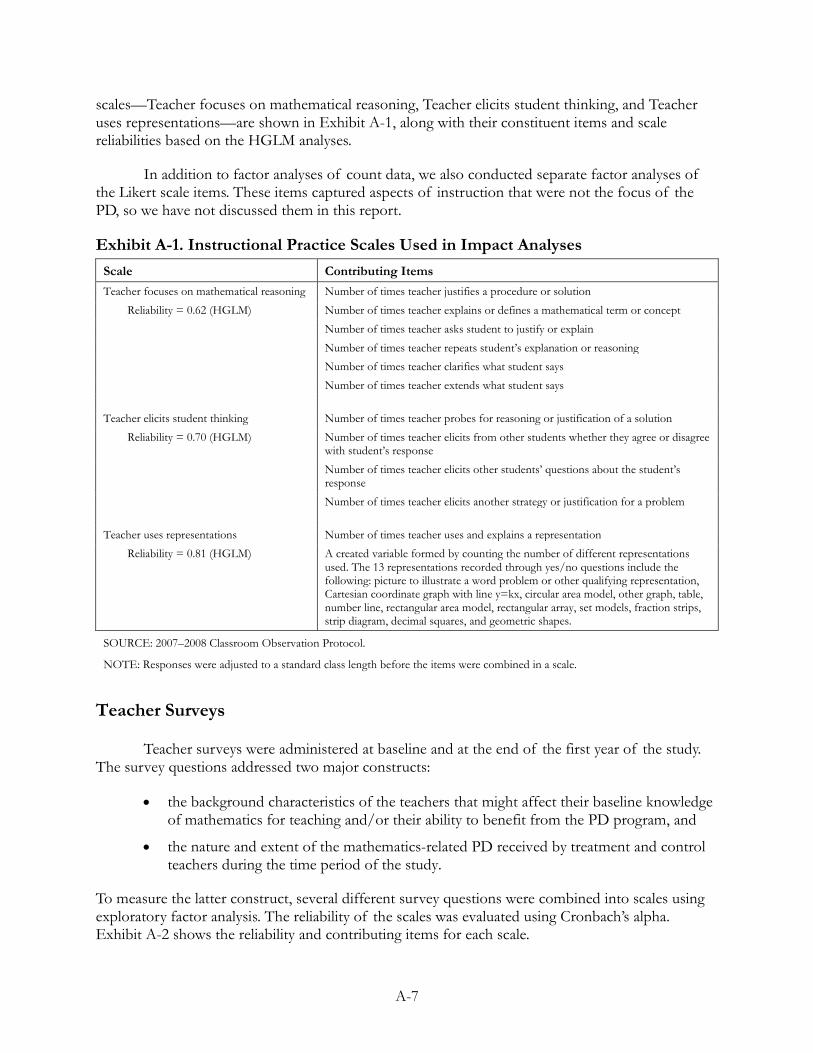
A-7
scales—Teacher focuses on mathematical reasoning, Teacher elicits student thinking, and Teacher uses representations—are shown in Exhibit A-1, along with their constituent items and scale reliabilities based on the HGLM analyses.
In addition to factor analyses of count data, we also conducted separate factor analyses of the Likert scale items. These items captured aspects of instruction that were not the focus of the PD, so we have not discussed them in this report.
Exhibit A-1. Instructional Practice Scales Used in Impact Analyses Scale Contributing Items Teacher focuses on mathematical reasoning
Reliability = 0.62 (HGLM)
Number of times teacher justifies a procedure or solution
Number of times teacher explains or defines a mathematical term or concept
Number of times teacher asks student to justify or explain
Number of times teacher repeats student’s explanation or reasoning Number of times teacher clarifies what student says
Number of times teacher extends what student says
Teacher elicits student thinking Number of times teacher probes for reasoning or justification of a solution
Reliability = 0.70 (HGLM) Number of times teacher elicits from other students whether they agree or disagree with student’s response
Number of times teacher elicits other students’ questions about the student’s response
Number of times teacher elicits another strategy or justification for a problem
Teacher uses representations Number of times teacher uses and explains a representation
Reliability = 0.81 (HGLM) A created variable formed by counting the number of different representations used. The 13 representations recorded through yes/no questions include the following: picture to illustrate a word problem or other qualifying representation, Cartesian coordinate graph with line y=kx, circular area model, other graph, table, number line, rectangular area model, rectangular array, set models, fraction strips, strip diagram, decimal squares, and geometric shapes.
SOURCE: 2007–2008 Classroom Observation Protocol.
NOTE: Responses were adjusted to a standard class length before the items were combined in a scale.
Teacher Surveys
Teacher surveys were administered at baseline and at the end of the first year of the study. The survey questions addressed two major constructs:
•
•
the background characteristics of the teachers that might affect their baseline knowledge of mathematics for teaching and/or their ability to benefit from the PD program, and
the nature and extent of the mathematics-related PD received by treatment and control teachers during the time period of the study.
To measure the latter construct, several different survey questions were combined into scales using exploratory factor analysis. The reliability of the scales was evaluated using Cronbach’s alpha. Exhibit A-2 shows the reliability and contributing items for each scale.
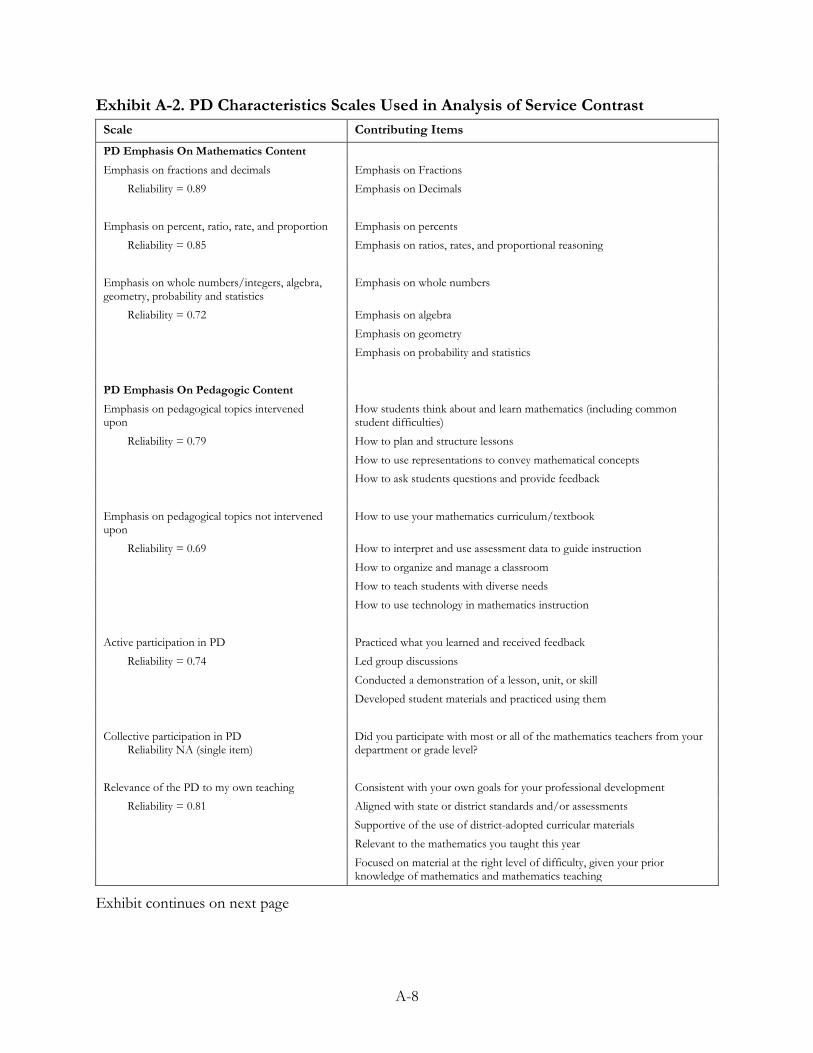
A-8
Exhibit A-2. PD Characteristics Scales Used in Analysis of Service Contrast Scale Contributing Items PD Emphasis On Mathematics Content
Emphasis on fractions and decimals Emphasis on Fractions
Reliability = 0.89 Emphasis on Decimals
Emphasis on percent, ratio, rate, and proportion Emphasis on percents
Reliability = 0.85 Emphasis on ratios, rates, and proportional reasoning
Emphasis on whole numbers/integers, algebra, geometry, probability and statistics
Emphasis on whole numbers
Reliability = 0.72 Emphasis on algebra
Emphasis on geometry
Emphasis on probability and statistics
PD Emphasis On Pedagogic Content
Emphasis on pedagogical topics intervened upon
How students think about and learn mathematics (including common student difficulties)
Reliability = 0.79 How to plan and structure lessons
How to use representations to convey mathematical concepts How to ask students questions and provide feedback
Emphasis on pedagogical topics not intervened upon
How to use your mathematics curriculum/textbook
Reliability = 0.69 How to interpret and use assessment data to guide instruction
How to organize and manage a classroom How to teach students with diverse needs
How to use technology in mathematics instruction
Active participation in PD Practiced what you learned and received feedback
Reliability = 0.74 Led group discussions
Conducted a demonstration of a lesson, unit, or skill
Developed student materials and practiced using them
Collective participation in PD Reliability NA (single item)
Did you participate with most or all of the mathematics teachers from your department or grade level?
Relevance of the PD to my own teaching Consistent with your own goals for your professional development Reliability = 0.81 Aligned with state or district standards and/or assessments
Supportive of the use of district-adopted curricular materials
Relevant to the mathematics you taught this year
Focused on material at the right level of difficulty, given your prior knowledge of mathematics and mathematics teaching
Exhibit continues on next page
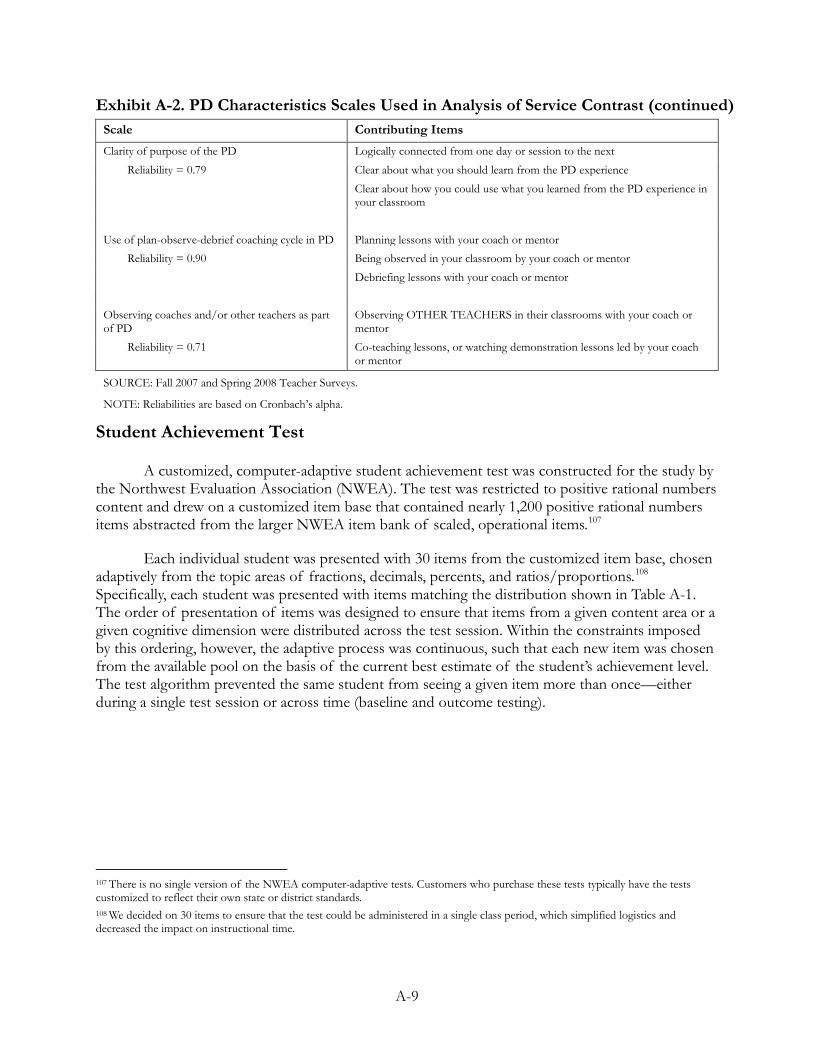
A-9
Exhibit A-2. PD Characteristics Scales Used in Analysis of Service Contrast (continued) Scale Contributing Items Clarity of purpose of the PD Logically connected from one day or session to the next
Reliability = 0.79 Clear about what you should learn from the PD experience
Clear about how you could use what you learned from the PD experience in your classroom
Use of plan-observe-debrief coaching cycle in PD Planning lessons with your coach or mentor Reliability = 0.90 Being observed in your classroom by your coach or mentor
Debriefing lessons with your coach or mentor
Observing coaches and/or other teachers as part of PD
Observing OTHER TEACHERS in their classrooms with your coach or mentor
Reliability = 0.71 Co-teaching lessons, or watching demonstration lessons led by your coach or mentor
SOURCE: Fall 2007 and Spring 2008 Teacher Surveys.
NOTE: Reliabilities are based on Cronbach’s alpha.
Student Achievement Test
A customized, computer-adaptive student achievement test was constructed for the study by the Northwest Evaluation Association (NWEA). The test was restricted to positive rational numbers content and drew on a customized item base that contained nearly 1,200 positive rational numbers items abstracted from the larger NWEA item bank of scaled, operational items.107
Each individual student was presented with 30 items from the customized item base, chosen adaptively from the topic areas of fractions, decimals, percents, and ratios/proportions.
108
Specifically, each student was presented with items matching the distribution shown in Table A-1. The order of presentation of items was designed to ensure that items from a given content area or a given cognitive dimension were distributed across the test session. Within the constraints imposed by this ordering, however, the adaptive process was continuous, such that each new item was chosen from the available pool on the basis of the current best estimate of the student’s achievement level. The test algorithm prevented the same student from seeing a given item more than once—either during a single test session or across time (baseline and outcome testing).
107 There is no single version of the NWEA computer-adaptive tests. Customers who purchase these tests typically have the tests customized to reflect their own state or district standards. 108 We decided on 30 items to ensure that the test could be administered in a single class period, which simplified logistics and decreased the impact on instructional time.
A-10
Table A-1. Distribution of Items on NWEA Rational Number Test
Fractions Decimals Percent Ratio/Proportion Total
Concepts 3 2 2 2 9
Operations 4 1 1 2 8
Applications 4 1 1 7 13
Total 11 4 4 11 30
The text box below presents example items from the customized test. The first two items were easy for most students in our study population; the last two were challenging.
Example Items From Student Achievement Test Example 1:
1. What is 6/12 in simplest form? *A. 1/2 B. 12/24 C. 2/4 D. 1/6 E. 1/12
Example 2: 2. 0.32 ÷ 8 =
A. 4.3 B. 0.15 *C. 0.04 D. 280 E. 43.75
Example 3: 3. What is 2 1/8 written as a decimal?
A. 2.25 B. 2.1 *C. 2.125 D. 2.13 E. 2.5
Example 4: 4. 8 is what % of 32?
A. 1/4 B. 4% C. 20% *D. 25% E. 2.56%
The NWEA test was not intended to be a timed test, and students were allowed to take as
much time as they needed to complete the test. However, the test software did not allow students to skip items. Table A-2 provides information on the mean test duration for students in the treatment and control conditions, at baseline and at the end of the first year.
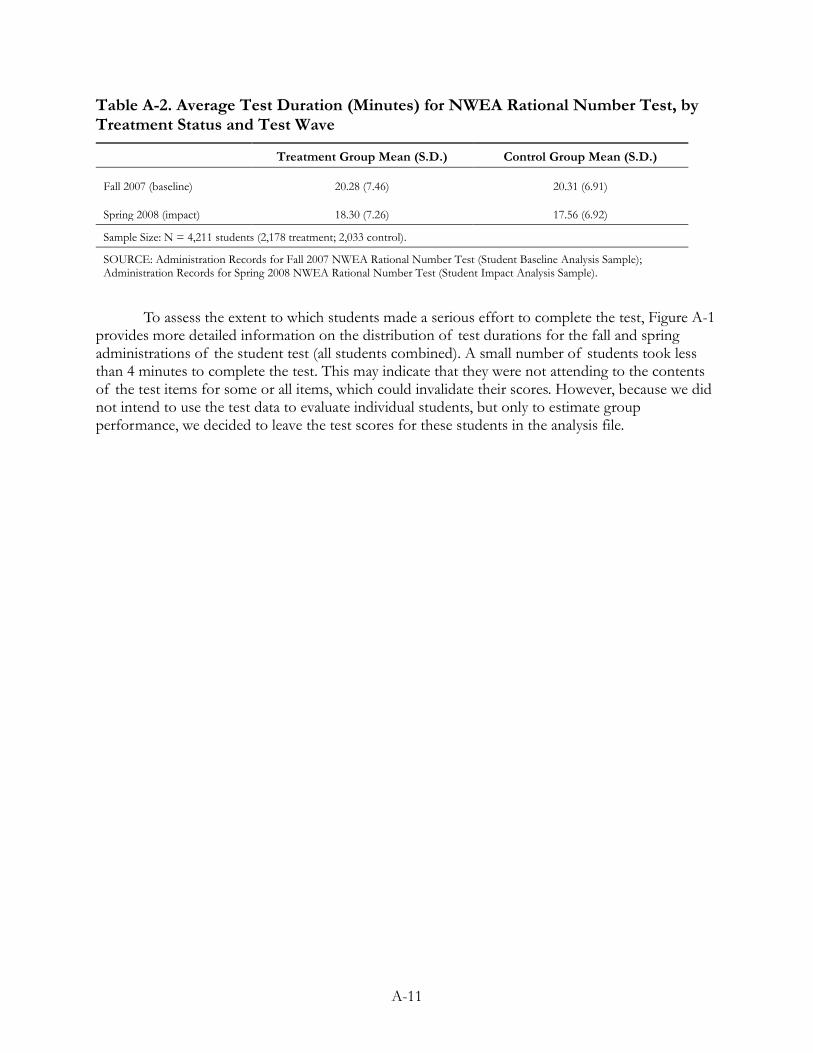
A-11
Table A-2. Average Test Duration (Minutes) for NWEA Rational Number Test, by Treatment Status and Test Wave
Treatment Group Mean (S.D.) Control Group Mean (S.D.)
Fall 2007 (baseline) 20.28 (7.46) 20.31 (6.91)
Spring 2008 (impact) 18.30 (7.26) 17.56 (6.92)
Sample Size: N = 4,211 students (2,178 treatment; 2,033 control).
SOURCE: Administration Records for Fall 2007 NWEA Rational Number Test (Student Baseline Analysis Sample); Administration Records for Spring 2008 NWEA Rational Number Test (Student Impact Analysis Sample).
To assess the extent to which students made a serious effort to complete the test, Figure A-1
provides more detailed information on the distribution of test durations for the fall and spring administrations of the student test (all students combined). A small number of students took less than 4 minutes to complete the test. This may indicate that they were not attending to the contents of the test items for some or all items, which could invalidate their scores. However, because we did not intend to use the test data to evaluate individual students, but only to estimate group performance, we decided to leave the test scores for these students in the analysis file.
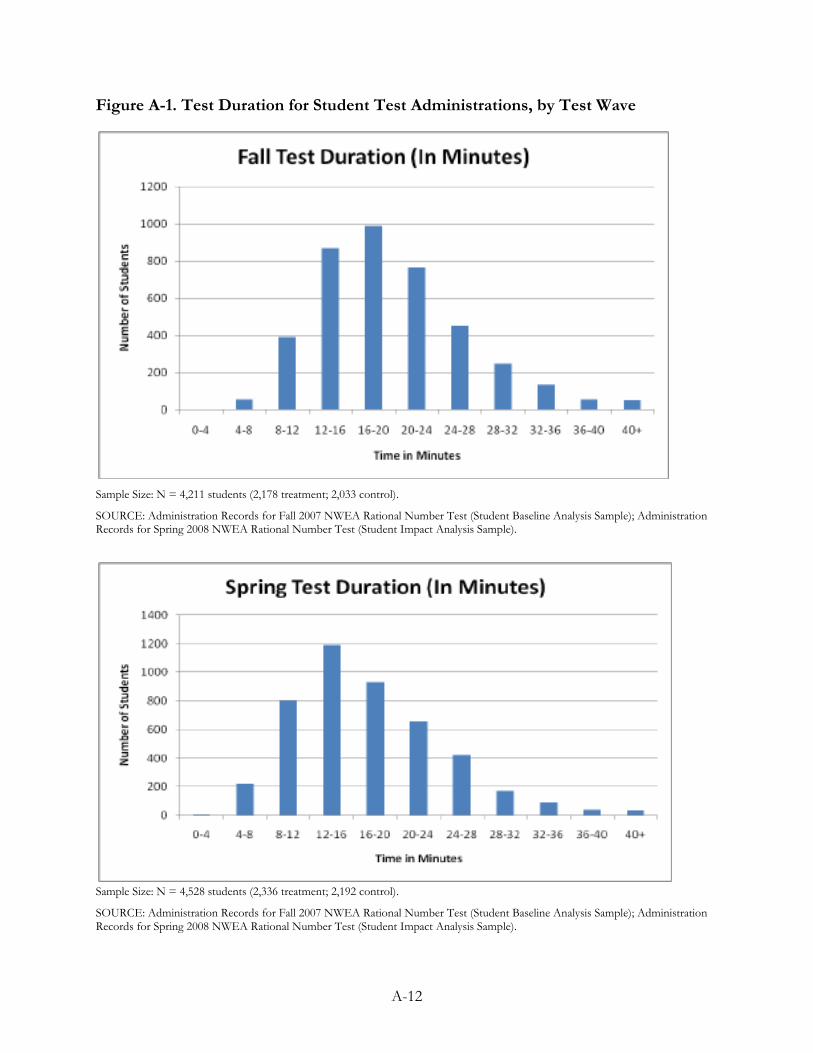
A-12
Figure A-1. Test Duration for Student Test Administrations, by Test Wave
Sample Size: N = 4,211 students (2,178 treatment; 2,033 control).
SOURCE: Administration Records for Fall 2007 NWEA Rational Number Test (Student Baseline Analysis Sample); Administration Records for Spring 2008 NWEA Rational Number Test (Student Impact Analysis Sample).
Sample Size: N = 4,528 students (2,336 treatment; 2,192 control).
SOURCE: Administration Records for Fall 2007 NWEA Rational Number Test (Student Baseline Analysis Sample); Administration Records for Spring 2008 NWEA Rational Number Test (Student Impact Analysis Sample).
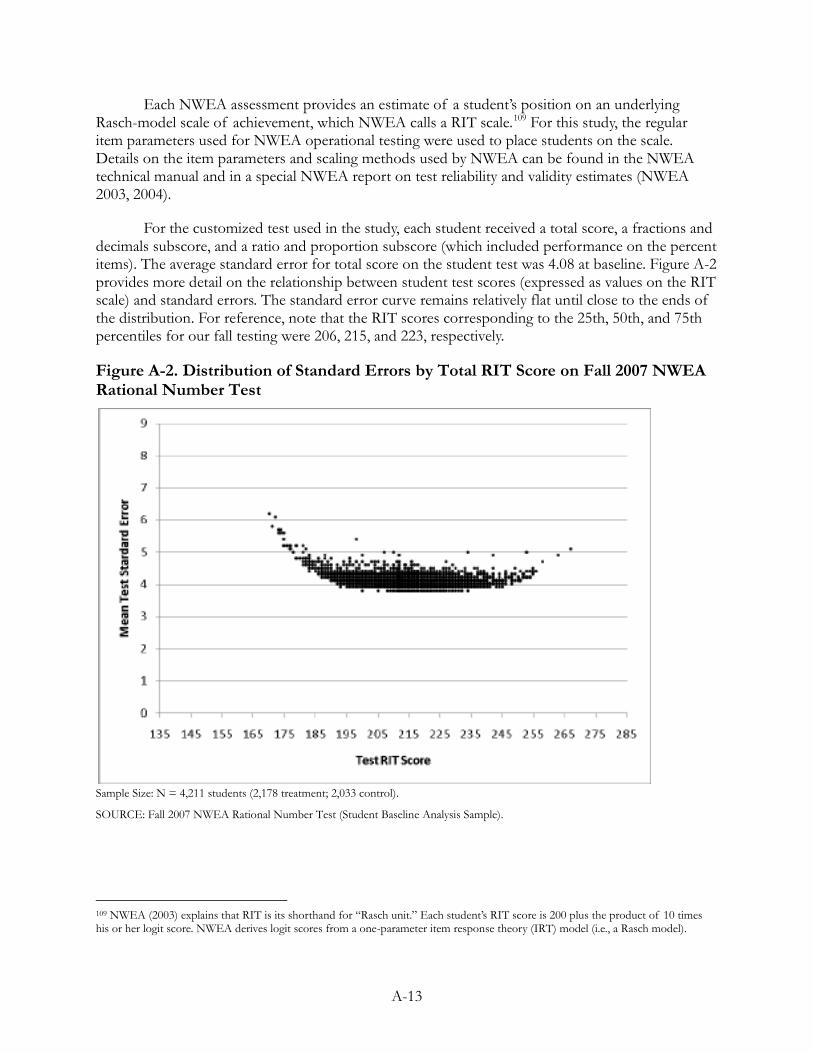
A-13
Each NWEA assessment provides an estimate of a student’s position on an underlying Rasch-model scale of achievement, which NWEA calls a RIT scale.109
For the customized test used in the study, each student received a total score, a fractions and decimals subscore, and a ratio and proportion subscore (which included performance on the percent items). The average standard error for total score on the student test was 4.08 at baseline. Figure A-2 provides more detail on the relationship between student test scores (expressed as values on the RIT scale) and standard errors. The standard error curve remains relatively flat until close to the ends of the distribution. For reference, note that the RIT scores corresponding to the 25th, 50th, and 75th percentiles for our fall testing were 206, 215, and 223, respectively.
For this study, the regular item parameters used for NWEA operational testing were used to place students on the scale. Details on the item parameters and scaling methods used by NWEA can be found in the NWEA technical manual and in a special NWEA report on test reliability and validity estimates (NWEA 2003, 2004).
Figure A-2. Distribution of Standard Errors by Total RIT Score on Fall 2007 NWEA Rational Number Test
Sample Size: N = 4,211 students (2,178 treatment; 2,033 control).
SOURCE: Fall 2007 NWEA Rational Number Test (Student Baseline Analysis Sample).
109 NWEA (2003) explains that RIT is its shorthand for “Rasch unit.” Each student’s RIT score is 200 plus the product of 10 times his or her logit score. NWEA derives logit scores from a one-parameter item response theory (IRT) model (i.e., a Rasch model).

A-14
To aid with the interpretation of the total score results, NWEA also constructed customized, seventh-grade norms by reanalyzing data from its Growth Research Database—a large data base compiled from operational NWEA testing.110
Response Rates
The data set represents students from a wide range of school districts in many states, but it is not specifically tailored to be nationally representative. For the customized norms, test records from seventh-grade students who had answered three or more rational numbers items (and answered at least one rational numbers item correctly) were rescored using only the rational numbers items. This norming sample had a mean scale score of 228.2 for fall and 232.6 for spring, with standard deviations of 17.17 and 18.28, respectively. By comparison, the study sample had a mean scale score of 214.6 (s.d. 13.07) for fall and 217.0 (s.d. 14.70) for spring.
Table A-3 provides information on response rates for each of the teacher and student instruments described in this appendix, separately by treatment status. None of the differences between the treatment and control groups is statistically significant. For teachers, the response rates for the baseline instruments are calculated as the percentage of responses received from teachers who were teaching target classes during the first 10 weeks of the fall semester (the baseline analysis sample). Similarly, the response rates for the outcome instruments are calculated as the percentage of responses received from teachers who were teaching target classes during the final 8 weeks of the spring semester (the impact analysis sample).111
The response rates for students are based on students in the attempted baseline sample and the attempted impact sample. Appendix B explains the manner in which the attempted samples for students were defined.
110 NWEA reported that its Growth Research Database contained more than 115 million scores at the time at which the customized, seventh-grade norms were constructed. 111 Only one teacher per teaching position was included in a particular sample. If teacher turnover occurred during the time window that defined the sample, data from the teacher who was active for the greater part of the window was included.
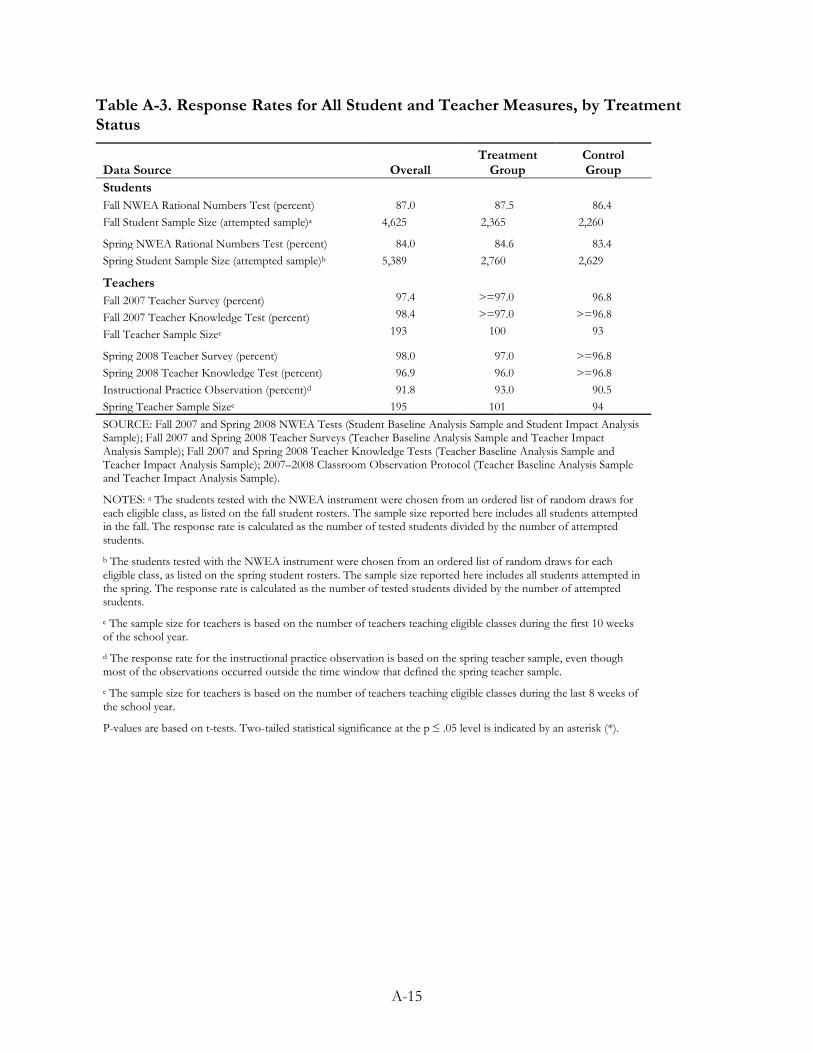
A-15
Table A-3. Response Rates for All Student and Teacher Measures, by Treatment Status
Data Source Overall Treatment
Group Control Group
Students Fall NWEA Rational Numbers Test (percent) 87.0 87.5 86.4 Fall Student Sample Size (attempted sample)a 4,625 2,365 2,260
Spring NWEA Rational Numbers Test (percent) 84.0 84.6 83.4 Spring Student Sample Size (attempted sample)b 5,389 2,760 2,629
Teachers Fall 2007 Teacher Survey (percent) 97.4 >=97.0 96.8
Fall 2007 Teacher Knowledge Test (percent) 98.4 >=97.0 >=96.8
Fall Teacher Sample Sizec 193 100 93
Spring 2008 Teacher Survey (percent) 98.0 97.0 >=96.8 Spring 2008 Teacher Knowledge Test (percent) 96.9 96.0 >=96.8 Instructional Practice Observation (percent)d 91.8 93.0 90.5 Spring Teacher Sample Sizee 195 101 94 SOURCE: Fall 2007 and Spring 2008 NWEA Tests (Student Baseline Analysis Sample and Student Impact Analysis Sample); Fall 2007 and Spring 2008 Teacher Surveys (Teacher Baseline Analysis Sample and Teacher Impact Analysis Sample); Fall 2007 and Spring 2008 Teacher Knowledge Tests (Teacher Baseline Analysis Sample and Teacher Impact Analysis Sample); 2007–2008 Classroom Observation Protocol (Teacher Baseline Analysis Sample and Teacher Impact Analysis Sample).
NOTES: a The students tested with the NWEA instrument were chosen from an ordered list of random draws for each eligible class, as listed on the fall student rosters. The sample size reported here includes all students attempted in the fall. The response rate is calculated as the number of tested students divided by the number of attempted students. b The students tested with the NWEA instrument were chosen from an ordered list of random draws for each eligible class, as listed on the spring student rosters. The sample size reported here includes all students attempted in the spring. The response rate is calculated as the number of tested students divided by the number of attempted students.
c The sample size for teachers is based on the number of teachers teaching eligible classes during the first 10 weeks of the school year. d The response rate for the instructional practice observation is based on the spring teacher sample, even though most of the observations occurred outside the time window that defined the spring teacher sample. e The sample size for teachers is based on the number of teachers teaching eligible classes during the last 8 weeks of the school year.
P-values are based on t-tests. Two-tailed statistical significance at the p ≤ .05 level is indicated by an asterisk (*).


APPENDIX B DETAILS OF THE STUDY SAMPLES AND
ANALYTICAL APPROACHES


B-1
APPENDIX B. DETAILS OF THE STUDY SAMPLES
AND ANALYTIC APPROACHES
This appendix provides additional details on the construction of study samples and the analytic approaches used. The first section compares the schools and teachers in the study with all U.S. public schools with a seventh grade. Subsequent sections provide more detail on the construction of the study’s teacher and student samples and present baseline equivalence test results for subgroups. A final section provides more detailed descriptions of the analytic models used for the impact estimation and addresses issues related to multiple hypothesis tests.
Similarity of School and Teacher Samples to Broader Populations
This section provides a broader frame of reference for the characteristics of the study sample by comparing the study sample with an additional comparison group: all U.S. public schools with a seventh grade. The comparison with eligible schools in large districts that appears in Chapter 2 also appears here.
As shown in Table B-1, the study sample schools were significantly more likely than all schools with a seventh grade to be in the South and less likely to be in the Midwest. The study sample schools were also significantly more likely to be in large- or middle-sized cities and had more students with free or reduced-price lunch status. The study sample schools had fewer White students and more Black and Hispanic students. The study schools also enrolled more seventh graders and were more likely to combine middle and elementary grades.
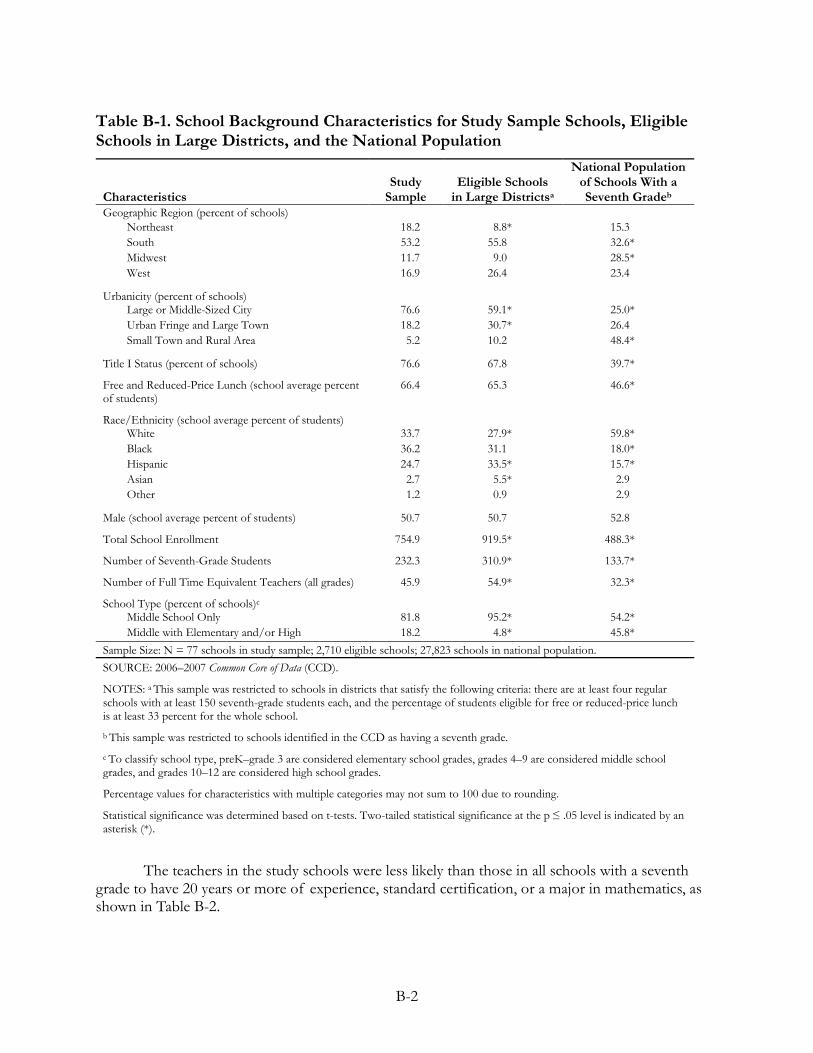
B-2
Table B-1. School Background Characteristics for Study Sample Schools, Eligible Schools in Large Districts, and the National Population
Characteristics Study
Sample Eligible Schools
in Large Districtsa
National Population of Schools With a Seventh Gradeb
Geographic Region (percent of schools) Northeast 18.2 8.8* 15.3 South 53.2 55.8 32.6* Midwest 11.7 9.0 28.5* West 16.9 26.4 23.4
Urbanicity (percent of schools)
Large or Middle-Sized City 76.6 59.1* 25.0* Urban Fringe and Large Town 18.2 30.7* 26.4 Small Town and Rural Area 5.2 10.2 48.4*
Title I Status (percent of schools) 76.6 67.8 39.7*
Free and Reduced-Price Lunch (school average percent of students)
66.4 65.3 46.6*
Race/Ethnicity (school average percent of students)
White 33.7 27.9* 59.8* Black 36.2 31.1 18.0* Hispanic 24.7 33.5* 15.7* Asian 2.7 5.5* 2.9 Other 1.2 0.9 2.9
Male (school average percent of students) 50.7 50.7 52.8
Total School Enrollment 754.9 919.5* 488.3*
Number of Seventh-Grade Students 232.3 310.9* 133.7*
Number of Full Time Equivalent Teachers (all grades) 45.9 54.9* 32.3*
School Type (percent of schools)c
Middle School Only 81.8 95.2* 54.2* Middle with Elementary and/or High 18.2 4.8* 45.8*
Sample Size: N = 77 schools in study sample; 2,710 eligible schools; 27,823 schools in national population. SOURCE: 2006–2007 Common Core of Data (CCD).
NOTES: a This sample was restricted to schools in districts that satisfy the following criteria: there are at least four regular schools with at least 150 seventh-grade students each, and the percentage of students eligible for free or reduced-price lunch is at least 33 percent for the whole school. b This sample was restricted to schools identified in the CCD as having a seventh grade.
c To classify school type, preK–grade 3 are considered elementary school grades, grades 4–9 are considered middle school grades, and grades 10–12 are considered high school grades.
Percentage values for characteristics with multiple categories may not sum to 100 due to rounding.
Statistical significance was determined based on t-tests. Two-tailed statistical significance at the p ≤ .05 level is indicated by an asterisk (*).
The teachers in the study schools were less likely than those in all schools with a seventh
grade to have 20 years or more of experience, standard certification, or a major in mathematics, as shown in Table B-2.
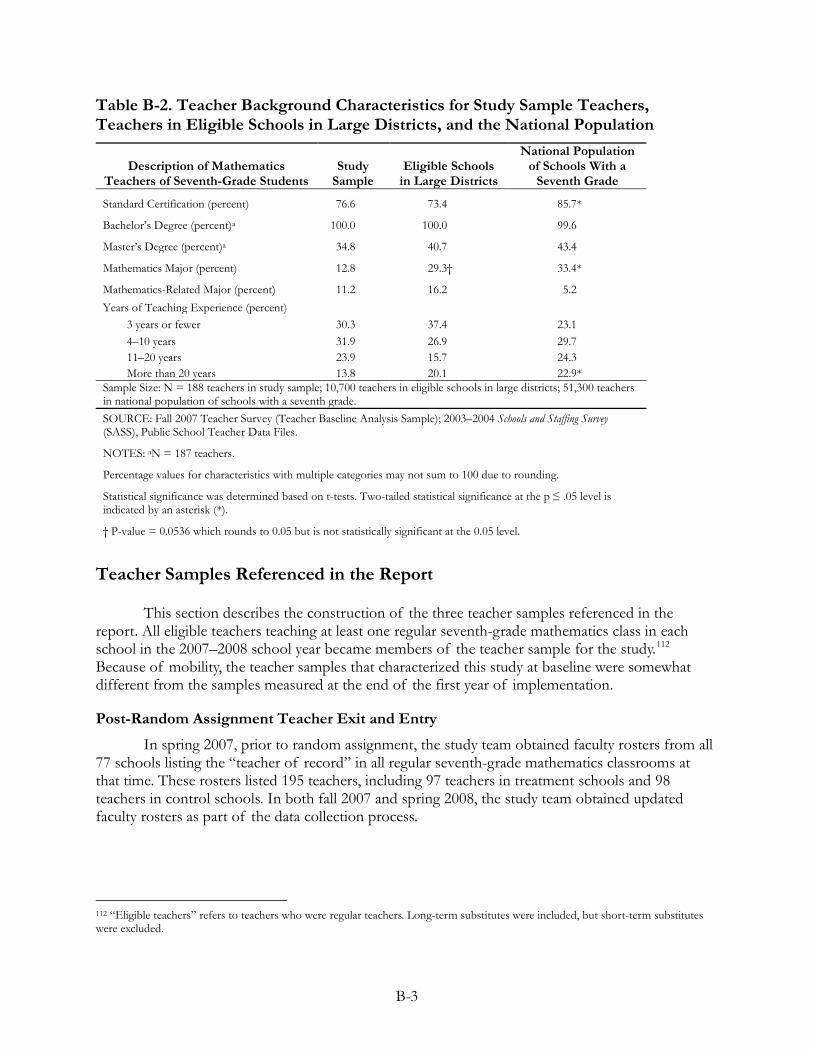
B-3
Table B-2. Teacher Background Characteristics for Study Sample Teachers, Teachers in Eligible Schools in Large Districts, and the National Population
Description of Mathematics Teachers of Seventh-Grade Students
Study Sample
Eligible Schools in Large Districts
National Population of Schools With a
Seventh Grade
Standard Certification (percent) 76.6 73.4 85.7*
Bachelor’s Degree (percent)a 100.0 100.0 99.6
Master’s Degree (percent)a 34.8 40.7 43.4
Mathematics Major (percent) 12.8 29.3† 33.4*
Mathematics-Related Major (percent) 11.2 16.2 5.2 Years of Teaching Experience (percent)
3 years or fewer 30.3 37.4 23.1 4–10 years 31.9 26.9 29.7 11–20 years 23.9 15.7 24.3 More than 20 years 13.8 20.1 22.9*
Sample Size: N = 188 teachers in study sample; 10,700 teachers in eligible schools in large districts; 51,300 teachers in national population of schools with a seventh grade. SOURCE: Fall 2007 Teacher Survey (Teacher Baseline Analysis Sample); 2003–2004 Schools and Staffing Survey (SASS), Public School Teacher Data Files.
NOTES: aN = 187 teachers.
Percentage values for characteristics with multiple categories may not sum to 100 due to rounding.
Statistical significance was determined based on t-tests. Two-tailed statistical significance at the p ≤ .05 level is indicated by an asterisk (*).
† P-value = 0.0536 which rounds to 0.05 but is not statistically significant at the 0.05 level.
Teacher Samples Referenced in the Report
This section describes the construction of the three teacher samples referenced in the report. All eligible teachers teaching at least one regular seventh-grade mathematics class in each school in the 2007–2008 school year became members of the teacher sample for the study.112 Because of mobility, the teacher samples that characterized this study at baseline were somewhat different from the samples measured at the end of the first year of implementation.
Post-Random Assignment Teacher Exit and Entry
In spring 2007, prior to random assignment, the study team obtained faculty rosters from all 77 schools listing the “teacher of record” in all regular seventh-grade mathematics classrooms at that time. These rosters listed 195 teachers, including 97 teachers in treatment schools and 98 teachers in control schools. In both fall 2007 and spring 2008, the study team obtained updated faculty rosters as part of the data collection process.
112 “Eligible teachers” refers to teachers who were regular teachers. Long-term substitutes were included, but short-term substitutes were excluded.
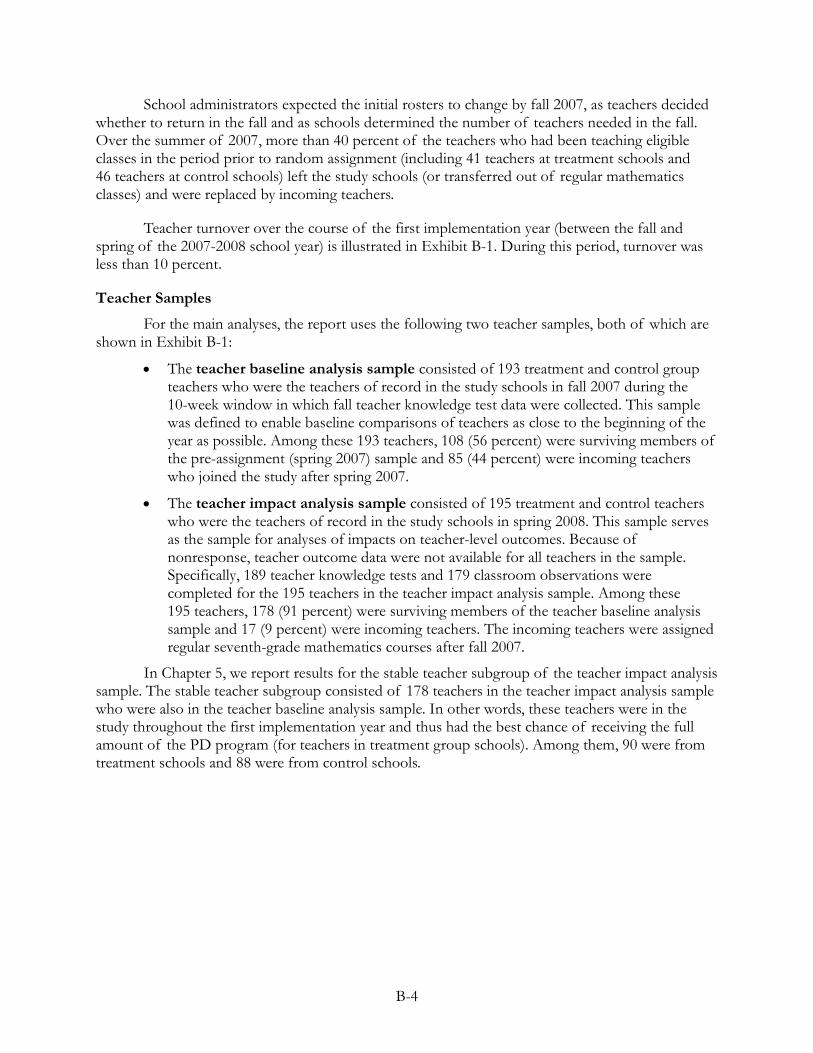
B-4
School administrators expected the initial rosters to change by fall 2007, as teachers decided whether to return in the fall and as schools determined the number of teachers needed in the fall. Over the summer of 2007, more than 40 percent of the teachers who had been teaching eligible classes in the period prior to random assignment (including 41 teachers at treatment schools and 46 teachers at control schools) left the study schools (or transferred out of regular mathematics classes) and were replaced by incoming teachers.
Teacher turnover over the course of the first implementation year (between the fall and spring of the 2007-2008 school year) is illustrated in Exhibit B-1. During this period, turnover was less than 10 percent.
Teacher Samples
For the main analyses, the report uses the following two teacher samples, both of which are shown in Exhibit B-1:
•
•
The teacher baseline analysis sample consisted of 193 treatment and control group teachers who were the teachers of record in the study schools in fall 2007 during the 10-week window in which fall teacher knowledge test data were collected. This sample was defined to enable baseline comparisons of teachers as close to the beginning of the year as possible. Among these 193 teachers, 108 (56 percent) were surviving members of the pre-assignment (spring 2007) sample and 85 (44 percent) were incoming teachers who joined the study after spring 2007.
The teacher impact analysis sample consisted of 195 treatment and control teachers who were the teachers of record in the study schools in spring 2008. This sample serves as the sample for analyses of impacts on teacher-level outcomes. Because of nonresponse, teacher outcome data were not available for all teachers in the sample. Specifically, 189 teacher knowledge tests and 179 classroom observations were completed for the 195 teachers in the teacher impact analysis sample. Among these 195 teachers, 178 (91 percent) were surviving members of the teacher baseline analysis sample and 17 (9 percent) were incoming teachers. The incoming teachers were assigned regular seventh-grade mathematics courses after fall 2007.
In Chapter 5, we report results for the stable teacher subgroup of the teacher impact analysis sample. The stable teacher subgroup consisted of 178 teachers in the teacher impact analysis sample who were also in the teacher baseline analysis sample. In other words, these teachers were in the study throughout the first implementation year and thus had the best chance of receiving the full amount of the PD program (for teachers in treatment group schools). Among them, 90 were from treatment schools and 88 were from control schools.
B-5
Exhibit B-1. Teacher Turnover During the 2007–2008 School Year
Student Samples Referenced in the Report
This section describes the construction of the five student samples referenced in the report. All seventh-grade students in the schools’ regular seventh-grade mathematics classes became members of the student sample of the study.113
113 Among students, those who were sampled for potential testing were evaluated by school personnel to determine whether testing was appropriate. Some students in regular mathematics classes have disabilities or are English language learners, which might preclude them from meaningful participation in testing under the conditions offered by the study. When school personnel determined that these students could not participate meaningfully, the students were removed from the sample. Approximately five percent of students in the fall sample, and three percent of students in the spring sample, were excluded on this basis.
However, because of logistical and budgetary constraints, it was not possible for the study to administer the computer-based NWEA rational
Teacher Baseline Analysis Sample(Total number of teachers in Fall 2007)
N = 193
Teachers in Control Schools
Fall 2007N = 93
Teachers in Treatment Schools
Fall 2007N = 100
Teachers in Treatment Schools
Spring 2008N = 100
Teachers in Control Schools
Spring 2008N=95
Left StudyN = 5
Teacher Impact Analysis Sample(Total number of teachers in Spring 2008)
N = 195
Incoming Teachers
N = 7
Left StudyN = 10
Incoming TeachersN = 10
B-6
number test to all students in each class section. Instead, the study team drew random samples of students to take the NWEA test in fall and spring of the first implementation year. The random selection procedure, together with student mobility during the school year, caused the student samples at baseline to be somewhat different from the samples measured at the end of the first year of implementation. Below we provide information on how students were selected to take the fall and spring NWEA tests and then describe the construction and definition of the student analysis samples referenced in the report.
Random Selection of Students to Take the Fall and Spring NWEA Tests
The sampling procedures for fall and spring testing differed slightly.
Fall sampling process. In the fall, the study sampled 8 students per class roster.114
•
•
•
•
•
To select the fall sample, 16 sequential draws from each class roster were executed to create an ordered sample list of 16 students. These 16 students were assigned line numbers 1 through 16, and the study team began testing from line number 1, moving down through the list until a sample of 8 students had been achieved. A student on the list might not be eligible to be tested for several reasons:
The student had a disability or was an English Language Learner (ELL) and was identified for exclusion on the basis of school review.
The student was withdrawn or otherwise ineligible (i.e., student was not really in any eligible classes).
The student or parent refused testing.
The student was absent on the day of testing.
The student was an alternate who was not needed because 8 students with lower line numbers were successfully tested.
The fall “attempted sample” was defined as all students listed, up to and including the last tested student, minus any excluded, withdrawn, or otherwise ineligible students. Response rates were calculated as the percentage of the attempted sample tested, and makeup sessions were held for any schools in which the overall response rate (across all class rosters) was less than 80 percent.
Spring sampling process. In the spring, the study sampled 9 students per classroom. Using the spring class rosters as the basis for sampling the study team constructed an ordered list of at least 16 students for each participating classroom and tested the first 9 students from the list who were eligible and present for testing. Students who were already known to be ineligible were removed from the class roster before sampling.115
Each ordered list included a combination of incoming and continuing students, with a portion of the continuing student slots assigned with certainty to students who were in the fall attempted sample. Continuing students were defined as all the
114 Because the fall class rosters were obtained early in the school year, there was some movement of students between classes between the time of rostering and the time of testing. The samples were based on the class rosters, rather than the classrooms, meaning that a sampled student who had changed from one eligible classroom to another prior to the test date was still eligible for testing and was tested with the rest of the students on the same class roster unless excluded, refused, or absent. 115 If the first 16 draws included students who were known to be refusing, additional students were added to the list to ensure that the overall list was large enough to yield a sample of 9 students. However, the refusing students were included in the calculation of the response rate.
B-7
students on the spring roster for a given class who had been on any of the class rosters (not necessarily the roster for the same class) in the fall. Incoming students were defined as all students on the spring roster for a given class who entered after the fall class rosters were created.116
The ordered lists were constructed as follows:
•
•
•
The first 9 students on the list were divided between continuing and incoming students in the same proportion as the class overall. All the continuing student slots among these first 9 students were allocated to students who were in the fall attempted sample (unless there were insufficient numbers of such students). If the spring class roster included more students from the fall attempted sample than could be accommodated in the first 9 slots, sequential random draws from among the students that had been in the fall attempted sample were used to fill the slots. Similarly, sequential random draws from among the incoming students were used to fill the incoming student slots.
The remainder of the list was also divided between continuing and incoming students in the same proportion as the class overall. Priority was given to students from the fall attempted sample when filling the continuing student slots in positions 10-16+. That is, students from the fall attempted sample were given a higher sampling probability than other continuing students when drawing students to fill these continuing student slots, but the other continuing students still had a probability greater than zero of being drawn into the spring sample.
Once the ordered list of 16 students for each classroom was formed, the study team began testing from line number 1, moving down through the list until a sample of 9 students had been achieved. If one of the first 9 students in the spring sample was absent or refused, the team tested the next eligible student. Absent and refusing students (including any fall refusing students who fell within in the spring attempted sample), but not ineligible students, counted against the spring participation rates. As in the fall, response rates were calculated as the percentage of the (spring) attempted sample tested, and makeup sessions were held for any schools in which the overall response rate (across all classrooms) was less than 80 percent.
Post-Random Assignment Student Exit and Entry
The study team obtained student rosters from the schools in the fall and spring data collection waves. Exhibit B-2 summarizes student turnover during the 2007–2008 school year. In fall 2007, there were 11,695 students on the class rosters provided by the schools. Among the students on the fall rosters, 51 percent (or 5,991 students) were from treatment group schools and 49 percent (or 5,704 students) were from control group schools. During the school year, about 20 percent of the students who were on the fall rosters left the study schools for various reasons, and almost as many students entered the study sample. The exit and entry rates in the treatment and control groups were similar.117
At the time of spring data collection, there were 11,479 students on the
116 The category of continuing students included students who stayed in the same school but switched from one eligible mathematics class to another. This definition was chosen to maximize the number of fall-tested students in the spring testing and to simplify the sampling strategy. 117 The exit rates were 20.8 percent and 19.7 percent for the treatment and control groups, respectively; the entry rates were 18.6 percent and 18.3 percent for the treatment and control groups, respectively.
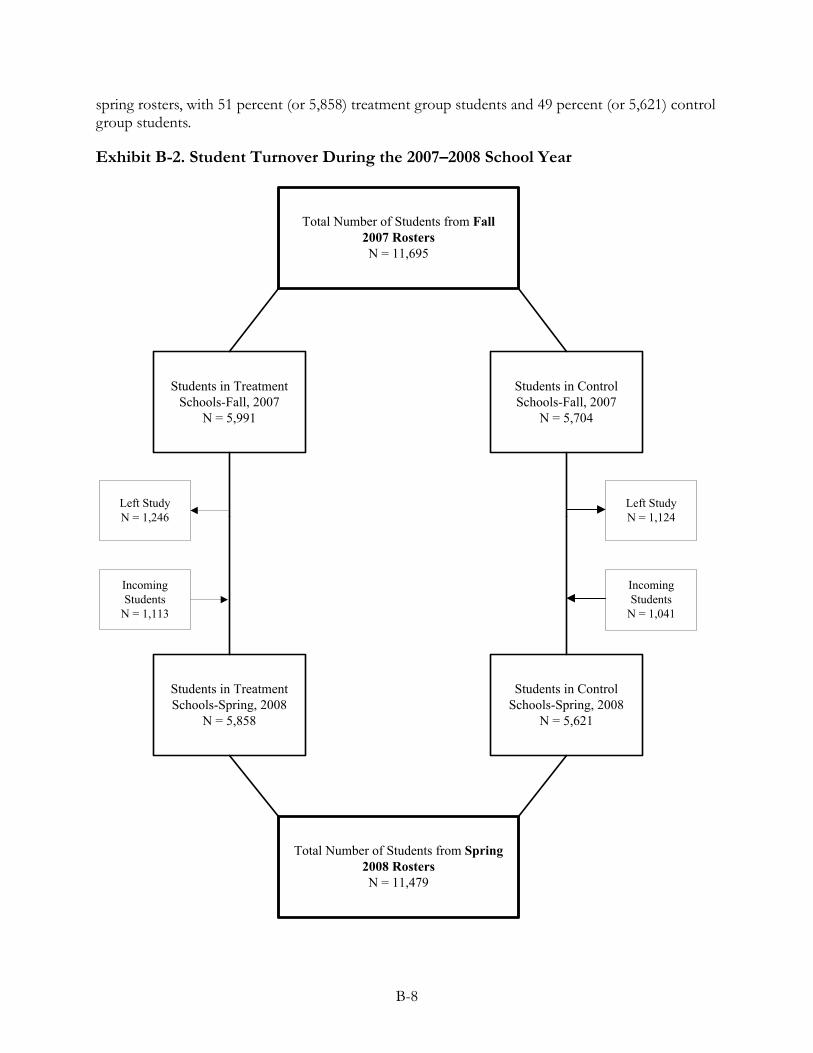
B-8
spring rosters, with 51 percent (or 5,858) treatment group students and 49 percent (or 5,621) control group students.
Exhibit B-2. Student Turnover During the 2007–2008 School Year
Total Number of Students from Fall 2007 RostersN = 11,695
Students in Treatment Schools-Fall, 2007
N = 5,991
Students in Control Schools-Fall, 2007
N = 5,704
Students in Treatment Schools-Spring, 2008
N = 5,858
Students in Control Schools-Spring, 2008
N = 5,621
Left StudyN = 1,246
Left Study N = 1,124
Total Number of Students from Spring 2008 RostersN = 11,479
Incoming Students
N = 1,041
Incoming Students
N = 1,113
B-9
Student Samples
For the main analyses of student outcomes, the report uses the following three student samples:
•
•
•
The student baseline analysis sample consisted of 4,211 eligible students who were on the fall 2007 class rosters, who consented to the data collection requests, and whom we attempted to test per our fall 2007 student sampling procedures. About 52 percent of them (or 2,178 students) were from treatment schools and the remaining 48 percent (or 2,033 students) were from control schools. Exhibit B-3 demonstrates how this sample was constructed. Not every student in this sample had a valid fall NWEA test score because some students were absent during testing. These students were still included in the baseline analysis if their demographic information was available to the study team.
The student impact analysis sample consisted of 4,528 eligible students who were on the spring 2008 class rosters, who consented to the data collection requests, and whom we attempted to test per our spring 2008 student sampling procedures. About 52 percent of them (or 2,336 students) were from treatment schools and the remaining 48 percent (or 2,192 students) were from control schools. Exhibit B-4 demonstrates how this sample was constructed.
Within the student impact analysis sample, the students of stable teachers subgroup consisted of 4,152 students from the student impact analysis sample whose teachers were “stable,” that is, were present at the same study schools in the fall and the spring of the 2007–2008 school year. This sample was used to investigate the relationship between the treatment and student outcomes among students whose teachers had the best chance of receiving the full amount of the program-provided professional development (for teachers in treatment group schools).
In addition, the study team collected demographic information and scores on district administered mathematics tests from district student records for the following two expanded samples of students:
•
•
The fall expanded student sample consisted of 11,062 students (5,697 treatment students and 5,365 control students) who were on the fall 2007 student rosters, whose parents had consented to the study, and for whom the district was able to provide data.
The spring expanded student sample consisted of 10,915 students (5,587 treatment students and 5,328 control students) who were on the spring 2008 student rosters, whose parents had consented to the study, and for whom the district was able to provide data.
Because of the eligibility criteria and the sampling procedures, we expect that the students who appear in the analysis samples may differ from those who appear only in the expanded samples. Table B-3 presents the comparisons in background characteristics between the students in the baseline analysis sample and students who only appear in the fall expanded student sample. Table B-4 presents the same comparisons between the students in the student impact analysis sample and the students who appear only in the spring expanded student sample. Test results presented in both tables demonstrate that the two samples are statistically different in the following aspects: students included in the analysis samples were younger, were more likely to be eligible for free or reduced-price lunch, and had higher sixth-grade state mathematics test scores than those who appear only in
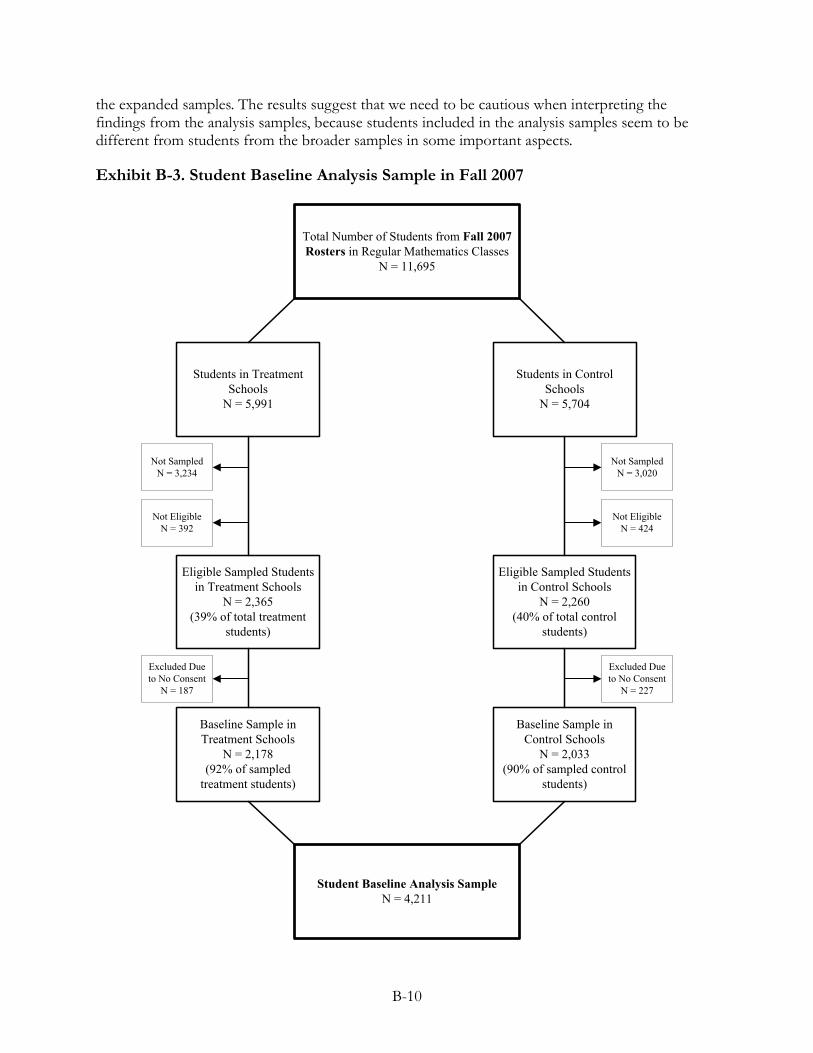
B-10
the expanded samples. The results suggest that we need to be cautious when interpreting the findings from the analysis samples, because students included in the analysis samples seem to be different from students from the broader samples in some important aspects.
Exhibit B-3. Student Baseline Analysis Sample in Fall 2007
Total Number of Students from Fall 2007 Rosters in Regular Mathematics Classes
N = 11,695
Students in Treatment Schools
N = 5,991
Students in Control Schools
N = 5,704
Eligible Sampled Students in Control Schools
N = 2,260(40% of total control
students)
Eligible Sampled Students in Treatment Schools
N = 2,365(39% of total treatment
students)
Baseline Sample in Treatment Schools
N = 2,178(92% of sampled
treatment students)
Baseline Sample in Control Schools
N = 2,033(90% of sampled control
students)
Excluded Due to No Consent
N = 187
Excluded Due to No Consent
N = 227
Student Baseline Analysis SampleN = 4,211
Not EligibleN = 392
Not EligibleN = 424
Not SampledN = 3,234
Not Sampled N = 3,020
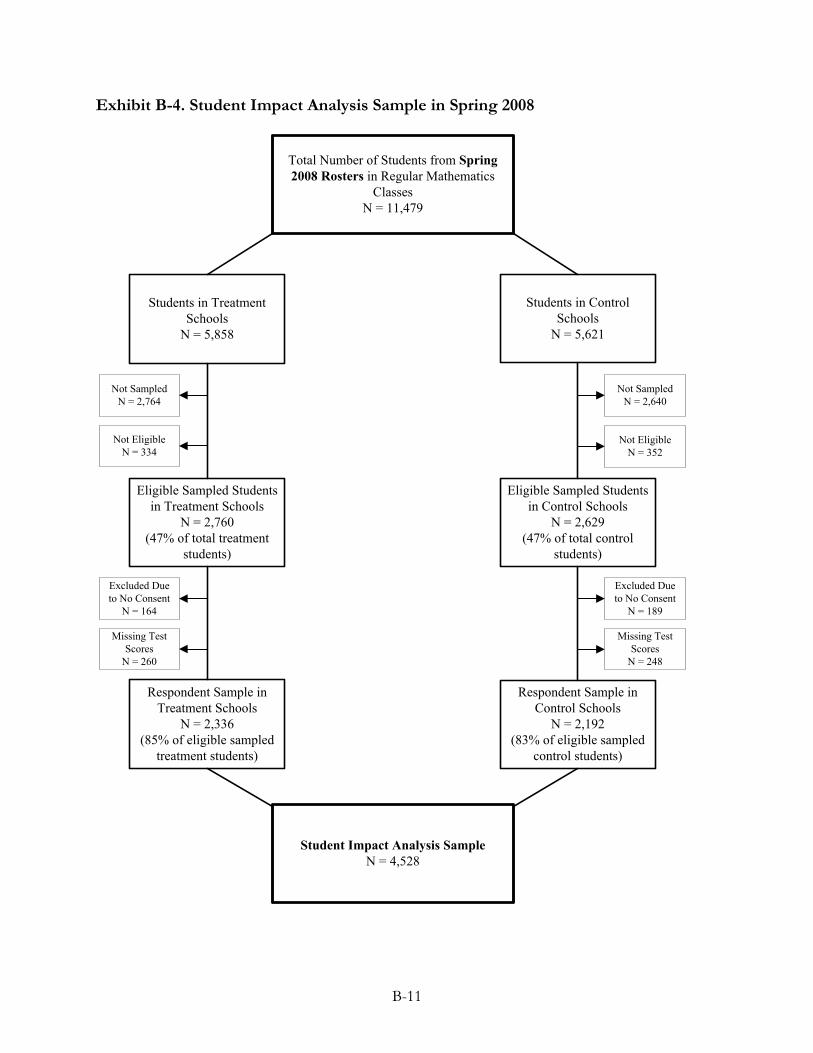
B-11
Exhibit B-4. Student Impact Analysis Sample in Spring 2008
Total Number of Students from Spring 2008 Rosters in Regular Mathematics
ClassesN = 11,479
Students in Treatment Schools
N = 5,858
Students in Control Schools
N = 5,621
Eligible Sampled Students in Control Schools
N = 2,629(47% of total control
students)
Eligible Sampled Students in Treatment Schools
N = 2,760(47% of total treatment
students)
Respondent Sample in Treatment Schools
N = 2,336(85% of eligible sampled
treatment students)
Respondent Sample in Control Schools
N = 2,192(83% of eligible sampled
control students)
Excluded Due to No Consent
N = 189
Student Impact Analysis SampleN = 4,528
Missing Test Scores
N = 248
Not EligibleN = 334
Not SampledN = 2,764
Not EligibleN = 352
Not SampledN = 2,640
Excluded Due to No Consent
N = 164
Missing Test Scores
N = 260
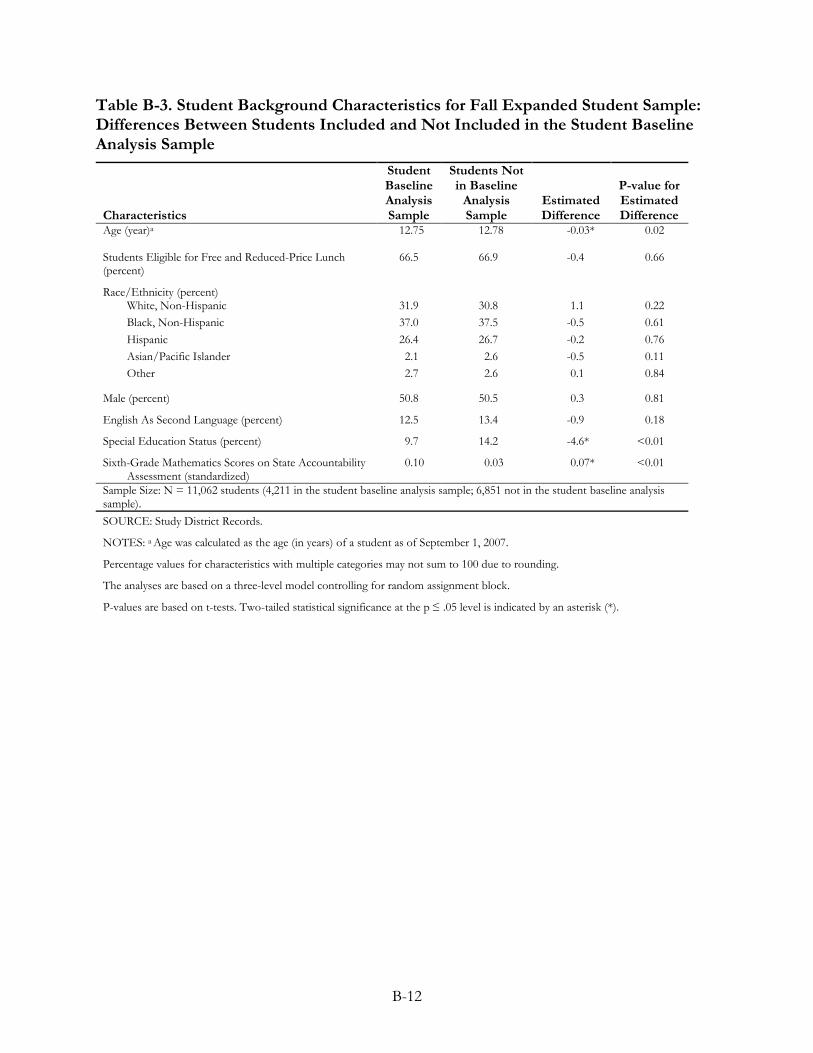
B-12
Table B-3. Student Background Characteristics for Fall Expanded Student Sample: Differences Between Students Included and Not Included in the Student Baseline Analysis Sample
Characteristics
Student Baseline Analysis Sample
Students Not in Baseline
Analysis Sample
Estimated Difference
P-value for Estimated Difference
Age (year)a 12.75 12.78 -0.03* 0.02
Students Eligible for Free and Reduced-Price Lunch (percent)
66.5 66.9 -0.4 0.66
Race/Ethnicity (percent)
White, Non-Hispanic 31.9 30.8 1.1 0.22 Black, Non-Hispanic 37.0 37.5 -0.5 0.61 Hispanic 26.4 26.7 -0.2 0.76 Asian/Pacific Islander 2.1 2.6 -0.5 0.11 Other 2.7 2.6 0.1 0.84
Male (percent) 50.8 50.5 0.3 0.81
English As Second Language (percent) 12.5 13.4 -0.9 0.18
Special Education Status (percent) 9.7 14.2 -4.6* <0.01
Sixth-Grade Mathematics Scores on State Accountability Assessment (standardized)
0.10 0.03 0.07* <0.01
Sample Size: N = 11,062 students (4,211 in the student baseline analysis sample; 6,851 not in the student baseline analysis sample). SOURCE: Study District Records.
NOTES: a Age was calculated as the age (in years) of a student as of September 1, 2007.
Percentage values for characteristics with multiple categories may not sum to 100 due to rounding.
The analyses are based on a three-level model controlling for random assignment block.
P-values are based on t-tests. Two-tailed statistical significance at the p ≤ .05 level is indicated by an asterisk (*).
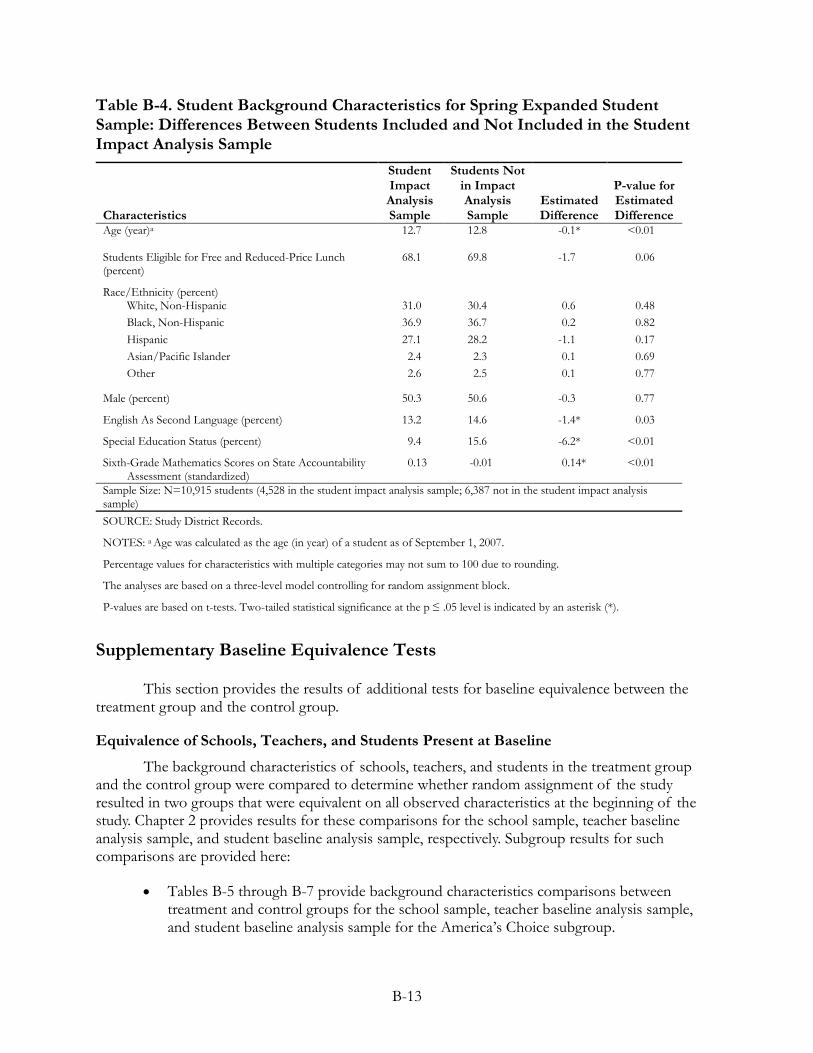
B-13
Table B-4. Student Background Characteristics for Spring Expanded Student Sample: Differences Between Students Included and Not Included in the Student Impact Analysis Sample
Characteristics
Student Impact Analysis Sample
Students Not in Impact Analysis Sample
Estimated Difference
P-value for Estimated Difference
Age (year)a 12.7 12.8 -0.1* <0.01
Students Eligible for Free and Reduced-Price Lunch (percent)
68.1 69.8 -1.7 0.06
Race/Ethnicity (percent)
White, Non-Hispanic 31.0 30.4 0.6 0.48 Black, Non-Hispanic 36.9 36.7 0.2 0.82 Hispanic 27.1 28.2 -1.1 0.17 Asian/Pacific Islander 2.4 2.3 0.1 0.69 Other 2.6 2.5 0.1 0.77
Male (percent) 50.3 50.6 -0.3 0.77
English As Second Language (percent) 13.2 14.6 -1.4* 0.03
Special Education Status (percent) 9.4 15.6 -6.2* <0.01
Sixth-Grade Mathematics Scores on State Accountability Assessment (standardized)
0.13 -0.01 0.14* <0.01
Sample Size: N=10,915 students (4,528 in the student impact analysis sample; 6,387 not in the student impact analysis sample) SOURCE: Study District Records.
NOTES: a Age was calculated as the age (in year) of a student as of September 1, 2007.
Percentage values for characteristics with multiple categories may not sum to 100 due to rounding.
The analyses are based on a three-level model controlling for random assignment block.
P-values are based on t-tests. Two-tailed statistical significance at the p ≤ .05 level is indicated by an asterisk (*).
Supplementary Baseline Equivalence Tests
This section provides the results of additional tests for baseline equivalence between the treatment group and the control group.
Equivalence of Schools, Teachers, and Students Present at Baseline
The background characteristics of schools, teachers, and students in the treatment group and the control group were compared to determine whether random assignment of the study resulted in two groups that were equivalent on all observed characteristics at the beginning of the study. Chapter 2 provides results for these comparisons for the school sample, teacher baseline analysis sample, and student baseline analysis sample, respectively. Subgroup results for such comparisons are provided here:
• Tables B-5 through B-7 provide background characteristics comparisons between treatment and control groups for the school sample, teacher baseline analysis sample, and student baseline analysis sample for the America’s Choice subgroup.
B-14
•
•
•
•
•
Tables B-8 through B-10 provide background characteristics comparisons between treatment and control groups for the school sample, teacher baseline analysis sample, and student baseline analysis sample for the Pearson Achievement Solutions subgroup.
Tables B-11 through B-13 provide background characteristics comparisons between treatment and control groups for the school sample, teacher baseline analysis sample, and student baseline analysis sample for the CMP curriculum subgroup.
Tables B-14 through B-16 provide background characteristics comparisons between treatment and control groups for the school sample, teacher baseline analysis sample, and student baseline analysis sample for the Glencoe/PH Mathematics curriculum subgroup.
Tables B-17 through B-18 provide background characteristics comparisons between treatment and control groups for the teacher and student baseline analysis samples for the stable teacher subgroup.
Table B-19 provides background characteristics comparisons between treatment and control groups for the fall expanded student sample.
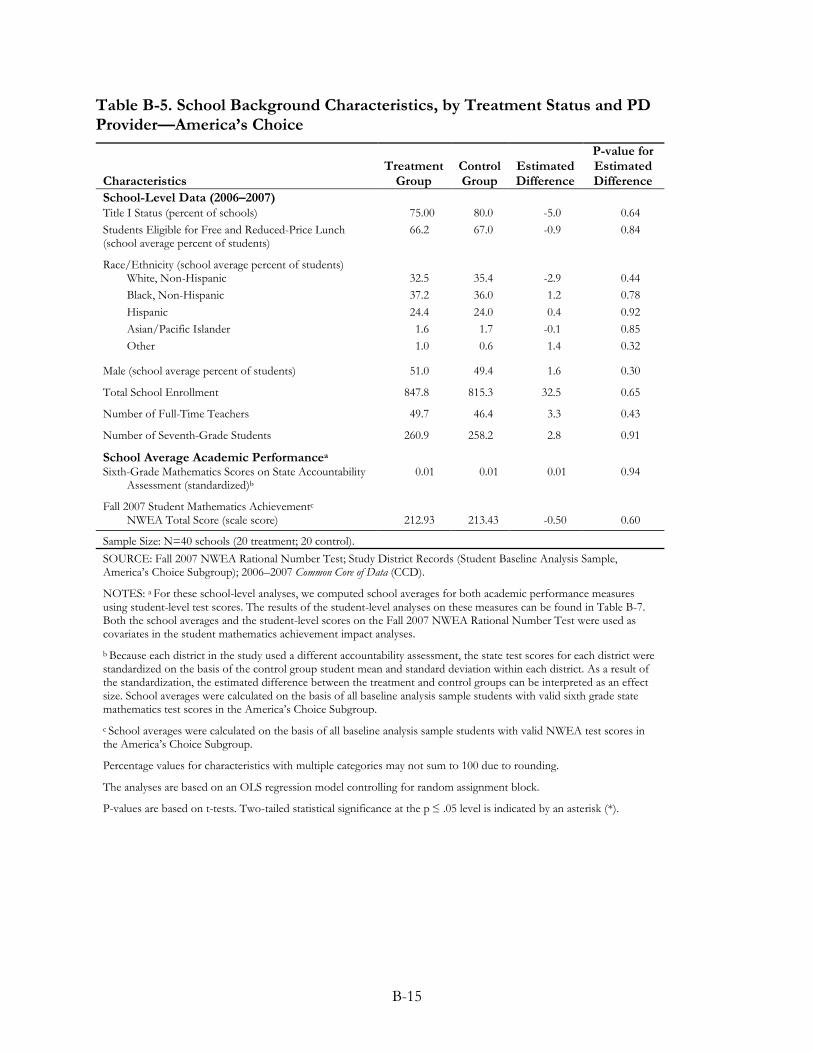
B-15
Table B-5. School Background Characteristics, by Treatment Status and PD Provider—America’s Choice
Characteristics Treatment
Group Control Group
Estimated Difference
P-value for Estimated Difference
School-Level Data (2006–2007) Title I Status (percent of schools) 75.00 80.0 -5.0 0.64 Students Eligible for Free and Reduced-Price Lunch (school average percent of students)
66.2 67.0 -0.9 0.84
Race/Ethnicity (school average percent of students)
White, Non-Hispanic 32.5 35.4 -2.9 0.44 Black, Non-Hispanic 37.2 36.0 1.2 0.78 Hispanic 24.4 24.0 0.4 0.92 Asian/Pacific Islander 1.6 1.7 -0.1 0.85 Other 1.0 0.6 1.4 0.32
Male (school average percent of students) 51.0 49.4 1.6 0.30
Total School Enrollment 847.8 815.3 32.5 0.65
Number of Full-Time Teachers 49.7 46.4 3.3 0.43
Number of Seventh-Grade Students 260.9 258.2 2.8 0.91
School Average Academic Performancea
Sixth-Grade Mathematics Scores on State Accountability Assessment (standardized)b
0.01 0.01 0.01 0.94
Fall 2007 Student Mathematics Achievementc
NWEA Total Score (scale score) 212.93 213.43 -0.50 0.60
Sample Size: N=40 schools (20 treatment; 20 control). SOURCE: Fall 2007 NWEA Rational Number Test; Study District Records (Student Baseline Analysis Sample, America’s Choice Subgroup); 2006–2007 Common Core of Data (CCD).
NOTES: a For these school-level analyses, we computed school averages for both academic performance measures using student-level test scores. The results of the student-level analyses on these measures can be found in Table B-7. Both the school averages and the student-level scores on the Fall 2007 NWEA Rational Number Test were used as covariates in the student mathematics achievement impact analyses.
b Because each district in the study used a different accountability assessment, the state test scores for each district were standardized on the basis of the control group student mean and standard deviation within each district. As a result of the standardization, the estimated difference between the treatment and control groups can be interpreted as an effect size. School averages were calculated on the basis of all baseline analysis sample students with valid sixth grade state mathematics test scores in the America’s Choice Subgroup.
c School averages were calculated on the basis of all baseline analysis sample students with valid NWEA test scores in the America’s Choice Subgroup.
Percentage values for characteristics with multiple categories may not sum to 100 due to rounding.
The analyses are based on an OLS regression model controlling for random assignment block.
P-values are based on t-tests. Two-tailed statistical significance at the p ≤ .05 level is indicated by an asterisk (*).
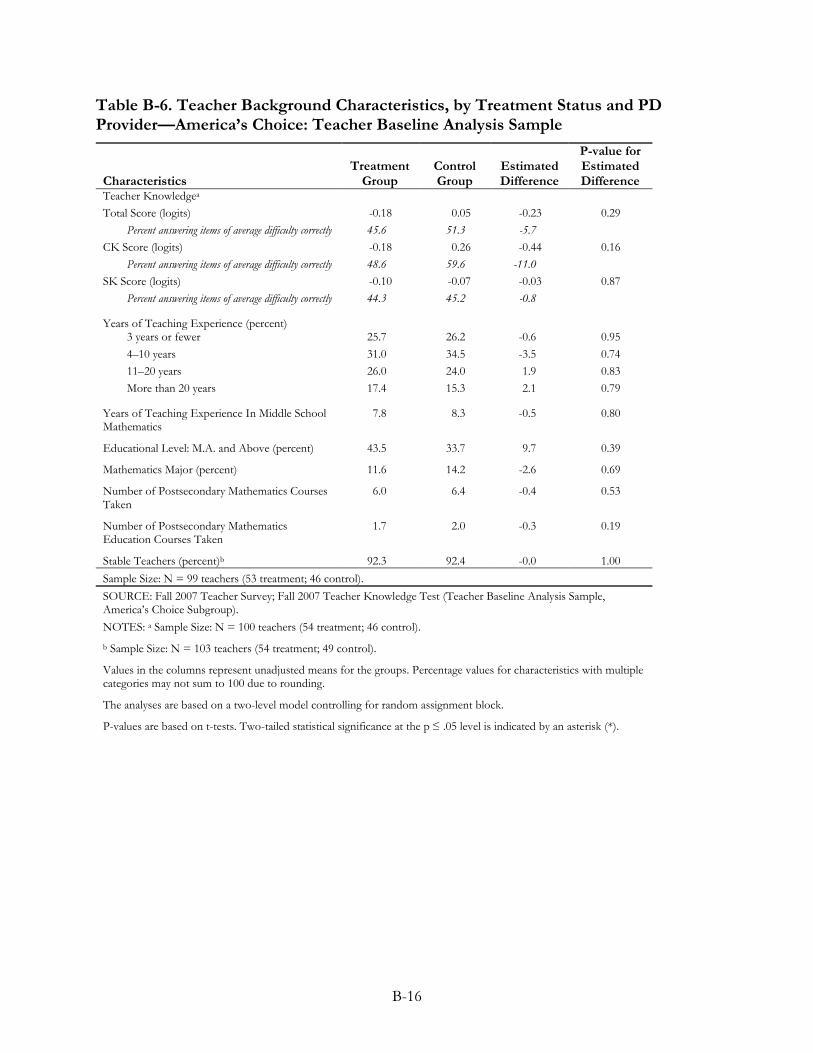
B-16
Table B-6. Teacher Background Characteristics, by Treatment Status and PD Provider—America’s Choice: Teacher Baseline Analysis Sample
Characteristics Treatment
Group Control Group
Estimated Difference
P-value for Estimated Difference
Teacher Knowledgea Total Score (logits) -0.18 0.05 -0.23 0.29
Percent answering items of average difficulty correctly 45.6 51.3 -5.7 CK Score (logits) -0.18 0.26 -0.44 0.16
Percent answering items of average difficulty correctly 48.6 59.6 -11.0 SK Score (logits) -0.10 -0.07 -0.03 0.87
Percent answering items of average difficulty correctly 44.3 45.2 -0.8
Years of Teaching Experience (percent)
3 years or fewer 25.7 26.2 -0.6 0.95 4–10 years 31.0 34.5 -3.5 0.74 11–20 years 26.0 24.0 1.9 0.83 More than 20 years 17.4 15.3 2.1 0.79
Years of Teaching Experience In Middle School Mathematics
7.8 8.3 -0.5 0.80
Educational Level: M.A. and Above (percent) 43.5 33.7 9.7 0.39
Mathematics Major (percent) 11.6 14.2 -2.6 0.69
Number of Postsecondary Mathematics Courses Taken
6.0 6.4 -0.4 0.53
Number of Postsecondary Mathematics Education Courses Taken
1.7 2.0 -0.3 0.19
Stable Teachers (percent)b 92.3 92.4 -0.0 1.00 Sample Size: N = 99 teachers (53 treatment; 46 control). SOURCE: Fall 2007 Teacher Survey; Fall 2007 Teacher Knowledge Test (Teacher Baseline Analysis Sample, America’s Choice Subgroup). NOTES: a Sample Size: N = 100 teachers (54 treatment; 46 control).
b Sample Size: N = 103 teachers (54 treatment; 49 control).
Values in the columns represent unadjusted means for the groups. Percentage values for characteristics with multiple categories may not sum to 100 due to rounding.
The analyses are based on a two-level model controlling for random assignment block.
P-values are based on t-tests. Two-tailed statistical significance at the p ≤ .05 level is indicated by an asterisk (*).
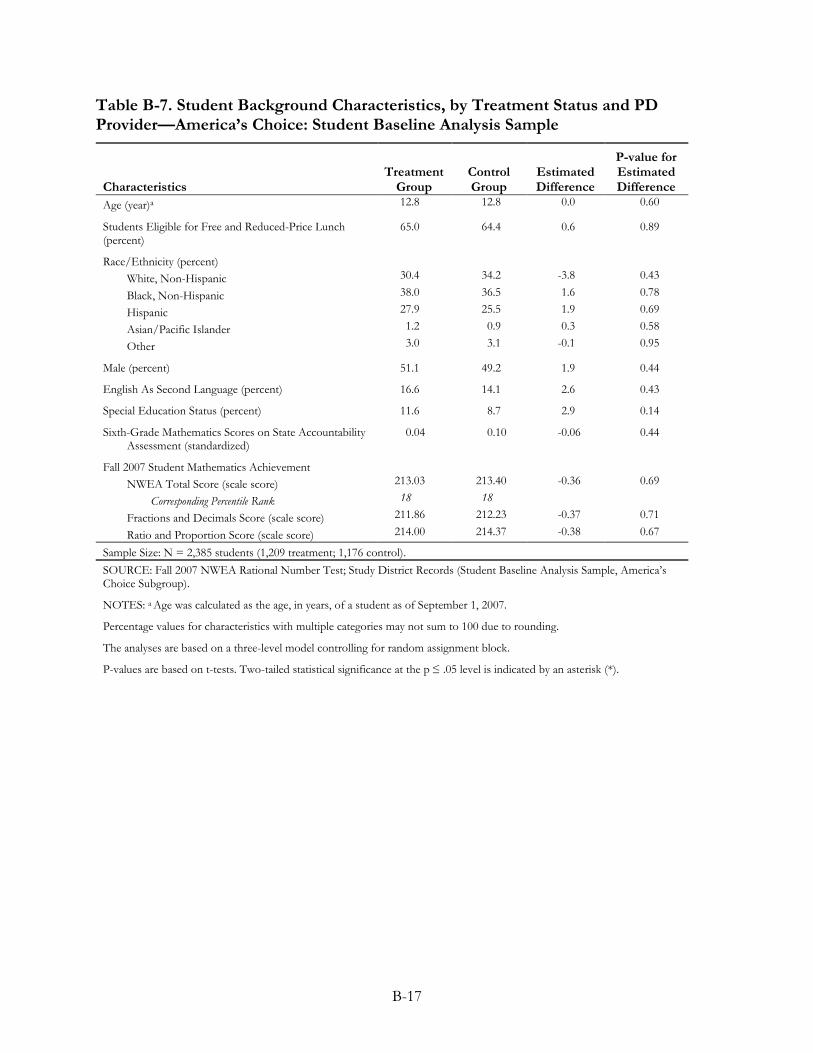
B-17
Table B-7. Student Background Characteristics, by Treatment Status and PD Provider—America’s Choice: Student Baseline Analysis Sample
Characteristics Treatment
Group Control Group
Estimated Difference
P-value for Estimated Difference
Age (year)a 12.8 12.8 0.0 0.60
Students Eligible for Free and Reduced-Price Lunch (percent)
65.0 64.4 0.6 0.89
Race/Ethnicity (percent)
White, Non-Hispanic 30.4 34.2 -3.8 0.43
Black, Non-Hispanic 38.0 36.5 1.6 0.78
Hispanic 27.9 25.5 1.9 0.69
Asian/Pacific Islander 1.2 0.9 0.3 0.58
Other 3.0 3.1 -0.1 0.95
Male (percent) 51.1 49.2 1.9 0.44
English As Second Language (percent) 16.6 14.1 2.6 0.43
Special Education Status (percent) 11.6 8.7 2.9 0.14
Sixth-Grade Mathematics Scores on State Accountability Assessment (standardized)
0.04 0.10 -0.06 0.44
Fall 2007 Student Mathematics Achievement
NWEA Total Score (scale score) 213.03 213.40 -0.36 0.69
Corresponding Percentile Rank 18 18
Fractions and Decimals Score (scale score) 211.86 212.23 -0.37 0.71
Ratio and Proportion Score (scale score) 214.00 214.37 -0.38 0.67
Sample Size: N = 2,385 students (1,209 treatment; 1,176 control). SOURCE: Fall 2007 NWEA Rational Number Test; Study District Records (Student Baseline Analysis Sample, America’s Choice Subgroup).
NOTES: a Age was calculated as the age, in years, of a student as of September 1, 2007.
Percentage values for characteristics with multiple categories may not sum to 100 due to rounding.
The analyses are based on a three-level model controlling for random assignment block.
P-values are based on t-tests. Two-tailed statistical significance at the p ≤ .05 level is indicated by an asterisk (*).
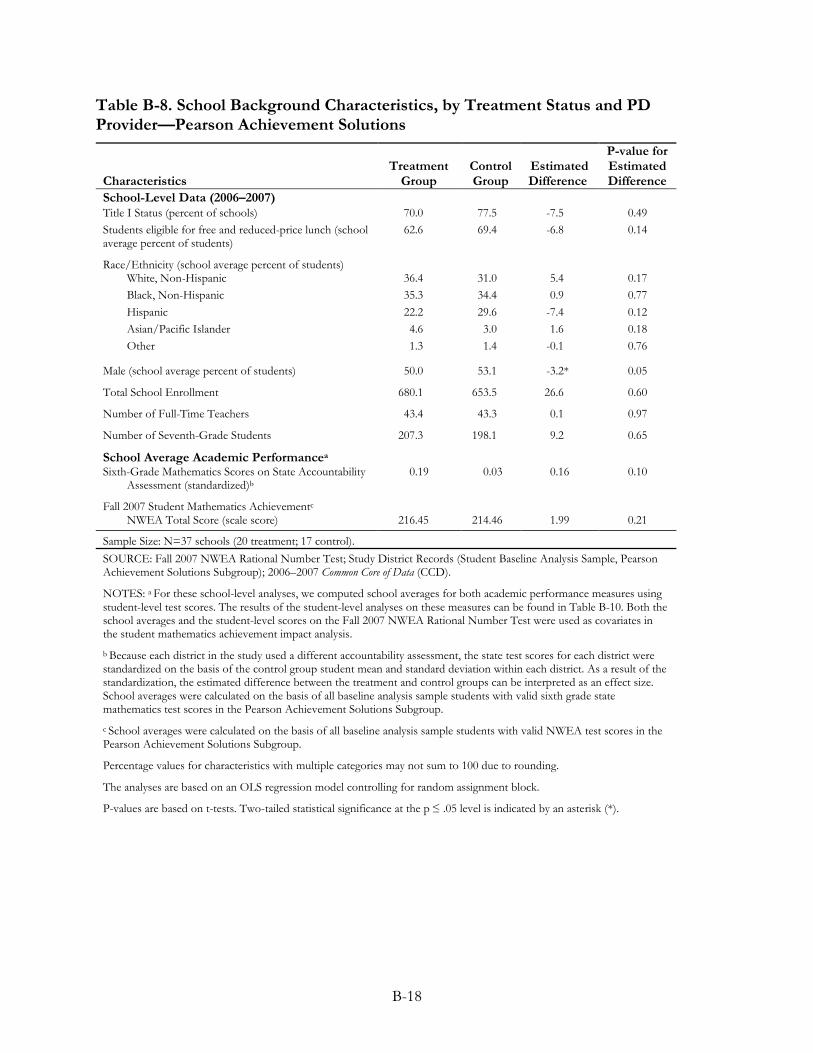
B-18
Table B-8. School Background Characteristics, by Treatment Status and PD Provider—Pearson Achievement Solutions
Characteristics Treatment
Group Control Group
Estimated Difference
P-value for Estimated Difference
School-Level Data (2006–2007) Title I Status (percent of schools) 70.0 77.5 -7.5 0.49 Students eligible for free and reduced-price lunch (school average percent of students)
62.6 69.4 -6.8 0.14
Race/Ethnicity (school average percent of students)
White, Non-Hispanic 36.4 31.0 5.4 0.17 Black, Non-Hispanic 35.3 34.4 0.9 0.77 Hispanic 22.2 29.6 -7.4 0.12 Asian/Pacific Islander 4.6 3.0 1.6 0.18 Other 1.3 1.4 -0.1 0.76
Male (school average percent of students) 50.0 53.1 -3.2* 0.05
Total School Enrollment 680.1 653.5 26.6 0.60
Number of Full-Time Teachers 43.4 43.3 0.1 0.97
Number of Seventh-Grade Students 207.3 198.1 9.2 0.65
School Average Academic Performancea
Sixth-Grade Mathematics Scores on State Accountability Assessment (standardized)b
0.19 0.03 0.16 0.10
Fall 2007 Student Mathematics Achievementc
NWEA Total Score (scale score) 216.45 214.46 1.99 0.21
Sample Size: N=37 schools (20 treatment; 17 control). SOURCE: Fall 2007 NWEA Rational Number Test; Study District Records (Student Baseline Analysis Sample, Pearson Achievement Solutions Subgroup); 2006–2007 Common Core of Data (CCD).
NOTES: a For these school-level analyses, we computed school averages for both academic performance measures using student-level test scores. The results of the student-level analyses on these measures can be found in Table B-10. Both the school averages and the student-level scores on the Fall 2007 NWEA Rational Number Test were used as covariates in the student mathematics achievement impact analysis.
b Because each district in the study used a different accountability assessment, the state test scores for each district were standardized on the basis of the control group student mean and standard deviation within each district. As a result of the standardization, the estimated difference between the treatment and control groups can be interpreted as an effect size. School averages were calculated on the basis of all baseline analysis sample students with valid sixth grade state mathematics test scores in the Pearson Achievement Solutions Subgroup.
c School averages were calculated on the basis of all baseline analysis sample students with valid NWEA test scores in the Pearson Achievement Solutions Subgroup.
Percentage values for characteristics with multiple categories may not sum to 100 due to rounding.
The analyses are based on an OLS regression model controlling for random assignment block.
P-values are based on t-tests. Two-tailed statistical significance at the p ≤ .05 level is indicated by an asterisk (*).
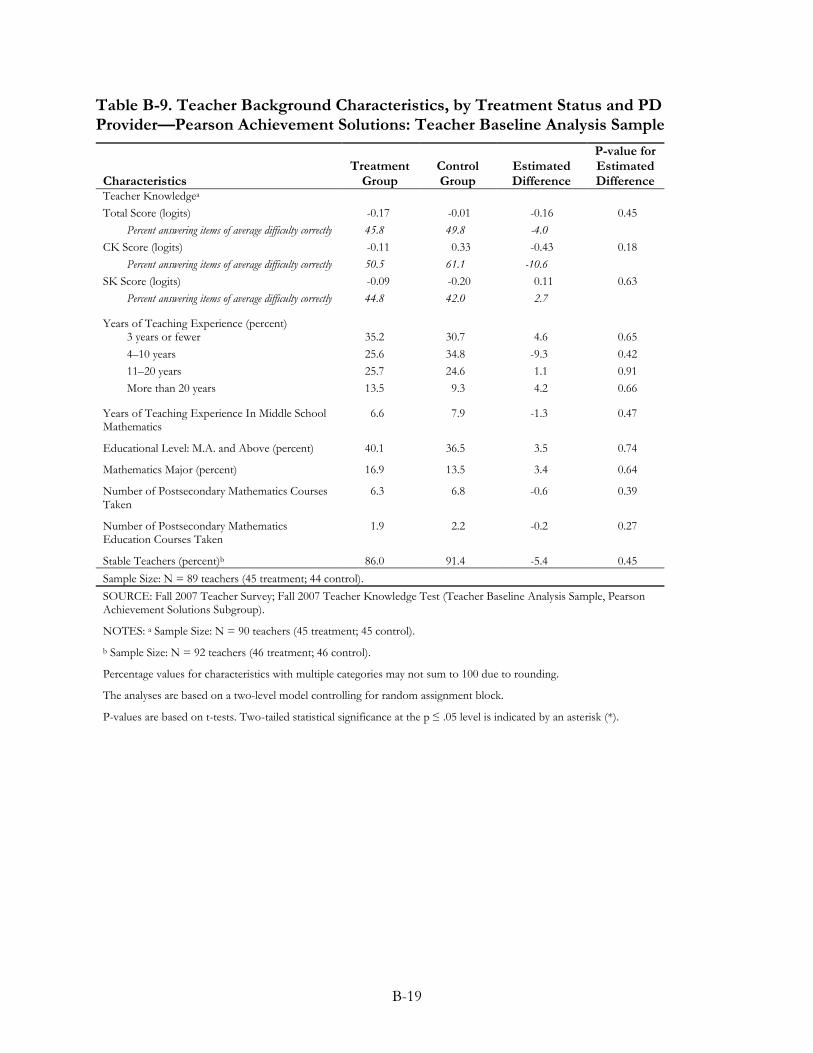
B-19
Table B-9. Teacher Background Characteristics, by Treatment Status and PD Provider—Pearson Achievement Solutions: Teacher Baseline Analysis Sample
Characteristics Treatment
Group Control Group
Estimated Difference
P-value for Estimated Difference
Teacher Knowledgea Total Score (logits) -0.17 -0.01 -0.16 0.45
Percent answering items of average difficulty correctly 45.8 49.8 -4.0 CK Score (logits) -0.11 0.33 -0.43 0.18
Percent answering items of average difficulty correctly 50.5 61.1 -10.6 SK Score (logits) -0.09 -0.20 0.11 0.63
Percent answering items of average difficulty correctly 44.8 42.0 2.7
Years of Teaching Experience (percent)
3 years or fewer 35.2 30.7 4.6 0.65 4–10 years 25.6 34.8 -9.3 0.42 11–20 years 25.7 24.6 1.1 0.91 More than 20 years 13.5 9.3 4.2 0.66
Years of Teaching Experience In Middle School Mathematics
6.6 7.9 -1.3 0.47
Educational Level: M.A. and Above (percent) 40.1 36.5 3.5 0.74
Mathematics Major (percent) 16.9 13.5 3.4 0.64
Number of Postsecondary Mathematics Courses Taken
6.3 6.8 -0.6 0.39
Number of Postsecondary Mathematics Education Courses Taken
1.9 2.2 -0.2 0.27
Stable Teachers (percent)b 86.0 91.4 -5.4 0.45 Sample Size: N = 89 teachers (45 treatment; 44 control). SOURCE: Fall 2007 Teacher Survey; Fall 2007 Teacher Knowledge Test (Teacher Baseline Analysis Sample, Pearson Achievement Solutions Subgroup).
NOTES: a Sample Size: N = 90 teachers (45 treatment; 45 control).
b Sample Size: N = 92 teachers (46 treatment; 46 control).
Percentage values for characteristics with multiple categories may not sum to 100 due to rounding.
The analyses are based on a two-level model controlling for random assignment block.
P-values are based on t-tests. Two-tailed statistical significance at the p ≤ .05 level is indicated by an asterisk (*).
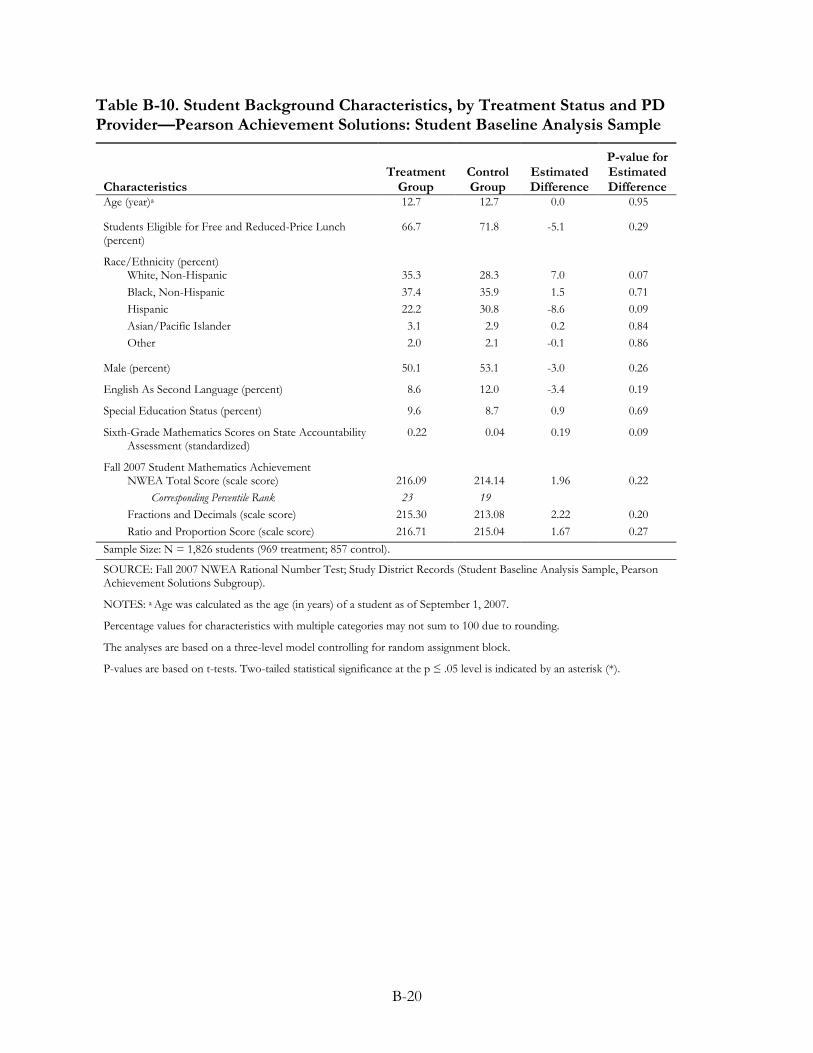
B-20
Table B-10. Student Background Characteristics, by Treatment Status and PD Provider—Pearson Achievement Solutions: Student Baseline Analysis Sample
Characteristics Treatment
Group Control Group
Estimated Difference
P-value for Estimated Difference
Age (year)a 12.7 12.7 0.0 0.95
Students Eligible for Free and Reduced-Price Lunch (percent)
66.7 71.8 -5.1 0.29
Race/Ethnicity (percent)
White, Non-Hispanic 35.3 28.3 7.0 0.07 Black, Non-Hispanic 37.4 35.9 1.5 0.71 Hispanic 22.2 30.8 -8.6 0.09 Asian/Pacific Islander 3.1 2.9 0.2 0.84 Other 2.0 2.1 -0.1 0.86
Male (percent) 50.1 53.1 -3.0 0.26
English As Second Language (percent) 8.6 12.0 -3.4 0.19
Special Education Status (percent) 9.6 8.7 0.9 0.69
Sixth-Grade Mathematics Scores on State Accountability Assessment (standardized)
0.22 0.04 0.19 0.09
Fall 2007 Student Mathematics Achievement
NWEA Total Score (scale score) 216.09 214.14 1.96 0.22 Corresponding Percentile Rank 23 19
Fractions and Decimals (scale score) 215.30 213.08 2.22 0.20 Ratio and Proportion Score (scale score) 216.71 215.04 1.67 0.27
Sample Size: N = 1,826 students (969 treatment; 857 control).
SOURCE: Fall 2007 NWEA Rational Number Test; Study District Records (Student Baseline Analysis Sample, Pearson Achievement Solutions Subgroup).
NOTES: a Age was calculated as the age (in years) of a student as of September 1, 2007.
Percentage values for characteristics with multiple categories may not sum to 100 due to rounding.
The analyses are based on a three-level model controlling for random assignment block.
P-values are based on t-tests. Two-tailed statistical significance at the p ≤ .05 level is indicated by an asterisk (*).
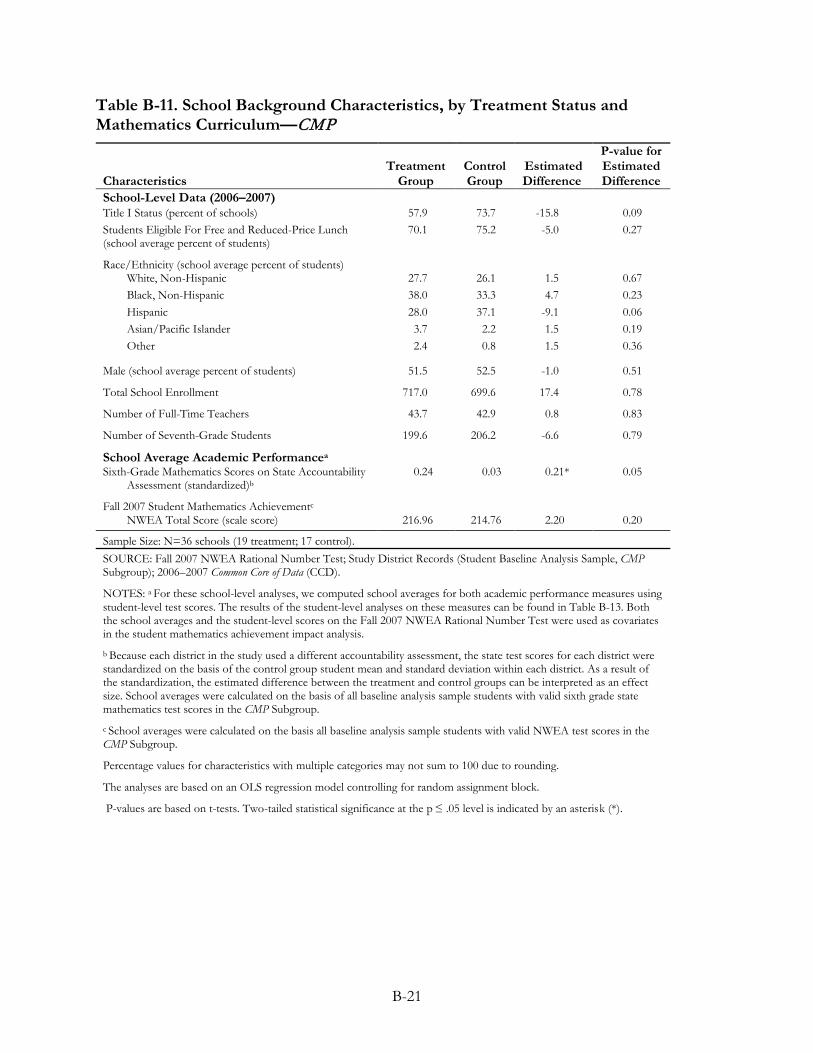
B-21
Table B-11. School Background Characteristics, by Treatment Status and Mathematics Curriculum—CMP
Characteristics Treatment
Group Control Group
Estimated Difference
P-value for Estimated Difference
School-Level Data (2006–2007) Title I Status (percent of schools) 57.9 73.7 -15.8 0.09 Students Eligible For Free and Reduced-Price Lunch (school average percent of students)
70.1 75.2 -5.0 0.27
Race/Ethnicity (school average percent of students)
White, Non-Hispanic 27.7 26.1 1.5 0.67 Black, Non-Hispanic 38.0 33.3 4.7 0.23 Hispanic 28.0 37.1 -9.1 0.06 Asian/Pacific Islander 3.7 2.2 1.5 0.19 Other 2.4 0.8 1.5 0.36
Male (school average percent of students) 51.5 52.5 -1.0 0.51
Total School Enrollment 717.0 699.6 17.4 0.78
Number of Full-Time Teachers 43.7 42.9 0.8 0.83
Number of Seventh-Grade Students 199.6 206.2 -6.6 0.79
School Average Academic Performancea
Sixth-Grade Mathematics Scores on State Accountability Assessment (standardized)b
0.24 0.03 0.21* 0.05
Fall 2007 Student Mathematics Achievementc
NWEA Total Score (scale score) 216.96 214.76 2.20 0.20
Sample Size: N=36 schools (19 treatment; 17 control). SOURCE: Fall 2007 NWEA Rational Number Test; Study District Records (Student Baseline Analysis Sample, CMP Subgroup); 2006–2007 Common Core of Data (CCD).
NOTES: a For these school-level analyses, we computed school averages for both academic performance measures using student-level test scores. The results of the student-level analyses on these measures can be found in Table B-13. Both the school averages and the student-level scores on the Fall 2007 NWEA Rational Number Test were used as covariates in the student mathematics achievement impact analysis.
b Because each district in the study used a different accountability assessment, the state test scores for each district were standardized on the basis of the control group student mean and standard deviation within each district. As a result of the standardization, the estimated difference between the treatment and control groups can be interpreted as an effect size. School averages were calculated on the basis of all baseline analysis sample students with valid sixth grade state mathematics test scores in the CMP Subgroup.
c School averages were calculated on the basis all baseline analysis sample students with valid NWEA test scores in the CMP Subgroup.
Percentage values for characteristics with multiple categories may not sum to 100 due to rounding.
The analyses are based on an OLS regression model controlling for random assignment block.
P-values are based on t-tests. Two-tailed statistical significance at the p ≤ .05 level is indicated by an asterisk (*).
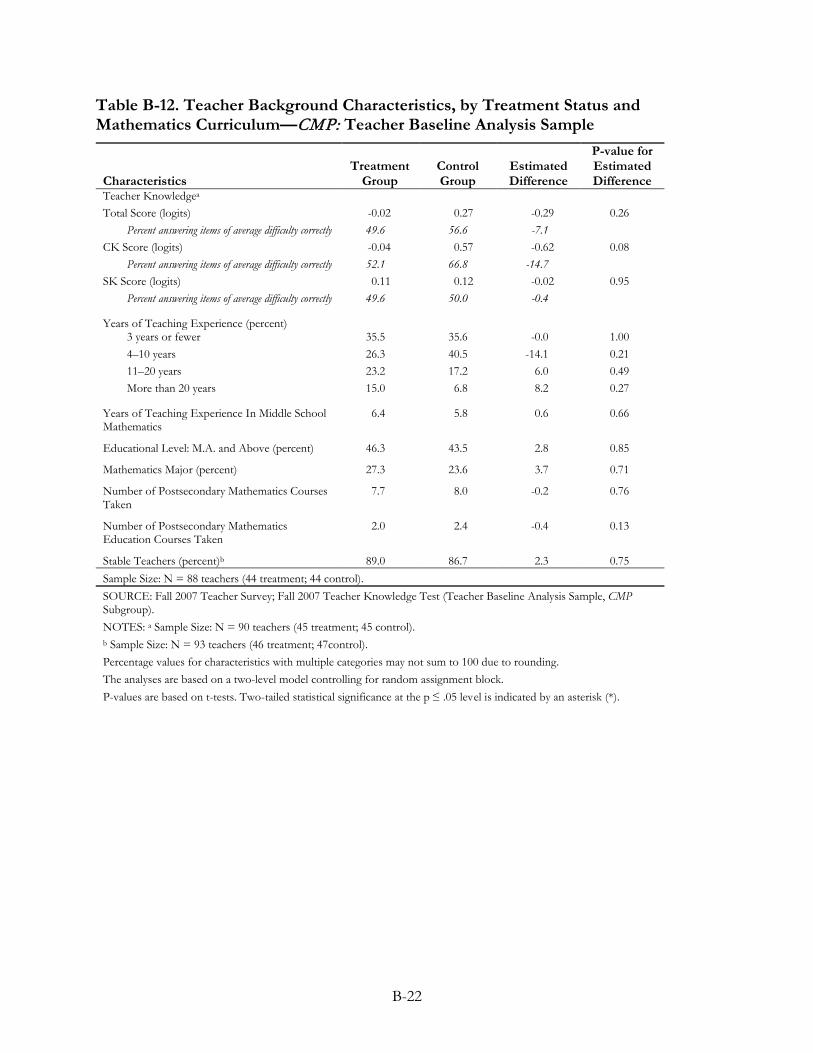
B-22
Table B-12. Teacher Background Characteristics, by Treatment Status and Mathematics Curriculum—CMP: Teacher Baseline Analysis Sample
Characteristics Treatment
Group Control Group
Estimated Difference
P-value for Estimated Difference
Teacher Knowledgea Total Score (logits) -0.02 0.27 -0.29 0.26
Percent answering items of average difficulty correctly 49.6 56.6 -7.1 CK Score (logits) -0.04 0.57 -0.62 0.08
Percent answering items of average difficulty correctly 52.1 66.8 -14.7 SK Score (logits) 0.11 0.12 -0.02 0.95
Percent answering items of average difficulty correctly 49.6 50.0 -0.4
Years of Teaching Experience (percent)
3 years or fewer 35.5 35.6 -0.0 1.00 4–10 years 26.3 40.5 -14.1 0.21 11–20 years 23.2 17.2 6.0 0.49 More than 20 years 15.0 6.8 8.2 0.27
Years of Teaching Experience In Middle School Mathematics
6.4 5.8 0.6 0.66
Educational Level: M.A. and Above (percent) 46.3 43.5 2.8 0.85
Mathematics Major (percent) 27.3 23.6 3.7 0.71
Number of Postsecondary Mathematics Courses Taken
7.7 8.0 -0.2 0.76
Number of Postsecondary Mathematics Education Courses Taken
2.0 2.4 -0.4 0.13
Stable Teachers (percent)b 89.0 86.7 2.3 0.75 Sample Size: N = 88 teachers (44 treatment; 44 control). SOURCE: Fall 2007 Teacher Survey; Fall 2007 Teacher Knowledge Test (Teacher Baseline Analysis Sample, CMP Subgroup). NOTES: a Sample Size: N = 90 teachers (45 treatment; 45 control). b Sample Size: N = 93 teachers (46 treatment; 47control). Percentage values for characteristics with multiple categories may not sum to 100 due to rounding. The analyses are based on a two-level model controlling for random assignment block. P-values are based on t-tests. Two-tailed statistical significance at the p ≤ .05 level is indicated by an asterisk (*).

B-23
Table B-13. Student Background Characteristics, by Treatment Status and Mathematics Curriculum—CMP: Student Baseline Analysis Sample
Characteristics Treatment
Group Control Group
Estimated Difference
P-value for Estimated Difference
Age (year)a 12.6 12.6 0.0 0.99
Students Eligible for Free and Reduced-Price Lunch (percent)
62.8 69.4 -6.6 0.14
Race/Ethnicity (percent)
White, Non-Hispanic 30.2 28.2 2.0 0.65 Black, Non-Hispanic 35.8 29.3 6.4 0.19 Hispanic 29.7 38.8 -9.2 0.11 Asian/Pacific Islander 3.2 2.5 0.7 0.45 Other 1.2 1.3 -0.1 0.86
Male (percent) 52.4 51.6 0.7 0.79
English As Second Language (percent) 15.2 17.8 -2.5 0.48
Special Education Status (percent) 14.3 11.3 3.0 0.19
Sixth-Grade Mathematics Scores on State Accountability Assessment (standardized)
0.26 0.11 0.15 0.17
Fall 2007 Student Mathematics Achievement
NWEA Total Score (scale score) 216.65 214.56 2.10 0.23 Corresponding Percentile Rank 24 20
Fractions and Decimals (scale score) 216.16 213.79 2.37 0.21 Ratio and Proportion Score (scale score) 216.99 215.18 1.80 0.28
Sample Size: N=1,828 students (922 treatment; 906 control). SOURCE: Fall 2007 NWEA Rational Number Test; Study District Records (Student Baseline Analysis Sample, CMP Subgroup).
NOTES: a Age was calculated as the age (in years) of a student as of September 1, 2007.
Percentage values for characteristics with multiple categories may not sum to 100 due to rounding.
The analyses are based on a three-level model controlling for random assignment block.
P-values are based on t-tests. Two-tailed statistical significance at the p ≤ .05 level is indicated by an asterisk (*).
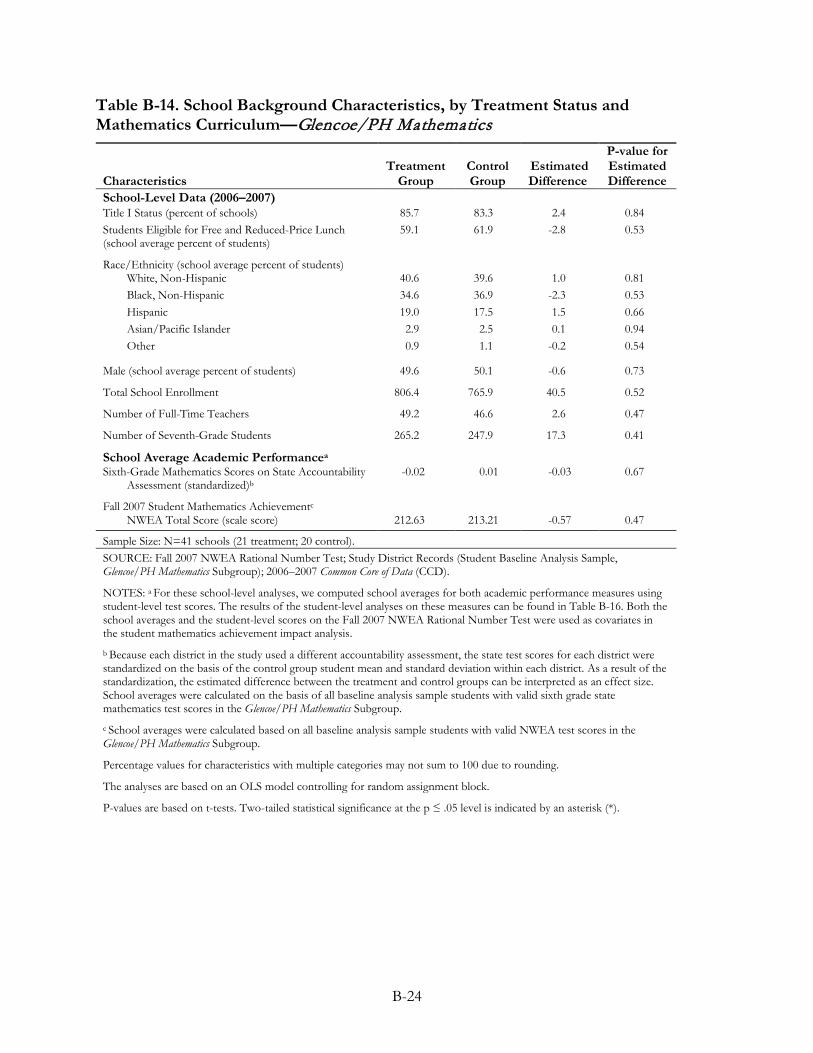
B-24
Table B-14. School Background Characteristics, by Treatment Status and Mathematics Curriculum—Glencoe/PH Mathematics
Characteristics Treatment
Group Control Group
Estimated Difference
P-value for Estimated Difference
School-Level Data (2006–2007) Title I Status (percent of schools) 85.7 83.3 2.4 0.84 Students Eligible for Free and Reduced-Price Lunch (school average percent of students)
59.1 61.9 -2.8 0.53
Race/Ethnicity (school average percent of students)
White, Non-Hispanic 40.6 39.6 1.0 0.81 Black, Non-Hispanic 34.6 36.9 -2.3 0.53 Hispanic 19.0 17.5 1.5 0.66 Asian/Pacific Islander 2.9 2.5 0.1 0.94 Other 0.9 1.1 -0.2 0.54
Male (school average percent of students) 49.6 50.1 -0.6 0.73
Total School Enrollment 806.4 765.9 40.5 0.52
Number of Full-Time Teachers 49.2 46.6 2.6 0.47
Number of Seventh-Grade Students 265.2 247.9 17.3 0.41
School Average Academic Performancea
Sixth-Grade Mathematics Scores on State Accountability Assessment (standardized)b
-0.02 0.01 -0.03 0.67
Fall 2007 Student Mathematics Achievementc
NWEA Total Score (scale score) 212.63 213.21 -0.57 0.47
Sample Size: N=41 schools (21 treatment; 20 control). SOURCE: Fall 2007 NWEA Rational Number Test; Study District Records (Student Baseline Analysis Sample, Glencoe/PH Mathematics Subgroup); 2006–2007 Common Core of Data (CCD).
NOTES: a For these school-level analyses, we computed school averages for both academic performance measures using student-level test scores. The results of the student-level analyses on these measures can be found in Table B-16. Both the school averages and the student-level scores on the Fall 2007 NWEA Rational Number Test were used as covariates in the student mathematics achievement impact analysis.
b Because each district in the study used a different accountability assessment, the state test scores for each district were standardized on the basis of the control group student mean and standard deviation within each district. As a result of the standardization, the estimated difference between the treatment and control groups can be interpreted as an effect size. School averages were calculated on the basis of all baseline analysis sample students with valid sixth grade state mathematics test scores in the Glencoe/PH Mathematics Subgroup. c School averages were calculated based on all baseline analysis sample students with valid NWEA test scores in the Glencoe/PH Mathematics Subgroup.
Percentage values for characteristics with multiple categories may not sum to 100 due to rounding.
The analyses are based on an OLS model controlling for random assignment block.
P-values are based on t-tests. Two-tailed statistical significance at the p ≤ .05 level is indicated by an asterisk (*).
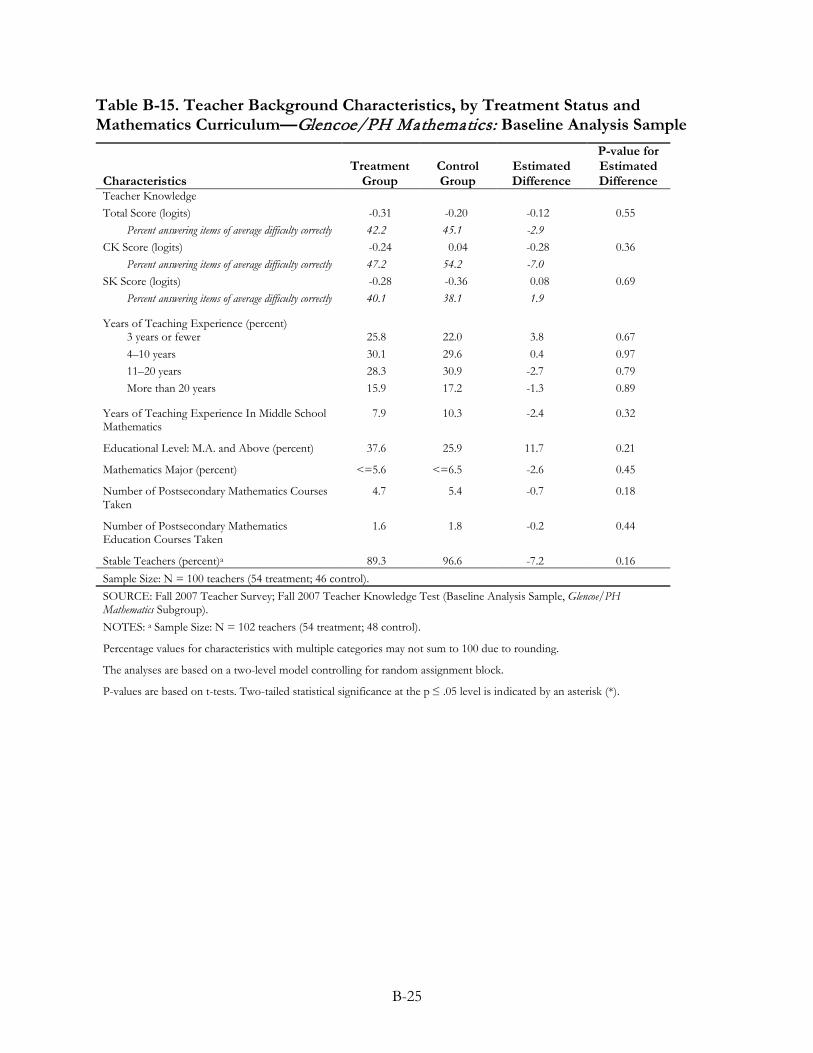
B-25
Table B-15. Teacher Background Characteristics, by Treatment Status and Mathematics Curriculum—Glencoe/PH Mathematics: Baseline Analysis Sample
Characteristics Treatment
Group Control Group
Estimated Difference
P-value for Estimated Difference
Teacher Knowledge Total Score (logits) -0.31 -0.20 -0.12 0.55
Percent answering items of average difficulty correctly 42.2 45.1 -2.9 CK Score (logits) -0.24 0.04 -0.28 0.36
Percent answering items of average difficulty correctly 47.2 54.2 -7.0 SK Score (logits) -0.28 -0.36 0.08 0.69
Percent answering items of average difficulty correctly 40.1 38.1 1.9
Years of Teaching Experience (percent)
3 years or fewer 25.8 22.0 3.8 0.67 4–10 years 30.1 29.6 0.4 0.97 11–20 years 28.3 30.9 -2.7 0.79 More than 20 years 15.9 17.2 -1.3 0.89
Years of Teaching Experience In Middle School Mathematics
7.9 10.3 -2.4 0.32
Educational Level: M.A. and Above (percent) 37.6 25.9 11.7 0.21
Mathematics Major (percent) <=5.6 <=6.5 -2.6 0.45
Number of Postsecondary Mathematics Courses Taken
4.7 5.4 -0.7 0.18
Number of Postsecondary Mathematics Education Courses Taken
1.6 1.8 -0.2 0.44
Stable Teachers (percent)a 89.3 96.6 -7.2 0.16 Sample Size: N = 100 teachers (54 treatment; 46 control). SOURCE: Fall 2007 Teacher Survey; Fall 2007 Teacher Knowledge Test (Baseline Analysis Sample, Glencoe/PH Mathematics Subgroup). NOTES: a Sample Size: N = 102 teachers (54 treatment; 48 control).
Percentage values for characteristics with multiple categories may not sum to 100 due to rounding.
The analyses are based on a two-level model controlling for random assignment block.
P-values are based on t-tests. Two-tailed statistical significance at the p ≤ .05 level is indicated by an asterisk (*).
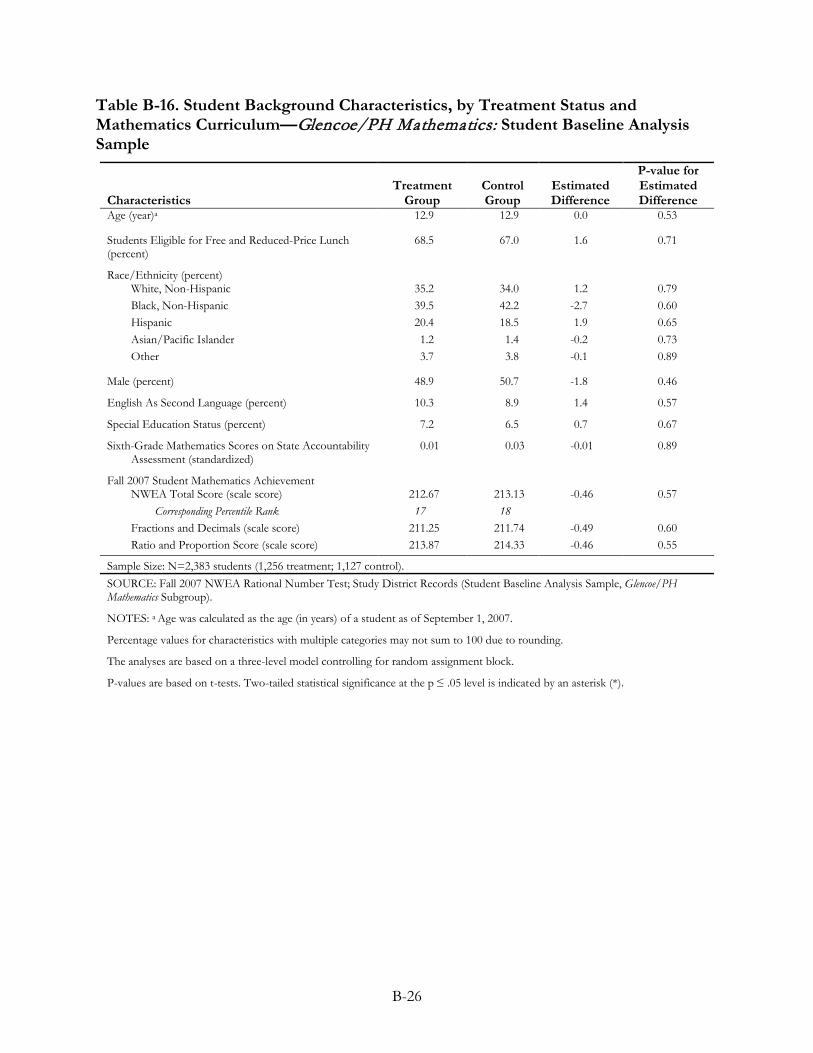
B-26
Table B-16. Student Background Characteristics, by Treatment Status and Mathematics Curriculum—Glencoe/PH Mathematics: Student Baseline Analysis Sample
Characteristics Treatment
Group Control Group
Estimated Difference
P-value for Estimated Difference
Age (year)a 12.9 12.9 0.0 0.53
Students Eligible for Free and Reduced-Price Lunch (percent)
68.5 67.0 1.6 0.71
Race/Ethnicity (percent)
White, Non-Hispanic 35.2 34.0 1.2 0.79 Black, Non-Hispanic 39.5 42.2 -2.7 0.60 Hispanic 20.4 18.5 1.9 0.65 Asian/Pacific Islander 1.2 1.4 -0.2 0.73 Other 3.7 3.8 -0.1 0.89
Male (percent) 48.9 50.7 -1.8 0.46
English As Second Language (percent) 10.3 8.9 1.4 0.57
Special Education Status (percent) 7.2 6.5 0.7 0.67
Sixth-Grade Mathematics Scores on State Accountability Assessment (standardized)
0.01 0.03 -0.01 0.89
Fall 2007 Student Mathematics Achievement
NWEA Total Score (scale score) 212.67 213.13 -0.46 0.57 Corresponding Percentile Rank 17 18
Fractions and Decimals (scale score) 211.25 211.74 -0.49 0.60 Ratio and Proportion Score (scale score) 213.87 214.33 -0.46 0.55
Sample Size: N=2,383 students (1,256 treatment; 1,127 control). SOURCE: Fall 2007 NWEA Rational Number Test; Study District Records (Student Baseline Analysis Sample, Glencoe/PH Mathematics Subgroup).
NOTES: a Age was calculated as the age (in years) of a student as of September 1, 2007.
Percentage values for characteristics with multiple categories may not sum to 100 due to rounding.
The analyses are based on a three-level model controlling for random assignment block.
P-values are based on t-tests. Two-tailed statistical significance at the p ≤ .05 level is indicated by an asterisk (*).
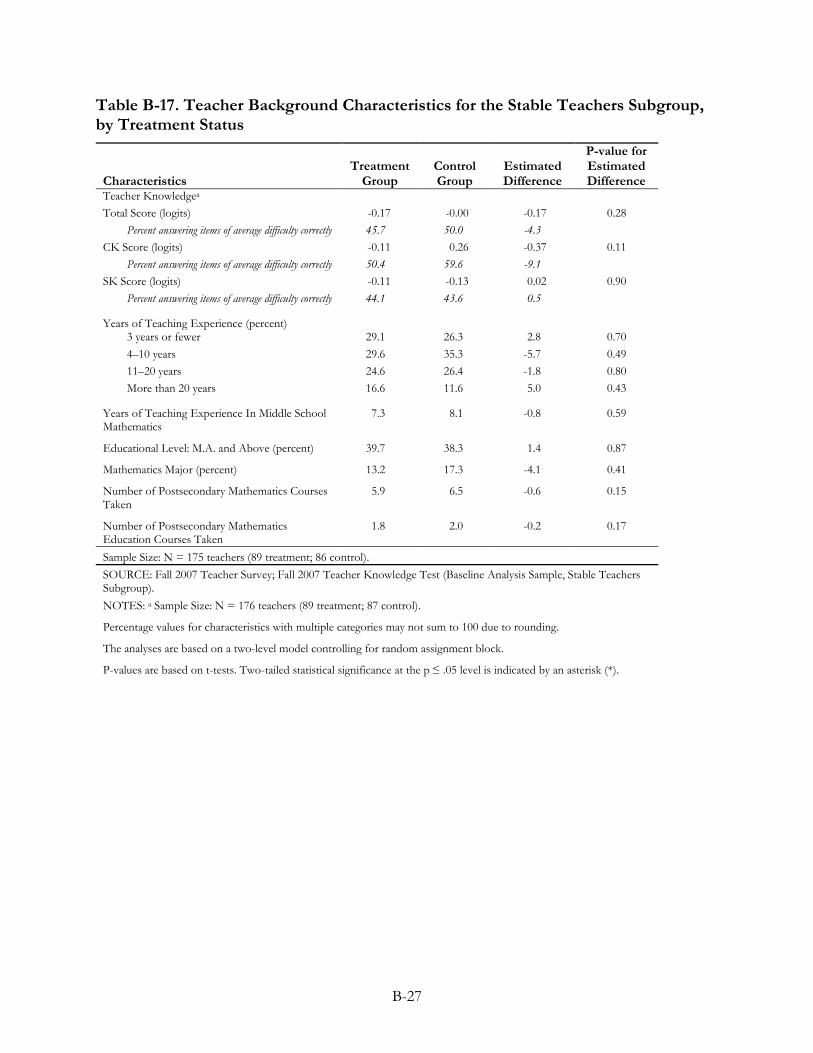
B-27
Table B-17. Teacher Background Characteristics for the Stable Teachers Subgroup, by Treatment Status
Characteristics Treatment
Group Control Group
Estimated Difference
P-value for Estimated Difference
Teacher Knowledgea Total Score (logits) -0.17 -0.00 -0.17 0.28
Percent answering items of average difficulty correctly 45.7 50.0 -4.3 CK Score (logits) -0.11 0.26 -0.37 0.11
Percent answering items of average difficulty correctly 50.4 59.6 -9.1 SK Score (logits) -0.11 -0.13 0.02 0.90
Percent answering items of average difficulty correctly 44.1 43.6 0.5
Years of Teaching Experience (percent)
3 years or fewer 29.1 26.3 2.8 0.70 4–10 years 29.6 35.3 -5.7 0.49 11–20 years 24.6 26.4 -1.8 0.80 More than 20 years 16.6 11.6 5.0 0.43
Years of Teaching Experience In Middle School Mathematics
7.3 8.1 -0.8 0.59
Educational Level: M.A. and Above (percent) 39.7 38.3 1.4 0.87
Mathematics Major (percent) 13.2 17.3 -4.1 0.41
Number of Postsecondary Mathematics Courses Taken
5.9 6.5 -0.6 0.15
Number of Postsecondary Mathematics Education Courses Taken
1.8 2.0 -0.2 0.17
Sample Size: N = 175 teachers (89 treatment; 86 control). SOURCE: Fall 2007 Teacher Survey; Fall 2007 Teacher Knowledge Test (Baseline Analysis Sample, Stable Teachers Subgroup). NOTES: a Sample Size: N = 176 teachers (89 treatment; 87 control).
Percentage values for characteristics with multiple categories may not sum to 100 due to rounding.
The analyses are based on a two-level model controlling for random assignment block.
P-values are based on t-tests. Two-tailed statistical significance at the p ≤ .05 level is indicated by an asterisk (*).
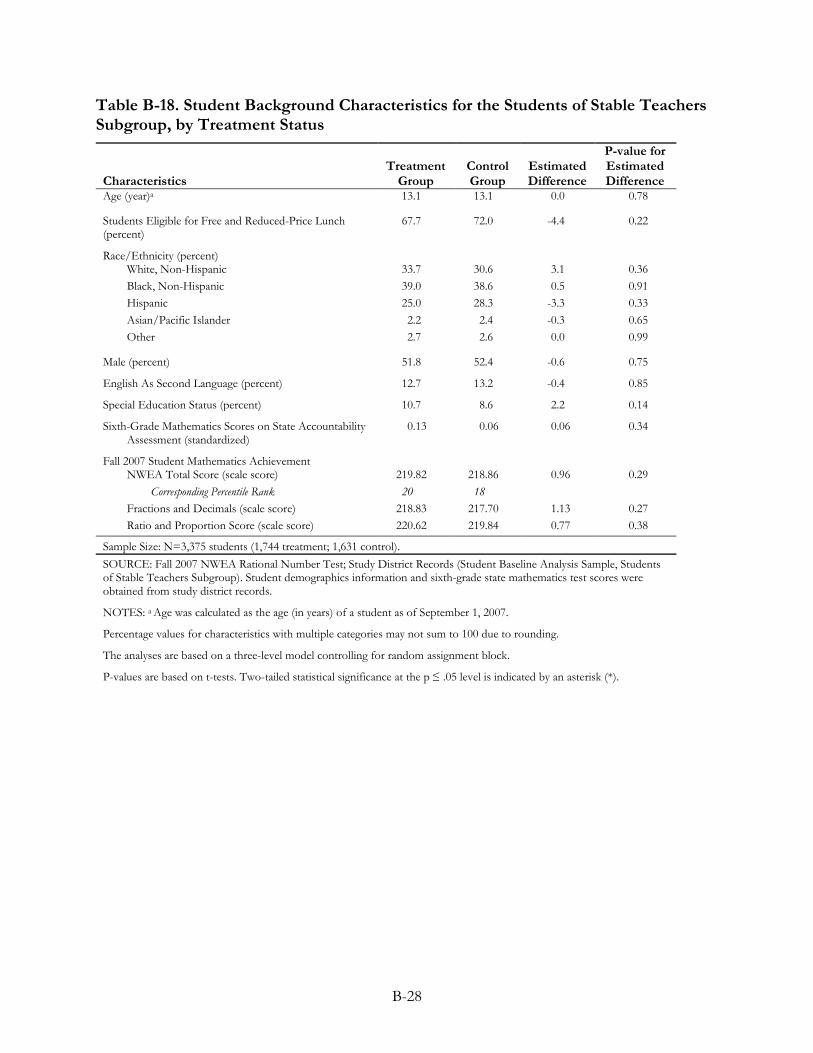
B-28
Table B-18. Student Background Characteristics for the Students of Stable Teachers Subgroup, by Treatment Status
Characteristics Treatment
Group Control Group
Estimated Difference
P-value for Estimated Difference
Age (year)a 13.1 13.1 0.0 0.78
Students Eligible for Free and Reduced-Price Lunch (percent)
67.7 72.0 -4.4 0.22
Race/Ethnicity (percent)
White, Non-Hispanic 33.7 30.6 3.1 0.36 Black, Non-Hispanic 39.0 38.6 0.5 0.91 Hispanic 25.0 28.3 -3.3 0.33 Asian/Pacific Islander 2.2 2.4 -0.3 0.65 Other 2.7 2.6 0.0 0.99
Male (percent) 51.8 52.4 -0.6 0.75
English As Second Language (percent) 12.7 13.2 -0.4 0.85
Special Education Status (percent) 10.7 8.6 2.2 0.14
Sixth-Grade Mathematics Scores on State Accountability Assessment (standardized)
0.13 0.06 0.06 0.34
Fall 2007 Student Mathematics Achievement
NWEA Total Score (scale score) 219.82 218.86 0.96 0.29 Corresponding Percentile Rank 20 18
Fractions and Decimals (scale score) 218.83 217.70 1.13 0.27 Ratio and Proportion Score (scale score) 220.62 219.84 0.77 0.38
Sample Size: N=3,375 students (1,744 treatment; 1,631 control). SOURCE: Fall 2007 NWEA Rational Number Test; Study District Records (Student Baseline Analysis Sample, Students of Stable Teachers Subgroup). Student demographics information and sixth-grade state mathematics test scores were obtained from study district records.
NOTES: a Age was calculated as the age (in years) of a student as of September 1, 2007.
Percentage values for characteristics with multiple categories may not sum to 100 due to rounding.
The analyses are based on a three-level model controlling for random assignment block.
P-values are based on t-tests. Two-tailed statistical significance at the p ≤ .05 level is indicated by an asterisk (*).
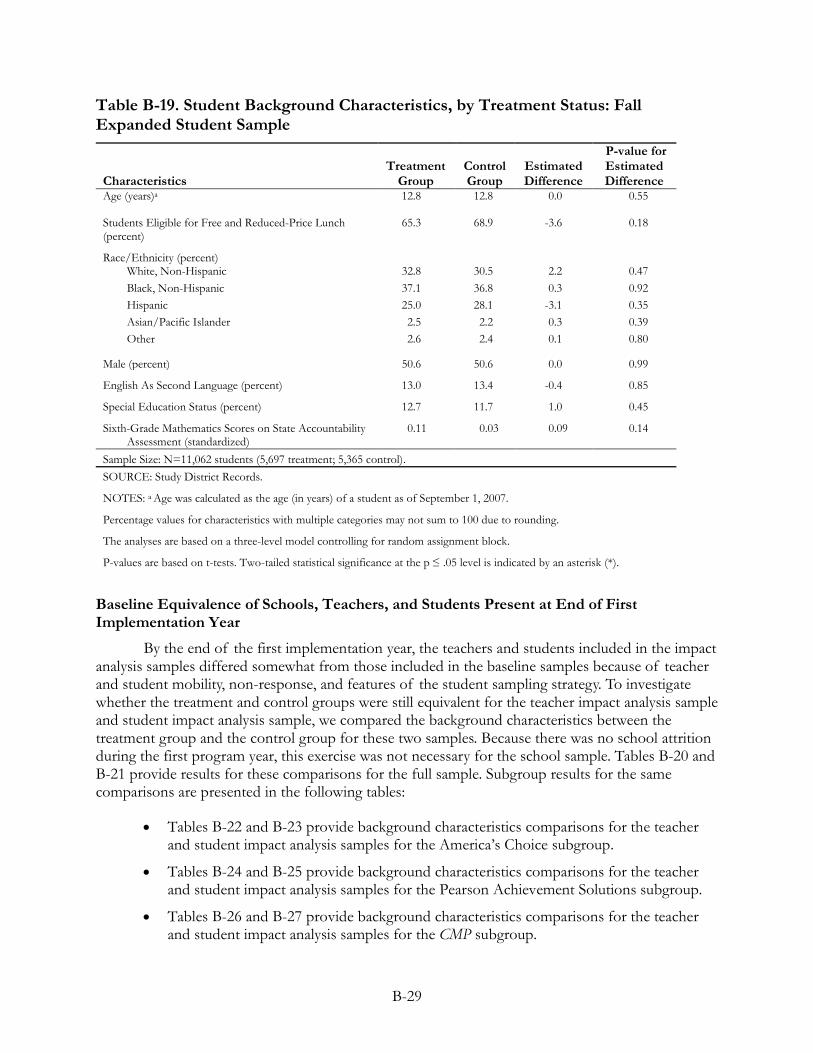
B-29
Table B-19. Student Background Characteristics, by Treatment Status: Fall Expanded Student Sample
Characteristics Treatment
Group Control Group
Estimated Difference
P-value for Estimated Difference
Age (years)a 12.8 12.8 0.0 0.55
Students Eligible for Free and Reduced-Price Lunch (percent)
65.3 68.9 -3.6 0.18
Race/Ethnicity (percent)
White, Non-Hispanic 32.8 30.5 2.2 0.47 Black, Non-Hispanic 37.1 36.8 0.3 0.92 Hispanic 25.0 28.1 -3.1 0.35 Asian/Pacific Islander 2.5 2.2 0.3 0.39 Other 2.6 2.4 0.1 0.80
Male (percent) 50.6 50.6 0.0 0.99
English As Second Language (percent) 13.0 13.4 -0.4 0.85
Special Education Status (percent) 12.7 11.7 1.0 0.45
Sixth-Grade Mathematics Scores on State Accountability Assessment (standardized)
0.11 0.03 0.09 0.14
Sample Size: N=11,062 students (5,697 treatment; 5,365 control). SOURCE: Study District Records.
NOTES: a Age was calculated as the age (in years) of a student as of September 1, 2007.
Percentage values for characteristics with multiple categories may not sum to 100 due to rounding.
The analyses are based on a three-level model controlling for random assignment block.
P-values are based on t-tests. Two-tailed statistical significance at the p ≤ .05 level is indicated by an asterisk (*).
Baseline Equivalence of Schools, Teachers, and Students Present at End of First Implementation Year
By the end of the first implementation year, the teachers and students included in the impact analysis samples differed somewhat from those included in the baseline samples because of teacher and student mobility, non-response, and features of the student sampling strategy. To investigate whether the treatment and control groups were still equivalent for the teacher impact analysis sample and student impact analysis sample, we compared the background characteristics between the treatment group and the control group for these two samples. Because there was no school attrition during the first program year, this exercise was not necessary for the school sample. Tables B-20 and B-21 provide results for these comparisons for the full sample. Subgroup results for the same comparisons are presented in the following tables:
•
•
•
Tables B-22 and B-23 provide background characteristics comparisons for the teacher and student impact analysis samples for the America’s Choice subgroup.
Tables B-24 and B-25 provide background characteristics comparisons for the teacher and student impact analysis samples for the Pearson Achievement Solutions subgroup.
Tables B-26 and B-27 provide background characteristics comparisons for the teacher and student impact analysis samples for the CMP subgroup.
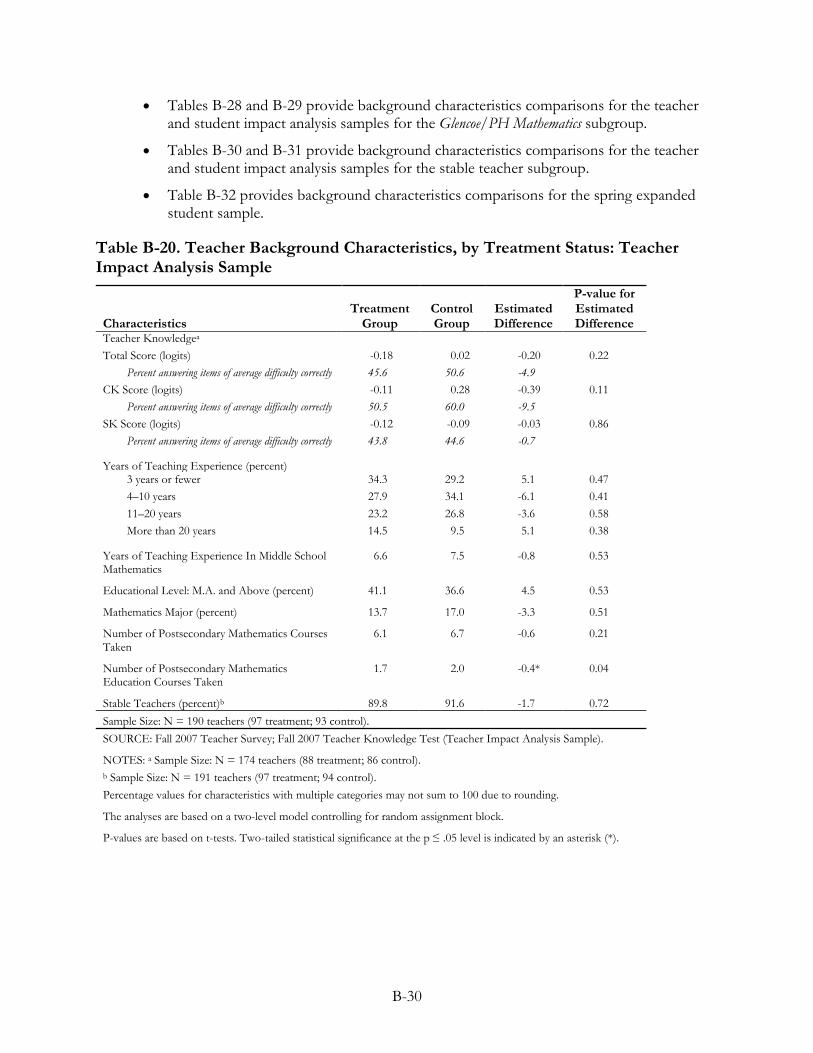
•
•
•
B-30
Tables B-28 and B-29 provide background characteristics comparisons for the teacher and student impact analysis samples for the Glencoe/PH Mathematics subgroup.
Tables B-30 and B-31 provide background characteristics comparisons for the teacher and student impact analysis samples for the stable teacher subgroup.
Table B-32 provides background characteristics comparisons for the spring expanded student sample.
Table B-20. Teacher Background Characteristics, by Treatment Status: Teacher Impact Analysis Sample
Characteristics Treatment
Group Control Group
Estimated Difference
P-value for Estimated Difference
Teacher Knowledgea Total Score (logits) -0.18 0.02 -0.20 0.22
Percent answering items of average difficulty correctly 45.6 50.6 -4.9 CK Score (logits) -0.11 0.28 -0.39 0.11
Percent answering items of average difficulty correctly 50.5 60.0 -9.5 SK Score (logits) -0.12 -0.09 -0.03 0.86
Percent answering items of average difficulty correctly 43.8 44.6 -0.7
Years of Teaching Experience (percent)
3 years or fewer 34.3 29.2 5.1 0.47 4–10 years 27.9 34.1 -6.1 0.41 11–20 years 23.2 26.8 -3.6 0.58 More than 20 years 14.5 9.5 5.1 0.38
Years of Teaching Experience In Middle School Mathematics
6.6 7.5 -0.8 0.53
Educational Level: M.A. and Above (percent) 41.1 36.6 4.5 0.53
Mathematics Major (percent) 13.7 17.0 -3.3 0.51
Number of Postsecondary Mathematics Courses Taken
6.1 6.7 -0.6 0.21
Number of Postsecondary Mathematics Education Courses Taken
1.7 2.0 -0.4* 0.04
Stable Teachers (percent)b 89.8 91.6 -1.7 0.72 Sample Size: N = 190 teachers (97 treatment; 93 control). SOURCE: Fall 2007 Teacher Survey; Fall 2007 Teacher Knowledge Test (Teacher Impact Analysis Sample).
NOTES: a Sample Size: N = 174 teachers (88 treatment; 86 control). b Sample Size: N = 191 teachers (97 treatment; 94 control). Percentage values for characteristics with multiple categories may not sum to 100 due to rounding.
The analyses are based on a two-level model controlling for random assignment block.
P-values are based on t-tests. Two-tailed statistical significance at the p ≤ .05 level is indicated by an asterisk (*).
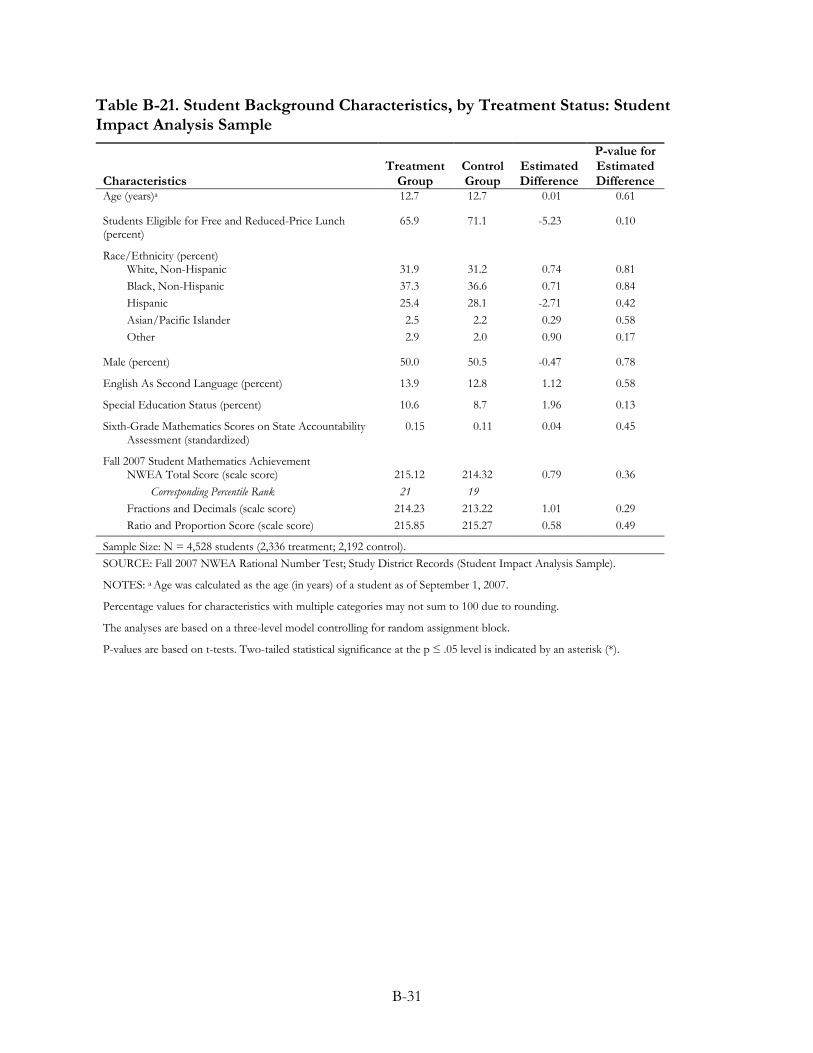
B-31
Table B-21. Student Background Characteristics, by Treatment Status: Student Impact Analysis Sample
Characteristics Treatment
Group Control Group
Estimated Difference
P-value for Estimated Difference
Age (years)a 12.7 12.7 0.01 0.61
Students Eligible for Free and Reduced-Price Lunch (percent)
65.9 71.1 -5.23 0.10
Race/Ethnicity (percent)
White, Non-Hispanic 31.9 31.2 0.74 0.81 Black, Non-Hispanic 37.3 36.6 0.71 0.84 Hispanic 25.4 28.1 -2.71 0.42 Asian/Pacific Islander 2.5 2.2 0.29 0.58 Other 2.9 2.0 0.90 0.17
Male (percent) 50.0 50.5 -0.47 0.78
English As Second Language (percent) 13.9 12.8 1.12 0.58
Special Education Status (percent) 10.6 8.7 1.96 0.13
Sixth-Grade Mathematics Scores on State Accountability Assessment (standardized)
0.15 0.11 0.04 0.45
Fall 2007 Student Mathematics Achievement
NWEA Total Score (scale score) 215.12 214.32 0.79 0.36 Corresponding Percentile Rank 21 19
Fractions and Decimals (scale score) 214.23 213.22 1.01 0.29 Ratio and Proportion Score (scale score) 215.85 215.27 0.58 0.49
Sample Size: N = 4,528 students (2,336 treatment; 2,192 control). SOURCE: Fall 2007 NWEA Rational Number Test; Study District Records (Student Impact Analysis Sample).
NOTES: a Age was calculated as the age (in years) of a student as of September 1, 2007.
Percentage values for characteristics with multiple categories may not sum to 100 due to rounding.
The analyses are based on a three-level model controlling for random assignment block.
P-values are based on t-tests. Two-tailed statistical significance at the p ≤ .05 level is indicated by an asterisk (*).

B-32
Table B-22. Teacher Background Characteristics, by Treatment Status and PD Provider—America’s Choice: Teacher Impact Analysis Sample
Characteristics Treatment
Group Control Group
Estimated Difference
P-value for Estimated Difference
Teacher Knowledgea Total Score (logits) -0.16 0.11 -0.27 0.24
Percent answering items of average difficulty correctly 46.0 52.8 -6.7 CK Score (logits) -0.13 0.30 -0.43 0.21
Percent answering items of average difficulty correctly 49.8 60.5 -10.7 SK Score (logits) -0.12 0.03 -0.15 0.52
Percent answering items of average difficulty correctly 43.9 47.5 -3.6
Years of Teaching Experience (percent)
3 years or fewer 30.9 31.1 -0.2 0.98 4–10 years 31.3 34.0 -2.7 0.79 11–20 years 20.3 24.4 -4.1 0.63 More than 20 years 17.5 10.5 7.0 0.33
Years of Teaching Experience In Middle School Mathematics
7.4 7.2 0.1 0.94
Educational Level: M.A. and Above (percent) 43.1 36.3 6.8 0.50
Mathematics Major (percent) 10.5 15.5 -5.0 0.45
Number of Postsecondary Mathematics Courses Taken
6.2 6.5 -0.2 0.68
Number of Postsecondary Mathematics Education Courses Taken
1.6 2.0 -0.4 0.11
Stable Teachers (percent) 91.7 91.8 -0.1 0.98 Sample Size: N = 102 teachers (53 treatment; 49 control). SOURCE: Fall 2007 Teacher Survey; Fall 2007 Teacher Knowledge Test (Teacher Impact Analysis Sample, America’s Choice Subgroup). NOTES: a Sample Size: N = 93 teachers (48 treatment; 45 control). Percentage values for characteristics with multiple categories may not sum to 100 due to rounding.
The analyses are based on a two-level model controlling for random assignment block.
P-values are based on t-tests. Two-tailed statistical significance at the p ≤ .05 level is indicated by an asterisk (*).

B-33
Table B-23. Student Background Characteristics, by Treatment Status and PD Provider—America’s Choice: Student Impact Analysis Sample
Characteristics Treatment
Group Control Group
Estimated Difference
P-value for Estimated Difference
Age (years)a 12.8 12.7 0.0 0.38
Students Eligible for Free and Reduced-Price Lunch (percent)
65.7 69.5 -3.8 0.33
Race/Ethnicity (percent)
White, Non-Hispanic 29.5 33.9 -4.5 0.34 Black, Non-Hispanic 38.3 35.3 3.0 0.58 Hispanic 27.0 27.2 -0.2 0.97 Asian/Pacific Islander 1.2 1.5 -0.2 0.64 Other 4.0 2.2 1.8 0.09
Male (percent) 50.6 47.8 2.8 0.23
English As Second Language (percent) 17.9 14.4 3.5 0.24
Special Education Status (percent) 12.0 9.6 2.5 0.21
Sixth-Grade Mathematics Scores on State Accountability Assessment (standardized)
0.09 0.12 -0.03 0.65
Fall 2007 Student Mathematics Achievement
NWEA Total Score (scale score) 213.79 213.61 0.18 0.85 Corresponding Percentile Rank 18 18
Fractions and Decimals (scale score) 212.59 212.41 0.17 0.86 Ratio and Proportion Score (scale score) 214.80 214.63 0.17 0.85
Sample Size: N=2,634 students (1,352 treatment; 1,282 control). SOURCE: Fall 2007 NWEA Rational Number Test; Study District Records (Student Impact Analysis Sample, America’s Choice Subgroup).
NOTES: a Age was calculated as the age (in years) of a student as of September 1, 2007.
Percentage values for characteristics with multiple categories may not sum to 100 due to rounding.
The analyses are based on a three-level model controlling for random assignment block.
P-values are based on t-tests. Two-tailed statistical significance at the p ≤ .05 level is indicated by an asterisk (*).
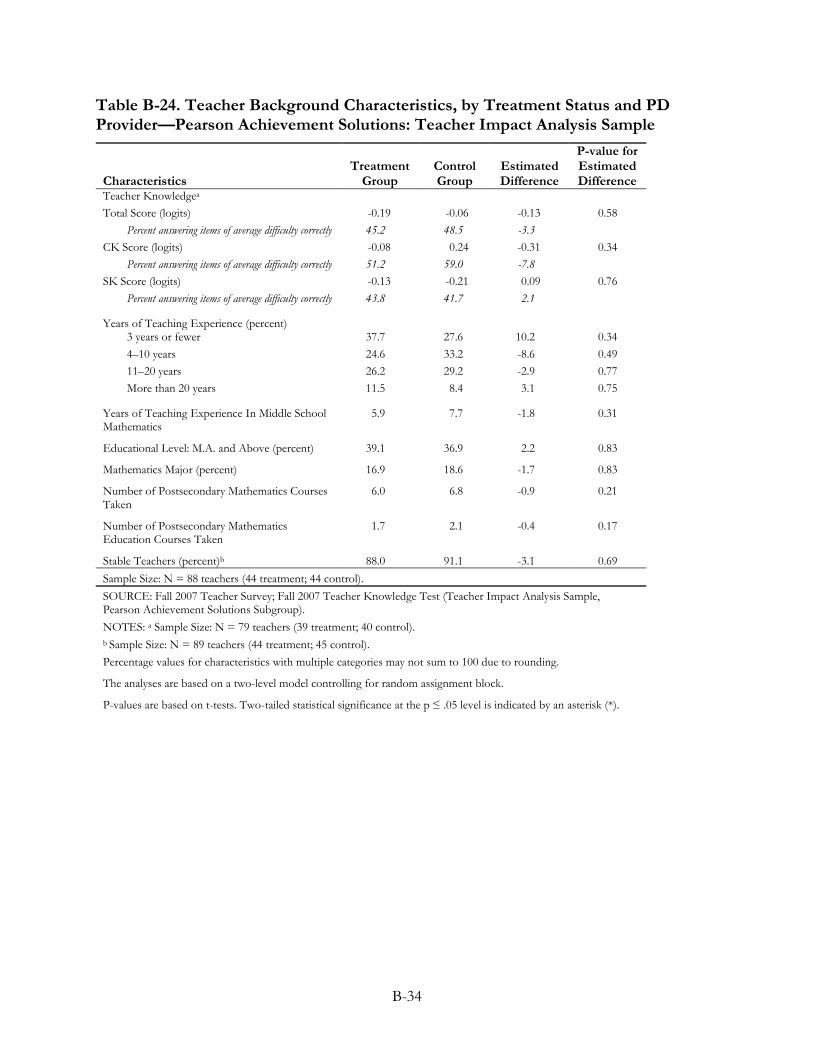
B-34
Table B-24. Teacher Background Characteristics, by Treatment Status and PD Provider—Pearson Achievement Solutions: Teacher Impact Analysis Sample
Characteristics Treatment
Group Control Group
Estimated Difference
P-value for Estimated Difference
Teacher Knowledgea Total Score (logits) -0.19 -0.06 -0.13 0.58
Percent answering items of average difficulty correctly 45.2 48.5 -3.3 CK Score (logits) -0.08 0.24 -0.31 0.34
Percent answering items of average difficulty correctly 51.2 59.0 -7.8 SK Score (logits) -0.13 -0.21 0.09 0.76
Percent answering items of average difficulty correctly 43.8 41.7 2.1
Years of Teaching Experience (percent)
3 years or fewer 37.7 27.6 10.2 0.34 4–10 years 24.6 33.2 -8.6 0.49 11–20 years 26.2 29.2 -2.9 0.77 More than 20 years 11.5 8.4 3.1 0.75
Years of Teaching Experience In Middle School Mathematics
5.9 7.7 -1.8 0.31
Educational Level: M.A. and Above (percent) 39.1 36.9 2.2 0.83
Mathematics Major (percent) 16.9 18.6 -1.7 0.83
Number of Postsecondary Mathematics Courses Taken
6.0 6.8 -0.9 0.21
Number of Postsecondary Mathematics Education Courses Taken
1.7 2.1 -0.4 0.17
Stable Teachers (percent)b 88.0 91.1 -3.1 0.69 Sample Size: N = 88 teachers (44 treatment; 44 control). SOURCE: Fall 2007 Teacher Survey; Fall 2007 Teacher Knowledge Test (Teacher Impact Analysis Sample, Pearson Achievement Solutions Subgroup). NOTES: a Sample Size: N = 79 teachers (39 treatment; 40 control). b Sample Size: N = 89 teachers (44 treatment; 45 control). Percentage values for characteristics with multiple categories may not sum to 100 due to rounding.
The analyses are based on a two-level model controlling for random assignment block.
P-values are based on t-tests. Two-tailed statistical significance at the p ≤ .05 level is indicated by an asterisk (*).
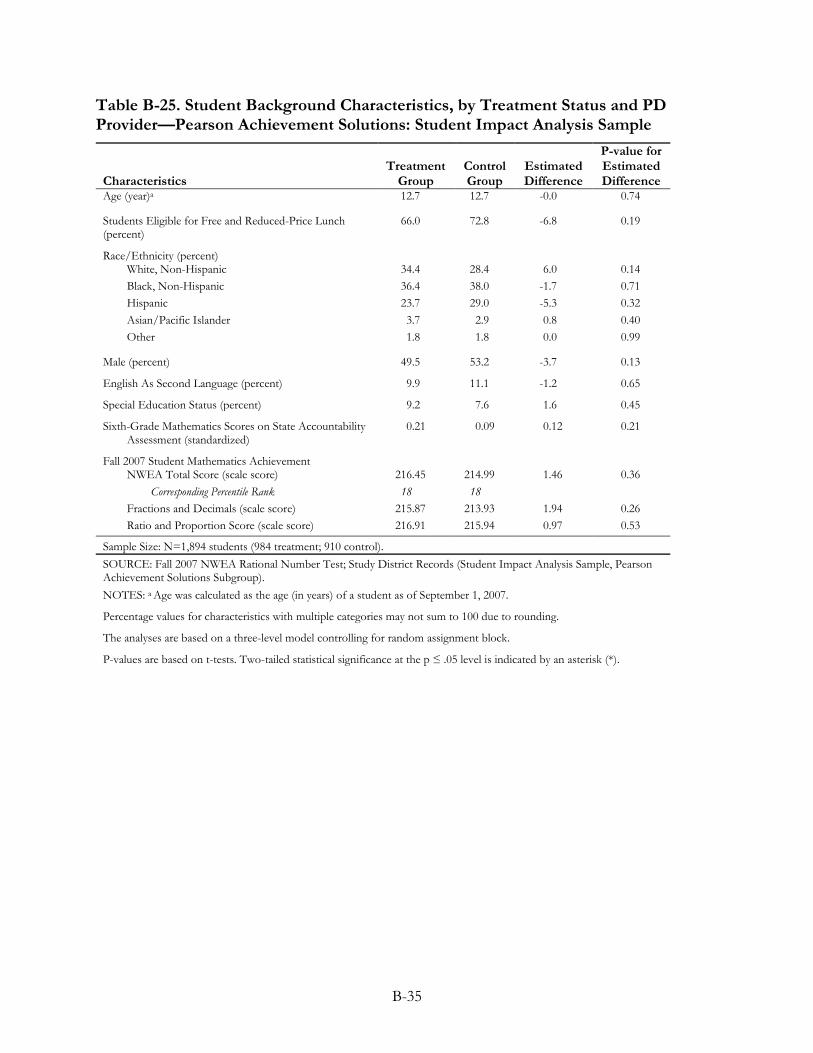
B-35
Table B-25. Student Background Characteristics, by Treatment Status and PD Provider—Pearson Achievement Solutions: Student Impact Analysis Sample
Characteristics Treatment
Group Control Group
Estimated Difference
P-value for Estimated Difference
Age (year)a 12.7 12.7 -0.0 0.74
Students Eligible for Free and Reduced-Price Lunch (percent)
66.0 72.8 -6.8 0.19
Race/Ethnicity (percent)
White, Non-Hispanic 34.4 28.4 6.0 0.14 Black, Non-Hispanic 36.4 38.0 -1.7 0.71 Hispanic 23.7 29.0 -5.3 0.32 Asian/Pacific Islander 3.7 2.9 0.8 0.40 Other 1.8 1.8 0.0 0.99
Male (percent) 49.5 53.2 -3.7 0.13
English As Second Language (percent) 9.9 11.1 -1.2 0.65
Special Education Status (percent) 9.2 7.6 1.6 0.45
Sixth-Grade Mathematics Scores on State Accountability Assessment (standardized)
0.21 0.09 0.12 0.21
Fall 2007 Student Mathematics Achievement
NWEA Total Score (scale score) 216.45 214.99 1.46 0.36 Corresponding Percentile Rank 18 18
Fractions and Decimals (scale score) 215.87 213.93 1.94 0.26 Ratio and Proportion Score (scale score) 216.91 215.94 0.97 0.53
Sample Size: N=1,894 students (984 treatment; 910 control). SOURCE: Fall 2007 NWEA Rational Number Test; Study District Records (Student Impact Analysis Sample, Pearson Achievement Solutions Subgroup). NOTES: a Age was calculated as the age (in years) of a student as of September 1, 2007.
Percentage values for characteristics with multiple categories may not sum to 100 due to rounding.
The analyses are based on a three-level model controlling for random assignment block.
P-values are based on t-tests. Two-tailed statistical significance at the p ≤ .05 level is indicated by an asterisk (*).
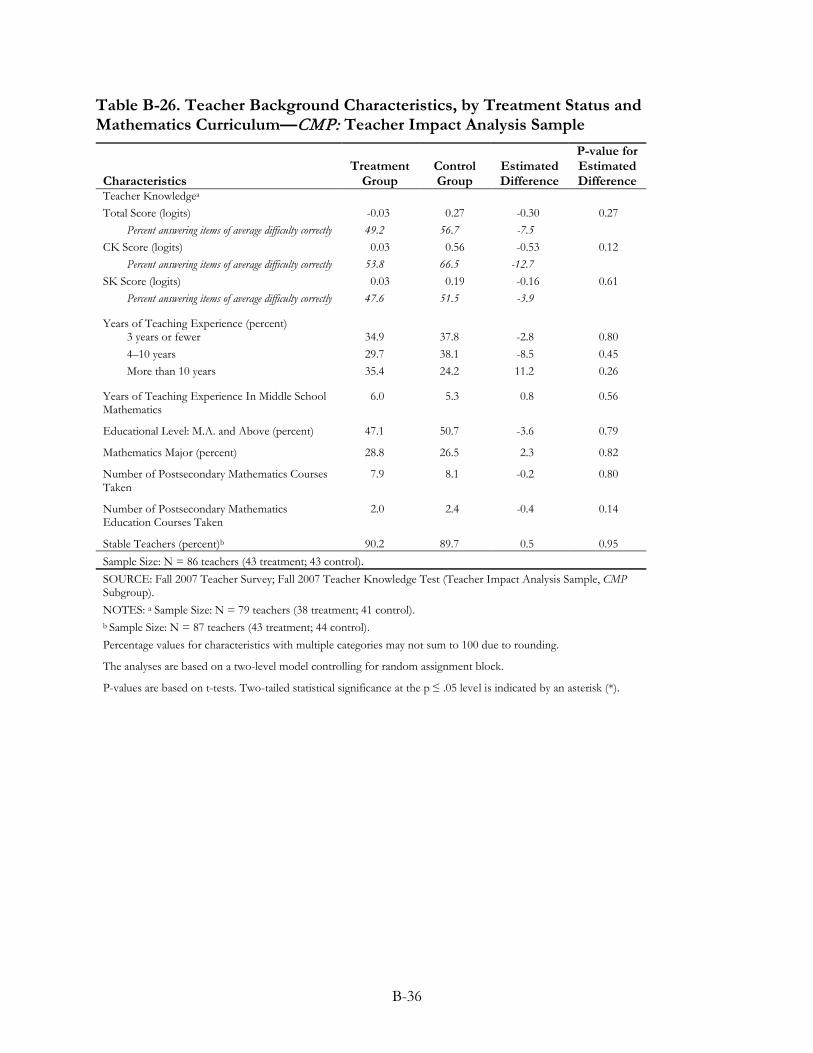
B-36
Table B-26. Teacher Background Characteristics, by Treatment Status and Mathematics Curriculum—CMP: Teacher Impact Analysis Sample
Characteristics Treatment
Group Control Group
Estimated Difference
P-value for Estimated Difference
Teacher Knowledgea Total Score (logits) -0.03 0.27 -0.30 0.27
Percent answering items of average difficulty correctly 49.2 56.7 -7.5 CK Score (logits) 0.03 0.56 -0.53 0.12
Percent answering items of average difficulty correctly 53.8 66.5 -12.7 SK Score (logits) 0.03 0.19 -0.16 0.61
Percent answering items of average difficulty correctly 47.6 51.5 -3.9
Years of Teaching Experience (percent)
3 years or fewer 34.9 37.8 -2.8 0.80 4–10 years 29.7 38.1 -8.5 0.45 More than 10 years 35.4 24.2 11.2 0.26
Years of Teaching Experience In Middle School Mathematics
6.0 5.3 0.8 0.56
Educational Level: M.A. and Above (percent) 47.1 50.7 -3.6 0.79
Mathematics Major (percent) 28.8 26.5 2.3 0.82
Number of Postsecondary Mathematics Courses Taken
7.9 8.1 -0.2 0.80
Number of Postsecondary Mathematics Education Courses Taken
2.0 2.4 -0.4 0.14
Stable Teachers (percent)b 90.2 89.7 0.5 0.95 Sample Size: N = 86 teachers (43 treatment; 43 control). SOURCE: Fall 2007 Teacher Survey; Fall 2007 Teacher Knowledge Test (Teacher Impact Analysis Sample, CMP Subgroup). NOTES: a Sample Size: N = 79 teachers (38 treatment; 41 control). b Sample Size: N = 87 teachers (43 treatment; 44 control). Percentage values for characteristics with multiple categories may not sum to 100 due to rounding.
The analyses are based on a two-level model controlling for random assignment block.
P-values are based on t-tests. Two-tailed statistical significance at the p ≤ .05 level is indicated by an asterisk (*).
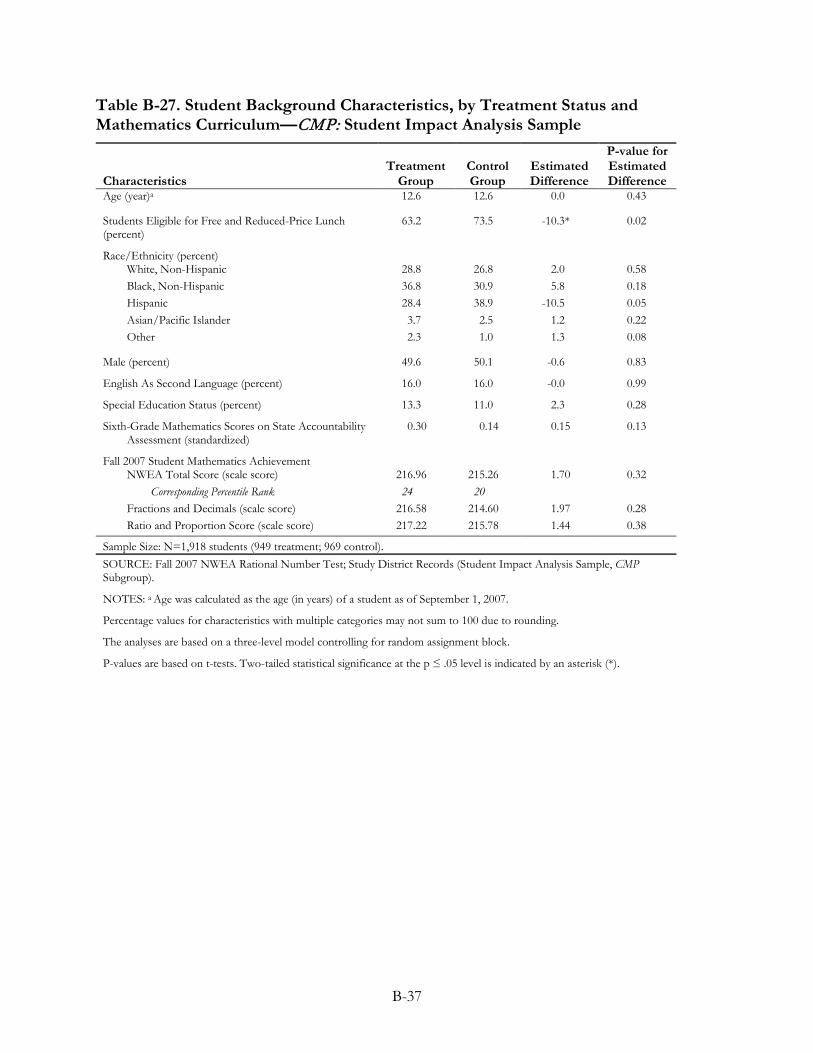
B-37
Table B-27. Student Background Characteristics, by Treatment Status and Mathematics Curriculum—CMP: Student Impact Analysis Sample
Characteristics Treatment
Group Control Group
Estimated Difference
P-value for Estimated Difference
Age (year)a 12.6 12.6 0.0 0.43
Students Eligible for Free and Reduced-Price Lunch (percent)
63.2 73.5 -10.3* 0.02
Race/Ethnicity (percent)
White, Non-Hispanic 28.8 26.8 2.0 0.58 Black, Non-Hispanic 36.8 30.9 5.8 0.18 Hispanic 28.4 38.9 -10.5 0.05 Asian/Pacific Islander 3.7 2.5 1.2 0.22 Other 2.3 1.0 1.3 0.08
Male (percent) 49.6 50.1 -0.6 0.83
English As Second Language (percent) 16.0 16.0 -0.0 0.99
Special Education Status (percent) 13.3 11.0 2.3 0.28
Sixth-Grade Mathematics Scores on State Accountability Assessment (standardized)
0.30 0.14 0.15 0.13
Fall 2007 Student Mathematics Achievement
NWEA Total Score (scale score) 216.96 215.26 1.70 0.32 Corresponding Percentile Rank 24 20
Fractions and Decimals (scale score) 216.58 214.60 1.97 0.28 Ratio and Proportion Score (scale score) 217.22 215.78 1.44 0.38
Sample Size: N=1,918 students (949 treatment; 969 control). SOURCE: Fall 2007 NWEA Rational Number Test; Study District Records (Student Impact Analysis Sample, CMP Subgroup).
NOTES: a Age was calculated as the age (in years) of a student as of September 1, 2007.
Percentage values for characteristics with multiple categories may not sum to 100 due to rounding.
The analyses are based on a three-level model controlling for random assignment block.
P-values are based on t-tests. Two-tailed statistical significance at the p ≤ .05 level is indicated by an asterisk (*).
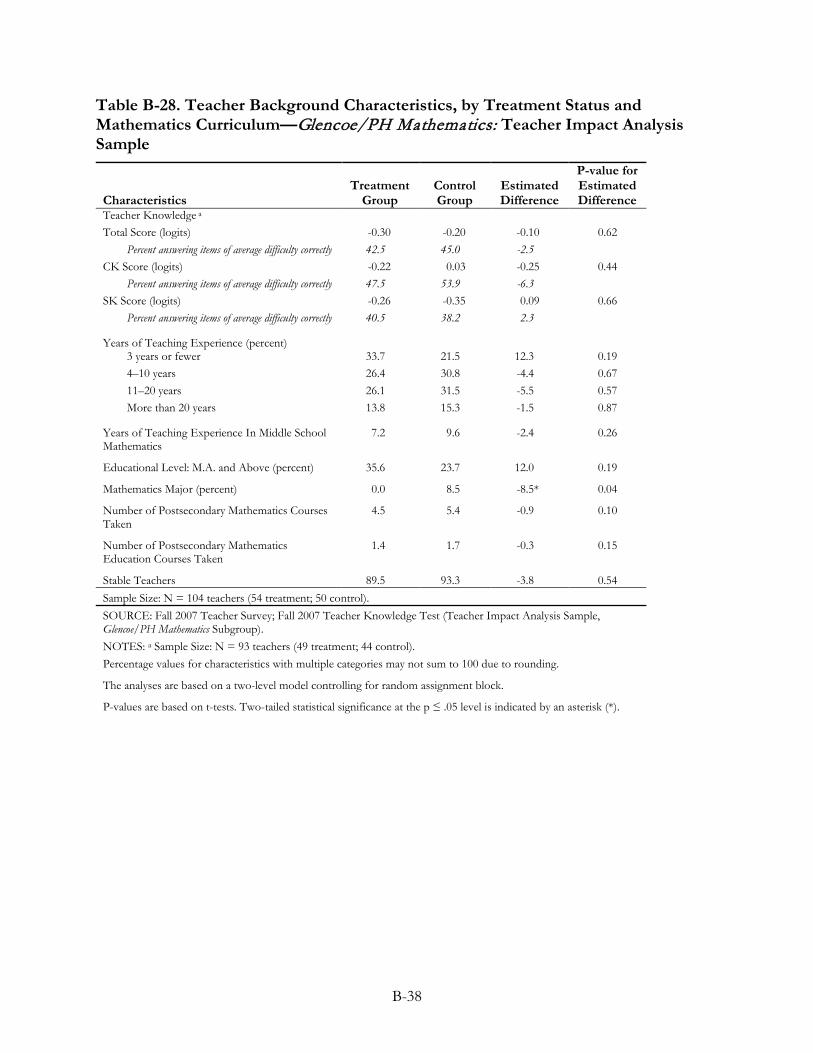
B-38
Table B-28. Teacher Background Characteristics, by Treatment Status and Mathematics Curriculum—Glencoe/PH Mathematics: Teacher Impact Analysis Sample
Characteristics Treatment
Group Control Group
Estimated Difference
P-value for Estimated Difference
Teacher Knowledge a Total Score (logits) -0.30 -0.20 -0.10 0.62
Percent answering items of average difficulty correctly 42.5 45.0 -2.5 CK Score (logits) -0.22 0.03 -0.25 0.44
Percent answering items of average difficulty correctly 47.5 53.9 -6.3 SK Score (logits) -0.26 -0.35 0.09 0.66
Percent answering items of average difficulty correctly 40.5 38.2 2.3
Years of Teaching Experience (percent)
3 years or fewer 33.7 21.5 12.3 0.19 4–10 years 26.4 30.8 -4.4 0.67 11–20 years 26.1 31.5 -5.5 0.57 More than 20 years 13.8 15.3 -1.5 0.87
Years of Teaching Experience In Middle School Mathematics
7.2 9.6 -2.4 0.26
Educational Level: M.A. and Above (percent) 35.6 23.7 12.0 0.19
Mathematics Major (percent) 0.0 8.5 -8.5* 0.04
Number of Postsecondary Mathematics Courses Taken
4.5 5.4 -0.9 0.10
Number of Postsecondary Mathematics Education Courses Taken
1.4 1.7 -0.3 0.15
Stable Teachers 89.5 93.3 -3.8 0.54 Sample Size: N = 104 teachers (54 treatment; 50 control). SOURCE: Fall 2007 Teacher Survey; Fall 2007 Teacher Knowledge Test (Teacher Impact Analysis Sample, Glencoe/PH Mathematics Subgroup). NOTES: a Sample Size: N = 93 teachers (49 treatment; 44 control). Percentage values for characteristics with multiple categories may not sum to 100 due to rounding.
The analyses are based on a two-level model controlling for random assignment block.
P-values are based on t-tests. Two-tailed statistical significance at the p ≤ .05 level is indicated by an asterisk (*).
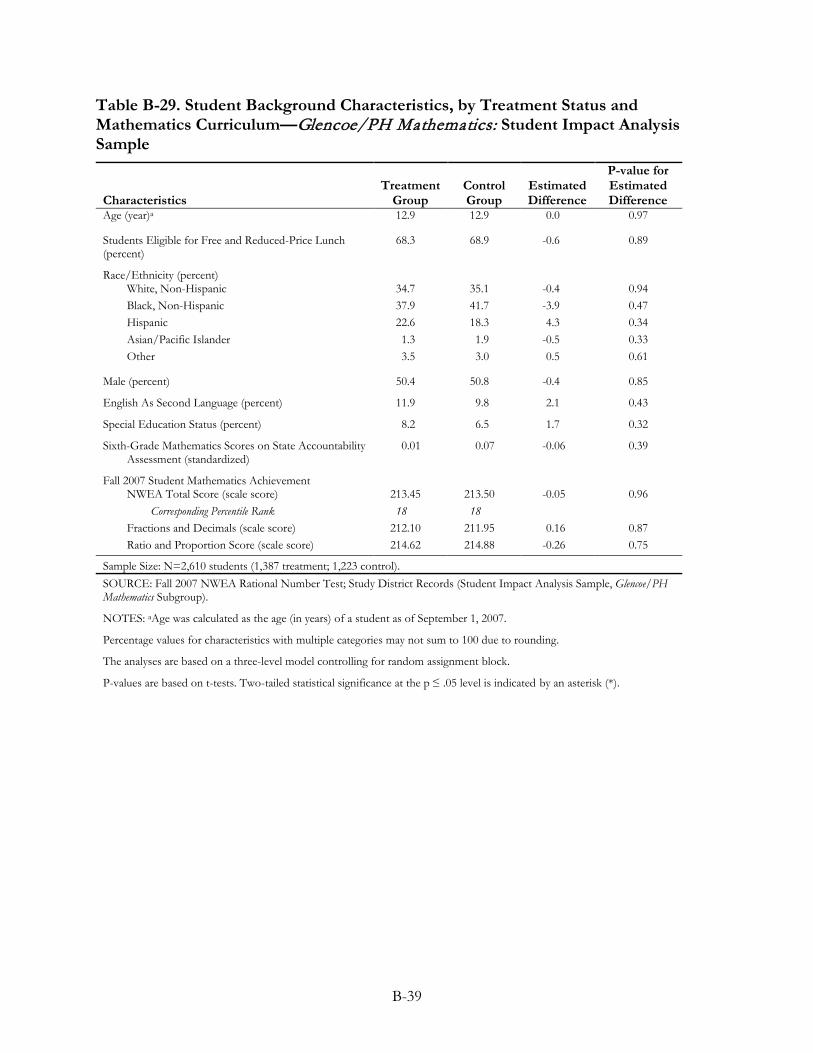
B-39
Table B-29. Student Background Characteristics, by Treatment Status and Mathematics Curriculum—Glencoe/PH Mathematics: Student Impact Analysis Sample
Characteristics Treatment
Group Control Group
Estimated Difference
P-value for Estimated Difference
Age (year)a 12.9 12.9 0.0 0.97
Students Eligible for Free and Reduced-Price Lunch (percent)
68.3 68.9 -0.6 0.89
Race/Ethnicity (percent)
White, Non-Hispanic 34.7 35.1 -0.4 0.94 Black, Non-Hispanic 37.9 41.7 -3.9 0.47 Hispanic 22.6 18.3 4.3 0.34 Asian/Pacific Islander 1.3 1.9 -0.5 0.33 Other 3.5 3.0 0.5 0.61
Male (percent) 50.4 50.8 -0.4 0.85
English As Second Language (percent) 11.9 9.8 2.1 0.43
Special Education Status (percent) 8.2 6.5 1.7 0.32
Sixth-Grade Mathematics Scores on State Accountability Assessment (standardized)
0.01 0.07 -0.06 0.39
Fall 2007 Student Mathematics Achievement
NWEA Total Score (scale score) 213.45 213.50 -0.05 0.96 Corresponding Percentile Rank 18 18
Fractions and Decimals (scale score) 212.10 211.95 0.16 0.87 Ratio and Proportion Score (scale score) 214.62 214.88 -0.26 0.75
Sample Size: N=2,610 students (1,387 treatment; 1,223 control). SOURCE: Fall 2007 NWEA Rational Number Test; Study District Records (Student Impact Analysis Sample, Glencoe/PH Mathematics Subgroup).
NOTES: aAge was calculated as the age (in years) of a student as of September 1, 2007.
Percentage values for characteristics with multiple categories may not sum to 100 due to rounding.
The analyses are based on a three-level model controlling for random assignment block.
P-values are based on t-tests. Two-tailed statistical significance at the p ≤ .05 level is indicated by an asterisk (*).
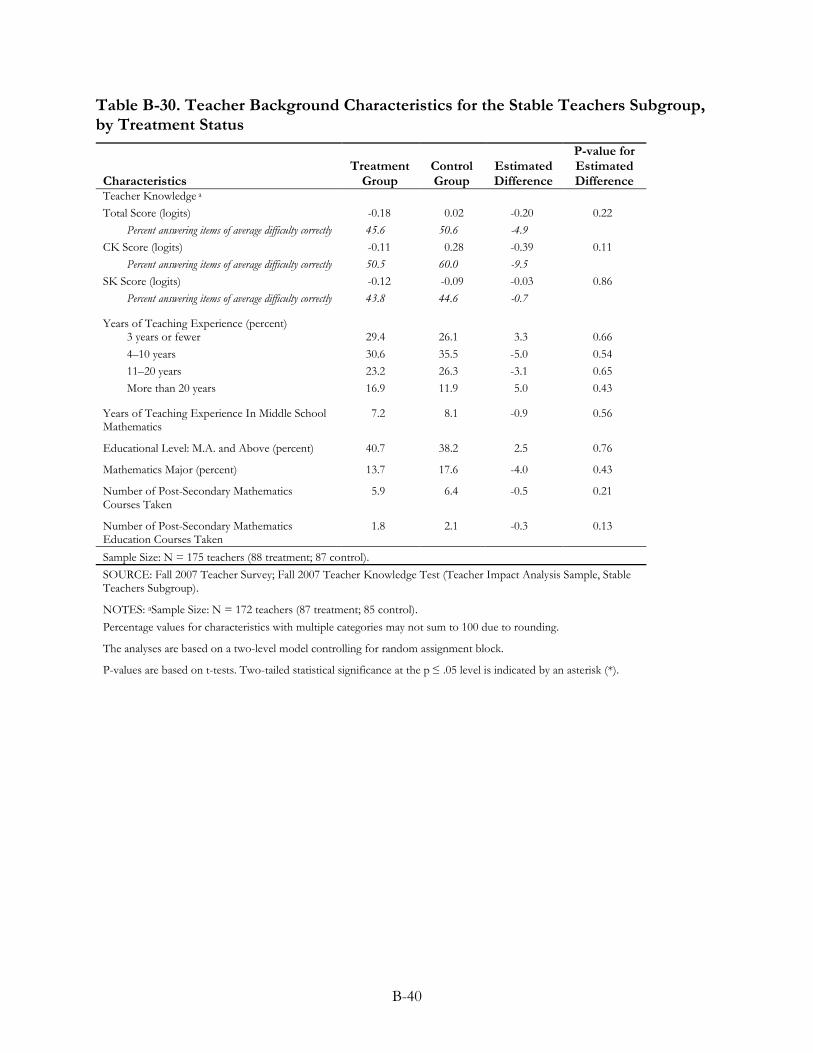
B-40
Table B-30. Teacher Background Characteristics for the Stable Teachers Subgroup, by Treatment Status
Characteristics Treatment
Group Control Group
Estimated Difference
P-value for Estimated Difference
Teacher Knowledge a Total Score (logits) -0.18 0.02 -0.20 0.22
Percent answering items of average difficulty correctly 45.6 50.6 -4.9 CK Score (logits) -0.11 0.28 -0.39 0.11
Percent answering items of average difficulty correctly 50.5 60.0 -9.5 SK Score (logits) -0.12 -0.09 -0.03 0.86
Percent answering items of average difficulty correctly 43.8 44.6 -0.7
Years of Teaching Experience (percent)
3 years or fewer 29.4 26.1 3.3 0.66 4–10 years 30.6 35.5 -5.0 0.54 11–20 years 23.2 26.3 -3.1 0.65 More than 20 years 16.9 11.9 5.0 0.43
Years of Teaching Experience In Middle School Mathematics
7.2 8.1 -0.9 0.56
Educational Level: M.A. and Above (percent) 40.7 38.2 2.5 0.76
Mathematics Major (percent) 13.7 17.6 -4.0 0.43
Number of Post-Secondary Mathematics Courses Taken
5.9 6.4 -0.5 0.21
Number of Post-Secondary Mathematics Education Courses Taken
1.8 2.1 -0.3 0.13
Sample Size: N = 175 teachers (88 treatment; 87 control). SOURCE: Fall 2007 Teacher Survey; Fall 2007 Teacher Knowledge Test (Teacher Impact Analysis Sample, Stable Teachers Subgroup).
NOTES: aSample Size: N = 172 teachers (87 treatment; 85 control). Percentage values for characteristics with multiple categories may not sum to 100 due to rounding.
The analyses are based on a two-level model controlling for random assignment block.
P-values are based on t-tests. Two-tailed statistical significance at the p ≤ .05 level is indicated by an asterisk (*).
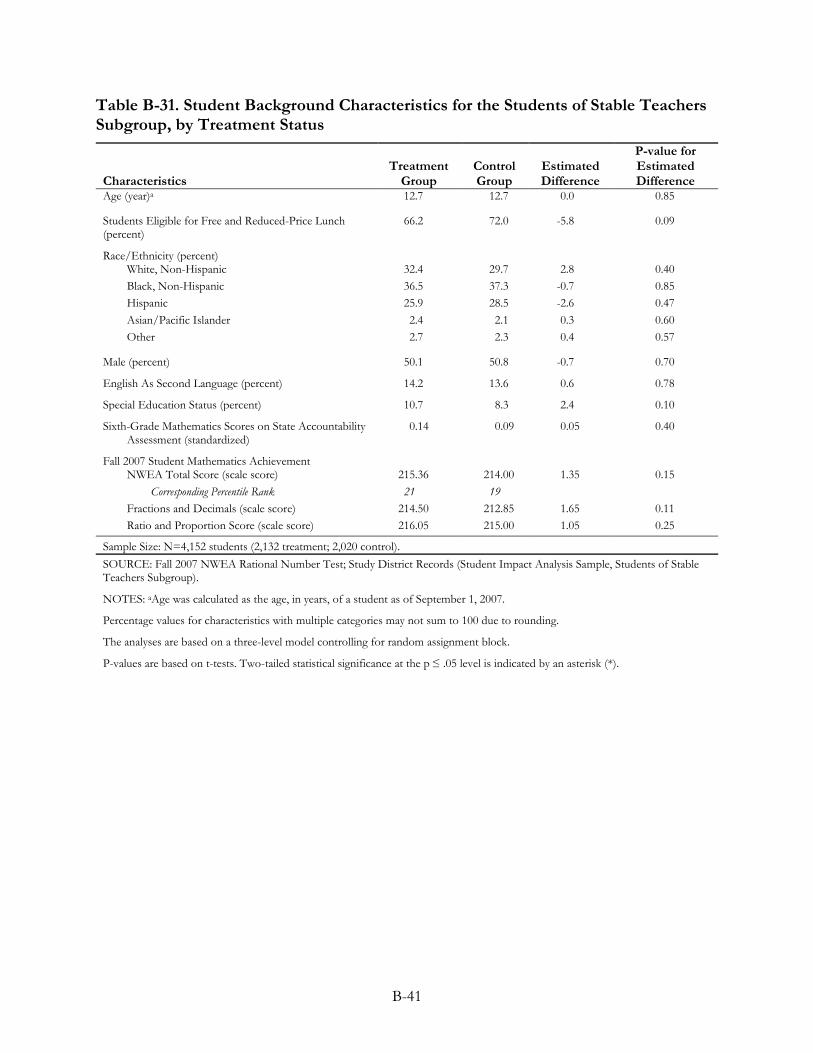
B-41
Table B-31. Student Background Characteristics for the Students of Stable Teachers Subgroup, by Treatment Status
Characteristics Treatment
Group Control Group
Estimated Difference
P-value for Estimated Difference
Age (year)a 12.7 12.7 0.0 0.85
Students Eligible for Free and Reduced-Price Lunch (percent)
66.2 72.0 -5.8 0.09
Race/Ethnicity (percent)
White, Non-Hispanic 32.4 29.7 2.8 0.40 Black, Non-Hispanic 36.5 37.3 -0.7 0.85 Hispanic 25.9 28.5 -2.6 0.47 Asian/Pacific Islander 2.4 2.1 0.3 0.60 Other 2.7 2.3 0.4 0.57
Male (percent) 50.1 50.8 -0.7 0.70
English As Second Language (percent) 14.2 13.6 0.6 0.78
Special Education Status (percent) 10.7 8.3 2.4 0.10
Sixth-Grade Mathematics Scores on State Accountability Assessment (standardized)
0.14 0.09 0.05 0.40
Fall 2007 Student Mathematics Achievement
NWEA Total Score (scale score) 215.36 214.00 1.35 0.15 Corresponding Percentile Rank 21 19
Fractions and Decimals (scale score) 214.50 212.85 1.65 0.11 Ratio and Proportion Score (scale score) 216.05 215.00 1.05 0.25
Sample Size: N=4,152 students (2,132 treatment; 2,020 control). SOURCE: Fall 2007 NWEA Rational Number Test; Study District Records (Student Impact Analysis Sample, Students of Stable Teachers Subgroup).
NOTES: aAge was calculated as the age, in years, of a student as of September 1, 2007.
Percentage values for characteristics with multiple categories may not sum to 100 due to rounding.
The analyses are based on a three-level model controlling for random assignment block.
P-values are based on t-tests. Two-tailed statistical significance at the p ≤ .05 level is indicated by an asterisk (*).
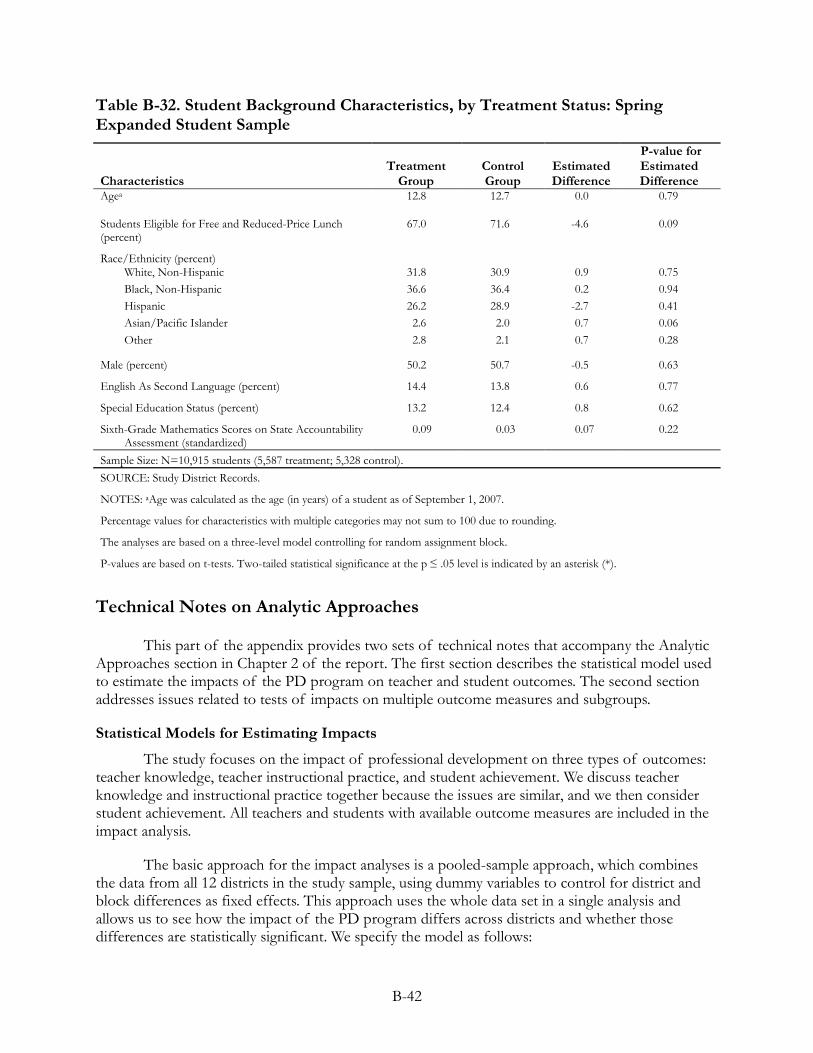
B-42
Table B-32. Student Background Characteristics, by Treatment Status: Spring Expanded Student Sample
Characteristics Treatment
Group Control Group
Estimated Difference
P-value for Estimated Difference
Agea 12.8 12.7 0.0 0.79
Students Eligible for Free and Reduced-Price Lunch (percent)
67.0 71.6 -4.6 0.09
Race/Ethnicity (percent)
White, Non-Hispanic 31.8 30.9 0.9 0.75 Black, Non-Hispanic 36.6 36.4 0.2 0.94 Hispanic 26.2 28.9 -2.7 0.41 Asian/Pacific Islander 2.6 2.0 0.7 0.06 Other 2.8 2.1 0.7 0.28
Male (percent) 50.2 50.7 -0.5 0.63
English As Second Language (percent) 14.4 13.8 0.6 0.77
Special Education Status (percent) 13.2 12.4 0.8 0.62
Sixth-Grade Mathematics Scores on State Accountability Assessment (standardized)
0.09 0.03 0.07 0.22
Sample Size: N=10,915 students (5,587 treatment; 5,328 control). SOURCE: Study District Records.
NOTES: aAge was calculated as the age (in years) of a student as of September 1, 2007.
Percentage values for characteristics with multiple categories may not sum to 100 due to rounding.
The analyses are based on a three-level model controlling for random assignment block.
P-values are based on t-tests. Two-tailed statistical significance at the p ≤ .05 level is indicated by an asterisk (*).
Technical Notes on Analytic Approaches
This part of the appendix provides two sets of technical notes that accompany the Analytic Approaches section in Chapter 2 of the report. The first section describes the statistical model used to estimate the impacts of the PD program on teacher and student outcomes. The second section addresses issues related to tests of impacts on multiple outcome measures and subgroups.
Statistical Models for Estimating Impacts
The study focuses on the impact of professional development on three types of outcomes: teacher knowledge, teacher instructional practice, and student achievement. We discuss teacher knowledge and instructional practice together because the issues are similar, and we then consider student achievement. All teachers and students with available outcome measures are included in the impact analysis.
The basic approach for the impact analyses is a pooled-sample approach, which combines the data from all 12 districts in the study sample, using dummy variables to control for district and block differences as fixed effects. This approach uses the whole data set in a single analysis and allows us to see how the impact of the PD program differs across districts and whether those differences are statistically significant. We specify the model as follows:
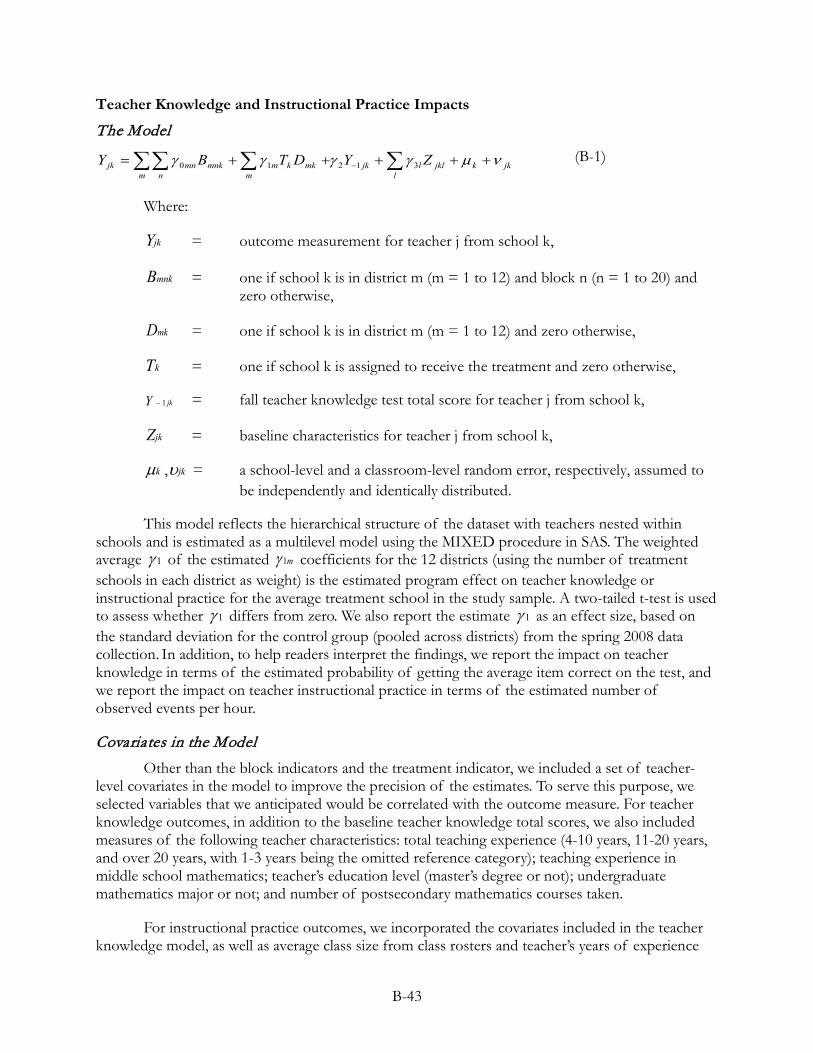
B-43
Teacher Knowledge and Instructional Practice Impacts
The Model
jkkl
jklljkm m
mkkmn
mnkmnjk ZYDTBY νµγγγγ +++++= ∑∑ ∑∑ − 31210 (B-1)
Where:
jkY = outcome measurement for teacher j from school k,
mnkB = one if school k is in district m (m = 1 to 12) and block n (n = 1 to 20) and zero otherwise,
mkD = one if school k is in district m (m = 1 to 12) and zero otherwise,
kT = one if school k is assigned to receive the treatment and zero otherwise,
= fall teacher knowledge test total score for teacher j from school k, jkY 1−
jkZ = baseline characteristics for teacher j from school k,
kµ , jkυ = a school-level and a classroom-level random error, respectively, assumed to be independently and identically distributed.
This model reflects the hierarchical structure of the dataset with teachers nested within schools and is estimated as a multilevel model using the MIXED procedure in SAS. The weighted average 1γ of the estimated m1γ coefficients for the 12 districts (using the number of treatment schools in each district as weight) is the estimated program effect on teacher knowledge or instructional practice for the average treatment school in the study sample. A two-tailed t-test is used to assess whether 1γ differs from zero. We also report the estimate 1γ as an effect size, based on the standard deviation for the control group (pooled across districts) from the spring 2008 data collection. In addition, to help readers interpret the findings, we report the impact on teacher knowledge in terms of the estimated probability of getting the average item correct on the test, and we report the impact on teacher instructional practice in terms of the estimated number of observed events per hour.
Covariates in the Model Other than the block indicators and the treatment indicator, we included a set of teacher-
level covariates in the model to improve the precision of the estimates. To serve this purpose, we selected variables that we anticipated would be correlated with the outcome measure. For teacher knowledge outcomes, in addition to the baseline teacher knowledge total scores, we also included measures of the following teacher characteristics: total teaching experience (4-10 years, 11-20 years, and over 20 years, with 1-3 years being the omitted reference category); teaching experience in middle school mathematics; teacher’s education level (master’s degree or not); undergraduate mathematics major or not; and number of postsecondary mathematics courses taken.
For instructional practice outcomes, we incorporated the covariates included in the teacher knowledge model, as well as average class size from class rosters and teacher’s years of experience
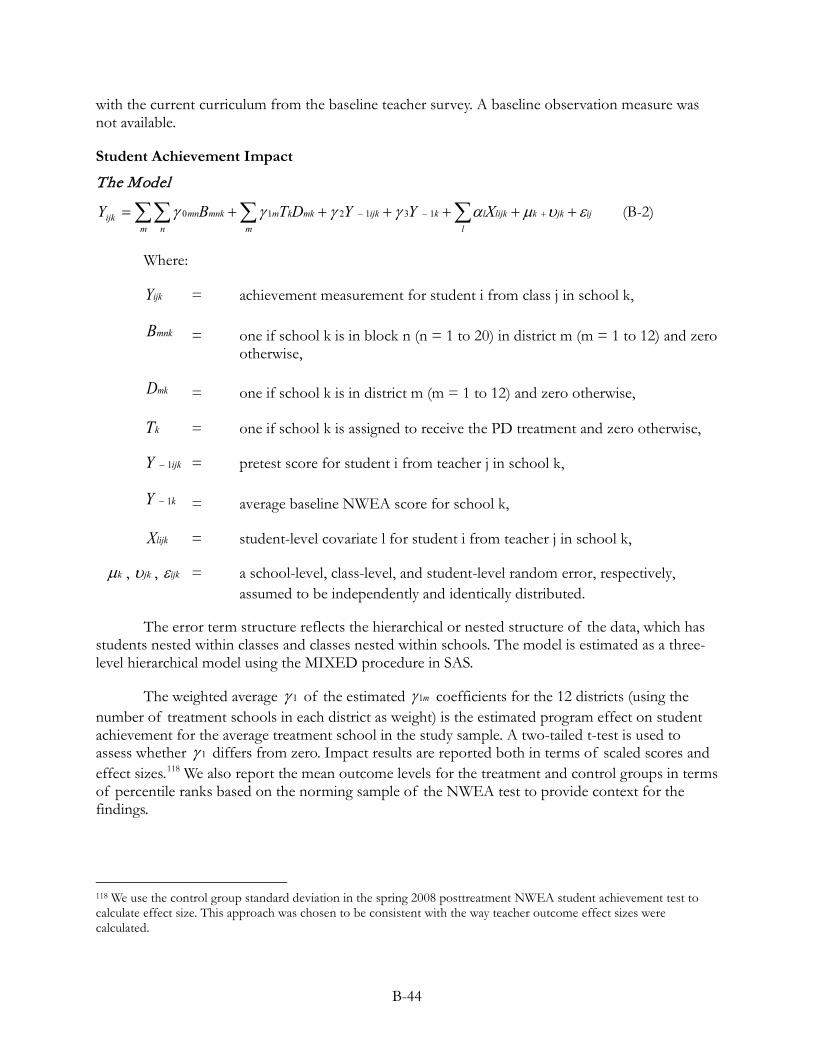
B-44
with the current curriculum from the baseline teacher survey. A baseline observation measure was not available.
Student Achievement Impact
The Model
∑ ∑∑∑ ++++++= +−−
mijjkk
llijklkijkmkkm
m nmnkmnijk XYYDTBY ευµαγγγγ 131210 (B-2)
Where:
ijkY = achievement measurement for student i from class j in school k,
mnkB = one if school k is in block n (n = 1 to 20) in district m (m = 1 to 12) and zero otherwise,
mkD = one if school k is in district m (m = 1 to 12) and zero otherwise,
kT = one if school k is assigned to receive the PD treatment and zero otherwise,
ijkY 1− = pretest score for student i from teacher j in school k,
kY 1− = average baseline NWEA score for school k,
lijkX = student-level covariate l for student i from teacher j in school k,
kµ , jkυ , ijkε = a school-level, class-level, and student-level random error, respectively, assumed to be independently and identically distributed.
The error term structure reflects the hierarchical or nested structure of the data, which has students nested within classes and classes nested within schools. The model is estimated as a three-level hierarchical model using the MIXED procedure in SAS.
The weighted average 1γ of the estimated m1γ coefficients for the 12 districts (using the number of treatment schools in each district as weight) is the estimated program effect on student achievement for the average treatment school in the study sample. A two-tailed t-test is used to assess whether 1γ differs from zero. Impact results are reported both in terms of scaled scores and effect sizes.118
118 We use the control group standard deviation in the spring 2008 posttreatment NWEA student achievement test to calculate effect size. This approach was chosen to be consistent with the way teacher outcome effect sizes were calculated.
We also report the mean outcome levels for the treatment and control groups in terms of percentile ranks based on the norming sample of the NWEA test to provide context for the findings.
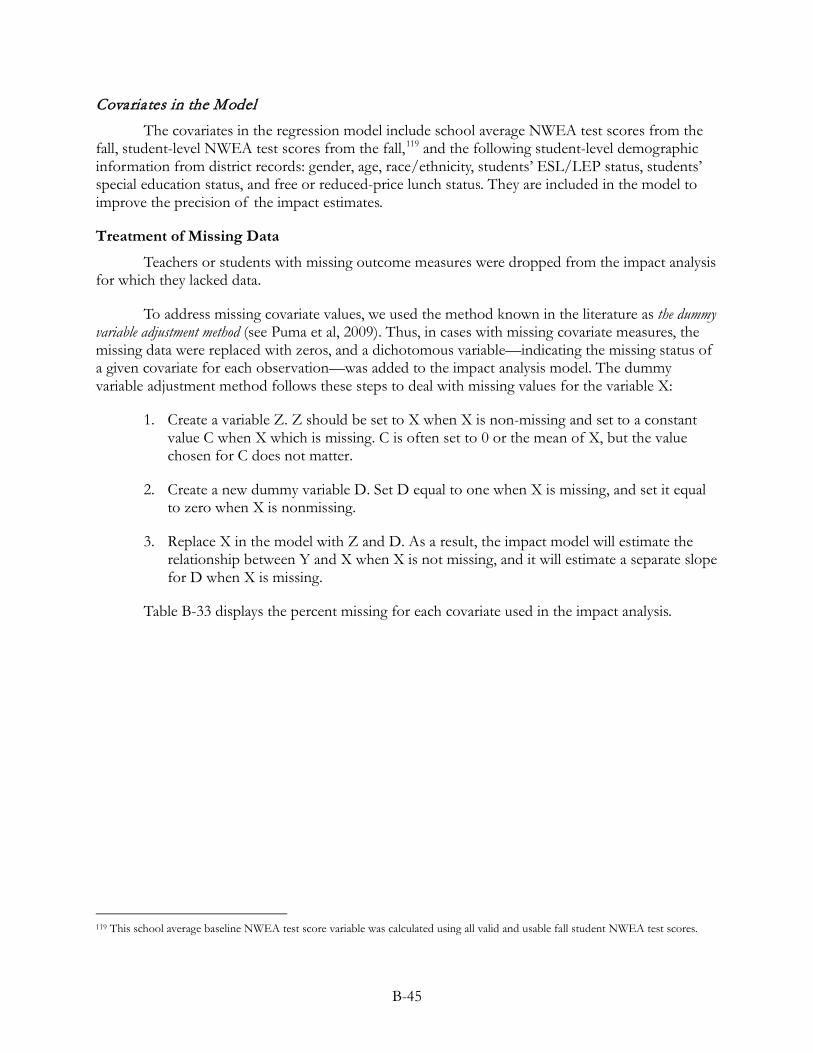
B-45
Covariates in the Model The covariates in the regression model include school average NWEA test scores from the
fall, student-level NWEA test scores from the fall,119
Treatment of Missing Data
and the following student-level demographic information from district records: gender, age, race/ethnicity, students’ ESL/LEP status, students’ special education status, and free or reduced-price lunch status. They are included in the model to improve the precision of the impact estimates.
Teachers or students with missing outcome measures were dropped from the impact analysis for which they lacked data.
To address missing covariate values, we used the method known in the literature as the dummy variable adjustment method (see Puma et al, 2009). Thus, in cases with missing covariate measures, the missing data were replaced with zeros, and a dichotomous variable—indicating the missing status of a given covariate for each observation—was added to the impact analysis model. The dummy variable adjustment method follows these steps to deal with missing values for the variable X:
1. Create a variable Z. Z should be set to X when X is non-missing and set to a constant value C when X which is missing. C is often set to 0 or the mean of X, but the value chosen for C does not matter.
2. Create a new dummy variable D. Set D equal to one when X is missing, and set it equal to zero when X is nonmissing.
3. Replace X in the model with Z and D. As a result, the impact model will estimate the relationship between Y and X when X is not missing, and it will estimate a separate slope for D when X is missing.
Table B-33 displays the percent missing for each covariate used in the impact analysis.
119 This school average baseline NWEA test score variable was calculated using all valid and usable fall student NWEA test scores.
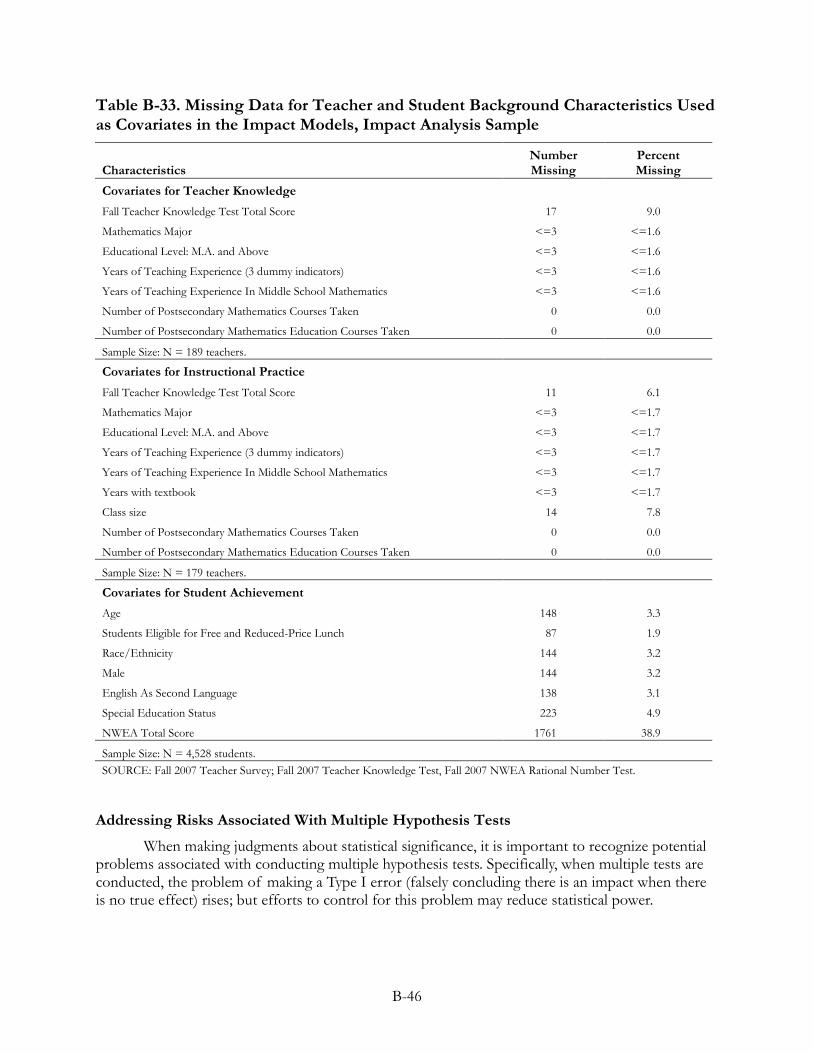
B-46
Table B-33. Missing Data for Teacher and Student Background Characteristics Used as Covariates in the Impact Models, Impact Analysis Sample
Characteristics Number Missing
Percent Missing
Covariates for Teacher Knowledge Fall Teacher Knowledge Test Total Score 17 9.0
Mathematics Major <=3 <=1.6
Educational Level: M.A. and Above <=3 <=1.6
Years of Teaching Experience (3 dummy indicators) <=3 <=1.6
Years of Teaching Experience In Middle School Mathematics <=3 <=1.6
Number of Postsecondary Mathematics Courses Taken 0 0.0
Number of Postsecondary Mathematics Education Courses Taken 0 0.0
Sample Size: N = 189 teachers.
Covariates for Instructional Practice Fall Teacher Knowledge Test Total Score 11 6.1
Mathematics Major <=3 <=1.7
Educational Level: M.A. and Above <=3 <=1.7
Years of Teaching Experience (3 dummy indicators) <=3 <=1.7
Years of Teaching Experience In Middle School Mathematics <=3 <=1.7
Years with textbook <=3 <=1.7
Class size 14 7.8
Number of Postsecondary Mathematics Courses Taken 0 0.0
Number of Postsecondary Mathematics Education Courses Taken 0 0.0
Sample Size: N = 179 teachers.
Covariates for Student Achievement Age 148 3.3
Students Eligible for Free and Reduced-Price Lunch 87 1.9
Race/Ethnicity 144 3.2
Male 144 3.2
English As Second Language 138 3.1
Special Education Status 223 4.9
NWEA Total Score 1761 38.9
Sample Size: N = 4,528 students. SOURCE: Fall 2007 Teacher Survey; Fall 2007 Teacher Knowledge Test, Fall 2007 NWEA Rational Number Test.
Addressing Risks Associated With Multiple Hypothesis Tests
When making judgments about statistical significance, it is important to recognize potential problems associated with conducting multiple hypothesis tests. Specifically, when multiple tests are conducted, the problem of making a Type I error (falsely concluding there is an impact when there is no true effect) rises; but efforts to control for this problem may reduce statistical power.

B-47
To control the Type I error rate while maintaining power insofar as possible, we used a two-step approach to address the multiple hypothesis testing issue. The first step in this process is to divide the impact analyses into two tiers: confirmatory analyses, which provide answers to our key research questions; and exploratory analyses, which facilitate a deeper analysis of our key findings and what they mean. The designation of each impact analysis is listed in the final column of Exhibit B-5.
The second step involves using composite “qualifying” tests to assess the overall statistical significance of a set of confirmatory impact estimates within a measurement domain. The qualifying test uses a composite index averaging the individual measures included in a domain. When a qualifying test indicates a statistically significant difference between groups, it suggests that there are in fact statistically significant findings in one or more of the individual tests included and hence adds confidence to the interpretation of the individual findings. However, when a qualifying test does not indicate a statistically significant difference between groups, it calls into question the interpretation of specific findings within that domain.
The qualifying tests were specified as follows, for the confirmatory analyses in the three domains on which the impact analyses focus: teacher knowledge, instructional practice, and student achievement:
•
•
•
For the teacher knowledge domain, we treated the Total score as a qualifying test for its subscores: Common knowledge score and Specialized knowledge score.
For the instructional practice domain, there are three outcome measures: Teacher focuses on mathematical reasoning, Teacher elicits student thinking, and Teacher uses representations. A composite “index” was constructed by averaging standardized versions of these three outcomes.
For the student achievement domain, we treated the Total score as a qualifying test for its subscale scores: Fractions and decimals score and Ratio and proportion score.
We treated the analyses of impact for provider and curricular subgroups as exploratory analyses and only reported unadjusted p-values for these analyses.
B-48
Exhibit B-5. Outcome Domains, Measures, Subgroups, and Types of Tests for the Middle School Mathematics PD Impact Study
Domain Outcome Measure Data Source Sample Type of Test Teacher Knowledge
Total Score Teacher Knowledge Test
Full Sample Confirmatory
(3 outcomes) Subgroups by PD Provider Exploratory Subgroups by Mathematics Curriculum Exploratory Subgroup of Stable Teachers Exploratory
CK Score Teacher Knowledge Test
Full Sample Confirmatory
Subgroups by PD Provider Exploratory Subgroups by Mathematics Curriculum Exploratory Subgroup of Stable Teachers Exploratory
SK Score Teacher Knowledge Test
Full Sample Confirmatory
Subgroups by PD Provider Exploratory Subgroups by Mathematics Curriculum Exploratory Subgroup of Stable Teachers Exploratory Instructional Practice
Teacher Elicits Student Thinking
Classroom Observations
Full Sample Confirmatory
(3 outcomes) Subgroups by PD Provider Exploratory Subgroups by Mathematics Curriculum Exploratory Subgroup of Stable Teachers Exploratory
Teacher Uses Representations
Classroom Observations
Full Sample Confirmatory
Subgroups by PD Provider Exploratory Subgroups by Mathematics Curriculum Exploratory Subgroup of Stable Teachers Exploratory
Teacher Focuses On Mathematical Reasoning
Classroom Observations
Full Sample Confirmatory
Subgroups by PD Provider Exploratory Subgroups by Mathematics Curriculum Exploratory Subgroup of Stable Teachers Exploratory Student Mathematics Achievement
Total Score NWEA Rational Numbers Test
Full Sample Confirmatory
(3 outcomes) Subgroups by PD Provider Exploratory Subgroups by Mathematics Curriculum Exploratory Subgroup of Stable Teachers Exploratory
Fractions and Decimals NWEA Rational Numbers Test
Full Sample Confirmatory
Subgroups by PD Provider Exploratory Subgroups by Mathematics Curriculum Exploratory Subgroup of Stable Teachers Exploratory
Ratio and Proportion NWEA Rational Numbers Test
Full Sample Confirmatory
Subgroups by PD Provider Exploratory Subgroups by Mathematics Curriculum Exploratory Subgroup of Stable Teachers Exploratory

APPENDIX C SUPPLEMENTAL INFORMATION ON THE DESIGN AND IMPLEMENTATION OF THE
PD PROGRAM

C-1
APPENDIX C. SUPPLEMENTAL INFORMATION ON THE DESIGN AND
IMPLEMENTATION OF THE PD PROGRAM
This appendix supplements the description of the PD program and its implementation in Chapter 3. The first section describes the scheduled coverage of seventh-grade mathematics topics in each district participating in the study, a key context for the study’s PD program. The second section provides a detailed list of each PD provider’s summer institute and seminar day topics. The third section describes supplemental PD implementation results separately for each PD provider. The fourth section presents PD participation results separately for each PD provider. The final section presents the service contrast in the features of PD in unstandardized form.
Scheduled Coverage of Mathematics Topics
As discussed in Chapter 3, the topics in rational numbers that were the focus of the study’s PD program accounted for 31 percent of the curriculum covered in seventh-grade mathematics in the study districts.120
The timing of this instruction also varied, even within curriculum. Some of the CMP districts completed all of their scheduled instruction on rational numbers in a single block of time—e.g., in the months prior to the winter break, between November and March, or between March and May. The other districts split their rational numbers instruction into two distinct blocks—one that occurred in the fall semester, and one that occurred in the spring semester. In most CMP districts, all of the instruction on rational number topics was on ratio, proportion, and percent. Explicit instruction on fractions and decimals in the seventh grade curriculum was less common.
Table C-1 summarizes the percentage of time allocated to rational numbers instruction based on an analysis of the pacing guides for each district. The table also distinguishes between the two main topics of rational numbers instruction: (1) fractions and decimals and (2) ratio, rate, proportion, and percent. Time explicitly devoted to fractions and decimals in the district pacing guide ranged from zero (in 6 districts) to 21 percent. Time explicitly dedicated to ratio, rate, proportion, and percent ranged from 8 percent to 41 percent.
Among the six Glencoe districts, there was also variation in pacing, including variation in the timing of fractions and decimals relative to ratio, proportion, and percent topics. Most of the Glencoe districts had completed their scheduled instruction on rational number topics by the end of January, but in a small number of districts, about eight weeks of instruction was devoted to the topic of percent late in the school year.
120 In addition, at other points throughout the school year, teachers may have addressed students’ understanding of rational number topics in the context of providing instruction on other mathematics topics.
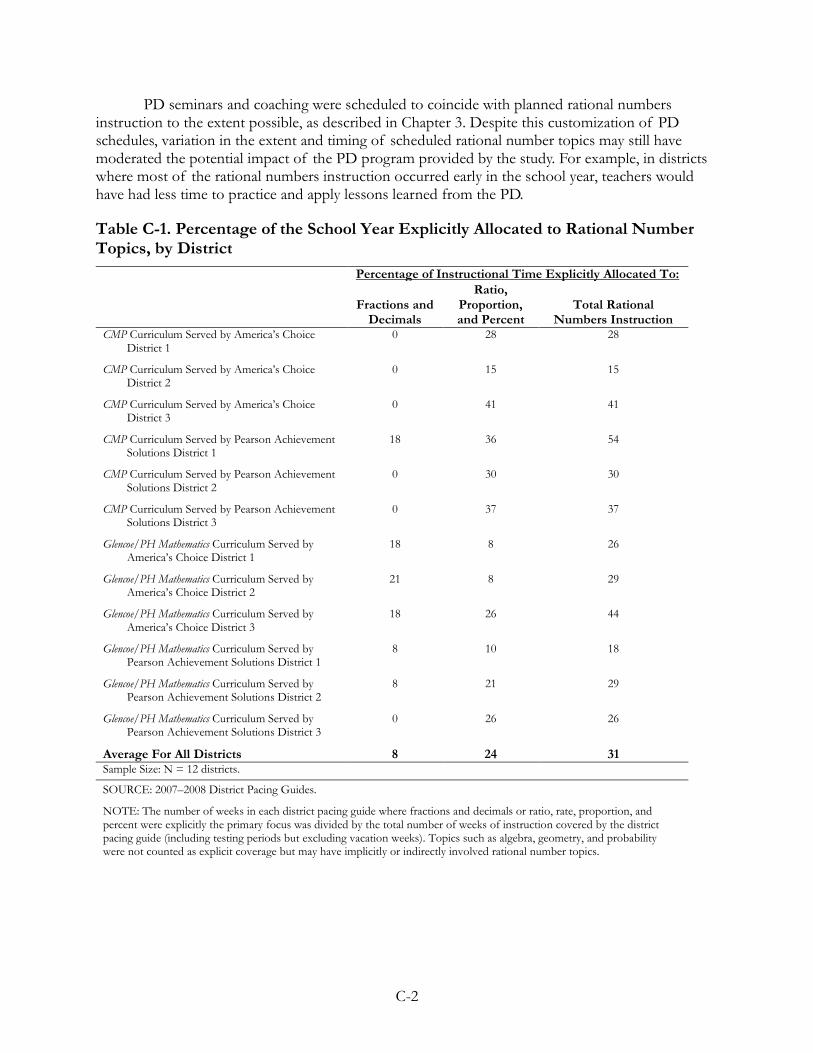
C-2
PD seminars and coaching were scheduled to coincide with planned rational numbers instruction to the extent possible, as described in Chapter 3. Despite this customization of PD schedules, variation in the extent and timing of scheduled rational number topics may still have moderated the potential impact of the PD program provided by the study. For example, in districts where most of the rational numbers instruction occurred early in the school year, teachers would have had less time to practice and apply lessons learned from the PD.
Table C-1. Percentage of the School Year Explicitly Allocated to Rational Number Topics, by District Percentage of Instructional Time Explicitly Allocated To:
Fractions and Decimals
Ratio, Proportion, and Percent
Total Rational Numbers Instruction
CMP Curriculum Served by America’s Choice District 1
0 28 28
CMP Curriculum Served by America’s Choice District 2
0 15 15
CMP Curriculum Served by America’s Choice District 3
0 41 41
CMP Curriculum Served by Pearson Achievement Solutions District 1
18 36 54
CMP Curriculum Served by Pearson Achievement Solutions District 2
0 30 30
CMP Curriculum Served by Pearson Achievement Solutions District 3
0 37 37
Glencoe/PH Mathematics Curriculum Served by America’s Choice District 1
18 8 26
Glencoe/PH Mathematics Curriculum Served by America’s Choice District 2
21 8 29
Glencoe/PH Mathematics Curriculum Served by America’s Choice District 3
18 26 44
Glencoe/PH Mathematics Curriculum Served by Pearson Achievement Solutions District 1
8 10 18
Glencoe/PH Mathematics Curriculum Served by Pearson Achievement Solutions District 2
8 21 29
Glencoe/PH Mathematics Curriculum Served by Pearson Achievement Solutions District 3
0 26 26
Average For All Districts 8 24 31 Sample Size: N = 12 districts.
SOURCE: 2007–2008 District Pacing Guides.
NOTE: The number of weeks in each district pacing guide where fractions and decimals or ratio, rate, proportion, and percent were explicitly the primary focus was divided by the total number of weeks of instruction covered by the district pacing guide (including testing periods but excluding vacation weeks). Topics such as algebra, geometry, and probability were not counted as explicit coverage but may have implicitly or indirectly involved rational number topics.
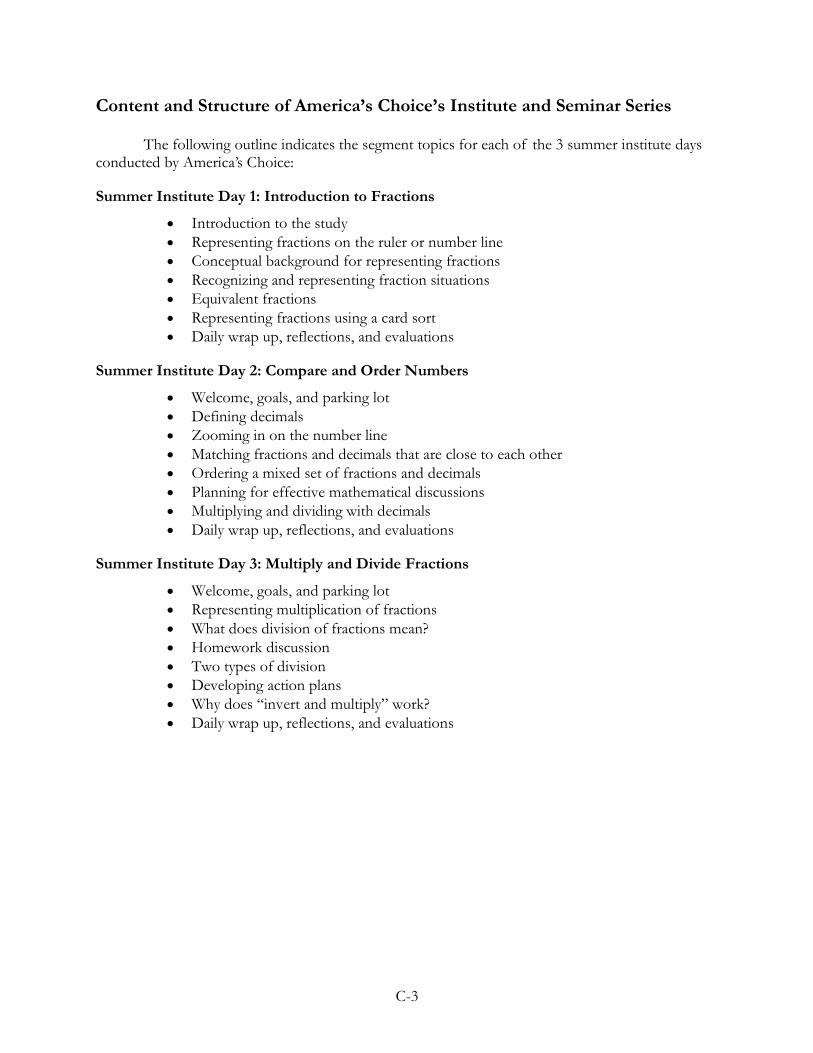
C-3
Content and Structure of America’s Choice’s Institute and Seminar Series
The following outline indicates the segment topics for each of the 3 summer institute days conducted by America’s Choice:
Summer Institute Day 1: Introduction to Fractions
• • • • • • •
Introduction to the study Representing fractions on the ruler or number line Conceptual background for representing fractions Recognizing and representing fraction situations Equivalent fractions Representing fractions using a card sort Daily wrap up, reflections, and evaluations
Summer Institute Day 2: Compare and Order Numbers
• • • • • • • •
Welcome, goals, and parking lot Defining decimals Zooming in on the number line Matching fractions and decimals that are close to each other Ordering a mixed set of fractions and decimals Planning for effective mathematical discussions Multiplying and dividing with decimals Daily wrap up, reflections, and evaluations
Summer Institute Day 3: Multiply and Divide Fractions
• • • • • • • •
Welcome, goals, and parking lot Representing multiplication of fractions What does division of fractions mean? Homework discussion Two types of division Developing action plans Why does “invert and multiply” work? Daily wrap up, reflections, and evaluations

C-4
The following outline indicates the segment topics for each of the 5 seminar days conducted by America’s Choice:121
Seminar Day 1: Ratio Tables
• • • • • • •
Welcome and goals Representing ratios Introducing ratio tables Connecting ratio tables and fractions Lesson planning Connecting to algebra Closing the seminar day
Seminar Day 2: Strip Diagrams and Scale Factor • • • • • • •
Welcome and goals Introducing strip diagrams Applying strip diagrams Homework discussion Scale Factor Applying scale factor Closing the seminar day
Seminar Day 3: Rate • • • • • •
Welcome and goals Applying unit rate Is it really addition of fractions? Homework discussion Do all rate problems involve proportions? Closing the seminar day
Seminar Day 4: Percent • • • • • • •
Welcome and goals Developing number sense for percents Lesson planning: What’s the math? Three kinds of percent problems Anticipating student responses Applying percent Closing the seminar day
121 As noted earlier, the five day-long seminars were reordered in each district so that each seminar was scheduled when the topics covered by that seminar were being taught, according to the district’s curriculum pacing guide. For the three America’s Choice districts that used Glencoe, it was not possible to schedule all three of the ratio, rate, and proportion seminars when these topics were being covered in the schools because ratio, rate, and proportion are covered in a single chapter in the Glencoe curriculum.
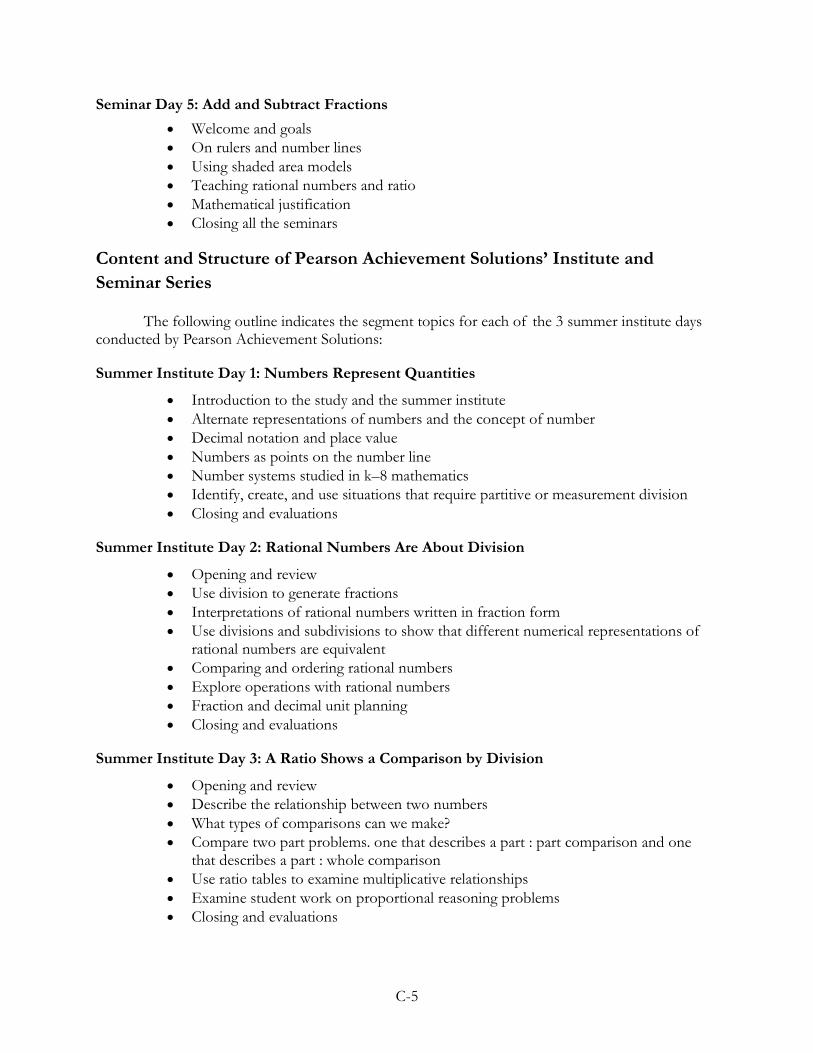
C-5
Seminar Day 5: Add and Subtract Fractions • • • • • •
Welcome and goals On rulers and number lines Using shaded area models Teaching rational numbers and ratio Mathematical justification Closing all the seminars
Content and Structure of Pearson Achievement Solutions’ Institute and Seminar Series
The following outline indicates the segment topics for each of the 3 summer institute days conducted by Pearson Achievement Solutions:
Summer Institute Day 1: Numbers Represent Quantities
• • • • • • •
Introduction to the study and the summer institute Alternate representations of numbers and the concept of number Decimal notation and place value Numbers as points on the number line Number systems studied in k–8 mathematics Identify, create, and use situations that require partitive or measurement division Closing and evaluations
Summer Institute Day 2: Rational Numbers Are About Division
• • • •
• • • •
Opening and review Use division to generate fractions Interpretations of rational numbers written in fraction form Use divisions and subdivisions to show that different numerical representations of rational numbers are equivalent Comparing and ordering rational numbers Explore operations with rational numbers Fraction and decimal unit planning Closing and evaluations
Summer Institute Day 3: A Ratio Shows a Comparison by Division
• • • •
• • •
Opening and review Describe the relationship between two numbers What types of comparisons can we make? Compare two part problems. one that describes a part : part comparison and one that describes a part : whole comparison Use ratio tables to examine multiplicative relationships Examine student work on proportional reasoning problems Closing and evaluations
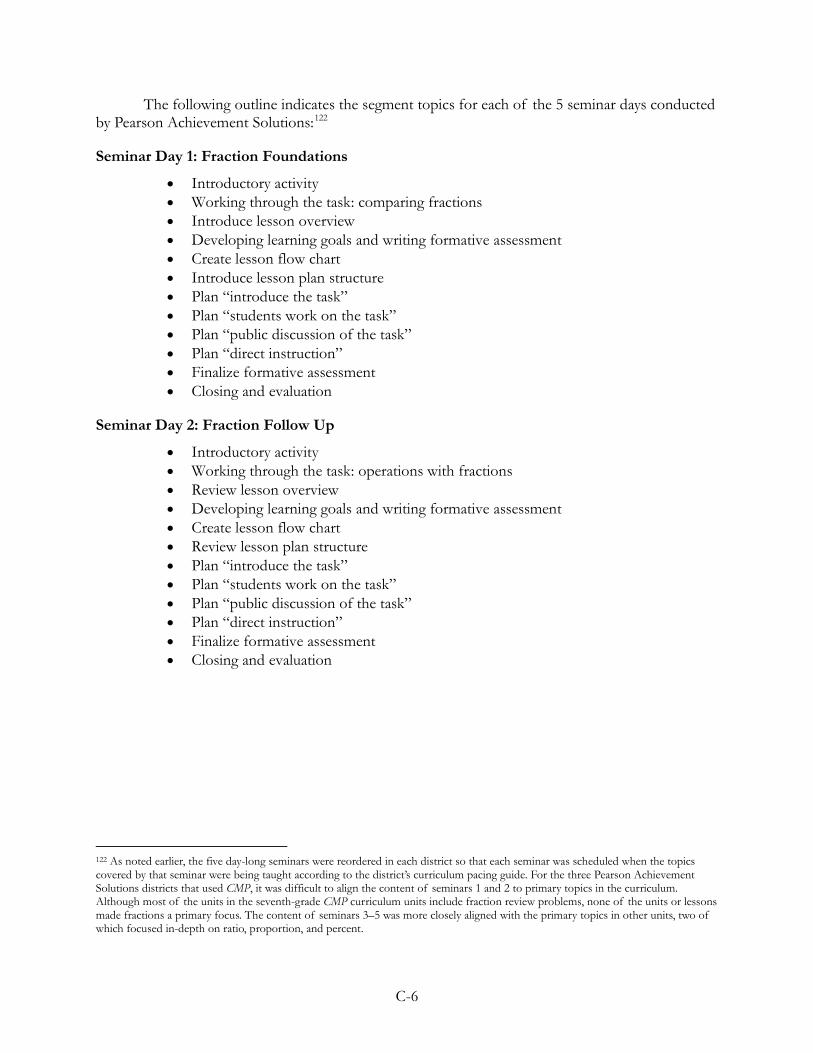
C-6
The following outline indicates the segment topics for each of the 5 seminar days conducted by Pearson Achievement Solutions:122
Seminar Day 1: Fraction Foundations
• • • • • • • • • • • •
Introductory activity Working through the task: comparing fractions Introduce lesson overview Developing learning goals and writing formative assessment Create lesson flow chart Introduce lesson plan structure Plan “introduce the task” Plan “students work on the task” Plan “public discussion of the task” Plan “direct instruction” Finalize formative assessment Closing and evaluation
Seminar Day 2: Fraction Follow Up
• • • • • • • • • • • •
Introductory activity Working through the task: operations with fractions Review lesson overview Developing learning goals and writing formative assessment Create lesson flow chart Review lesson plan structure Plan “introduce the task” Plan “students work on the task” Plan “public discussion of the task” Plan “direct instruction” Finalize formative assessment Closing and evaluation
122 As noted earlier, the five day-long seminars were reordered in each district so that each seminar was scheduled when the topics covered by that seminar were being taught according to the district’s curriculum pacing guide. For the three Pearson Achievement Solutions districts that used CMP, it was difficult to align the content of seminars 1 and 2 to primary topics in the curriculum. Although most of the units in the seventh-grade CMP curriculum units include fraction review problems, none of the units or lessons made fractions a primary focus. The content of seminars 3–5 was more closely aligned with the primary topics in other units, two of which focused in-depth on ratio, proportion, and percent.
C-7
Seminar Day 3: Ratio and Proportion Foundations
• • • • • • • • • • • •
Introductory activity Working through the task: ratios Review lesson overview Create lesson flow chart Developing learning goals and writing formative assessment Review lesson plan structure Plan “introduce the task” Plan “students work on the task” Plan “public discussion of the task” Plan “direct instruction” Finalize formative assessment Closing and evaluation
Seminar Day 4: Ratio and Proportion Follow Up
• • • • • • • • • •
Introductory activity Working through the task: proportions Review of what two features of teaching help students understand mathematics Review lesson overview and lesson plan structure review lesson plan structure Plan “introduce the task” Plan “students work on the task” Plan “public discussion of the task” Plan “direct instruction” Finalize formative assessment Closing and evaluation
Seminar Day 5: Connections
• • • • • • • • • • •
Introductory activity Review of what two features of teaching help students understand mathematics Working through the task: sharing pizza Review lesson overview and lesson plan structure Developing learning goals and writing formative assessment Plan “introduce the task” Plan “students work on the task” Plan “public discussion of the task” Plan “direct instruction” Finalize formative assessment Closing and evaluation
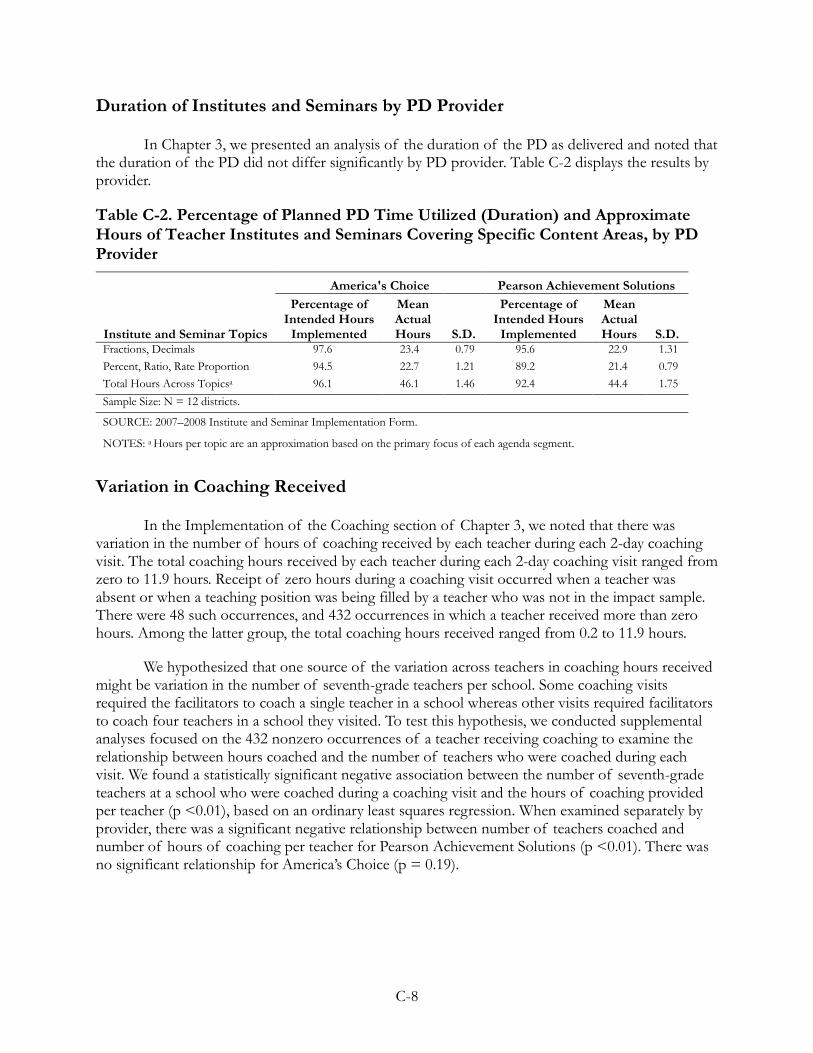
C-8
Duration of Institutes and Seminars by PD Provider
In Chapter 3, we presented an analysis of the duration of the PD as delivered and noted that the duration of the PD did not differ significantly by PD provider. Table C-2 displays the results by provider.
Table C-2. Percentage of Planned PD Time Utilized (Duration) and Approximate Hours of Teacher Institutes and Seminars Covering Specific Content Areas, by PD Provider
Institute and Seminar Topics
America's Choice Pearson Achievement Solutions Percentage of
Intended Hours Implemented
Mean Actual Hours S.D.
Percentage of Intended Hours
Implemented
Mean Actual Hours S.D.
Fractions, Decimals 97.6 23.4 0.79 95.6 22.9 1.31 Percent, Ratio, Rate Proportion 94.5 22.7 1.21 89.2 21.4 0.79 Total Hours Across Topicsa 96.1 46.1 1.46 92.4 44.4 1.75 Sample Size: N = 12 districts.
SOURCE: 2007–2008 Institute and Seminar Implementation Form.
NOTES: a Hours per topic are an approximation based on the primary focus of each agenda segment.
Variation in Coaching Received
In the Implementation of the Coaching section of Chapter 3, we noted that there was variation in the number of hours of coaching received by each teacher during each 2-day coaching visit. The total coaching hours received by each teacher during each 2-day coaching visit ranged from zero to 11.9 hours. Receipt of zero hours during a coaching visit occurred when a teacher was absent or when a teaching position was being filled by a teacher who was not in the impact sample. There were 48 such occurrences, and 432 occurrences in which a teacher received more than zero hours. Among the latter group, the total coaching hours received ranged from 0.2 to 11.9 hours.
We hypothesized that one source of the variation across teachers in coaching hours received might be variation in the number of seventh-grade teachers per school. Some coaching visits required the facilitators to coach a single teacher in a school whereas other visits required facilitators to coach four teachers in a school they visited. To test this hypothesis, we conducted supplemental analyses focused on the 432 nonzero occurrences of a teacher receiving coaching to examine the relationship between hours coached and the number of teachers who were coached during each visit. We found a statistically significant negative association between the number of seventh-grade teachers at a school who were coached during a coaching visit and the hours of coaching provided per teacher (p <0.01), based on an ordinary least squares regression. When examined separately by provider, there was a significant negative relationship between number of teachers coached and number of hours of coaching per teacher for Pearson Achievement Solutions (p <0.01). There was no significant relationship for America’s Choice (p = 0.19).
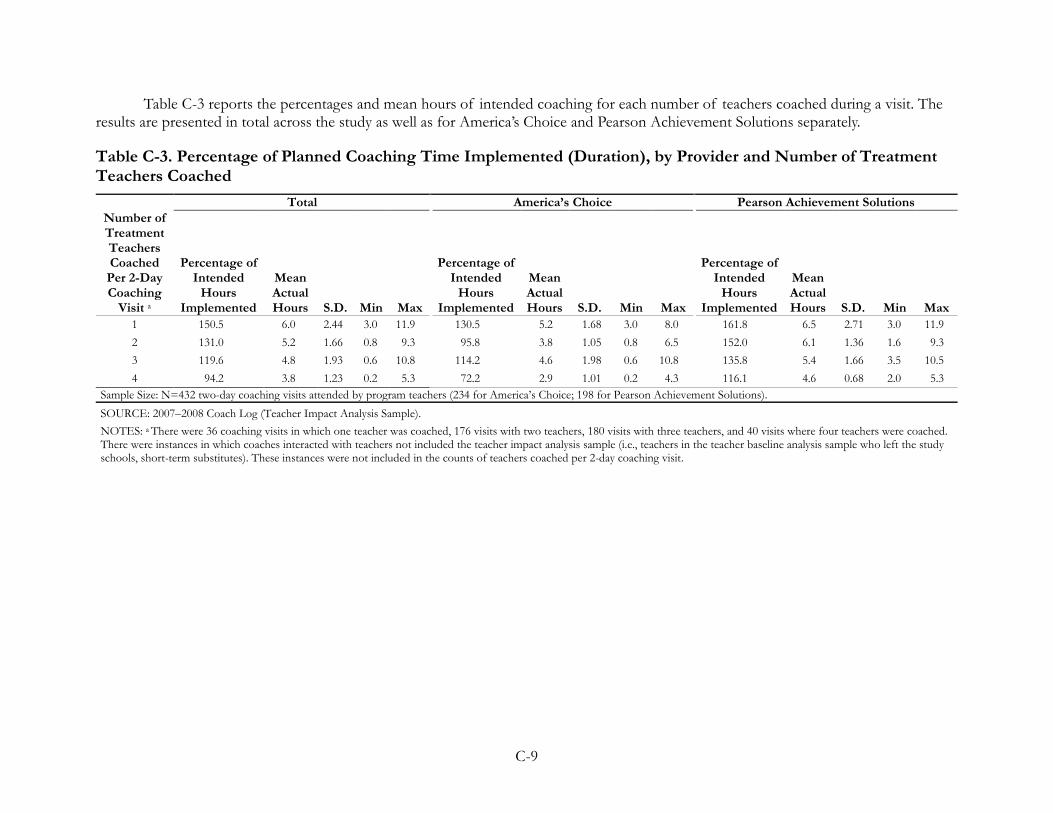
C-9
Table C-3 reports the percentages and mean hours of intended coaching for each number of teachers coached during a visit. The results are presented in total across the study as well as for America’s Choice and Pearson Achievement Solutions separately.
Table C-3. Percentage of Planned Coaching Time Implemented (Duration), by Provider and Number of Treatment Teachers Coached
Total America’s Choice Pearson Achievement Solutions Number of Treatment Teachers Coached
Per 2-Day Coaching
Visit a
Percentage of Intended
Hours Implemented
Mean Actual Hours S.D. Min Max
Percentage of Intended
Hours Implemented
Mean Actual Hours S.D. Min Max
Percentage of Intended
Hours Implemented
Mean Actual Hours S.D. Min Max
1 150.5 6.0 2.44 3.0 11.9 130.5 5.2 1.68 3.0 8.0 161.8 6.5 2.71 3.0 11.9 2 131.0 5.2 1.66 0.8 9.3 95.8 3.8 1.05 0.8 6.5 152.0 6.1 1.36 1.6 9.3 3 119.6 4.8 1.93 0.6 10.8 114.2 4.6 1.98 0.6 10.8 135.8 5.4 1.66 3.5 10.5 4 94.2 3.8 1.23 0.2 5.3 72.2 2.9 1.01 0.2 4.3 116.1 4.6 0.68 2.0 5.3
Sample Size: N=432 two-day coaching visits attended by program teachers (234 for America’s Choice; 198 for Pearson Achievement Solutions). SOURCE: 2007–2008 Coach Log (Teacher Impact Analysis Sample). NOTES: a There were 36 coaching visits in which one teacher was coached, 176 visits with two teachers, 180 visits with three teachers, and 40 visits where four teachers were coached. There were instances in which coaches interacted with teachers not included the teacher impact analysis sample (i.e., teachers in the teacher baseline analysis sample who left the study schools, short-term substitutes). These instances were not included in the counts of teachers coached per 2-day coaching visit.
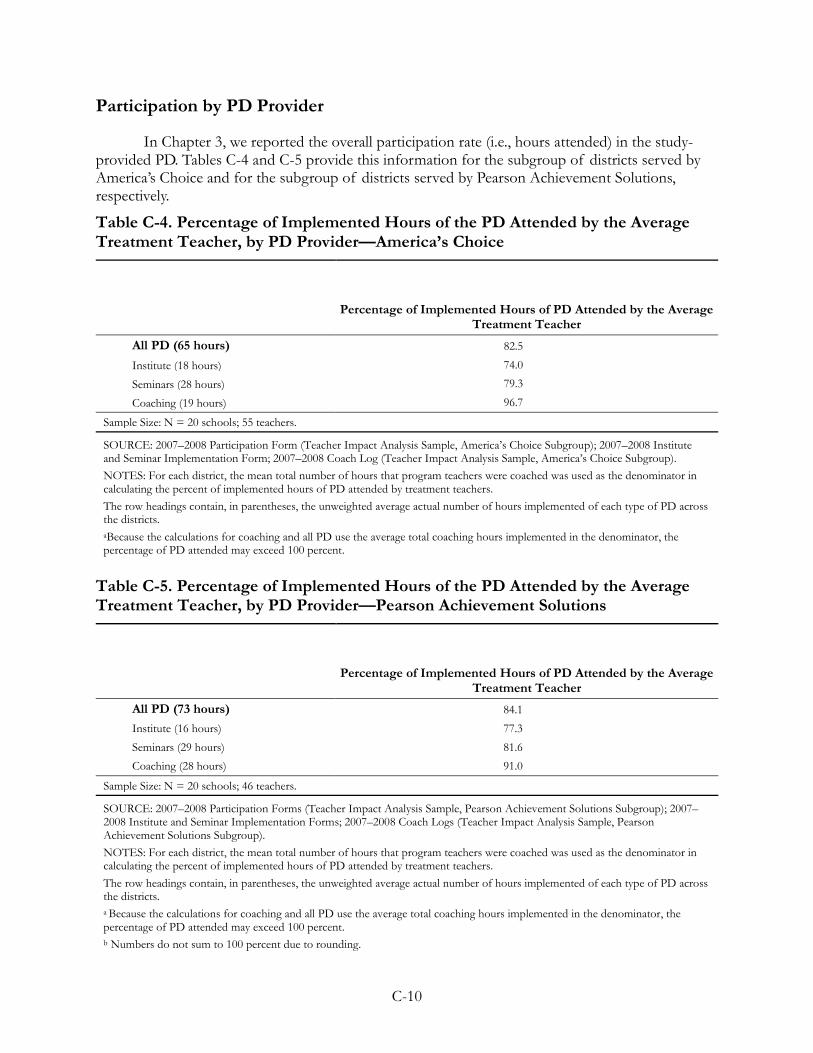
C-10
Participation by PD Provider
In Chapter 3, we reported the overall participation rate (i.e., hours attended) in the study-provided PD. Tables C-4 and C-5 provide this information for the subgroup of districts served by America’s Choice and for the subgroup of districts served by Pearson Achievement Solutions, respectively.
Table C-4. Percentage of Implemented Hours of the PD Attended by the Average Treatment Teacher, by PD Provider—America’s Choice
Percentage of Implemented Hours of PD Attended by the Average
Treatment Teacher All PD (65 hours) 82.5
Institute (18 hours) 74.0
Seminars (28 hours) 79.3
Coaching (19 hours) 96.7
Sample Size: N = 20 schools; 55 teachers.
SOURCE: 2007–2008 Participation Form (Teacher Impact Analysis Sample, America’s Choice Subgroup); 2007–2008 Institute and Seminar Implementation Form; 2007–2008 Coach Log (Teacher Impact Analysis Sample, America’s Choice Subgroup). NOTES: For each district, the mean total number of hours that program teachers were coached was used as the denominator in calculating the percent of implemented hours of PD attended by treatment teachers. The row headings contain, in parentheses, the unweighted average actual number of hours implemented of each type of PD across the districts. aBecause the calculations for coaching and all PD use the average total coaching hours implemented in the denominator, the percentage of PD attended may exceed 100 percent.
Table C-5. Percentage of Implemented Hours of the PD Attended by the Average Treatment Teacher, by PD Provider—Pearson Achievement Solutions
Percentage of Implemented Hours of PD Attended by the Average
Treatment Teacher All PD (73 hours) 84.1
Institute (16 hours) 77.3
Seminars (29 hours) 81.6 Coaching (28 hours) 91.0
Sample Size: N = 20 schools; 46 teachers.
SOURCE: 2007–2008 Participation Forms (Teacher Impact Analysis Sample, Pearson Achievement Solutions Subgroup); 2007–2008 Institute and Seminar Implementation Forms; 2007–2008 Coach Logs (Teacher Impact Analysis Sample, Pearson Achievement Solutions Subgroup). NOTES: For each district, the mean total number of hours that program teachers were coached was used as the denominator in calculating the percent of implemented hours of PD attended by treatment teachers. The row headings contain, in parentheses, the unweighted average actual number of hours implemented of each type of PD across the districts. a Because the calculations for coaching and all PD use the average total coaching hours implemented in the denominator, the percentage of PD attended may exceed 100 percent. b Numbers do not sum to 100 percent due to rounding.
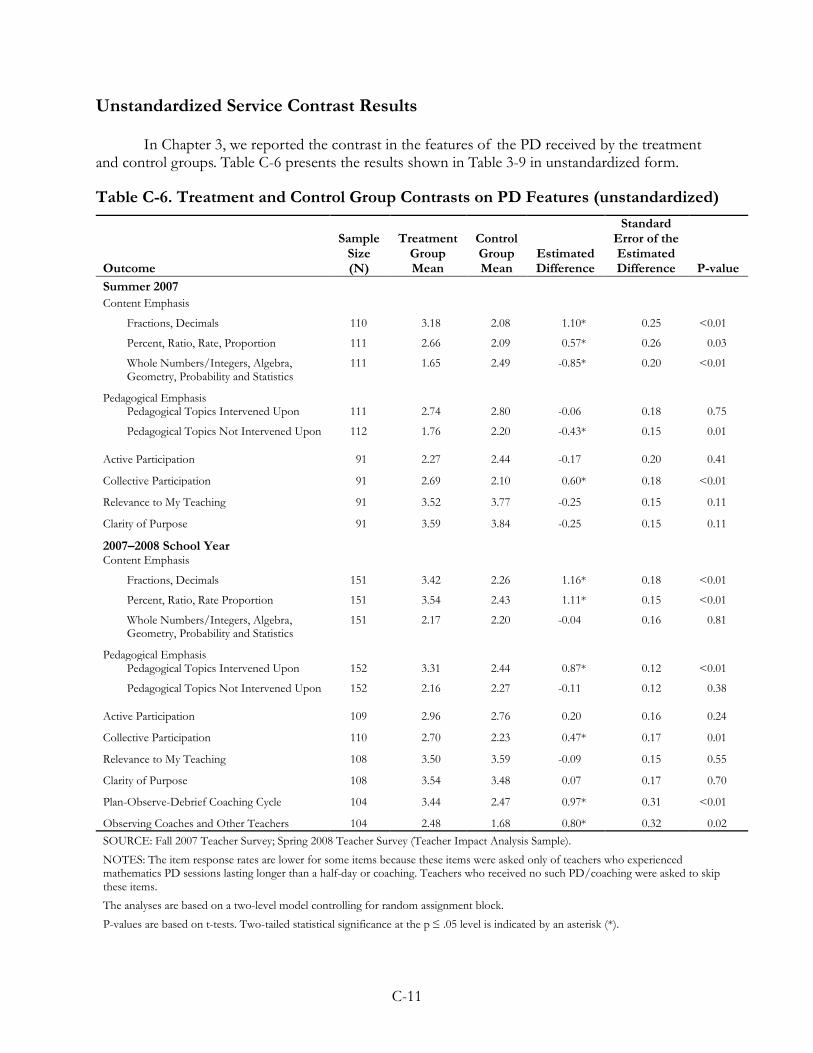
C-11
Unstandardized Service Contrast Results
In Chapter 3, we reported the contrast in the features of the PD received by the treatment and control groups. Table C-6 presents the results shown in Table 3-9 in unstandardized form.
Table C-6. Treatment and Control Group Contrasts on PD Features (unstandardized)
Outcome
Sample Size (N)
Treatment Group Mean
Control Group Mean
Estimated Difference
Standard Error of the Estimated Difference P-value
Summer 2007
Content Emphasis
Fractions, Decimals 110 3.18 2.08 1.10* 0.25 <0.01
Percent, Ratio, Rate, Proportion 111 2.66 2.09 0.57* 0.26 0.03
Whole Numbers/Integers, Algebra, Geometry, Probability and Statistics
111 1.65 2.49 -0.85* 0.20 <0.01
Pedagogical Emphasis
Pedagogical Topics Intervened Upon 111 2.74 2.80 -0.06 0.18 0.75
Pedagogical Topics Not Intervened Upon 112 1.76 2.20 -0.43* 0.15 0.01
Active Participation 91 2.27 2.44 -0.17 0.20 0.41
Collective Participation 91 2.69 2.10 0.60* 0.18 <0.01
Relevance to My Teaching 91 3.52 3.77 -0.25 0.15 0.11
Clarity of Purpose 91 3.59 3.84 -0.25 0.15 0.11
2007–2008 School Year
Content Emphasis
Fractions, Decimals 151 3.42 2.26 1.16* 0.18 <0.01
Percent, Ratio, Rate Proportion 151 3.54 2.43 1.11* 0.15 <0.01
Whole Numbers/Integers, Algebra, Geometry, Probability and Statistics
151 2.17 2.20 -0.04 0.16 0.81
Pedagogical Emphasis
Pedagogical Topics Intervened Upon 152 3.31 2.44 0.87* 0.12 <0.01
Pedagogical Topics Not Intervened Upon 152 2.16 2.27 -0.11 0.12 0.38
Active Participation 109 2.96 2.76 0.20 0.16 0.24
Collective Participation 110 2.70 2.23 0.47* 0.17 0.01
Relevance to My Teaching 108 3.50 3.59 -0.09 0.15 0.55
Clarity of Purpose 108 3.54 3.48 0.07 0.17 0.70
Plan-Observe-Debrief Coaching Cycle 104 3.44 2.47 0.97* 0.31 <0.01
Observing Coaches and Other Teachers 104 2.48 1.68 0.80* 0.32 0.02 SOURCE: Fall 2007 Teacher Survey; Spring 2008 Teacher Survey (Teacher Impact Analysis Sample).
NOTES: The item response rates are lower for some items because these items were asked only of teachers who experienced mathematics PD sessions lasting longer than a half-day or coaching. Teachers who received no such PD/coaching were asked to skip these items. The analyses are based on a two-level model controlling for random assignment block.
P-values are based on t-tests. Two-tailed statistical significance at the p ≤ .05 level is indicated by an asterisk (*).

APPENDIX D SUPPORTING TABLES AND FIGURES FOR
IMPACT ANALYSES

D-1
APPENDIX D. SUPPORTING TABLES AND FIGURES
FOR IMPACT ANALYSES
This appendix supplements the presentation of the study’s main impact analyses in Chapter 4. The first section provides impact analyses using alternative models to test the robustness of the findings in Chapter 4. The second section displays the variation in impacts across districts. The third section provides unadjusted means and standard deviations to supplement the impact analyses presented in Chapter 4.
Robustness Checks for Impact Estimates
In Chapter 4, we presented impact estimates and group means based on models that adjusted for student and teacher or classroom characteristics. Tables D-1 through D-3 present the impact estimates and group means for teacher knowledge, instructional practice, and student achievement without controlling for any student-level or school-level covariates other than the random assignment blocks. Table D-4 presents the student achievement results using the basic model used in the student analysis in Chapter 4 but also incorporating the teacher-level covariates that were included in the teacher outcome models. The teacher covariates include the baseline teacher knowledge total scores, total teacher experience, teaching experience in middle-school mathematics, teacher’s education level (master’s degree or not), undergraduate mathematics major (or not), the number of postsecondary mathematics courses taken by the teacher, the average class size from class rosters, and the teacher’s years of experience with the current curriculum, as recorded by teachers when completing the survey items on teacher background characteristics. Table D-5 presents student achievement results using teacher instead of classroom as the middle level of the multi-level model.
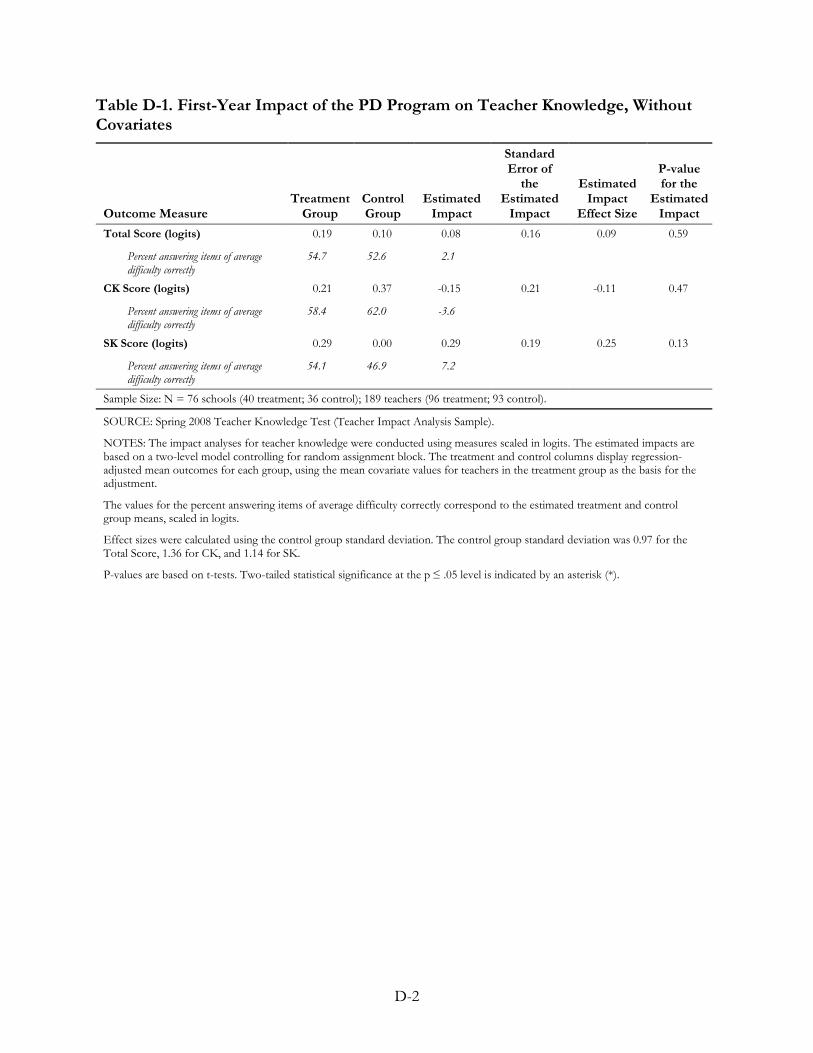
D-2
Table D-1. First-Year Impact of the PD Program on Teacher Knowledge, Without Covariates
Outcome Measure Treatment
Group Control Group
Estimated Impact
Standard Error of
the Estimated
Impact
Estimated Impact
Effect Size
P-value for the
Estimated Impact
Total Score (logits) 0.19 0.10 0.08 0.16 0.09 0.59
Percent answering items of average difficulty correctly
54.7 52.6 2.1
CK Score (logits) 0.21 0.37 -0.15 0.21 -0.11 0.47
Percent answering items of average difficulty correctly
58.4 62.0 -3.6
SK Score (logits) 0.29 0.00 0.29 0.19 0.25 0.13
Percent answering items of average difficulty correctly
54.1 46.9 7.2
Sample Size: N = 76 schools (40 treatment; 36 control); 189 teachers (96 treatment; 93 control).
SOURCE: Spring 2008 Teacher Knowledge Test (Teacher Impact Analysis Sample).
NOTES: The impact analyses for teacher knowledge were conducted using measures scaled in logits. The estimated impacts are based on a two-level model controlling for random assignment block. The treatment and control columns display regression-adjusted mean outcomes for each group, using the mean covariate values for teachers in the treatment group as the basis for the adjustment.
The values for the percent answering items of average difficulty correctly correspond to the estimated treatment and control group means, scaled in logits.
Effect sizes were calculated using the control group standard deviation. The control group standard deviation was 0.97 for the Total Score, 1.36 for CK, and 1.14 for SK.
P-values are based on t-tests. Two-tailed statistical significance at the p ≤ .05 level is indicated by an asterisk (*).
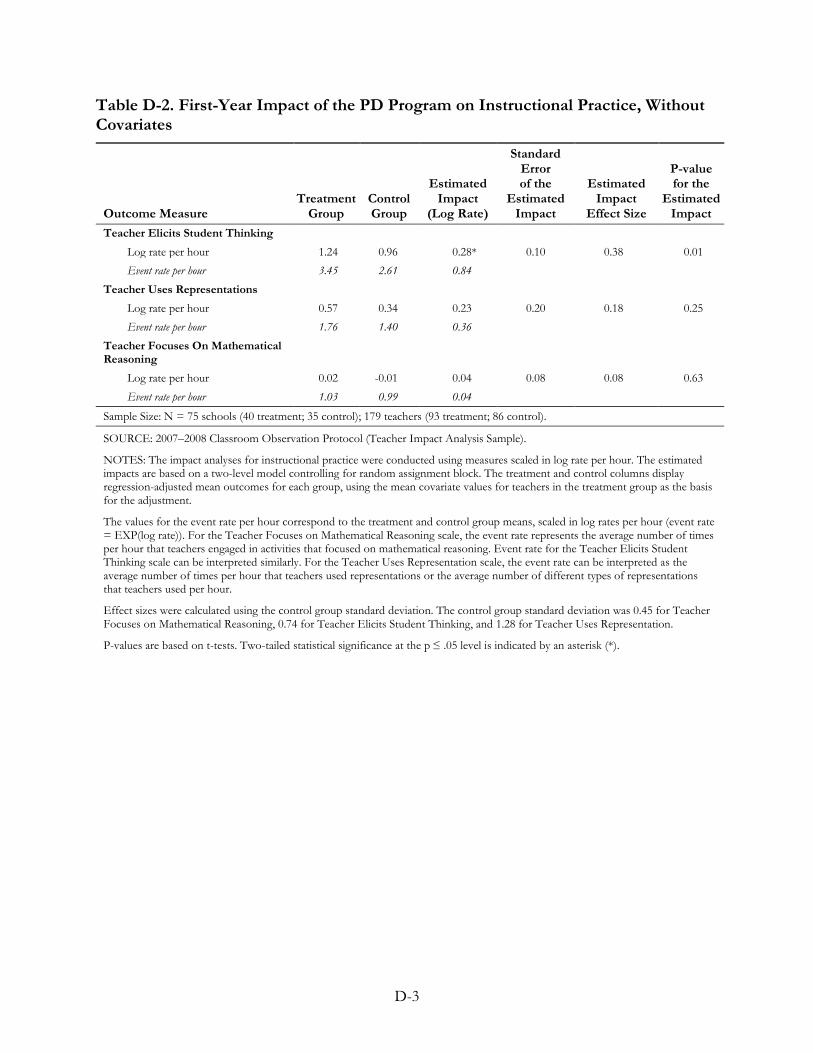
D-3
Table D-2. First-Year Impact of the PD Program on Instructional Practice, Without Covariates
Outcome Measure Treatment
Group Control Group
Estimated Impact
(Log Rate)
Standard Error of the
Estimated Impact
Estimated Impact
Effect Size
P-value for the
Estimated Impact
Teacher Elicits Student Thinking
Log rate per hour 1.24 0.96 0.28* 0.10 0.38 0.01 Event rate per hour 3.45 2.61 0.84
Teacher Uses Representations
Log rate per hour 0.57 0.34 0.23 0.20 0.18 0.25 Event rate per hour 1.76 1.40 0.36
Teacher Focuses On Mathematical Reasoning
Log rate per hour 0.02 -0.01 0.04 0.08 0.08 0.63
Event rate per hour 1.03 0.99 0.04
Sample Size: N = 75 schools (40 treatment; 35 control); 179 teachers (93 treatment; 86 control).
SOURCE: 2007–2008 Classroom Observation Protocol (Teacher Impact Analysis Sample).
NOTES: The impact analyses for instructional practice were conducted using measures scaled in log rate per hour. The estimated impacts are based on a two-level model controlling for random assignment block. The treatment and control columns display regression-adjusted mean outcomes for each group, using the mean covariate values for teachers in the treatment group as the basis for the adjustment.
The values for the event rate per hour correspond to the treatment and control group means, scaled in log rates per hour (event rate = EXP(log rate)). For the Teacher Focuses on Mathematical Reasoning scale, the event rate represents the average number of times per hour that teachers engaged in activities that focused on mathematical reasoning. Event rate for the Teacher Elicits Student Thinking scale can be interpreted similarly. For the Teacher Uses Representation scale, the event rate can be interpreted as the average number of times per hour that teachers used representations or the average number of different types of representations that teachers used per hour.
Effect sizes were calculated using the control group standard deviation. The control group standard deviation was 0.45 for Teacher Focuses on Mathematical Reasoning, 0.74 for Teacher Elicits Student Thinking, and 1.28 for Teacher Uses Representation.
P-values are based on t-tests. Two-tailed statistical significance at the p ≤ .05 level is indicated by an asterisk (*).
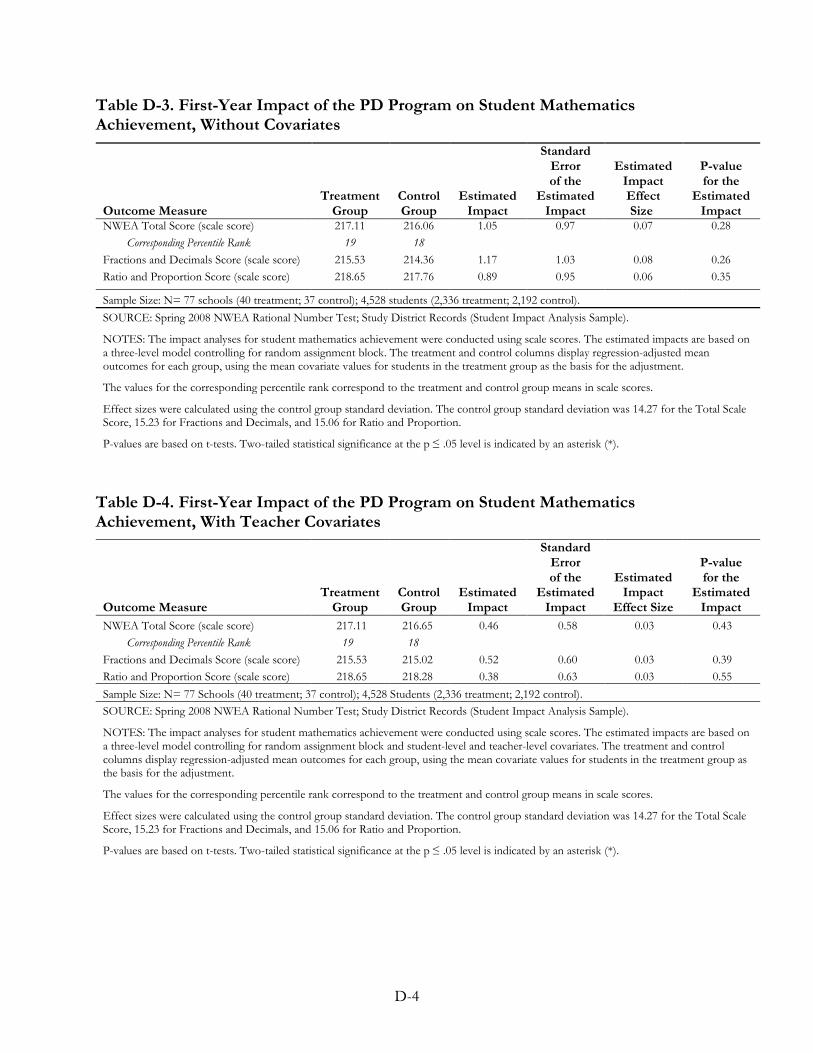
D-4
Table D-3. First-Year Impact of the PD Program on Student Mathematics Achievement, Without Covariates
Outcome Measure Treatment
Group Control Group
Estimated Impact
Standard Error of the
Estimated Impact
Estimated Impact Effect Size
P-value for the
Estimated Impact
NWEA Total Score (scale score) 217.11 216.06 1.05 0.97 0.07 0.28 Corresponding Percentile Rank 19 18
Fractions and Decimals Score (scale score) 215.53 214.36 1.17 1.03 0.08 0.26 Ratio and Proportion Score (scale score) 218.65 217.76 0.89 0.95 0.06 0.35
Sample Size: N= 77 schools (40 treatment; 37 control); 4,528 students (2,336 treatment; 2,192 control). SOURCE: Spring 2008 NWEA Rational Number Test; Study District Records (Student Impact Analysis Sample).
NOTES: The impact analyses for student mathematics achievement were conducted using scale scores. The estimated impacts are based on a three-level model controlling for random assignment block. The treatment and control columns display regression-adjusted mean outcomes for each group, using the mean covariate values for students in the treatment group as the basis for the adjustment.
The values for the corresponding percentile rank correspond to the treatment and control group means in scale scores.
Effect sizes were calculated using the control group standard deviation. The control group standard deviation was 14.27 for the Total Scale Score, 15.23 for Fractions and Decimals, and 15.06 for Ratio and Proportion.
P-values are based on t-tests. Two-tailed statistical significance at the p ≤ .05 level is indicated by an asterisk (*).
Table D-4. First-Year Impact of the PD Program on Student Mathematics Achievement, With Teacher Covariates
Outcome Measure Treatment
Group Control Group
Estimated Impact
Standard Error of the
Estimated Impact
Estimated Impact
Effect Size
P-value for the
Estimated Impact
NWEA Total Score (scale score) 217.11 216.65 0.46 0.58 0.03 0.43 Corresponding Percentile Rank 19 18
Fractions and Decimals Score (scale score) 215.53 215.02 0.52 0.60 0.03 0.39 Ratio and Proportion Score (scale score) 218.65 218.28 0.38 0.63 0.03 0.55 Sample Size: N= 77 Schools (40 treatment; 37 control); 4,528 Students (2,336 treatment; 2,192 control). SOURCE: Spring 2008 NWEA Rational Number Test; Study District Records (Student Impact Analysis Sample).
NOTES: The impact analyses for student mathematics achievement were conducted using scale scores. The estimated impacts are based on a three-level model controlling for random assignment block and student-level and teacher-level covariates. The treatment and control columns display regression-adjusted mean outcomes for each group, using the mean covariate values for students in the treatment group as the basis for the adjustment.
The values for the corresponding percentile rank correspond to the treatment and control group means in scale scores.
Effect sizes were calculated using the control group standard deviation. The control group standard deviation was 14.27 for the Total Scale Score, 15.23 for Fractions and Decimals, and 15.06 for Ratio and Proportion.
P-values are based on t-tests. Two-tailed statistical significance at the p ≤ .05 level is indicated by an asterisk (*).
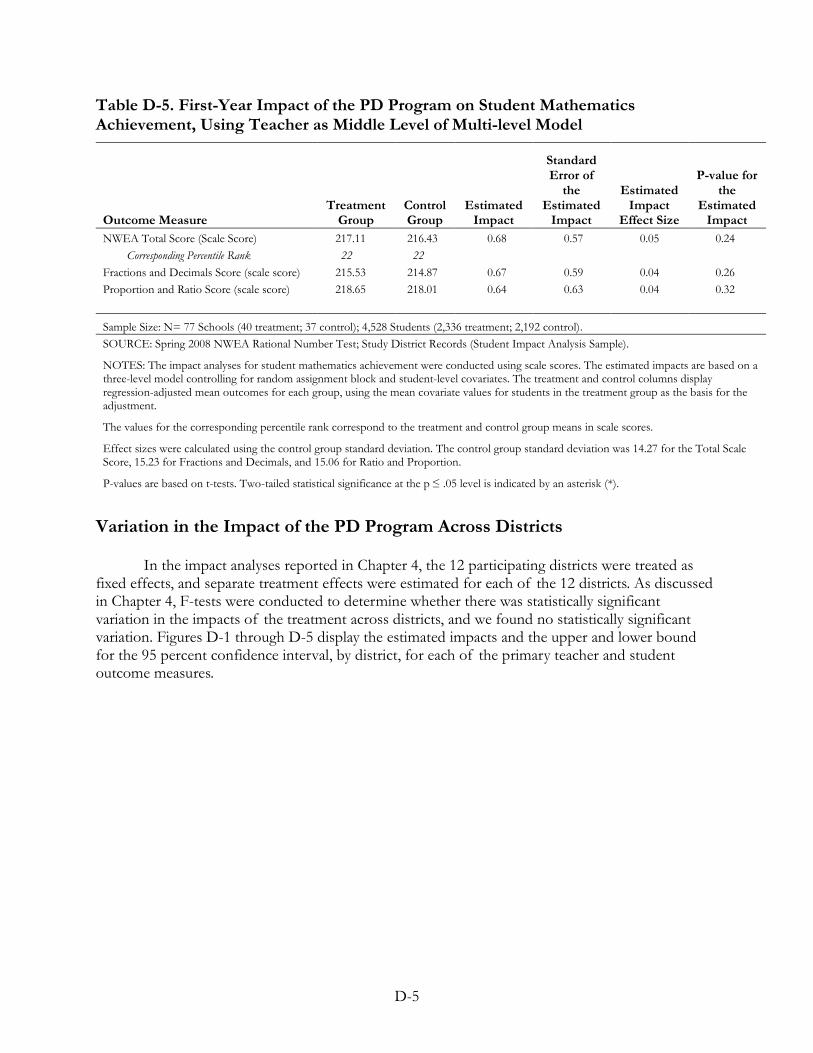
D-5
Table D-5. First-Year Impact of the PD Program on Student Mathematics Achievement, Using Teacher as Middle Level of Multi-level Model
Outcome Measure Treatment
Group Control Group
Estimated Impact
Standard Error of
the Estimated
Impact
Estimated Impact
Effect Size
P-value for the
Estimated Impact
NWEA Total Score (Scale Score) 217.11 216.43 0.68 0.57 0.05 0.24 Corresponding Percentile Rank 22 22
Fractions and Decimals Score (scale score) 215.53 214.87 0.67 0.59 0.04 0.26 Proportion and Ratio Score (scale score) 218.65 218.01 0.64 0.63 0.04 0.32
Sample Size: N= 77 Schools (40 treatment; 37 control); 4,528 Students (2,336 treatment; 2,192 control). SOURCE: Spring 2008 NWEA Rational Number Test; Study District Records (Student Impact Analysis Sample).
NOTES: The impact analyses for student mathematics achievement were conducted using scale scores. The estimated impacts are based on a three-level model controlling for random assignment block and student-level covariates. The treatment and control columns display regression-adjusted mean outcomes for each group, using the mean covariate values for students in the treatment group as the basis for the adjustment.
The values for the corresponding percentile rank correspond to the treatment and control group means in scale scores.
Effect sizes were calculated using the control group standard deviation. The control group standard deviation was 14.27 for the Total Scale Score, 15.23 for Fractions and Decimals, and 15.06 for Ratio and Proportion.
P-values are based on t-tests. Two-tailed statistical significance at the p ≤ .05 level is indicated by an asterisk (*).
Variation in the Impact of the PD Program Across Districts
In the impact analyses reported in Chapter 4, the 12 participating districts were treated as fixed effects, and separate treatment effects were estimated for each of the 12 districts. As discussed in Chapter 4, F-tests were conducted to determine whether there was statistically significant variation in the impacts of the treatment across districts, and we found no statistically significant variation. Figures D-1 through D-5 display the estimated impacts and the upper and lower bound for the 95 percent confidence interval, by district, for each of the primary teacher and student outcome measures.
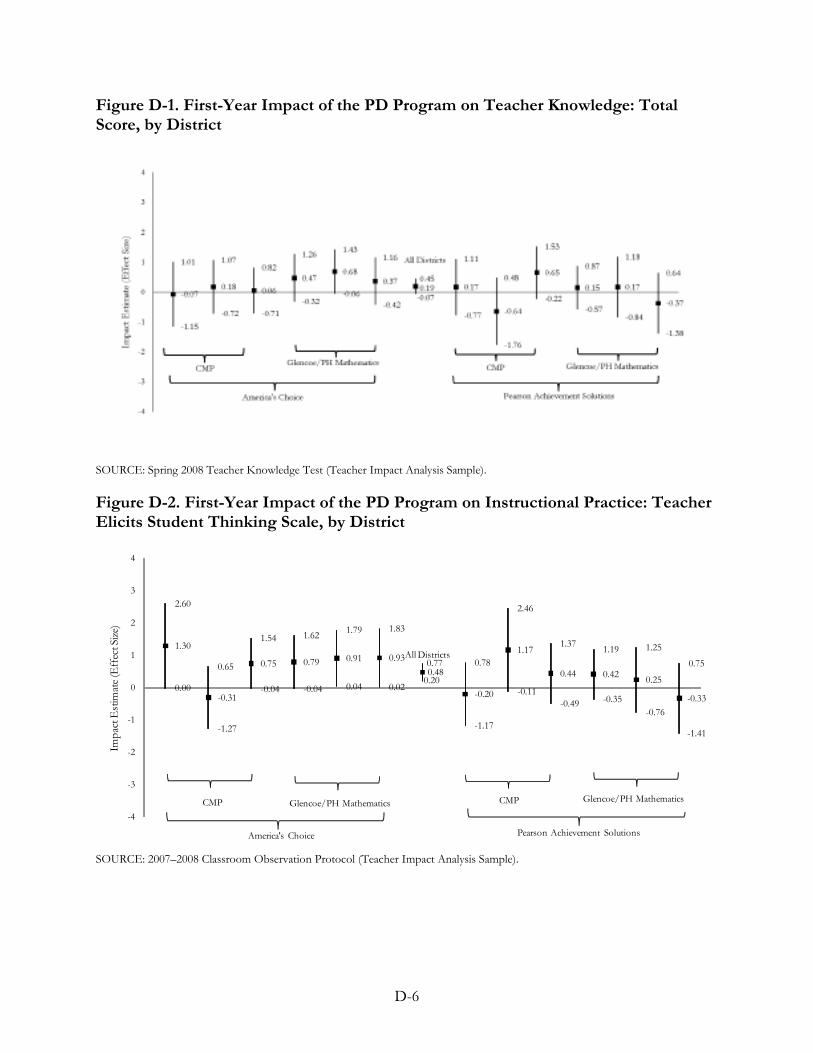
D-6
Figure D-1. First-Year Impact of the PD Program on Teacher Knowledge: Total Score, by District
SOURCE: Spring 2008 Teacher Knowledge Test (Teacher Impact Analysis Sample).
Figure D-2. First-Year Impact of the PD Program on Instructional Practice: Teacher Elicits Student Thinking Scale, by District
2.60
0.65
1.54 1.62 1.79 1.83
0.77 0.78
2.46
1.37 1.19 1.25
0.75
0.00
-1.27
-0.04 -0.04 0.04 0.020.20
-1.17
-0.11-0.49 -0.35
-0.76
-1.41
1.30
-0.31
0.75 0.79 0.91 0.930.48
-0.20
1.17
0.44 0.42 0.25
-0.33
-4
-3
-2
-1
0
1
2
3
4
Impa
ct E
stim
ate (
Eff
ect S
ize)
All Districts
America's Choice Pearson Achievement Solutions
CMPCMP Glencoe/PH Mathematics Glencoe/PH Mathematics
SOURCE: 2007–2008 Classroom Observation Protocol (Teacher Impact Analysis Sample).
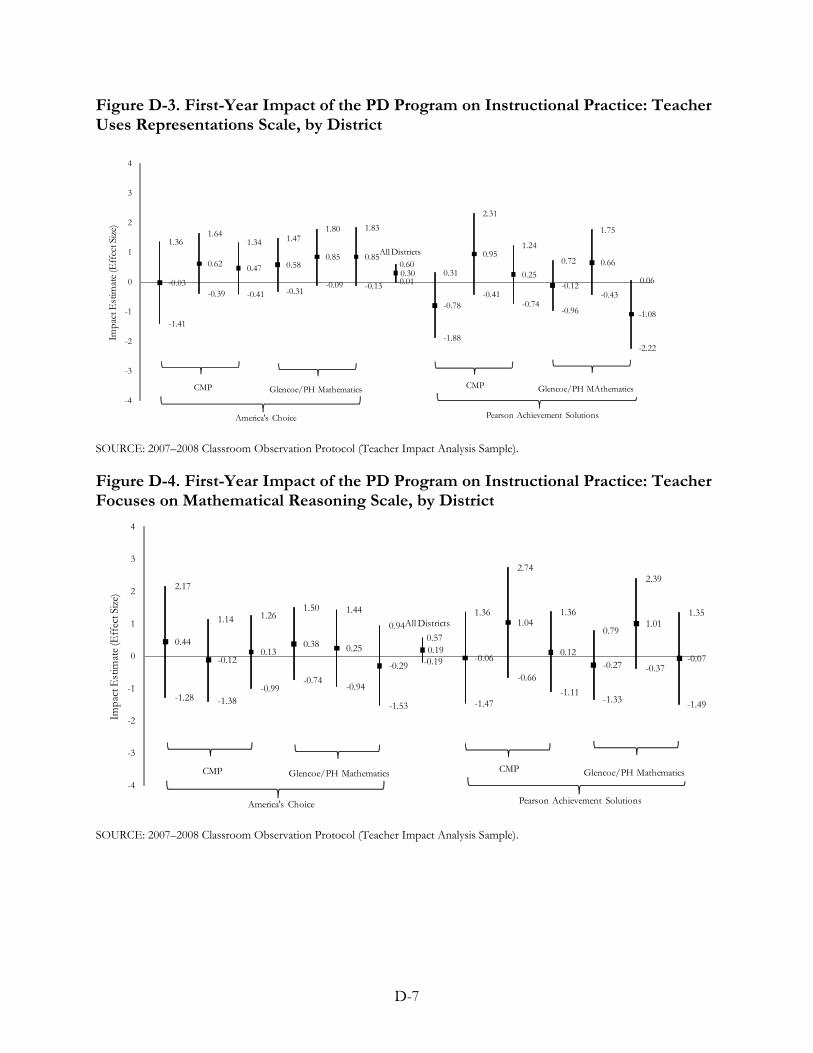
D-7
Figure D-3. First-Year Impact of the PD Program on Instructional Practice: Teacher Uses Representations Scale, by District
1.361.64
1.34 1.471.80 1.83
0.600.31
2.31
1.24
0.72
1.75
0.06
-1.41
-0.39 -0.41 -0.31-0.09 -0.13 -0.01
-1.88
-0.41-0.74
-0.96
-0.43
-2.22
-0.03
0.62 0.47 0.580.85 0.85
0.30
-0.78
0.95
0.25-0.12
0.66
-1.08
-4
-3
-2
-1
0
1
2
3
4
Impa
ct E
stim
ate (
Eff
ect S
ize)
All Districts
America's Choice Pearson Achievement Solutions
CMPCMP Glencoe/PH Mathematics Glencoe/PH MAthematics
SOURCE: 2007–2008 Classroom Observation Protocol (Teacher Impact Analysis Sample).
Figure D-4. First-Year Impact of the PD Program on Instructional Practice: Teacher Focuses on Mathematical Reasoning Scale, by District
2.17
1.14 1.261.50 1.44
0.940.57
1.36
2.74
1.36
0.79
2.39
1.35
-1.28 -1.38-0.99
-0.74-0.94
-1.53
-0.19
-1.47
-0.66-1.11
-1.33
-0.37
-1.49
0.44
-0.120.13
0.38 0.25
-0.29
0.19-0.06
1.04
0.12-0.27
1.01
-0.07
-4
-3
-2
-1
0
1
2
3
4
Impa
ct E
stim
ate (
Eff
ect S
ize)
All Districts
America's Choice Pearson Achievement Solutions
CMPCMP Glencoe/PH Mathematics Glencoe/PH Mathematics
SOURCE: 2007–2008 Classroom Observation Protocol (Teacher Impact Analysis Sample).
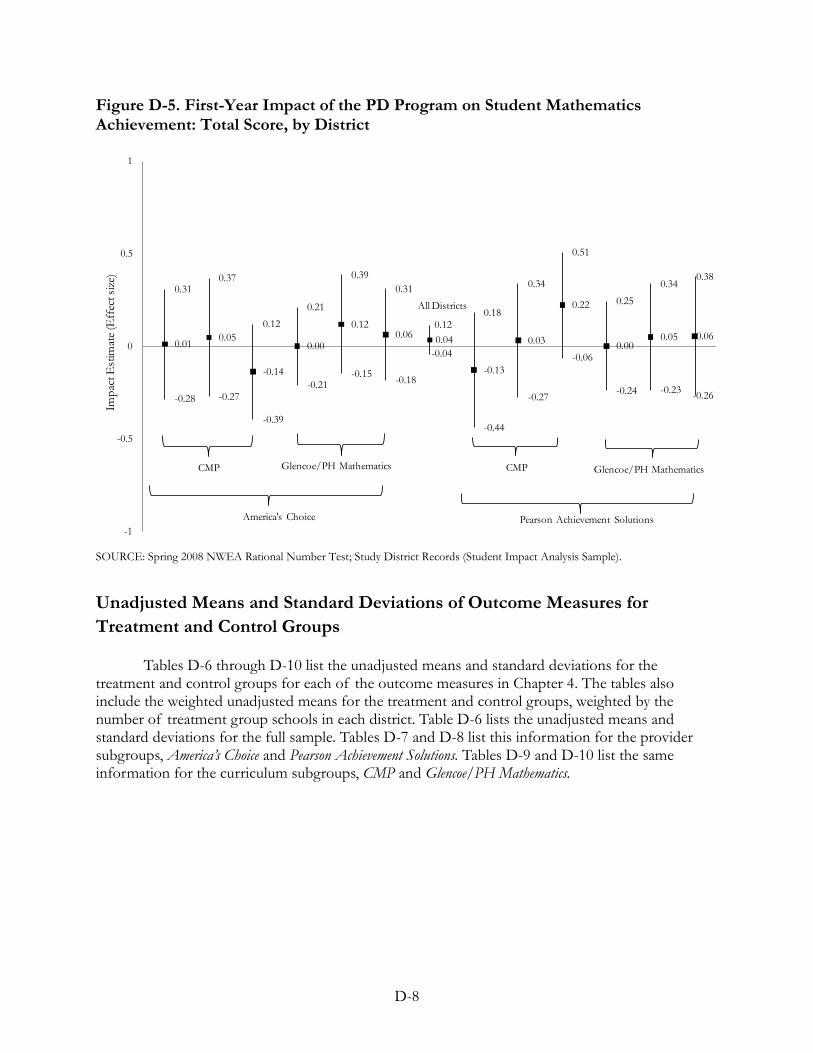
D-8
Figure D-5. First-Year Impact of the PD Program on Student Mathematics Achievement: Total Score, by District
0.310.37
0.12
0.21
0.390.31
0.120.18
0.34
0.51
0.25
0.340.38
-0.28 -0.27
-0.39
-0.21-0.15 -0.18
-0.04
-0.44
-0.27
-0.06
-0.24 -0.23 -0.26
0.01 0.05
-0.14
0.00
0.120.06 0.04
-0.13
0.03
0.22
0.000.05 0.06
-1
-0.5
0
0.5
1
Impa
ct E
stim
ate (
Eff
ect s
ize)
All Districts
America's Choice Pearson Achievement Solutions
CMPCMP Glencoe/PH Mathematics Glencoe/PH Mathematics
SOURCE: Spring 2008 NWEA Rational Number Test; Study District Records (Student Impact Analysis Sample).
Unadjusted Means and Standard Deviations of Outcome Measures for Treatment and Control Groups
Tables D-6 through D-10 list the unadjusted means and standard deviations for the treatment and control groups for each of the outcome measures in Chapter 4. The tables also include the weighted unadjusted means for the treatment and control groups, weighted by the number of treatment group schools in each district. Table D-6 lists the unadjusted means and standard deviations for the full sample. Tables D-7 and D-8 list this information for the provider subgroups, America’s Choice and Pearson Achievement Solutions. Tables D-9 and D-10 list the same information for the curriculum subgroups, CMP and Glencoe/PH Mathematics.
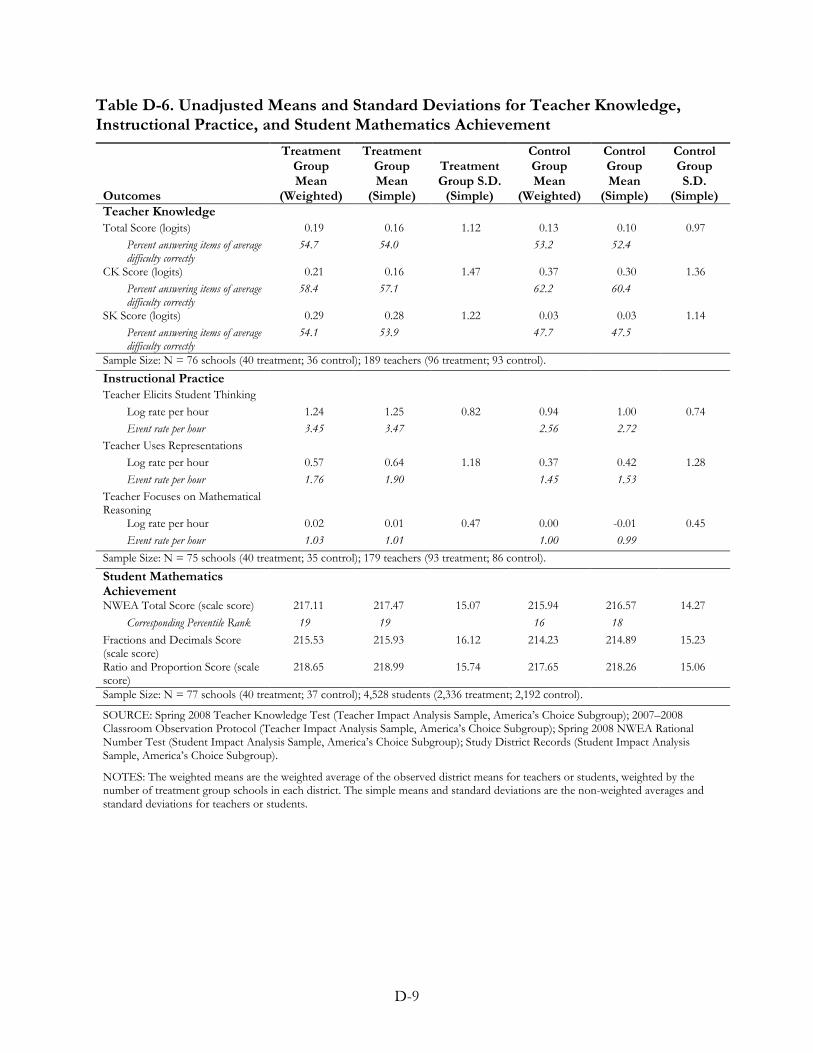
D-9
Table D-6. Unadjusted Means and Standard Deviations for Teacher Knowledge, Instructional Practice, and Student Mathematics Achievement
Outcomes
Treatment Group Mean
(Weighted)
Treatment Group Mean
(Simple)
Treatment Group S.D.
(Simple)
Control Group Mean
(Weighted)
Control Group Mean
(Simple)
Control Group S.D.
(Simple) Teacher Knowledge Total Score (logits) 0.19 0.16 1.12 0.13 0.10 0.97
Percent answering items of average difficulty correctly
54.7 54.0 53.2 52.4
CK Score (logits) 0.21 0.16 1.47 0.37 0.30 1.36 Percent answering items of average difficulty correctly
58.4 57.1 62.2 60.4
SK Score (logits) 0.29 0.28 1.22 0.03 0.03 1.14 Percent answering items of average difficulty correctly
54.1 53.9 47.7 47.5
Sample Size: N = 76 schools (40 treatment; 36 control); 189 teachers (96 treatment; 93 control). Instructional Practice Teacher Elicits Student Thinking
Log rate per hour 1.24 1.25 0.82 0.94 1.00 0.74 Event rate per hour 3.45 3.47 2.56 2.72
Teacher Uses Representations Log rate per hour 0.57 0.64 1.18 0.37 0.42 1.28 Event rate per hour 1.76 1.90 1.45 1.53
Teacher Focuses on Mathematical Reasoning
Log rate per hour 0.02 0.01 0.47 0.00 -0.01 0.45 Event rate per hour 1.03 1.01 1.00 0.99
Sample Size: N = 75 schools (40 treatment; 35 control); 179 teachers (93 treatment; 86 control).
Student Mathematics Achievement
NWEA Total Score (scale score) 217.11 217.47 15.07 215.94 216.57 14.27 Corresponding Percentile Rank 19 19 16 18
Fractions and Decimals Score (scale score)
215.53 215.93 16.12 214.23 214.89 15.23
Ratio and Proportion Score (scale score)
218.65 218.99 15.74 217.65 218.26 15.06
Sample Size: N = 77 schools (40 treatment; 37 control); 4,528 students (2,336 treatment; 2,192 control).
SOURCE: Spring 2008 Teacher Knowledge Test (Teacher Impact Analysis Sample, America’s Choice Subgroup); 2007–2008 Classroom Observation Protocol (Teacher Impact Analysis Sample, America’s Choice Subgroup); Spring 2008 NWEA Rational Number Test (Student Impact Analysis Sample, America’s Choice Subgroup); Study District Records (Student Impact Analysis Sample, America’s Choice Subgroup).
NOTES: The weighted means are the weighted average of the observed district means for teachers or students, weighted by the number of treatment group schools in each district. The simple means and standard deviations are the non-weighted averages and standard deviations for teachers or students.
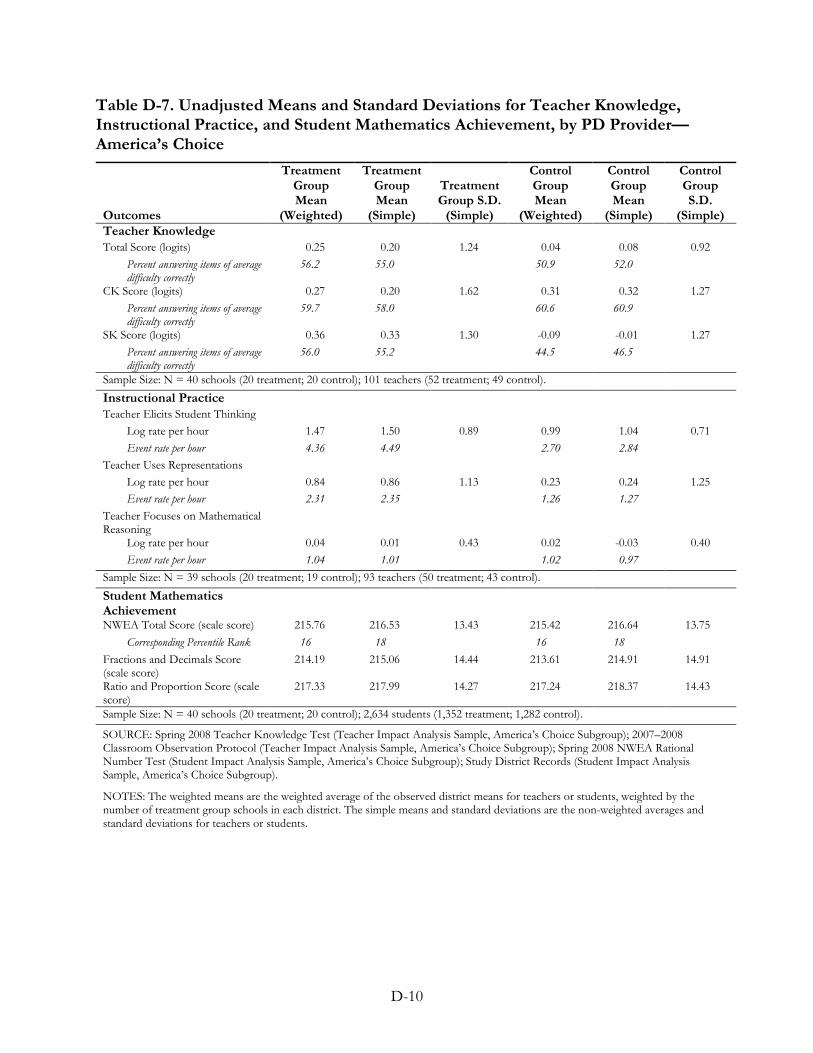
D-10
Table D-7. Unadjusted Means and Standard Deviations for Teacher Knowledge, Instructional Practice, and Student Mathematics Achievement, by PD Provider—America’s Choice
Outcomes
Treatment Group Mean
(Weighted)
Treatment Group Mean
(Simple)
Treatment Group S.D.
(Simple)
Control Group Mean
(Weighted)
Control Group Mean
(Simple)
Control Group S.D.
(Simple) Teacher Knowledge Total Score (logits) 0.25 0.20 1.24 0.04 0.08 0.92
Percent answering items of average difficulty correctly
56.2 55.0 50.9 52.0
CK Score (logits) 0.27 0.20 1.62 0.31 0.32 1.27 Percent answering items of average difficulty correctly
59.7 58.0 60.6 60.9
SK Score (logits) 0.36 0.33 1.30 -0.09 -0.01 1.27 Percent answering items of average difficulty correctly
56.0 55.2 44.5 46.5
Sample Size: N = 40 schools (20 treatment; 20 control); 101 teachers (52 treatment; 49 control). Instructional Practice Teacher Elicits Student Thinking
Log rate per hour 1.47 1.50 0.89 0.99 1.04 0.71 Event rate per hour 4.36 4.49 2.70 2.84
Teacher Uses Representations Log rate per hour 0.84 0.86 1.13 0.23 0.24 1.25 Event rate per hour 2.31 2.35 1.26 1.27
Teacher Focuses on Mathematical Reasoning
Log rate per hour 0.04 0.01 0.43 0.02 -0.03 0.40 Event rate per hour 1.04 1.01 1.02 0.97
Sample Size: N = 39 schools (20 treatment; 19 control); 93 teachers (50 treatment; 43 control).
Student Mathematics Achievement
NWEA Total Score (scale score) 215.76 216.53 13.43 215.42 216.64 13.75 Corresponding Percentile Rank 16 18 16 18
Fractions and Decimals Score (scale score)
214.19 215.06 14.44 213.61 214.91 14.91
Ratio and Proportion Score (scale score)
217.33 217.99 14.27 217.24 218.37 14.43
Sample Size: N = 40 schools (20 treatment; 20 control); 2,634 students (1,352 treatment; 1,282 control).
SOURCE: Spring 2008 Teacher Knowledge Test (Teacher Impact Analysis Sample, America’s Choice Subgroup); 2007–2008 Classroom Observation Protocol (Teacher Impact Analysis Sample, America’s Choice Subgroup); Spring 2008 NWEA Rational Number Test (Student Impact Analysis Sample, America’s Choice Subgroup); Study District Records (Student Impact Analysis Sample, America’s Choice Subgroup).
NOTES: The weighted means are the weighted average of the observed district means for teachers or students, weighted by the number of treatment group schools in each district. The simple means and standard deviations are the non-weighted averages and standard deviations for teachers or students.
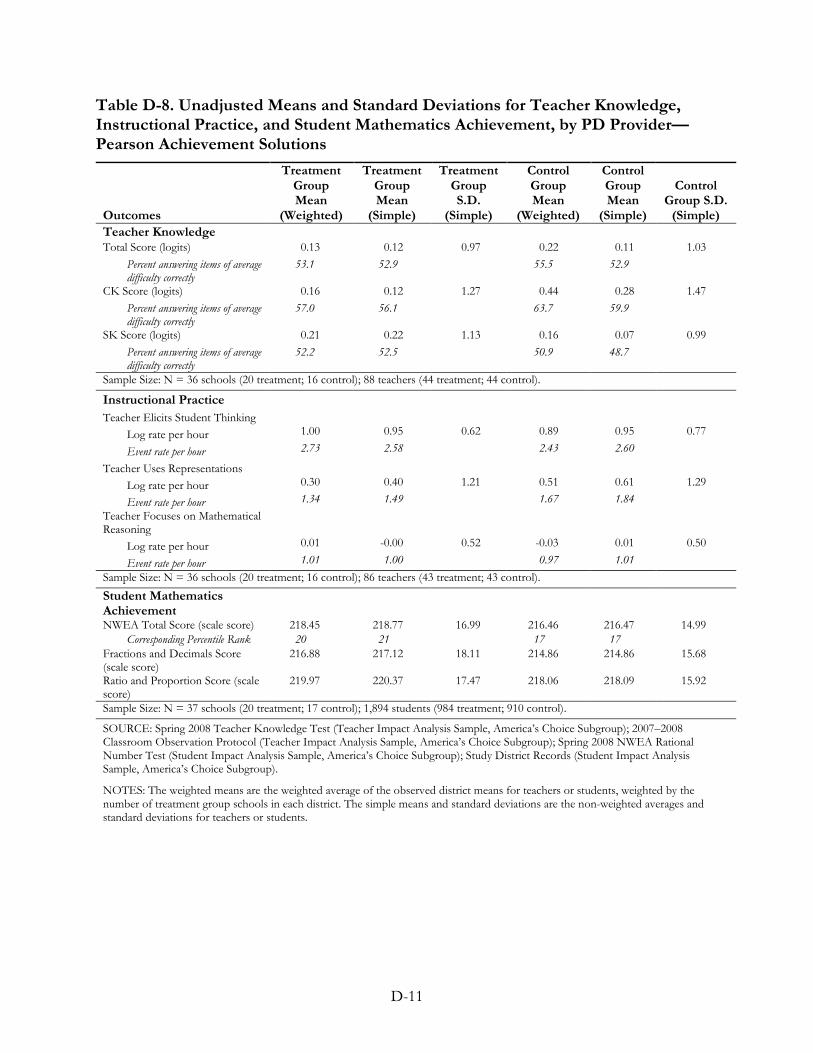
D-11
Table D-8. Unadjusted Means and Standard Deviations for Teacher Knowledge, Instructional Practice, and Student Mathematics Achievement, by PD Provider—Pearson Achievement Solutions
Outcomes
Treatment Group Mean
(Weighted)
Treatment Group Mean
(Simple)
Treatment Group S.D.
(Simple)
Control Group Mean
(Weighted)
Control Group Mean
(Simple)
Control Group S.D.
(Simple) Teacher Knowledge Total Score (logits) 0.13 0.12 0.97 0.22 0.11 1.03
Percent answering items of average difficulty correctly
53.1 52.9 55.5 52.9
CK Score (logits) 0.16 0.12 1.27 0.44 0.28 1.47 Percent answering items of average difficulty correctly
57.0 56.1 63.7 59.9
SK Score (logits) 0.21 0.22 1.13 0.16 0.07 0.99 Percent answering items of average difficulty correctly
52.2 52.5 50.9 48.7
Sample Size: N = 36 schools (20 treatment; 16 control); 88 teachers (44 treatment; 44 control).
Instructional Practice
Teacher Elicits Student Thinking
Log rate per hour 1.00 0.95 0.62 0.89 0.95 0.77
Event rate per hour 2.73 2.58 2.43 2.60
Teacher Uses Representations
Log rate per hour 0.30 0.40 1.21 0.51 0.61 1.29
Event rate per hour 1.34 1.49 1.67 1.84 Teacher Focuses on Mathematical Reasoning
Log rate per hour 0.01 -0.00 0.52 -0.03 0.01 0.50
Event rate per hour 1.01 1.00 0.97 1.01 Sample Size: N = 36 schools (20 treatment; 16 control); 86 teachers (43 treatment; 43 control).
Student Mathematics Achievement
NWEA Total Score (scale score) 218.45 218.77 16.99 216.46 216.47 14.99 Corresponding Percentile Rank 20 21 17 17
Fractions and Decimals Score (scale score)
216.88 217.12 18.11 214.86 214.86 15.68
Ratio and Proportion Score (scale score)
219.97 220.37 17.47 218.06 218.09 15.92
Sample Size: N = 37 schools (20 treatment; 17 control); 1,894 students (984 treatment; 910 control).
SOURCE: Spring 2008 Teacher Knowledge Test (Teacher Impact Analysis Sample, America’s Choice Subgroup); 2007–2008 Classroom Observation Protocol (Teacher Impact Analysis Sample, America’s Choice Subgroup); Spring 2008 NWEA Rational Number Test (Student Impact Analysis Sample, America’s Choice Subgroup); Study District Records (Student Impact Analysis Sample, America’s Choice Subgroup).
NOTES: The weighted means are the weighted average of the observed district means for teachers or students, weighted by the number of treatment group schools in each district. The simple means and standard deviations are the non-weighted averages and standard deviations for teachers or students.
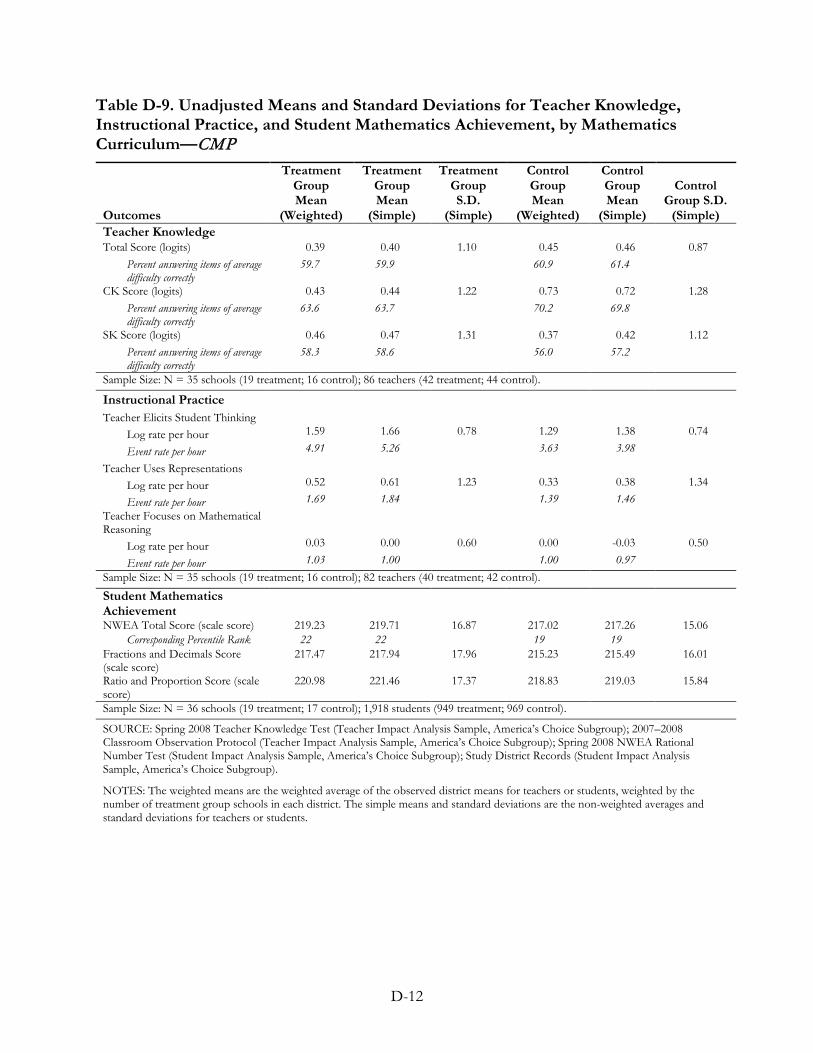
D-12
Table D-9. Unadjusted Means and Standard Deviations for Teacher Knowledge, Instructional Practice, and Student Mathematics Achievement, by Mathematics Curriculum—CMP
Outcomes
Treatment Group Mean
(Weighted)
Treatment Group Mean
(Simple)
Treatment Group S.D.
(Simple)
Control Group Mean
(Weighted)
Control Group Mean
(Simple)
Control Group S.D.
(Simple) Teacher Knowledge Total Score (logits) 0.39 0.40 1.10 0.45 0.46 0.87
Percent answering items of average difficulty correctly
59.7 59.9 60.9 61.4
CK Score (logits) 0.43 0.44 1.22 0.73 0.72 1.28 Percent answering items of average difficulty correctly
63.6 63.7 70.2 69.8
SK Score (logits) 0.46 0.47 1.31 0.37 0.42 1.12 Percent answering items of average difficulty correctly
58.3 58.6 56.0 57.2
Sample Size: N = 35 schools (19 treatment; 16 control); 86 teachers (42 treatment; 44 control).
Instructional Practice
Teacher Elicits Student Thinking
Log rate per hour 1.59 1.66 0.78 1.29 1.38 0.74
Event rate per hour 4.91 5.26 3.63 3.98
Teacher Uses Representations
Log rate per hour 0.52 0.61 1.23 0.33 0.38 1.34
Event rate per hour 1.69 1.84 1.39 1.46 Teacher Focuses on Mathematical Reasoning
Log rate per hour 0.03 0.00 0.60 0.00 -0.03 0.50
Event rate per hour 1.03 1.00 1.00 0.97 Sample Size: N = 35 schools (19 treatment; 16 control); 82 teachers (40 treatment; 42 control).
Student Mathematics Achievement
NWEA Total Score (scale score) 219.23 219.71 16.87 217.02 217.26 15.06 Corresponding Percentile Rank 22 22 19 19
Fractions and Decimals Score (scale score)
217.47 217.94 17.96 215.23 215.49 16.01
Ratio and Proportion Score (scale score)
220.98 221.46 17.37 218.83 219.03 15.84
Sample Size: N = 36 schools (19 treatment; 17 control); 1,918 students (949 treatment; 969 control).
SOURCE: Spring 2008 Teacher Knowledge Test (Teacher Impact Analysis Sample, America’s Choice Subgroup); 2007–2008 Classroom Observation Protocol (Teacher Impact Analysis Sample, America’s Choice Subgroup); Spring 2008 NWEA Rational Number Test (Student Impact Analysis Sample, America’s Choice Subgroup); Study District Records (Student Impact Analysis Sample, America’s Choice Subgroup).
NOTES: The weighted means are the weighted average of the observed district means for teachers or students, weighted by the number of treatment group schools in each district. The simple means and standard deviations are the non-weighted averages and standard deviations for teachers or students.
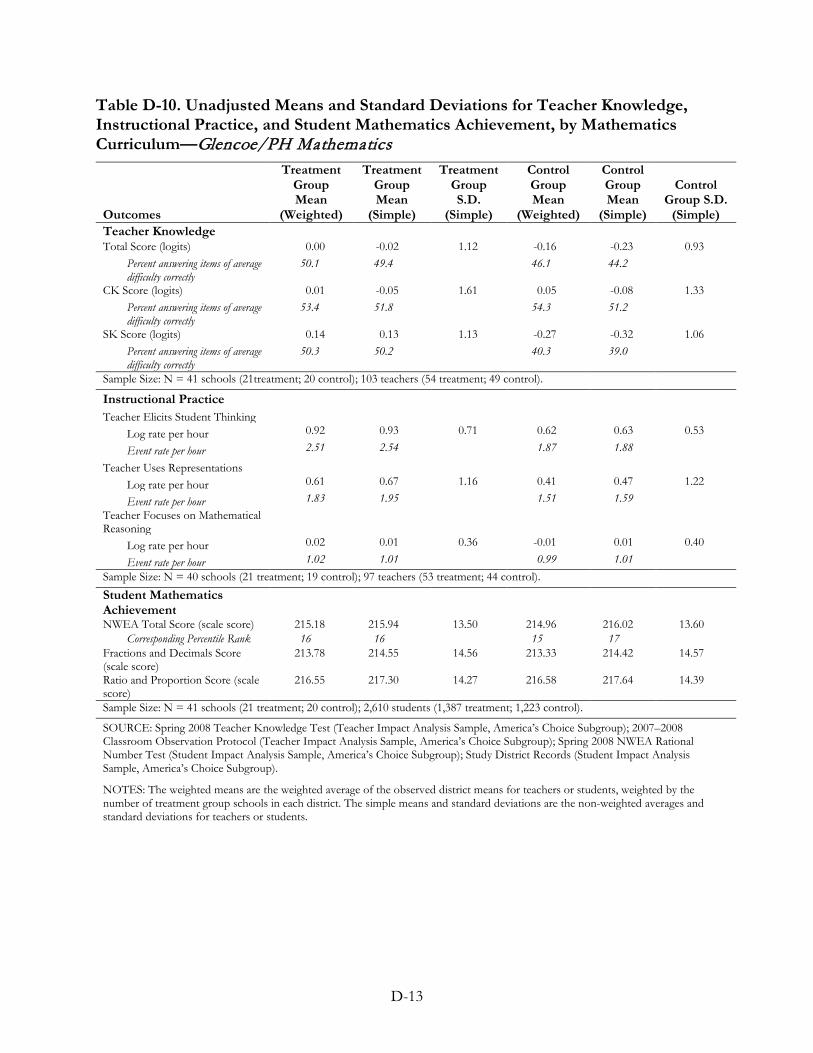
D-13
Table D-10. Unadjusted Means and Standard Deviations for Teacher Knowledge, Instructional Practice, and Student Mathematics Achievement, by Mathematics Curriculum—Glencoe/PH Mathematics
Outcomes
Treatment Group Mean
(Weighted)
Treatment Group Mean
(Simple)
Treatment Group S.D.
(Simple)
Control Group Mean
(Weighted)
Control Group Mean
(Simple)
Control Group S.D.
(Simple) Teacher Knowledge Total Score (logits) 0.00 -0.02 1.12 -0.16 -0.23 0.93
Percent answering items of average difficulty correctly
50.1 49.4 46.1 44.2
CK Score (logits) 0.01 -0.05 1.61 0.05 -0.08 1.33 Percent answering items of average difficulty correctly
53.4 51.8 54.3 51.2
SK Score (logits) 0.14 0.13 1.13 -0.27 -0.32 1.06 Percent answering items of average difficulty correctly
50.3 50.2 40.3 39.0
Sample Size: N = 41 schools (21treatment; 20 control); 103 teachers (54 treatment; 49 control).
Instructional Practice
Teacher Elicits Student Thinking
Log rate per hour 0.92 0.93 0.71 0.62 0.63 0.53
Event rate per hour 2.51 2.54 1.87 1.88
Teacher Uses Representations
Log rate per hour 0.61 0.67 1.16 0.41 0.47 1.22
Event rate per hour 1.83 1.95 1.51 1.59 Teacher Focuses on Mathematical Reasoning
Log rate per hour 0.02 0.01 0.36 -0.01 0.01 0.40
Event rate per hour 1.02 1.01 0.99 1.01 Sample Size: N = 40 schools (21 treatment; 19 control); 97 teachers (53 treatment; 44 control). Student Mathematics Achievement
NWEA Total Score (scale score) 215.18 215.94 13.50 214.96 216.02 13.60 Corresponding Percentile Rank 16 16 15 17
Fractions and Decimals Score (scale score)
213.78 214.55 14.56 213.33 214.42 14.57
Ratio and Proportion Score (scale score)
216.55 217.30 14.27 216.58 217.64 14.39
Sample Size: N = 41 schools (21 treatment; 20 control); 2,610 students (1,387 treatment; 1,223 control).
SOURCE: Spring 2008 Teacher Knowledge Test (Teacher Impact Analysis Sample, America’s Choice Subgroup); 2007–2008 Classroom Observation Protocol (Teacher Impact Analysis Sample, America’s Choice Subgroup); Spring 2008 NWEA Rational Number Test (Student Impact Analysis Sample, America’s Choice Subgroup); Study District Records (Student Impact Analysis Sample, America’s Choice Subgroup).
NOTES: The weighted means are the weighted average of the observed district means for teachers or students, weighted by the number of treatment group schools in each district. The simple means and standard deviations are the non-weighted averages and standard deviations for teachers or students.

APPENDIX E EXPLORATORY ANALYSES: APPROACHES AND
ADDITIONAL RESULTS

E-1
APPENDIX E. EXPLORATORY ANALYSES: APPROACHES AND
ADDITIONAL RESULTS
This appendix provides descriptions of the analytic approaches used in Chapter 5. It also provides supplementary results from these exploratory analyses.
Minimum Detectable Effect Sizes (MDES) for Interaction Tests
The study was designed to answer the primary research questions about the impact of the PD program on the full sample of schools, teachers, and students. Chapter 2 reports the minimum detectable effect size (MDES) for the main impact analysis. This section provides minimum detectable effect sizes (MDES) to supplement those reported in Chapter 2. Table E-1 presents the MDES for the tests for the interactions between baseline teacher knowledge and the treatment effects and between baseline student achievement and the treatment effects.
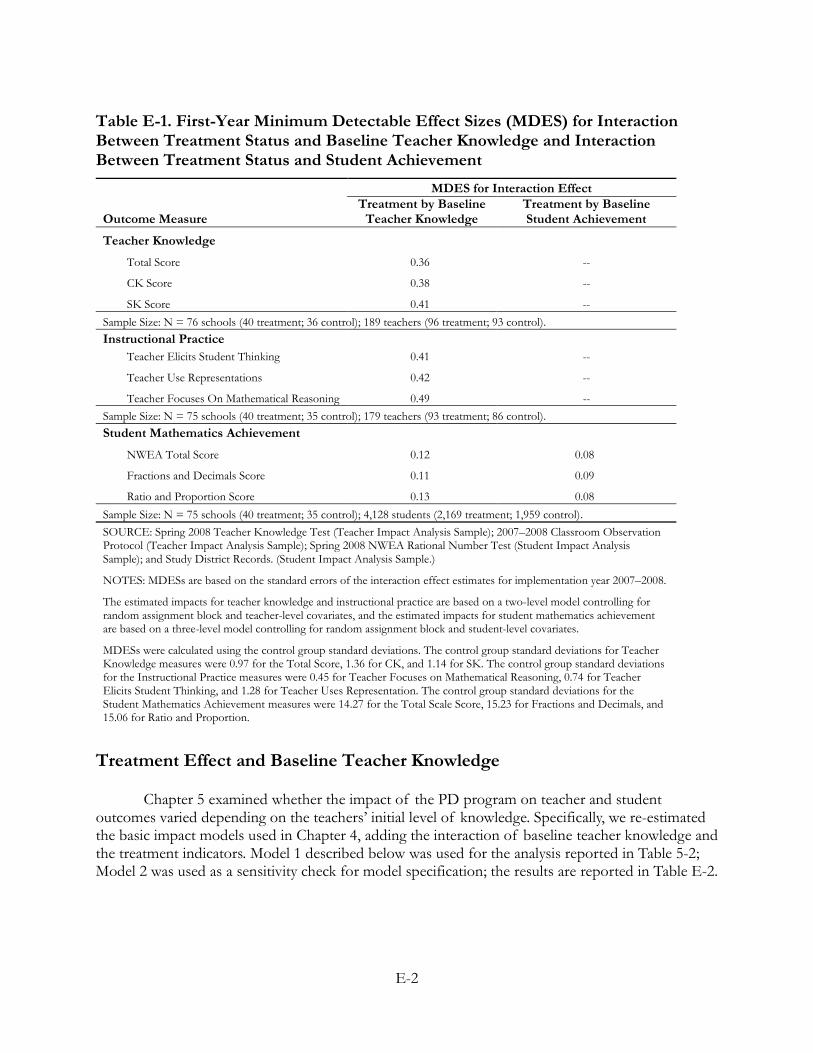
E-2
Table E-1. First-Year Minimum Detectable Effect Sizes (MDES) for Interaction Between Treatment Status and Baseline Teacher Knowledge and Interaction Between Treatment Status and Student Achievement
Outcome Measure
MDES for Interaction Effect Treatment by Baseline
Teacher Knowledge Treatment by Baseline Student Achievement
Teacher Knowledge
Total Score 0.36 --
CK Score 0.38 --
SK Score 0.41 -- Sample Size: N = 76 schools (40 treatment; 36 control); 189 teachers (96 treatment; 93 control). Instructional Practice
Teacher Elicits Student Thinking 0.41 --
Teacher Use Representations 0.42 --
Teacher Focuses On Mathematical Reasoning 0.49 -- Sample Size: N = 75 schools (40 treatment; 35 control); 179 teachers (93 treatment; 86 control). Student Mathematics Achievement
NWEA Total Score 0.12 0.08
Fractions and Decimals Score 0.11 0.09
Ratio and Proportion Score 0.13 0.08 Sample Size: N = 75 schools (40 treatment; 35 control); 4,128 students (2,169 treatment; 1,959 control). SOURCE: Spring 2008 Teacher Knowledge Test (Teacher Impact Analysis Sample); 2007–2008 Classroom Observation Protocol (Teacher Impact Analysis Sample); Spring 2008 NWEA Rational Number Test (Student Impact Analysis Sample); and Study District Records. (Student Impact Analysis Sample.)
NOTES: MDESs are based on the standard errors of the interaction effect estimates for implementation year 2007–2008.
The estimated impacts for teacher knowledge and instructional practice are based on a two-level model controlling for random assignment block and teacher-level covariates, and the estimated impacts for student mathematics achievement are based on a three-level model controlling for random assignment block and student-level covariates.
MDESs were calculated using the control group standard deviations. The control group standard deviations for Teacher Knowledge measures were 0.97 for the Total Score, 1.36 for CK, and 1.14 for SK. The control group standard deviations for the Instructional Practice measures were 0.45 for Teacher Focuses on Mathematical Reasoning, 0.74 for Teacher Elicits Student Thinking, and 1.28 for Teacher Uses Representation. The control group standard deviations for the Student Mathematics Achievement measures were 14.27 for the Total Scale Score, 15.23 for Fractions and Decimals, and 15.06 for Ratio and Proportion.
Treatment Effect and Baseline Teacher Knowledge
Chapter 5 examined whether the impact of the PD program on teacher and student outcomes varied depending on the teachers’ initial level of knowledge. Specifically, we re-estimated the basic impact models used in Chapter 4, adding the interaction of baseline teacher knowledge and the treatment indicators. Model 1 described below was used for the analysis reported in Table 5-2; Model 2 was used as a sensitivity check for model specification; the results are reported in Table E-2.
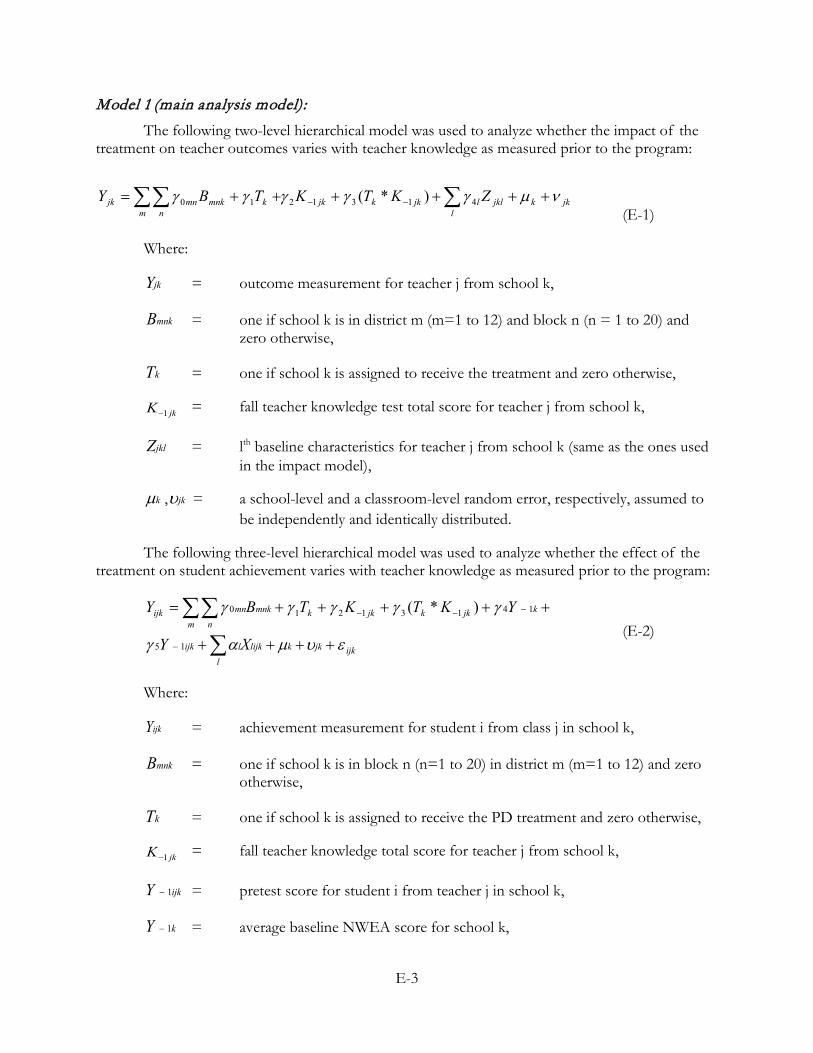
E-3
Model 1 (main analysis model): The following two-level hierarchical model was used to analyze whether the impact of the
treatment on teacher outcomes varies with teacher knowledge as measured prior to the program:
jkkl
jklljkkjkm
kn
mnkmnjk ZKTKTBY νµγγγγγ ++++++= ∑∑∑ −− 4131210 )*( (E-1)
Where:
jkY = outcome measurement for teacher j from school k,
mnkB = one if school k is in district m (m=1 to 12) and block n (n = 1 to 20) and zero otherwise,
kT = one if school k is assigned to receive the treatment and zero otherwise,
jkK 1− = fall teacher knowledge test total score for teacher j from school k,
jklZ = lth baseline characteristics for teacher j from school k (same as the ones used in the impact model),
kµ , jkυ = a school-level and a classroom-level random error, respectively, assumed to be independently and identically distributed.
The following three-level hierarchical model was used to analyze whether the effect of the treatment on student achievement varies with teacher knowledge as measured prior to the program:
ijkjkkl
lijklijk
kjkkjkkm n
mnkmnijk
XY
YKTKTBY
ευµαγ
γγγγγ
++++
+++++=
∑
∑∑−
−−−
15
14131210 )*( (E-2)
Where:
ijkY = achievement measurement for student i from class j in school k,
mnkB = one if school k is in block n (n=1 to 20) in district m (m=1 to 12) and zero otherwise,
kT = one if school k is assigned to receive the PD treatment and zero otherwise,
jkK 1− = fall teacher knowledge total score for teacher j from school k,
ijkY 1− = pretest score for student i from teacher j in school k,
kY 1− = average baseline NWEA score for school k,
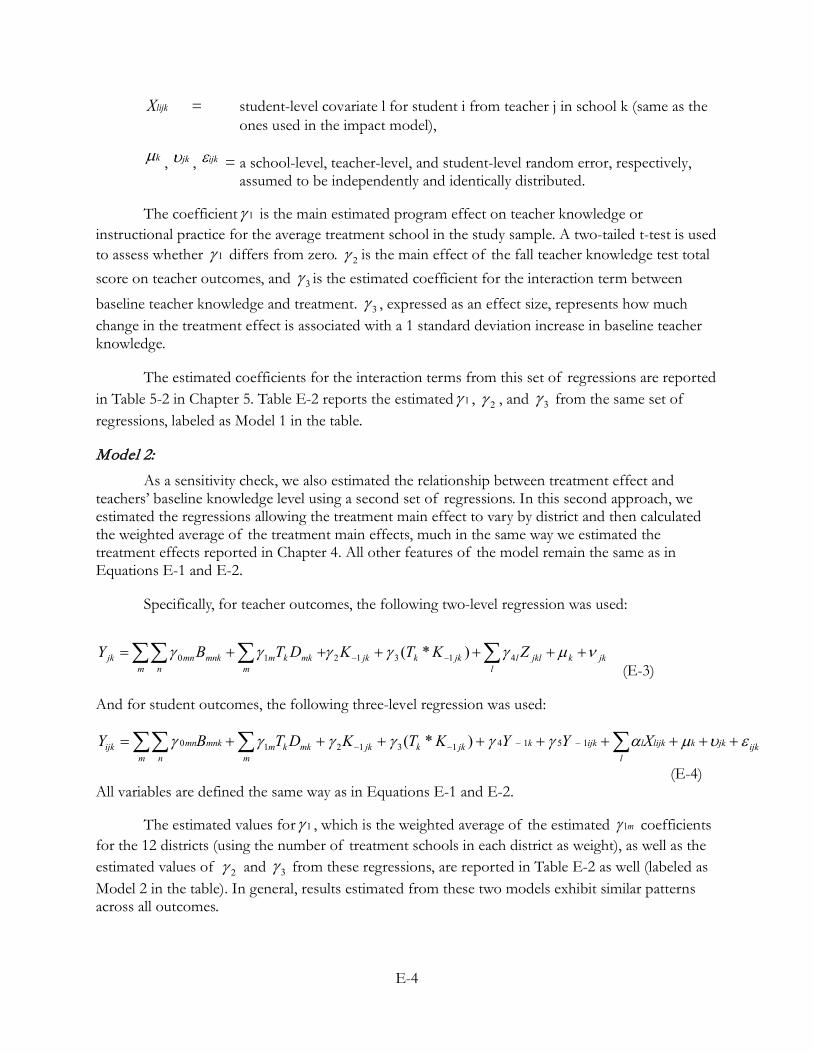
E-4
lijkX = student-level covariate l for student i from teacher j in school k (same as the ones used in the impact model),
kµ , jkυ , ijkε = a school-level, teacher-level, and student-level random error, respectively, assumed to be independently and identically distributed.
The coefficient 1γ is the main estimated program effect on teacher knowledge or instructional practice for the average treatment school in the study sample. A two-tailed t-test is used to assess whether 1γ differs from zero. 2γ is the main effect of the fall teacher knowledge test total score on teacher outcomes, and 3γ is the estimated coefficient for the interaction term between
baseline teacher knowledge and treatment. 3γ , expressed as an effect size, represents how much change in the treatment effect is associated with a 1 standard deviation increase in baseline teacher knowledge.
The estimated coefficients for the interaction terms from this set of regressions are reported in Table 5-2 in Chapter 5. Table E-2 reports the estimated 1γ , 2γ , and 3γ from the same set of regressions, labeled as Model 1 in the table.
Model 2: As a sensitivity check, we also estimated the relationship between treatment effect and
teachers’ baseline knowledge level using a second set of regressions. In this second approach, we estimated the regressions allowing the treatment main effect to vary by district and then calculated the weighted average of the treatment main effects, much in the same way we estimated the treatment effects reported in Chapter 4. All other features of the model remain the same as in Equations E-1 and E-2.
Specifically, for teacher outcomes, the following two-level regression was used:
jkkl
jklljkkjkm m
mkkmn
mnkmnjk ZKTKDTBY νµγγγγγ ++++++= ∑∑ ∑∑ −− 4131210 )*( (E-3)
And for student outcomes, the following three-level regression was used:
ijkjkkl
lijklijkkjkkjkm
mkkmm n
mnkmnijk XYYKTKDTBY ευµαγγγγγγ +++++++++= ∑∑∑∑ −−−− 1514131210 )*(
(E-4) All variables are defined the same way as in Equations E-1 and E-2.
The estimated values for 1γ , which is the weighted average of the estimated m1γ coefficients for the 12 districts (using the number of treatment schools in each district as weight), as well as the estimated values of 2γ and 3γ from these regressions, are reported in Table E-2 as well (labeled as Model 2 in the table). In general, results estimated from these two models exhibit similar patterns across all outcomes.
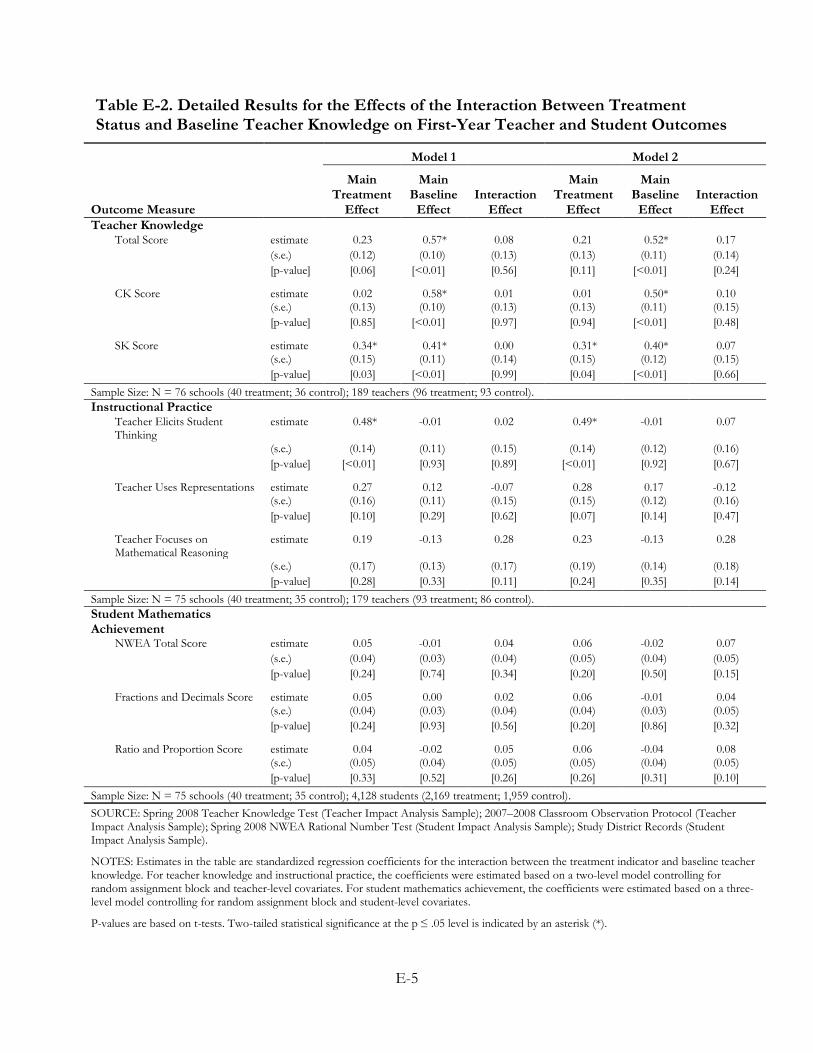
E-5
Table E-2. Detailed Results for the Effects of the Interaction Between Treatment Status and Baseline Teacher Knowledge on First-Year Teacher and Student Outcomes
Outcome Measure
Model 1 Model 2
Main Treatment
Effect
Main Baseline
Effect Interaction
Effect
Main Treatment
Effect
Main Baseline
Effect Interaction
Effect Teacher Knowledge
Total Score estimate 0.23 0.57* 0.08 0.21 0.52* 0.17 (s.e.) (0.12) (0.10) (0.13) (0.13) (0.11) (0.14) [p-value] [0.06] [<0.01] [0.56] [0.11] [<0.01] [0.24]
CK Score estimate 0.02 0.58* 0.01 0.01 0.50* 0.10 (s.e.) (0.13) (0.10) (0.13) (0.13) (0.11) (0.15) [p-value] [0.85] [<0.01] [0.97] [0.94] [<0.01] [0.48]
SK Score estimate 0.34* 0.41* 0.00 0.31* 0.40* 0.07 (s.e.) (0.15) (0.11) (0.14) (0.15) (0.12) (0.15) [p-value] [0.03] [<0.01] [0.99] [0.04] [<0.01] [0.66] Sample Size: N = 76 schools (40 treatment; 36 control); 189 teachers (96 treatment; 93 control). Instructional Practice
Teacher Elicits Student Thinking
estimate 0.48* -0.01 0.02 0.49* -0.01 0.07
(s.e.) (0.14) (0.11) (0.15) (0.14) (0.12) (0.16) [p-value] [<0.01] [0.93] [0.89] [<0.01] [0.92] [0.67]
Teacher Uses Representations estimate 0.27 0.12 -0.07 0.28 0.17 -0.12 (s.e.) (0.16) (0.11) (0.15) (0.15) (0.12) (0.16) [p-value] [0.10] [0.29] [0.62] [0.07] [0.14] [0.47]
Teacher Focuses on Mathematical Reasoning
estimate 0.19 -0.13 0.28 0.23 -0.13 0.28
(s.e.) (0.17) (0.13) (0.17) (0.19) (0.14) (0.18) [p-value] [0.28] [0.33] [0.11] [0.24] [0.35] [0.14] Sample Size: N = 75 schools (40 treatment; 35 control); 179 teachers (93 treatment; 86 control). Student Mathematics Achievement
NWEA Total Score estimate 0.05 -0.01 0.04 0.06 -0.02 0.07 (s.e.) (0.04) (0.03) (0.04) (0.05) (0.04) (0.05) [p-value] [0.24] [0.74] [0.34] [0.20] [0.50] [0.15]
Fractions and Decimals Score estimate 0.05 0.00 0.02 0.06 -0.01 0.04 (s.e.) (0.04) (0.03) (0.04) (0.04) (0.03) (0.05) [p-value] [0.24] [0.93] [0.56] [0.20] [0.86] [0.32]
Ratio and Proportion Score estimate 0.04 -0.02 0.05 0.06 -0.04 0.08 (s.e.) (0.05) (0.04) (0.05) (0.05) (0.04) (0.05) [p-value] [0.33] [0.52] [0.26] [0.26] [0.31] [0.10] Sample Size: N = 75 schools (40 treatment; 35 control); 4,128 students (2,169 treatment; 1,959 control). SOURCE: Spring 2008 Teacher Knowledge Test (Teacher Impact Analysis Sample); 2007–2008 Classroom Observation Protocol (Teacher Impact Analysis Sample); Spring 2008 NWEA Rational Number Test (Student Impact Analysis Sample); Study District Records (Student Impact Analysis Sample).
NOTES: Estimates in the table are standardized regression coefficients for the interaction between the treatment indicator and baseline teacher knowledge. For teacher knowledge and instructional practice, the coefficients were estimated based on a two-level model controlling for random assignment block and teacher-level covariates. For student mathematics achievement, the coefficients were estimated based on a three-level model controlling for random assignment block and student-level covariates.
P-values are based on t-tests. Two-tailed statistical significance at the p ≤ .05 level is indicated by an asterisk (*).

E-6
Results reported in Table E-2 assume a linear relationship between teacher baseline knowledge level and program impact. The linear specification has the advantage of being the most parsimonious and interpretable form. To see if the relationship between a teacher’s initial knowledge level and the program impact is sensitive to this model specification, we added a quadratic term for teacher baseline knowledge ( 2
1 jkK− ) and its interaction with treatment ( 21* jkKT − ) in Equations E-1 to E-4
and re-estimated models 1 and 2. Results from the augmented model 1 are presented in Table E-3, and those from the augmented model 2 are presented in Table E-4. Overall, most of the interaction terms involving the treatment indicator and the teacher baseline knowledge score or the squared teacher baseline knowledge score were not statistically significant for any of the teacher or student outcome measures. The only exceptions are for total teacher knowledge scores and SK scores. For these two outcomes, the coefficient estimates for the quadratic interaction term are statistically significant at the 0.05 level.
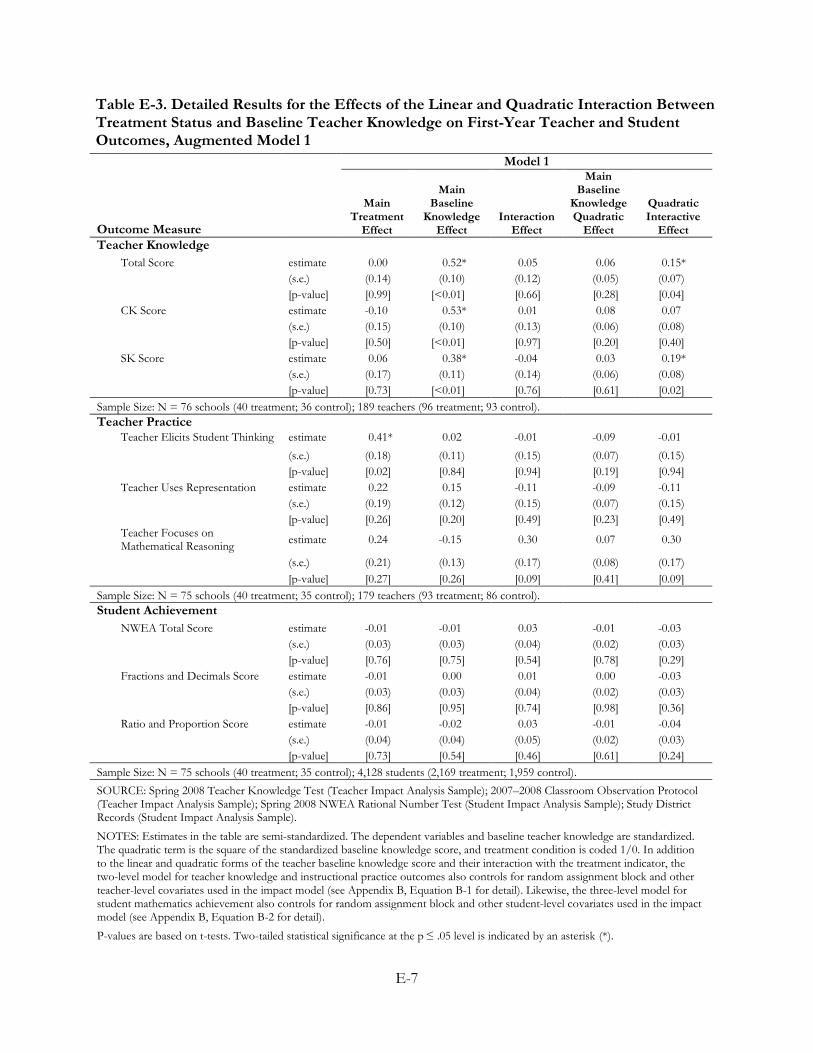
E-7
Table E-3. Detailed Results for the Effects of the Linear and Quadratic Interaction Between Treatment Status and Baseline Teacher Knowledge on First-Year Teacher and Student Outcomes, Augmented Model 1
Outcome Measure
Model 1
Main Treatment
Effect
Main Baseline
Knowledge Effect
Interaction Effect
Main Baseline
Knowledge Quadratic
Effect
Quadratic Interactive
Effect Teacher Knowledge
Total Score estimate 0.00 0.52* 0.05 0.06 0.15*
(s.e.) (0.14) (0.10) (0.12) (0.05) (0.07)
[p-value] [0.99] [<0.01] [0.66] [0.28] [0.04]
CK Score estimate -0.10 0.53* 0.01 0.08 0.07
(s.e.) (0.15) (0.10) (0.13) (0.06) (0.08)
[p-value] [0.50] [<0.01] [0.97] [0.20] [0.40]
SK Score estimate 0.06 0.38* -0.04 0.03 0.19*
(s.e.) (0.17) (0.11) (0.14) (0.06) (0.08)
[p-value] [0.73] [<0.01] [0.76] [0.61] [0.02]
Sample Size: N = 76 schools (40 treatment; 36 control); 189 teachers (96 treatment; 93 control). Teacher Practice
Teacher Elicits Student Thinking estimate 0.41* 0.02 -0.01 -0.09 -0.01
(s.e.) (0.18) (0.11) (0.15) (0.07) (0.15)
[p-value] [0.02] [0.84] [0.94] [0.19] [0.94]
Teacher Uses Representation estimate 0.22 0.15 -0.11 -0.09 -0.11
(s.e.) (0.19) (0.12) (0.15) (0.07) (0.15)
[p-value] [0.26] [0.20] [0.49] [0.23] [0.49]
Teacher Focuses on Mathematical Reasoning estimate 0.24 -0.15 0.30 0.07 0.30
(s.e.) (0.21) (0.13) (0.17) (0.08) (0.17)
[p-value] [0.27] [0.26] [0.09] [0.41] [0.09]
Sample Size: N = 75 schools (40 treatment; 35 control); 179 teachers (93 treatment; 86 control). Student Achievement
NWEA Total Score estimate -0.01 -0.01 0.03 -0.01 -0.03
(s.e.) (0.03) (0.03) (0.04) (0.02) (0.03)
[p-value] [0.76] [0.75] [0.54] [0.78] [0.29]
Fractions and Decimals Score estimate -0.01 0.00 0.01 0.00 -0.03
(s.e.) (0.03) (0.03) (0.04) (0.02) (0.03)
[p-value] [0.86] [0.95] [0.74] [0.98] [0.36]
Ratio and Proportion Score estimate -0.01 -0.02 0.03 -0.01 -0.04
(s.e.) (0.04) (0.04) (0.05) (0.02) (0.03)
[p-value] [0.73] [0.54] [0.46] [0.61] [0.24]
Sample Size: N = 75 schools (40 treatment; 35 control); 4,128 students (2,169 treatment; 1,959 control). SOURCE: Spring 2008 Teacher Knowledge Test (Teacher Impact Analysis Sample); 2007–2008 Classroom Observation Protocol (Teacher Impact Analysis Sample); Spring 2008 NWEA Rational Number Test (Student Impact Analysis Sample); Study District Records (Student Impact Analysis Sample).
NOTES: Estimates in the table are semi-standardized. The dependent variables and baseline teacher knowledge are standardized. The quadratic term is the square of the standardized baseline knowledge score, and treatment condition is coded 1/0. In addition to the linear and quadratic forms of the teacher baseline knowledge score and their interaction with the treatment indicator, the two-level model for teacher knowledge and instructional practice outcomes also controls for random assignment block and other teacher-level covariates used in the impact model (see Appendix B, Equation B-1 for detail). Likewise, the three-level model for student mathematics achievement also controls for random assignment block and other student-level covariates used in the impact model (see Appendix B, Equation B-2 for detail).
P-values are based on t-tests. Two-tailed statistical significance at the p ≤ .05 level is indicated by an asterisk (*).
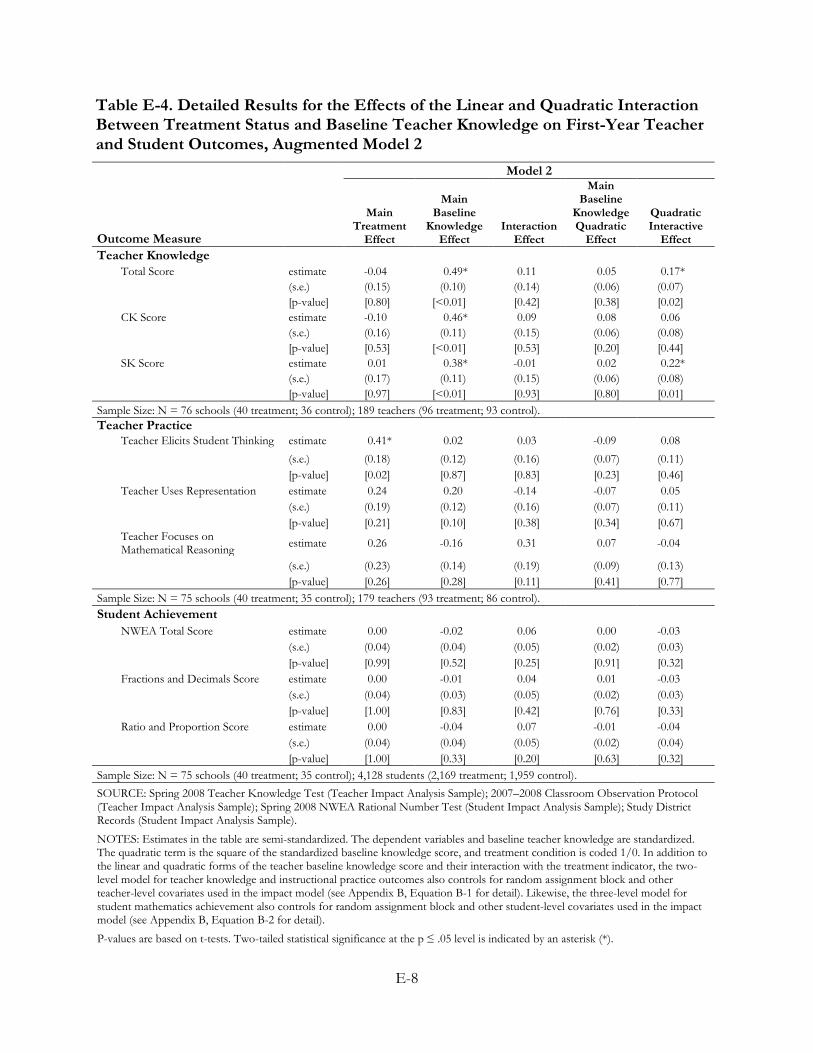
E-8
Table E-4. Detailed Results for the Effects of the Linear and Quadratic Interaction Between Treatment Status and Baseline Teacher Knowledge on First-Year Teacher and Student Outcomes, Augmented Model 2
Outcome Measure
Model 2
Main Treatment
Effect
Main Baseline
Knowledge Effect
Interaction Effect
Main Baseline
Knowledge Quadratic
Effect
Quadratic Interactive
Effect Teacher Knowledge
Total Score estimate -0.04 0.49* 0.11 0.05 0.17*
(s.e.) (0.15) (0.10) (0.14) (0.06) (0.07)
[p-value] [0.80] [<0.01] [0.42] [0.38] [0.02]
CK Score estimate -0.10 0.46* 0.09 0.08 0.06
(s.e.) (0.16) (0.11) (0.15) (0.06) (0.08)
[p-value] [0.53] [<0.01] [0.53] [0.20] [0.44]
SK Score estimate 0.01 0.38* -0.01 0.02 0.22*
(s.e.) (0.17) (0.11) (0.15) (0.06) (0.08)
[p-value] [0.97] [<0.01] [0.93] [0.80] [0.01]
Sample Size: N = 76 schools (40 treatment; 36 control); 189 teachers (96 treatment; 93 control). Teacher Practice
Teacher Elicits Student Thinking estimate 0.41* 0.02 0.03 -0.09 0.08
(s.e.) (0.18) (0.12) (0.16) (0.07) (0.11)
[p-value] [0.02] [0.87] [0.83] [0.23] [0.46]
Teacher Uses Representation estimate 0.24 0.20 -0.14 -0.07 0.05
(s.e.) (0.19) (0.12) (0.16) (0.07) (0.11)
[p-value] [0.21] [0.10] [0.38] [0.34] [0.67]
Teacher Focuses on Mathematical Reasoning estimate 0.26 -0.16 0.31 0.07 -0.04
(s.e.) (0.23) (0.14) (0.19) (0.09) (0.13)
[p-value] [0.26] [0.28] [0.11] [0.41] [0.77]
Sample Size: N = 75 schools (40 treatment; 35 control); 179 teachers (93 treatment; 86 control). Student Achievement
NWEA Total Score estimate 0.00 -0.02 0.06 0.00 -0.03
(s.e.) (0.04) (0.04) (0.05) (0.02) (0.03)
[p-value] [0.99] [0.52] [0.25] [0.91] [0.32]
Fractions and Decimals Score estimate 0.00 -0.01 0.04 0.01 -0.03
(s.e.) (0.04) (0.03) (0.05) (0.02) (0.03)
[p-value] [1.00] [0.83] [0.42] [0.76] [0.33]
Ratio and Proportion Score estimate 0.00 -0.04 0.07 -0.01 -0.04
(s.e.) (0.04) (0.04) (0.05) (0.02) (0.04)
[p-value] [1.00] [0.33] [0.20] [0.63] [0.32]
Sample Size: N = 75 schools (40 treatment; 35 control); 4,128 students (2,169 treatment; 1,959 control).
SOURCE: Spring 2008 Teacher Knowledge Test (Teacher Impact Analysis Sample); 2007–2008 Classroom Observation Protocol (Teacher Impact Analysis Sample); Spring 2008 NWEA Rational Number Test (Student Impact Analysis Sample); Study District Records (Student Impact Analysis Sample).
NOTES: Estimates in the table are semi-standardized. The dependent variables and baseline teacher knowledge are standardized. The quadratic term is the square of the standardized baseline knowledge score, and treatment condition is coded 1/0. In addition to the linear and quadratic forms of the teacher baseline knowledge score and their interaction with the treatment indicator, the two-level model for teacher knowledge and instructional practice outcomes also controls for random assignment block and other teacher-level covariates used in the impact model (see Appendix B, Equation B-1 for detail). Likewise, the three-level model for student mathematics achievement also controls for random assignment block and other student-level covariates used in the impact model (see Appendix B, Equation B-2 for detail).
P-values are based on t-tests. Two-tailed statistical significance at the p ≤ .05 level is indicated by an asterisk (*).
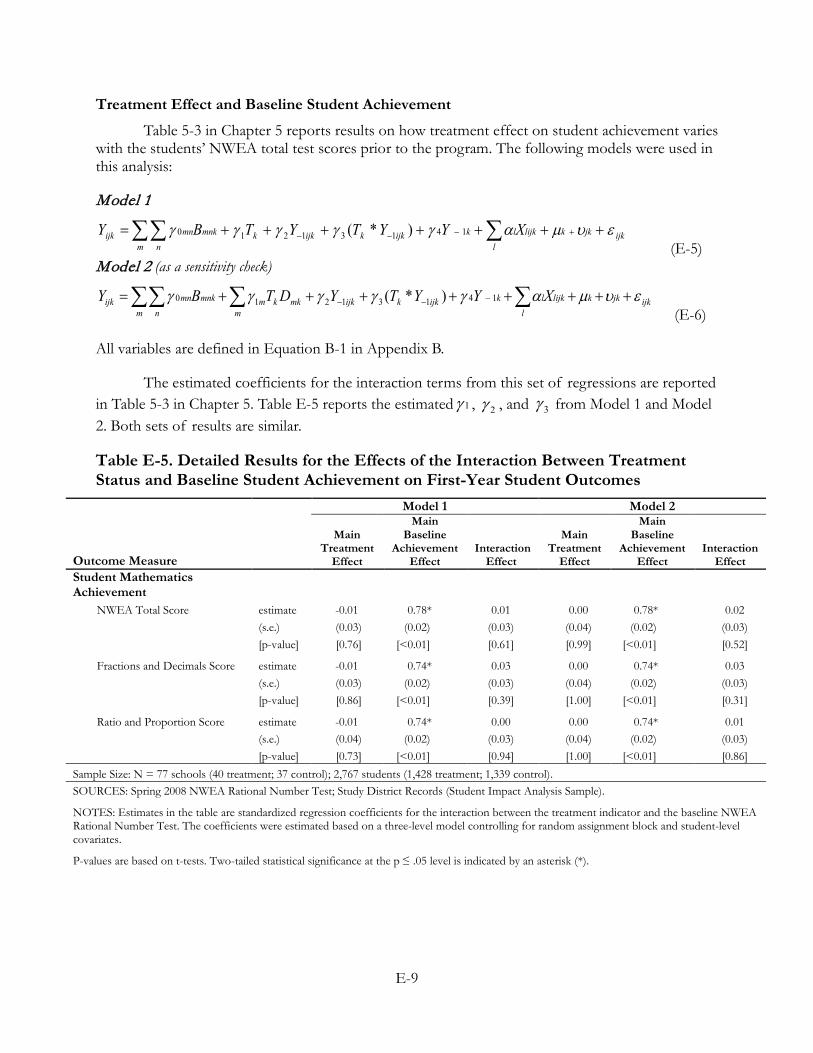
E-9
Treatment Effect and Baseline Student Achievement
Table 5-3 in Chapter 5 reports results on how treatment effect on student achievement varies with the students’ NWEA total test scores prior to the program. The following models were used in this analysis:
Model 1
ijkjkkl
lijklkijkkijkkm n
mnkmnijk XYYTYTBY ευµαγγγγγ +++++++= +−−− ∑∑∑ 14131210 )*( (E-5)
Model 2 (as a sensitivity check)
ijkjkkl
lijklkijkkijkm
mkkmm n
mnkmnijk XYYTYDTBY ευµαγγγγγ ++++++++= ∑∑∑∑ −−− 14131210 )*( (E-6)
All variables are defined in Equation B-1 in Appendix B.
The estimated coefficients for the interaction terms from this set of regressions are reported in Table 5-3 in Chapter 5. Table E-5 reports the estimated 1γ , 2γ , and 3γ from Model 1 and Model 2. Both sets of results are similar.
Table E-5. Detailed Results for the Effects of the Interaction Between Treatment Status and Baseline Student Achievement on First-Year Student Outcomes
Outcome Measure
Model 1 Model 2
Main Treatment
Effect
Main Baseline
Achievement Effect
Interaction Effect
Main Treatment
Effect
Main Baseline
Achievement Effect
Interaction Effect
Student Mathematics Achievement
NWEA Total Score estimate -0.01 0.78* 0.01 0.00 0.78* 0.02 (s.e.) (0.03) (0.02) (0.03) (0.04) (0.02) (0.03) [p-value] [0.76] [<0.01] [0.61] [0.99] [<0.01] [0.52]
Fractions and Decimals Score estimate -0.01 0.74* 0.03 0.00 0.74* 0.03 (s.e.) (0.03) (0.02) (0.03) (0.04) (0.02) (0.03) [p-value] [0.86] [<0.01] [0.39] [1.00] [<0.01] [0.31]
Ratio and Proportion Score estimate -0.01 0.74* 0.00 0.00 0.74* 0.01 (s.e.) (0.04) (0.02) (0.03) (0.04) (0.02) (0.03) [p-value] [0.73] [<0.01] [0.94] [1.00] [<0.01] [0.86] Sample Size: N = 77 schools (40 treatment; 37 control); 2,767 students (1,428 treatment; 1,339 control). SOURCES: Spring 2008 NWEA Rational Number Test; Study District Records (Student Impact Analysis Sample).
NOTES: Estimates in the table are standardized regression coefficients for the interaction between the treatment indicator and the baseline NWEA Rational Number Test. The coefficients were estimated based on a three-level model controlling for random assignment block and student-level covariates.
P-values are based on t-tests. Two-tailed statistical significance at the p ≤ .05 level is indicated by an asterisk (*).
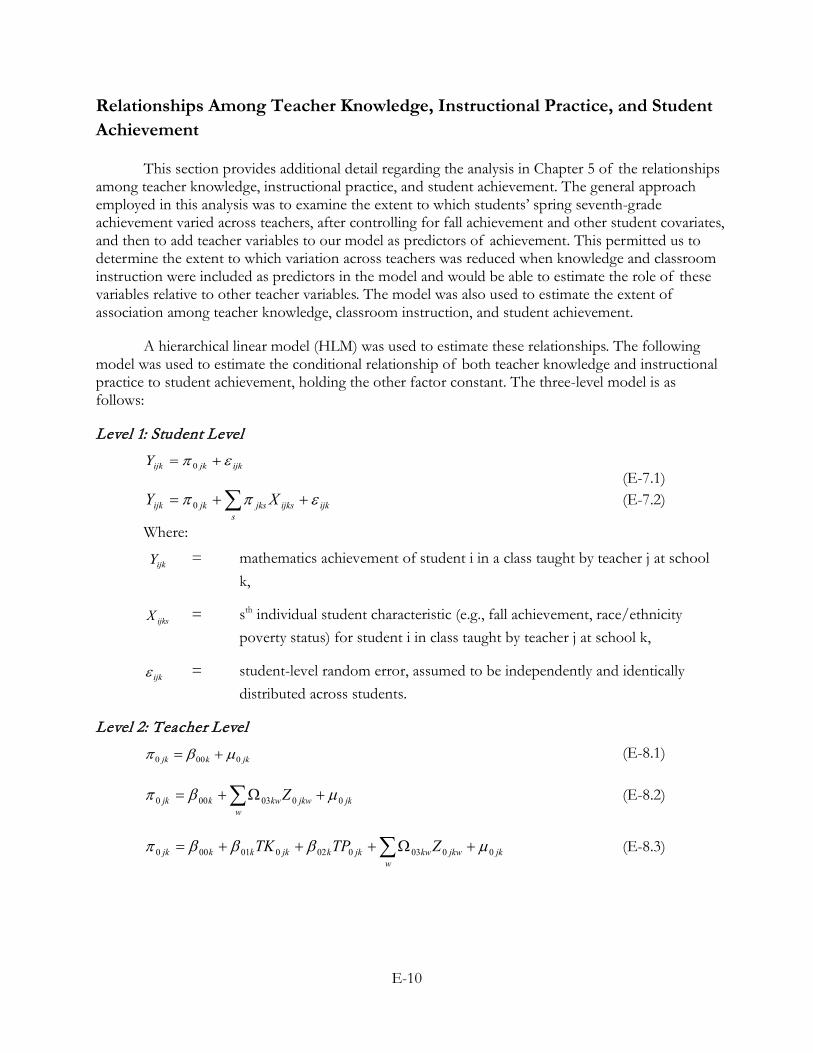
E-10
Relationships Among Teacher Knowledge, Instructional Practice, and Student Achievement
This section provides additional detail regarding the analysis in Chapter 5 of the relationships among teacher knowledge, instructional practice, and student achievement. The general approach employed in this analysis was to examine the extent to which students’ spring seventh-grade achievement varied across teachers, after controlling for fall achievement and other student covariates, and then to add teacher variables to our model as predictors of achievement. This permitted us to determine the extent to which variation across teachers was reduced when knowledge and classroom instruction were included as predictors in the model and would be able to estimate the role of these variables relative to other teacher variables. The model was also used to estimate the extent of association among teacher knowledge, classroom instruction, and student achievement.
A hierarchical linear model (HLM) was used to estimate these relationships. The following model was used to estimate the conditional relationship of both teacher knowledge and instructional practice to student achievement, holding the other factor constant. The three-level model is as follows:
Level 1: Student Level
ijkjkijkY επ += 0
(E-7.1)
∑ ++=s
ijkijksjksjkijk XY εππ 0 (E-7.2)
Where:
ijkY = mathematics achievement of student i in a class taught by teacher j at school k,
ijksX = sth individual student characteristic (e.g., fall achievement, race/ethnicity poverty status) for student i in class taught by teacher j at school k,
ijkε = student-level random error, assumed to be independently and identically distributed across students.
Level 2: Teacher Level
jkkjk 0000 µβπ += (E-8.1)
∑ +Ω+=w
jkjkwkwkjk Z 0003000 µβπ (E-8.2)
∑ +Ω+++=w
jkjkwkwjkkjkkkjk ZTPTK 0003002001000 µβββπ (E-8.3)
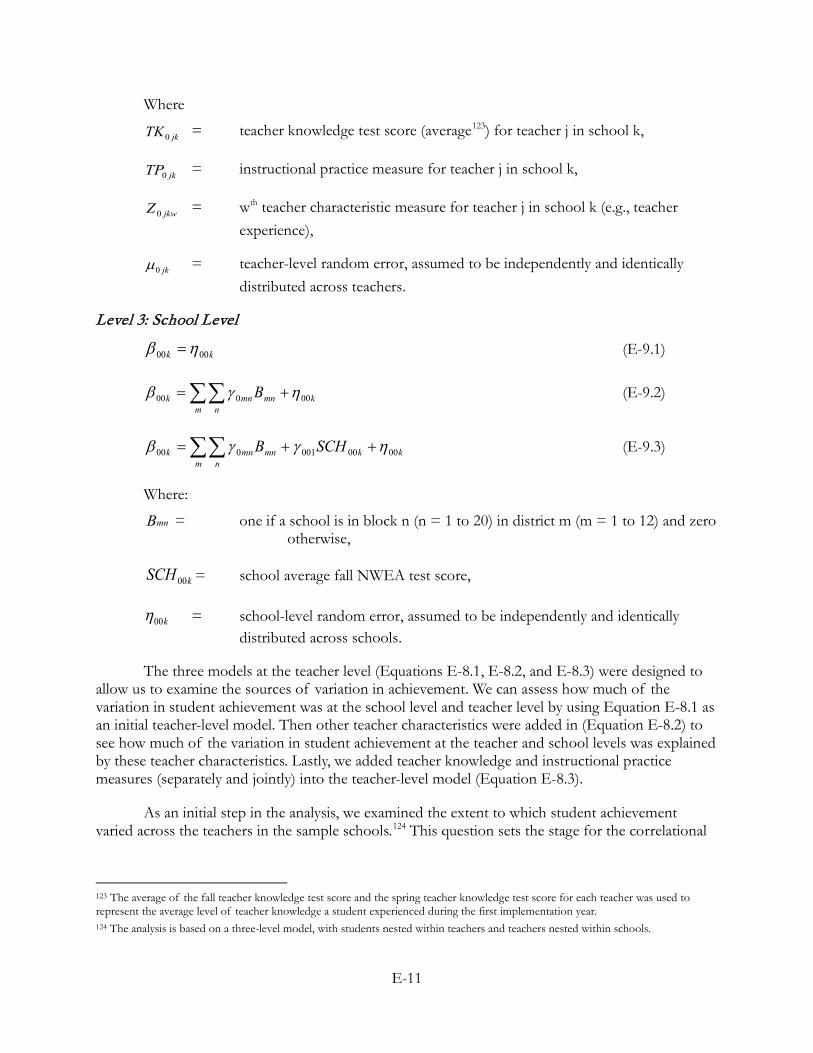
E-11
Where
jkTK0 = teacher knowledge test score (average123
jkTP0
) for teacher j in school k,
= instructional practice measure for teacher j in school k,
jkwZ 0 = wth teacher characteristic measure for teacher j in school k (e.g., teacher experience),
jk0µ = teacher-level random error, assumed to be independently and identically distributed across teachers.
Level 3: School Level
kk 0000 ηβ = (E-9.1)
km n
mnmnk B 00000 ηγβ += ∑∑ (E-9.2)
kkm n
mnmnk SCHB 0000001000 ηγγβ ++= ∑∑ (E-9.3)
Where:
mnB = one if a school is in block n (n = 1 to 20) in district m (m = 1 to 12) and zero otherwise,
kSCH00 = school average fall NWEA test score,
k00η = school-level random error, assumed to be independently and identically distributed across schools.
The three models at the teacher level (Equations E-8.1, E-8.2, and E-8.3) were designed to allow us to examine the sources of variation in achievement. We can assess how much of the variation in student achievement was at the school level and teacher level by using Equation E-8.1 as an initial teacher-level model. Then other teacher characteristics were added in (Equation E-8.2) to see how much of the variation in student achievement at the teacher and school levels was explained by these teacher characteristics. Lastly, we added teacher knowledge and instructional practice measures (separately and jointly) into the teacher-level model (Equation E-8.3).
As an initial step in the analysis, we examined the extent to which student achievement varied across the teachers in the sample schools.124
This question sets the stage for the correlational
123 The average of the fall teacher knowledge test score and the spring teacher knowledge test score for each teacher was used to represent the average level of teacher knowledge a student experienced during the first implementation year. 124 The analysis is based on a three-level model, with students nested within teachers and teachers nested within schools.
E-12
analyses, because teacher knowledge and instructional practice can be related to student achievement only to the extent that student achievement varies among teachers.
Table E-6 presents the variance decomposition for the standardized student spring total NWEA test scores. The table reports results based on the following models:
•
•
•
•
•
With no control variables (Equations E-7.1, E-8.1, and E-9.1) (benchmark)
Add random assignment block fixed effects (Equations E-7.1, E-8.1, and E-9.2) (model 1)
Add school and student characteristics (Equations E-7.2, E-8.1, and E-9.3) (model 2)
Add baseline teacher characteristics (Equations E-7.2, E-8.2, and E-9.3) (model 3)
Add teacher knowledge and instructional practice measures (Equations E-7.2, E-8.3, E-9.3) (model 4)
125 The value 0.17 is calculated as the square-root of the variance at the teacher level as a proportion of the total variance in achievement (0.03/1.08 = 0.03). The estimated between-teacher variation in student achievement is similar to findings reported in the literature. For example, Rockoff (2004) looked at two school districts in New Jersey and found that “moving up one standard deviation in the teacher fixed effect distribution raises both reading and mathematics test scores by approximately 0.1 standard deviations on a nationally standardized scale.” Hanushek, Kain, O’Brien, and Rivkin (2005) put the best bounds on the standard deviation associated with teacher quality at 0.22 to 0.27. Using data from the Los Angeles Unified School District, Kane and Staiger (2008) put the estimate in the range of 0.10 to 0.25 standard deviations.
The results of this analysis (reported in Table E-6) show that after controlling for student demographics and prior achievement, as well as teacher education and experience, 3 percent of the total variance in student achievement was at the teacher level (0.03 compared with a total of 1.08), and 5 percent of the adjusted variance in student achievement was at the teacher level (0.03 compared with an adjusted total of 0.61). Thus, if we interpret the teacher-level variance as the variation among teachers in their effectiveness in raising student achievement, students with a teacher 1 standard deviation above average in effectiveness scored 0.17 standard deviations above average.125 This difference is higher than the control group fall-to-spring growth of 0.10 standard deviations, reported in Chapter 4. Thus, a student taught by a teacher 1 standard deviation above average would be expected to gain 0.17 + 0.10 standard deviations during the school year, or more than twice as much as a student taught by an average teacher (0.10 standard deviations).
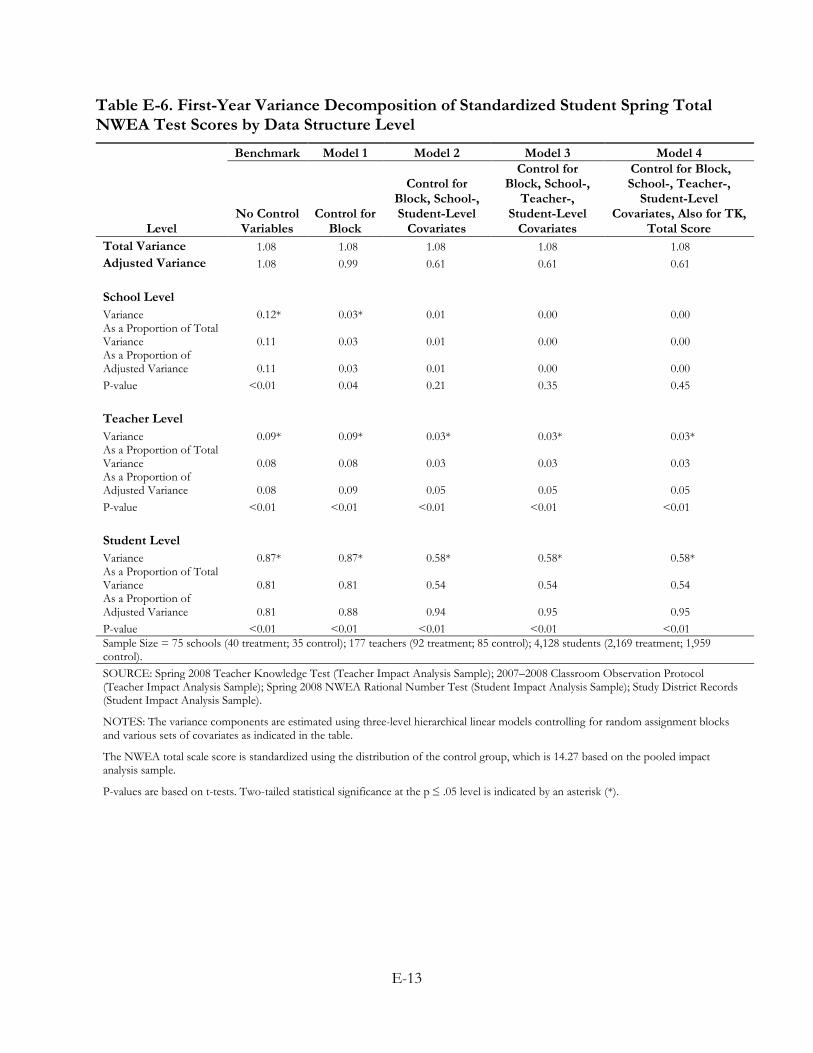
E-13
Table E-6. First-Year Variance Decomposition of Standardized Student Spring Total NWEA Test Scores by Data Structure Level
Level
Benchmark Model 1 Model 2 Model 3 Model 4
No Control Variables
Control for Block
Control for Block, School-, Student-Level
Covariates
Control for Block, School-,
Teacher-, Student-Level
Covariates
Control for Block, School-, Teacher-,
Student-Level Covariates, Also for TK,
Total Score Total Variance 1.08 1.08 1.08 1.08 1.08 Adjusted Variance 1.08 0.99 0.61 0.61 0.61 School Level Variance 0.12* 0.03* 0.01 0.00 0.00 As a Proportion of Total Variance 0.11 0.03 0.01 0.00 0.00 As a Proportion of Adjusted Variance 0.11 0.03 0.01 0.00 0.00 P-value <0.01 0.04 0.21 0.35 0.45 Teacher Level Variance 0.09* 0.09* 0.03* 0.03* 0.03* As a Proportion of Total Variance 0.08 0.08 0.03 0.03 0.03 As a Proportion of Adjusted Variance 0.08 0.09 0.05 0.05 0.05 P-value <0.01 <0.01 <0.01 <0.01 <0.01 Student Level Variance 0.87* 0.87* 0.58* 0.58* 0.58* As a Proportion of Total Variance 0.81 0.81 0.54 0.54 0.54 As a Proportion of Adjusted Variance 0.81 0.88 0.94 0.95 0.95 P-value <0.01 <0.01 <0.01 <0.01 <0.01 Sample Size = 75 schools (40 treatment; 35 control); 177 teachers (92 treatment; 85 control); 4,128 students (2,169 treatment; 1,959 control). SOURCE: Spring 2008 Teacher Knowledge Test (Teacher Impact Analysis Sample); 2007–2008 Classroom Observation Protocol (Teacher Impact Analysis Sample); Spring 2008 NWEA Rational Number Test (Student Impact Analysis Sample); Study District Records (Student Impact Analysis Sample).
NOTES: The variance components are estimated using three-level hierarchical linear models controlling for random assignment blocks and various sets of covariates as indicated in the table.
The NWEA total scale score is standardized using the distribution of the control group, which is 14.27 based on the pooled impact analysis sample.
P-values are based on t-tests. Two-tailed statistical significance at the p ≤ .05 level is indicated by an asterisk (*).
E-14
In Table 5-4, we reported the coefficients for the teacher knowledge and instructional practice variables, which indicate the association between the teacher outcome measures and the main student outcome, holding all other covariates in the model constant. The reported coefficients
in this table for teacher knowledge ( 01β ) and instructional practice ( 02β ) come from Equation E-
8.3. 01β is the conditional relationship between teacher knowledge and student achievement, holding
instructional practice and other covariates constant. Likewise, 02β is the conditional relationship between instructional practice and student achievement, holding teacher knowledge and the other covariates constant. To simplify the interpretation of the estimated coefficients, all teacher knowledge, instructional practice, and student achievement measures were standardized, and thus
the estimated coefficients can be interpreted as effect sizes. For example, 01β is the effect size for the change in student test score associated with a 1 standard deviation increase in teacher knowledge, holding everything else constant. A joint F-test was used to determine whether teacher knowledge and instructional practice jointly explained variation in student achievement, over and above the variance explained by the student and teacher covariates.
Recommended