Pergamon Ann. Nucl. Energy, Vol. 25, No. 7, pp. 409-420, 1998
© 1997 Published by Elsevier Science Ltd. All fights reserved PII: S0306-4549(97)00075-3 Printed in Great Britain
0306-4549/98 $19.00+0.00
MODELLING OF CORE PROTECTION AND MONITORING SYSTEM FOR PWR NUCLEAR
POWER PLANT SIMULATOR
J U N G K U N L E E and B Y O U N G S U N G H A N
Department of Electrical Engineering, Chonbuk National University, 664-14 Dukjindong, Chonju, Chonbuk, Korea, 561-756
(Received 8 July 1997)
Abstract--A nuclear power plant simulator was developed for Younggwang units 3 and 4 nuclear power plant (YGN Nos 3 and 4) in Korea; it has been in operation on training center since November 1996. The core protection calcu- lator (CPC) and the core operating limit supervisory system (COLSS) for the simulator were also developed. The CPC is a digital computer-based core protection system, which performs on-line calculation of departure from nucleate boiling ratio (DNBR) and local power density (LPD). It initiates reactor trip when the core conditions exceed designated DNBR or LPD lim- itations. The COLSS is designed to assist operators by implementing the lim- iting conditions for operations in the technical specifications. With these systems, it is possible to increase capacity factor and safety of nuclear power plants, because the COLSS data can show accurate operation margin to plant operators and the CPC can protect reactor core. In this study, the function of CPC/COLSS is analyzed in detail, and then simulation model for CPC/COLSS is presented based on the function. Compared with the YGN Nos 3 and 4 plant operation data and CEDIPS/COLSS FORTRAN code test results, the predictions with the model show reasonable results. © 1997 Published by Elsevier Science Ltd.
1. INTRODUCTION
The safety and reliability of nuclear power plant heavily rely on the plant operator's ability to respond to various emergency situations of a power plant. The importance of operator's ability was well demonstrated in the investigation of the TMI accident in 1979. Investigators for the accident reported that mistaken operations in the emergent situation contributed greatly to the accident. The TMI accident also demonstrated the importance of operator training and the use of simulators for this very purpose. It has become stan- dard industrial practice to use simulators to improve the safety and reliability of nuclear power plant operations. For this purpose, a simulator was developed for Younggwang
409
410 Jung Kun Lee and Byoung Sung Han
unit 3 and 4 nuclear power plant, which is the basic model of the Korean standard nuclear power plant. The power plant is the first plant that has several conceptually different fea- tures compared with other nuclear power plants in Korea. Two of them are the core protection calculator and the core operational limit supervisory system. For the simulator to have the same function as the referenced plant, the core protection calculator (CPC) and core operating limit supervisory system (COLSS) simulation model was developed in accordance with the functional design requirement of CPC and COLSS system (CE- NPSD-366, April 1988; CE-NPSD-423, December 1988). The CPC is a digital computer based reactor protection system, which initiates reactor trip when core condition exceeds the departure from nucleate boiling ratio (DNBR) and local power density (LPD) design limit by performing on-line calculation. The COLSS is designed to assist operators in implementing the limiting conditions for operations in technical specifications. The simu- lator hardware systems are designed to provide the same features and appearance as reference plant's main control room, and software systems are in operation under real time UNIX system. For this study, we gathered nuclear and thermohydraulic data during the startup operation to get the parameters of various range of power level from Young- gwang nuclear power plant units 3 and 4, the reference plant for this simulator. These data are used to generate the reference values of parameters by CEDIPS and COLSS FORTRAN provided by plant system vendor. They are also used as inputs for the eva- luation of the simulation model.
2. CPC/COLSS SYSTEM
The core protection calculator calculates departure from nucleate boiling ratio and local power density of reactor core. When its values reach to setpoint during certain transients, CPC initiates reactor trip to prevent violation of design limits such as the low DNBR and the high temperature of fuel centerline (Design Spec. 1992).
The minimum DNBR is calculated as follows:
q DNn(K) (1) D N B R K - FK " q ~OCAL(K)
The minimum is selected, and the adjustment terms are applied.
DNBRMIN = M I N [ D N B R 2 , DNBR3. . .DNBR21] ,
D N B R s r = EDNm • [DNBRMIN + EDNB2],
(2)
where DNBRK = array of DNB ratio in hot channel, q ~NB = critical heat flux of hot channel (BTU/sec ft-2), q ~:OCAL(K)= heat flux distribution of K point hot pin, F/~ = non uniform heating correction factor for hot channel node K, D N B R s r = m i n i m u m static DNBR, EDNB1 and EDNB2 = constants for DNBR adjustment terms.
The local power density is calculated as follows:
Modelling of core protection and monitoring system 411
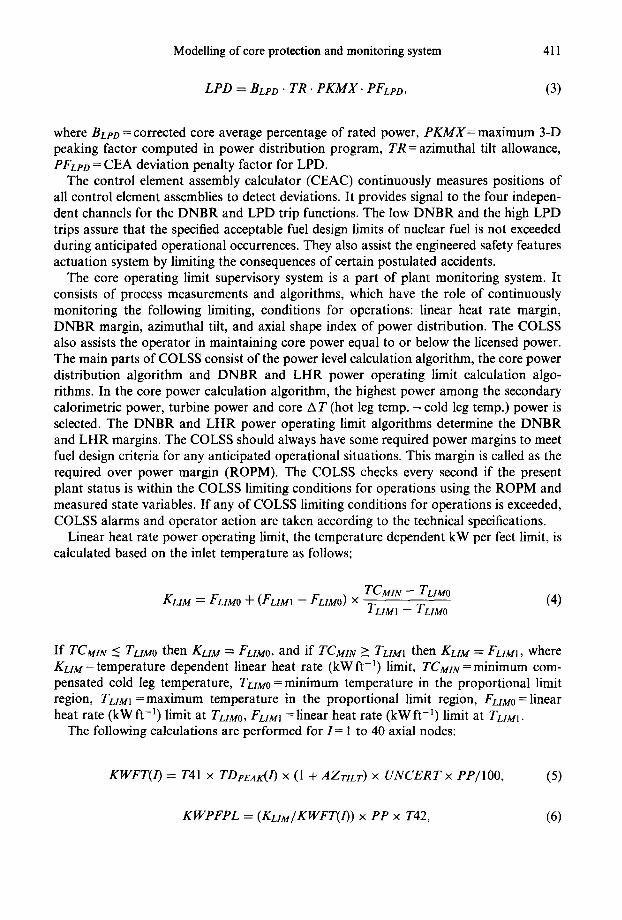
LPD = BLED" T R . P K M X . PFLeD, (3)
where BLeD = corrected core average percentage of rated power, P K M X = maximum 3-D peaking factor computed in power distribution program, TR = azimuthal tilt allowance, PFH,o = CEA deviation penalty factor for LPD.
The control element assembly calculator (CEAC) continuously measures positions of all control element assemblies to detect deviations. It provides signal to the four indepen- dent channels for the DNBR and LPD trip functions. The low DNBR and the high LPD trips assure that the specified acceptable fuel design limits of nuclear fuel is not exceeded during anticipated operational occurrences. They also assist the engineered safety features actuation system by limiting the consequences of certain postulated accidents.
The core operating limit supervisory system is a part of plant monitoring system. It consists of process measurements and algorithms, which have the role of continuously monitoring the following limiting, conditions for operations: linear heat rate margin, DNBR margin, azimuthal tilt, and axial shape index of power distribution. The COLSS also assists the operator in maintaining core power equal to or below the licensed power. The main parts of COLSS consist of the power level calculation algorithm, the core power distribution algorithm and DNBR and LHR power operating limit calculation algo- rithms. In the core power calculation algorithm, the highest power among the secondary calorimetric power, turbine power and core A T (hot leg temp. - cold leg temp.) power is selected. The DNBR and LHR power operating limit algorithms determine the DNBR and LHR margins. The COLSS should always have some required power margins to meet fuel design criteria for any anticipated operational situations. This margin is called as the required over power margin (ROPM). The COLSS checks every second if the present plant status is within the COLSS limiting conditions for operations using the ROPM and measured state variables. If any of COLSS limiting conditions for operations is exceeded, COLSS alarms and operator action are taken according to the technical specifications.
Linear heat rate power operating limit, the temperature dependent kW per feet limit, is calculated based on the inlet temperature as follows;
KLI M ~- FLIMO + (FLIMI -- FLIMO ) X TCMIN- TLIMO
TLIM1 -- TLIMO (4)
If TCM1N ~ TLIMO then KLIM = FLIMO, and if TCMIN >~ TLIMI then KLIM = FLIMI, where KLIM = temperature dependent linear heat rate (kWft -~) limit, TCMIN=minimum com- pensated cold leg temperature, TLtMO = minimum temperature in the proportional limit region, TLIM1 =maximum temperature in the proportional limit region, FLIMO =linear heat rate (kWft -1) limit at TLIMO, FLIM! =linear heat rate (kWft -1) limit at TIJM1.
The following calculations are performed for I = 1 to 40 axial nodes:
KWFT(1) = T41 x TDpEAK(I) × (1 + AZTILT) × U N C E R T x PP/IO0, (5)
K W P F P L = (KLIM/KWFT(1)) × PP x T42, (6)
412 Jung Kun Lee and Byoung Sung Han
where KWFT(1)= linear heat rate at node I, T41 = core average linear heat rate at rated power, TD?EAK(1)= 3-D peaking factor, AZriLr=the azimuthal tilt, PP=plan t power (%), KLtM =temperature-dependent linear heat rate limit, T42 =adjustment factor for linear heat rate limit, UNCERT= adjustment factor for the calculation of linear heat rate, KWPFPL = the power operating limit.
The linear heat rate power operating limit, KWPFOPL, is assigned as minimum value of KWPFPL(1) for I= 1 to 40:
KWPFOPL = MIN[KWPFPL(1)] (7)
3. HARDWARE CONFIGURATION OF SIMULATOR CPC/COLSS SYSTEM
The simulator for the YGN Nos 3 and 4 is a full scope replica type simulator for the training of plant operators. The CPC/COLSS on the simulator was designed to provide the same features as those installed in the reference power plant. To accomplish this, hardware identical to the plant main control room was installed. The hardware includes the same operator modules such as the plasma display unit, Cathode Ray Tube (CRT) and function keyboards. The simulation host computer system consists of one Silicon Graphics Challenge L server and Indy workstations operating under real-time UNIX OS. Table 1 shows the hardware configuration of the actual plant and that of the simulator.
4. DEVELOPMENT OF CPC/COLSS MODEL FOR SIMULATOR
4.1. Model development process
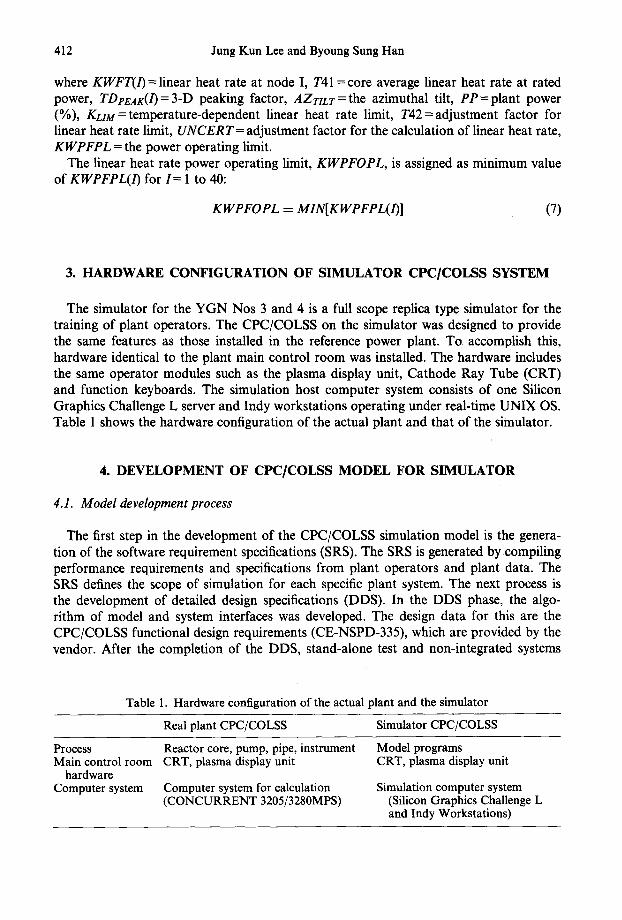
The first step in the development of the CPC/COLSS simulation model is the genera- tion of the software requirement specifications (SRS). The SRS is generated by compiling performance requirements and specifications from plant operators and plant data. The SRS defines the scope of simulation for each specific plant system. The next process is the development of detailed design specifications (DDS). In the DDS phase, the algo- rithm of model and system interfaces was developed. The design data for this are the CPC/COLSS functional design requirements (CE-NSPD-335), which are provided by the vendor. After the completion of the DDS, stand-alone test and non-integrated systems
Table 1. Hardware configuration of the actual plant and the simulator
Real plant CPC/COLSS Simulator CPC/COLSS
Process Main control room
hardware Computer system
Reactor core, pump, pipe, instrument CRT, plasma display unit
Computer system for calculation (CONCURRENT 3205/3280MPS)
Model programs CRT, plasma display unit
Simulation computer system (Silicon Graphics Challenge L and Indy Workstations)
Modelling of core protection and monitoring system 413
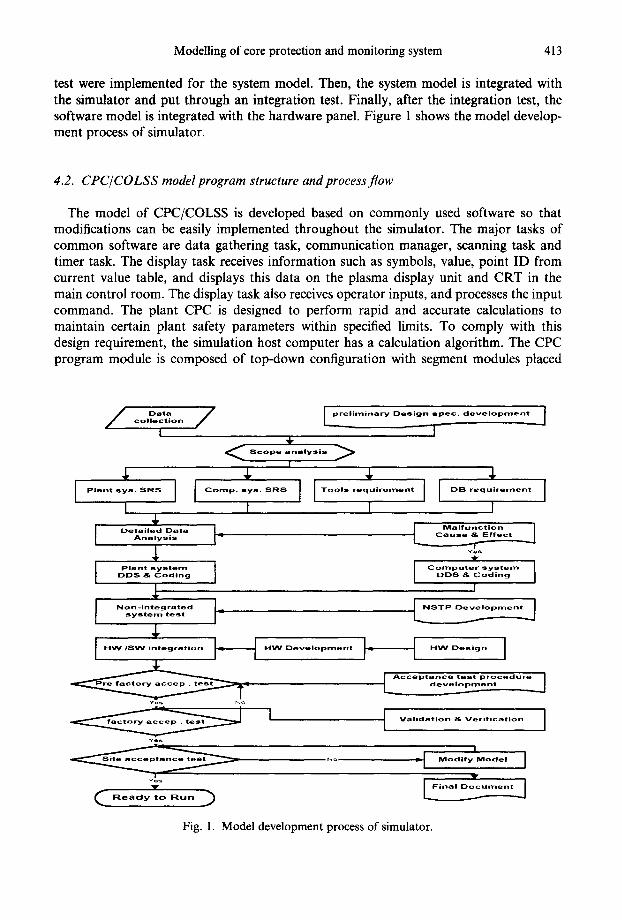
test were implemented for the system model. Then, the system model is integrated with the simulator and put through an integration test. Finally, after the integration test, the software model is integrated with the hardware panel. Figure 1 shows the model develop- ment process of simulator.
4.2. CPC/COLSS model program structure and process flow
The model of CPC/COLSS is developed based on commonly used software so that modifications can be easily implemented throughout the simulator. The major tasks of common software are data gathering task, communication manager, scanning task and timer task. The display task receives information such as symbols, value, point ID from current value table, and displays this data on the plasma display unit and CRT in the main control room. The display task also receives operator inputs, and processes the input command. The plant CPC is designed to perform rapid and accurate calculations to maintain certain plant safety parameters within specified limits. To comply with this design requirement, the simulation host computer has a calculation algorithm. The CPC program module is composed of top-down configuration with segment modules placed
/ co,,.o.,on°"° / ~ . c o--,oo .... I
Plant sys. SRS [
I 4 [ Detailed Data [ Analyeis q
I ° ' . . . . , . . . . . I D D S 8, C o d i n g
I .oo_,n.o o I" . . . . s y s t e m t e s t
HW ISW i n t e g r a t i o r |
e s o
S c o p e a n a l y s i s > I
I Comp. ,,,~,,,. =.,,~ l [ Too,,, req,.,, . . . . . . I I o,3,',-qo, . . . . . .
I I I
Yes
Io_o . . . . . ~ . . . . I DDS & C o d i n g
~ S T P E ) ~
t - - ~ . w Oeve 'oo - -n ' I - - - - ~ " W O- - io ° I
[ A c c e p t a n c e t e s t p r o c e d u r e ] [ d e v e l o p m e n t
[ W, id. ion. Veri,ic.tio,, ]
Y's ( Ready to Run ~
I -I ~ o d " - ~ o d - ' I
Y L y o a , ~
Fig. 1. Model development process of simulator.
414 Jung Kun Lee and Byoung Sung Han
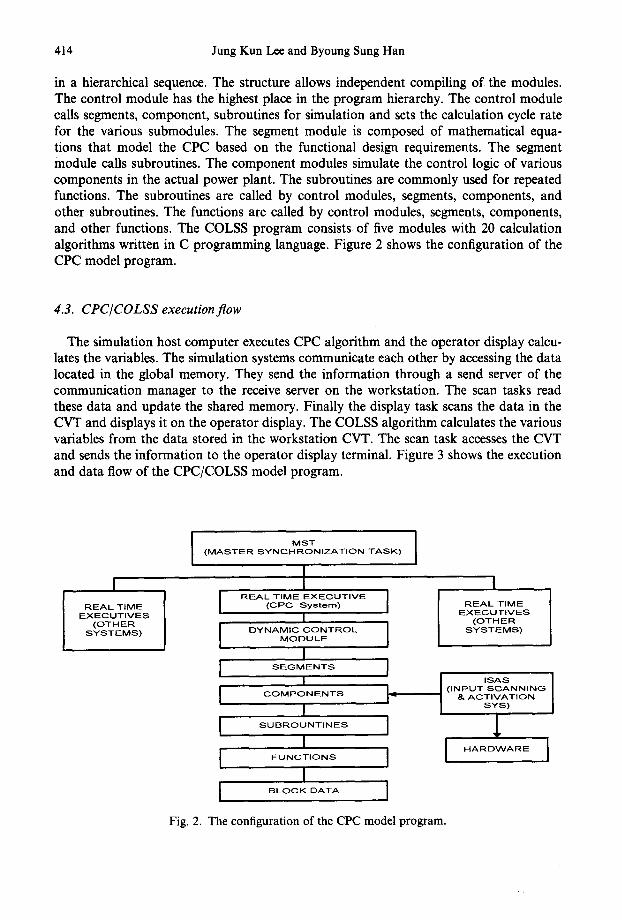
in a hierarchical sequence. The structure allows independent compiling of the modules. The control module has the highest place in the program hierarchy. The control module calls segments, component, subroutines for simulation and sets the calculation cycle rate for the various submodules. The segment module is composed of mathematical equa- tions that model the CPC based on the functional design requirements. The segment module calls subroutines. The component modules simulate the control logic of various components in the actual power plant. The subroutines are commonly used for repeated functions. The subroutines are called by control modules, segments, components, and other subroutines. The functions are called by control modules, segments, components, and other functions. The COLSS program consists of five modules with 20 calculation algorithms written in C programming language. Figure 2 shows the configuration of the CPC model program.
4.3. CPC/COLSS execution flow
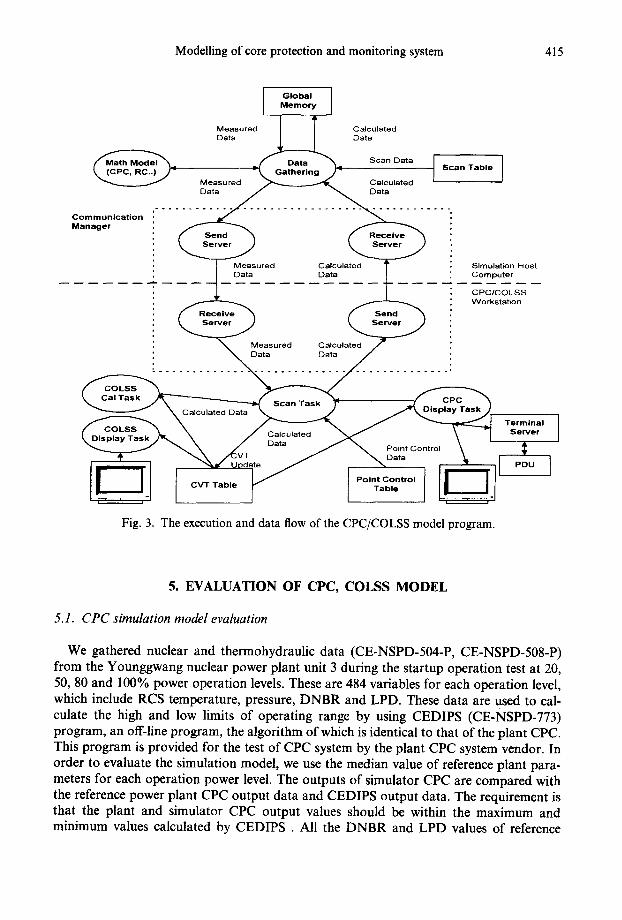
The simulation host computer executes CPC algorithm and the operator display calcu- lates the variables. The simulation systems communicate each other by accessing the data located in the global memory. They send the information through a send server of the communication manager to the receive server on the workstation. The scan tasks read these data and update the shared memory. Finally the display task scans the data in the CVT and displays it on the operator display. The COLSS algorithm calculates the various variables from the data stored in the workstation CVT. The scan task accesses the CVT and sends the information to the operator display terminal. Figure 3 shows the execution and data flow of the CPC/COLSS model program.
I REALTIME
EXECUTIVES (OTHER
SYSTEMS)
I MST I (MASTER SYNCHRONIZATION TASK)
I I REALT,MEE×EOUT,VE I (CPC System) I
I DYNAMIC CONTROL I MODULE
I I SEGMENTS I
I COMPONENTS I -
I I SU--OUNTINES I
I I UNCT,ONS I
I I BLOCK DATA I
I REAL TIME
EXECUTIVES (OTHER
SYSTEMS)
I ISAS (INPUT SCANNING
I & ACTIVATION SYS)
Fig. 2. The configuration of the CPC model program.
Modelling of core protection and monitoring system 415
Communicat ion Manager
Global Memory
Data Measured I I Data Calculated
f Data ~ Scan Data J Gathering 4 Scan Table
Measured ~ Calculated Data / ~ Data
Send "~ ( Receive Server Server
Measured Calculated Data Data
Receive ) ( Send Server Server
..... . . / . . : Calculated Data Data
Point Control CVT Table Table
u ' ~ i-
Fig. 3. The execution and data flow of the CPC/COLSS model program.
Simulation Host Computer
CPC/COLSS Workstation
Terminal Server
5. EVALUATION OF CPC, COLSS MODEL
5.1. CPC simulation model evaluation
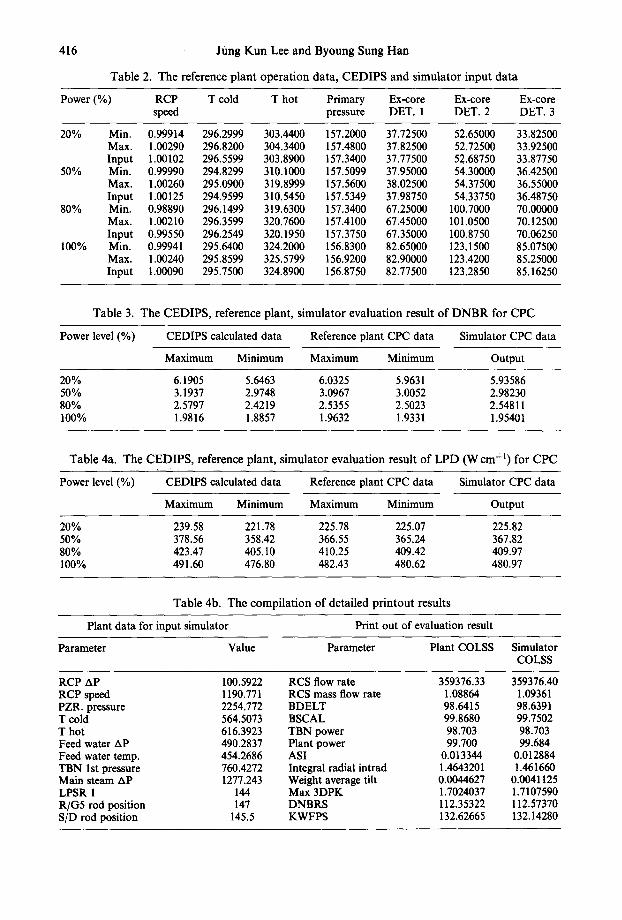
We gathered nuclear and thermohydraulic data (CE-NSPD-504-P, CE-NSPD-508-P) from the Younggwang nuclear power plant unit 3 during the startup operation test at 20, 50, 80 and 100% power operation levels. These are 484 variables for each operation level, which include RCS temperature, pressure, DNBR and LPD. These data are used to cal- culate the high and low limits of operating range by using CEDIPS (CE-NSPD-773) program, an off-line program, the algorithm of which is identical to that of the plant CPC. This program is provided for the test of CPC system by the plant CPC system vendor. In order to evaluate the simulation model, we use the median value of reference plant para- meters for each operation power level. The outputs of simulator CPC are compared with the reference power plant CPC output data and CEDIPS output data. The requirement is that the plant and simulator CPC output values should be within the maximum and minimum values calculated by CEDIPS . All the DNBR and LPD values of reference
416 J u n g K u n L e e and Byoung Sung Han
Table 2. The re~renceplantoperat ion data, CEDIPS and simulatorinputdata
Power(%) RCP T cold T hot Primary Ex-core Ex-core Ex-core speed pressure DET. 1 DET. 2 DET. 3
20% Min. 0.99914 296.2999 303.4400 157.2000 37.72500 52.65000 33.82500 Max. 1.00290 296.8200 304.3400 157.4800 37.82500 52.72500 33.92500 Input 1.00102 296.5599 303.8900 157.3400 37.77500 52.68750 33.87750
50% Min. 0.99990 294.8299 310.1000 157.5099 37.95000 54.30000 36.42500 Max. 1.00260 295.0900 319.8999 157.5600 38.02500 54.37500 36.55000 Input 1.00125 294.9599 310.5450 157.5349 37.98750 54.33750 36.48750
80% Min. 0.98890 296.1499 319.6300 157.3400 67.25000 100.7000 70.00000 Max. 1.00210 296.3599 320.7600 157.4100 67.45000 101.0500 70.12500 Input 0.99550 296.2549 320.1950 157.3750 67.35000 100.8750 70.06250
100% Min. 0.99941 295.6400 324.2000 156.8300 82.65000 123.1500 85.07500 Max. 1.00240 295.8599 325.5799 156.9200 82.90000 123.4200 85.25000 Input 1.00090 295.7500 324.8900 156.8750 82.77500 123.2850 85.16250
Table 3. The CEDIPS, reference plant, simulator evaluation result of DNBR for CPC
Power level (%) CEDIPS calculated data Reference plant CPC data Simulator CPC data
Maximum Minimum Maximum Minimum Output
20% 6.1905 5.6463 6.0325 5.9631 5.93586 500 3.1937 2.9748 3.0967 3.0052 2.98230 80% 2.5797 2.4219 2.5355 2.5023 2.54811 100% 1.9816 1.8857 1.9632 1.9331 1.95401
Table 4a. The CEDIPS, reference plant, simulator evaluation result of LPD (W cm -1) for CPC
Power level (%) CEDIPS calculated data Reference plant CPC data Simulator CPC data
Maximum Minimum Maximum Minimum Output
20% 239.58 221.78 225.78 225.07 225.82 50% 378.56 358.42 366.55 365.24 367.82 80% 423.47 405.10 410.25 409.42 409.97 100% 491.60 476.80 482.43 480.62 480.97
Table 4b. The compilation of detailed printout results
Plant data for input simulator Print out of evaluation result
Parameter Value Parameter Plant COLSS Simulator COLSS
RCP AP RCP speed PZR. pressure T cold T hot Feed water AP Feed water temp. TBN 1st pressure Main steam AP LPSR 1 R/G5 rod position S/D rod position
100.5922 RCS flow rate 359376.33 1190.771 RCS mass flow rate 1.08864 2254.772 BDELT 98.6415 564.5073 BSCAL 99.8680 616.3923 TBN power 98.703 490.2837 Plant power 99.700 454.2686 ASI 0.013344 760.4272 Integral radial intrad 1.4643201 1277.243 Weight average tilt 0.0044627
144 Max 3DPK 1.7024037 147 DNBRS 112.35322
145.5 KWFPS 132.62665
359376.40 1.09361 98.6391 99.7502 98.703 99.684
0.012884 1.461660
0.0041125 1.7107590 112.57370 132.14280
Modelling of core protection and monitoring system 417
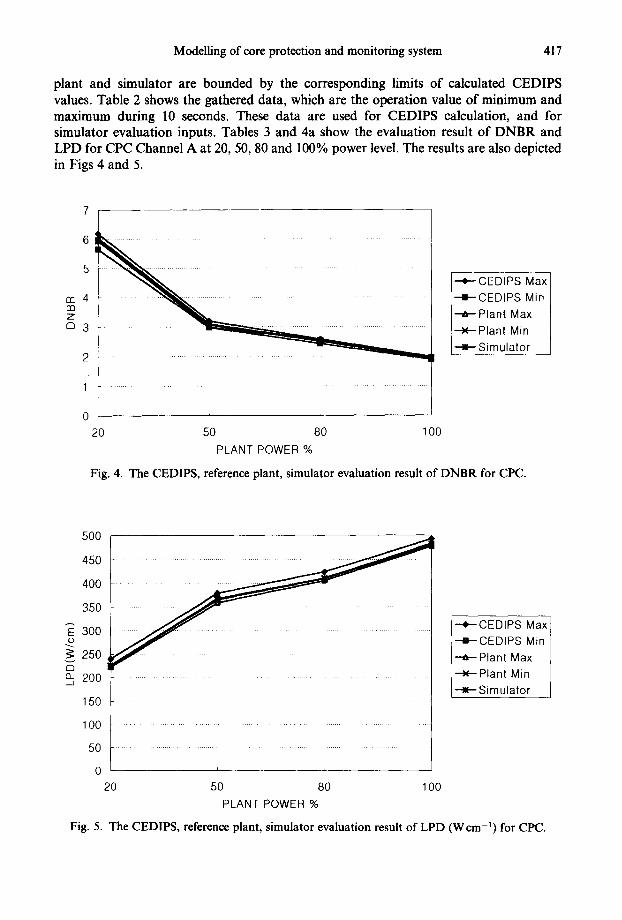
plant and simulator are bounded by the corresponding limits of calculated CEDIPS values. Table 2 shows the gathered data, which are the operation value of minimum and maximum during 10 seconds. These data are used for CEDIPS calculation, and for simulator evaluation inputs. Tables 3 and 4a show the evaluation result of DNBR and LPD for CPC Channel A at 20, 50, 80 and 100% power level. The results are also depicted in Figs 4 and 5.
7 l °! 5
rr 4 rn Z
~ 3
2
1 -
0 20
h
50 80 PLANT POWER %
• -o-" CE DIPS Max 1 -m-CEDIPS Min / --~,- Plant Max [
x Plant Min / K Simulator j
100
Fig. 4. The CEDIPS, reference plant, simulator evaluation result of DNBR for CPC.
500
450
400
350 !-'-4,- CEDIPS Max ~ 300 ..-a-CEDIPS Min I
250 ~ Planl Max J
"~.j 200 x Plant Min Ii Simulator J
150
[ , ,
1 0 0
50
0 20 50 80 100
PLANT POWER %
Fig. 5. The CEDIPS, reference plant, simulator evaluation result of LPD (Wcm -1) for CPC.
418 Jung Kun Lee and Byoung Sung Han
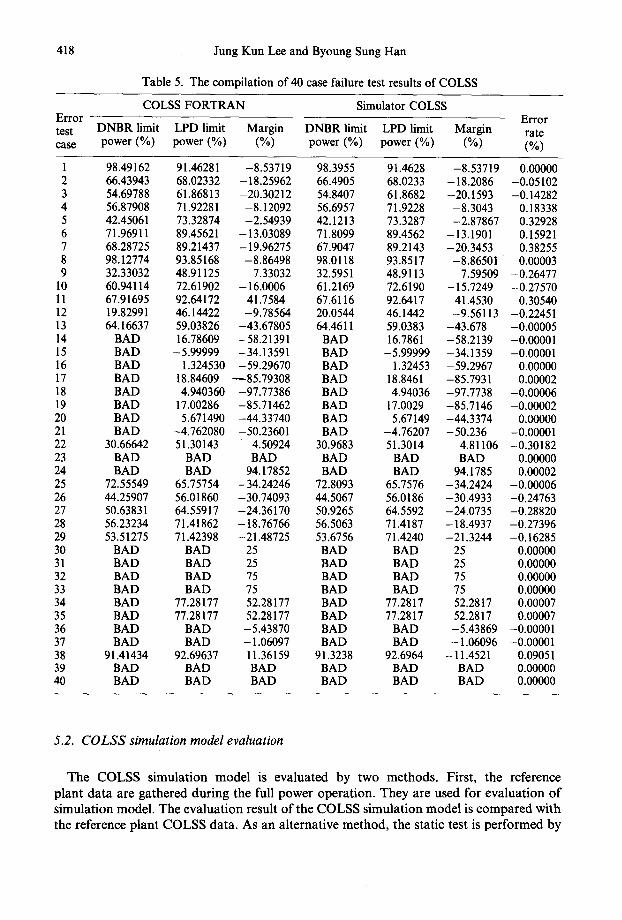
Table 5. The compilation of 40 case failure test results of COLSS
COLSS FORTRAN Simulator COLSS Error Error test DNBR limit LPD limit Margin DNBR limit LPD limit Margin rate case power (%) power (%) (%) power (%) power (%) (%) (%)
1 98.49162 91.46281 -8.53719 98.3955 91.4628 -8.53719 0.00000 2 66.43943 68.02332 -18.25962 66.4905 68.0233 -18.2086 -0.05102 3 54.69788 61.86813 -20.30212 54.8407 61.8682 -20.1593 -0.14282 4 56.87908 71.92281 -8.12092 56.6957 71.9228 -8.3043 0.18338 5 42.45061 73.32874 -2.54939 42.1213 73.3287 -2.87867 0.32928 6 71.96911 89.45621 -13.03089 71.8099 89.4562 -13.1901 0.15921 7 68.28725 89.21437 -19.96275 67.9047 89.2143 -20.3453 0.38255 8 98.12774 93.85168 -8.86498 98.0118 93.8517 -8.86501 0.00003 9 32.33032 48.91125 7.33032 32.5951 48.9113 7.59509 -0.26477
10 60.94114 72.61902 -16.0006 61.2169 72.6190 -15.7249 -0.27570 11 67.91695 92.64172 41.7584 67.6116 92.6417 41.4530 0.30540 12 19.82991 46.14422 -9.78564 20.0544 46.1442 -9.56113 -0.22451 13 64.16637 59.03826 -43.67805 64.4611 59.0383 -43.678 -0.00005 14 BAD 16.78609 -58.21391 BAD 16.7861 -58.2139 -0.00001 15 BAD -5.99999 -34.13591 BAD -5.99999 -34.1359 -0.00001 16 BAD 1.324530 -59.29670 BAD 1.32453 -59.2967 0.00000 17 BAD 18.84609 485.79308 BAD 18.8461 -85.7931 0.00002 18 BAD 4.940360 -97.77386 BAD 4.94036 -97.7738 -0.00006 19 BAD 17.00286 -85.71462 BAD 17.0029 -85.7146 -0.00002 20 BAD 5.671490 -44.33740 BAD 5.67149 -44.3374 0.00000 21 BAD -4.762080 -50.23601 BAD -4.76207 -50.236 -0.00001 22 30.66642 51.30143 4.50924 30.9683 51.3014 4.81106 -0.30182 23 BAD BAD BAD BAD BAD BAD 0.00000 24 BAD BAD 94.17852 BAD BAD 94.1785 0.00002 25 72.55549 65.75754 -34.24246 72.8093 65.7576 -34.2424 -0.00006 26 44.25907 56.01860 -30.74093 44.5067 56.0186 -30.4933 -0.24763 27 5 0 . 6 3 8 3 1 64.55917 -24.36170 50.9265 64.5592 -24.0735 -0.28820 28 56.23234 71.41862 -18.76766 56.5063 71.4187 -18.4937 -0.27396 29 53.51275 71.42398 -21.48725 53.6756 71.4240 -21.3244 -0.16285 30 BAD BAD 25 BAD BAD 25 0.00000 31 BAD BAD 25 BAD BAD 25 0.00000 32 BAD BAD 75 BAD BAD 75 0.00000 33 BAD BAD 75 BAD BAD 75 0.00000 34 BAD 77.28177 52.28177 BAD 77.2817 52.2817 0.00007 35 BAD 77.28177 52.28177 BAD 77.2817 52.2817 0.00007 36 BAD BAD -5.43870 BAD BAD -5.43869 -0.00001 37 BAD BAD -1.06097 BAD BAD -1.06096 -0.00001 38 91.41434 92.69637 -11.36159 91.3238 92.6964 -11.4521 0.09051 39 BAD BAD BAD BAD BAD BAD 0.00000 40 BAD BAD BAD BAD BAD BAD 0.00000
5.2. COLSS simulation model evaluation
The C O L S S s imula t ion mode l is eva lua ted by two methods . Fi rs t , the reference p lan t d a t a are ga thered dur ing the full power opera t ion . They are used for eva lua t ion o f s imula t ion model . The eva lua t ion result o f the C O L S S s imula t ion m o d e l is c o m p a r e d wi th the reference p lan t C O L S S data . As an a l te rna t ive me thod , the stat ic test is p e r f o r m e d by
Modelling of core protection and monitoring system 419
operating the COLSS simulation model independently, using 40 static test cases. The reference plant COLSS vendor provides these test cases for the verification of COLSS, which include various sensors, fail highs or fail lows and nominal value related tests. The static test values of the COLSS simulation model are compared with the inspection pro- gram results called COLSS FORTRAN, which is supplied by the reference plant COLSS vendor. The system requirement is that the two values of parameters should not differ more than 1% from each other. The maximum difference between the simulation model and reference plant of operating limit power comes within 0.38%, well within the 1% requirement. Table 4b shows the sample of gathered data among 222 parameters from reference plant for COLSS input and the compilation of detailed printout results of simu- lator COLSS at 100% power level. Table 5 shows a compilation of 40 test case results.
6. CONCLUSION
In this paper, the model of the reactor core protection calculator and the core operating limit supervisory system are developed for pressurized light water reactor simulator. The simulator is the replica of Younggwang nuclear power plant unit 3 and 4 in Korea, which is the basic model of the Korean standard nuclear power plant. In the evaluation of the simulated CPC model, it is verified that all the DNBR and the LPD values of simulated model are bounded within the upper and lower limits of calculated CEDIPS values. This means the simulated CPC model data are within the design performance limits of YGN Nos 3 and 4. The calculated values of parameters from the COLSS simulation model are compared with the results of real power plant COLSS data and the results of the COLSS inspection program called COLSS FORTRAN. The maximum error rate between the value of simulation model parameters and the actual plant parameters is less than 0.38%, well fitting within the 1% requirement of ANSI/ANS 3.5. The simulation model for safety system unique to YGN Nos. 3 and 4 will contribute to the improvement of the plant capacity factor and nuclear plant safety, by using this simulator for operator training.
REFERENCES
Auh, G.-S., Hwang, Si.-H. and Kim, S.-H. (1990, March) A steady state margin com- parison between analog and digital protection systems. Journal of the Korean Nuclear Society 22(1).
CE-NPSD-335. (1988, April) Functional Design Requirements for Core Protection Cal- culator, Combustion Engineering, Inc. Windsor, CT, USA.
CE-NPSD-366. (1988, April) Functional Design Requirements for Control Element Assembly Calculator, Combustion Engineering, Inc. Windsor, CT, USA.
CE-NPSD-423. (1988, December) Functional Design Requirements for Core Operating Limit Supervisory System for YGN 3 and 4, Combustion Engineering, Inc. Wind- sor, CT, USA.
CE-NPSD-504-P. Rev. 0-P (1988, December) YGN CPC/CEAC DataBase Document, Combustion Engineering, Inc. Windsor, CT, USA.
CE-NPSD-508-P. Rev. 0-P (1988, December) YGN#3,4 Reload Data Block Constants, Combustion Engineering, Inc. Windsor, CT, USA.
CE-NPSD-773. (1993) CEDIPS User's Manual, Combustion Engineering, Inc. Windsor, CT, USA.
420 Jung Kun Lee and Byoung Sung Han
Chi, S. G., Yu, S. S., In, W. K., Auh, G. S., Doo, J. Y. and Kim, D. K. (1988, April) Analysis and evaluation of CPC/COLSS related test results during YGN#3 initial startup. Journal of the Korean Nuclear Society 27(6).
Design Specification for Core Protection Calculator for YGN 3 and 4. (1992, April) Combustion Engineering, Inc. Windsor, CT, USA.
Nuclear Power Plant Simulators for Use in Operator Training and Examination, ANSI/ ANS 3.5. 1985.
System Description for Core Protection Calculator for YGN 3 and 4 (1990, November) Combustion Engineering, Inc. Windsor, CT, USA.
YGN #3&4, CPC/COLSS Verification Test Procedure. (1994, September) 3S-I-000-18.
Recommended