North Carolina Organic Vegetable Production Cost Study
Edmund A. Estes, Tony Kleese, and Laura Lauffer
ARE Report No. 31 June 2003
Department of Agricultural and Resource Economics North Carolina State University
Raleigh North Carolina
and
Carolina Farm Stewardship Association Tony Kleese, Executive Director
Laura Lauffer, Project Coordinator Pittsboro, North Carolina
Funded by: The Z. Smith Reynolds Foundation
Winston-Salem, North Carolina
2
Executive Summary
American consumers continue to buy organically grown food, especially fruits and vegetables, for variety of reasons including lifestyle, nutrition, taste, and health choices. As consumer interest in organic food increases, new market opportunities exist for suppliers as organic market niches expand beyond specialty food stores into traditional chain grocery stores. During 2001, USDA analysts reported that organic food products were available for sale in 73% of all U.S. grocery stores in addition to the estimated 20,000 natural food store outlets. Natural Food Merchandiser, a food industry publication, estimated U.S. organic food sales were about $7.8 billion in 2000, nearly double the estimated 1996 value. Among organic foods, fresh produce is the top-selling organic food category if sales value is used an indicator of importance. After fruits and vegetables, top selling food categories include non-dairy beverages, breads and grains, packaged foods (baby food, soups, frozen food), and dairy products (ranked from highest to lowest sales most to least). As consumer demand expands, new marketing opportunities will exist for new and established organic growers as well as supply chain handlers such as organic wholesalers and distributors.
The unique set of attributes often possessed by organic foods has resulted in consumers willing to pay extra to purchase organic food products. Previous studies by Estes et al. (1999) found that retail prices for organically grown fruits and vegetables sold in North Carolina were approximately 25 percent higher than comparable-quality conventionally grown fruits and vegetables. Other studies (The Packer (2001), Thomas Dobbs (1998), and The Hartman Group (2000)) reported similar price premium findings. If price premiums were typically realized, then a research question of interest could be “Are higher prices simply a reflection of higher production costs?” To date, relatively few organic cost studies have been conducted. One purpose of this study was simply to collect basic organic cultural cost information from several local organic growers. During 2001, we asked 24 growers to maintain detailed production and marketing records for one entire crop season. The 24 cooperators grew 8 different organic vegetables so we had cost records for one crop from three growers. Before the study started, we hypothesized that only slight cost differences would exist across each commodity grower, that is, each grower would incur similar cultural and marketing costs but fixed and labor costs would vary considerably across growers. In fact there were significant differences in machinery, equipment, and labor but also in cultural and marketing expenditures among farmers who raised the same crop. It is clear that growers employed a variety of cultural methods to raise the crop a few cost similarities were observed for each commodity. A variety of cultural practices, equipment and machinery ownership, use of own and hired labor, and marketing techniques contributed to significant differences in per unit costs of production. Peppers, squash, and lettuce were the most expensive study crops to grow (dollar cost / 100 square feet) while sweet corn, tomatoes, and salad mix were the least expensive crops to raise (dollar cost / 100 square feet) based on cooperator records. Net returns per 100 square feet also varied considerably within and across commodities but overall tomatoes, lettuce, salad mix, and sweet corn were among the most profitable.
3
North Carolina Organic Vegetable Production Cost Study Producers, lending institutions, agricultural advisors, and industry analysts need
timely economic information in order to evaluate business opportunities and make well-informed decisions. In addition, producers need guidance in establishing good business practices to enhance the profitability of their operations. The Carolina Farm Stewardship Association (CFSA) in conjunction with the Department of Agricultural and Resource Economics at North Carolina State University sought to address these needs by developing enterprise budgets for organic commodities. The Z. Smith Reynolds Foundation funded the study and it was initiated to address the lack of financial-based data for organic vegetable crops grown in the Southeastern U.S.
The main goal of the study was to organize and collect organic vegetable crop production and marketing cost information in order to assist organic growers and lenders in the estimation of crop costs and net profits. In order to develop accurate cost and profit budget information, we recruited North Carolina certified organic vegetable growers to serve as study cooperators. Study cooperators were asked to keep track of all production and marketing costs and activities for one specific commodity over the course of one production cycle during 2001. In particular, cooperators were requested to document all purchases, to list wages paid to employees, to record own and family time spent in production of the crop, to note cultural practices used, to provide us with a list of basic equipment and machinery that they used to grow the crop, and to record all marketing expenditures (both money and time). An example of a cooperator production cost tracking sheet is included in Appendix A. With a complete listing of costs, sales figures could be used in combination with costs to estimate crop costs and profits. In addition, we have included information on how we collected the information and established the budgets in order to assist farmers in the collection and evaluation of financial data for their operations. An example budget is listed in Appendix B.
Initially, we identified nine frequently grown organic vegetables and requested three organic growers’ track production and marketing practices for each commodity. However, problems arose for several growers so we elected to eliminate one commodity from the data collection process. As a result, three certified organic growers recorded costs and activities for eight different vegetables. North Carolina organic cooperators were identified through their membership in Carolina Farm Stewardship Association (CFSA). Laura Lauffer, Project Coordinator, worked with grower-cooperators so that a total of twenty-four detailed activities records were obtained during 2001. Since cooperators were asked to be diligent in documenting activities and costs, cooperators were paid a small, nominal fee for their efforts. Nevertheless, it is possible that some tasks or activities might not be recorded. If a task or expenditure was omitted, then true costs may be understated.
Despite detailed recordkeeping by cooperators, however, readers are cautioned that it is not appropriate to compare grower-cooperator costs and profits. In this study the difference between total revenue minus total cost is referred to as ‘net return’ rather than profit. Net return is similar to profit but differs from profit because some input costs are unvalued in the budget process. For example, in this study the use of several inputs such as a value of the land and grower-cooperator time are recognized but unva lued in the budget. Since grower time, management, and land are not explicitly identified as a

4
production expense, they are omitted as cost factor. Indeed, people disagree about the exact value of a piece of land and the value of grower-cooperator labor so it is likely that it would vary from farm to farm. Most individuals would agree, however, that land and grower-cooperator labor are valuables assets to the business and using these assets likely has an implicit cost. Owner labor or management time are bus iness costs in the same sense that a mortgage-free house still has a fixed ‘opportunity’ cost to the owner, that is, there is some amount of money that the owner would realize if the house were sold (even though the owner is not thinking about selling the house). The ‘opportunity cost’ of grower time, grower management, and land is similar in concept to the idea cost of a mortgage-free house so we prefer to use the term ‘net return’ rather than profit to remind us that some inputs are unvalued in the budget. In this study, grower-cooperators did not draw a salary or value their time during the 2001 season. The amount of hours that a grower-cooperator contributed to the crop was collected and reported in a later table but the time was unvalued so ‘net profit’ included, in part, compensation for unvalued contributions. If we wanted or were able to value all input costs, then the difference between gross revenue and total cost could be identified as net profit.
Differences in size of plot and operation, labor, market, and equipment make it unrealistic to compare net returns. Because of input differences across commodities, cost and return information must be interpreted very carefully. This study is meant to provide the reader with a foundation for establishing their own fixed costs while providing examples of variable costs to estimate potential variable costs for their crop. It is recommended that organic growers utilize report information as one tool to assist them in developing cost and return estimates rather than a way to compare operations as measured by profit indicators.
In addition, it is necessary to understand that if a grower-cooperator did not record an item as expenditure, then returns are overstated relative to returns estimated from accurate data. For analysis purposes, we assumed that all grower-cooperator records were accurately recorded and data were complete, but it is possible that there are data inconsistencies. For example, records revealed that grower-cooperators purchased containers (boxes) to facilitate product sales. While one assumes that all grower-cooperators needed to utilize shipping or handling containers so all grower-cooperators should list a ‘container’ charge in their records. However, records for several grower-cooperators did not list any container costs. If a grower-cooperator did not include a container charge as a production expense, then several explanations are possible: 1) the grower-cooperator does not use any bags, boxes, or containers; 2) containers were recycled and/or donated so the current cost was near zero; or 3) the grower-cooperator simply forgot to record the cost. Unfortunately, all three scenarios are equally likely so we could not determine ex post which option reflected the correct situation. Thus, we again urge caution in reading, analyzing, interpreting, and comparing cost and return information summarized in this study and remind the reader that the main purpose of this study was to organize and collect organic vegetable crop production and marketing cost information in order to assist organic growers and lenders in the estimation of crop costs and returns.
The eight organic vegetable study crops were fresh market broccoli, kale, tomatoes, sweet corn, salad mix, leaf lettuce, peppers, and summer squash. During and after the growing season, in-person and phone interviews were conducted with all
5
cooperators to be sure that they understood our request for detailed information and we understood how they recorded the information. Grower information was used to develop organic cost and revenue estimates that are reported in a series of tables in this report. Cost and revenue information recorded by cooperators was reorganized in such a way as to present the information in a commodity ‘enterprise budget’ format. A budget is a useful planning tool that organizes financial information to provide one measure of total cost and total returns. Since annual budgets are annual financial plans, a series of annual budgets can provide information about how farm income has changed in response to crop and/or livestock decisions. Several types of enterprise budgets exist. One type of budget summarizes expected cost and revenue information using historic or expected values obtained from experienced growers. In most instances, cultural practices and grower activities are based on expected situations and recommended practices, the use of standard but new equipment, and growers expect to encounter typical market conditions and expected weather. Oftentimes, cooperative extension service specialists publish commodity budgets based on these assumptions plus expected yields.
Alternately, enterprise budgets can be based on actual records kept by growers. There is no historic or expected value data published for organic vegetables grown in the southeastern U.S., so we elected to collect actual production cost data and organize the information into the form of an enterprise budget. This type of budget provides data based on real costs and activities but it only represents one season of data. Values can change season-to-season because of the variations in weather, insect and disease pressure and market. For example, in this study and in other situations, growers lose crops due to a variety of reasons, including disease or pest pressures. Organic growers and lenders should recognize that the organic practices and outcomes in this study reflect actions taken by individual growers, which may not necessarily reflect a recommended practice. Next year the same cooperator might change a cultural practice, may experience fewer or greater pest pressures, or may decide to grow another commodity. Agricultural production is a dynamic process and some factors are beyond the control of growers such as weather and market price. Accurate records about what occur red may not serve as a good predictor of what will happen the following year, but can provide valuable information for predicting or estimating outcomes for planning and budgetary processes.
Each grower possesses a unique mix of resources such as access to land, equipment, and money, plant production experience, time availability, marketing expertise, and management training. Success is rarely achieved by simply duplicating resources since each situation and circumstance is unique. If you have no experience growing this crop, we recommend that you establish your fixed costs based on your specific situation and use values presented here to assist you in estimating variable costs if you utilize similar production methods. We also recommend that you establish a thorough recordkeeping system to record income, inputs, activities, and expenses to help you measure profitability and improve your farming operation. You will be required to keep these records as a certified organic farm under the USDA’s new National Organic Program standards.
6
Revenue and Cost Categories To analyze budget information, it is best to organize revenues (income) and costs
(expenses) into major categories. Total revenue for a crop is the sum of daily and weekly sales transactions. Total revenue for a farm is the sum of all income received for product sold or services provided. Usually costs are recognized as either: 1) a variable or operating cost; or 2) a fixed cost. Variable costs are expenses that occur only if a crop is grown and change as output changes. Oftentimes, a grower thinks of variable costs as “out-of-pocket” expenses involving expenditures of money. Typical variable costs include many cultural production expenses such as the plant or seed costs, soil nutrient amendment costs, pest control practices, harvest labor, interest on borrowed money, and marketing expenses. Fixed costs generally remain the same irrespective of how much crop is planted. Total fixed cost does not change with output. Typical fixed costs include land, equipment and machinery, property taxes, and insurance. Variable or Operating Costs
Variable or operating costs are expenses associated directly with growing and marketing the crop. In fact, most cash production and marketing outlays are variable costs related to the production or marketing of the crop. Numerous examples of variable costs exist and in this study they were divided into three categories, cultural costs, wages paid to employees, and marketing expenses. Cultural costs included in this study:
• Cover crop seed • Crop seed • Trays/potting mix • Plastic mulch • Row covers • Fertilizers • Pest management products • Boxes, bins, and bags • Equipment rental • Ice • General supplies associated with the crop Labor is a unique variable cost because it can be performed by the farmer-owner or
by hired employees. It might be viewed as a fixed cost if it is the farmer-owner or salaried employee. For the purposes of this study we asked that the farmer keep track of their employee’s hours associated with the crop so we included this expense as a part of variable costs.
Typical marketing expenses included: • harvest buckets • roundtrip mileage to market • farmers market dues

7
• cooperative selling fees • sales display tables • tents • advertising circulars • internet access
If money were borrowed to purchase inputs, then interest paid on borrowed
money was considered a variable cost. We did not collect data for this type study. Some machinery and equipment costs included a variable cost component. For example, tractors, pickup trucks, or an irrigation pump required fuel and oil to operate so fuel and oil costs varied with the amount of time each item operates. Hourly machinery and equipment costs were estimated and included with each commodity operating cost component. Fixed Costs
Fixed costs are the same irrespective of the amount of crops planted. Calculating fixed costs has many variables and should be approached with caution or in consultation with a tax professional. Typical examples of fixed costs included:
• land • equipment and machinery • property taxes • insurance
The fixed costs associated with land are usually ownership costs such as mortgage payments and property taxes. Land is critical and necessary production input but in this study, as in many others, land was excluded as a cost consideration unless land was rented (variable cost) or there existed a mortgage payment (fixed cost).
Fixed costs for equipment and machinery can be generated by using tax values or by using economic life values for assets. Tax values are often regulated by statute, are subject to review by an accounting board, and are usually less than an asset’s useful economic life. For tax purposes, most farm machinery and equipment is identified as 3, 7, or 10-year property and the value of the asset is written off in 3, 7, or 10 years. Economic life values are based on economic useful life and often range between 10 and 20 years. For example, a $3,500 irrigation system can have an economic useful life of 10 years (for the main pump, filter, and frame) while its tax life is 7 years. The annual average fixed cost for the $3,500 irrigation system is $350 if one assumes an economic life of 10 years ($3,500 / 10 years minus zero salvage value). Alternatively, the annual average fixed cost for the same $3,500 irrigation system is $500 if the cost is based on its tax life ($3,500 / 7 minus zero salvage). Thus, the tax-based approach results in a 43% higher annual average fixed cost than does the economic-based approach. It is useful to recognize that either approach provided a correct estimate of annual fixed cost. If a grower has earned a lot of income and wished to pay less income tax, then the grower would be interested in the higher average fixed cost approach, that is, the grower would prefer the tax life
8
calculation approach. It should be clear, however, that selection of ‘economic versus tax life’ approach provides different answers to the question of “what is the annual average fixed cost for the $3,500 irrigation system”?
In addition to the annual fixed cost and variable cost, machinery and equipment can also have an ownership expense. An ownership expense is the cost incurred simply because you continue to own a long-term asset. For example, a farm pickup truck or a tractor may be insured so the insurance premium is considered an ownership cost. The average annual fixed cost plus the variable operating cost plus the annual ownership cost equals the total annual cost for the machinery or equipment. Types of machinery and equipment identified by study cooperators included:
• greenhouses • irrigation equipment • specialized tools • rotovators • tillage and planting equipment • tractors • water pumps • motors • filters • nozzles • coolers
Organic growers also incur a special category of fixed costs such as organic certification fees that are paid annually.
In most cases, machinery, equipment, and ownership costs are not specifically linked to one commodity so the annual cost of the item must be prorated across multiple crops. There exist several acceptable prorating methods to allocate fixed costs but for this study we elected to use a method that apportions cost based on the area grown of a commodity relative to the total crop production area. For example, if total planted crop area is 10 acres and the planted area of the study commodity (say sweet corn) was 1 acre, then 10 percent of the average annual machinery, equipment, and ownership fixed cost would be allocated to sweet corn in the production budget. Annual average fixed cost for all equipment and machinery was calculated by developing a list of all farm machinery and equipment, developing initial purchase prices for each item, summing up machinery and equipment values, and then dividing the total by the expected economic life (assumed to be 10 years). Total Costs
The sum of total annual fixed cost, total annual ownership cost, total hired labor
costs, total marketing costs, and other total variable costs such as cultural costs resulted in estimation of total crop cost. In addition, grower-cooperator labor time (in hours) and management is reported but for budgeting purposes it as well as land are not valued as a cost of production. In this study, we allocated annual fixed costs to a commodity by comparing the total cropland area to the planted commodity area.
9
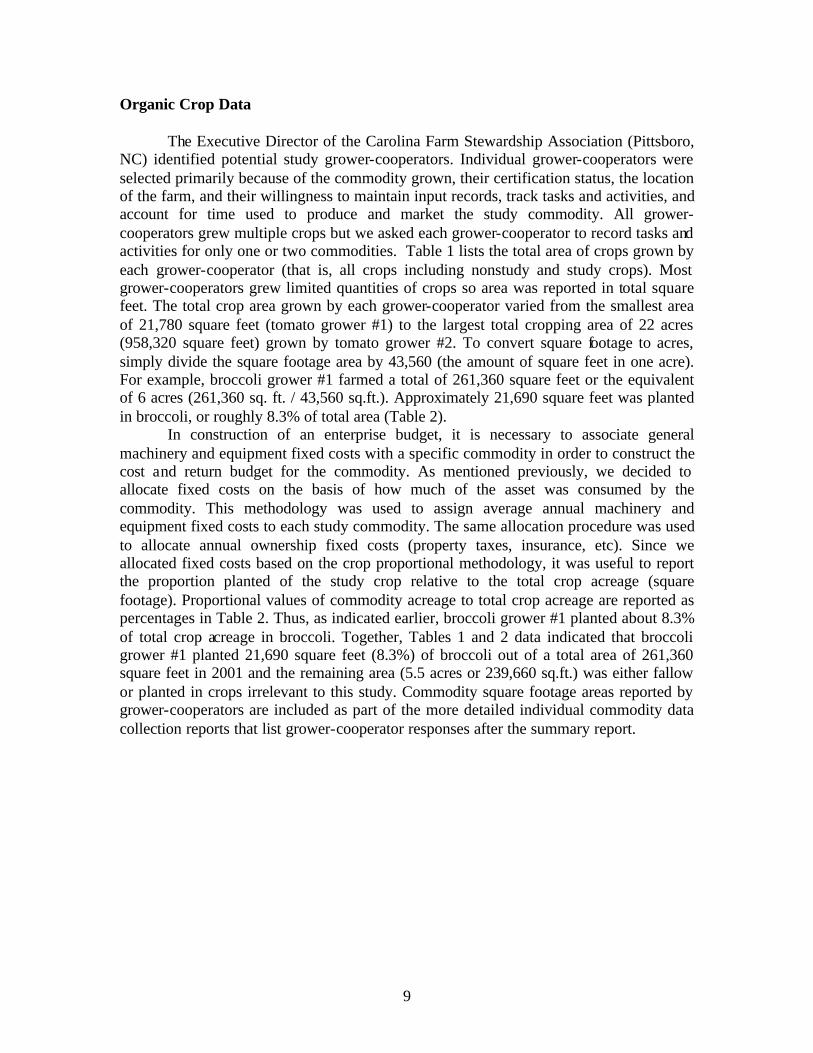
Organic Crop Data The Executive Director of the Carolina Farm Stewardship Association (Pittsboro,
NC) identified potential study grower-cooperators. Individual grower-cooperators were selected primarily because of the commodity grown, their certification status, the location of the farm, and their willingness to maintain input records, track tasks and activities, and account for time used to produce and market the study commodity. All grower-cooperators grew multiple crops but we asked each grower-cooperator to record tasks and activities for only one or two commodities. Table 1 lists the total area of crops grown by each grower-cooperator (that is, all crops including nonstudy and study crops). Most grower-cooperators grew limited quantities of crops so area was reported in total square feet. The total crop area grown by each grower-cooperator varied from the smallest area of 21,780 square feet (tomato grower #1) to the largest total cropping area of 22 acres (958,320 square feet) grown by tomato grower #2. To convert square footage to acres, simply divide the square footage area by 43,560 (the amount of square feet in one acre). For example, broccoli grower #1 farmed a total of 261,360 square feet or the equivalent of 6 acres (261,360 sq. ft. / 43,560 sq.ft.). Approximately 21,690 square feet was planted in broccoli, or roughly 8.3% of total area (Table 2).
In construction of an enterprise budget, it is necessary to associate general machinery and equipment fixed costs with a specific commodity in order to construct the cost and return budget for the commodity. As mentioned previously, we decided to allocate fixed costs on the basis of how much of the asset was consumed by the commodity. This methodology was used to assign average annual machinery and equipment fixed costs to each study commodity. The same allocation procedure was used to allocate annual ownership fixed costs (property taxes, insurance, etc). Since we allocated fixed costs based on the crop proportional methodology, it was useful to report the proportion planted of the study crop relative to the total crop acreage (square footage). Proportional values of commodity acreage to total crop acreage are reported as percentages in Table 2. Thus, as indicated earlier, broccoli grower #1 planted about 8.3% of total crop acreage in broccoli. Together, Tables 1 and 2 data indicated that broccoli grower #1 planted 21,690 square feet (8.3%) of broccoli out of a total area of 261,360 square feet in 2001 and the remaining area (5.5 acres or 239,660 sq.ft.) was either fallow or planted in crops irrelevant to this study. Commodity square footage areas reported by grower-cooperators are included as part of the more detailed individual commodity data collection reports that list grower-cooperator responses after the summary report.
10
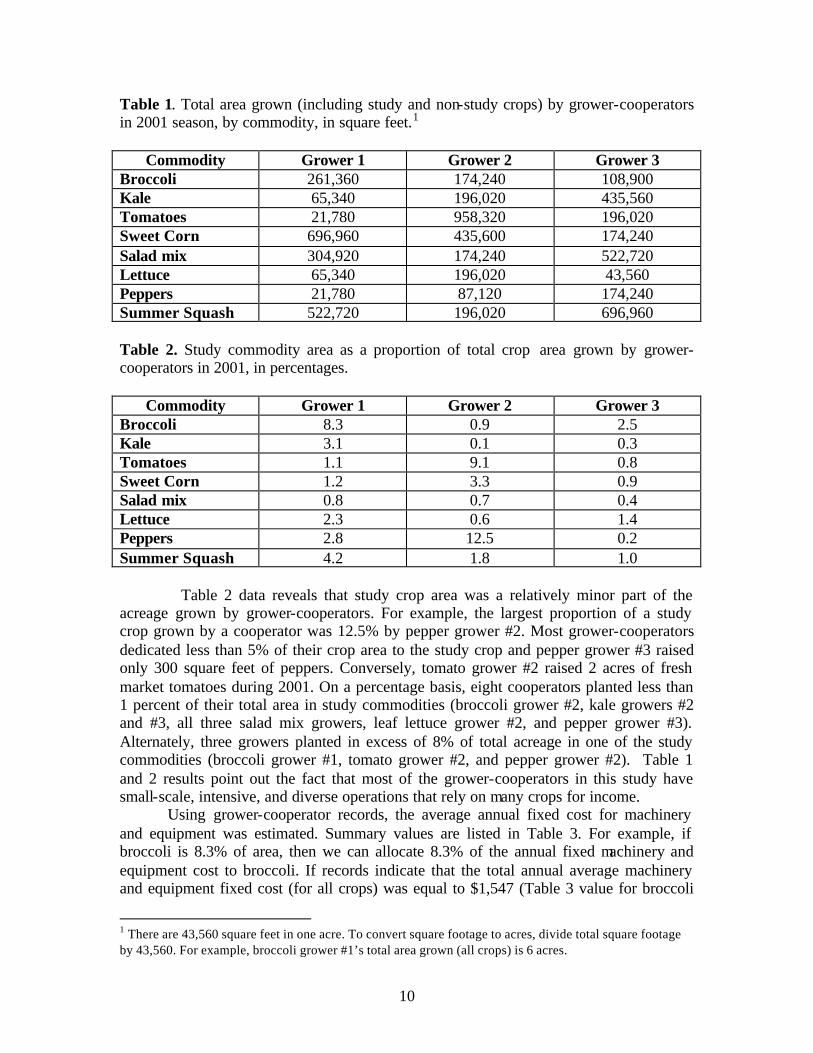
Table 1. Total area grown (including study and non-study crops) by grower-cooperators in 2001 season, by commodity, in square feet.1
Commodity Grower 1 Grower 2 Grower 3
Broccoli 261,360 174,240 108,900 Kale 65,340 196,020 435,560 Tomatoes 21,780 958,320 196,020 Sweet Corn 696,960 435,600 174,240 Salad mix 304,920 174,240 522,720 Lettuce 65,340 196,020 43,560 Peppers 21,780 87,120 174,240 Summer Squash 522,720 196,020 696,960 Table 2. Study commodity area as a proportion of total crop area grown by grower-cooperators in 2001, in percentages.
Commodity Grower 1 Grower 2 Grower 3 Broccoli 8.3 0.9 2.5 Kale 3.1 0.1 0.3 Tomatoes 1.1 9.1 0.8 Sweet Corn 1.2 3.3 0.9 Salad mix 0.8 0.7 0.4 Lettuce 2.3 0.6 1.4 Peppers 2.8 12.5 0.2 Summer Squash 4.2 1.8 1.0
Table 2 data reveals that study crop area was a relatively minor part of the acreage grown by grower-cooperators. For example, the largest proportion of a study crop grown by a cooperator was 12.5% by pepper grower #2. Most grower-cooperators dedicated less than 5% of their crop area to the study crop and pepper grower #3 raised only 300 square feet of peppers. Conversely, tomato grower #2 raised 2 acres of fresh market tomatoes during 2001. On a percentage basis, eight cooperators planted less than 1 percent of their total area in study commodities (broccoli grower #2, kale growers #2 and #3, all three salad mix growers, leaf lettuce grower #2, and pepper grower #3). Alternately, three growers planted in excess of 8% of total acreage in one of the study commodities (broccoli grower #1, tomato grower #2, and pepper grower #2). Table 1 and 2 results point out the fact that most of the grower-cooperators in this study have small-scale, intensive, and diverse operations that rely on many crops for income.
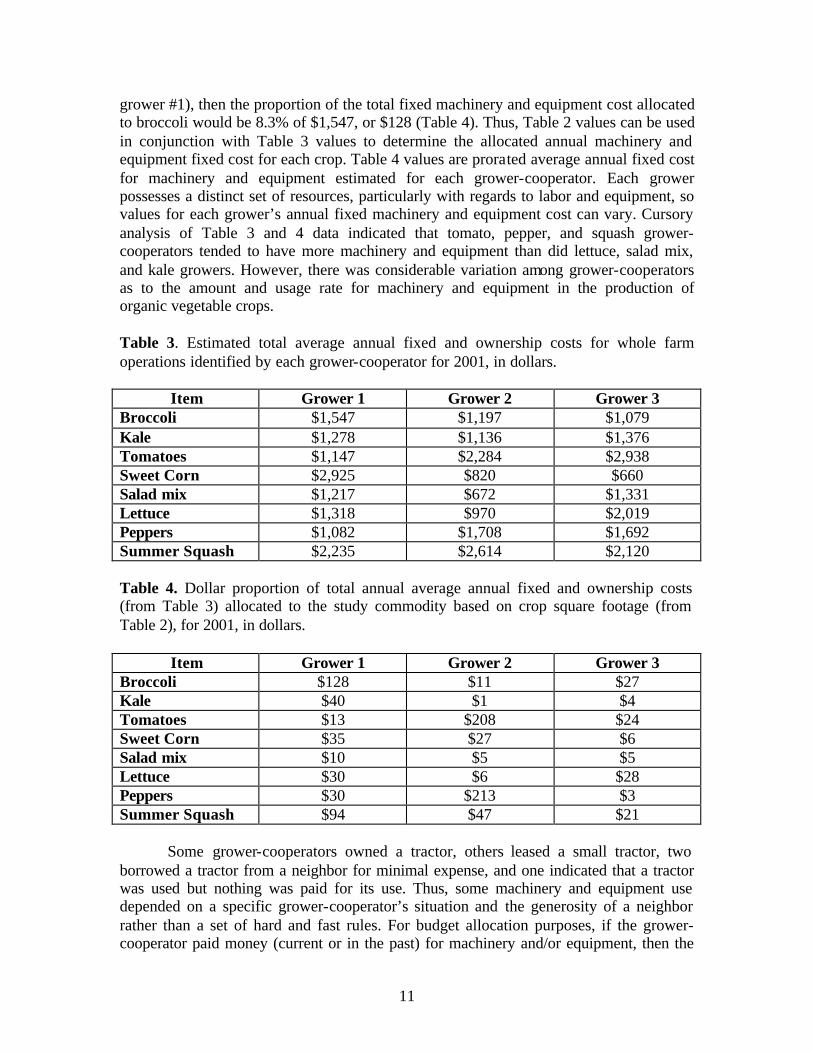
Using grower-cooperator records, the average annual fixed cost for machinery and equipment was estimated. Summary values are listed in Table 3. For example, if broccoli is 8.3% of area, then we can allocate 8.3% of the annual fixed machinery and equipment cost to broccoli. If records indicate that the total annual average machinery and equipment fixed cost (for all crops) was equal to $1,547 (Table 3 value for broccoli
1 There are 43,560 square feet in one acre. To convert square footage to acres, divide total square footage by 43,560. For example, broccoli grower #1’s total area grown (all crops) is 6 acres.
11
grower #1), then the proportion of the total fixed machinery and equipment cost allocated to broccoli would be 8.3% of $1,547, or $128 (Table 4). Thus, Table 2 values can be used in conjunction with Table 3 values to determine the allocated annual machinery and equipment fixed cost for each crop. Table 4 values are prorated average annual fixed cost for machinery and equipment estimated for each grower-cooperator. Each grower possesses a distinct set of resources, particularly with regards to labor and equipment, so values for each grower’s annual fixed machinery and equipment cost can vary. Cursory analysis of Table 3 and 4 data indicated that tomato, pepper, and squash grower-cooperators tended to have more machinery and equipment than did lettuce, salad mix, and kale growers. However, there was considerable variation among grower-cooperators as to the amount and usage rate for machinery and equipment in the production of organic vegetable crops. Table 3. Estimated total average annual fixed and ownership costs for whole farm operations identified by each grower-cooperator for 2001, in dollars.
Item Grower 1 Grower 2 Grower 3 Broccoli $1,547 $1,197 $1,079 Kale $1,278 $1,136 $1,376 Tomatoes $1,147 $2,284 $2,938 Sweet Corn $2,925 $820 $660 Salad mix $1,217 $672 $1,331 Lettuce $1,318 $970 $2,019 Peppers $1,082 $1,708 $1,692 Summer Squash $2,235 $2,614 $2,120 Table 4. Dollar proportion of total annual average annual fixed and ownership costs (from Table 3) allocated to the study commodity based on crop square footage (from Table 2), for 2001, in dollars.
Item Grower 1 Grower 2 Grower 3 Broccoli $128 $11 $27 Kale $40 $1 $4 Tomatoes $13 $208 $24 Sweet Corn $35 $27 $6 Salad mix $10 $5 $5 Lettuce $30 $6 $28 Peppers $30 $213 $3 Summer Squash $94 $47 $21
Some grower-cooperators owned a tractor, others leased a small tractor, two borrowed a tractor from a neighbor for minimal expense, and one indicated that a tractor was used but nothing was paid for its use. Thus, some machinery and equipment use depended on a specific grower-cooperator’s situation and the generosity of a neighbor rather than a set of hard and fast rules. For budget allocation purposes, if the grower-cooperator paid money (current or in the past) for machinery and/or equipment, then the
12
cash expenditure cost was recognized. Conversely, if cash was not paid then cost was not recognized.
Labor Cost
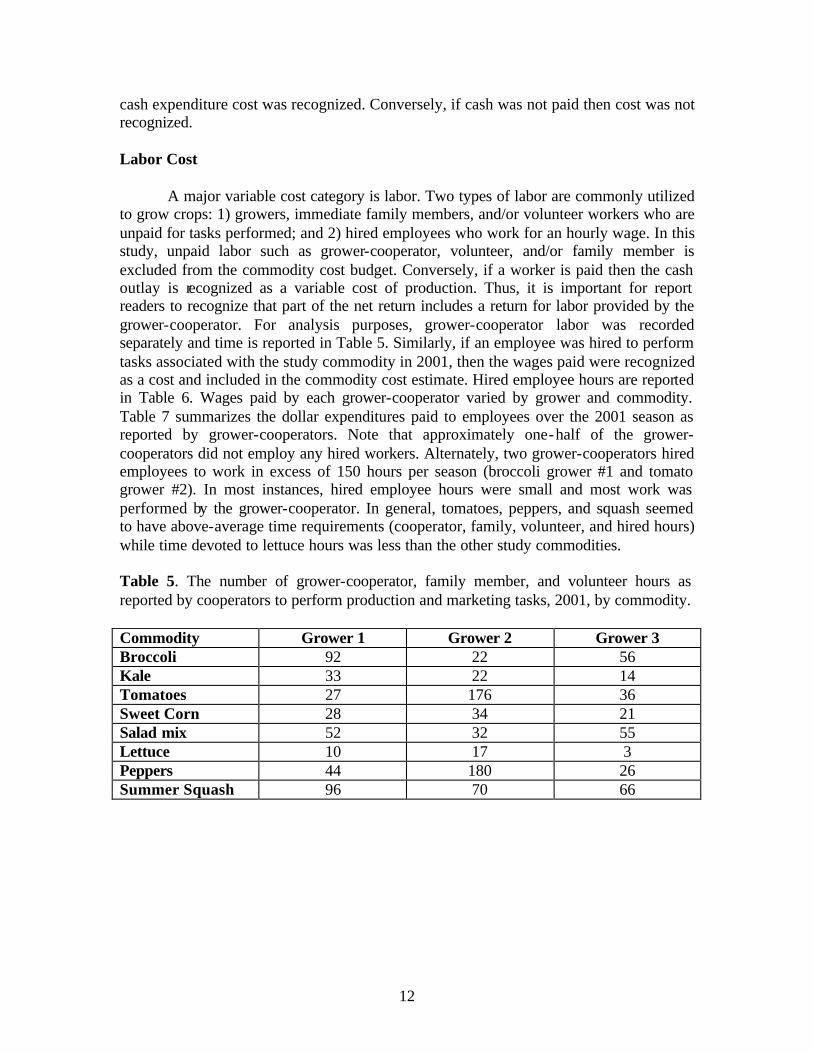
A major variable cost category is labor. Two types of labor are commonly utilized to grow crops: 1) growers, immediate family members, and/or volunteer workers who are unpaid for tasks performed; and 2) hired employees who work for an hourly wage. In this study, unpaid labor such as grower-cooperator, volunteer, and/or family member is excluded from the commodity cost budget. Conversely, if a worker is paid then the cash outlay is recognized as a variable cost of production. Thus, it is important for report readers to recognize that part of the net return includes a return for labor provided by the grower-cooperator. For analysis purposes, grower-cooperator labor was recorded separately and time is reported in Table 5. Similarly, if an employee was hired to perform tasks associated with the study commodity in 2001, then the wages paid were recognized as a cost and included in the commodity cost estimate. Hired employee hours are reported in Table 6. Wages paid by each grower-cooperator varied by grower and commodity. Table 7 summarizes the dollar expenditures paid to employees over the 2001 season as reported by grower-cooperators. Note that approximately one-half of the grower-cooperators did not employ any hired workers. Alternately, two grower-cooperators hired employees to work in excess of 150 hours per season (broccoli grower #1 and tomato grower #2). In most instances, hired employee hours were small and most work was performed by the grower-cooperator. In general, tomatoes, peppers, and squash seemed to have above-average time requirements (cooperator, family, volunteer, and hired hours) while time devoted to lettuce hours was less than the other study commodities.
Table 5. The number of grower-cooperator, family member, and volunteer hours as reported by cooperators to perform production and marketing tasks, 2001, by commodity. Commodity Grower 1 Grower 2 Grower 3 Broccoli 92 22 56 Kale 33 22 14 Tomatoes 27 176 36 Sweet Corn 28 34 21 Salad mix 52 32 55 Lettuce 10 17 3 Peppers 44 180 26 Summer Squash 96 70 66
13
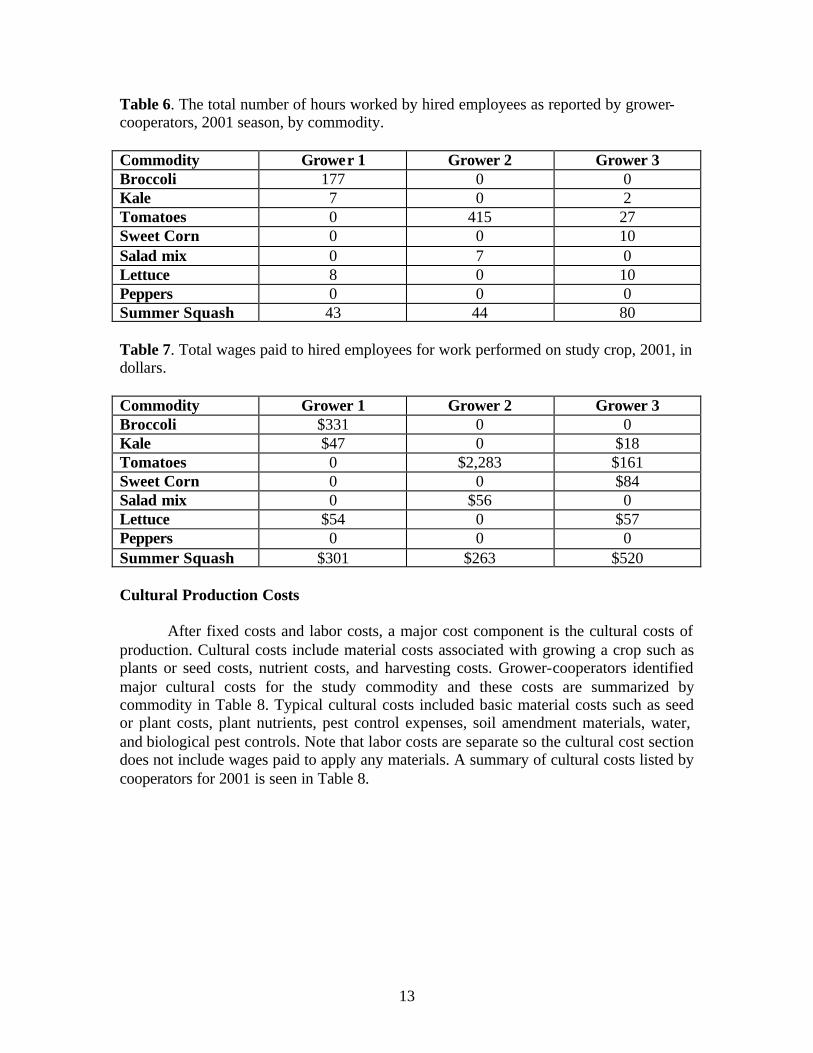
Table 6. The total number of hours worked by hired employees as reported by grower-cooperators, 2001 season, by commodity. Commodity Grower 1 Grower 2 Grower 3 Broccoli 177 0 0 Kale 7 0 2 Tomatoes 0 415 27 Sweet Corn 0 0 10 Salad mix 0 7 0 Lettuce 8 0 10 Peppers 0 0 0 Summer Squash 43 44 80 Table 7. Total wages paid to hired employees for work performed on study crop, 2001, in dollars. Commodity Grower 1 Grower 2 Grower 3 Broccoli $331 0 0 Kale $47 0 $18 Tomatoes 0 $2,283 $161 Sweet Corn 0 0 $84 Salad mix 0 $56 0 Lettuce $54 0 $57 Peppers 0 0 0 Summer Squash $301 $263 $520 Cultural Production Costs
After fixed costs and labor costs, a major cost component is the cultural costs of production. Cultural costs include material costs associated with growing a crop such as plants or seed costs, nutrient costs, and harvesting costs. Grower-cooperators identified major cultural costs for the study commodity and these costs are summarized by commodity in Table 8. Typical cultural costs included basic material costs such as seed or plant costs, plant nutrients, pest control expenses, soil amendment materials, water, and biological pest controls. Note that labor costs are separate so the cultural cost section does not include wages paid to apply any materials. A summary of cultural costs listed by cooperators for 2001 is seen in Table 8.
14
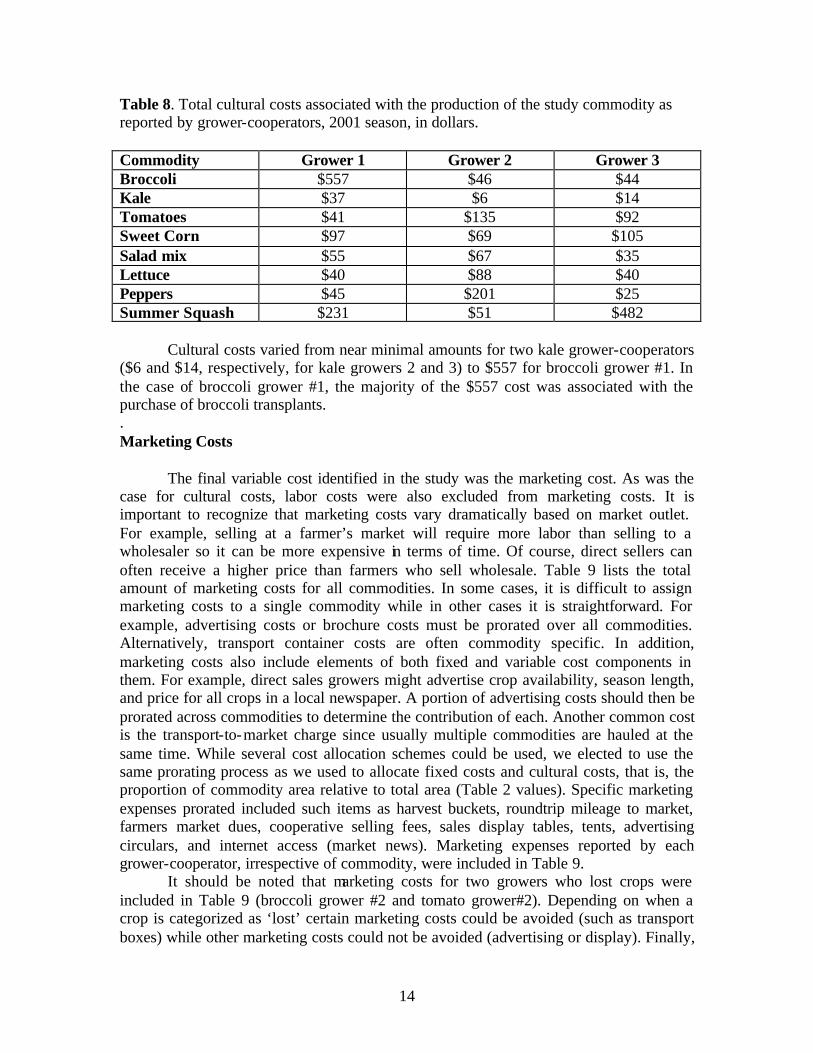
Table 8. Total cultural costs associated with the production of the study commodity as reported by grower-cooperators, 2001 season, in dollars. Commodity Grower 1 Grower 2 Grower 3 Broccoli $557 $46 $44 Kale $37 $6 $14 Tomatoes $41 $135 $92 Sweet Corn $97 $69 $105 Salad mix $55 $67 $35 Lettuce $40 $88 $40 Peppers $45 $201 $25 Summer Squash $231 $51 $482
Cultural costs varied from near minimal amounts for two kale grower-cooperators ($6 and $14, respectively, for kale growers 2 and 3) to $557 for broccoli grower #1. In the case of broccoli grower #1, the majority of the $557 cost was associated with the purchase of broccoli transplants. . Marketing Costs
The final variable cost identified in the study was the marketing cost. As was the case for cultural costs, labor costs were also excluded from marketing costs. It is important to recognize that marketing costs vary dramatically based on market outlet. For example, selling at a farmer’s market will require more labor than selling to a wholesaler so it can be more expensive in terms of time. Of course, direct sellers can often receive a higher price than farmers who sell wholesale. Table 9 lists the total amount of marketing costs for all commodities. In some cases, it is difficult to assign marketing costs to a single commodity while in other cases it is straightforward. For example, advertising costs or brochure costs must be prorated over all commodities. Alternatively, transport container costs are often commodity specific. In addition, marketing costs also include elements of both fixed and variable cost components in them. For example, direct sales growers might advertise crop availability, season length, and price for all crops in a local newspaper. A portion of advertising costs should then be prorated across commodities to determine the contribution of each. Another common cost is the transport-to-market charge since usually multiple commodities are hauled at the same time. While several cost allocation schemes could be used, we elected to use the same prorating process as we used to allocate fixed costs and cultural costs, that is, the proportion of commodity area relative to total area (Table 2 values). Specific marketing expenses prorated included such items as harvest buckets, roundtrip mileage to market, farmers market dues, cooperative selling fees, sales display tables, tents, advertising circulars, and internet access (market news). Marketing expenses reported by each grower-cooperator, irrespective of commodity, were included in Table 9.
It should be noted that marketing costs for two growers who lost crops were included in Table 9 (broccoli grower #2 and tomato grower#2). Depending on when a crop is categorized as ‘lost’ certain marketing costs could be avoided (such as transport boxes) while other marketing costs could not be avoided (advertising or display). Finally,
15
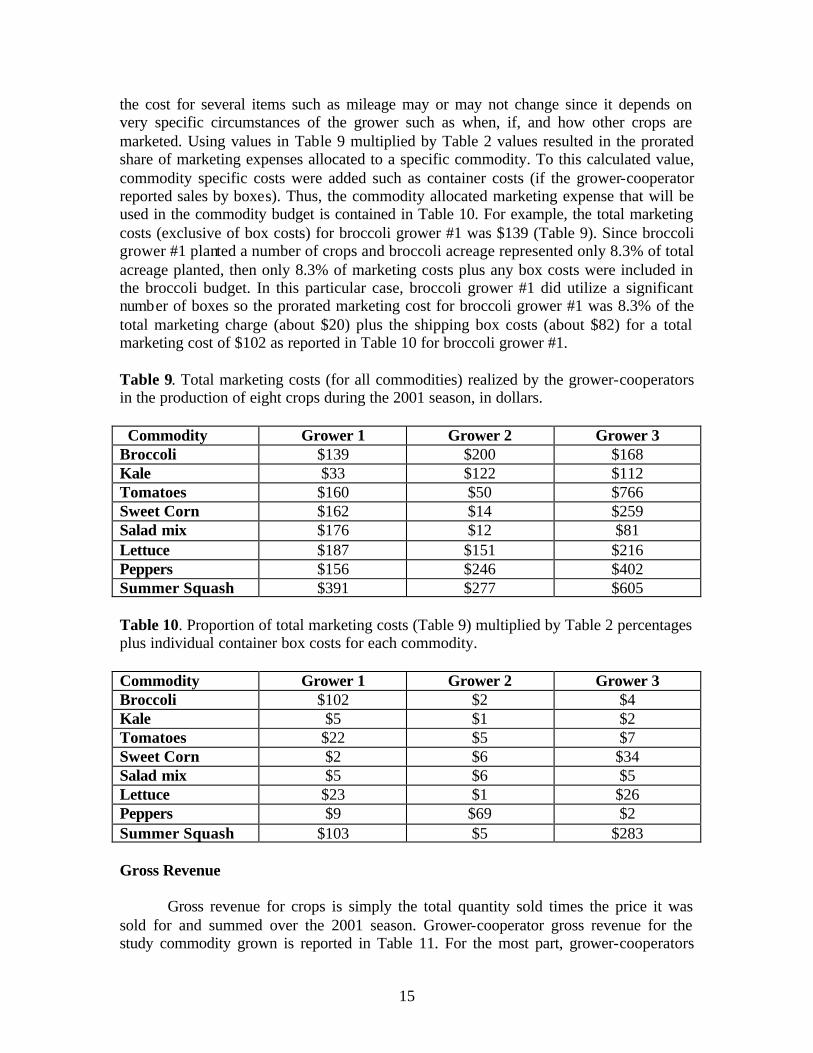
the cost for several items such as mileage may or may not change since it depends on very specific circumstances of the grower such as when, if, and how other crops are marketed. Using values in Table 9 multiplied by Table 2 values resulted in the prorated share of marketing expenses allocated to a specific commodity. To this calculated value, commodity specific costs were added such as container costs (if the grower-cooperator reported sales by boxes). Thus, the commodity allocated marketing expense that will be used in the commodity budget is contained in Table 10. For example, the total marketing costs (exclusive of box costs) for broccoli grower #1 was $139 (Table 9). Since broccoli grower #1 planted a number of crops and broccoli acreage represented only 8.3% of total acreage planted, then only 8.3% of marketing costs plus any box costs were included in the broccoli budget. In this particular case, broccoli grower #1 did utilize a significant number of boxes so the prorated marketing cost for broccoli grower #1 was 8.3% of the total marketing charge (about $20) plus the shipping box costs (about $82) for a total marketing cost of $102 as reported in Table 10 for broccoli grower #1.
Table 9. Total marketing costs (for all commodities) realized by the grower-cooperators in the production of eight crops during the 2001 season, in dollars. Commodity Grower 1 Grower 2 Grower 3 Broccoli $139 $200 $168 Kale $33 $122 $112 Tomatoes $160 $50 $766 Sweet Corn $162 $14 $259 Salad mix $176 $12 $81 Lettuce $187 $151 $216 Peppers $156 $246 $402 Summer Squash $391 $277 $605
Table 10. Proportion of total marketing costs (Table 9) multiplied by Table 2 percentages plus individual container box costs for each commodity. Commodity Grower 1 Grower 2 Grower 3 Broccoli $102 $2 $4 Kale $5 $1 $2 Tomatoes $22 $5 $7 Sweet Corn $2 $6 $34 Salad mix $5 $6 $5 Lettuce $23 $1 $26 Peppers $9 $69 $2 Summer Squash $103 $5 $283 Gross Revenue
Gross revenue for crops is simply the total quantity sold times the price it was sold for and summed over the 2001 season. Grower-cooperator gross revenue for the study commodity grown is reported in Table 11. For the most part, grower-cooperators

16
simply calculated the 2001 gross revenue for the study commodity and simply listed the figure on the recorded sheet. Broccoli grower #2 and tomato grower #2 lost their crop during the season so gross revenues were zero. One-fourth of the grower-cooperators (6) reported gross sales in excess of $1,000 while three grower-cooperators (plus the grower who lost the crop) had gross sales of less than $100. Table 11. Gross Revenue as reported by grower-cooperators for the production of the study commodity, 2001, in dollars. Commodity Grower 1 Grower 2 Grower 3 Broccoli $1,601 $0 $315 Kale $311 $65 $135 Tomatoes $781 $0 $3,100 Sweet Corn $520 $60 $768 Salad mix $284 $970 $1,267 Lettuce $265 $188 $616 Peppers $45 $878 $710 Summer Squash $1,982 $602 $4,590
If all prorated fixed and variable costs are summed by grower-cooperator by commodity for the 2001 season then you obtain the total cost values listed In Table 12. Of course, total cost varied by grower-cooperators because of distinct methods of marketing, the amount of hired versus grower-cooperator labor contributed, the amount of machinery and equipment purchased and used, and the total crop production (volume). As might be expected, the largest total cost was associated with the largest area planted (tomato grower #2). Unfortunately, this grower also experienced serious disease problems so the entire tomato crop was lost. Crop quality problems were experienced by a number of conventional and organic tomato growers throughout the state so this problem was not an isolated problem unique to study cooperators in 2001. The main disease problem among eastern NC tomato growers was tomato spotted wilt. In general, the lettuce and salad mix producers recorded the lowest costs by commodity group.
17
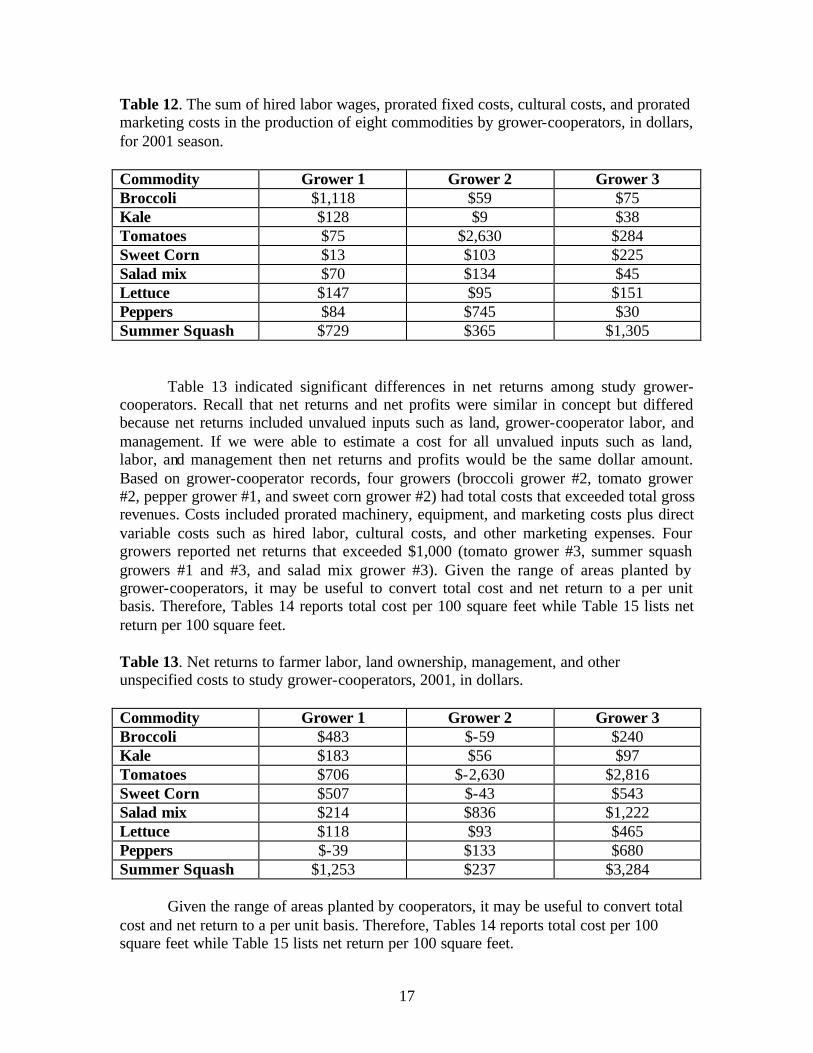
Table 12. The sum of hired labor wages, prorated fixed costs, cultural costs, and prorated marketing costs in the production of eight commodities by grower-cooperators, in dollars, for 2001 season. Commodity Grower 1 Grower 2 Grower 3 Broccoli $1,118 $59 $75 Kale $128 $9 $38 Tomatoes $75 $2,630 $284 Sweet Corn $13 $103 $225 Salad mix $70 $134 $45 Lettuce $147 $95 $151 Peppers $84 $745 $30 Summer Squash $729 $365 $1,305
Table 13 indicated significant differences in net returns among study grower-cooperators. Recall that net returns and net profits were similar in concept but differed because net returns included unvalued inputs such as land, grower-cooperator labor, and management. If we were able to estimate a cost for all unvalued inputs such as land, labor, and management then net returns and profits would be the same dollar amount. Based on grower-cooperator records, four growers (broccoli grower #2, tomato grower #2, pepper grower #1, and sweet corn grower #2) had total costs that exceeded total gross revenues. Costs included prorated machinery, equipment, and marketing costs plus direct variable costs such as hired labor, cultural costs, and other marketing expenses. Four growers reported net returns that exceeded $1,000 (tomato grower #3, summer squash growers #1 and #3, and salad mix grower #3). Given the range of areas planted by grower-cooperators, it may be useful to convert total cost and net return to a per unit basis. Therefore, Tables 14 reports total cost per 100 square feet while Table 15 lists net return per 100 square feet. Table 13. Net returns to farmer labor, land ownership, management, and other unspecified costs to study grower-cooperators, 2001, in dollars. Commodity Grower 1 Grower 2 Grower 3 Broccoli $483 $-59 $240 Kale $183 $56 $97 Tomatoes $706 $-2,630 $2,816 Sweet Corn $507 $-43 $543 Salad mix $214 $836 $1,222 Lettuce $118 $93 $465 Peppers $-39 $133 $680 Summer Squash $1,253 $237 $3,284
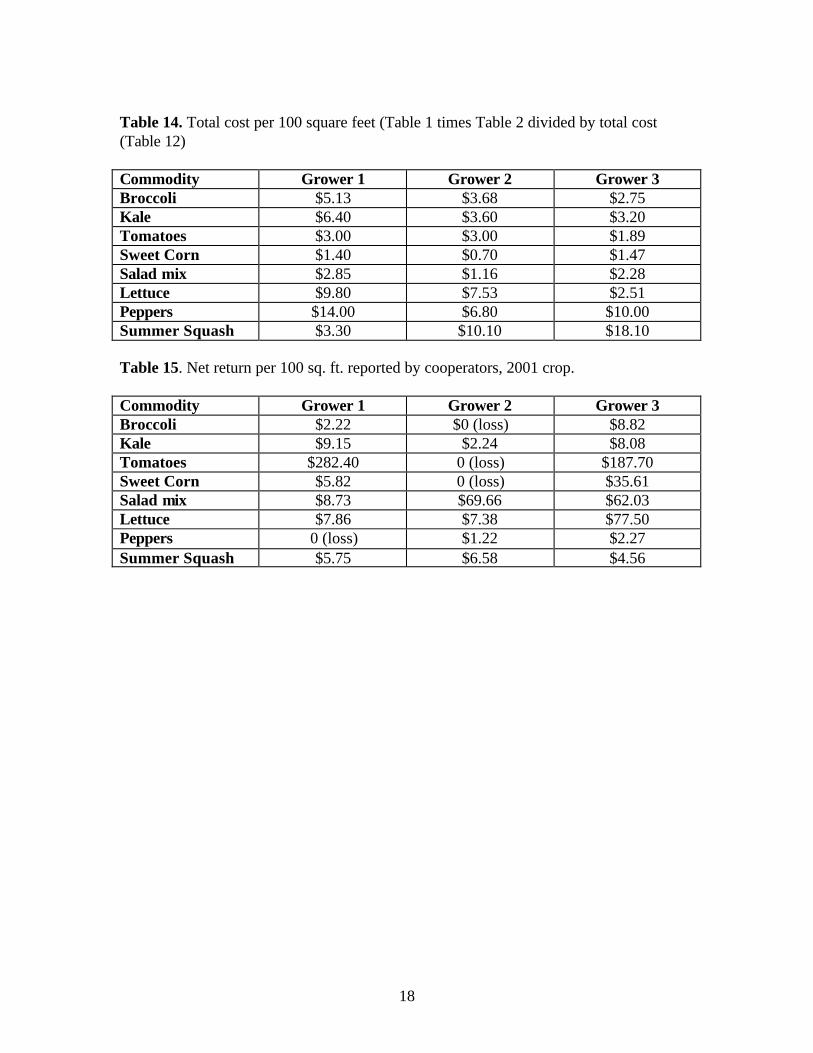
Given the range of areas planted by cooperators, it may be useful to convert total cost and net return to a per unit basis. Therefore, Tables 14 reports total cost per 100 square feet while Table 15 lists net return per 100 square feet.
18
Table 14. Total cost per 100 square feet (Table 1 times Table 2 divided by total cost (Table 12) Commodity Grower 1 Grower 2 Grower 3 Broccoli $5.13 $3.68 $2.75 Kale $6.40 $3.60 $3.20 Tomatoes $3.00 $3.00 $1.89 Sweet Corn $1.40 $0.70 $1.47 Salad mix $2.85 $1.16 $2.28 Lettuce $9.80 $7.53 $2.51 Peppers $14.00 $6.80 $10.00 Summer Squash $3.30 $10.10 $18.10 Table 15. Net return per 100 sq. ft. reported by cooperators, 2001 crop. Commodity Grower 1 Grower 2 Grower 3 Broccoli $2.22 $0 (loss) $8.82 Kale $9.15 $2.24 $8.08 Tomatoes $282.40 0 (loss) $187.70 Sweet Corn $5.82 0 (loss) $35.61 Salad mix $8.73 $69.66 $62.03 Lettuce $7.86 $7.38 $77.50 Peppers 0 (loss) $1.22 $2.27 Summer Squash $5.75 $6.58 $4.56
19
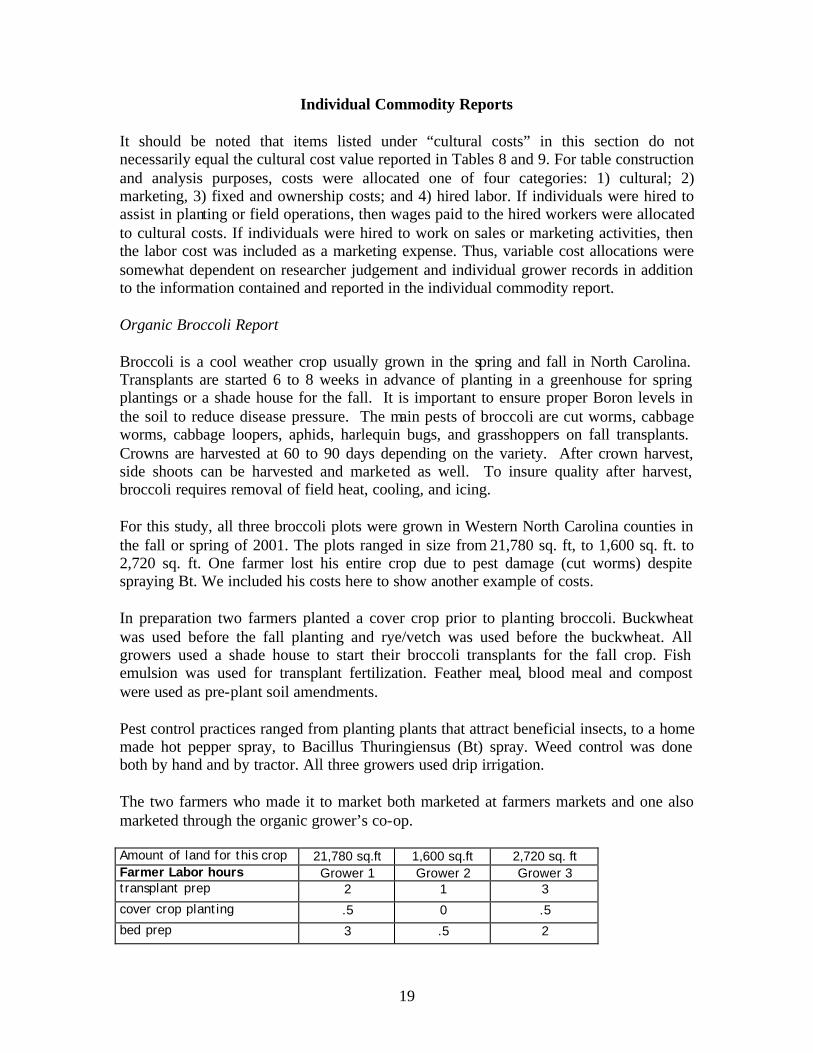
Individual Commodity Reports It should be noted that items listed under “cultural costs” in this section do not necessarily equal the cultural cost value reported in Tables 8 and 9. For table construction and analysis purposes, costs were allocated one of four categories: 1) cultural; 2) marketing, 3) fixed and ownership costs; and 4) hired labor. If individuals were hired to assist in planting or field operations, then wages paid to the hired workers were allocated to cultural costs. If individuals were hired to work on sales or marketing activities, then the labor cost was included as a marketing expense. Thus, variable cost allocations were somewhat dependent on researcher judgement and individual grower records in addition to the information contained and reported in the individual commodity report. Organic Broccoli Report Broccoli is a cool weather crop usually grown in the spring and fall in North Carolina. Transplants are started 6 to 8 weeks in advance of planting in a greenhouse for spring plantings or a shade house for the fall. It is important to ensure proper Boron levels in the soil to reduce disease pressure. The main pests of broccoli are cut worms, cabbage worms, cabbage loopers, aphids, harlequin bugs, and grasshoppers on fall transplants. Crowns are harvested at 60 to 90 days depending on the variety. After crown harvest, side shoots can be harvested and marketed as well. To insure quality after harvest, broccoli requires removal of field heat, cooling, and icing. For this study, all three broccoli plots were grown in Western North Carolina counties in the fall or spring of 2001. The plots ranged in size from 21,780 sq. ft, to 1,600 sq. ft. to 2,720 sq. ft. One farmer lost his entire crop due to pest damage (cut worms) despite spraying Bt. We included his costs here to show another example of costs. In preparation two farmers planted a cover crop prior to planting broccoli. Buckwheat was used before the fall planting and rye/vetch was used before the buckwheat. All growers used a shade house to start their broccoli transplants for the fall crop. Fish emulsion was used for transplant fertilization. Feather meal, blood meal and compost were used as pre-plant soil amendments. Pest control practices ranged from planting plants that attract beneficial insects, to a home made hot pepper spray, to Bacillus Thuringiensus (Bt) spray. Weed control was done both by hand and by tractor. All three growers used drip irrigation. The two farmers who made it to market both marketed at farmers markets and one also marketed through the organic grower’s co-op. Amount of land for this crop 21,780 sq.ft 1,600 sq.ft 2,720 sq. ft Farmer Labor hours Grower 1 Grower 2 Grower 3 transplant prep 2 1 3
cover crop planting .5 0 .5
bed prep 3 .5 2
20
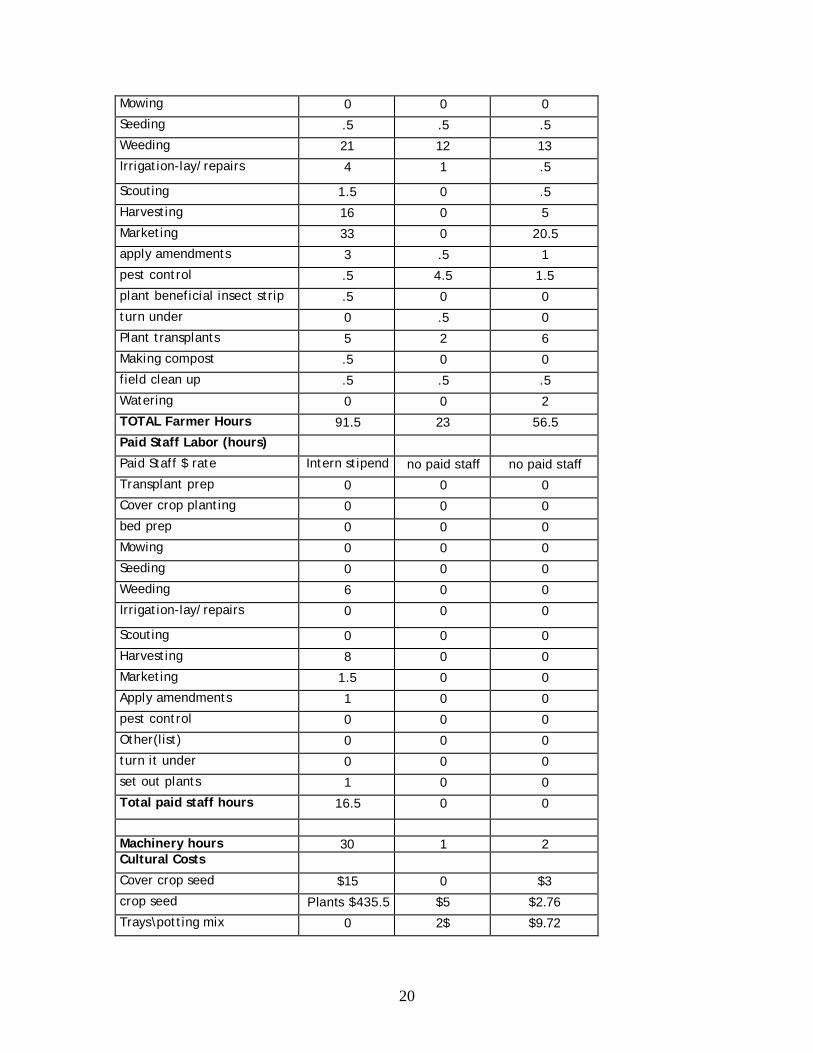
Mowing 0 0 0
Seeding .5 .5 .5
Weeding 21 12 13
Irrigation-lay/repairs 4 1 .5
Scouting 1.5 0 .5
Harvesting 16 0 5
Marketing 33 0 20.5
apply amendments 3 .5 1
pest control .5 4.5 1.5
plant beneficial insect strip .5 0 0
turn under 0 .5 0
Plant transplants 5 2 6
Making compost .5 0 0
field clean up .5 .5 .5
Watering 0 0 2
TOTAL Farmer Hours 91.5 23 56.5
Paid Staff Labor (hours)
Paid Staff $ rate Intern stipend no paid staff no paid staff
Transplant prep 0 0 0
Cover crop planting 0 0 0
bed prep 0 0 0
Mowing 0 0 0
Seeding 0 0 0
Weeding 6 0 0
Irrigation-lay/repairs 0 0 0
Scouting 0 0 0
Harvesting 8 0 0
Marketing 1.5 0 0
Apply amendments 1 0 0
pest control 0 0 0
Other(list) 0 0 0
turn it under 0 0 0
set out plants 1 0 0
Total paid staff hours 16.5 0 0
Machinery hours 30 1 2 Cultural Costs
Cover crop seed $15 0 $3
crop seed Plants $435.5 $5 $2.76
Trays\potting mix 0 2$ $9.72
21
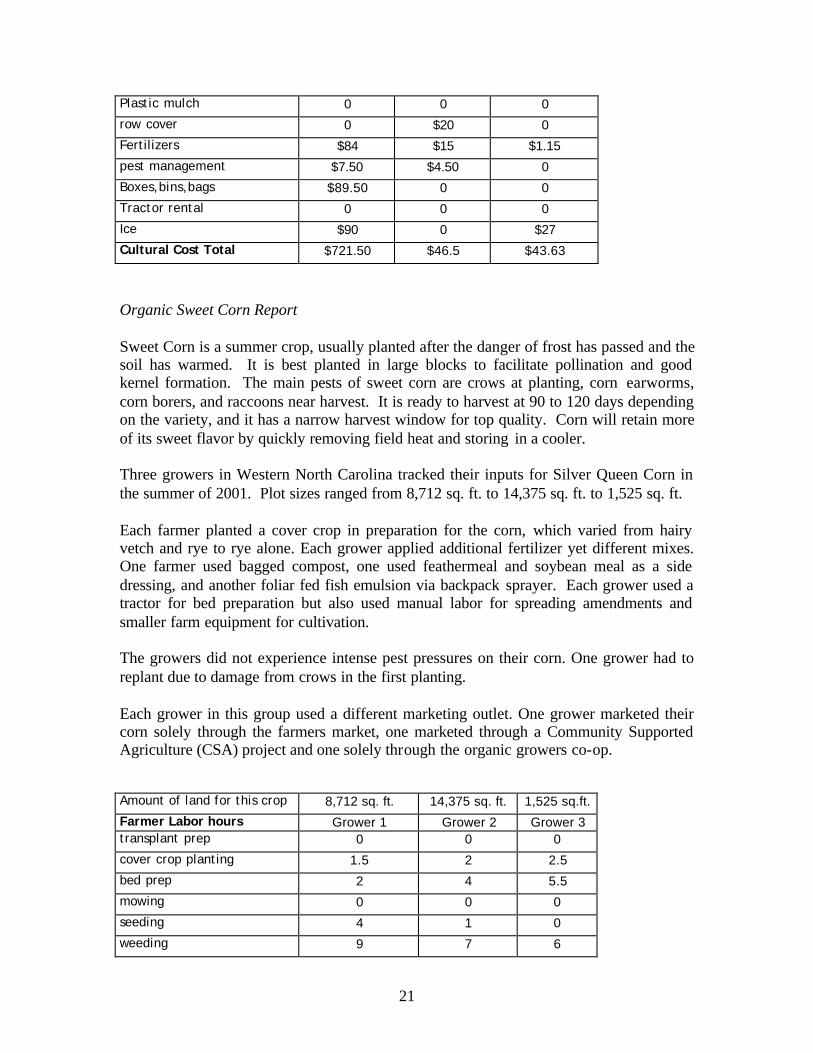
Plastic mulch 0 0 0
row cover 0 $20 0
Fertilizers $84 $15 $1.15
pest management $7.50 $4.50 0
Boxes,bins,bags $89.50 0 0
Tractor rental 0 0 0
Ice $90 0 $27
Cultural Cost Total $721.50 $46.5 $43.63
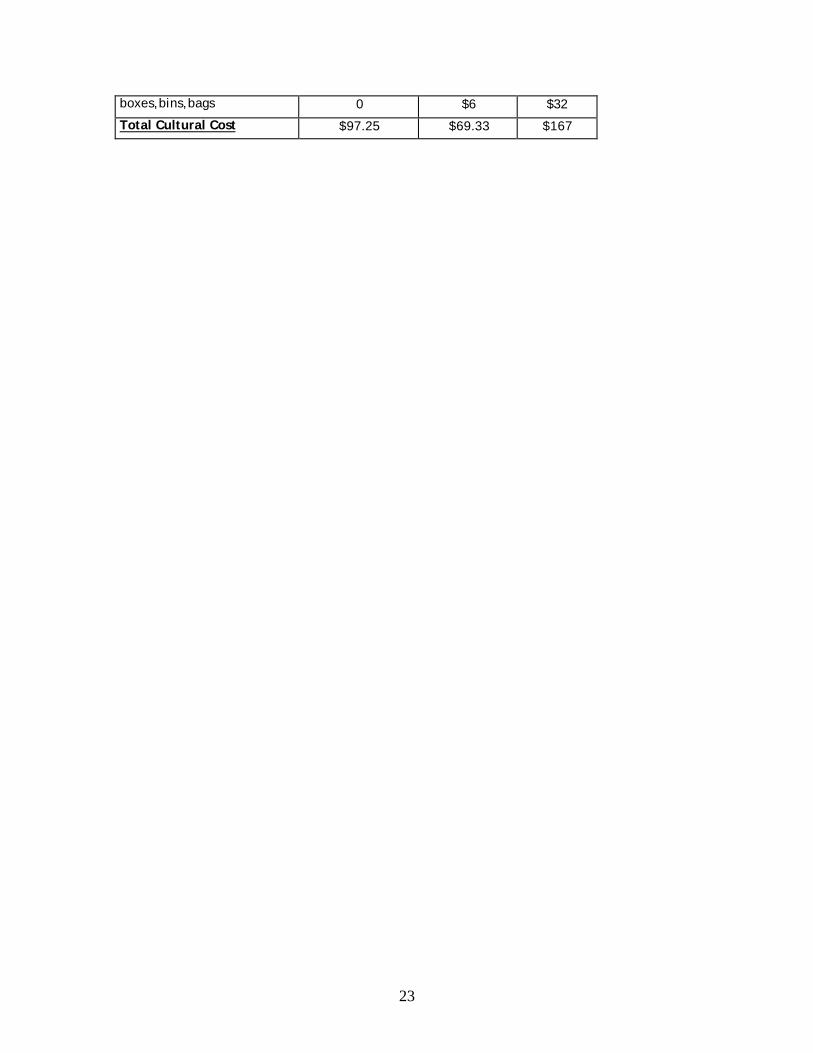
Organic Sweet Corn Report Sweet Corn is a summer crop, usually planted after the danger of frost has passed and the soil has warmed. It is best planted in large blocks to facilitate pollination and good kernel formation. The main pests of sweet corn are crows at planting, corn earworms, corn borers, and raccoons near harvest. It is ready to harvest at 90 to 120 days depending on the variety, and it has a narrow harvest window for top quality. Corn will retain more of its sweet flavor by quickly removing field heat and storing in a cooler. Three growers in Western North Carolina tracked their inputs for Silver Queen Corn in the summer of 2001. Plot sizes ranged from 8,712 sq. ft. to 14,375 sq. ft. to 1,525 sq. ft. Each farmer planted a cover crop in preparation for the corn, which varied from hairy vetch and rye to rye alone. Each grower applied additional fertilizer yet different mixes. One farmer used bagged compost, one used feathermeal and soybean meal as a side dressing, and another foliar fed fish emulsion via backpack sprayer. Each grower used a tractor for bed preparation but also used manual labor for spreading amendments and smaller farm equipment for cultivation. The growers did not experience intense pest pressures on their corn. One grower had to replant due to damage from crows in the first planting. Each grower in this group used a different marketing outlet. One grower marketed their corn solely through the farmers market, one marketed through a Community Supported Agriculture (CSA) project and one solely through the organic growers co-op. Amount of land for this crop 8,712 sq. ft. 14,375 sq. ft. 1,525 sq.ft.
Farmer Labor hours Grower 1 Grower 2 Grower 3 transplant prep 0 0 0
cover crop planting 1.5 2 2.5
bed prep 2 4 5.5
mowing 0 0 0
seeding 4 1 0
weeding 9 7 6

22
irrigation(lay/repairs 2 0 0
scouting 1 1 1
harvesting 4 1 6
marketing 2 1 6
apply amendments 2 1.5 0
pest control 0 2 0
other(list) 0 0 0 turn it under 0 0 0
plant transplants 0 0 0
thinning 1 0 0
Total Farmer Hours 28.5 20.5 27
Paid Staff Labor (hours) no paid staff no paid staff
Paid Staff $ rate 8$/hour
transplant prep 0 0 0
cover crop planting 0 0 0
bed prep 0 0 0
mowing 0 0 0
seeding 0 0 3
weeding 0 0 0
Irrigation-lay/repairs 0 0 0 scouting 0 0 0
harvesting 0 0 6
marketing 0 0 0
apply amendments 0 0 1
pest control 0 0 0
other(list) 0 0 0
turn it under 0 0 0
plant transplants 0 0 0
Total Paid Staff hours 0 0 10
Machinery hours 4.5 6.5 7.5
Cultural Cost
Cover crop seed $12 $22 $4
crop seed $36.25 $15 $26
trays\potting mix 0 0 0
plastic mulch 0 0 0
row cover 0 $8.33 0
fertilizers $49 $15 $105
pest management 0 $3 0
23
boxes,bins,bags 0 $6 $32
Total Cultural Cost $97.25 $69.33 $167
24
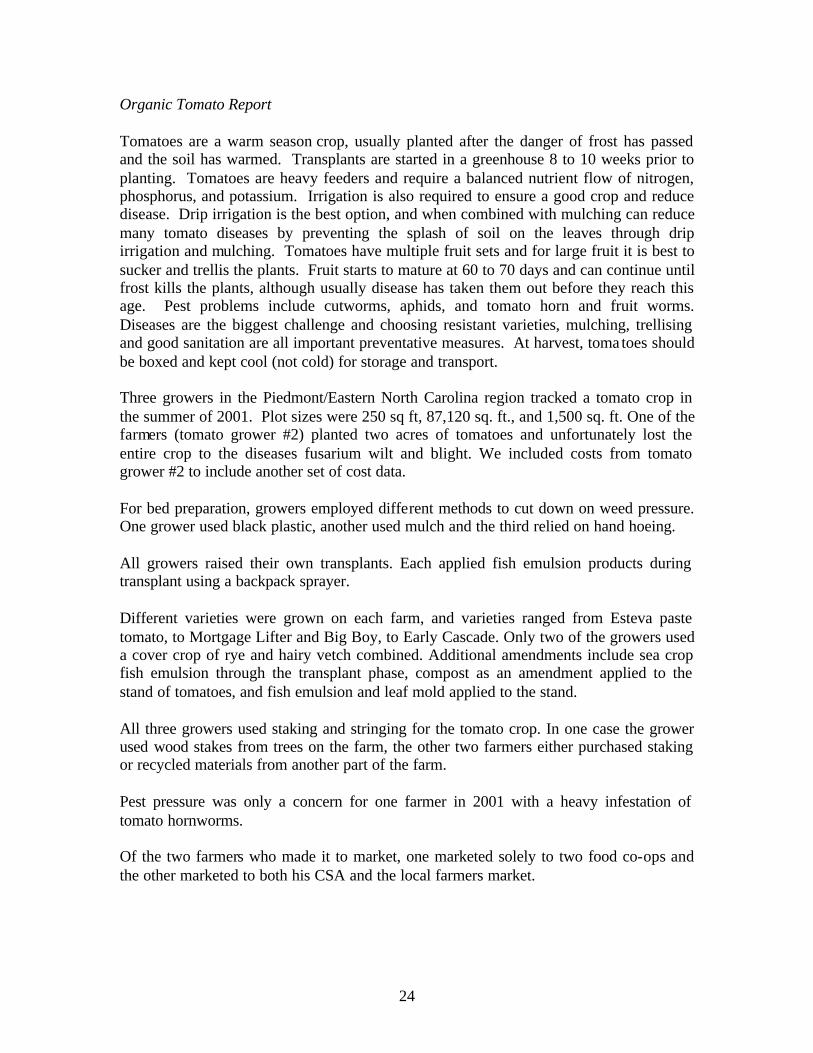
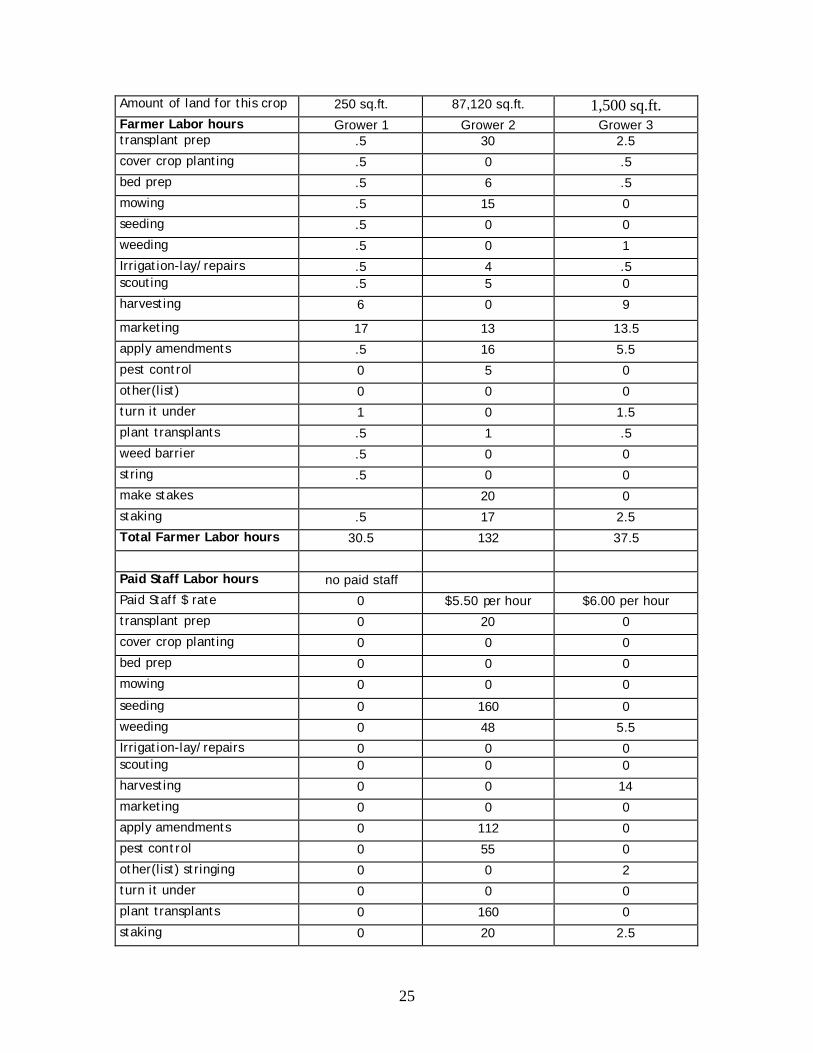
Organic Tomato Report Tomatoes are a warm season crop, usually planted after the danger of frost has passed and the soil has warmed. Transplants are started in a greenhouse 8 to 10 weeks prior to planting. Tomatoes are heavy feeders and require a balanced nutrient flow of nitrogen, phosphorus, and potassium. Irrigation is also required to ensure a good crop and reduce disease. Drip irrigation is the best option, and when combined with mulching can reduce many tomato diseases by preventing the splash of soil on the leaves through drip irrigation and mulching. Tomatoes have multiple fruit sets and for large fruit it is best to sucker and trellis the plants. Fruit starts to mature at 60 to 70 days and can continue until frost kills the plants, although usually disease has taken them out before they reach this age. Pest problems include cutworms, aphids, and tomato horn and fruit worms. Diseases are the biggest challenge and choosing resistant varieties, mulching, trellising and good sanitation are all important preventative measures. At harvest, toma toes should be boxed and kept cool (not cold) for storage and transport. Three growers in the Piedmont/Eastern North Carolina region tracked a tomato crop in the summer of 2001. Plot sizes were 250 sq ft, 87,120 sq. ft., and 1,500 sq. ft. One of the farmers (tomato grower #2) planted two acres of tomatoes and unfortunately lost the entire crop to the diseases fusarium wilt and blight. We included costs from tomato grower #2 to include another set of cost data. For bed preparation, growers employed different methods to cut down on weed pressure. One grower used black plastic, another used mulch and the third relied on hand hoeing. All growers raised their own transplants. Each applied fish emulsion products during transplant using a backpack sprayer. Different varieties were grown on each farm, and varieties ranged from Esteva paste tomato, to Mortgage Lifter and Big Boy, to Early Cascade. Only two of the growers used a cover crop of rye and hairy vetch combined. Additional amendments include sea crop fish emulsion through the transplant phase, compost as an amendment applied to the stand of tomatoes, and fish emulsion and leaf mold applied to the stand. All three growers used staking and stringing for the tomato crop. In one case the grower used wood stakes from trees on the farm, the other two farmers either purchased staking or recycled materials from another part of the farm. Pest pressure was only a concern for one farmer in 2001 with a heavy infestation of tomato hornworms. Of the two farmers who made it to market, one marketed solely to two food co-ops and the other marketed to both his CSA and the local farmers market.
25
Amount of land for this crop 250 sq.ft. 87,120 sq.ft. 1,500 sq.ft. Farmer Labor hours Grower 1 Grower 2 Grower 3 transplant prep .5 30 2.5
cover crop planting .5 0 .5
bed prep .5 6 .5
mowing .5 15 0
seeding .5 0 0
weeding .5 0 1
Irrigation-lay/repairs .5 4 .5 scouting .5 5 0
harvesting 6 0 9
marketing 17 13 13.5
apply amendments .5 16 5.5
pest control 0 5 0
other(list) 0 0 0
turn it under 1 0 1.5
plant transplants .5 1 .5
weed barrier .5 0 0
string .5 0 0
make stakes 20 0
staking .5 17 2.5
Total Farmer Labor hours 30.5 132 37.5
Paid Staff Labor hours no paid staff
Paid Staff $ rate 0 $5.50 per hour $6.00 per hour
transplant prep 0 20 0
cover crop planting 0 0 0
bed prep 0 0 0
mowing 0 0 0
seeding 0 160 0
weeding 0 48 5.5
Irrigation-lay/repairs 0 0 0 scouting 0 0 0
harvesting 0 0 14
marketing 0 0 0
apply amendments 0 112 0
pest control 0 55 0
other(list) stringing 0 0 2
turn it under 0 0 0
plant transplants 0 160 0
staking 0 20 2.5

26
field clean up 0 3
Total Paid Staff Labor hours 0 575 27
Machinery hours 1 21 .5 Cultural Cost
Cover crop seed $1.00 0 $2.00
crop seed $4.75 $15.00 $7.10
trays\potting mix $1.95 $25.00 $10.40
plastic mulch $5.33 0 0
row cover 0 0 0
fertilizers 0 $45.00 $19.39
pest management 0 0 0
boxes,bins,bags $19.50 0 0
general supplies- $8.83 $10.00 $3.25 stakes $50.00
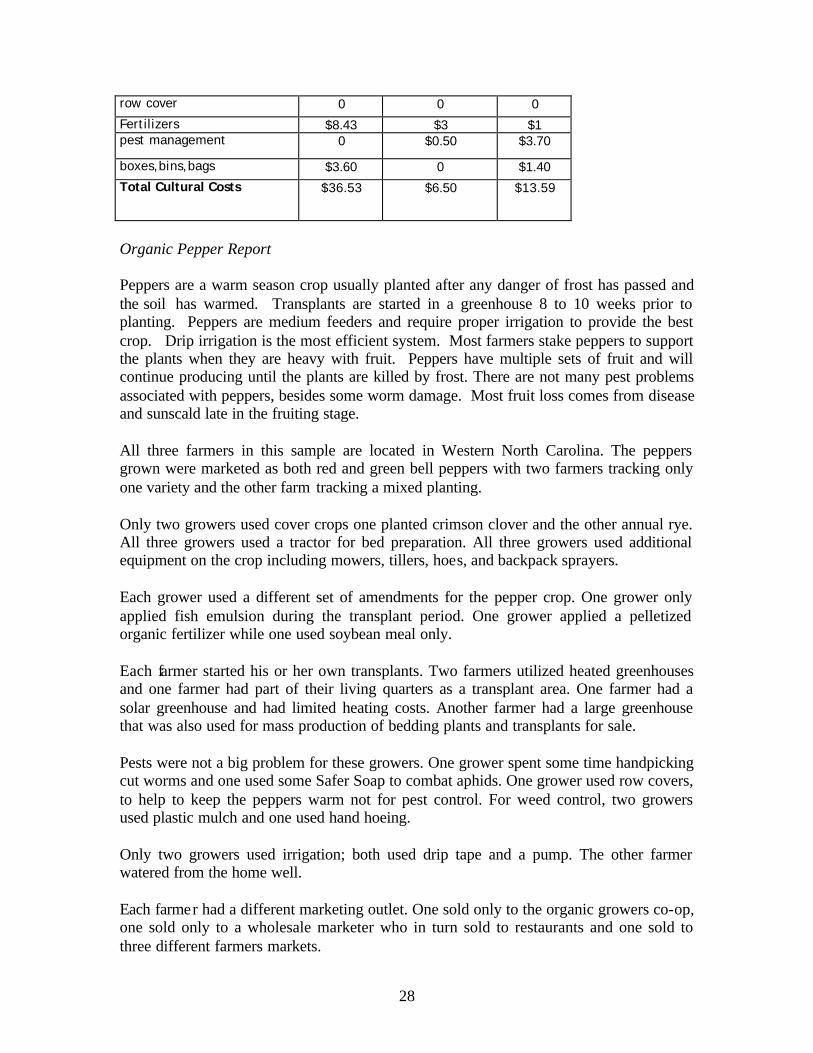
Total Cultural Cost $41.36 $95.00 $92.14 Organic Kale Report Kale is a cool weather crop usually grown in the spring and the fall in North Carolina. Additionally, some farmers are experiencing success with over-wintering kale. Kale can be direct seeded or transplanted. Transplants should be started 4 to 6 weeks prior to planting. The main pests of kale are cut worms, cabbageworms, cabbage loopers, aphids, harlequin bugs, and grasshoppers on fall transplants. Leaves are harvested and bunched as they reach marketable size. Field heat must be removed quickly and cool storage is required. Three farmers in Western North Carolina tracked their Kale crops in the fall of 2001. Plots ranged in size from 2,000 square feet, to 250 square feet to1200 square feet. All growers started their own transplants. Only one farmer used a cover crop, which was winter rye. Each farmer used a different set of amendments for their kale. One used Lime and feather meal, one used foliar fish during transplant preparation and soy meal in the field, and one used foliar fish for transplants and in the field. Pest pressures were mixed. One farmer had problems with worms and controlled them by hand picking. The other two used a Bacillus Theringiensus product to deter cabbage loopers. Weed management was achieved through tiller, tractor and hand weeding. Each grower had a different marketing outlet. One sold only to the organic grower’s co-op, one sold at two tailgate markets and one sold only through their CSA.
27
Amount of land for this crop 2,000 sq.ft. 250 sq.ft. 1,200 sq.ft.
Farmer Labor hours Grower 1 Grower 2 Grower 3 transplant prep 3 1 .5 cover crop planting .5 0 0 bed prep 1 .5 .5
Mowing 0 0 0
Seeding 2 0 .5
Weeding 1 1 2
Irrigation-lay/repairs .5 .5 .5 Scouting .5 .5 .5
Harvesting 4 3.5 4
Marketing 2 1 1 apply amendments 1 .5 2 pest control 1 .5 .5
other(list) 0 0 0
turn it under 0 0 .5 plant transplants 2.5 .5 2.5 Total Farmer Labor 19 9.5 15
Paid Staff Labor hours No paid staff Paid Staff $ rate 7$/ hour 0 8$/ hour
transplant prep 0 0 0
cover crop planting 0 0 0
bed prep 0 0 0
Mowing 0 0 0
Seeding 0 0 0
Weeding 2 0 0
Irrigation-lay repairs 0 0 0 Scouting 0 0 0
Harvesting 2.5 0 2
Marketing 0 0 0
apply amendments 0 0 0
pest control 0 0 0
other(list) 0 0 0
turn it under 0 0 0 plant transplants 2.5 0 .5
Total Paid Staff hours 7 0 2.5
Machinery hours 1.5 .5 2 Cultural Cost
Cover crop seed $2.20 0 0 crop seed $19.60 $1 $1 trays\potting mix $2.70 $2 $2.01
plastic mulch 0 0 $4.48
28
row cover 0 0 0
Fertilizers $8.43 $3 $1 pest management 0 $0.50 $3.70
boxes,bins,bags $3.60 0 $1.40
Total Cultural Costs $36.53 $6.50 $13.59
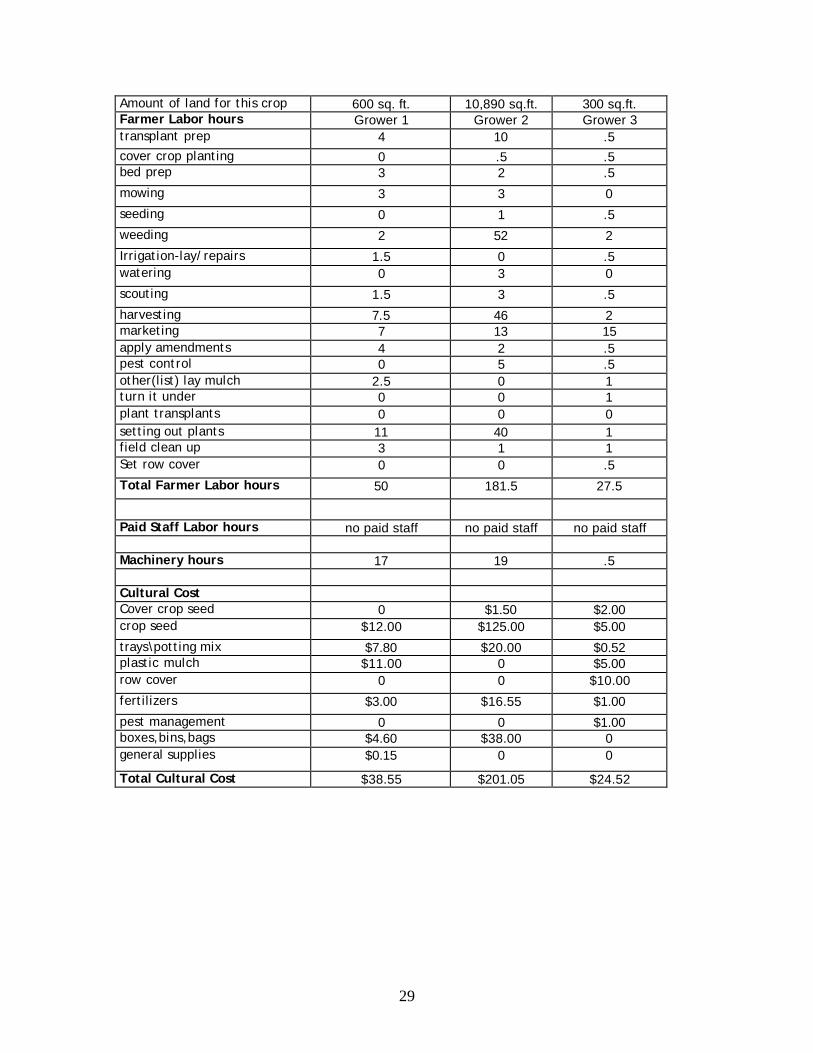
Organic Pepper Report Peppers are a warm season crop usually planted after any danger of frost has passed and the soil has warmed. Transplants are started in a greenhouse 8 to 10 weeks prior to planting. Peppers are medium feeders and require proper irrigation to provide the best crop. Drip irrigation is the most efficient system. Most farmers stake peppers to support the plants when they are heavy with fruit. Peppers have multiple sets of fruit and will continue producing until the plants are killed by frost. There are not many pest problems associated with peppers, besides some worm damage. Most fruit loss comes from disease and sunscald late in the fruiting stage. All three farmers in this sample are located in Western North Carolina. The peppers grown were marketed as both red and green bell peppers with two farmers tracking only one variety and the other farm tracking a mixed planting. Only two growers used cover crops one planted crimson clover and the other annual rye. All three growers used a tractor for bed preparation. All three growers used additional equipment on the crop including mowers, tillers, hoes, and backpack sprayers. Each grower used a different set of amendments for the pepper crop. One grower only applied fish emulsion during the transplant period. One grower applied a pelletized organic fertilizer while one used soybean meal only. Each farmer started his or her own transplants. Two farmers utilized heated greenhouses and one farmer had part of their living quarters as a transplant area. One farmer had a solar greenhouse and had limited heating costs. Another farmer had a large greenhouse that was also used for mass production of bedding plants and transplants for sale. Pests were not a big problem for these growers. One grower spent some time handpicking cut worms and one used some Safer Soap to combat aphids. One grower used row covers, to help to keep the peppers warm not for pest control. For weed control, two growers used plastic mulch and one used hand hoeing. Only two growers used irrigation; both used drip tape and a pump. The other farmer watered from the home well. Each farmer had a different marketing outlet. One sold only to the organic growers co-op, one sold only to a wholesale marketer who in turn sold to restaurants and one sold to three different farmers markets.
29
Amount of land for this crop 600 sq. ft. 10,890 sq.ft. 300 sq.ft. Farmer Labor hours Grower 1 Grower 2 Grower 3 transplant prep 4 10 .5 cover crop planting 0 .5 .5 bed prep 3 2 .5
mowing 3 3 0
seeding 0 1 .5
weeding 2 52 2
Irrigation-lay/repairs 1.5 0 .5 watering 0 3 0
scouting 1.5 3 .5
harvesting 7.5 46 2 marketing 7 13 15 apply amendments 4 2 .5 pest control 0 5 .5 other(list) lay mulch 2.5 0 1 turn it under 0 0 1 plant transplants 0 0 0 setting out plants 11 40 1 field clean up 3 1 1 Set row cover 0 0 .5
Total Farmer Labor hours 50 181.5 27.5
Paid Staff Labor hours no paid staff no paid staff no paid staff Machinery hours 17 19 .5 Cultural Cost Cover crop seed 0 $1.50 $2.00 crop seed $12.00 $125.00 $5.00
trays\potting mix $7.80 $20.00 $0.52 plastic mulch $11.00 0 $5.00 row cover 0 0 $10.00
fertilizers $3.00 $16.55 $1.00
pest management 0 0 $1.00 boxes,bins,bags $4.60 $38.00 0 general supplies $0.15 0 0
Total Cultural Cost $38.55 $201.05 $24.52
30
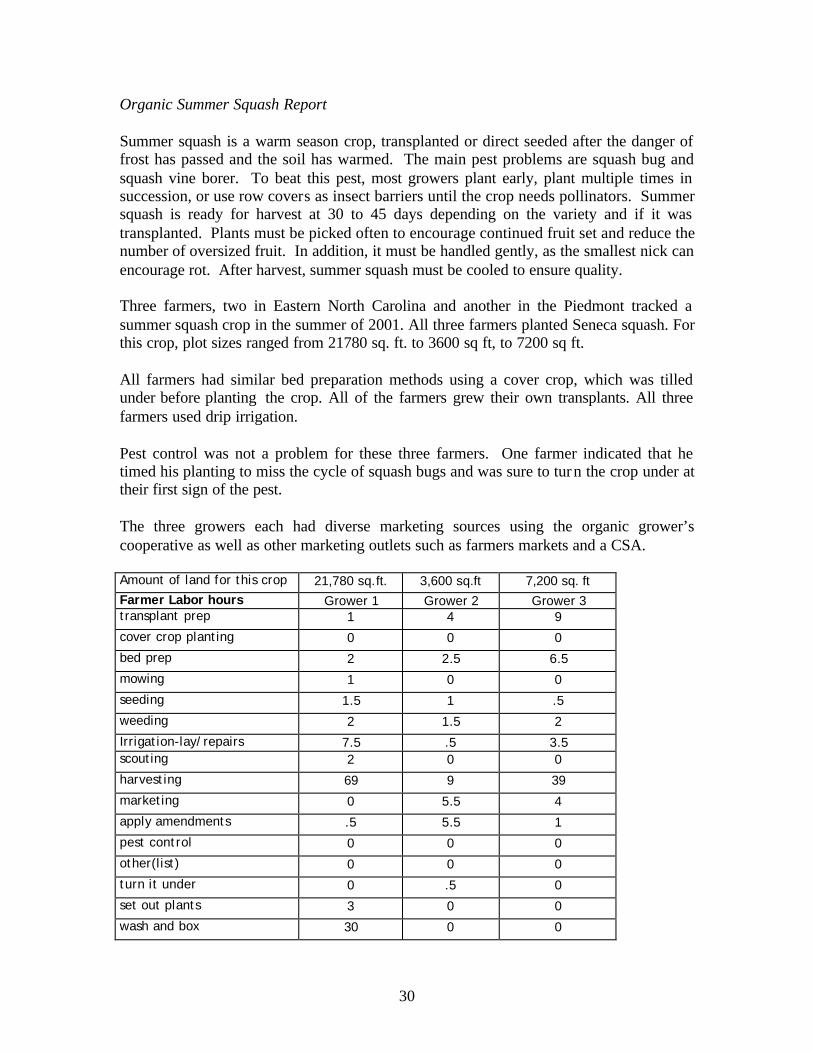
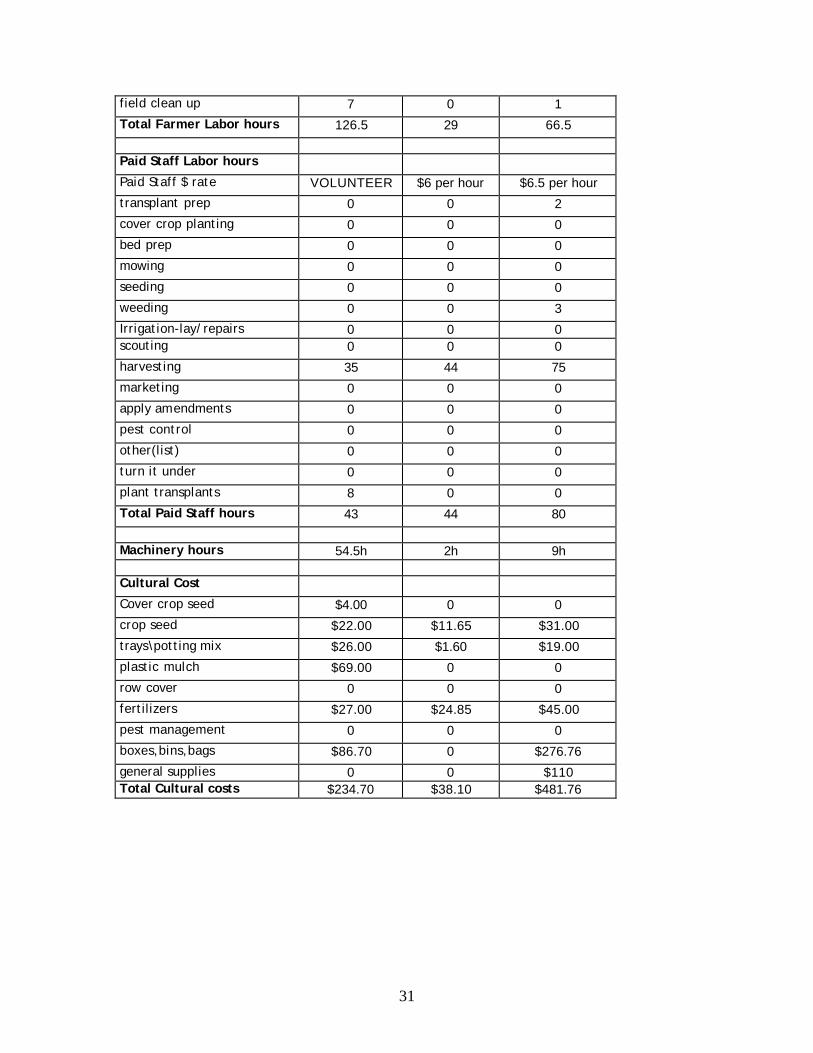
Organic Summer Squash Report Summer squash is a warm season crop, transplanted or direct seeded after the danger of frost has passed and the soil has warmed. The main pest problems are squash bug and squash vine borer. To beat this pest, most growers plant early, plant multiple times in succession, or use row covers as insect barriers until the crop needs pollinators. Summer squash is ready for harvest at 30 to 45 days depending on the variety and if it was transplanted. Plants must be picked often to encourage continued fruit set and reduce the number of oversized fruit. In addition, it must be handled gently, as the smallest nick can encourage rot. After harvest, summer squash must be cooled to ensure quality. Three farmers, two in Eastern North Carolina and another in the Piedmont tracked a summer squash crop in the summer of 2001. All three farmers planted Seneca squash. For this crop, plot sizes ranged from 21780 sq. ft. to 3600 sq ft, to 7200 sq ft. All farmers had similar bed preparation methods using a cover crop, which was tilled under before planting the crop. All of the farmers grew their own transplants. All three farmers used drip irrigation. Pest control was not a problem for these three farmers. One farmer indicated that he timed his planting to miss the cycle of squash bugs and was sure to turn the crop under at their first sign of the pest. The three growers each had diverse marketing sources using the organic grower’s cooperative as well as other marketing outlets such as farmers markets and a CSA. Amount of land for this crop 21,780 sq.ft. 3,600 sq.ft 7,200 sq. ft Farmer Labor hours Grower 1 Grower 2 Grower 3 transplant prep 1 4 9
cover crop planting 0 0 0
bed prep 2 2.5 6.5
mowing 1 0 0
seeding 1.5 1 .5
weeding 2 1.5 2
Irrigation-lay/repairs 7.5 .5 3.5 scouting 2 0 0
harvesting 69 9 39
marketing 0 5.5 4
apply amendments .5 5.5 1
pest control 0 0 0
other(list) 0 0 0
turn it under 0 .5 0
set out plants 3 0 0
wash and box 30 0 0
31
field clean up 7 0 1
Total Farmer Labor hours 126.5 29 66.5
Paid Staff Labor hours
Paid Staff $ rate VOLUNTEER $6 per hour $6.5 per hour
transplant prep 0 0 2
cover crop planting 0 0 0
bed prep 0 0 0
mowing 0 0 0
seeding 0 0 0
weeding 0 0 3
Irrigation-lay/repairs 0 0 0 scouting 0 0 0
harvesting 35 44 75
marketing 0 0 0
apply amendments 0 0 0
pest control 0 0 0
other(list) 0 0 0
turn it under 0 0 0
plant transplants 8 0 0
Total Paid Staff hours 43 44 80
Machinery hours 54.5h 2h 9h Cultural Cost
Cover crop seed $4.00 0 0
crop seed $22.00 $11.65 $31.00
trays\potting mix $26.00 $1.60 $19.00
plastic mulch $69.00 0 0
row cover 0 0 0
fertilizers $27.00 $24.85 $45.00
pest management 0 0 0
boxes,bins,bags $86.70 0 $276.76
general supplies 0 0 $110 Total Cultural costs $234.70 $38.10 $481.76
32
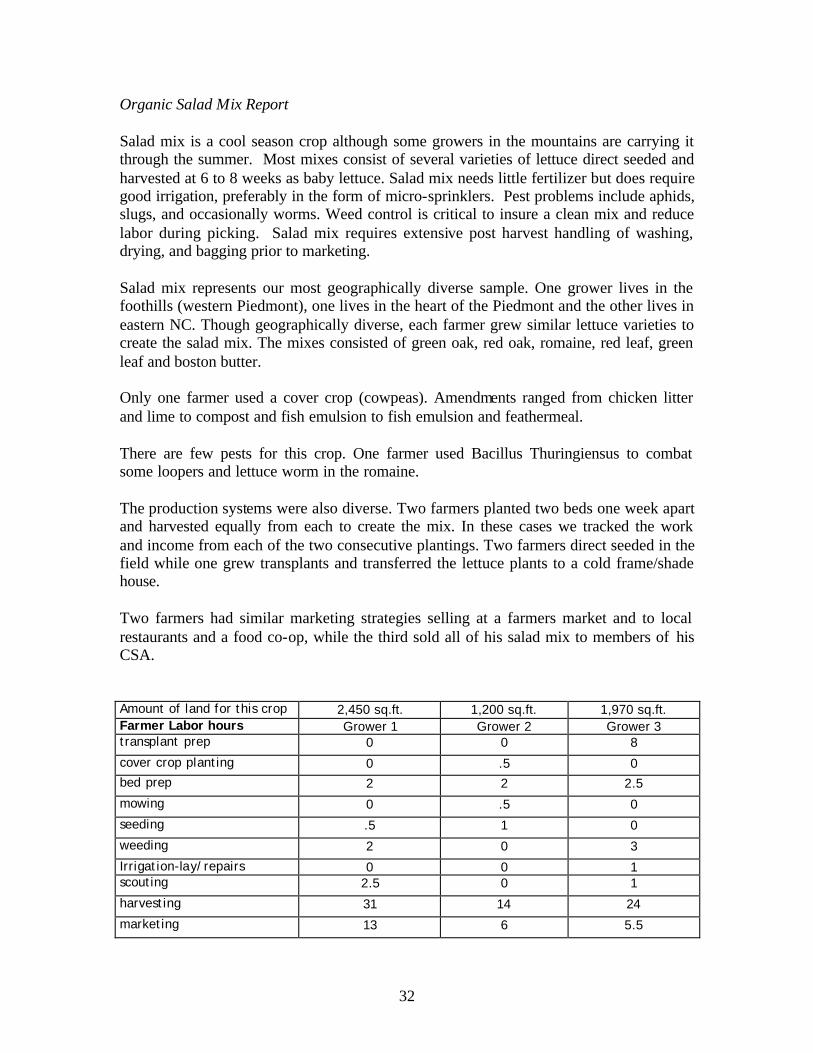
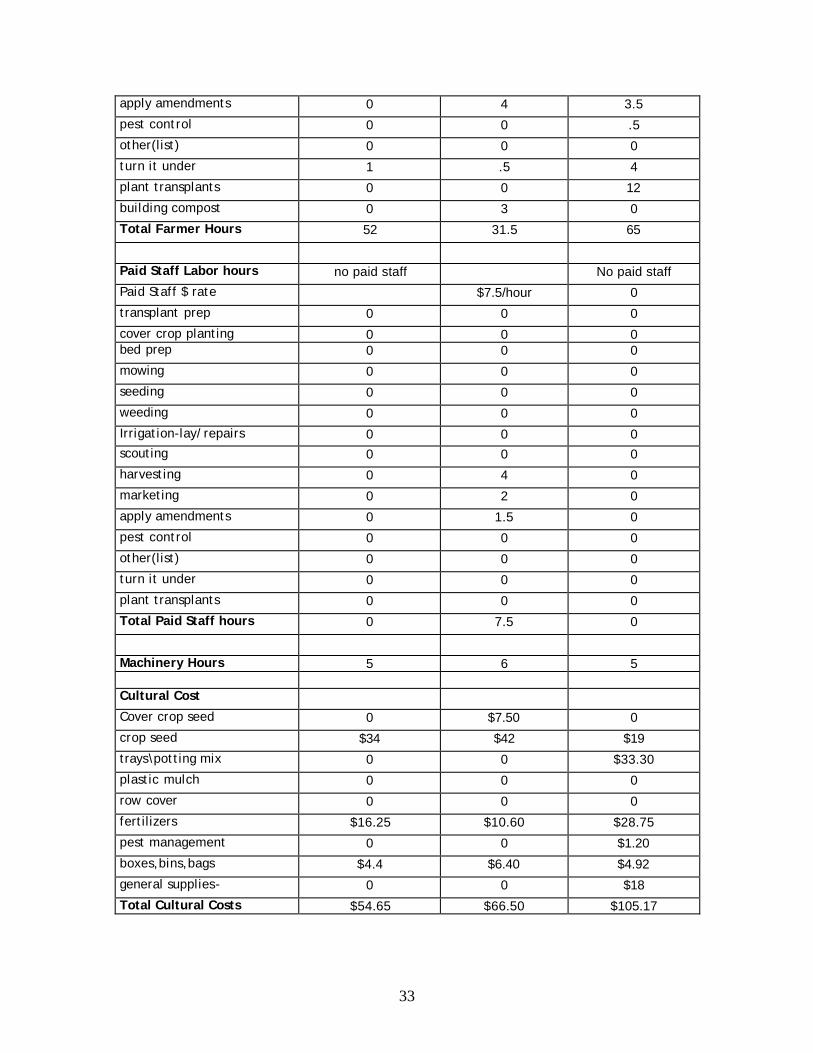
Organic Salad Mix Report Salad mix is a cool season crop although some growers in the mountains are carrying it through the summer. Most mixes consist of several varieties of lettuce direct seeded and harvested at 6 to 8 weeks as baby lettuce. Salad mix needs little fertilizer but does require good irrigation, preferably in the form of micro-sprinklers. Pest problems include aphids, slugs, and occasionally worms. Weed control is critical to insure a clean mix and reduce labor during picking. Salad mix requires extensive post harvest handling of washing, drying, and bagging prior to marketing. Salad mix represents our most geographically diverse sample. One grower lives in the foothills (western Piedmont), one lives in the heart of the Piedmont and the other lives in eastern NC. Though geographically diverse, each farmer grew similar lettuce varieties to create the salad mix. The mixes consisted of green oak, red oak, romaine, red leaf, green leaf and boston butter. Only one farmer used a cover crop (cowpeas). Amendments ranged from chicken litter and lime to compost and fish emulsion to fish emulsion and feathermeal. There are few pests for this crop. One farmer used Bacillus Thuringiensus to combat some loopers and lettuce worm in the romaine. The production systems were also diverse. Two farmers planted two beds one week apart and harvested equally from each to create the mix. In these cases we tracked the work and income from each of the two consecutive plantings. Two farmers direct seeded in the field while one grew transplants and transferred the lettuce plants to a cold frame/shade house. Two farmers had similar marketing strategies selling at a farmers market and to local restaurants and a food co-op, while the third sold all of his salad mix to members of his CSA. Amount of land for this crop 2,450 sq.ft. 1,200 sq.ft. 1,970 sq.ft. Farmer Labor hours Grower 1 Grower 2 Grower 3 transplant prep 0 0 8
cover crop planting 0 .5 0 bed prep 2 2 2.5
mowing 0 .5 0
seeding .5 1 0
weeding 2 0 3
Irrigation-lay/repairs 0 0 1 scouting 2.5 0 1
harvesting 31 14 24
marketing 13 6 5.5
33
apply amendments 0 4 3.5
pest control 0 0 .5
other(list) 0 0 0
turn it under 1 .5 4
plant transplants 0 0 12
building compost 0 3 0
Total Farmer Hours 52 31.5 65
Paid Staff Labor hours no paid staff No paid staff
Paid Staff $ rate $7.5/hour 0
transplant prep 0 0 0
cover crop planting 0 0 0 bed prep 0 0 0
mowing 0 0 0
seeding 0 0 0
weeding 0 0 0
Irrigation-lay/repairs 0 0 0 scouting 0 0 0
harvesting 0 4 0
marketing 0 2 0
apply amendments 0 1.5 0
pest control 0 0 0
other(list) 0 0 0
turn it under 0 0 0
plant transplants 0 0 0
Total Paid Staff hours 0 7.5 0
Machinery Hours 5 6 5 Cultural Cost
Cover crop seed 0 $7.50 0
crop seed $34 $42 $19
trays\potting mix 0 0 $33.30
plastic mulch 0 0 0
row cover 0 0 0
fertilizers $16.25 $10.60 $28.75
pest management 0 0 $1.20
boxes,bins,bags $4.4 $6.40 $4.92
general supplies- 0 0 $18
Total Cultural Costs $54.65 $66.50 $105.17
34
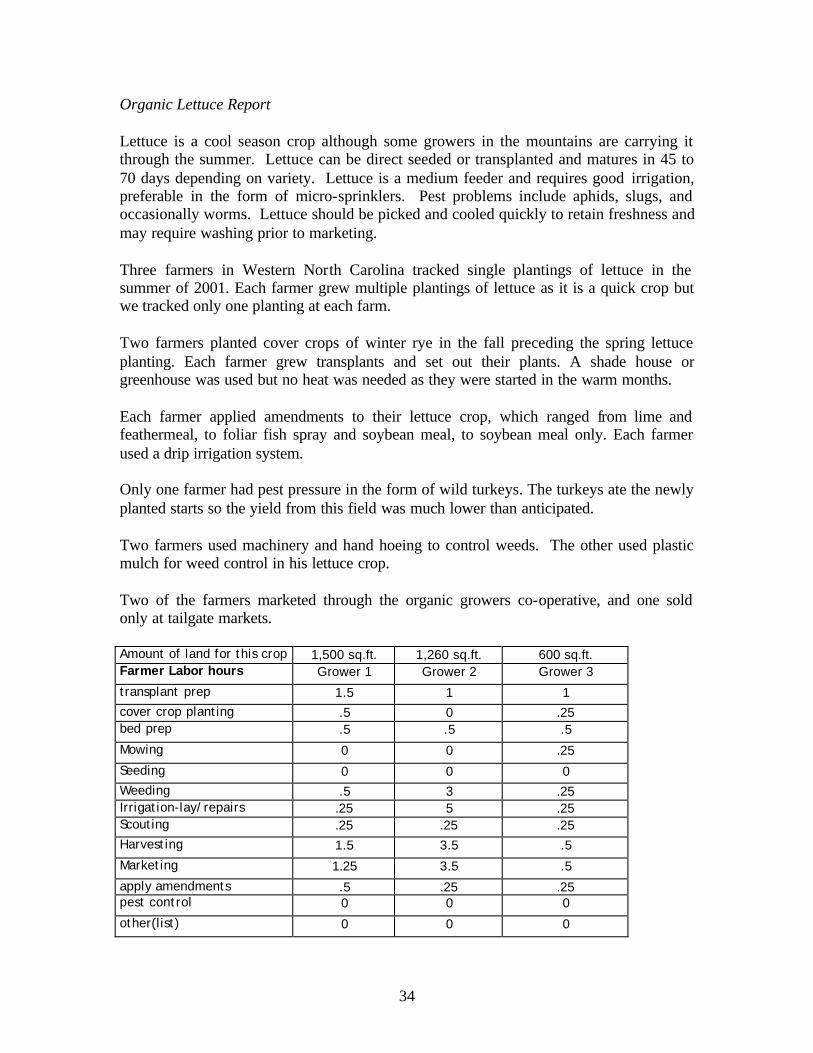
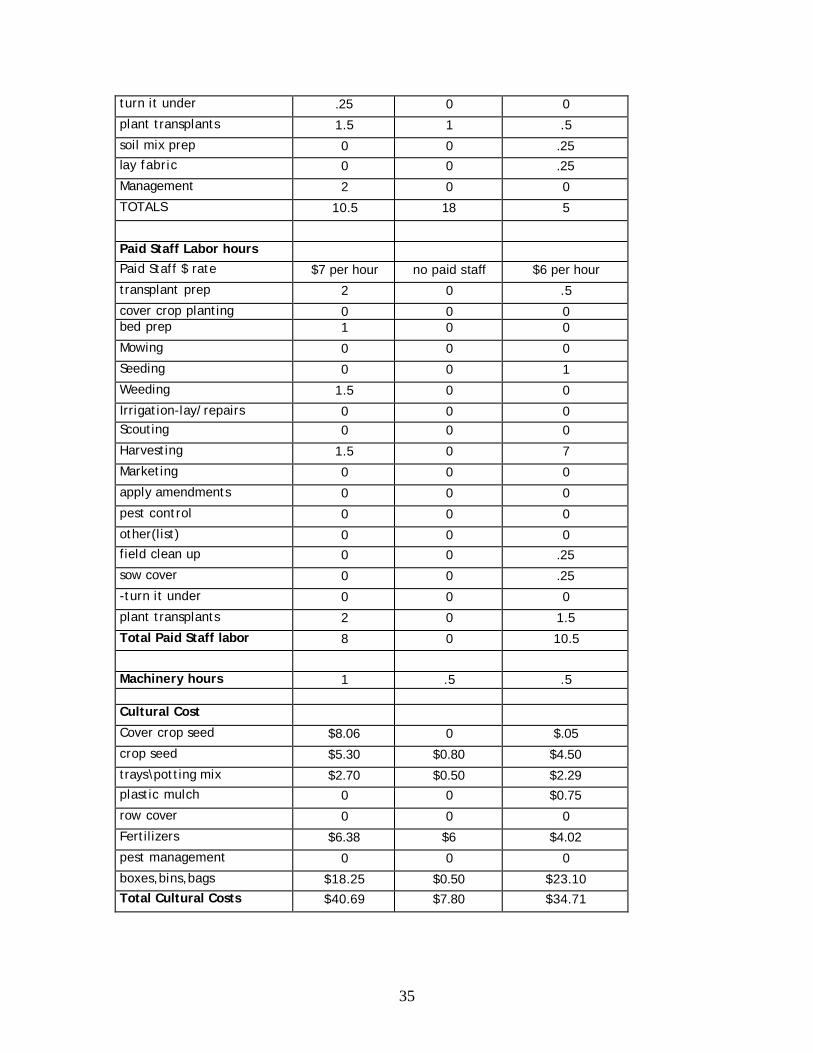
Organic Lettuce Report Lettuce is a cool season crop although some growers in the mountains are carrying it through the summer. Lettuce can be direct seeded or transplanted and matures in 45 to 70 days depending on variety. Lettuce is a medium feeder and requires good irrigation, preferable in the form of micro-sprinklers. Pest problems include aphids, slugs, and occasionally worms. Lettuce should be picked and cooled quickly to retain freshness and may require washing prior to marketing. Three farmers in Western North Carolina tracked single plantings of lettuce in the summer of 2001. Each farmer grew multiple plantings of lettuce as it is a quick crop but we tracked only one planting at each farm. Two farmers planted cover crops of winter rye in the fall preceding the spring lettuce planting. Each farmer grew transplants and set out their plants. A shade house or greenhouse was used but no heat was needed as they were started in the warm months. Each farmer applied amendments to their lettuce crop, which ranged from lime and feathermeal, to foliar fish spray and soybean meal, to soybean meal only. Each farmer used a drip irrigation system. Only one farmer had pest pressure in the form of wild turkeys. The turkeys ate the newly planted starts so the yield from this field was much lower than anticipated. Two farmers used machinery and hand hoeing to control weeds. The other used plastic mulch for weed control in his lettuce crop. Two of the farmers marketed through the organic growers co-operative, and one sold only at tailgate markets. Amount of land for this crop 1,500 sq.ft. 1,260 sq.ft. 600 sq.ft. Farmer Labor hours Grower 1 Grower 2 Grower 3
transplant prep 1.5 1 1 cover crop planting .5 0 .25 bed prep .5 .5 .5
Mowing 0 0 .25
Seeding 0 0 0 Weeding .5 3 .25 Irrigation-lay/repairs .25 5 .25 Scouting .25 .25 .25 Harvesting 1.5 3.5 .5
Marketing 1.25 3.5 .5
apply amendments .5 .25 .25 pest control 0 0 0
other(list) 0 0 0
35
turn it under .25 0 0
plant transplants 1.5 1 .5
soil mix prep 0 0 .25 lay fabric 0 0 .25
Management 2 0 0
TOTALS 10.5 18 5
Paid Staff Labor hours Paid Staff $ rate $7 per hour no paid staff $6 per hour
transplant prep 2 0 .5
cover crop planting 0 0 0 bed prep 1 0 0
Mowing 0 0 0
Seeding 0 0 1
Weeding 1.5 0 0
Irrigation-lay/repairs 0 0 0 Scouting 0 0 0
Harvesting 1.5 0 7
Marketing 0 0 0
apply amendments 0 0 0
pest control 0 0 0
other(list) 0 0 0 field clean up 0 0 .25
sow cover 0 0 .25
-turn it under 0 0 0
plant transplants 2 0 1.5
Total Paid Staff labor 8 0 10.5
Machinery hours 1 .5 .5 Cultural Cost
Cover crop seed $8.06 0 $.05
crop seed $5.30 $0.80 $4.50
trays\potting mix $2.70 $0.50 $2.29 plastic mulch 0 0 $0.75
row cover 0 0 0
Fertilizers $6.38 $6 $4.02
pest management 0 0 0
boxes,bins,bags $18.25 $0.50 $23.10 Total Cultural Costs $40.69 $7.80 $34.71
Recommended