Department of Health and Human Services
OFFICE OF INSPECTOR GENERAL
MEDICARE PAYMENTS
FOR NEWLY AVAILABLE GENERIC DRUGS
Daniel R. Levinson Inspector General
January 2011
OEI-03-09-00510
E X E C U T I V E S U M M A R Y
OBJECTIVES
1. To estimate the financial impact of the two-quarter reimbursement lag on Medicare payments for Part B-covered drugs with newly available generic versions.
2. To estimate when high-expenditure brand-only Part B-covered drugs will likely have first-generic versions reach the market.
BACKGROUND Although Medicare Part D covers most prescription drugs, Part B continues to cover a limited number of outpatient prescription drugs. Payment for most Part B-covered drugs is equal to 106 percent of the average sales price (ASP) for all versions of a drug. Manufacturers are required to submit ASP data to the Centers for Medicare & Medicaid Services (CMS) within 30 days after the close of each quarter, and the data are used to calculate the payment amount for the following quarter. As a result, there is a two-quarter lag between when sales occur and when the payment amount reflects those sales. This reimbursement lag is especially problematic when newly available generic drugs enter the market, as their ASPs are often substantially lower than their brand counterparts, but payment amounts remain at the higher brand level for two quarters or more.
A previous Office of Inspector General (OIG) report highlighted the vulnerabilities of the two-quarter lag by estimating the amount that Medicare would have saved if reimbursement had been based on actual market sales prices for one high-expenditure Part B-covered drug. OIG recommended that CMS explore options to ensure that payment amounts reflect actual market prices in a more timely manner. CMS concurred with our recommendation; however, as of May 2010, CMS has yet to make any changes to its reimbursement process.
For this study, we examined the Medicare payment amounts for 16 Part B-covered drugs that we identified as having first-generic versions reach the market in 2007, 2008, or the first two quarters of 2009. For each of the drugs, we determined how much Part B spending would have decreased had there been no two-quarter lag during the initial period of generic availability (i.e., the first three quarters in which generics were available). We then totaled these figures to determine the net financial impact of the two-quarter lag on Part B and its beneficiaries. To provide context for the future impact of the
O E I - 0 3 - 0 9 - 0 0 5 1 0 M E D I C A R E PAY M E N T S F O R N E W LY AV A I L A B L E G E N E R I C D R U G S i
E X E C U T I V E S U M M A R Y
two-quarter lag, we also requested from the Food and Drug Administration (FDA) the estimated date of generic approval for the top dollar-volume brand drugs covered under Part B.
FINDINGS Medicare could have saved an estimated $111 million had payment amounts immediately reflected generic sales prices for 16 drugs. The financial impact of the two-quarter reimbursement lag in the period of initial generic availability for 16 newly available generic drugs totaled approximately $111 million. These potential savings accounted for 25 percent of total expenditures for these drugs during the same period. It is not just the program itself, but also Medicare beneficiaries who feel the financial effect of the reimbursement lag (because of cost sharing).
Furthermore, it may take years for Medicare to realize the full savings of generic versions. The average payment amounts for the drugs under review continued to decline beyond the period of initial generic availability, ending with an average payment amount 2 years after the introduction of generics that was nearly 60 percent less than that of the original brand-only payment amount. Additionally, brand drugs were initially 3 times more expensive than their generic versions, on average.
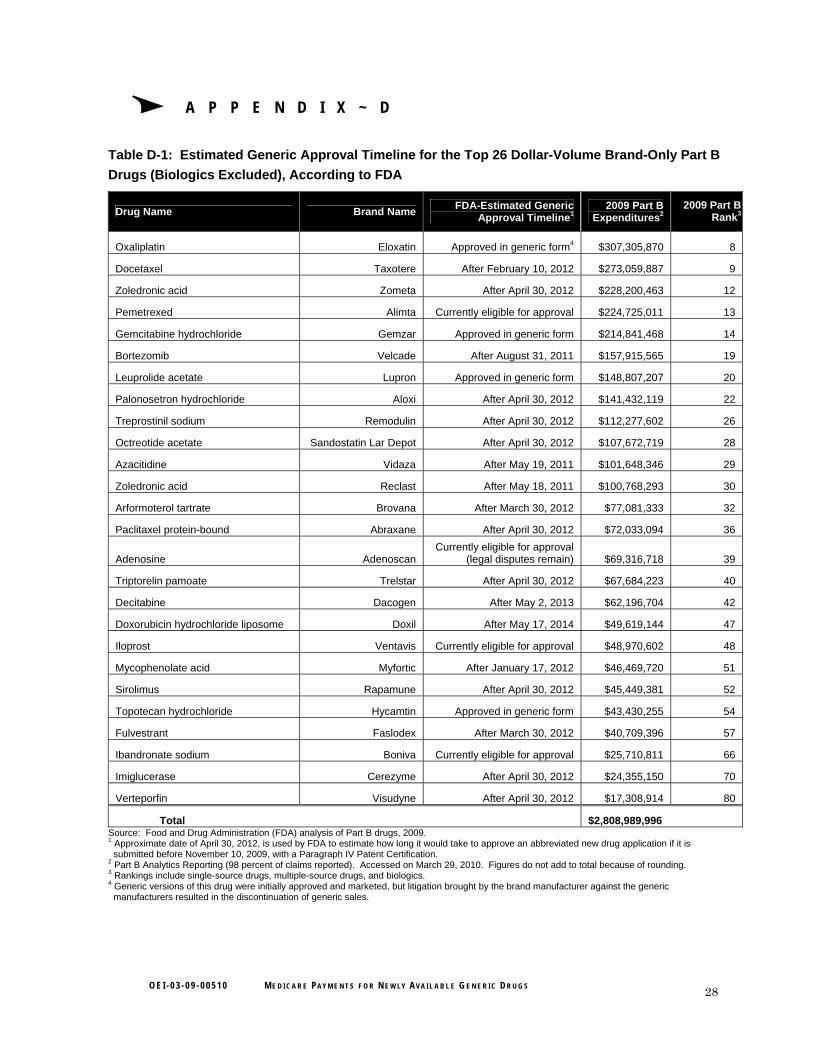
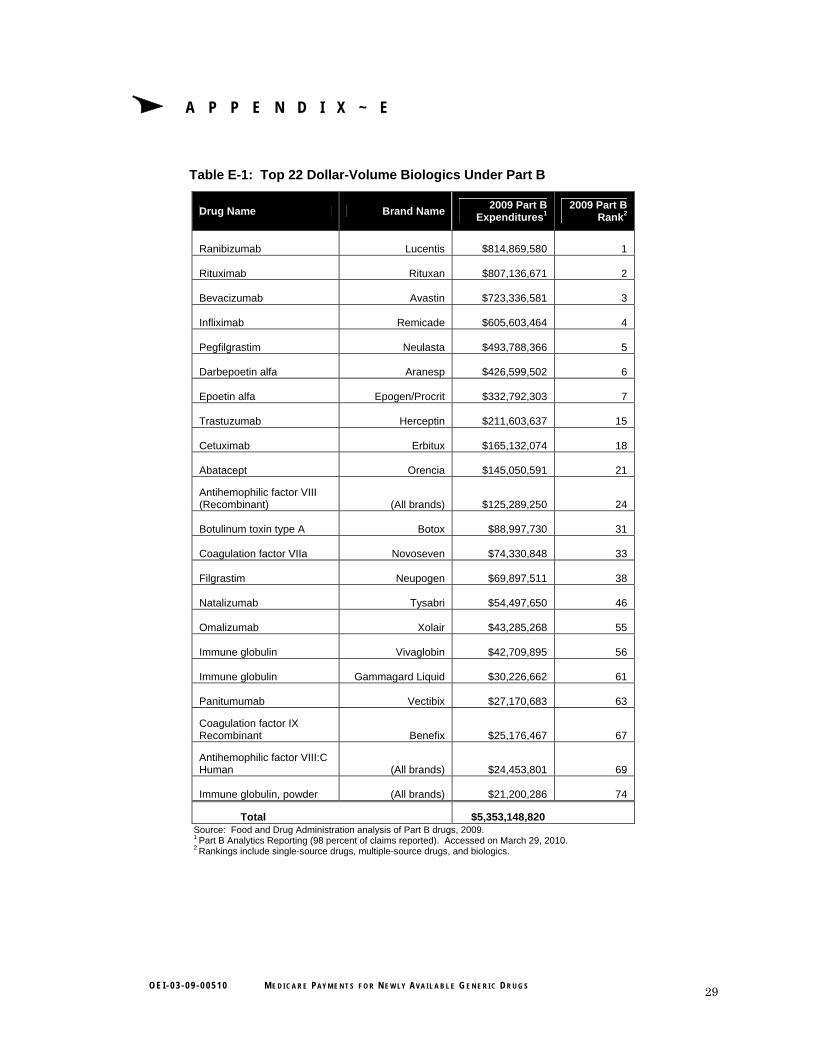
According to FDA, numerous high-expenditure drugs could have first-generic versions approved in the next several years. According to FDA, 26 of the 48 top dollar-volume brand drugs covered under Part B either already have or could have generic versions approved for the first time in the next several years. These 26 drugs had combined Part B expenditures of over $2.8 billion in 2009. The remaining 22 drugs are biologics, which comprise nearly half of all current high-dollar brand-only Part B drugs, and (because of recent legislation) may have generic versions approved in the future. Part B spending on the top 22 biologics totaled over $5.3 billion in 2009.
Significant obstacles remain in proactively identifying newly available generic drugs. Although FDA publishes the date of approval for first generics, this date is often not an accurate indicator of the entry of generic versions into the market because issues such as patent litigation and marketing agreements may affect the date of generic availability. Our analysis identified a number of drugs with FDA-estimated dates of generic approval that did not coincide with the generic market entry dates, including two drugs FDA identified as
O E I - 0 3 - 0 9 - 0 0 5 1 0 M E D I C A R E PAY M E N T S F O R N E W LY AV A I L A B L E G E N E R I C D R U G S ii
E X E C U T I V E S U M M A R Y
having first-generic versions but appear to have never reached the market. For another group of drugs, generic manufacturers failed to report ASPs in a timely manner, increasing the difficulty in setting payment amounts that accurately reflect sales of newly available generic drugs.
RECOMMENDATION This is the second OIG report to identify systemic vulnerabilities in Part B as a result of the two-quarter lag in payments for newly available generic drugs. We found that Medicare payment amounts were significantly higher than market prices for an extended period for the newly available generic drugs under review. In other words, generic versions of these drugs were being administered or dispensed to beneficiaries, but Medicare was still paying brand prices. Although other government and privately sponsored prescription drug programs are designed to take advantage of lower-priced generic drugs, our findings demonstrate that the Part B reimbursement system fails to capture these potential savings for at least two quarters.
With more than half of the top dollar-volume brand drugs covered under Part B potentially gaining approval in generic form over the next 4 years, and the creation under the Patient Protection and Affordable Care Act of a new approval pathway for generic biologics, this vulnerability will likely continue to grow if CMS does not make changes to its Part B payment system. We therefore recommend that:
CMS work with Congress to require manufacturers of first generics to submit monthly ASP data during the period of initial generic availability. By requiring manufacturers of first generics to report ASPs on a monthly basis when the generics first become available, CMS could substantially reduce the two-quarter lag and make Medicare payment amounts more reflective of actual market prices. If CMS finds this to be an effective means for alleviating the financial impact of the two-quarter lag, the agency may wish to consider requiring monthly ASP submissions for all Part B-covered drugs.
AGENCY COMMENTS AND OFFICE OF INSPECTOR GENERAL RESPONSE CMS did not concur with our recommendation, citing potential problems with manufacturer price submissions and increased administrative burdens under a proposed monthly ASP reporting requirement. CMS
O E I - 0 3 - 0 9 - 0 0 5 1 0 M E D I C A R E PAY M E N T S F O R N E W LY AV A I L A B L E G E N E R I C D R U G S iii
O E I - 0 3 - 0 9 - 0 0 5 1 0 M E D I C A R E PAY M E N T S F O R N E W LY AV A I L A B L E G E N E R I C D R U G S iv
E X E C U T I V E S U M M A R Y
also stated that it believes the two-quarter lag protects Medicare and its beneficiaries from unchecked price increases and is an incentive for faster generic utilization.
Because of the two-quarter lag, Part B and its beneficiaries are denied significant potential savings when generic versions first become available. Therefore, we believe that the savings from a reduced reimbursement lag may outweigh any difficulties with implementing a monthly ASP reporting system. Furthermore, we note that the ASP-based reimbursement system (in which all versions of a drug assigned to one payment code are paid at the same amount) is a natural incentive for manufacturers to limit rapid price increases, as well as for providers to utilize generic versions.
T A B L E O F C O N T E N T S
E X E C U T I V E S U M M A R Y . . . . . . . . . . . . . . . . . . . . . . . . . . . . . . . . . . . . . i
I N T R O D U C T I O N . . . . . . . . . . . . . . . . . . . . . . . . . . . . . . . . . . . . . . . . . . . 1
F I N D I N G S . . . . . . . . . . . . . . . . . . . . . . . . . . . . . . . . . . . . . . . . . . . . . . . . 13
Medicare could have saved an estimated $111 million had payment amounts immediately reflected generic sales prices for 16 drugs. . . . . . . . . . . . . . . . . . . . . . . . . . . . . . . . . . . . . . . . . . . . . . 13
According to FDA, numerous high-expenditure drugs could have first-generic versions approved in the next several years . . . . . . . 15
Significant obstacles remain in proactively identifying newly available generic drugs . . . . . . . . . . . . . . . . . . . . . . . . . . . . . . . . . . 16
R E C O M M E N D A T I O N . . . . . . . . . . . . . . . . . . . . . . . . . . . . . . . . . . . . . . 19
Agency Comments and Office of Inspector General Response . . . 20
A P P E N D I X E S . . . . . . . . . . . . . . . . . . . . . . . . . . . . . . . . . . . . . . . . . . . . . 23
A: Detailed Methodology for Identifying First-Generic Drugs and Their Dates of Market Entry. . . . . . . . . . . . . . . . . . . . . . . 23
B: First-Generic Drugs Included in Our Analysis. . . . . . . . . . . . . 25
C: Medicare Payment Amounts for 16 Newly Available Generic Drugs. . . . . . . . . . . . . . . . . . . . . . . . . . . . . . . . . . . . . . . . . . . . . 26
D: Estimated Generic Approval Timeline for the Top 26 Dollar-Volume Brand-Only Part B Drugs (Biologics Excluded), According to FDA . . . . . . . . . . . . . . . . . . . . . . . . . . 28
E: Top 22 Dollar-Volume Biologics Under Part B. . . . . . . . . . . . . 29
F: Comparison of FDA’s ANDA Approval Dates and Actual Generic Entry Dates . . . . . . . . . . . . . . . . . . . . . . . . . . . . . . . . . 30
G: Agency Comments. . . . . . . . . . . . . . . . . . . . . . . . . . . . . . . . . . . 31
A C K N O W L E D G M E N T S . . . . . . . . . . . . . . . . . . . . . . . . . . . . . . . . . . . . 36
I N T R O D U C T I O N
OBJECTIVES 1. To estimate the financial impact of the two-quarter reimbursement
lag on Medicare payments for Part B-covered drugs with newly available generic versions.
2. To estimate when high-expenditure brand-only Part B-covered drugs will likely have first-generic versions reach the market.
BACKGROUND In 2009, Medicare spent approximately $11 billion on Part B-covered drugs.1 Medicare pays for most prescription drugs covered under Part B based on manufacturer-reported average sales prices (ASP). Becauspayment amounts are determined using ASP data from two quarters earlier, it may take 6 months or more for Medicare reimbursement to reflect any price changes in the marketplace.
e
A previous Office of Inspector General (OIG) report2 found that this two-quarter reimbursement lag had negative financial consequences for the Medicare program and its beneficiaries (through higher coinsurance) when lower-priced generic versions of the cancer drug irinotecan first reached the market. In its comments to that report, the Centers for Medicare & Medicaid Services (CMS) concurred with our recommendation that the agency explore options that would allow payment amounts to more accurately reflect new generic prices. CMS stated that it is interested in any suggestions OIG may have to improve the methods used to collect and array data under the ASP system.3 However, CMS has yet to make any changes that would allow Medicare to take advantage of the lower prices of newly available generic drugs in a more timely manner. To that end, this study expands on previous work by examining the impact of the two-quarter lag on a broader scale.
Payment for Medicare Part B-Covered Drugs
Although Medicare Part D covers most outpatient prescription drugs, CMS continues to cover a limited number of outpatient prescription drugs and biologicals (hereinafter referred to as drugs) under its Part B benefit. Part B-covered drugs generally fall into the following
1 Part B Analytics Reporting (PBAR) (98 percent of claims reported). Accessed on March 29, 2010.
2 OIG, Medicare Payment for Irinotecan, OEI-03-08-00310, August 2008. 3 Ibid.
O E I - 0 3 - 0 9 - 0 0 5 1 0 M E D I C A R E PAY M E N T S F O R N E W LY AV A I L A B L E G E N E R I C D R U G S 1
I N T R O D U C T I O N
categories: drugs furnished incident to a physician’s service (e.g., injectable drugs used in connection with the treatment of cancer), drugs explicitly covered by statute (e.g., some vaccines and oral anticancer drugs), and drugs used in conjunction with durable medical equipment (e.g., inhalation drugs).4
To obtain Medicare payment for Part B-covered drugs, physicians and suppliers submit claims, using the Healthcare Common Procedure Coding System (HCPCS) codes, to claims-processing contractors. The HCPCS codes provide a standardized system for describing specific items and services provided in the delivery of health care. In the case of prescription drugs, each HCPCS code defines the drug ingredient name and billing unit size but does not specify the manufacturer or package size. As a result, HCPCS codes for single-source drugs (i.e., drugs with no available generic versions) typically include products from only one manufacturer, and HCPCS codes for multiple-source drugs (i.e., drugs with generic versions) include products from multiple manufacturers.
CMS pays for most Part B-covered drugs based on their ASPs.5 The ASP is defined as a manufacturer’s sales of a drug to all purchasers in the United States in a calendar quarter divided by the total number of units of the drug sold by the manufacturer in that same quarter.6 The ASP is net of any price concessions, such as volume discounts, prompt-pay discounts, cash discounts, free goods contingent on purchase requirements, chargebacks, and rebates other than those obtained through the Medicaid drug rebate program.7 Sales that are nominal in amount are exempted from the ASP calculation, as are sales excluded from the determination of “best price” in the Medicaid drug rebate program.8, 9
Medicare payment amounts for most Part B-covered prescription drugs are equal to 106 percent of the volume-weighted ASPs for the HCPCS
4 68 Fed. Reg. 50428, 50429 (Aug. 20, 2003). 5 Several Part B drugs, including certain vaccines and blood products, are not paid under
the ASP methodology. 6 Section 1847A(c) of the Social Security Act (the Act), as added by the Medicare
Prescription Drug, Improvement, and Modernization Act of 2003 (MMA), P.L. 108-173. 7 Section 1847A(c)(3) of the Act. 8 Pursuant to section 1927(c)(1)(C)(i) of the Act, “best price” is the lowest price available
from the manufacturer during the rebate period to any wholesaler, retailer, provider, health maintenance organization, nonprofit entity, or governmental entity within the United States, with certain exceptions.
9 Section 1847A(c)(2) of the Act.
O E I - 0 3 - 0 9 - 0 0 5 1 0 M E D I C A R E PAY M E N T S F O R N E W LY AV A I L A B L E G E N E R I C D R U G S 2
I N T R O D U C T I O N
codes. Medicare beneficiaries are responsible for 20 percent of this amount in the form of coinsurance.
Manufacturer Reporting Requirements
ASP data. Manufacturers with Medicaid drug rebate agreements in effect must, among other things, provide CMS with pricing information, including the ASP for each of their Part B-covered drugs and the average manufacturer price (AMP) for each of their Medicaid-covered drugs.10, 11 Manufacturers report ASPs for Part B-covered drugs by national drug codes (NDC), which are 11-digit numeric codes divided into three segments identifying (1) the firm that manufactures, distributes, or repackages12 the drug product (i.e., the labeler code); (2) the specific strength, dosage form, and formulation of the product; and (3) the product’s package size. Manufacturers are required to provide CMS with the ASP and volume of sales for each NDC within 30 days of the end of each quarter.13 Because Medicare payment for Part B-covered drugs is based on HCPCS codes rather than NDCs and more than one NDC may meet the definition of a particular HCPCS code, CMS has developed a file that “crosswalks” manufacturers’ NDCs to HCPCS codes.
Manufacturers may face civil money penalties or suspension of their rebate agreements if they knowingly provide false information about their ASPs, fail to report ASP data in the required timeframe, or make misrepresentations in reporting ASPs.14 The penalties associated with late submissions may be increased by up to $10,000 for each day ASP data are not provided.15
The Two-Quarter Lag in Reimbursement for Part B-Covered Drugs
CMS’s ASP payment methodology has an inherent lag between the time when sales occur and when the sales become the basis for payment amounts. Manufacturers must provide CMS with the required ASP
10 For Federal payment to be available for covered outpatient drugs provided under
Medicaid, sections 1927(a)(1) and (b)(1) of the Act mandate that drug manufacturers enter into rebate agreements with the Secretary of Health & Human Services and pay quarterly rebates to State Medicaid agencies.
11 Medicaid rebates are based on AMPs. ASPs are not used in the calculation of Medicaid rebates.
12 A repackager purchases drugs from manufacturers and typically repackages them into smaller quantities.
13 Section 1927(b)(3) of the Act and 42 CFR § 414.804(a)(5). 14 Sections 1927(b)(3)(C)(i) and (ii) of the Act and § 1847A(d)(4) of the Act. 15 Section 1927(b)(3)(C)(i) of the Act.
O E I - 0 3 - 0 9 - 0 0 5 1 0 M E D I C A R E PAY M E N T S F O R N E W LY AV A I L A B L E G E N E R I C D R U G S 3
I N T R O D U C T I O N
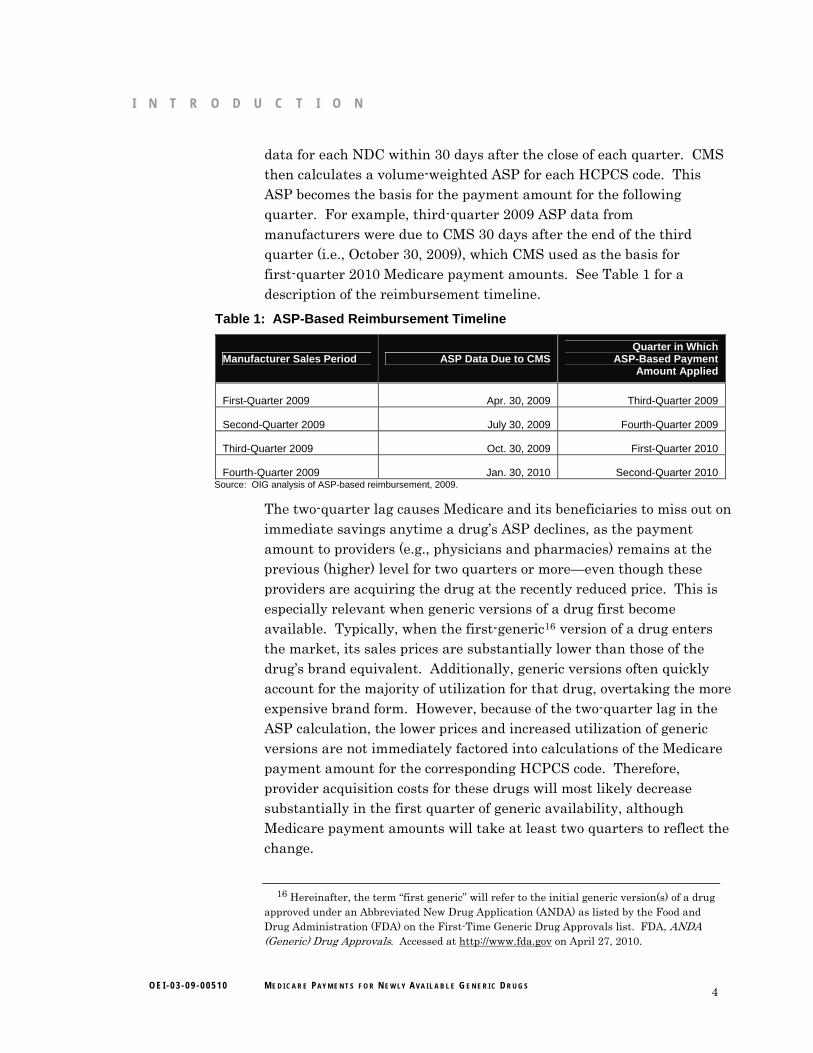
data for each NDC within 30 days after the close of each quarter. CMS then calculates a volume-weighted ASP for each HCPCS code. This ASP becomes the basis for the payment amount for the following quarter. For example, third-quarter 2009 ASP data from manufacturers were due to CMS 30 days after the end of the third quarter (i.e., October 30, 2009), which CMS used as the basis for first-quarter 2010 Medicare payment amounts. See Table 1 for a description of the reimbursement timeline.
Table 1: ASP-Based Reimbursement Timeline
Manufacturer Sales Period ASP Data Due to CMS Quarter in Which
ASP-Based Payment Amount Applied
First-Quarter 2009 Apr. 30, 2009 Third-Quarter 2009
Second-Quarter 2009 July 30, 2009 Fourth-Quarter 2009
Third-Quarter 2009 Oct. 30, 2009 First-Quarter 2010
Fourth-Quarter 2009 Jan. 30, 2010 Second-Quarter 2010 Source: OIG analysis of ASP-based reimbursement, 2009.
The two-quarter lag causes Medicare and its beneficiaries to miss out on immediate savings anytime a drug’s ASP declines, as the payment amount to providers (e.g., physicians and pharmacies) remains at the previous (higher) level for two quarters or more—even though these providers are acquiring the drug at the recently reduced price. This is especially relevant when generic versions of a drug first become available. Typically, when the first-generic16 version of a drug enters the market, its sales prices are substantially lower than those of the drug’s brand equivalent. Additionally, generic versions often quickly account for the majority of utilization for that drug, overtaking the more expensive brand form. However, because of the two-quarter lag in the ASP calculation, the lower prices and increased utilization of generic versions are not immediately factored into calculations of the Medicare payment amount for the corresponding HCPCS code. Therefore, provider acquisition costs for these drugs will most likely decrease substantially in the first quarter of generic availability, although Medicare payment amounts will take at least two quarters to reflect the change.
16 Hereinafter, the term “first generic” will refer to the initial generic version(s) of a drug
approved under an Abbreviated New Drug Application (ANDA) as listed by the Food and Drug Administration (FDA) on the First-Time Generic Drug Approvals list. FDA, ANDA (Generic) Drug Approvals. Accessed at http://www.fda.gov on April 27, 2010.
O E I - 0 3 - 0 9 - 0 0 5 1 0 M E D I C A R E PAY M E N T S F O R N E W LY AV A I L A B L E G E N E R I C D R U G S 4
I N T R O D U C T I O N
FDA’s Generic Approval Process
Brand drugs are given patent protection by the U.S. Patent and Trademark Office for a certain period (generally 20 years from the date of filing).17 Upon approval by FDA, manufacturers are also granted market exclusivity for the drug, which may or may not run concurrently with the patent protection.18 With certain exceptions, generic drugs cannot be marketed before the brand drug’s patent and market exclusivity expire.19, 20 Before marketing a generic version of a brand drug, a pharmaceutical company must obtain FDA approval by submitting an ANDA.21 Generally, a generic drug must be the same as a brand drug with respect to conditions of use (with certain exceptions), active ingredient(s), route of administration, dosage form, strength, and labeling.22 In addition, with certain exceptions, the generic drug must be bioequivalent to (i.e., perform in the same manner as) the brand drug.
Each month, FDA publishes a list of new first-time generic drug approvals (note: the approval of a drug does not mean that it reaches the market).23 Furthermore, the FDA Approved Drug Products directory (“Drugs@FDA”) provides each drug’s approval history, including whether it was approved under an ANDA, thereby indicating a generic drug. Drugs@FDA is searchable by application number, proprietary drug name, and active ingredient.24
Previous OIG Work
A 2008 OIG report identified vulnerabilities in the Part B payment system when the first-generic versions of a prescription drug enter the market.25 In that report, we estimated that providers paid $51.59 per 20 milligrams of irinotecan (a cancer drug that was available in generic
17 U.S. Patent and Trademark Office. General Information Concerning Patents: Nature
of Patent and Patent Rights. Accessed at http://www.uspto.gov on June 7, 2010. 18 FDA, Frequently Asked Questions on Patents and Exclusivity. Accessed at
www.fda.gov on July 28, 2010. 19 Ibid. 20 U.S. Patent and Trademark Office, loc. cit. 21 21 CFR § 314.105(d). 22 21 U.S.C. § 355(j)(2) (§ 505(j)(2) of the Federal Food, Drug, and Cosmetic Act);
21 CFR §§ 314.92 and 314.105(c). 23 FDA, ANDA (Generic) Drug Approvals. Accessed at http://www.fda.gov on
April 27, 2010. 24 Accessed at http://www.fda.gov on March 26, 2010. 25 OIG, Medicare Payment for Irinotecan, OEI-03-08-00310, August 2008.
O E I - 0 3 - 0 9 - 0 0 5 1 0 M E D I C A R E PAY M E N T S F O R N E W LY AV A I L A B L E G E N E R I C D R U G S 5
I N T R O D U C T I O N
form beginning in February 2008) in the first quarter of 2008. The Medicare payment amount in the same quarter was more than double that amount ($126.31). We found that Medicare expenditures could have been reduced by an estimated $26 million had Medicare reimbursement immediately reflected actual market prices between March and June 2008 (the period in which payment amounts were still fully based on the brand prices).
We recommended that CMS explore options (including a possible legislative change) that would allow payment amounts to more accurately reflect new generic prices. CMS concurred with our recommendation and expressed its commitment to ensuring accurate payments for drug products under the ASP methodology, including working with OIG to improve the methods CMS uses to collect data. However, as of May 2010, CMS has not taken any actions to address potential overreimbursement for first generics.
METHODOLOGY Data Sources
The following data sources were used in our analysis to identify newly available generic drugs, calculate the financial impact of the two-quarter lag, and estimate when high-expenditure brand-only Part B-covered drugs will likely have first-generic versions reach the market.
FDA’s monthly list of first-generic drug approvals. Each month, FDA publishes on its Web site a list of first-time generic drug approvals.26 This list contains the drug name, form, strength, and manufacturer of each first-generic drug approved in that month. It does not list the NDCs or HCPCS codes for the newly approved drugs.
FDA’s Approved Drug Products directory (“Drugs@FDA”). This FDA directory contains the approval history of all drugs, including approved labels and whether a drug was approved under a New Drug Application or ANDA.27 It does not list any of this information by NDC or HCPCS code.
26 FDA, ANDA (Generic) Drug Approvals. Accessed at http://www.fda.gov on
April 27, 2010. 27 FDA, FDA Approved Drug Products. Accessed at http://www.fda.gov on
March 26, 2010.
O E I - 0 3 - 0 9 - 0 0 5 1 0 M E D I C A R E PAY M E N T S F O R N E W LY AV A I L A B L E G E N E R I C D R U G S 6
I N T R O D U C T I O N
FDA staff. We requested information from staff at FDA relating to the generic approval status of certain high-expenditure brand-only drugs covered under Part B.
CMS’s quarterly crosswalk file. Each quarter, CMS publishes a file that lists all NDCs that correspond to each HCPCS code for drugs paid under Part B.28
CMS’s quarterly Part B payment-limit file. Each quarter, CMS posts a file containing the payment amount by HCPCS code for drugs paid under Part B.29
CMS’s quarterly ASP background file. CMS provides OIG with the ASP background file each quarter. This file contains ASP data (including the ASP itself and the number of units sold in the quarter) for all NDCs (grouped by their corresponding HCPCS codes) that were reported in that quarter. The data in this file are used to calculate the payment amount for each HCPCS code as listed in the quarterly Part B payment-limit file.
CMS’s monthly AMP file. CMS provides OIG with a file containing manufacturer-reported AMP data each month. AMP data30 are used in the determination of rebates under the Medicaid drug rebate program and are reported by the NDC.
CMS’s labeler file. CMS publishes a file that lists each manufacturer with a Medicaid drug rebate agreement, the agreement’s effective date, and the manufacturer’s labeler code (i.e., the first five digits of the NDC).31
CMS’s Part B quarterly utilization data. Quarterly Part B utilization data for prescription drugs are available through CMS’s Part B Extract and Summary System (BESS) and PBAR system. These data provide the
28 CMS, ASP NDC-HCPCS Crosswalk. Accessed at http://www.cms.gov on May 28, 2010. 29 CMS, ASP Pricing File. Accessed at http://www.cms.gov on May 28, 2010. 30 Section 6001(b)(1)(A) of the Deficit Reduction Act of 2005 requires manufacturers,
beginning January 1, 2007, to report AMPs to CMS on both a monthly and a quarterly basis, with monthly submissions due 30 days after the close of each period. As generally defined in section 1927(k)(1) of the Act, as amended by section 2503(a)(2) of the Patient Protection and Affordable Care Act (ACA), P.L. 111-148, the AMP is the average price paid to manufacturers for drugs in the United States by wholesalers for drugs distributed to retail community pharmacies and by retail community pharmacies that purchase drugs directly from manufacturers.
31 CMS, Participating Drug Companies. Accessed at http://www.cms.hhs.gov on April 28, 2010.
O E I - 0 3 - 0 9 - 0 0 5 1 0 M E D I C A R E PAY M E N T S F O R N E W LY AV A I L A B L E G E N E R I C D R U G S 7
I N T R O D U C T I O N
total units and total amount reimbursed for each HCPCS code during a given quarter or year.
Micromedex’s quarterly Red Book file. The Red Book file is an industry-produced compendium containing drug product information and pricing data at the NDC level. OIG receives updated Red Book data each quarter.
Manufacturer online press releases. Through manufacturer Web sites and online trade publications, manufacturers periodically announce the launch of recently approved generic drugs.
Identification of Newly Available Generic Drugs
We consulted FDA’s monthly list of first-generic drug approvals to identify all drugs that had first-generic versions potentially become available in 2007, 2008, or the first two quarters of 2009.32 We compared this list of drugs to CMS’s Part B crosswalk files to determine which of these first-generic drugs were covered under Part B and reimbursed based on the ASP payment methodology.
Because issues such as patent infringement litigation prevent some FDA-approved first generics from becoming available or available immediately after approval, we performed the following additional checks to determine whether Part B drugs on FDA’s list actually reached the market in 2007, 2008, or the first two quarters of 2009:
1. We first used CMS’s quarterly ASP background files to determine the number of manufacturers that reported sales of potential first-generic drugs covered under Part B and the drugs’ corresponding NDCs. Because manufacturers are required to submit quarterly ASP data to CMS, the background files enabled us to identify the number of manufacturers that sold each drug in each quarter, thereby confirming whether FDA’s first-generic approval date coincided with the market entry of new manufacturers for each drug. However, because previous OIG work33 found that manufacturers do not always report ASPs in a timely manner, we
32 Because there is often a gap between the time when a drug receives FDA approval and
when it becomes available on the marketplace, we also included drugs from FDA’s list of generic drugs approved in November and December 2006 if data sources indicated they did not become available until 2007.
33 OIG, Average Sales Prices: Manufacturer Reporting and CMS Oversight, OEI-03-08-00480, February 2010.
O E I - 0 3 - 0 9 - 0 0 5 1 0 M E D I C A R E PAY M E N T S F O R N E W LY AV A I L A B L E G E N E R I C D R U G S 8
I N T R O D U C T I O N
also took additional steps to identify whether and when a product reached the market.
2. We performed similar checks using CMS’s monthly AMP files and Micromedex’s Red Book file to further confirm the date of the first reported sales of each generic drug. By matching the NDCs reported by each generic manufacturer in the ASP background files to the NDCs listed in the AMP files, we were able to determine the first month that generic sales were reported to CMS. The same NDCs were also used to determine the first quarter that generic manufacturers reported product information to Red Book, which served as an additional confirmation of the date of generic market entry.
3. As a final check, we reviewed generic manufacturer online press releases announcing the availability of generic drugs to confirm the date of market entrance.
This process produced a final list of 16 Part B drugs that had first-generic versions appear on the market in 2007, 2008, or the first two quarters of 2009.34, 35
For some drugs, not all of these data sources mentioned above provided the same date of generic entry. With most discrepancies, we chose the consensus date among most of these data sources. When there was no clear consensus (3 of the 16 drugs), we deferred to the first full month of generic sales listed among all data sources.
In some instances, these date discrepancies indicated a failure of manufacturers to report ASPs, as required. For example, comparing NDCs in the quarterly ASP background files to those listed in the
34 Our analysis initially identified 18 first-generic drugs. Two drugs (levalbuterol
inhalation solution unit dose and levalbuterol inhalation solution concentrate) reached the market, but coding and payment issues created difficulties with any analysis. In general, for much of the review period, Medicare payment amounts for levalbuterol were not based solely on its own ASPs, but also on the ASPs for a different drug (albuterol) as well. The removal of these 2 drugs brought the final number of first generics under review to 16. See the OIG report entitled Beneficiary Utilization of Albuterol and Levalbuterol Under Medicare Part B, OEI-03-07-00440, August 2009, for a full description of the numerous coding and payment changes for levalbuterol since 2003.
35 We use the term “drug” here to describe a unique HCPCS code: the final list included 16 unique HCPCS codes, representing 14 drug ingredients (granisetron hydrochloride had separate HCPCS codes for injection and tablet forms, and dronabinol oral had separate HCPCS codes for 2.5 mg and 5 mg), but because each HCPCS code has its own Part B payment amount, we considered the total list of first generics to include 16 drugs.
O E I - 0 3 - 0 9 - 0 0 5 1 0 M E D I C A R E PAY M E N T S F O R N E W LY AV A I L A B L E G E N E R I C D R U G S 9
I N T R O D U C T I O N
monthly AMP files enabled us to determine whether generic manufacturers were late to report ASPs. In such cases, we used the CMS labeler files to determine whether those manufacturers had a Medicaid drug rebate agreement (and thus were required to submit ASPs). See Appendix A for a detailed description of our methodology for identifying first generics.
Financial Impact of the Two-Quarter Lag During Initial Generic Availability
To determine the financial impact of the reimbursement lag for the 16 newly available generic drugs, we first calculated the effect the lag had on payment amounts in each quarter. We did this by comparing the Part B payment amount from CMS’s payment-limit file in the quarter under review to the payment amount from two quarters later. Because the payment amount from two quarters later was based on sales that occurred during the quarter under review, it served as an estimate of what the payment amount would have been had there been no lag. To determine the amount spending would have decreased had this payment amount been in effect, we (1) calculated the percentage difference between the payment amount during the quarter under review and the payment amount from two quarters later and (2) multiplied the percentage difference by the total amount reimbursed in that quarter.36
We performed this analysis during the initial generic availability period of each drug; i.e., the quarter in which generics were first available in the market, as well as the subsequent two quarters—yielding three quarters of analysis for each drug.37 Although payment amounts are always based on ASPs from two quarters previous, the initial effects of the lag often extend into the third quarter of generic availability. For example, if a first generic did not become available until the middle of a quarter (e.g., February 15, 2008), the volume-weighted ASP for that quarter (first-quarter 2008) will not reflect a full period of sales of generic versions—and consequently, the drug’s Medicare payment amount in third-quarter 2008 will only reflect partial generic sales. As a result, the effects of the reimbursement lag will still be felt in the third quarter of 2008 (i.e., the third quarter of generic availability). By
36 We obtained utilization data from BESS and PBAR for each quarter and drug under
review. 37 For the purpose of this analysis, a two-quarter reimbursement lag is assumed for all
newly available generic drugs.
O E I - 0 3 - 0 9 - 0 0 5 1 0 M E D I C A R E PAY M E N T S F O R N E W LY AV A I L A B L E G E N E R I C D R U G S 10
I N T R O D U C T I O N I N T R O D U C T I O N
including the third quarter of generic availability in our financial impact analysis, we were able to account for these extended effects.
In instances in which a first generic was approved after the first month of a quarter (and therefore was available for only a portion of the quarter), we used proportional utilization data to reflect the amount of time the generics were available in that quarter.38
Once we estimated the financial impact for each drug, we totaled these figures to determine the net financial impact of the two-quarter reimbursement lag on Part B and its beneficiaries for the 16 drugs over their initial periods of generic availability. We compared the total potential savings to the total amount reimbursed for all drugs over the same period and determined the proportion of potentially excessive expenditures resulting from the two-quarter lag.
Comparison of generic and brand ASPs. The volume-weighted ASP for a HCPCS code is calculated using the individual ASPs for all corresponding NDCs. Within each HCPCS code, the ASPs for the brand and any generic NDCs often vary considerably (even though the Medicare payment amount is the same for all NDCs under a HCPCS code). To highlight the difference between generic-only and brand-only ASPs when a generic version first becomes available, we used CMS’s background files to separately calculate the volume-weighted ASP of generic and brand versions of each drug in the first quarter in which the generics were available.39
Analysis of payment levels beyond the period of initial generic availability.
Even after generics become fully accounted for in the Medicare payment amount (i.e., after the period of initial generic availability), the two-quarter lag may still have a negative effect if market prices continue to fall. Therefore, in addition to quantifying the financial impact of the two-quarter lag during the period of initial generic availability, we also tracked Medicare payment amounts for the 16 drugs for up to 2 years40 after their first-generic versions became available. To do so, we compared the Medicare payment amounts during the quarter before generics became available to the payment
38 CMS’s AMP files allowed us to determine the first month of generic availability. 39 Data were unavailable for two drugs. 40 Because three drugs did not reach the market until first- or second-quarter 2009,
payment amounts for these drugs were not available for the full 2 years.
O E I - 0 3 - 0 9 - 0 0 5 1 0 M E D I C A R E PAY M E N T S F O R N E W LY AV A I L A B L E G E N E R I C D R U G S 11
I N T R O D U C T I O N
amounts 2 years later.41 By comparing the Medicare payment amounts before and after generic sales were reflected in the volume-weighted ASPs, we were able to illustrate the long-term effect of generics on Medicare payment amounts as well as how the two-quarter lag may continue to affect payment after the period of initial generic availability.
Identification of Future First-Generic Drugs
We provided FDA with a list of the top 48 brand-only drugs (by Medicare expenditure) covered under Part B and requested an estimate of when each drug was likely to have first-generic versions receive approval.42 To compile the list, we researched the top dollar-volume drugs covered under Part B in 2008 to determine which drugs were available only in brand form.43 FDA provided the estimated date of generic approval for each brand drug based on when an ANDA could first be approved.
Limitations
Our analysis was based on data provided by FDA and CMS, and we did not verify the data’s accuracy or completeness. Additionally, FDA’s generic approval timeline for brand drugs was based only on the estimated date of possible ANDA approval and did not take into account other factors (e.g., patent litigation) that may affect the date of actual market entry.
Standards
This study was conducted in accordance with the Quality Standards for Inspections approved by the Council of the Inspectors General on Integrity and Efficiency.
41 The 2 years varied for each drug, but our analysis did not extend beyond
second-quarter 2010. 42 Originally, we provided FDA with a list of 50 brand-only drugs. We removed two
drugs from this list after we determined that first-generic versions had been approved by FDA. In the case of mycophenolate mofetil, our data sources contained no evidence at the time we originally contacted FDA that generics had reached the market (although they subsequently did during the period covered by our review). In the case of budesonide, first-generic versions had been approved and had briefly reached the market; however, as the result of patent litigation, no generic versions remained on the market during the period covered by our analysis. This brought the final list to 48 brand-only drugs.
43 We used CMS’s background files, manufacturer Web sites, and FDA’s list of generic drug approvals to determine whether a drug was brand-only or available in generic form.
O E I - 0 3 - 0 9 - 0 0 5 1 0 M E D I C A R E PAY M E N T S F O R N E W LY AV A I L A B L E G E N E R I C D R U G S 12
F I N D I N G S
Had there been no two-quarter reimbursement lag during the period of initial generic availability44 for 16 drugs, we estimate that Medicare and its
beneficiaries could have saved $111 million.45, 46 The potential savings accounted for 25 percent of Part B expenditures for these drugs in their period of initial generic availability. Three drugs47 each had an estimated $20 million or more in total potential savings over the course of the three quarters under review. See Appendix B for a list of each drug’s potential savings.
Medicare could have saved an estimated
$111 million had payment amounts immediately
reflected generic sales prices for 16 drugs
Because of cost-sharing obligations, Medicare beneficiaries also experience the financial effect of the reimbursement lag. For example, when the oral version of the antiemetic drug granisetron first became available in generic form in first-quarter 2008, providers who purchased the generic version paid, on average, $12.89 per milligram (mg).48 The Medicare payment amount that quarter ($50.22 per mg), however, was based only on brand versions. As a result, the 20-percent beneficiary coinsurance at this time ($10.04 per mg) was only slightly less than the entire acquisition cost of the generic drug.
Because of the reimbursement lag, it may take years for Medicare to
realize the full savings of generic versions
The negative effects of the reimbursement lag are not necessarily limited to the first three quarters of generic availability. Medicare payment amounts will exceed actual market prices anytime ASPs decline. Therefore, when ASPs for a drug with new generic versions
44 The period of initial generic availability is defined as the first three quarters generic
versions were available. 45 Savings estimates for each drug were based on three quarters of analysis (i.e., the
period of initial generic availability), but because the 16 drugs became available in generic form at different times, the three quarters under review varied from drug to drug.
46 Because generic manufacturers for two of the drugs in our analysis did not report any ASPs, we could not calculate the financial impact of new generic versions of these two drugs.
47 These drugs were mycophenolate mofetil oral, albuterol sulfate/ipratropium bromide inhalation solution, and irinotecan injection. Irinotecan may be atypical in that numerous generic manufacturers, rather than one generic manufacturer, reported sales in the period of initial generic availability.
48 The volume-weighted ASP for all versions in the HCPCS code was actually $16.20 per mg, because some providers at that point were still dispensing the brand version of the drug.
O E I - 0 3 - 0 9 - 0 0 5 1 0 M E D I C A R E PAY M E N T S F O R N E W LY AV A I L A B L E G E N E R I C D R U G S 13
F I N D I N G S
continue to fall (possibly because of increasing utilization of generic versions or more generic versions reaching the market), the two-quarter lag has an extended impact because the Medicare payment amount is always slow to reflect the continuously decreasing ASP.
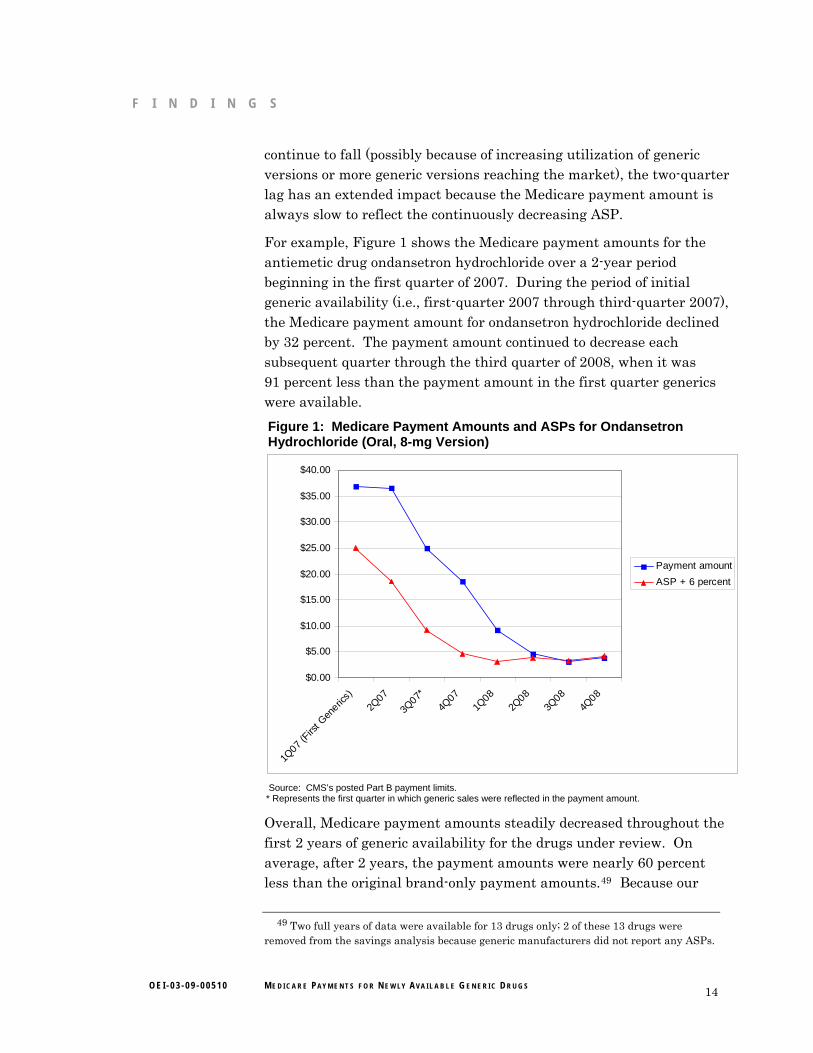
For example, Figure 1 shows the Medicare payment amounts for the antiemetic drug ondansetron hydrochloride over a 2-year period beginning in the first quarter of 2007. During the period of initial generic availability (i.e., first-quarter 2007 through third-quarter 2007), the Medicare payment amount for ondansetron hydrochloride declined by 32 percent. The payment amount continued to decrease each subsequent quarter through the third quarter of 2008, when it was 91 percent less than the payment amount in the first quarter generics were available.
Figure 1: Medicare Payment Amounts and ASPs for Ondansetron Hydrochloride (Oral, 8-mg Version)
$0.00
$5.00
$10.00
$15.00
$20.00
$25.00
$30.00
$35.00
$40.00
1Q07
(Firs
t Gen
erics)
2Q07
3Q07*
4Q07
1Q08
2Q08
3Q08
4Q08
Payment amount
ASP + 6 percent
Source: CMS’s posted Part B payment limits.
* Represents the first quarter in which generic sales were reflected in the payment amount.
Overall, Medicare payment amounts steadily decreased throughout the first 2 years of generic availability for the drugs under review. On average, after 2 years, the payment amounts were nearly 60 percent less than the original brand-only payment amounts.49 Because our
49 Two full years of data were available for 13 drugs only; 2 of these 13 drugs were removed from the savings analysis because generic manufacturers did not report any ASPs.
O E I - 0 3 - 0 9 - 0 0 5 1 0 M E D I C A R E PAY M E N T S F O R N E W LY AV A I L A B L E G E N E R I C D R U G S 14
F I N D I N G S
savings analysis included only the first three quarters of each drug’s generic availability, but the decline in payment amounts continued for up to 2 years, the potential savings of $111 million underestimate the total potential savings that would result if the two-quarter lag were eliminated. See Appendix C for a full list of payment amounts for each drug over a 2-year period.
On average, brand drugs were initially 3 times more expensive than their
generic versions
During the first quarter of generic availability for each drug, the brand versions’ ASPs were, on average, 2.85 times that of their generic equivalents.50 For 1 drug, the brand ASP was over 10 times that of the generic equivalent in the same quarter.
For three drugs in our analysis, brand versions were priced lower than their generic equivalents in the first quarter of generic availability. However, the payment amounts for all three drugs still showed gradual declines, resulting in potential savings for each. For example, in the first quarter of generic availability, the volume-weighted ASP for brand sumatriptan was over 17 percent lower than that of the generic versions. By two quarters later, however, the generic ASP had dropped 59 percent and the brand ASP had dropped 23 percent, resulting in a decrease in overall volume-weighted ASP of 47 percent. This reflected an overall trend in our analysis, as the entry of first-generic versions resulted in a decline in prices over time, whether because of the emergence of lower-priced generics or the lowering of brand prices.
According to FDA, numerous high-expenditure
drugs could have first-generic versions
approved in the next several years
According to FDA, 26 of the 48 brand-only drugs with the highest Part B expenditures have had or may have generic versions
approved for the first time in the next several years. Generic versions of these 26 drugs are expected to gain approval in gradually increasing numbers through 2014.51 These 26 brand drugs had combined Part B expenditures of over $2.8 billion and accounted for 25 percent of Part B
50 Data were available for 12 drugs only. 51 Specifically, 4 of the 26 drugs have become generic since our review began; 4 drugs are
currently eligible for generic approval; an additional 3 drugs may become generic beginning in 2011; 13 drugs may become generic beginning in 2012; 1 drug may become generic beginning in 2013; and 1 drug may become generic beginning in 2014.
O E I - 0 3 - 0 9 - 0 0 5 1 0 M E D I C A R E PAY M E N T S F O R N E W LY AV A I L A B L E G E N E R I C D R U G S 15
F I N D I N G S
drug payments in 2009. If and when these 26 drugs become available in generic form, their payment amounts will be subject to the same two-quarter lag that exists under the ASP-based system.
FDA could not provide exact dates for the expected generic approval of these drugs. Instead, it gave an estimate of the earliest possible date of ANDA approval. The date of actual market entry may differ from this estimate, as external factors, such as patent litigation, may prolong the introduction of generic versions beyond the date of ANDA approval. See Appendix D for a list of these 26 brand-only Part B-covered drugs and their FDA-estimated generic approval times.
Nearly half of the current high-dollar brand-only Part B drugs are biologics;
the ACA recently created a pathway for generic approval of biological
products
The remaining 22 of the top 48 brand-only Part B-covered drugs are biologics, including the 7 Part B drugs with the highest Medicare expenditures in 2009. Prior to the passage of the ACA, no pathway existed for the approval of generic versions of biologics; however, section 7002 of the ACA provides for approval of biosimilars (i.e., generic biologics). As a result, generic forms of these 22 drugs may gain approval in the future.52 In 2009, these 22 biologics accounted for over $5.3 billion in Part B spending. See Appendix E for a list of the top 22 biologics under Part B.
Significant obstacles remain in proactively
identifying newly available generic drugs
Because of issues such as patent litigation and marketing agreements, the date of FDA’s
approval of generic versions often does not coincide with the date of actual generic market entry. In fact, 3 of the 16 generic drugs in our analysis did not reach the market until at least 6 months after FDA’s date of generic approval. See Appendix F for a comparison of the dates of ANDA approvals and the dates of actual generic entry.
Two additional drugs not included in our analysis (gemcitabine and torsemide) were listed by FDA as having had first-generic versions approved during our timeframe (i.e., between first-quarter 2007 and
52 Because of barriers to market entry, the complexities of manufacturing these products,
and a slightly different payment methodology, biologics may not show the same degree of decline in payment amounts when generic versions reach the market, compared to the drugs identified in this report.
O E I - 0 3 - 0 9 - 0 0 5 1 0 M E D I C A R E PAY M E N T S F O R N E W LY AV A I L A B L E G E N E R I C D R U G S 16
F I N D I N G S
second-quarter 2009), but no generic versions appeared to have reached the market as of the fourth quarter of 2009.53 In the case of another drug (budesonide), generic versions were approved by FDA and reached the market for a few days, but as a result of patent litigation, generic versions ceased being marketed during the period under review.54 These issues highlight the complications in predicting when generic versions are likely to become available, making it difficult to anticipate changes in ASPs.
For a number of drugs, generic manufacturers were late to report ASPs or
did not report ASPs at all
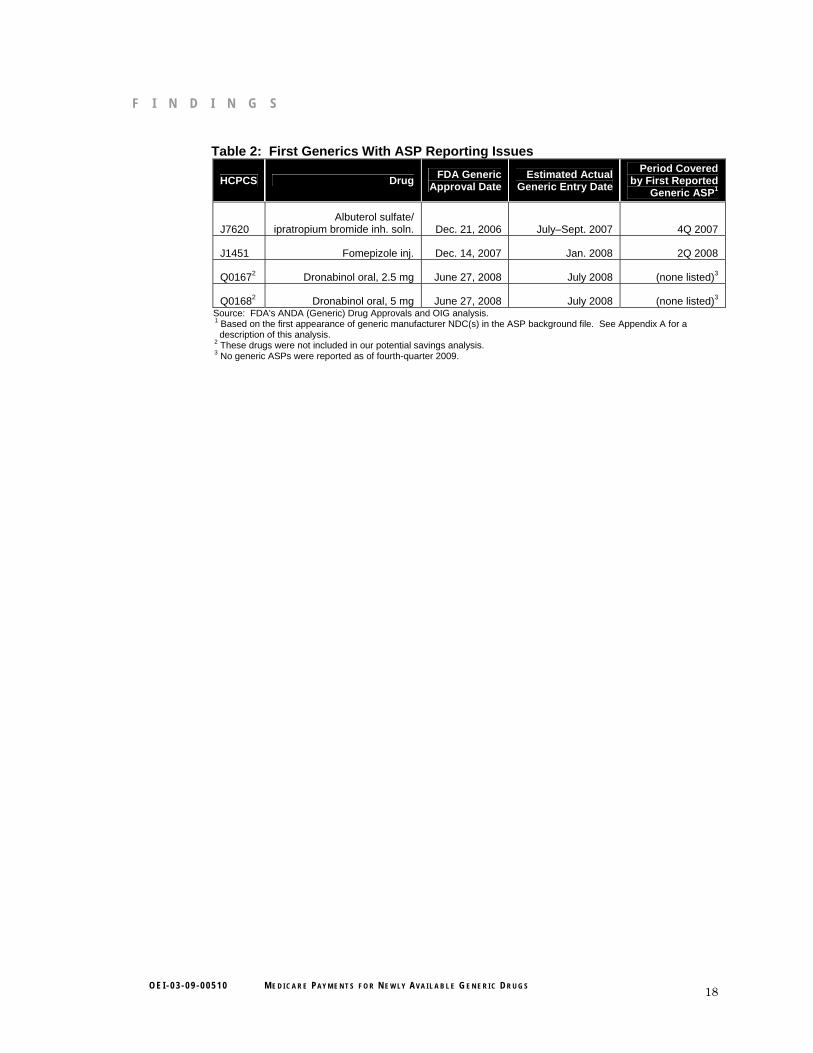
The first-generic ASPs for two drugs (albuterol sulfate/ipratropium bromide inhalation solution and fomepizole injection) were reported one quarter after the actual generic entry date (see Table 2).55 Generic manufacturers for two other drugs never reported ASPs to CMS, despite the drugs’ becoming available in generic form.56
All four drugs with late or unreported generic ASPs were sold by generic manufacturers that had Medicaid drug rebate agreements with CMS at the time of their market entry and were required to report ASPs in the first quarter in which sales occurred. In instances in which ASPs are reported a quarter late or not at all, the Medicare payment amounts take even longer to reflect sales of generics. Had the manufacturers of these newly available generic drugs reported ASPs in a timely fashion, the potential savings to Part B identified in our analysis could have been even greater.
53 Research into CMS’s background files and manufacturer press releases yielded no
evidence of generic versions. 54 In 2009, Medicare and its beneficiaries paid $265 million for budesonide. According to
the settlement agreement with a generic manufacturer, generic budesonide was allowed to be marketed again starting on December 15, 2009. Accessed at http://www.tevapharm.com on July 1, 2010.
55 The manufacturer-reported ASPs for these drugs were determined to have been submitted late based on the fact that generic manufacturers reported NDCs in the monthly AMP files in the quarter before ASPs were reported in the background files for those same NDCs.
56 No generic ASPs were reported as of the fourth quarter of 2009. We will refer the manufacturers of these two drugs to CMS and work with the agency to undertake appropriate action.
O E I - 0 3 - 0 9 - 0 0 5 1 0 M E D I C A R E PAY M E N T S F O R N E W LY AV A I L A B L E G E N E R I C D R U G S 17
F I N D I N G S
Table 2: First Generics With ASP Reporting Issues
HCPCS Drug FDA Generic
Approval Date Estimated Actual
Generic Entry Date
Period Covered by First Reported
Generic ASP1
J7620 Albuterol sulfate/
ipratropium bromide inh. soln. Dec. 21, 2006 July–Sept. 2007 4Q 2007
J1451 Fomepizole inj. Dec. 14, 2007 Jan. 2008 2Q 2008
Q01672 Dronabinol oral, 2.5 mg June 27, 2008 July 2008 (none listed)3
Q01682 Dronabinol oral, 5 mg June 27, 2008 July 2008 (none listed)3 Source: FDA's ANDA (Generic) Drug Approvals and OIG analysis.
1 Based on the first appearance of generic manufacturer NDC(s) in the ASP background file. See Appendix A for a description of this analysis. 2 These drugs were not included in our potential savings analysis.
3 No generic ASPs were reported as of fourth-quarter 2009.
O E I - 0 3 - 0 9 - 0 0 5 1 0 M E D I C A R E PAY M E N T S F O R N E W LY AV A I L A B L E G E N E R I C D R U G S 18
R E C O M M E N D A T I O N S R E C O M M E N D A T I O N
This is the second OIG report to identify systemic vulnerabilities in Part B payments for prescription drugs as a result of the two-quarter lag in reimbursement. We found that payment amounts were significantly higher than market prices for an extended period for the newly available generic drugs under review. In other words, during the period of initial generic availability, generic versions of these drugs were being administered or dispensed to beneficiaries, but Medicare was still paying the brand prices.
Although other government and privately sponsored prescription drug programs are designed to take advantage of lower priced generic drugs (e.g., mandatory generic substitution policies), our findings demonstrate that the Part B reimbursement system fails to capture these potential savings for at least two quarters. CMS has expressed interest in exploring options to improve its reimbursement process, but it has yet to make specific changes. With more than half of the top dollar-volume brand drugs covered under Part B potentially gaining approval in generic form over the next 4 years, and the creation under the ACA of a new approval pathway for generic biologics, this vulnerability will likely continue to grow if CMS does not make changes to its Part B payment system.
We therefore recommend that:
CMS work with Congress to require manufacturers of first generics to
submit monthly ASP data during the period of initial generic availability
If generic manufacturers were required to submit ASP data by the end of each month during the period of initial generic availability, CMS could develop a more appropriate drug payment amount that reflects those generic sales, and set that payment amount for the following quarter. This would substantially reduce the two-quarter lag and would make payment amounts more reflective of actual market prices for newly available generic drugs, thereby taking advantage of their lower prices. CMS could also apply the requirement to manufacturers of generic biologics, once these products begin to be approved.
Our findings also demonstrate that the vulnerability posed by the two-quarter lag is not limited to periods of initial generic availability, as Medicare payment amounts will exceed actual market sales any time ASPs decline. Therefore, if CMS finds that the implementation of a monthly ASP reporting requirement for first generics helps alleviate the financial impact of the two-quarter lag, the agency may wish to consider
O E I - 0 3 - 0 9 - 0 0 5 1 0 M E D I C A R E PAY M E N T S F O R N E W LY AV A I L A B L E G E N E R I C D R U G S 19
R E C O M M E N D A T I O N
transitioning to a monthly ASP reporting system for all Part B-covered drugs.
AGENCY COMMENTS AND OFFICE OF INSPECTOR GENERAL RESPONSE CMS did not concur with our recommendation. CMS stated that requiring manufacturers to submit monthly ASP data would not be feasible for either manufacturers or CMS, and the agency cited the high rates of manufacturer price restatements for monthly AMPs (in contrast to quarterly ASPs) as evidence of the administrative burden of monthly reporting on manufacturers. CMS noted that OIG had identified a number of manufacturers that failed to submit quarterly ASP data, as required, and that this problem could be exacerbated by monthly reporting requirements. The agency recommended that OIG contact these manufacturers to determine why ASPs were not reported and whether any penalties are warranted. CMS went on to state that it is developing a process to identify manufacturers that do not submit quarterly ASPs in a timely manner, and then refer these manufacturers to OIG when appropriate.
CMS also supported the two-quarter lag from a policy perspective, stating that (1) the lag protects Medicare and its beneficiaries from unchecked price increases, as manufacturers may limit raising prices based on their awareness of potential provider reimbursement issues, and (2) the lag leads to the more rapid utilization of generics, as providers have an incentive to quickly switch to lower-priced versions during the limited period when the payment spread is at its highest. CMS also described methods that the agency had considered to lessen the two-quarter lag, and it contended that any policy implementing these approaches would be technically infeasible or lead to more inaccurate and unstable payment rates.
Although the administrative feasibility and compliance burden of any new reporting requirements should be taken into account, OIG believes that the cost savings for Medicare and its beneficiaries that would be achieved by reducing the current reimbursement lag may outweigh any potential issues for CMS and manufacturers. Regarding the latter, OIG is working closely with CMS to improve compliance with price-reporting requirements and recently issued an advisory bulletin notifying manufacturers of a new OIG enforcement initiative that addresses late
O E I - 0 3 - 0 9 - 0 0 5 1 0 M E D I C A R E PAY M E N T S F O R N E W LY AV A I L A B L E G E N E R I C D R U G S 20
R E C O M M E N D A T I O N
and missing data. As part of this initiative, OIG will consider pursuing penalties for manufacturers that fail to report ASPs.
Furthermore, we do not believe the best protection against price inflation should be a reimbursement system that is slow to reflect market trends, or that the best encouragement for generic substitution is one that causes Medicare and its beneficiaries to pay substantially more than provider costs. Rather, the nature of the volume-weighted ASP-based reimbursement system itself (in which all NDCs assigned to one HCPCS code are paid at the same amount) is an incentive for manufacturers to limit rapid price increases, as well as for providers to utilize generic versions. Yet, because of the two-quarter lag, Part B and its beneficiaries are denied significant potential savings when these generic versions first become available. Although we appreciate CMS’s consideration of alternative price reporting timelines, we note that the methods outlined by CMS in its comments are not the only possible approaches. Therefore, the agency’s conclusions about feasibility and price stability may not apply to other methods that could be used to reduce the reimbursement lag.
CMS also expressed concerns with our savings estimate. The agency stated that:
it is not clear from the report that the potential savings of $111 million are not annualized savings;
almost 95 percent of our estimated savings are attributable to three drugs, and therefore not representative of Part B pricing trends overall;
the savings estimate of $111 million assumes that the lag would be completely eliminated, which is administratively impossible; and
OIG’s finding regarding the future availability of generic biologics implies significant potential savings; however, it is uncertain that the two-quarter lag would cause payment gaps for these particular products.
As we state in both the methodology and findings sections of the report, our overall savings estimate is not intended to be an annualized figure; rather the $111 million represents the estimated savings had there been no two-quarter lag during the period of initial generic availability (i.e., up to three quarters) for 16 drugs. Because our findings show that the ASPs for these drugs continued to drop beyond the three quarters of analysis, our estimated savings likely would have been significantly
O E I - 0 3 - 0 9 - 0 0 5 1 0 M E D I C A R E PAY M E N T S F O R N E W LY AV A I L A B L E G E N E R I C D R U G S 21
R E C O M M E N D A T I O N
greater had we calculated the total cost of the two-quarter lag for the entire period from January 2007 to June 2009.
In addition, CMS is correct that three drugs account for the vast majority of the $111 million in potential savings. However, we disagree that this means that our results are not representative. In 2009, 64 HCPCS codes accounted for 90 percent of the $11 billion in expenditures for Part B drugs, with only 13 of these codes representing the majority (52 percent) of spending. Therefore, it follows that our estimates would be largely driven by the savings attributable to the few high-dollar drugs that had new generic versions become available during the period under review. Our findings also illustrate that this trend is likely to continue, as 26 brand drugs representing over $2.8 billion and 25 percent of Part B spending may become generic in the next several years.
Furthermore, we realize that it may be impossible to completely eliminate the reimbursement lag, and that our savings estimate presents a best-case scenario. However, given the high cost and substantial expenditures for many Part B drugs, any reduction in the two-quarter lag would lead to significant savings to the program and to Medicare beneficiaries in the form of reduced coinsurance.
Finally, even though the two-quarter lag may or may not affect generic biologics in the same manner as other Part B drugs, the fact that Medicare and its beneficiaries spent $5.3 billion on just 22 biologic products in 2009 means that any delay in taking advantage of even slightly less expensive generic versions would have a profound impact on the program and its beneficiaries.
For the full text of CMS’s comments, see Appendix G.
O E I - 0 3 - 0 9 - 0 0 5 1 0 M E D I C A R E PAY M E N T S F O R N E W LY AV A I L A B L E G E N E R I C D R U G S 22
A P P E N D I X ~ A
Detailed Methodology for Identifying First-Generic Drugs and Their Dates of Market Entry
1. The Food and Drug Administration’s (FDA) monthly list of first-generic drug
approvals. We first compiled a list of all drugs listed under FDA’s first-generic drug approvals for all months between January 2007 and June 2009. Because we were interested in identifying drugs which became available within our timeframe, we also included drugs in this analysis that were approved within 2 months before our timeframe (i.e., November 2006) in case any of those drugs actually hit the market starting in January 2007. The FDA list provided the drug name, form, strength, and manufacturer but did not list the Healthcare Common Procedure Coding System (HCPCS) code of each drug. Therefore, we had to search the Centers for Medicare & Medicaid Services’ (CMS) crosswalk files by drug name to identify the drug’s HCPCS code and to determine whether the FDA-listed drug was covered under Part B. If a drug name listed by FDA did not clearly match that in the crosswalk file, we did not include it in the analysis.
2. CMS’s quarterly background files. Once we had determined each drug’s HCPCS code, we searched the background files by HCPCS code to identify all manufacturers that reported average sales prices (ASP) for each drug in all quarters in our analysis. Because the first five digits of a national drug code (NDC) denote the manufacturer, we were able to use the NDCs listed in the background files to identify the number of unique manufacturers per drug. We then ran this list of NDCs against the Red Book to exclude any NDCs that the Red Book identified as repackagers. We also excluded any NDCs that CMS had flagged in the background file as being problematic or excluded from the ASP calculation in that quarter. Once we repeated this process in each quarter, we were able to see when a drug went from one manufacturer to multiple manufacturers, thereby indicating the entry of generic versions. The background file also lists a variable to denote whether the drug is a brand or generic version, and this was used as an additional check to confirm that the new manufacturer was marketing a generic version rather than a competing brand version.
3. CMS’s monthly average manufacturer price (AMP) files. We used the monthly AMP files to confirm the date of first-generic entry. Because the AMP files list only NDCs and not HCPCS codes, we had to rely
O E I - 0 3 - 0 9 - 0 0 5 1 0 M E D I C A R E PAY M E N T S F O R N E W LY AV A I L A B L E G E N E R I C D R U G S 23
A P P E N D I X ~ A
on the NDCs listed in the background files to identify NDCs in the AMP files.
4. Red Book. We repeated the same process used in the AMP analysis to identify the earliest appearance of an NDC in the Red Book.
5. Manufacturer press releases. We researched manufacturer press releases and Web sites to confirm generic drug NDCs and dates of market entry.
There were often discrepancies in the dates of generic entry given by the above data sources. In most instances of discrepancies, we chose the consensus when most of these data sources were in agreement on the date of market entry. When the background file was the only data source to report a different date, we took this to mean that the manufacturer was late to report ASPs in the background file. In instances in which there was no clear consensus (3 of the 16 drugs), we deferred to the earliest listed generic market entry date among all data sources. For example, if a drug was listed in the background files starting in first-quarter 2008 but was not listed in the AMP files until May 2008, we assumed the date of generic market entry was the first quarter of 2008. If it was not clear whether a drug had first-generic versions become available within our timeframe, it was not included in the analysis. We also excluded from our savings analysis drugs from manufacturers that failed to report any generic NDCs in the background files.
O E I - 0 3 - 0 9 - 0 0 5 1 0 M E D I C A R E PAY M E N T S F O R N E W LY AV A I L A B L E G E N E R I C D R U G S 24
A P P E N D I X ~ B
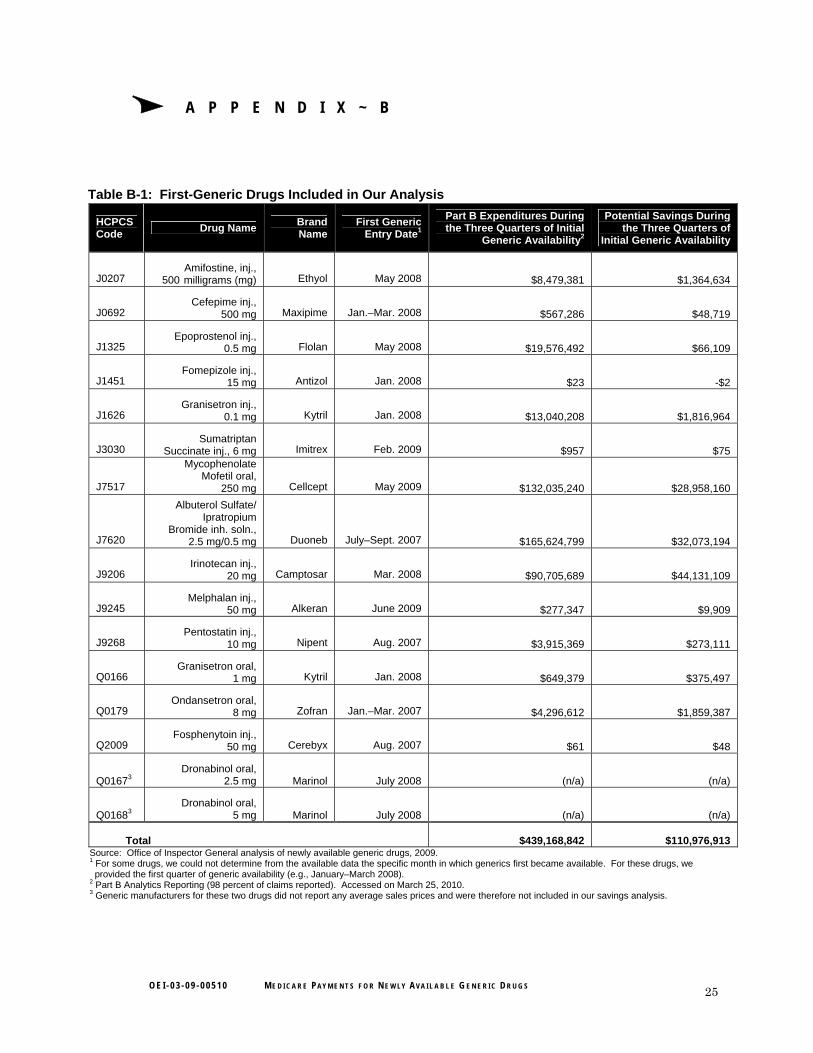
Table B-1: First-Generic Drugs Included in Our Analysis
HCPCS Code
Drug Name Brand Name
First Generic Entry Date1
Part B Expenditures During the Three Quarters of Initial
Generic Availability2
Potential Savings During the Three Quarters of
Initial Generic Availability
J0207 Amifostine, inj.,
500 milligrams (mg) Ethyol May 2008 $8,479,381 $1,364,634
J0692 Cefepime inj.,
500 mg Maxipime Jan.–Mar. 2008 $567,286 $48,719
J1325 Epoprostenol inj.,
0.5 mg Flolan May 2008 $19,576,492 $66,109
J1451 Fomepizole inj.,
15 mg Antizol Jan. 2008 $23 -$2
J1626 Granisetron inj.,
0.1 mg Kytril Jan. 2008 $13,040,208 $1,816,964
J3030 Sumatriptan
Succinate inj., 6 mg Imitrex Feb. 2009 $957 $75
J7517
Mycophenolate Mofetil oral,
250 mg Cellcept May 2009 $132,035,240 $28,958,160
J7620
Albuterol Sulfate/ Ipratropium
Bromide inh. soln., 2.5 mg/0.5 mg Duoneb July–Sept. 2007 $165,624,799 $32,073,194
J9206 Irinotecan inj.,
20 mg Camptosar Mar. 2008 $90,705,689 $44,131,109
J9245 Melphalan inj.,
50 mg Alkeran June 2009 $277,347 $9,909
J9268 Pentostatin inj.,
10 mg Nipent Aug. 2007 $3,915,369 $273,111
Q0166 Granisetron oral,
1 mg Kytril Jan. 2008 $649,379 $375,497
Q0179 Ondansetron oral,
8 mg Zofran Jan.–Mar. 2007 $4,296,612 $1,859,387
Q2009 Fosphenytoin inj.,
50 mg Cerebyx Aug. 2007 $61 $48
Q01673 Dronabinol oral,
2.5 mg Marinol July 2008 (n/a) (n/a)
Q01683 Dronabinol oral,
5 mg Marinol July 2008 (n/a) (n/a)
Total $439,168,842 $110,976,913 Source: Office of Inspector General analysis of newly available generic drugs, 2009. 1 For some drugs, we could not determine from the available data the specific month in which generics first became available. For these drugs, we provided the first quarter of generic availability (e.g., January–March 2008). 2 Part B Analytics Reporting (98 percent of claims reported). Accessed on March 25, 2010. 3 Generic manufacturers for these two drugs did not report any average sales prices and were therefore not included in our savings analysis.
O E I - 0 3 - 0 9 - 0 0 5 1 0 M E D I C A R E PAY M E N T S F O R N E W LY AV A I L A B L E G E N E R I C D R U G S 25
A P P E N D I X ~ C
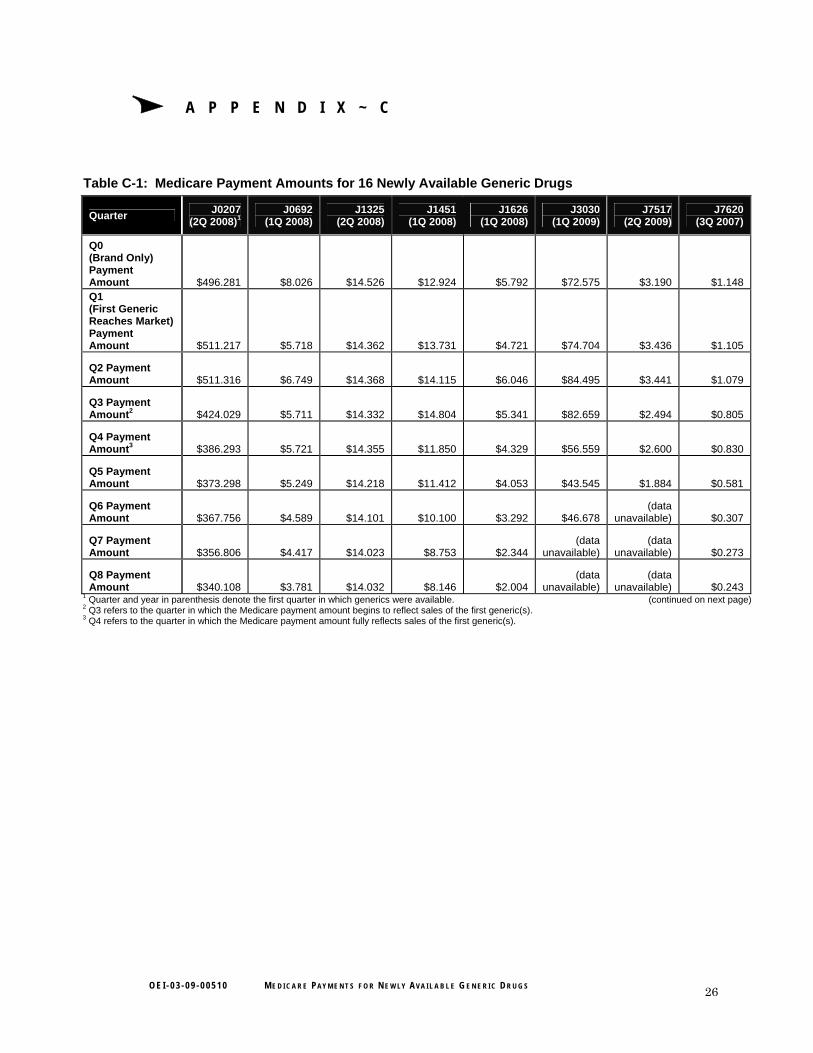
Table C-1: Medicare Payment Amounts for 16 Newly Available Generic Drugs
Quarter J0207
(2Q 2008)1 J0692
(1Q 2008) J1325
(2Q 2008) J1451
(1Q 2008) J1626
(1Q 2008) J3030
(1Q 2009) J7517
(2Q 2009) J7620
(3Q 2007)
Q0 (Brand Only) Payment Amount $496.281 $8.026 $14.526 $12.924 $5.792 $72.575 $3.190 $1.148Q1 (First Generic Reaches Market) Payment Amount $511.217 $5.718 $14.362 $13.731 $4.721 $74.704 $3.436 $1.105
Q2 Payment Amount $511.316 $6.749 $14.368 $14.115 $6.046 $84.495 $3.441 $1.079
Q3 Payment Amount2 $424.029 $5.711 $14.332 $14.804 $5.341 $82.659 $2.494 $0.805
Q4 Payment Amount3 $386.293 $5.721 $14.355 $11.850 $4.329 $56.559 $2.600 $0.830
Q5 Payment Amount $373.298 $5.249 $14.218 $11.412 $4.053 $43.545 $1.884 $0.581
Q6 Payment Amount $367.756 $4.589 $14.101 $10.100 $3.292 $46.678
(data unavailable) $0.307
Q7 Payment Amount $356.806 $4.417 $14.023 $8.753 $2.344
(data unavailable)
(data unavailable) $0.273
Q8 Payment Amount $340.108 $3.781 $14.032 $8.146 $2.004
(data unavailable)
(data unavailable) $0.243
1 Quarter and year in parenthesis denote the first quarter in which generics were available. (continued on next page) 2 Q3 refers to the quarter in which the Medicare payment amount begins to reflect sales of the first generic(s). 3 Q4 refers to the quarter in which the Medicare payment amount fully reflects sales of the first generic(s).
O E I - 0 3 - 0 9 - 0 0 5 1 0 M E D I C A R E PAY M E N T S F O R N E W LY AV A I L A B L E G E N E R I C D R U G S 26
A P P E N D I X ~ C
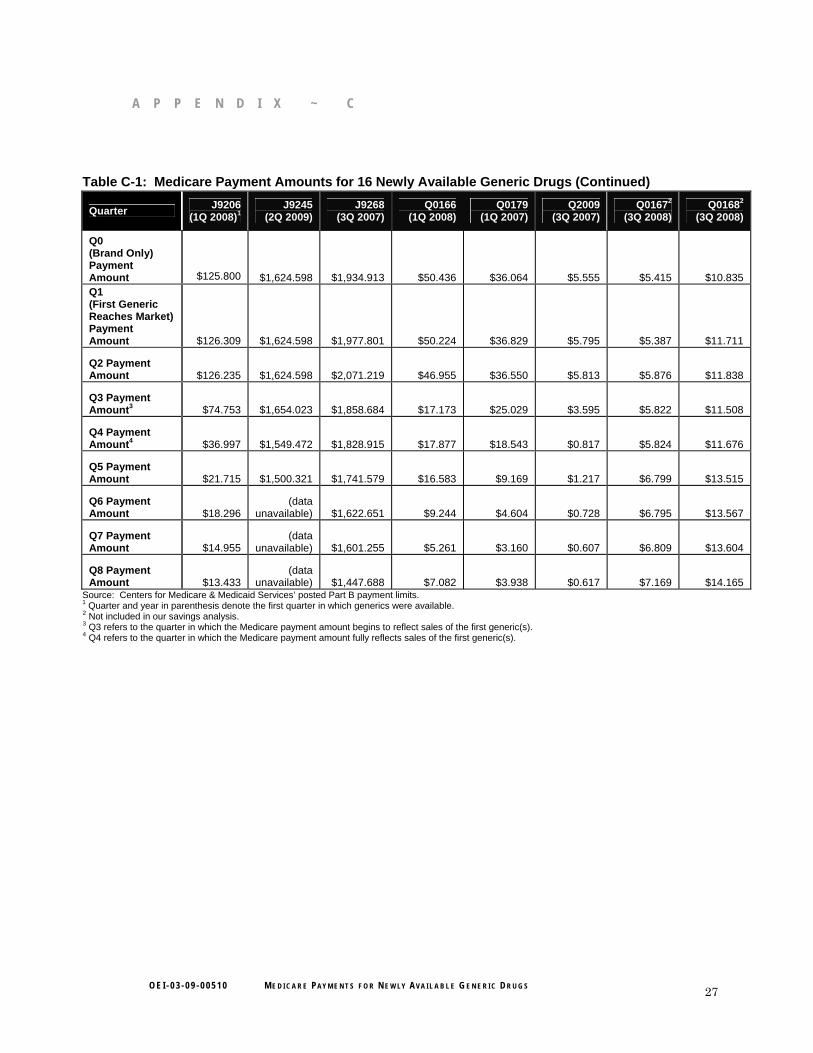
Table C-1: Medicare Payment Amounts for 16 Newly Available Generic Drugs (Continued)
Quarter J9206
(1Q 2008)1 J9245
(2Q 2009) J9268
(3Q 2007) Q0166
(1Q 2008) Q0179
(1Q 2007) Q2009
(3Q 2007) Q01672
(3Q 2008) Q01682
(3Q 2008)
Q0 (Brand Only) Payment Amount $125.800 $1,624.598 $1,934.913 $50.436 $36.064 $5.555 $5.415 $10.835 Q1 (First Generic Reaches Market) Payment Amount $126.309 $1,624.598 $1,977.801 $50.224 $36.829 $5.795 $5.387 $11.711
Q2 Payment Amount $126.235 $1,624.598 $2,071.219 $46.955 $36.550 $5.813 $5.876 $11.838
Q3 Payment Amount3 $74.753 $1,654.023 $1,858.684 $17.173 $25.029 $3.595 $5.822 $11.508
Q4 Payment Amount4 $36.997 $1,549.472 $1,828.915 $17.877 $18.543 $0.817 $5.824 $11.676
Q5 Payment Amount $21.715 $1,500.321 $1,741.579 $16.583 $9.169 $1.217 $6.799 $13.515
Q6 Payment Amount $18.296
(data unavailable) $1,622.651 $9.244 $4.604 $0.728 $6.795 $13.567
Q7 Payment Amount $14.955
(data unavailable) $1,601.255 $5.261 $3.160 $0.607 $6.809 $13.604
Q8 Payment Amount $13.433
(data unavailable) $1,447.688 $7.082 $3.938 $0.617 $7.169 $14.165
Source: Centers for Medicare & Medicaid Services’ posted Part B payment limits. 1 Quarter and year in parenthesis denote the first quarter in which generics were available. 2 Not included in our savings analysis. 3 Q3 refers to the quarter in which the Medicare payment amount begins to reflect sales of the first generic(s). 4 Q4 refers to the quarter in which the Medicare payment amount fully reflects sales of the first generic(s).
O E I - 0 3 - 0 9 - 0 0 5 1 0 M E D I C A R E PAY M E N T S F O R N E W LY AV A I L A B L E G E N E R I C D R U G S 27
A P P E N D I X ~ D
Table D-1: Estimated Generic Approval Timeline for the Top 26 Dollar-Volume Brand-Only Part B
Drugs (Biologics Excluded), According to FDA
Drug Name Brand Name FDA-Estimated Generic
Approval Timeline1 2009 Part B
Expenditures2 2009 Part B
Rank3
Oxaliplatin Eloxatin Approved in generic form4 $307,305,870 8
Docetaxel Taxotere After February 10, 2012 $273,059,887 9
Zoledronic acid Zometa After April 30, 2012 $228,200,463 12
Pemetrexed Alimta Currently eligible for approval $224,725,011 13
Gemcitabine hydrochloride Gemzar Approved in generic form $214,841,468 14
Bortezomib Velcade After August 31, 2011 $157,915,565 19
Leuprolide acetate Lupron Approved in generic form $148,807,207 20
Palonosetron hydrochloride Aloxi After April 30, 2012 $141,432,119 22
Treprostinil sodium Remodulin After April 30, 2012 $112,277,602 26
Octreotide acetate Sandostatin Lar Depot After April 30, 2012 $107,672,719 28
Azacitidine Vidaza After May 19, 2011 $101,648,346 29
Zoledronic acid Reclast After May 18, 2011 $100,768,293 30
Arformoterol tartrate Brovana After March 30, 2012 $77,081,333 32
Paclitaxel protein-bound Abraxane After April 30, 2012 $72,033,094 36
Adenosine Adenoscan Currently eligible for approval
(legal disputes remain) $69,316,718 39
Triptorelin pamoate Trelstar After April 30, 2012 $67,684,223 40
Decitabine Dacogen After May 2, 2013 $62,196,704 42
Doxorubicin hydrochloride liposome Doxil After May 17, 2014 $49,619,144 47
Iloprost Ventavis Currently eligible for approval $48,970,602 48
Mycophenolate acid Myfortic After January 17, 2012 $46,469,720 51
Sirolimus Rapamune After April 30, 2012 $45,449,381 52
Topotecan hydrochloride Hycamtin Approved in generic form $43,430,255 54
Fulvestrant Faslodex After March 30, 2012 $40,709,396 57
Ibandronate sodium Boniva Currently eligible for approval $25,710,811 66
Imiglucerase Cerezyme After April 30, 2012 $24,355,150 70
Verteporfin Visudyne After April 30, 2012 $17,308,914 80
Total $2,808,989,996 Source: Food and Drug Administration (FDA) analysis of Part B drugs, 2009. 1 Approximate date of April 30, 2012, is used by FDA to estimate how long it would take to approve an abbreviated new drug application if it is submitted before November 10, 2009, with a Paragraph IV Patent Certification. 2 Part B Analytics Reporting (98 percent of claims reported). Accessed on March 29, 2010. Figures do not add to total because of rounding. 3 Rankings include single-source drugs, multiple-source drugs, and biologics. 4 Generic versions of this drug were initially approved and marketed, but litigation brought by the brand manufacturer against the generic manufacturers resulted in the discontinuation of generic sales.
O E I - 0 3 - 0 9 - 0 0 5 1 0 M E D I C A R E PAY M E N T S F O R N E W LY AV A I L A B L E G E N E R I C D R U G S 28
A P P E N D I X ~ E
Table E-1: Top 22 Dollar-Volume Biologics Under Part B
Source: Food and Drug Administration analysis of Part B drugs, 2009. 1 Part B Analytics Reporting (98 percent of claims reported). Accessed on March 29, 2010. 2 Rankings include single-source drugs, multiple-source drugs, and biologics.
Drug Name Brand Name 2009 Part B
Expenditures1 2009 Part B
Rank2
Ranibizumab Lucentis $814,869,580 1
Rituximab Rituxan $807,136,671 2
Bevacizumab Avastin $723,336,581 3
Infliximab Remicade $605,603,464 4
Pegfilgrastim Neulasta $493,788,366 5
Darbepoetin alfa Aranesp $426,599,502 6
Epoetin alfa Epogen/Procrit $332,792,303 7
Trastuzumab Herceptin $211,603,637 15
Cetuximab Erbitux $165,132,074 18
Abatacept Orencia $145,050,591 21
Antihemophilic factor VIII (Recombinant) (All brands) $125,289,250 24
Botulinum toxin type A Botox $88,997,730 31
Coagulation factor VIIa Novoseven $74,330,848 33
Filgrastim Neupogen $69,897,511 38
Natalizumab Tysabri $54,497,650 46
Omalizumab Xolair $43,285,268 55
Immune globulin Vivaglobin $42,709,895 56
Immune globulin Gammagard Liquid $30,226,662 61
Panitumumab Vectibix $27,170,683 63
Coagulation factor IX Recombinant Benefix $25,176,467 67
Antihemophilic factor VIII:C Human (All brands) $24,453,801 69
Immune globulin, powder (All brands) $21,200,286 74
Total $5,353,148,820
O E I - 0 3 - 0 9 - 0 0 5 1 0 M E D I C A R E PAY M E N T S F O R N E W LY AV A I L A B L E G E N E R I C D R U G S 29
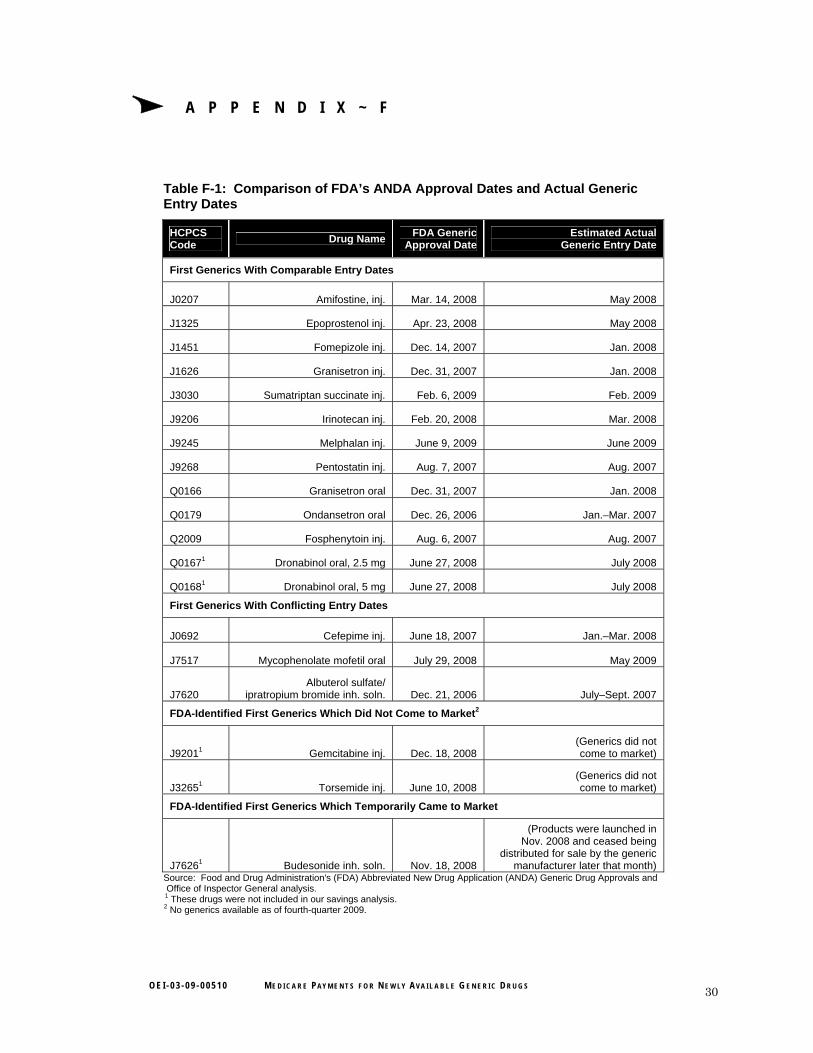
A P P E N D I X ~ F
Table F-1: Comparison of FDA’s ANDA Approval Dates and Actual Generic Entry Dates
HCPCS Code
Drug Name FDA Generic
Approval Date Estimated Actual
Generic Entry Date
First Generics With Comparable Entry Dates
J0207 Amifostine, inj. Mar. 14, 2008 May 2008
J1325 Epoprostenol inj. Apr. 23, 2008 May 2008
J1451 Fomepizole inj. Dec. 14, 2007 Jan. 2008
J1626 Granisetron inj. Dec. 31, 2007 Jan. 2008
J3030 Sumatriptan succinate inj. Feb. 6, 2009 Feb. 2009
J9206 Irinotecan inj. Feb. 20, 2008 Mar. 2008
J9245 Melphalan inj. June 9, 2009 June 2009
J9268 Pentostatin inj. Aug. 7, 2007 Aug. 2007
Q0166 Granisetron oral Dec. 31, 2007 Jan. 2008
Q0179 Ondansetron oral Dec. 26, 2006 Jan.–Mar. 2007
Q2009 Fosphenytoin inj. Aug. 6, 2007 Aug. 2007
Q01671 Dronabinol oral, 2.5 mg June 27, 2008 July 2008
Q01681 Dronabinol oral, 5 mg June 27, 2008 July 2008
First Generics With Conflicting Entry Dates
J0692 Cefepime inj. June 18, 2007 Jan.–Mar. 2008
J7517 Mycophenolate mofetil oral July 29, 2008 May 2009
J7620 Albuterol sulfate/
ipratropium bromide inh. soln. Dec. 21, 2006 July–Sept. 2007
FDA-Identified First Generics Which Did Not Come to Market2
J92011 Gemcitabine inj. Dec. 18, 2008 (Generics did not come to market)
J32651 Torsemide inj. June 10, 2008 (Generics did not come to market)
FDA-Identified First Generics Which Temporarily Came to Market
J76261 Budesonide inh. soln. Nov. 18, 2008
(Products were launched in Nov. 2008 and ceased being
distributed for sale by the generic manufacturer later that month)
Source: Food and Drug Administration's (FDA) Abbreviated New Drug Application (ANDA) Generic Drug Approvals and Office of Inspector General analysis.
1 These drugs were not included in our savings analysis.
2 No generics available as of fourth-quarter 2009.
O E I - 0 3 - 0 9 - 0 0 5 1 0 M E D I C A R E PAY M E N T S F O R N E W LY AV A I L A B L E G E N E R I C D R U G S 30
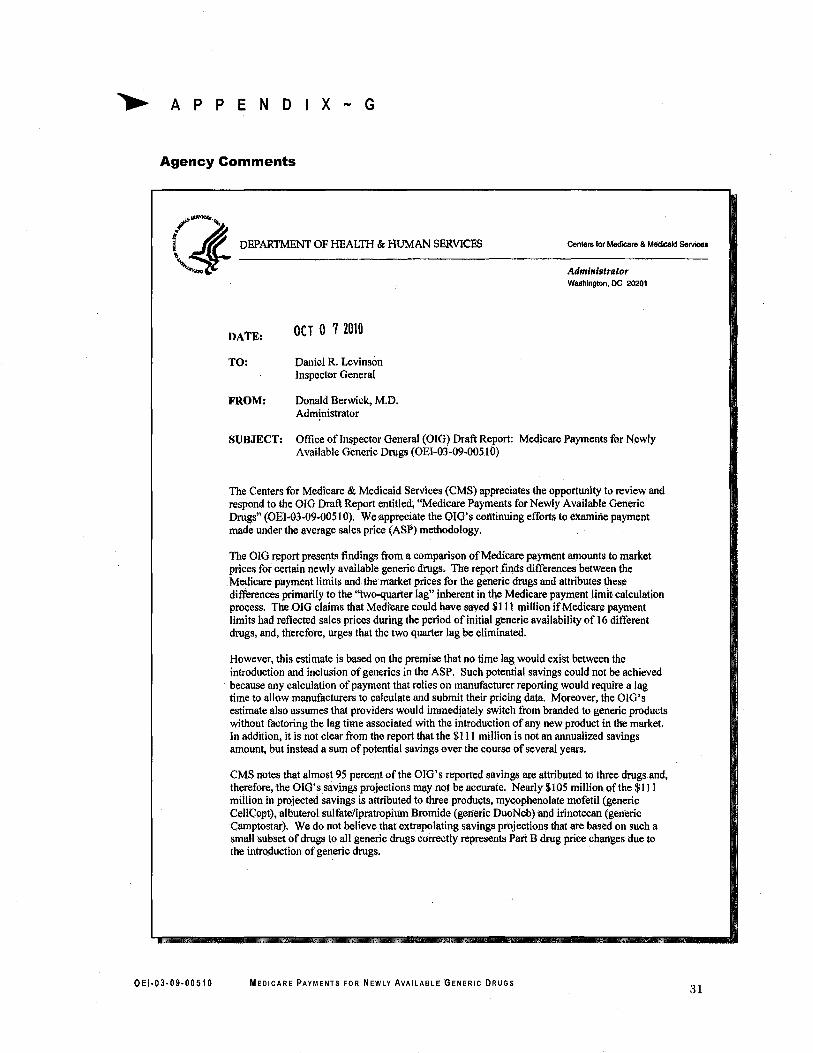
A P PEN 0 x G
Agency Comments
/- ... ( ~ DEPARTMENT OF HEALTH & HUMAN SERVICES Cenlers for MedIcare & Medicaid Services
,~ AdministrAtor Washington, DC 20201
OCT 0 7 2010DATE:
TO: Daniel R. Levinson Inspector General
FROM: Donald Berwick, M.D. Administrator
SUBJECT: Office of Inspector General (OIG) Draft Report: Medicare Payments for Newly Available Generic Drugs (OEI"03-09-0051 0)
The Centers for Medicare & Medicaid Services (CMS) appreciates the opportunity to review and respond to the OIG Draft Report entitled, "Medicare Payments for Newly Available Generic Drugs" (OEI-03-09-0051 0). We appreciate the OIG's continuing efforts to examine payment made under the average sales price (ASP) methodology.
The OIG report presents findings from a comparison ofMedicare payment amounts to market prices for certain newly available generic drugs. The report finds differences between the Medicare payment limits and the market prices for the generic drugs and attributes these differences primarily to the "two-quarter lag" inherent in the Medicare payment limit calculation process. The OIG claims that Medicare could have saved $111 million ifMedicare payment limits had reflected sales prices during the period of initial generic availability of 16 different drugs, and, therefore, urges that the two quarter lag be eliminated.
However, this estimate is based on the premise that no time lag would exist between the introduction and inclusion of generics in the ASP. Such potential savings could not be achieved because any calculation of payment that relies on manufacturer reporting would require a lag time to allow manufacturers to calculate and submit their pricing data. Moreover, the 01G's estimate also assumes that providers would immediately switch from branded to generic products without factoring the lag time associated with the introduction ofany new product in the market. In addition, it is not clear from the report that the $111 million is not an annualized savings amount, but instead a sum of potential savings over the course of several years.
CMS notes that almost 95 percent of the OIG's reported savings are attributed to three drugs and, therefore, the 0I0's savings projections may not be accurate. Nearly $105 million of the $111 million in projected savings is attributed to three products, mycophenolate mofetil (generic CeIlCept), albuterol sulfateiipratropium Bromide (generic DuoNeb) and irinotecan (generic Camptostar). We do not believe that extrapolating savings projections that are based on such a small subset of drugs to all generic drugs correctly represents Part B drug price changes due to the introduction ofgeneric drugs.
OEI·03·09·00510 MEDICARE PAYMENTS FOR NEWLY AVAILABLE GENERIC DRUGS 31
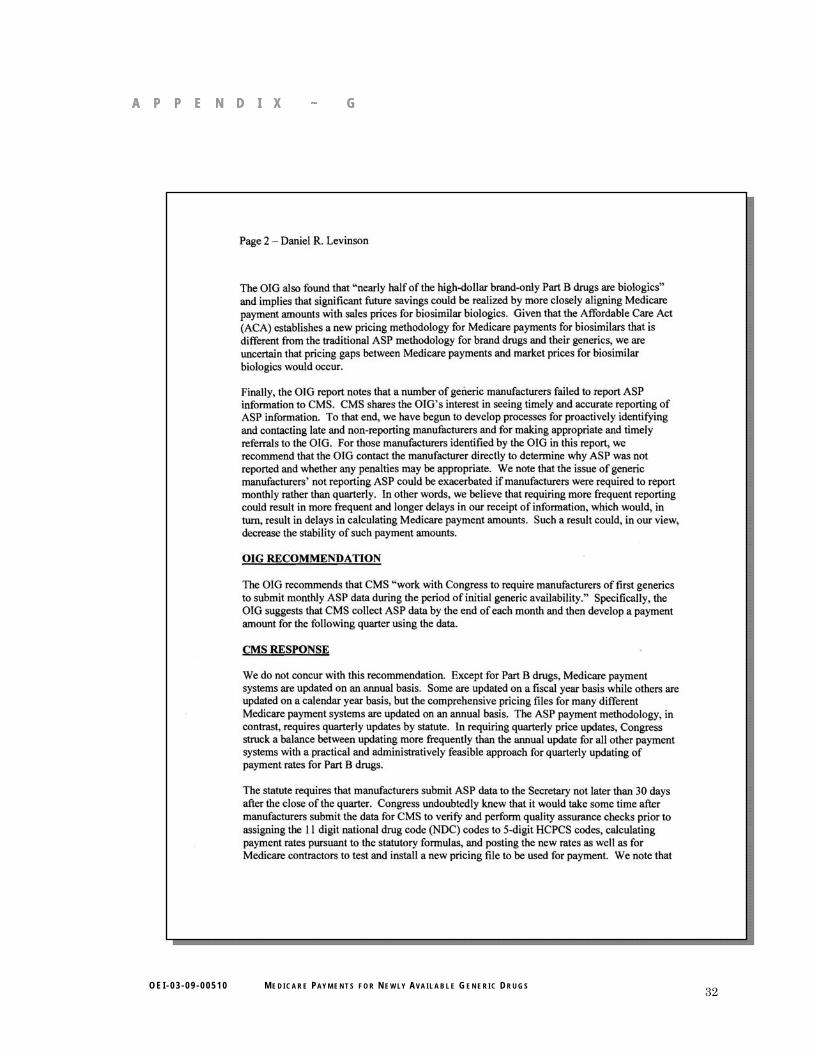
A P P E N D I X ~ G A P P E N D I X ~ G
O E I - 0 3 - 0 9 - 0 0 5 1 0 M E D I C A R E PAY M E N T S F O R N E W LY AV A I L A B L E G E N E R I C D R U G S 32
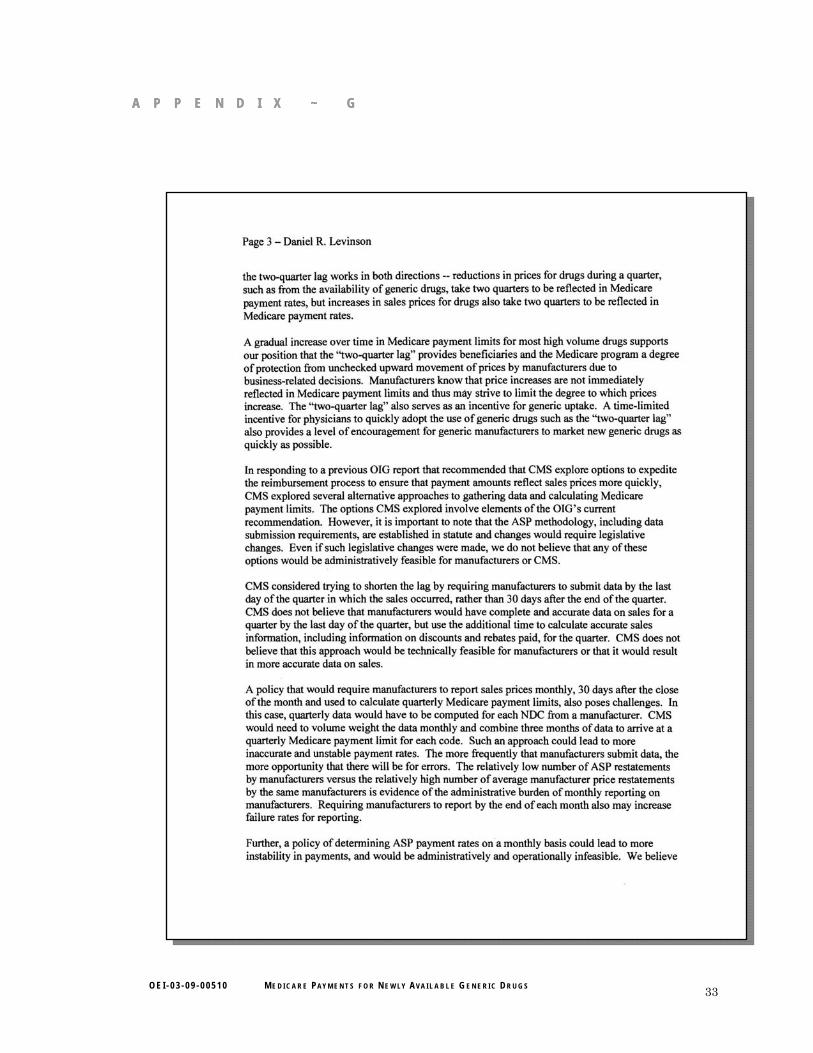
A P P E N D I X ~ G A P P E N D I X ~ G
O E I - 0 3 - 0 9 - 0 0 5 1 0 M E D I C A R E PAY M E N T S F O R N E W LY AV A I L A B L E G E N E R I C D R U G S 33
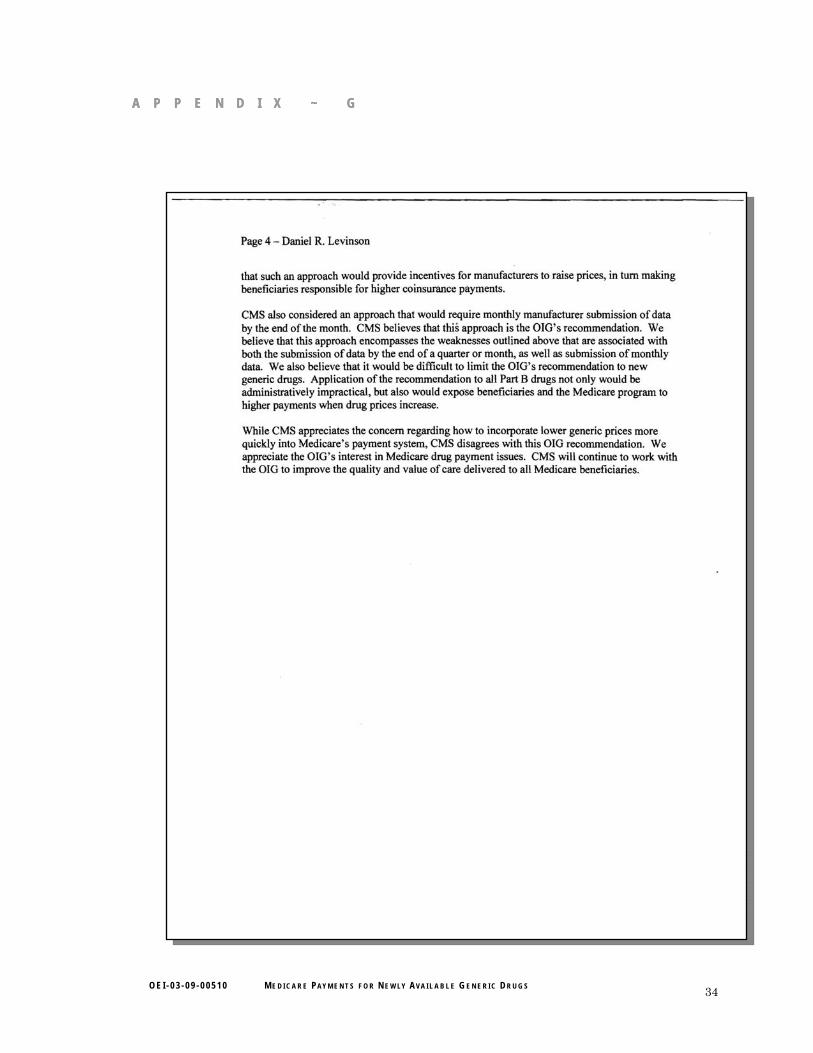
A P P E N D I X ~ G A P P E N D I X ~ G
O E I - 0 3 - 0 9 - 0 0 5 1 0 M E D I C A R E PAY M E N T S F O R N E W LY AV A I L A B L E G E N E R I C D R U G S 34
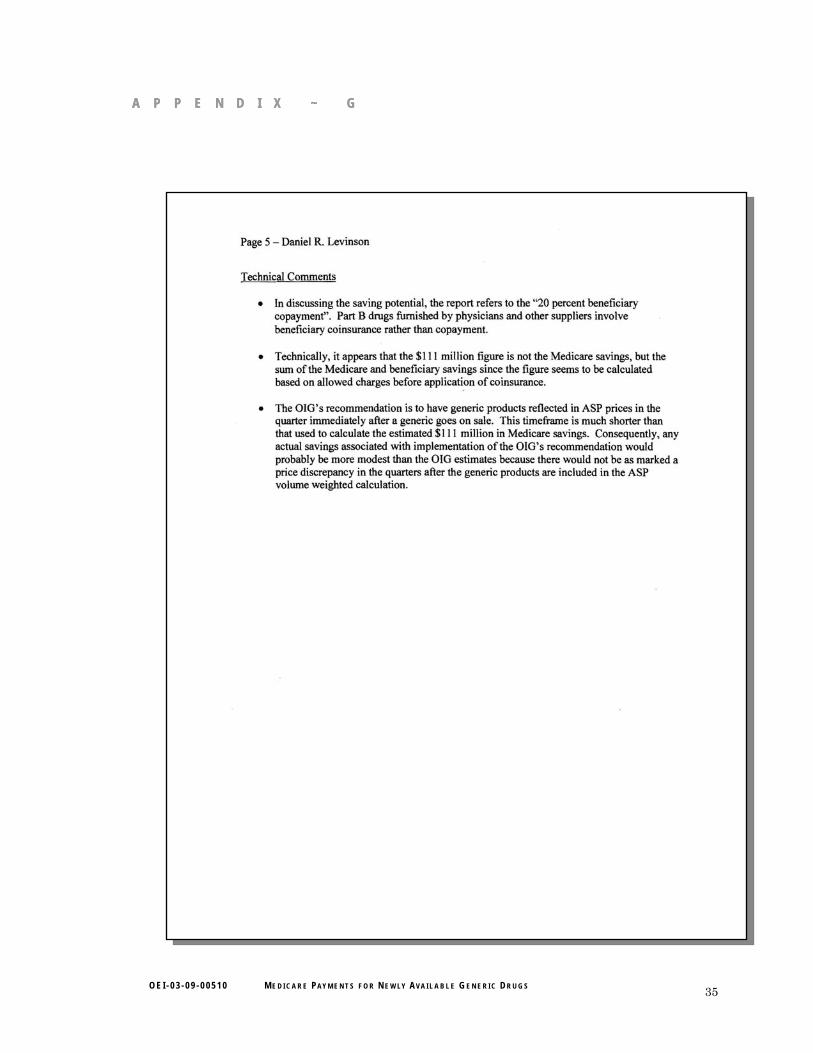
A P P E N D I X ~ G A P P E N D I X ~ G
O E I - 0 3 - 0 9 - 0 0 5 1 0 M E D I C A R E PAY M E N T S F O R N E W LY AV A I L A B L E G E N E R I C D R U G S 35
O E I - 0 3 - 0 9 - 0 0 5 1 0 M E D I C A R E PAY M E N T S F O R N E W LY AV A I L A B L E G E N E R I C D R U G S 36
A C K N O W L E D G M E N T S
This report was prepared under the direction of Robert A. Vito, Regional Inspector General for Evaluation and Inspections in the Philadelphia regional office, and David E. Tawes, Director of the Medicare and Medicaid Prescription Drug Unit.
Kevin McAloon served as lead analyst for this study. Central office staff who contributed include Natasha Franklin, Kevin Manley, and Scott Manley.
Office of Inspector General http://oig.hhs.gov
The mission of the Office of Inspector General (OIG), as mandated by Public Law 95-452, as amended, is to protect the integrity of the Department of Health and Human Services (HHS) programs, as well as the health and welfare of beneficiaries served by those programs. This statutory mission is carried out through a nationwide network of audits, investigations, and inspections conducted by the following operating components:
Office of Audit Services The Office of Audit Services (OAS) provides auditing services for HHS, either by conducting audits with its own audit resources or by overseeing audit work done by others. Audits examine the performance of HHS programs and/or its grantees and contractors in carrying out their respective responsibilities and are intended to provide independent assessments of HHS programs and operations. These assessments help reduce waste, abuse, and mismanagement and promote economy and efficiency throughout HHS.
Office of Evaluation and Inspections The Office of Evaluation and Inspections (OEI) conducts national evaluations to provide HHS, Congress, and the public with timely, useful, and reliable information on significant issues. These evaluations focus on preventing fraud, waste, or abuse and promoting economy, efficiency, and effectiveness of departmental programs. To promote impact, OEI reports also present practical recommendations for improving program operations.
Office of Investigations The Office of Investigations (OI) conducts criminal, civil, and administrative investigations of fraud and misconduct related to HHS programs, operations, and beneficiaries. With investigators working in all 50 States and the District of Columbia, OI utilizes its resources by actively coordinating with the Department of Justice and other Federal, State, and local law enforcement authorities. The investigative efforts of OI often lead to criminal convictions, administrative sanctions, and/or civil monetary penalties.
Office of Counsel to the Inspector General The Office of Counsel to the Inspector General (OCIG) provides general legal services to OIG, rendering advice and opinions on HHS programs and operations and providing all legal support for OIG’s internal operations. OCIG represents OIG in all civil and administrative fraud and abuse cases involving HHS programs, including False Claims Act, program exclusion, and civil monetary penalty cases. In connection with these cases, OCIG also negotiates and monitors corporate integrity agreements. OCIG renders advisory opinions, issues compliance program guidance, publishes fraud alerts, and provides other guidance to the health care industry concerning the anti-kickback statute and other OIG enforcement authorities.
Recommended