Operating Experience with Biogas Plants in Sri Lanka L.C.A. de S. WIJESINGHE and J.A. CHANDRASIRI
Natural Resources, Energy and Science Authority, Vidya Mawatha, Colombo 7, Sri Lanka
Three hundred and three biogas plants, representing a majority of the units installed in Sri Lanka up to 1984, were inspected, and it was found that 280 of these had been put into commission at some time prior to the study. Of the 280 commissioned plants, 170 (61%) were functioning satisfactorily providing biogas for cooking and/or lighting. The. remaining 110 (39%) were either not functioning or were supplyin very little gas owing to gas leaks, inadequate input of dung, or poor plant management. The most
common plant was the 6 m , fixed dome, household plant, and the most common raw material used was cattle dung. In the majority of household plants the cost of construction was partly or wholly subsidized.
9 .
1. INTRODUCTION Biogas is the gas that is produced when animal dung or other organic matter undergoes anaero- bic digestion. It consists mainly of methane and carbon dioxide. The presence of the former makes biogas inflammable and therefore usable as a fuel. In the search for cheap, indigenous sources of energy to reduce the demand on fossil fuels, many countries, both developing and de- veloped, have devoted attention to advancing biogas technology; but in terms of its possible economic and social benefit the greatest potential of biogas lies in the oil importing, developing countries. A biogas plant, besides producing fuel, also yields a waste sludge which can be used as a fertilizer.
With the price of commercial fuel rising sharply in the long term, it is obvious that in most countries attention should be focused on alterna- tive indigenous fuels and improved technologies of fuel use. Sri Lanka is a country with a farming tradition, and one would have expected biogas to be given serious consideration as an alternative household fuel. However, even as late as 1979, six
years after the first fuel crisis, it was reported that there were only two successful biogas units in the country (Gosling, 1979). As a result of a heavy subsidy on kerosene introduced by the govern- ment following the first fuel crisis, cheap kerosene was available in the market up to 1979, and it is likely that this factor acted as a strong disincentive in the development of alternative energy resources. From 1979 onwards the subsidy was reduced in stages, and a kerosene stamp scheme was introduced to enable the needy to obtain a small quantity of kerosene free of charge each month.
Several government institutions in Sri Lanka have started to promote biogas as a fuel and have set up an extension programme for biogas tech- nology. A few non-government institutions have also taken to promoting the use of biogas as a fuel. Casual estimates made by those involved in biogas promotion work lead one to believe that by early 1984 several hundred units had been set up throughout the country.
In discussions with energy sector officials, those directly involved in biogas extension work gener-
L.C.A. de S. Wijesinghe is a forester by training. From 19SR to 1977 he served as a professional forester in the Sri Lanka Forest Department. Since 1977 he has been the Additional Director General of the Natural Resources, Energy and Science Authority of Sri Lanka. During this period his special interest was energy and he carried out a number of national surveys on energy use in the
household sector. The present study is one of these. J.A. Chandrasiri is a graduate in physicalsciences from the University of Sri Lanka. He joined the Natural Resources, Energy and
Science Authority as a Staff Assktant and in that capacity he assisted the senior author in a number of national energy surveys.
Natural Resources Forum 0 United Nations, New York, 1986
22 1
222 de S . WIJESINGHE and CHANDRASIRI NRF VOL. 10, NO. 3,1986
ally spoke enthusiastically of the benefits to be derived from the widespread use of biogas, but some of the others expressed scepticism. The latter generally referred to the high cost of installing a biogas unit, the scarcity of dung, technical problems in the maintenance of the biogas plant, and the fact that the increment to the national energy supply which even an ex- panded biogas programme would be expected to contribute is relatively small. Those who favoured promoting the use of biogas as a fuel saw the impact it could have in raising the quality of life of rural households by providing both vastly im- proved lighting and cooking facilities and a high quality fertilizer. Because of the conflicting views that were expressed, and considering that by 1984 several hundred biogas units were said to have been set up throughout the country, the authors decided to carry out a field study to evaluate the programme at its present stage.
2. METHODOLOGY Information on the ownership and location of biogas units was obtained from government and non-government institutions which were involved in biogas extension work, and the owners were informed by post of the proposed study and the intended visit by an officer of the Natural Resources, Energy and Science Authority. When field visits were made, the officer often received information on the existence of other units in the locality.
Data were collected on the following: the capacity, type (design) and condition (whether functioning or not) of the unit; the year of commencing operation; the cost, and subsidy if any; the use to which the biogas was put, and the proportion of cooking and lighting done with biogas; the raw material used; the supplementary fuels used for lighting and cooking; repair and maintenance problems, if any; and the use made of the effluent sludge. The proportion of the cooking for which biogas was used was assessed on the basis of information provided by the respondent, and the proportion of lighting was assessed notionally taking into account the aver- age number of lamp hours (as given by the respondent) and the percentage and frequency of use of the floor area illuminated. A suitable questionnaire was composed and it was com-
pleted for each biogas plant visited. No measurements were made of the quantity of
gas produced, and what is referred to in this paper as the capacity is the internal volume of the unit. In the fixed dome type (Chinese design), the volume of the entire unit (slurry and gas contain- ing sections taken together) was recorded. In the floating gas holder type (Indian design), the capacity was taken as the volume of the digester up to the level of the slurry and half the volume of the gas holder.
A total of 303 biogas units were inspected between August 1984 and January 1985. In visits to 14 other units there was no responsible person from whom information could be obtained. Thirty-eight units in the administrative districts of Jaffna, Mannar, Vavuniya, Trincomalee and Bat- ticaloa, in the north and east of the country, could not be visited because of the conditions of civil unrest prevailing there. There was some, not very precise, information on about 25 other units said to be found in different parts of the island; in three of these cases no unit was found at the given address, and in two cases, although the gas holder had been delivered to the site, the construction of the digester had not been carried out. Because over 300 units had been inspected, and it was going to be time-consuming to trace the remain- ing plants, it was decided to make the evaluation on the basis of the data about these 300 units. Two small biogas plants in a research and development institution and one large biogas plant which forms a part of an integrated project for producing electricity using biogas, wind power and solar energy to meet the needs of a remote village were not included in the survey. *
3. RESULTS 3.1 DISTRIBUTION
The total number of biogas plants inspected was 303. Their distribution is shown in Fig. 1. Some of the plants were in the final stages of construction or were being filled with dung or were awaiting the connection of the gas pipe and appliances; these plants numbered 23. This meant that, among the biogas plants inspected, there were
* For detailed information on the integrated project, the reader may refer to Renewuhle Sources of Energy. Vol. 1, No. 2, pp.81-108.
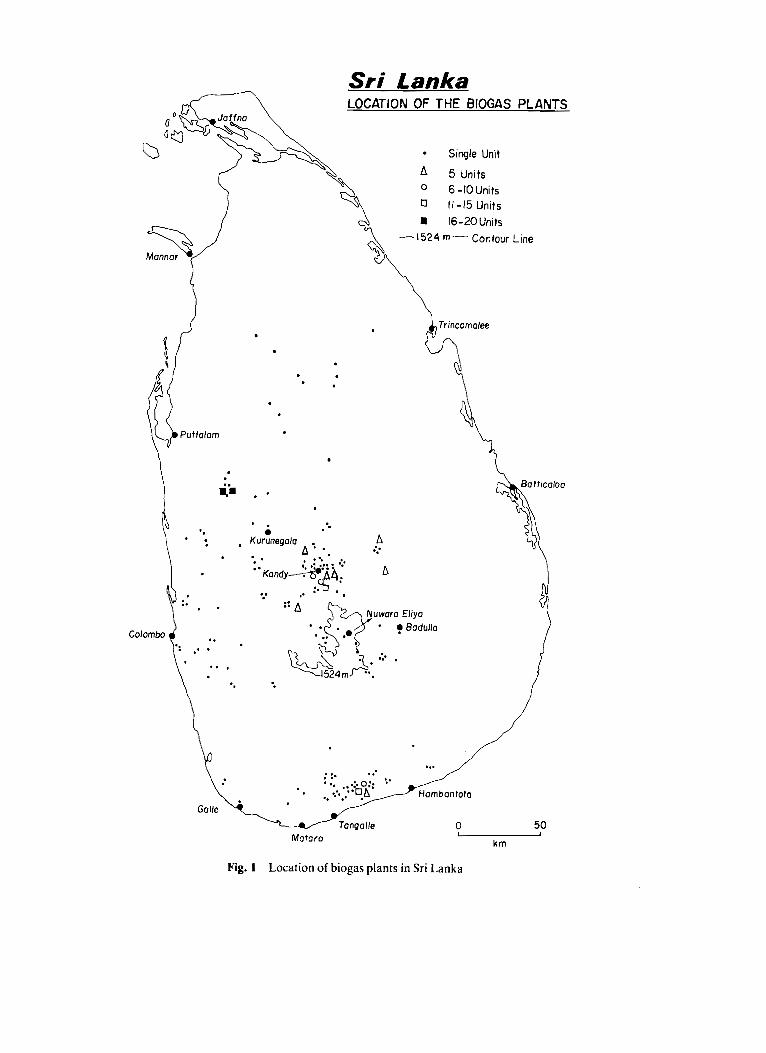
Sri Lanka LOCATION OF THE BIOGAS PLANTS
Single Unit
* 5 Units 6-IOUnits
0 11-15 Units 16-20Units
-1524 m- Contour Line Monnor
6 '.
Trincomolee h
A ::
\
224 de S. WIJESINGHE and CHANDRASIRI NRF VOL. 10, NO. 3, 1986
280 that had started functioning after construc- tion. The great majority of the biogas plants inspected were situated in the low and midcoun- try, with high concentrations around Kandy, at Hungama (between Matara and Hambantota) and at Nikaweratiya (between Kurunegala and Puttalam).
3.2 DESIGN, CAPACITY, OWNERSHIP,
The vast majority of the plants were of the fixed dome type (Chinese design) - 266 (88%) of the total of 303 units inspected. The other 37 were of the floating gas holder type (Indian design).
There was one plant of 4 m3 capacity; the others ranged from 6 m3 to 100 m3. The 6 m3 plants were the most common, accounting for 54% of the plants that had been put into commission. The next most common size was 8 m3. The 6 m3 and 8 m3 units together accounted for 67% of the plants. There were 150 units of 6 m3 capacity, and it should be noted that 43 of these were constructed by the government in a model housing scheme at Nikaweratiya and the families which occupied the houses had no choice but to accept the 6 m3 plants that were provided. However, even if these are left out of the reckoning, the 6 m3 plant was still the most common.
Excluding the plants that had not commenced operation up to the time of the inspection, there was a total of 280 units, and of these, 200 were actually functioning. Twenty-seven were not functioning for a period of up to six months and 53 for over six months. It appeared that most of the plants falling into the latter category had been
FUNCTIONING
abandoned. The distribution of the functioning and non-functioning plants in households and institutions is given in Table I . Table I1 gives the capacity, the year of commencing operation and the present condition. Table 111 gives the distribu- tion by year of commencing operation, the present condition and the design. The capacity classes that were selected (4 m3, 6 m3 and so on) for classifying the units were based on the actual data collected. In a few cases where the capacity of the plant did not fit one of the classes exactly, it was placed in the class that was the closest approximation to its capacity.
Table 111 shows that, out of a total of 37 floating gas holder plants, 18, or half the number, were not functioning. Taking the fixed dome plants only, the proportion of non-functioning plants was much lower, 62 out of 243, or one quarter. The responses appeared to indicate that the owners were less able to cope with repair and maintenance in the floating gas holder plant than in the fixed dome type and this may have contributed in some measure to the proportion of non-functioning units being higher among the floating holder plants. Two common problems with the floating gas holder were the occurrence of corrosion and the difficulty of lifting and moving it aside in order to clean out the digester. One should not overlook another factor of importance when comparing the performance of the two models; the biogas expert of the Depart- ment of Agriculture promoted the construction of the fixed dome model only, and he provided the advisory services for the construction, manage- ment and maintenance of as many as 211 out of the 243 fixed dome plants.
TABLE I Numbers of functioning and non-functioning biogas plants in households
and institutions
Functioning Not functioning for Not functioning for more than 6 months 6 months or less
159 26 25
41 1 28
No. of household plants No. of institution plants TOTAL
~~
200 27 ~
53
NRFVOL. 10, NO. 3,1986 BIOGAS IN SRI LANKA 225
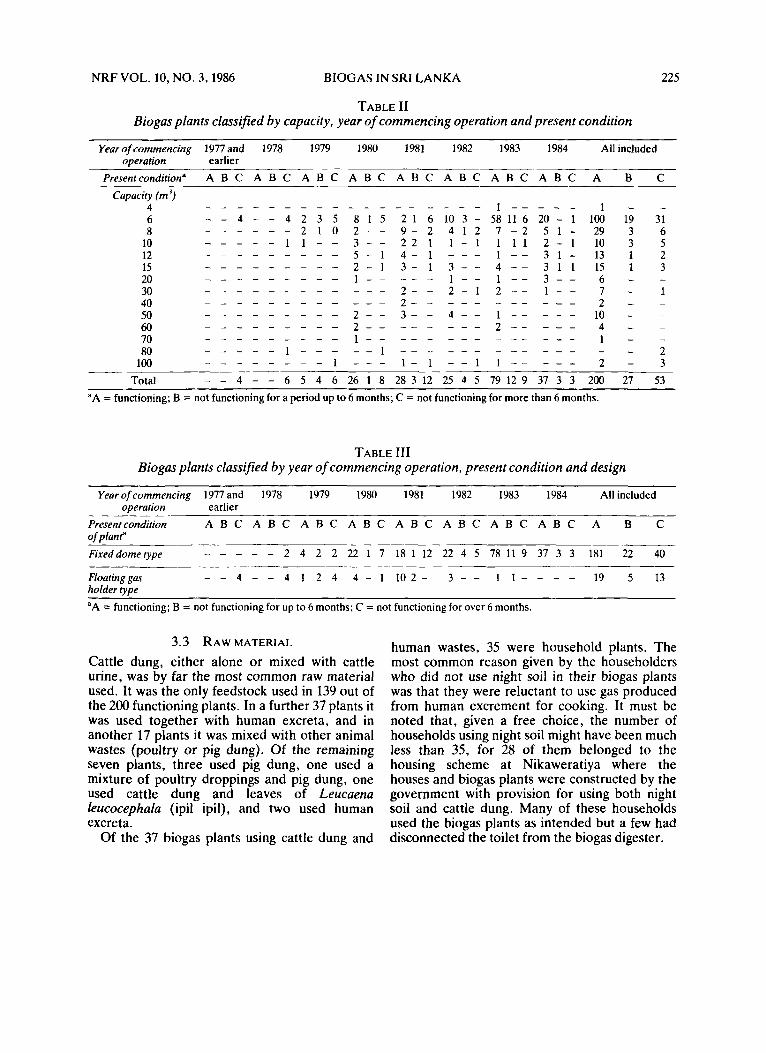
TABLE I1 Biogas plants classified by capacity, year of commencing operation and present condition
Yearofcommencing 1977and 1978 1979 1980 1981 1982 1983 1984 All included operation earlier
Presentcondition" A B C A B C AB C A B C A B C A B C A B C A B C A B C
Total - - 4 - - 6 5 4 6 26 1 8 2 8 3 1 2 25 4 5 1 9 1 2 9 37 3 3 200 27 53 "A = functioning; B = not functioning for a period up to 6 months; C = not functioning for more than 6 months.
TABLE 111 Biogas plants classified by year of commencing operation, present condition and design
Yearofcommencing 1977and 1978 1979 1980 1981 1982 1983 1984 All included oDeration earlier
Present condition A B C A B C A B C A B C A B C A B C A B C A B C A B C of planP Fixed dome type - - _ _ _ 2 4 2 2 22 1 7 18 1 12 22 4 5 78 11 9 37 3 3 181 22 40
~~ ~
Floating gas - - 4 - - 4 1 2 4 4 - 1 1 0 2 - 3 - - 1 1 - - - - 19 5 13 holder type "A = functioning; B = not functioning for up to 6 months; C = not functioning for over 6 months.
3.3 RAW MATERIAL
Cattle dung, either alone or mixed with cattle urine, was by far the most common raw material used. It was the only feedstock used in 139 out of the 200 functioning plants. In a further 37 plants it was used together with human excreta, and in another 17 plants it was mixed with other animal wastes (poultry or pig dung). Of the remaining seven plants, three used pig dung, one used a mixture of poultry droppings and pig dung, one used cattle dung and leaves of Leucaena leucocephala (ipil ipil), and two used human excreta.
Of the 37 biogas plants using cattle dung and
human wastes, 35 were household plants. The most common reason given by the householders who did not use night soil in their biogas plants was that they were reluctant to use gas produced from human excrement for cooking. It must be noted that, given a free choice, the number of households using night soil might have been much less than 35, for 28 of them belonged to the housing scheme at Nikaweratiya where the houses and biogas plants were constructed by the government with provision for using both night soil and cattle dung. Many of these households used the biogas plants as intended but a few had disconnected the toilet from the biogas digester.
226 de S. WIJESINGHE and CHANDRASlRl NRF VOL. 10, NO. 3. 1986
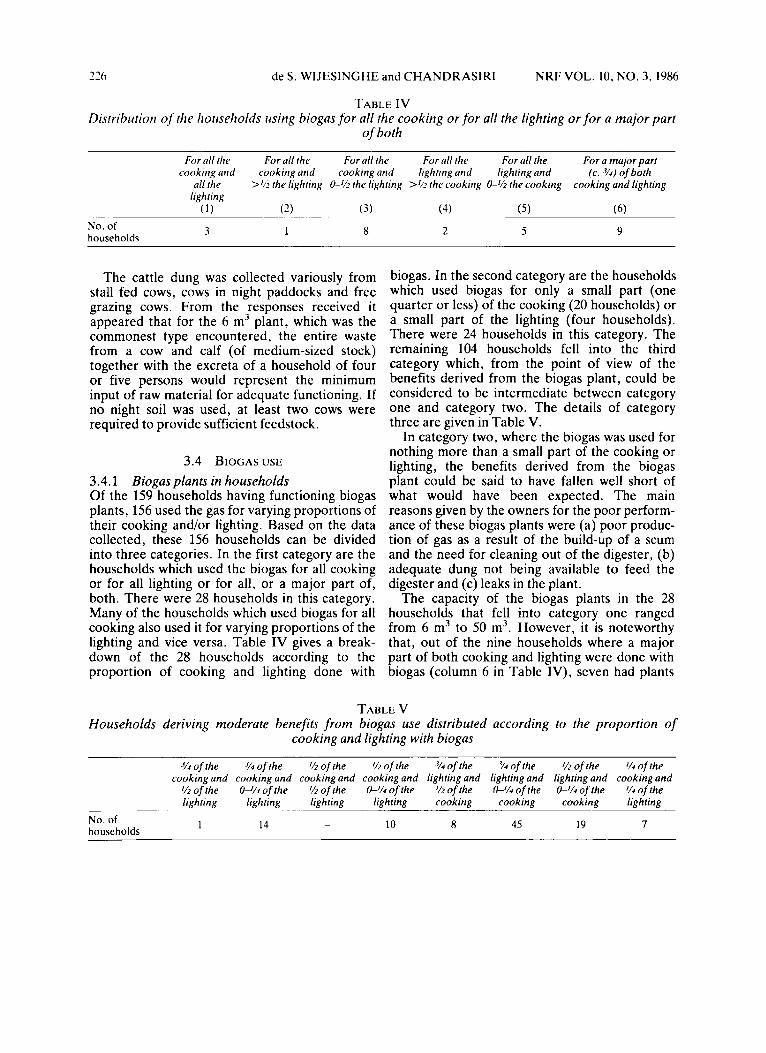
TABLE IV Distribution of the households using biogas for all the cooking or for all the lighting or for a major part
of both
For all the For all the For all the For all the For all the For a major part cooking and cooking and cooking and lighting and lighting and (c . Y 4 ) Of both
all the lighting
>I/? rhe lighting P h the lighting >V> the cooking OPh rhe cooking cooking and lighting
( 1 ) (2) (3) (4) ( 5 ) (6)
3 1 8 2 5 No. of households 9
The cattle dung was collected variously from stall fed cows, cows in night paddocks and free grazing cows. From the responses received it appeared that for the 6 m3 plant, which was the commonest type encountered, the entire waste from a cow and calf (of medium-sized stock) together with the excreta of a household of four or five persons would represent the minimum input of raw material for adequate functioning. If no night soil was used, at least two cows were required to provide sufficient feedstock.
3.4 BIOGAS USE
3.4.1 Biogas plants in households Of the 159 households having functioning biogas plants, 156 used the gas for varying proportions of their cooking and/or lighting. Based on the data collected, these 156 households can be divided into three categories. In the first category are the households which used the biogas for all cooking or for all lighting or for all, or a major part of, both. There were 28 households in this category. Many of the households which used biogas for all cooking also used it for varying proportions of the lighting and vice versa. Table IV gives a break- down of the 28 households according to the proportion of cooking and lighting done with
biogas. In the second category are the households which used biogas for only a small part (one quarter or less) of the cooking (20 households) or a small part of the lighting (four households). There were 24 households in this category. The remaining 104 households fell into the third category which, from the point of view of the benefits derived from the biogas plant, could be considered to be intermediate between category one and category two. The details of category three are given in Table V.
In category two, where the biogas was used for nothing more than a small part of the cooking or lighting, the benefits derived from the biogas plant could be said to have fallen well short of what would have been expected. The main reasons given by the owners for the poor perform- ance of these biogas plants were (a) poor produc- tion of gas as a result of the build-up of a scum and the need for cleaning out of the digester, (b) adequate dung not being available to feed the digester and (c) leaks in the plant.
The capacity of the biogas plants in the 28 households that fell into category one ranged from 6 m3 to 50 m3. However, it is noteworthy that, out of the nine households where a major part of both cooking and lighting were done with biogas (column 6 in Table IV), seven had plants
TABLE V Households deriving moderate benefits from biogas use distributed according to the proportion of
cooking and lighting with biogas
-%of the 3/4 of the Ih of the ‘h of the V4 of the ?4 of the ’/2 of the Y4 ofthe cooking and cooking and cooking and cooking and lighting and lighting and lighting and cooking and Jh of the o J / 4 of the I/’ of rhe P I 4 of the of the 0 4 4 of the W h of the V4 of the lighting lighting lighting lighting cooking cooking cooking lighting
- 1 14 10 8 45 19 7 No. of households
NRF VOL. 10, NO. 3, 1986 BIOGAS IN sRr LANKA 227
of 6 m3 capacity, and out of the three households where all cooking and all lighting were done with biogas (column l ) , one had a 6 m3 plant. The number of members in these households varied from three to six. These data seem to suggest that, at peak performance, a 6 m3 plant should provide sufficient biogas for most of the cooking and lighting in an average household of four or five members.
In the households which used biogas for cook- ing, biomass is the fuel that has been substituted by biogas. Out of the 159 households with functioning biogas units, 37 were provided with mains electricity and, while 30 out of the 37 households used only electricity for lighting, seven households used a part of the biogas for some supplementary lighting. In houses without electricity and where biogas was used for a part or all of the lighting, the use of biogas had reduced or eliminated kerosene consumption.
Based on the data given in this and the previous section, the performance of the household plants at the time of the inspection could be summarized as follows. Taking the 210 households which had biogas plants that had been put into commission at some time prior to the study, in 31 households (15%) the performance was highly satisfactory, in 104 households (50%) the performance was moderate, in 24 households (1 1 %) the perform- ance was poor, in 26 households (12%) the plants were not functioning for a period of up to six months, and in 25 households (12%) the plants were not functioning for a period of over six months and could be considered to have been abandoned.
3.4.2 Biogas plants installed by institutions In the case of the biogas plants installed by institutions, the data on biogas use which were collected could not be validly interpreted in terms of the proportion of the cooking and lighting done with biogas. Nevertheless, in 35 out of the 41 institutions having functioning biogas plants (i.e. in 85%), the respondents stated that they were satisfied with the performance of the plants. This result agrees almost exactly with the percentage of household biogas plants (among the function- ing household units) in which the performance was good or moderate; as stated earlier, out of the 159 functioning plants, 135 (85%) gave a good or moderate yield of gas.
In institutions the biogas was mostly used for cooking, boiling water and boiling milk (the last mentioned in farms). Three institutions used biogas for generating electricity, and two (located in small schools) for providing gas to the labora- tory. 3.5 CONSTRUCTION, REPAIR AND MAINTENANCE
The Department of Agriculture provided the know-how for the construction of 211 out of the 280 plants that had been put into commission and for 21 of the 23 plants that had not yet started functioning. The Energy Unit of the Ceylon Electricity Board provided advisory services for setting up 27 plants and the Engineering Division of the Industrial Development Board provided advisory services for setting up 17 plants. Some non-government organizations also provided the know-how.
Out of the total of 280 biogas plants which had commenced operatons at some time prior to this study, 80 (29%) were not functioning at the time of inspection. In 14 of the non-functioning units (all household plants) management and mainte- nance had been neglected and the owners had lost interest in obtaining biogas. In the other units the reasons given for non-functioning were generally the same as those given to explain the low yields of gas in those plants where the performance was poor.
A common problem which many households faced was the absence of a suitable gas tap. Many of the householders bent the plastic pipeline and fastened the two arms of the bend with a piece of string in order to shut off the gas. This, after a time, resulted in the pipe being damaged. At the present time a cheap and very efficient gas tap is being manufactured and is being made available to the households. This should prevent future pipe damage. Many respondents also complained of the lack of repair and maintenance facilities for the cookers and lamps which used biogas.
3.6 USE OFTHE EFFLUENT SLUDGE
One hundred and thirty three of the 159 house- holds having functioning biogas plants used the effluent sludge as a fertilizer in their home garden plots, and 123 of these households reported distinct benefits from the application of this organic fertilizer. In the institutions with biogas plants the effluent sludge was used for fertilizing a
228 de S. WIJESINGHE and CHANDRASIRI NRF VOL. 10, NO. 3, 1986
variety of food crops and fodder grass grown by the institution. The use of the manure enabled the institutions to obtain excellent yields without the application of artificial fertilizer and hence repre- sented an additional benefit.
3.7 COST. SUBSIDIES
The most reliable information on costs was that obtained for the 6 m3 fixed dome plants. The average cost (material and labour) of constructing a plant in 1984 was Rs.3200 (US$125). Of the 210 household plants constructed, 167 (80%) of them had their cost fully or partly subsidized.
Twenty of the 41 institutions with functioning biogas plants were government-owned and the cost of construction of the plant was borne by the state. In the other 21, the cost of construction was met from the funds of the institution or by aid donors. No reliable information on costs was available on the non-functioning institution plants.
4. DISCUSSION Sri Lanka’s biogas extension programme could be said to have started effectively in 1979. Although some individuals associated with biogas extension work believed that 500-600 units had been installed throughout the country up to 1984, information on the location of plants could be obtained for only 350-400 units. Of these, 303 were inspected during the present study. Twenty- three plants had not yet been put into commission at the time of inspection, and hence the data on 280 plants were analysed for performance. Of the 280 plants, 80 (28.6%) were not functioning and 30 (10.7%) were giving very low yields of gas. In the remaining 61%, the performance was fair to good. It must be stated that 143 out of the 280 plants were installed in 1983 and 1984 and were therefore two years old or less at the time of the study.
The performance levels observed in this study, though they appear disappointing, are compara- ble with or better than those from some other countries. In China it was reported that seven million biogas plants had been installed and 30-50% of these were having serious problems (Eggeling and Stephan, 1981); and in Thailand, where the scale of the programme is similar to that in Sri Lanka, more than half of the 221 biogas digesters installed up to 1979 were abandoned,
mostly after two years of operation (Tam and Thanh, 1982). In the present study, out of the 110 plants which were either producing low yields of gas or none at all at the time of the survey, it is expected that at least half will be reactivated after repairs or a clean-out of the digester.
Two of the most frequent causes of plant failure were the occurrence of leaks and the build-up of a scum in the digester, and this underscores the importance of exercising the utmost care in every detail of construction and carrying out regular maintenance and management operations. The biogas expert of the Department of Agriculture, Mr G.K. Upawansa, took a personal interest in the construction of the plants which were done under the guidance of his unit, and he followed this up with visits to the plants to advise the owners on management and maintenance of the plant and on repairs and maintenance of the fittings and appliances. This is reflected in the fact that out of the 211 units set up under his supervision only 42 (20%) were not functioning, whereas among the others as many as 38 out of 69 (i.e. 55%) were not functioning.
This study showed that the entire excreta from two cows of medium build represents the mini- mum quantity of feedstock required for a 6 m3 plant. It would appear that one of the basic prerequisites for deciding whether to install an household biogas plant is the availability of dung daily (the digesters have to be fed once or twice a day) and in adequate quantity.
The data collected showed that in 80% of the household biogas plants the cost of construction was totally or partly subsidized, in most cases by state institutions. In the course of the field work, families without biogas plants were also occa- sionally interviewed, and it was evident that even where sufficient dung for a biogas plant is available most families cannot afford the capital expense required to construct a plant. Subsidies for construction are therefore necessary if the biogas programme is to expand. A part subsidy where the householder meets a part of the cost is preferable to a total subsidy because there will then be a greater commitment on the part of the householder to ensure that the plant is kept in good working order.
The general response of the households and institutions where the biogas plants were func- tioning was that there were positive benefits by
NRF VOL. 10, NO. 3,1986 BIOGAS IN SRI LANKA 229
way of improved cooking or lighting or both. Operating costs of lighting with biogas were substantially lower than with kerosene. In institu- tions which had earlier used liquid petroleum gas for cooking, there was a substantial saving in recurrent expenditure by switching over to biogas.
5 . CONCLUSIONS (1) For biogas extension to be successful a
competent technical unit should be available and readily accessible to users to assist and advise on construction, management and repair and maintenance.
(2) An assured daily supply of feedstock (generally cow dung) in adequate quantities is the first prerequisite for installing a biogas plant.
ACKNOWLEDGEMENT The writers wish to thank Dr R.P. Jayewardene, Director-General, Natural Resources, Energy and Science Authority, for having provided the resources that were required for carrying out this study.
(3) A well managed biogas plant of 6 m3 size could provide sufficient biogas for a good part of the cooking and lighting in a rural household of four or five members.
(4) The expanded use of biogas among house- holds will continue to depend on the availability of subsidies to meet a part of the cost of constructing the plant.
REFERENCES Director of Census & Statistics, 1982. Housing Tables, Preliminary Release No. 3. Department of Census &
Eggeling, G., and Stephan, B., 1981. Biogas in the People’s Republic of China. Deutsche Gesellschaft fur
Gosling, D., 1979. Cooking up Biogas for Tea in Sri Lanka. New Scientist 84,95. Tam, D.M., and Thanh, N.C., 1982. Biogas Technology in Developing Countries: An Overview of
Wijesinghe, L.C.A. de S., 1983. A Quantitative Study of the Direct Use of Kerosene for Lighting in Sri
Wijesinghe, L.C.A. de S. , 1984. A Sample Study of Biomass Fuel Consumption in Sri Lanka Households.
Statistics, Colombo 7.
Technische Zusammenarbeit (GTZ), GmbH, Bremen.
Perspectives. Environmental Sanitation Information Center, Bangkok.
Lanka Households. J . Natn. Sci. Coun. Sri Lanka 11.
Biomass 5,261-81.
Recommended