1
Positron Emission Tomography (PET)
A radiological technique for functional imaging
Please note that this exercise takes place at the Stockholm Centre for Physics,Astronomy and Biotechniques (Alba Nova).Address Roslagstullsbacken 21You will find the PET-lab equipment in room T2:3025 , tel 08 5537 8476The lab assistant (Lars-Olov Norlin) can be found in his office: C3:3007, tel 08-5537 8209 or byMAIL [email protected] . For reference see S. Webb: The Physics of Medical Imaging or
R.F. Farr and P.J.Allisy-Roberts
2
1 Introduction (Webb 6.3.5)
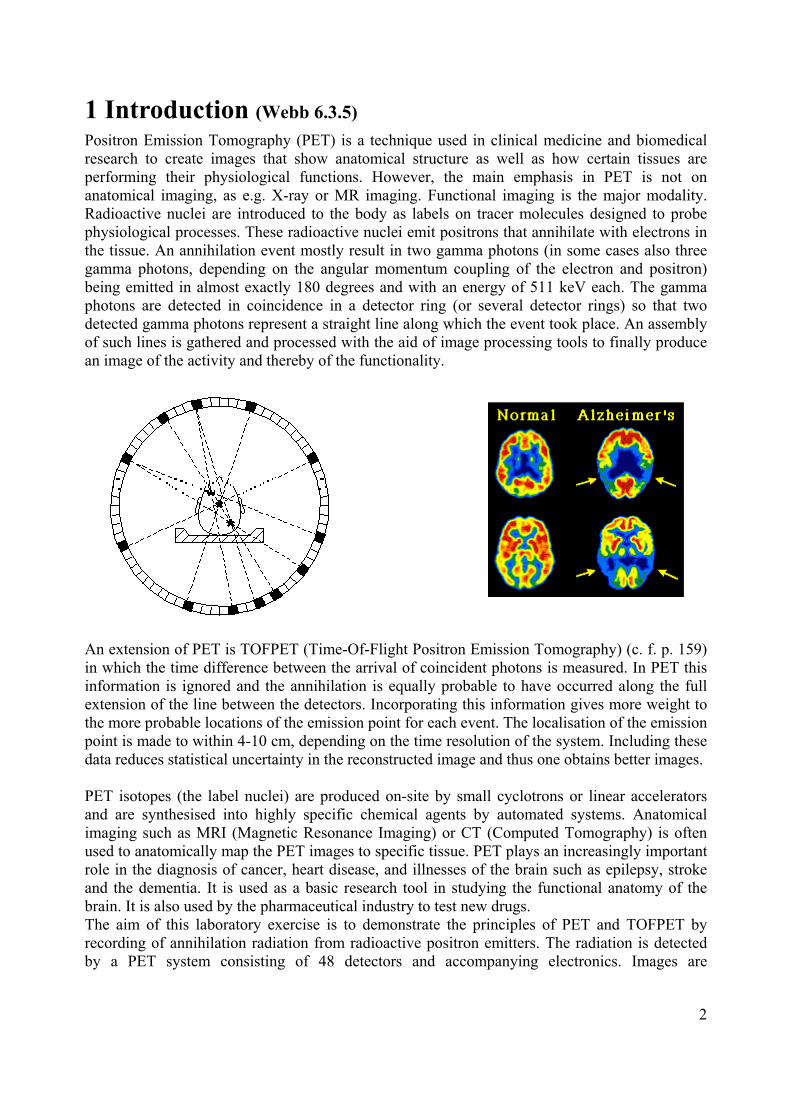
Positron Emission Tomography (PET) is a technique used in clinical medicine and biomedicalresearch to create images that show anatomical structure as well as how certain tissues areperforming their physiological functions. However, the main emphasis in PET is not onanatomical imaging, as e.g. X-ray or MR imaging. Functional imaging is the major modality.Radioactive nuclei are introduced to the body as labels on tracer molecules designed to probephysiological processes. These radioactive nuclei emit positrons that annihilate with electrons inthe tissue. An annihilation event mostly result in two gamma photons (in some cases also threegamma photons, depending on the angular momentum coupling of the electron and positron)being emitted in almost exactly 180 degrees and with an energy of 511 keV each. The gammaphotons are detected in coincidence in a detector ring (or several detector rings) so that twodetected gamma photons represent a straight line along which the event took place. An assemblyof such lines is gathered and processed with the aid of image processing tools to finally producean image of the activity and thereby of the functionality.
An extension of PET is TOFPET (Time-Of-Flight Positron Emission Tomography) (c. f. p. 159)in which the time difference between the arrival of coincident photons is measured. In PET thisinformation is ignored and the annihilation is equally probable to have occurred along the fullextension of the line between the detectors. Incorporating this information gives more weight tothe more probable locations of the emission point for each event. The localisation of the emissionpoint is made to within 4-10 cm, depending on the time resolution of the system. Including thesedata reduces statistical uncertainty in the reconstructed image and thus one obtains better images.
PET isotopes (the label nuclei) are produced on-site by small cyclotrons or linear acceleratorsand are synthesised into highly specific chemical agents by automated systems. Anatomicalimaging such as MRI (Magnetic Resonance Imaging) or CT (Computed Tomography) is oftenused to anatomically map the PET images to specific tissue. PET plays an increasingly importantrole in the diagnosis of cancer, heart disease, and illnesses of the brain such as epilepsy, strokeand the dementia. It is used as a basic research tool in studying the functional anatomy of thebrain. It is also used by the pharmaceutical industry to test new drugs.The aim of this laboratory exercise is to demonstrate the principles of PET and TOFPET byrecording of annihilation radiation from radioactive positron emitters. The radiation is detectedby a PET system consisting of 48 detectors and accompanying electronics. Images are
3
constructed by software and reveal the positions of the sources. TOFPET is not yet usedcommercially.
2. The Basic Physics of PET
2.1 Beta Decay
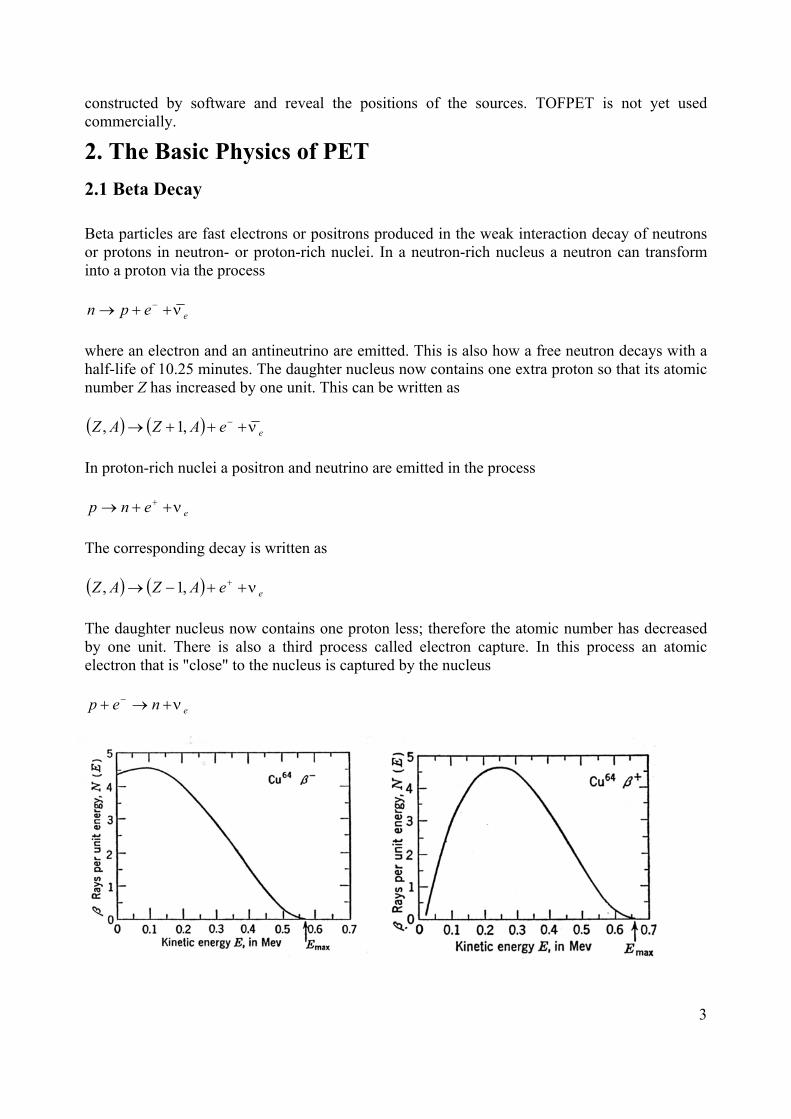
Beta particles are fast electrons or positrons produced in the weak interaction decay of neutronsor protons in neutron- or proton-rich nuclei. In a neutron-rich nucleus a neutron can transforminto a proton via the process
eepn ν++→ −
where an electron and an antineutrino are emitted. This is also how a free neutron decays with ahalf-life of 10.25 minutes. The daughter nucleus now contains one extra proton so that its atomicnumber Z has increased by one unit. This can be written as
( ) ( ) eeAZAZ ν+++→ −,1,
In proton-rich nuclei a positron and neutrino are emitted in the process
eenp ν++→ +
The corresponding decay is written as
( ) ( ) eeAZAZ ν++−→ +,1,
The daughter nucleus now contains one proton less; therefore the atomic number has decreasedby one unit. There is also a third process called electron capture. In this process an atomicelectron that is "close" to the nucleus is captured by the nucleus
enep ν+→+ −
4
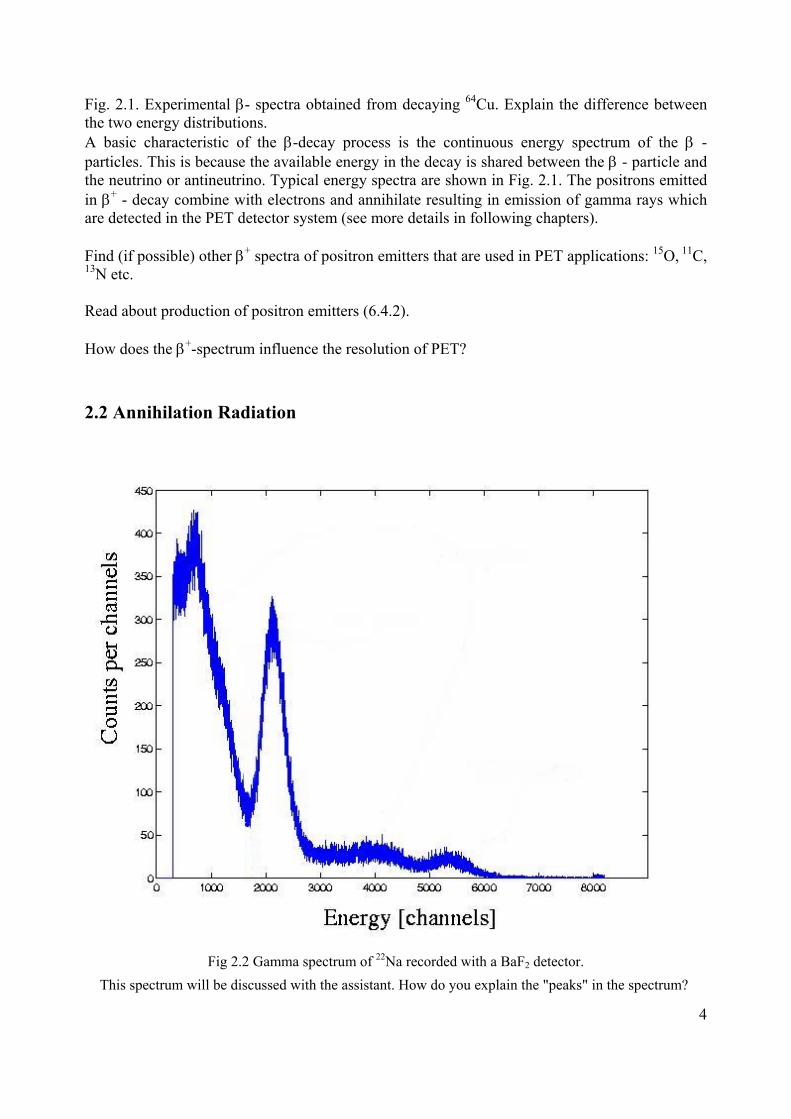
Fig. 2.1. Experimental β- spectra obtained from decaying 64Cu. Explain the difference betweenthe two energy distributions. A basic characteristic of the β-decay process is the continuous energy spectrum of the β -particles. This is because the available energy in the decay is shared between the β - particle andthe neutrino or antineutrino. Typical energy spectra are shown in Fig. 2.1. The positrons emittedin β+ - decay combine with electrons and annihilate resulting in emission of gamma rays whichare detected in the PET detector system (see more details in following chapters).
Find (if possible) other β+ spectra of positron emitters that are used in PET applications: 15O, 11C,13N etc.
Read about production of positron emitters (6.4.2).
How does the β+-spectrum influence the resolution of PET?
2.2 Annihilation Radiation
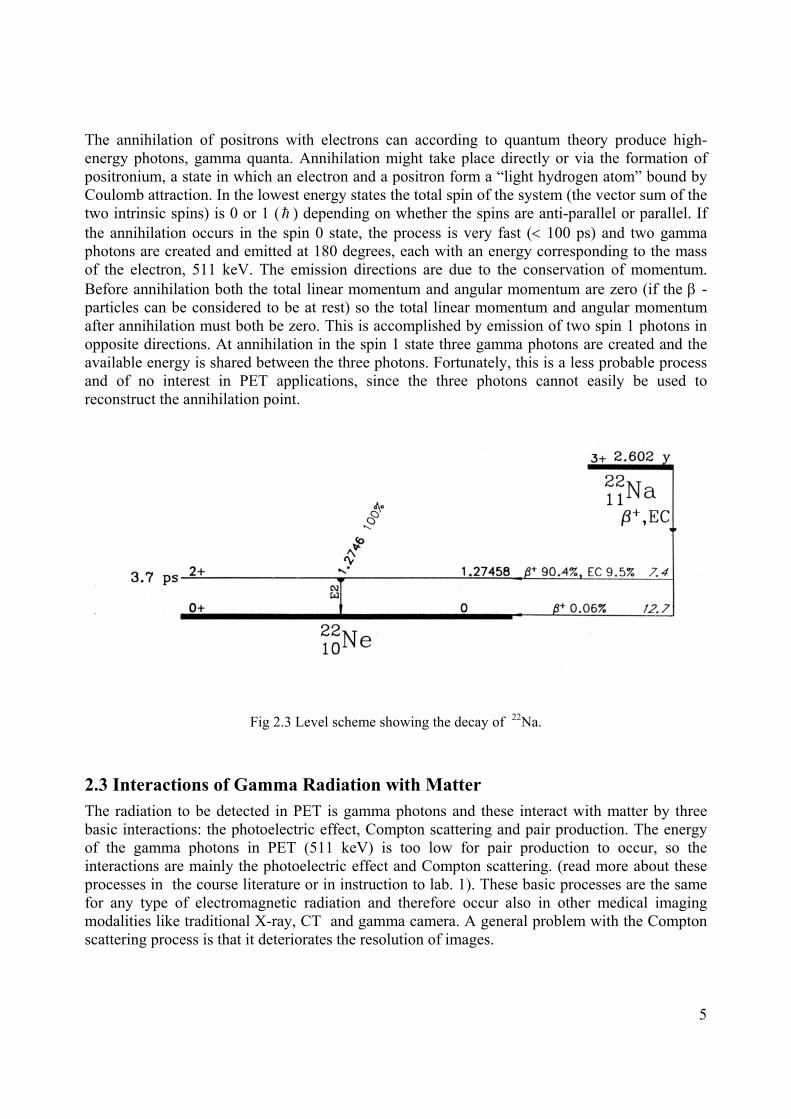
Fig 2.2 Gamma spectrum of 22Na recorded with a BaF2 detector.
This spectrum will be discussed with the assistant. How do you explain the "peaks" in the spectrum?
5
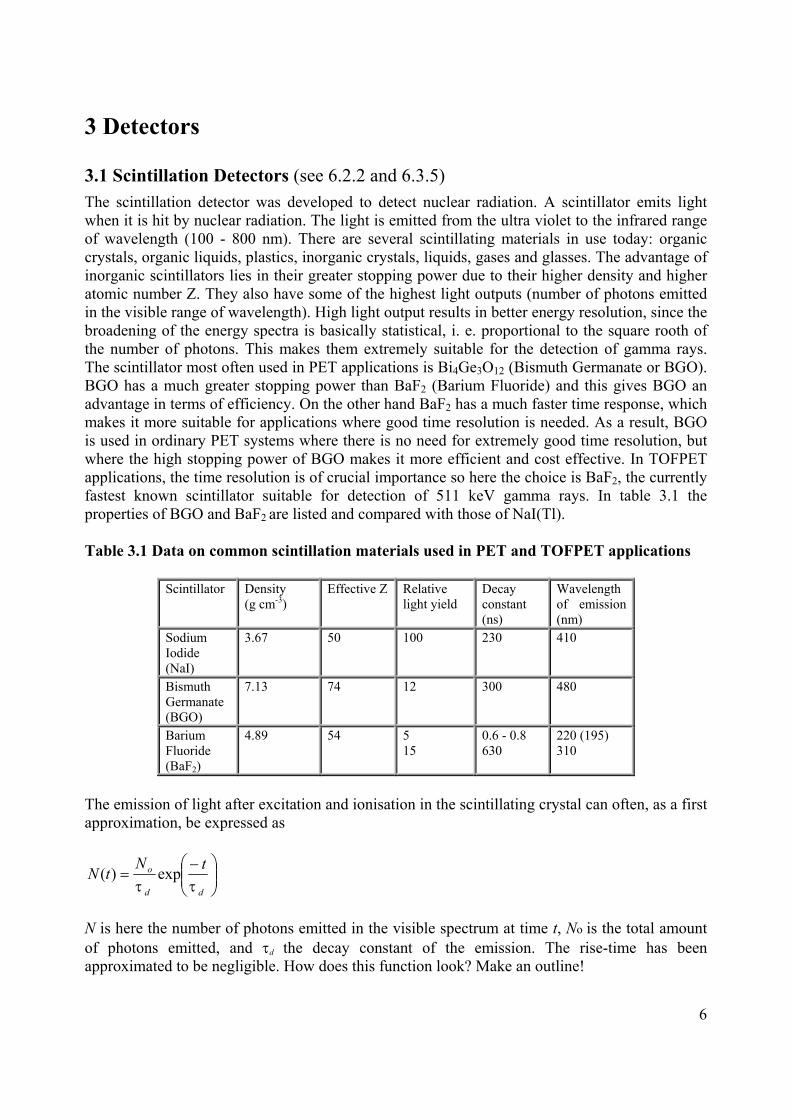
The annihilation of positrons with electrons can according to quantum theory produce high-energy photons, gamma quanta. Annihilation might take place directly or via the formation ofpositronium, a state in which an electron and a positron form a “light hydrogen atom” bound byCoulomb attraction. In the lowest energy states the total spin of the system (the vector sum of thetwo intrinsic spins) is 0 or 1 (h ) depending on whether the spins are anti-parallel or parallel. Ifthe annihilation occurs in the spin 0 state, the process is very fast (< 100 ps) and two gammaphotons are created and emitted at 180 degrees, each with an energy corresponding to the massof the electron, 511 keV. The emission directions are due to the conservation of momentum.Before annihilation both the total linear momentum and angular momentum are zero (if the β -particles can be considered to be at rest) so the total linear momentum and angular momentumafter annihilation must both be zero. This is accomplished by emission of two spin 1 photons inopposite directions. At annihilation in the spin 1 state three gamma photons are created and theavailable energy is shared between the three photons. Fortunately, this is a less probable processand of no interest in PET applications, since the three photons cannot easily be used toreconstruct the annihilation point.
Fig 2.3 Level scheme showing the decay of 22Na.
2.3 Interactions of Gamma Radiation with MatterThe radiation to be detected in PET is gamma photons and these interact with matter by threebasic interactions: the photoelectric effect, Compton scattering and pair production. The energyof the gamma photons in PET (511 keV) is too low for pair production to occur, so theinteractions are mainly the photoelectric effect and Compton scattering. (read more about theseprocesses in the course literature or in instruction to lab. 1). These basic processes are the samefor any type of electromagnetic radiation and therefore occur also in other medical imagingmodalities like traditional X-ray, CT and gamma camera. A general problem with the Comptonscattering process is that it deteriorates the resolution of images.
6
3 Detectors
3.1 Scintillation Detectors (see 6.2.2 and 6.3.5)
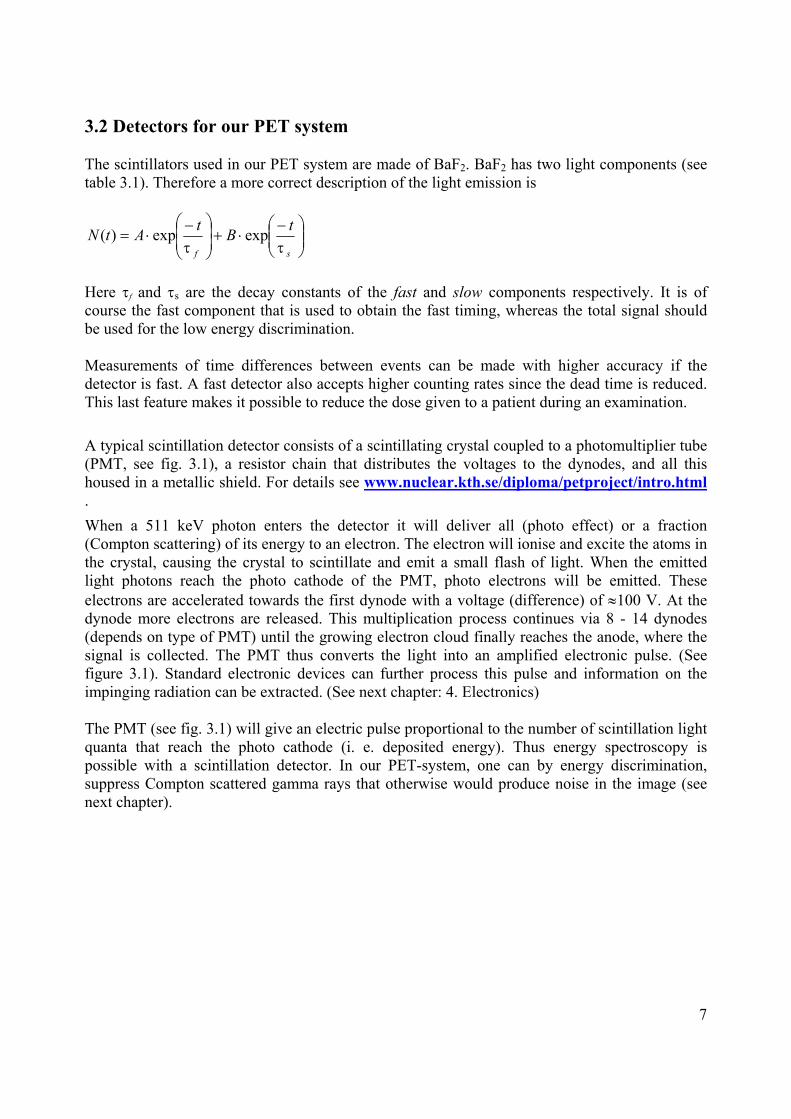
The scintillation detector was developed to detect nuclear radiation. A scintillator emits lightwhen it is hit by nuclear radiation. The light is emitted from the ultra violet to the infrared rangeof wavelength (100 - 800 nm). There are several scintillating materials in use today: organiccrystals, organic liquids, plastics, inorganic crystals, liquids, gases and glasses. The advantage ofinorganic scintillators lies in their greater stopping power due to their higher density and higheratomic number Z. They also have some of the highest light outputs (number of photons emittedin the visible range of wavelength). High light output results in better energy resolution, since thebroadening of the energy spectra is basically statistical, i. e. proportional to the square rooth ofthe number of photons. This makes them extremely suitable for the detection of gamma rays.The scintillator most often used in PET applications is Bi4Ge3O12 (Bismuth Germanate or BGO).BGO has a much greater stopping power than BaF2 (Barium Fluoride) and this gives BGO anadvantage in terms of efficiency. On the other hand BaF2 has a much faster time response, whichmakes it more suitable for applications where good time resolution is needed. As a result, BGOis used in ordinary PET systems where there is no need for extremely good time resolution, butwhere the high stopping power of BGO makes it more efficient and cost effective. In TOFPETapplications, the time resolution is of crucial importance so here the choice is BaF2, the currentlyfastest known scintillator suitable for detection of 511 keV gamma rays. In table 3.1 theproperties of BGO and BaF2 are listed and compared with those of NaI(Tl).
Table 3.1 Data on common scintillation materials used in PET and TOFPET applications
Scintillator Density(g cm-3)
Effective Z Relativelight yield
Decayconstant(ns)
Wavelengthof emission(nm)
SodiumIodide(NaI)
3.67 50 100 230 410
BismuthGermanate(BGO)
7.13 74 12 300 480
BariumFluoride(BaF2)
4.89 54 515
0.6 - 0.8630
220 (195)310
The emission of light after excitation and ionisation in the scintillating crystal can often, as a firstapproximation, be expressed as
−=
dd
o tNtN
ττexp)(
N is here the number of photons emitted in the visible spectrum at time t, No is the total amountof photons emitted, and τd the decay constant of the emission. The rise-time has beenapproximated to be negligible. How does this function look? Make an outline!
7
3.2 Detectors for our PET system
The scintillators used in our PET system are made of BaF2. BaF2 has two light components (seetable 3.1). Therefore a more correct description of the light emission is
−⋅+
−⋅=
sf
tB
tAtN
ττexpexp)(
Here τf and τs are the decay constants of the fast and slow components respectively. It is ofcourse the fast component that is used to obtain the fast timing, whereas the total signal shouldbe used for the low energy discrimination.
Measurements of time differences between events can be made with higher accuracy if thedetector is fast. A fast detector also accepts higher counting rates since the dead time is reduced.This last feature makes it possible to reduce the dose given to a patient during an examination.
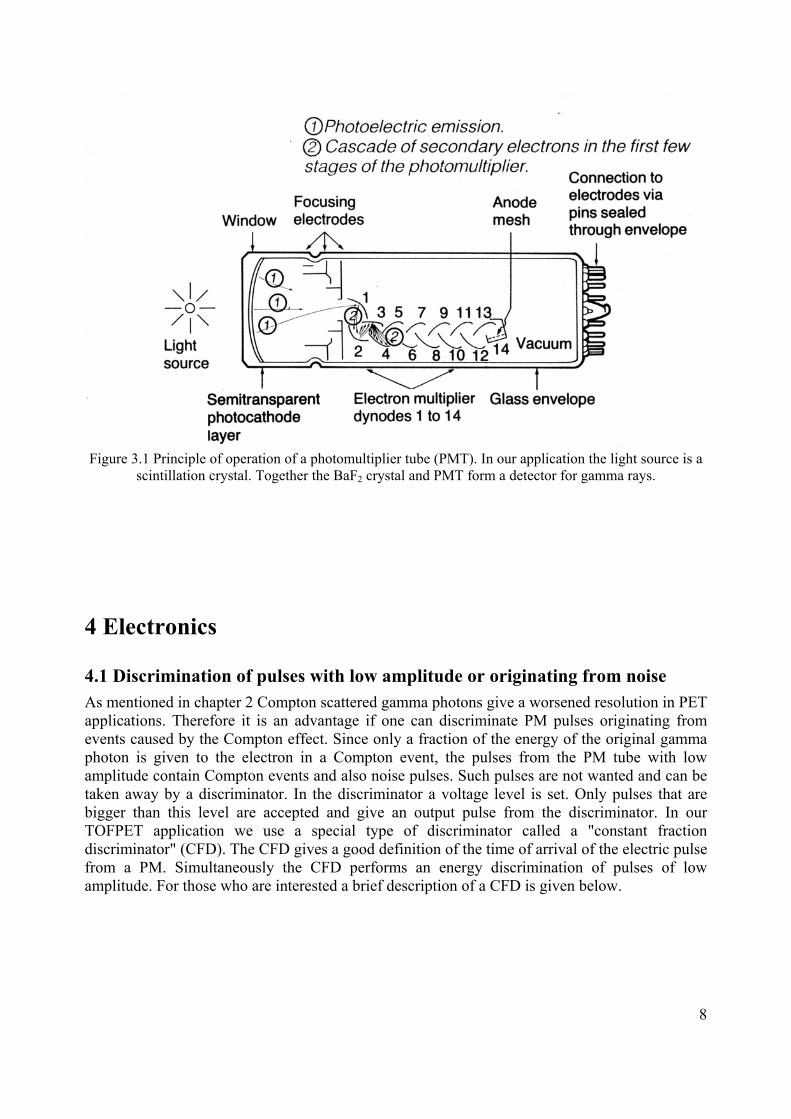
A typical scintillation detector consists of a scintillating crystal coupled to a photomultiplier tube(PMT, see fig. 3.1), a resistor chain that distributes the voltages to the dynodes, and all thishoused in a metallic shield. For details see www.nuclear.kth.se/diploma/petproject/intro.html.
When a 511 keV photon enters the detector it will deliver all (photo effect) or a fraction(Compton scattering) of its energy to an electron. The electron will ionise and excite the atoms inthe crystal, causing the crystal to scintillate and emit a small flash of light. When the emittedlight photons reach the photo cathode of the PMT, photo electrons will be emitted. Theseelectrons are accelerated towards the first dynode with a voltage (difference) of ≈100 V. At thedynode more electrons are released. This multiplication process continues via 8 - 14 dynodes(depends on type of PMT) until the growing electron cloud finally reaches the anode, where thesignal is collected. The PMT thus converts the light into an amplified electronic pulse. (Seefigure 3.1). Standard electronic devices can further process this pulse and information on theimpinging radiation can be extracted. (See next chapter: 4. Electronics)
The PMT (see fig. 3.1) will give an electric pulse proportional to the number of scintillation lightquanta that reach the photo cathode (i. e. deposited energy). Thus energy spectroscopy ispossible with a scintillation detector. In our PET-system, one can by energy discrimination,suppress Compton scattered gamma rays that otherwise would produce noise in the image (seenext chapter).
8
Figure 3.1 Principle of operation of a photomultiplier tube (PMT). In our application the light source is ascintillation crystal. Together the BaF2 crystal and PMT form a detector for gamma rays.
4 Electronics
4.1 Discrimination of pulses with low amplitude or originating from noise As mentioned in chapter 2 Compton scattered gamma photons give a worsened resolution in PETapplications. Therefore it is an advantage if one can discriminate PM pulses originating fromevents caused by the Compton effect. Since only a fraction of the energy of the original gammaphoton is given to the electron in a Compton event, the pulses from the PM tube with lowamplitude contain Compton events and also noise pulses. Such pulses are not wanted and can betaken away by a discriminator. In the discriminator a voltage level is set. Only pulses that arebigger than this level are accepted and give an output pulse from the discriminator. In ourTOFPET application we use a special type of discriminator called a "constant fractiondiscriminator" (CFD). The CFD gives a good definition of the time of arrival of the electric pulsefrom a PM. Simultaneously the CFD performs an energy discrimination of pulses of lowamplitude. For those who are interested a brief description of a CFD is given below.
9
4.2 Constant Fraction Discriminator
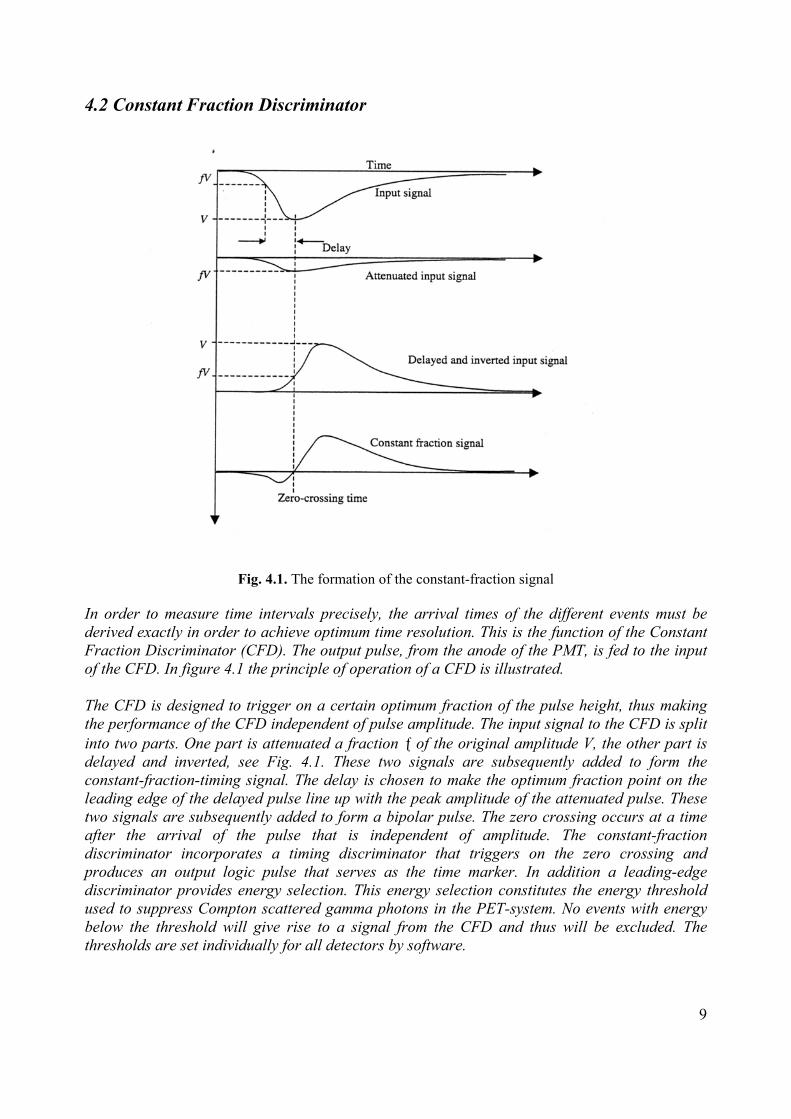
Fig. 4.1. The formation of the constant-fraction signal
In order to measure time intervals precisely, the arrival times of the different events must bederived exactly in order to achieve optimum time resolution. This is the function of the ConstantFraction Discriminator (CFD). The output pulse, from the anode of the PMT, is fed to the inputof the CFD. In figure 4.1 the principle of operation of a CFD is illustrated.
The CFD is designed to trigger on a certain optimum fraction of the pulse height, thus makingthe performance of the CFD independent of pulse amplitude. The input signal to the CFD is splitinto two parts. One part is attenuated a fraction ƒ of the original amplitude V, the other part isdelayed and inverted, see Fig. 4.1. These two signals are subsequently added to form theconstant-fraction-timing signal. The delay is chosen to make the optimum fraction point on theleading edge of the delayed pulse line up with the peak amplitude of the attenuated pulse. Thesetwo signals are subsequently added to form a bipolar pulse. The zero crossing occurs at a timeafter the arrival of the pulse that is independent of amplitude. The constant-fractiondiscriminator incorporates a timing discriminator that triggers on the zero crossing andproduces an output logic pulse that serves as the time marker. In addition a leading-edgediscriminator provides energy selection. This energy selection constitutes the energy thresholdused to suppress Compton scattered gamma photons in the PET-system. No events with energybelow the threshold will give rise to a signal from the CFD and thus will be excluded. Thethresholds are set individually for all detectors by software.
10
4.3 The PET Data Acquisition System
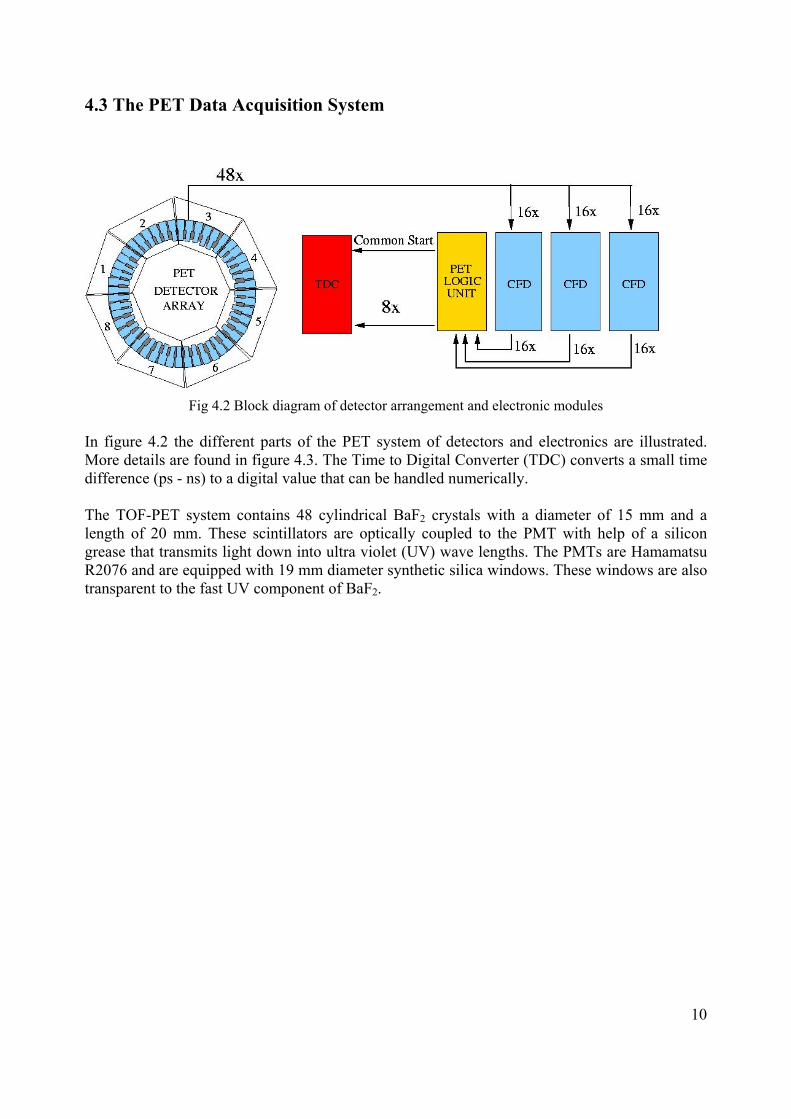
Fig 4.2 Block diagram of detector arrangement and electronic modules
In figure 4.2 the different parts of the PET system of detectors and electronics are illustrated.More details are found in figure 4.3. The Time to Digital Converter (TDC) converts a small timedifference (ps - ns) to a digital value that can be handled numerically.
The TOF-PET system contains 48 cylindrical BaF2 crystals with a diameter of 15 mm and alength of 20 mm. These scintillators are optically coupled to the PMT with help of a silicongrease that transmits light down into ultra violet (UV) wave lengths. The PMTs are HamamatsuR2076 and are equipped with 19 mm diameter synthetic silica windows. These windows are alsotransparent to the fast UV component of BaF2.
11
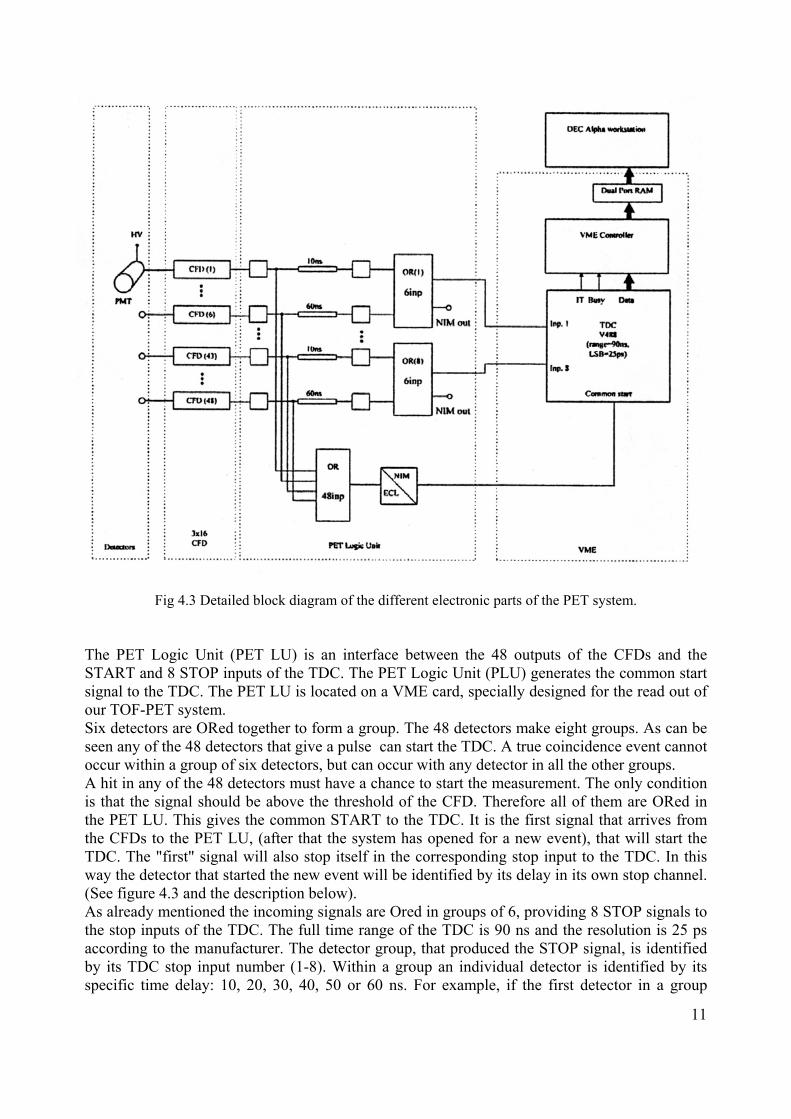
Fig 4.3 Detailed block diagram of the different electronic parts of the PET system.
The PET Logic Unit (PET LU) is an interface between the 48 outputs of the CFDs and theSTART and 8 STOP inputs of the TDC. The PET Logic Unit (PLU) generates the common startsignal to the TDC. The PET LU is located on a VME card, specially designed for the read out ofour TOF-PET system. Six detectors are ORed together to form a group. The 48 detectors make eight groups. As can beseen any of the 48 detectors that give a pulse can start the TDC. A true coincidence event cannotoccur within a group of six detectors, but can occur with any detector in all the other groups. A hit in any of the 48 detectors must have a chance to start the measurement. The only conditionis that the signal should be above the threshold of the CFD. Therefore all of them are ORed inthe PET LU. This gives the common START to the TDC. It is the first signal that arrives fromthe CFDs to the PET LU, (after that the system has opened for a new event), that will start theTDC. The "first" signal will also stop itself in the corresponding stop input to the TDC. In thisway the detector that started the new event will be identified by its delay in its own stop channel.(See figure 4.3 and the description below). As already mentioned the incoming signals are Ored in groups of 6, providing 8 STOP signals tothe stop inputs of the TDC. The full time range of the TDC is 90 ns and the resolution is 25 psaccording to the manufacturer. The detector group, that produced the STOP signal, is identifiedby its TDC stop input number (1-8). Within a group an individual detector is identified by itsspecific time delay: 10, 20, 30, 40, 50 or 60 ns. For example, if the first detector in a group
12
stopped the TDC, the result of the time to digital conversion is 10 ns plus the flight time. For thesecond detector the result is 20 ns plus flight time and so on. Since the flight time is ≤ 2 ns eachdetector is easily identified within a time window of 10 ns. As seen in figure 4.3 the differentdelays are fixed and included in the PET LU electronics. They cannot be altered by software.With a pair of BaF2 detectors a best time resolution of 340 ± 10 ps has been achieved. Realcoincidence events between two detectors are called doubles. A detector that starts the TDC butdoes not get a stop from any other detector group gives an event called a single.
The software stores the time and channel number of all TDCs that were stopped before the FullScale Time Range was reached.
4.4 Event Building and Software
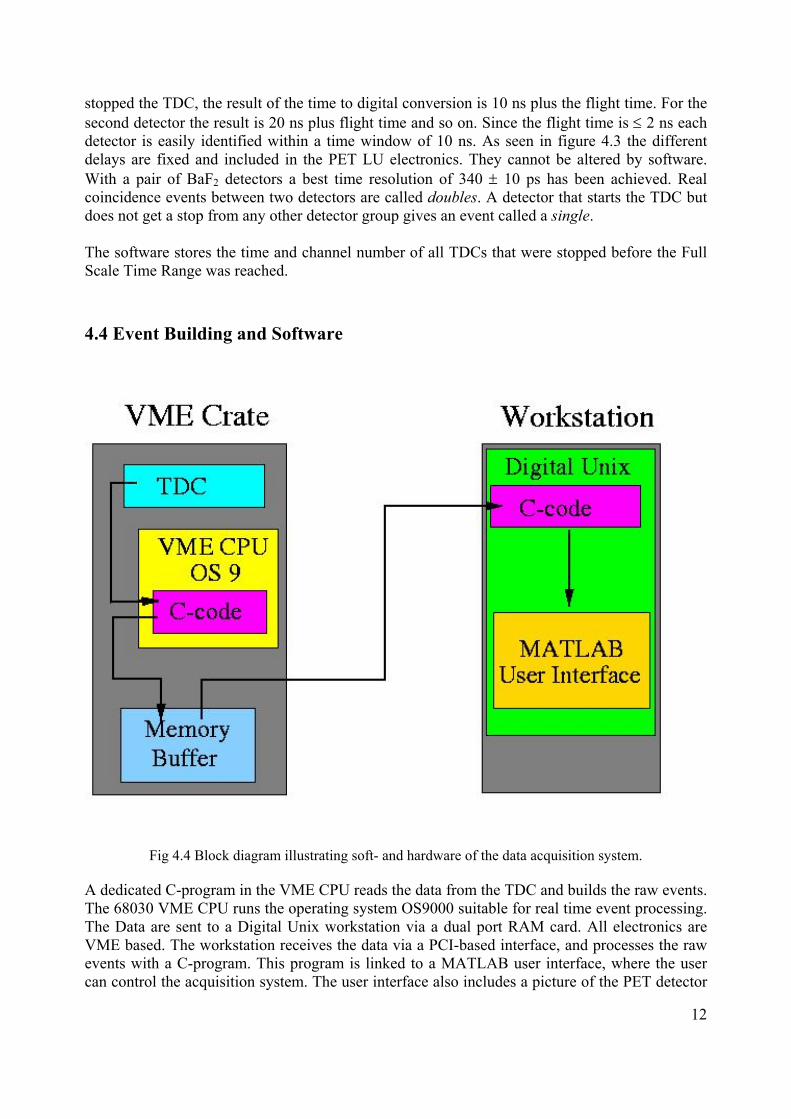
Fig 4.4 Block diagram illustrating soft- and hardware of the data acquisition system.
A dedicated C-program in the VME CPU reads the data from the TDC and builds the raw events.The 68030 VME CPU runs the operating system OS9000 suitable for real time event processing.The Data are sent to a Digital Unix workstation via a dual port RAM card. All electronics areVME based. The workstation receives the data via a PCI-based interface, and processes the rawevents with a C-program. This program is linked to a MATLAB user interface, where the usercan control the acquisition system. The user interface also includes a picture of the PET detector
13
array and provides a feedback by drawing every coincidence line between the two individualcoincident detectors, event by event. The event stream is also stored in a list mode file for offline processing.
Presently we are installing a PC that will replace the workstation. You will learn which system isin operation on your day of exercise. Hopefully the PC system will be ready.
5 The Principles of PET and TOFPET
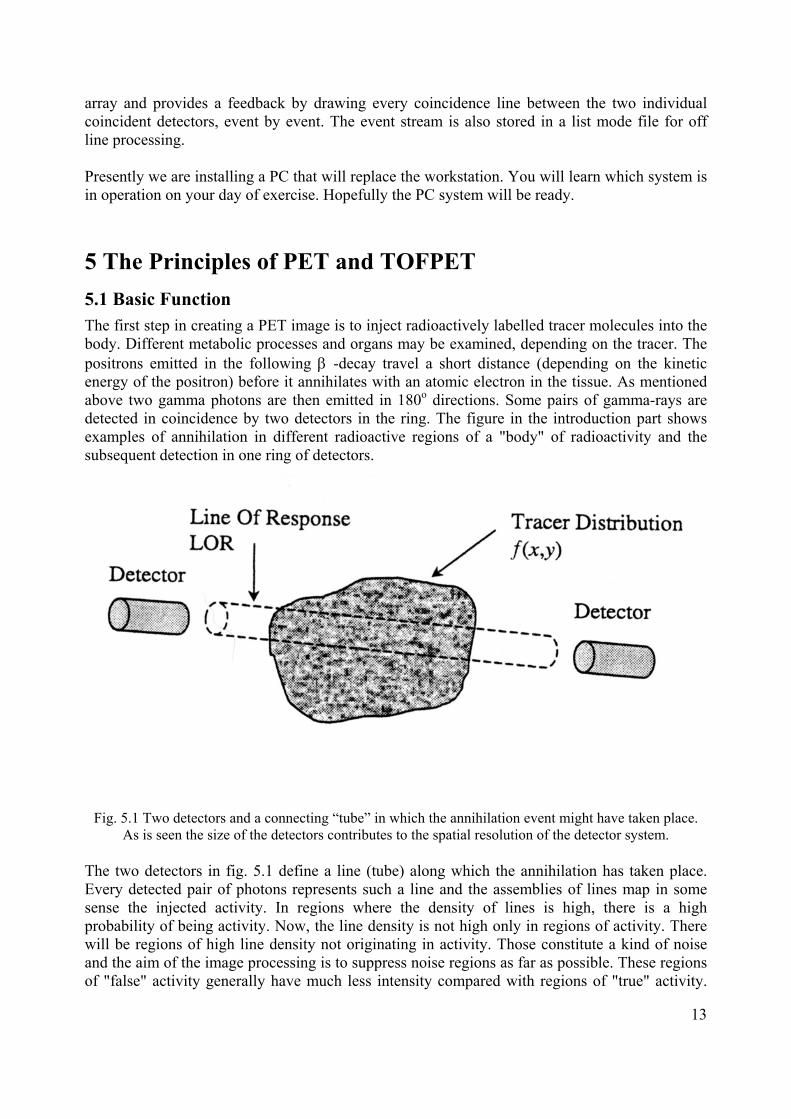
5.1 Basic FunctionThe first step in creating a PET image is to inject radioactively labelled tracer molecules into thebody. Different metabolic processes and organs may be examined, depending on the tracer. Thepositrons emitted in the following β -decay travel a short distance (depending on the kineticenergy of the positron) before it annihilates with an atomic electron in the tissue. As mentionedabove two gamma photons are then emitted in 180o directions. Some pairs of gamma-rays aredetected in coincidence by two detectors in the ring. The figure in the introduction part showsexamples of annihilation in different radioactive regions of a "body" of radioactivity and thesubsequent detection in one ring of detectors.
Fig. 5.1 Two detectors and a connecting “tube” in which the annihilation event might have taken place.As is seen the size of the detectors contributes to the spatial resolution of the detector system.
The two detectors in fig. 5.1 define a line (tube) along which the annihilation has taken place.Every detected pair of photons represents such a line and the assemblies of lines map in somesense the injected activity. In regions where the density of lines is high, there is a highprobability of being activity. Now, the line density is not high only in regions of activity. Therewill be regions of high line density not originating in activity. Those constitute a kind of noiseand the aim of the image processing is to suppress noise regions as far as possible. These regionsof "false" activity generally have much less intensity compared with regions of "true" activity.
14
The assembly of lines contains the image information. This assembly is treated with differentimage processing tools to produce the final image. These principles are explained in detail in thediploma work that can be found on the nuclear physics homepage. The simplest way ofprocessing is to draw all LORs (see fig. 5.1).The LORs will cross at regions of high activity,other regions can be suppressed by a discriminating threshold.
5.2 TOPFET
With the information of the difference in time of flight for the two detected gamma quanta, onecan locate the point of highest activity to a point along the LOR. Usually the intensity along theline is given a gaussian distribution. This defines regions of activity which are less probable thanothers. The time resolution is not good enough to sharpen the image, but good enough to reducethe noise. This subject will be discussed and demonstrated further during the laboratory exercise.
6. The Laboratory ExerciseThe exercise will start with a discussion about the PET technique. We will talk about the physicsbehind it, and about how the PET technology can be used in medicine. In particular, we willdiscuss the TOF technique used in this specific PET setup. We will also briefly discuss theelectronics and acquisition system used to extract the data from the PET system.
To understand the detector technology involved, we will then use two different kinds of detectors,a germanium detector and a BaF2 detector, to detect gamma radiation from a 22Na radioactivesource. We will study their behaviour by looking at the electronic pulses they send out (using anoscilloscope), and we will look at energy spectra using a PC-based Multi Channel Analyser(MCA). We will probably only have time to discuss this part, maybe look at one or two spectra.
After this we will run the PET system and collect data, again using 22Na sources. We willinvestigate the data, and reconstruct images. Specifically, we will compare images reconstructedwith TOF information to non-TOF images.
A final exercise is to find one or two 22Na sources hidden in a dummy head, using only the PETdevice.
This exercise itself will take about 5 hours. In order to be prepared for the exercise, you shouldread about PET in this instruction, in your textbook, and elsewhere for example on the internet,where this PET demonstrator is described more in detail (See Diploma work on the NuclearPhysics Home page). On the WWW you can also find Departments at Karolinska Sjukhuset (KS)in Stockholm and at Akademiska sjukhuset (Petcenter) in Uppsala where PET is used in researchand diagnostics.
To do before the exercise in the laboratory:
• Read about the physics of PET • Find out something about different applications of PET

15
• You can search the Web for information: PET Center in Uppsala, Karolinska Inst inStockholm
• Try to answer the following questions (to be discussed at the beginning of the laboration):
• How can we make use of the beta decay in PET? • How does a scintillation detector work? • How does a photo multiplier tube (PMT) work? • What is a constant fraction discriminator? • What is a time-to-digital converter (TDC)? • What are the advantages/disadvantages of PET in medical applications? • What are the main differences between our PET system and a commercial PET
system?
During the laboratory exercise you will do the following
• We will start with a discussion/lecture about PET/Physics/Detectors etc.• OBS! All radioactive sources will be handled by the assistant only! • Calculate the dose that will be received during the exercise. Compare with the normal
yearly dose.• Measure pulses from a 22Na radioactive source with a BaF2 detector and a Germanium
detector. The Ge-detector will be described by the assistant. Look at the pulses with theoscilloscope. How does the intensity and height of the pulse depend on the incominggamma photon?
• Use the PC-based MCA (multi channel analyser) to get an energy spectrum (as the oneabove). Explain the different parts of the spectrum. Compare germanium and BaF2
detectors. Can we see anything not related to the 22Na source? • Start the PET system. Put a 22Na source in the centre. Start the acquisition. Stop after
about 5 minutes and study the data file. Think about how we can reconstruct an imagefrom this data.
• Run the petlines and petdots programs to see how data relates to position. What is theapproximate time resolution of the system?
• Reconstruct the image in MATLAB. • Look at different ways of reconstruction; overlapping bands, Gaussian bands, TOF, no
TOF. (TOF/nonTOF)• Move the motor (z direction) to see how sensitive the system is in this direction. How
thick is one plane? • The assistant will put two sources in one plane with a well defined geometry (out-of-
centre). Run the system and reconstruct the images. • Use MATLAB to add some filtering. What can be gained by filtering? • The lab. assistant will put some sources in the model head. Run the motors and acquire
data in all planes of the head to find the sources. Reconstruct planes with high count rate. • If you would like to save your pictures in a computer, send them by ftp to your accounts
at KTH. • Write a report describing briefly the methods and procedures as well as the results
obtained.

16
These "points" might be changed depending on the status of the PET detector and dataacquisition system!
7. PET image reconstructionExplain how the PET picture is made. Show the coincidence lines. Make pet picture of point source in centre. process the data file(s) to make nice picture. a) point source centre b) measure FWHM along the axis of PET by moving the source (peak value, every5mm, 8
points c) measure FWHM in the plane of PET by moving the source (or two sources) (peak value,
every5mm, 8 points d) Find tumour in the incredible PET-man
Recommended