Vol. 75. No. 4. pp. 412-426.©2009 Council fir Exceptional Chiliiren.
Predictors of Change inEligibility Status Amon^Preschoolers in SpecialEducation
TAMARA C. DALEY
ELAINE CARLSONWestat
ABSTRACT:T: Relatively little is known about the incidence of declassification among young children
who receive preschool special education services or about factors associated with declassification.
The Pre-Elementary Education Longitudinal Study (PEELS) follows a nationally representative
sample of children who were receiving preschool special education, services, in 2003-2004. Data
from PEELS show that approximately 16% of preschoolers who received special education services
stopped receiving those services, or were "declassified, " each year over a 2-year period. In a multi-
variate logistic regression, significant variables predicting declassification 'included child gender,
size of the district's preschool special education program, district wealth, dishbility category, ratings
of problem behaviors, severity of impairment, anaSscores on the Peabody Picture Vocabulary Test.
The process for obtaining specialeducation services is well speci-fied within the regulations of theIndividuals With Disabilities Ed-ucation Act (IDEA, 2004). In
contrast, there are no clearly defined federal crite-ria regarding the process by which a child leavesspecial education. If districts rely on federal lawfor guidance, regulation 300.534 (c)(l) of IDEA2004 states simply that "a public agency mustevaluate a child with a disability in accordancewith Sections 300.532 and 300.533 before deter-mining that the child is no longer a child with adisability"; Sections 300.532 and 300.533 oudineevaluation procedures. The only available research
4 1 2
on the topic amoiig very young children suggeststhat as mariiy as 50% of preschool programs donot have written specifications for exit criteria(Thurlow, Ysseldyke, & ¡Weiss, 1988). Leavingspecial education has historically been consideredrare (Finn, Rotherham, &• Hokanson, 2000), anddata on declassification have been collected bythe Office of Special Education Programs (OSEP)only since 1993-1994 and only for students ages14 and older. !
Despite the vagaries associated with exitingspecial education, many young children do re-ceive services and support for a period of timeand then stop. Data from Washington and Col-orado showed that one sixth to one third of chil-
Summer 2009
dren graduating from preschool were placed ingeneral education programs with no support(Edgar, McNulty, Gaetz, & Maddox, 1984). Stile,LeCrone, and Ames (1991) reported the sameoutcome for 1 in 10 children from 74 school dis-tricts in New Mexico. Among children receivingpreschool special education services in two NorthCarolina counties, 28% were no longer receivingservices upon entry into elementary school(Wong, 1997).
[Tjhere are no clearly defined federalcriteria regarding the process by which
a child leaves special education.
Longitudinal analyses have produced similarfindings. Thirty-two percent of preschoolers whowere classified as having speech impairments in aMaryland county exited special education duringa 4-year period. Even among children identifiedwith two or more disabilities, 11% left special ed-ucation by the first year of elementary school(Markowitz & Bridges-Cline, 1991). Higher rateswere observed in a more recent study of childrenwho were enrolled in preschool special educationin Utah; approximately 50% of children were nolonger receiving services 2 years after their initialenrollment in the study (Innocenti, 2005).
We know relatively little about the factorsthat are associated with leaving special education,but given that the regulations of IDEA frame theprocess of declassification in terms of eligibilitydetermination, we can turn to this body of re-search as background. Within the special educa-tion literature, there is a longstanding andongoing criticism of classification and eligibilitypractices, stemming from seminal works such asNicholas Hobbs' Issues in the CUissification of Chil-dren (1975). Certain disability categories haveparticularly come under fire for being social con-structions; for example, the emergence of thelearning disability category was seen as a way forchildren of middle-class, white families to receiveservices without being stigmatized (Sleeter, 1986).More recently, critics have asserted that Asperger'ssyndrome is used for eligibility purposes when itoften reflects normal variations in personality(Molloy & Vasil, 2002). In short, many re-searchers have identified theoretical flaws with
any system that lacks "reliability, coverage, logicalconsistency, utility, and acceptability to users"(Cromwell, Blashfield, & Strauss, 1975, p. 22),all of which are limitations critics have raised ofthe categorical eligibility system under IDEA.
A comprehensive review of the criticisms ofcurrent IDEA eligibility practices, which aboundin the literature, is beyond the scope of this arti-cle, but a few examples are illustrative. Racial andethnic disproportionality in special educationplacement has been identified as a problem fordecades; two panels convened by the NationalAcademy of Sciences, in 1982 and 2002, ad-dressed this issue at a national level (Donovan &Cross, 2002; Heller, Holtzman, & Messick,1982). In part because of these panels, IDEA nowincludes specific activities that are aimed at pro-viding support to districts with evidence of signif-icant disproportionality. Consistent with this,recent work (e.g., Skiba, Poloni-Staudinger,Callini, Simmons, & Feggins-Azziz, 2006) notesthat longstanding differences in classificationbased on race and ethnicity are still present, withAfrican American children more likely to be clas-sified as having mental retardation and emotionaldisturbance than non-African American children.Of note, however, Hibel, Farkas, and Morgan(2006) found that African American, Hispanic,and Asian students were much less likely to beplaced into special education programs and thatattending schools with lower average perfor-mance, being female, and lacking academic readi-ness also decreased a student's chance of enteringspecial education.
Several researchers have demonstrated power-ful district-level influences on classification. Forexample, using functional profiles. Singer, Palfrey,Butler, and Walker (1989) showed that classifica-tion of children, particularly those with the labelsof emotional disturbance and mental retardation,varied based on district of residence. Similarly, re-searchers have demonstrated that low-achievingstudents in general education are functionallysimilar to many students identified as havinglearning disabilities (Ysseldyke et al., 1983). Evenusing the most current data available from OSEP,it is clear that there is wide variability and overlapin criteria and definitions across districts andstates, particularly for some disability categories(Hallahan et al., 2007).
Exceptional Children
, Past research has examined declassification inthe context of some of these same factors, al-though to a more limited degree. Several studieshave confirmed that children who exit special ed-ucation have higher academic and intellectualfunctioning than those who remain eligible (Carl-son, 1997; Halgren &C Clarizio, 1993; Innocenti,2005; Ysseldyke & Bielinski, 2002). Across agegroups, children identified as having speech orlanguage impairments and learning disabilitieswere the most likely to leave special education(Carlson; Carlson & Parshall, 1996; Halgren &Clarizio; Innocenti; Walker et al,, 1988; Wong,1997). Nevertheless, a small percentage of chil-dren (2%-4%) declassified in a recent study of el-ementary-age children were previously identifiedas having autism, mental retardation, and multi-ple disabilities (SRI International, 2005),
Although child functioning is a logical pre-dictor of declassification, certain demographicfactors have also been linked with declassification.Higher incomes were associated with greater de-classification among school-age children (Carlson,1997; SRI International, 2005) and with morefi"equent checks on progress among preschoolers(Markowitz & Bridges-Cline, 1991); children oflower income families across a range of ages weremore likely than those in higher income familiesto be reclassified into different disability cate-gories (Halgren & Clarizio, 1993).
With respect to race, declassification was re-ported to be more likely among White childrenthan among African American or Hispanic chil-dren in school-age samples (Carlson, 1997) andless likely for African American children withinthe category of speech impairment (Walker et al,,1988). Some demographic factors, such as gender,have not previously been linked to declassification(Carlson; Carlson & Parshall, 1996),
We are not aware of any studies that have ex-amined important process variables, such as parentinvolvement or school outreach, in relation to de-classification. Two studies examined parent satis-faction as it relates to change in disability categoryand change in programming. Parents of school-agechildren who left special education were slightlymore likely to report being very satisfied with theirchild's school than parents of students who contin-ued receiving services (SRI International, 2005);Halgren and Clarizio (1993) found no such asso-
414
ciation between parent satisfaction and declassifi-cation, ¡
Ideally, characteristits of a child's district andschool would not play al central role in determin-ing changes in eligibility status. But a New Yorkstudy found that suburban preschool programshad the highest percentage of preschool childrendeclassified, and New York City programs had thelowest percentage (MAGI Educational Services,Inc., 2003), In contrast; a comparison in NorthCarolina found that preschoolers from an urbancounty were more likely to leave special educationthan those from a rural county (Wong, 1997).Other factors, such as size of the special educationprogram and district wealth, have not previouslybeen examined. j
As referenced earlier, past research has docu-mented numerous fiawslin the predominant sys-tem of eligibility deterrnination for children inthe United States, which; at best might be charac-terized as inconsistent (Ysseldyke, 2001; Ys-seldyke et al,, 1983), A smaller body of pastresearch has exarnined the opposite process, de-classification, with mixed and limited findings.Therefore, the central question of this study canbe stated a|s follows: Is the process of declassifica-tion one that is logical ahd predictable from rele-vant child factors or, in| contrast, is it one thatvaries according to demographic or district-levelcharacteristics? i
This study includes] a range of independentvariables to explore this question. As noted ealier,some of these have previously been examined inthe literature (child academic skills, gender,race/ethniclity, and disability category; transitionstatus; household inconie; metropolitan status;and parent; satisfaction), ^vhereas others have not(district size, preschool special education enroll-ment, and wealth; parent involvement; andschool/program outreach). We also address somelimitations ;of past studies of preschool special ed-ucation status. Specifically, they have either sam-pled all students in one! district or a sample ofstudents from a set of districts within a state, andmany of the studies of preschoolers are more than2 decades old. In this study, we use a large, na-tionally representative sample of children ages 3through 5 and eligible for special education ser-vices during the 2003-2004 school year to exam-ine declassification after 2 years. This study
Summer 2009
represents an opportunity to extend the literatureon deciassification by filling gaps in what weknow and providing current data for a preschool-age population.
METHOD
DESIGN AND SAMPLE
The PEELS, sponsored by the National Centerfor Special Education Research in the U.S. De-partment of Education, is following a nationallyrepresentative sample of 3,104 children from apopulation of approximately 670,000 childrenwho were receiving special education services in2004, when they were 3 through 5 years old.PEELS used a two-stage sample design: In thefirst stage, a national sample of local educationagencies (LEAs) was selected. In the second stage,a sample of preschoolers with disabilities was se-lected from lists of eligible children provided bythe participating LEAs.
The PEELS data collection includes par-ent/guardian interviews, teacher questionnaires,direct assessments of the children, and question-naires sent to children's programs, schools, dis-tricts, and states. Instruments were designed tocapture information on the characteristics of chil-dren receiving preschool special education, theservices they receive, their transitions from earlyintervention to preschool and from preschool toelementary school, and their educational perfor-mance. (Data from an early childhood programdirector, elementary school principal, and stateeducation agency questionnaire were not used inthis analysis.)
Children were recruited into PEELS as 3-, 4-,and 5-year-olds. All participating 3-year-olds werenewly enrolled in special education during the re-cruitment period; participating 4- and 5-year-oldsincluded children both newly enrolled in specialeducation during the recruitment period andthose who had already been identified as eligiblefor services. Because the PEELS sarriple was se-lected by age, not by grade, some of the childrenwere in kindergarten; others were in preschool,day care, or at home. The children may or maynot have received early intervention services frombirth to age 3 through Part C of IDEA.
Eligibility criteria for study participationwere: (a) there was an English- or Spanish-speak-ing adult or an adult who used signed communi-cation in the household or, alternatively, couldrespond to questions using a telephone relay ser-vice or interpreter for the hearing impaired; (b)this was the family's first child sampled forPEELS; and (c) the sampled child's family residedin the participating school disrrict at the time ofenrollment in PEELS. Eighty-eight percent of thefamilies were found eligible for rhe study, and80% of those eligible agreed to participate.
The data presented have been weighted togenerate national estimates. Different weightswere used, depending on the sources of data.These weights adjust the child base weights to ac-count for nonresponse on specific data collectionsin specific waves or groups of waves. (For a moredetailed description of family recruitment, sam-pling, and weighting procedures, see Markowitzet al., 2006, at www.peels.org.)
MEASURES
Outcome Variahle: Special Education Eligibil-ity Status. At the time they were recruited intoPEELS, all children had an active individualizededucation program (lEP) or individualized familyservice plan (IFSP). At each point of data collec-tion, teachers reported whether the child had ei-ther an lEP or IFSP. If those data were missing forthe relevant year, teacher reports from the follow-ing year were used to determine changes in thechild's lEP status. Teachers were routinely askedwhether the child received special educarion ser-vices during the previous year. If data on lEP sta-tus were still unavailable from both these sources,parent response was used. Because of the large-scale nature of the study, independent confirma-tion of eligibiliry status was not available. Theprimary deciassification variable used in this studyidentifies children decla.ssified by the 2005-2006school year, with deciassification occurring eitherbetween 2003-2004 and 2004-2005, or between2004-2005 and 2005-2006. A small group ofchildren (5.8%) discontintied special educationservices prior to 2003-2004 data coUectiori.These children were excluded from the analysespresented here. In addition, children whochanged from one disability classification to
Exceptional Children
another (for example, from developmental delay [to mental retardation) were not considered declas-sified, because they continued to receive services iunder IDEA. I
Control Variable: Preschool Status. The transi- ;tipn from preschool to kindergarten is a timewhen special education eligibility may receive par-ticular scrutiny, with an inclination among someeducators and administrators to give the child achance in general education (Edgar, Heggelund,& Fischer, 1988). Therefore, as a control variablein the multivariate model, we have includedwhether the child remained in preschool frorn2003-2004 to 2005-2006. This variable wasbased on teacher report.
Demographic and Household Characteristics.Demographic and family characteristics, such aschild gender, race/ethnicity, and household in-come, were obtained through the parent inter-view. For this analysis, race/ethnicity was derivedfrom a series of questions and recoded into threecategories: Hispanic and of any race. Black orAfrican American orily (not Hispanic), and Whiteonly (not Hispanic). Children from other racialgroups were excluded from analyses by race be-cause the samples were too small to produce reli-able results.
District Characteristics. Information aboutdistrict wealth, metropolitan status, and size ofthe district's preschool special education prograrriwas taken from the Quality Education Data(QED) district file, which was used as the PEELSdistrict sampling frame. PEELS uses the same cutpoints as the QED. District poverty was definedas a percentage of the district's children fallingbelow the federal governrnent poverty guidelines,where high wealth was 0% to 12%, mediumwealth was 13% to 34%, low wealth was 35% to40%, and very low wealth was more than 40%.
Metropolitan status was defined by the desig-nations of the U.S. Department of Education'sNational Center for Education Statistics (NCES),as applied by QED, and was classified as urban,suburban, and rural.
District preschool special education enroll-ment size (for children ages 3 through 5 years)was categorized as small if the district had 41 orfewer children enrolled, medium if it had between42 and 117 children enrolled, large if it had 118
to 390 children enrolled, and very large if the dis-trict had 391 or more children enrolled.
Overall district size was obtained through theLEA questionnaire and was based on total districtenrollment. Based on cutoffs used in the NCESCommon-Core of Data,' the districts were catego-rized as small if they had 300 to 2,500 students,medium if they had 2,501 to 10,000 students,large if they had 10,001 to 25,000 students, andvery large if they had mote than 25,000 students.
Disability Category. Information on children'sprimary disability category was obtained frorntheir teachers or service providers. If those datawere missing, disability information was obtainedfrom enrollment forms submitted by district per-sonnel. Because of the srhall sample sizes for somedisability categories, a low-incidence category wascreated; it included deaf/blindness, deafness, hear-ing impairment, traumatic brain injury, visual im-pairment, and other (disabilities that werespecified on the teacher questionnaire or enroll-ment form. Therefore, in this study, primary dis-ability is grouped into nine categories: autism,developmental delay, emotional distur-bance/behavior disorder, learning disability, men-tal retardation, orthopedic impairment, otherhealth impairment, speech or language impair-ment, and low-incidence disabilities.
SchooVProgram Outreach, Parent Involvement,and Parent Satisfaction. Three scales on school/pro-gram outreach, parent involvement, and parentsatisfaction were developed using questions fromthe parent interview and! were created using Mas-ter's partial credit model of scaling (Masters,1982). This model provides estimates of item loca-tions or calibrations along a common measure-ment continuum. Unidfmensionality along theconstruct was determined by goodness-of-fit statis-tics. These infit statistics compare each child's ob-served response pattern' to his or her expectedresponse pattern for each specific overall score.The expected value of the mean square INFIT(MNSQ) is 1.00. Deviation above 1.00 indicatespotential departures from unidimensionality; val-ues less than 1.00 flag potential violations of localindependence. A reasonable criterion value forgoodness-of-fit for npn-high-stakes measures is be-tween 0.7 and 1.3 (Wright Si Linacre, 1994). Forall three measures, the INFIT (MNSQ) statisticwas well within the acceptable bounds.
4 1 6 Summer 2009
The school/program outreach scale reflectedparent interview responses for three variables: thefrequency of personal notes, notices, and phonecalls from the school. The INFIT (MNSQ) statis-tic for' this scale was 0.92.
The parent involvement scale included 11items from the parent interview related to partici-pation in school and classroom activities (e.g., at-tending a school meeting or a class event, aparent—teacher conference, or planning groups;volunteering in the classroom; helping with fieldtrips; and fundraising); involvement in the IEPprocess (e.g., attending the meeting, involvementin generating goals, and parent satisfaction abouttheir involvement in determining IEP goals); andthe number of other parents from the child's pro-gram with whom the respondent spoke. TheINFIT (MNSQ) statistic for this scale was 0.98.
The parent satisfaction scale comprised 17variables, covering respondent satisfaction withthe child's program/school and teachers; commu-nication with staff; availability, quality, andamount of services received; feelings toward spe-cial education professionals, in general, and feel-ings toward the professionals who worked withtheir child, in particular; and satisfaction with thechild's IEP goals. The INFIT (MNSQ) statisticfor this scale was 0.97.
Functioning, Behavior, and Emerging LiteracySkills. Parents provided information about theseverity of their child's disability, a six-componentvariable based on the framework of the ABILI-TIES Index (Bailey, Simeonsson, Buysse, &Smith, 1993) and consisting of cognition, corn-munication, overall health and limitations thatwere due to health, regulation of activity level,regulation of attention, and understanding of lan-guage. Using the PEELS sample, validity of anabbreviated index was also established throughsignificant correlations with age at which childrenbegan receiving special education or therapy ser-vice {r = .22), the teacher-reported amount ofmodification to curriculum materials {r = .42),and with the number of services the child receivedin the school (r = .37). The PEELS ABILITIESIndex also significantly differentiated betweenchildren who took alternate and regular assess-ments in PEELS (Daley, Simeonsson, & Carlson,2008).
Teachers provided information on children'sproblem behavior using a standardized ratingscale, the Preschool and Kindergarten BehaviorScales, Second Edition (PKBS-2; Merrell, 2002).The Problern Behaviors composite comprises Ex-ternalizing and Internalizing Prçblems subscales.The composite score is converted to a standardscore, which is based on a distribution with amean of 100 and a standard deviation of 15. Thisscale has Cronbach alpha coefficierits of ,93 to .95and 3-week test-retest reliability froin .70 to .78for the two subscales (Merrell).
A direct one-on-one assessment was used toobtain information on the preacademic skills ofpreschoolers in the sample. More than 400 asses-sors in participating LEAs were employefd andtrained to administer the one-on-one assessment.These assessors included school psychologists,teachers, administrators, and other individuals ex-perienced in administering standardized assess-ments to young children with disabilities. In thisreport, vve use data from two emerging literacy as-sessments, the Woodcock-Johnson III Letter-Word Identification subtest (Woodcock, McGrew,& Mather, 2001) and a psychometricaUy short-ened version of the Peabody Picture VocabularyTest-III (PPVT-III; Dunn & Dunn, 1997).
The Letter-Word Identification test mea-sures the child's word identification skills. Initialitems require the child to identify letters that ap-pear in large type, arid the remaining items re-quire the child to pronounce words correctly. Thestandard scale score used in the Letter—WordIdentification has a mean of 100 and a standarddeviation of 15 (Woodcock et al., 2001). Test de-velopers reported a 1-year test-retest correlationof .92 for children ages 4 to 7 (McGrew &Woodcock, 2001).
The PPVT-III is a measure of receptive vo-cabulary. The standard administration of thePPVT-III involves the assessor showing the childfour pictures on a single, page then asking thechild to point to the picture that matches a wordthe assessor speaks aloud. PEELS uses a psycho-metricaUy adapted and shortened version of thePPVT-III. With the shortened version, all chil-dren are presented a core set of 14 items. If theirperformance on the core set of items is extremelylow or high, they are administered an easier basalset of items (for children who get all or most of
Exceptional Children 4 1 7
the core items incorrect) or a harder ceiling set ofitems (for children who get all or most of the coreitems correct) to determine their basic or ex-tended level of performance. The Item ResponseTheory (IRT) true-score for the items in the coreitem set was used to determine basal and ceilingdecision rules appropriate for the PEELS targetpopulation. The IRT true-score is a model-basedestimate of the number right raw score. Rawscores on the core item set were used to determinewhether a child would actually receive either theadditional basal or ceiling item set. The IRT esti-mate of test reliability for a population havingdistribution parameters equal to those of thePEELS latent ability distribution is r = .78. Thesample-based IRT reliability obtained from abilityestimates and standard errors of measurement inPEELS is r = . 86.
Because the PEELS adapted version of thePPVT and the full PPVT have a common subsetof items, it was possible to apply a linear transfor-mation to the proficiencies of thé PEELS assess-ment so that proficiencies were comparable to thenational norming sample. Therefore, the PPVTshort forms yield the same expected score valuesas the full PPVT, making use of the publisher'snorms appropriate. The standard version of thePPVT-III has high alternate form reliability forthe standardized scores (.88 to .96). Test—retest re-liability coefficients were in the .90s (Dunn &Dunn, 1997). Children's scores on the variousparts of the test were transformed into a singlescore and placed on a standardized scale with amean of 100 and a standard deviation of 15.
The PPVT and Woodcock-Johnson III Let-ter-Word Identification subtest were selected be-cause they were administered to the largestnumber of children in the sample (some measureswere administered only to older or younger chil-dren). If the child could not follow simple direc-tions, had a visual impairment that wouldinterfere with test administration, or began thedirect assessment but could riot meaningfully par-ticipate because of a disability, an alternate assess-ment, the Adaptive Behavior AssessmentSystem-II (ABAS-Il; Harrison & Oakland, 200.3)was used. Coefficient alpha reliabilities for theABAS-II subtests on the teacher and day-careprovider forms ranged from .72 to .97, withhigher reliabilities for composite domain scores
418
(r = .92 to .97). Test—retest reliabilities for periodsof 2 days to 6 weeks rariged from .66 to .98, de-pending on age level and subtest. Approximately100 students included in the analyses reported inthis study had an alternate assessment; these chil-dren are iricluded in all imivariate analyses exceptfor those involving the two literacy measures fromthe standard assessment battery.
I
ANALYSIS 1
. . . ! .Logistic regression is a technique that is similar tomultiple regression but is used with binomiallydistributed dependent variables—in this case,whether the child was declassified. To identifypredictors bf change in eligibility status, we con-ducted a séries of univariate logistic regressions,with each individual predictor entered and withchange in eligibility stattis as the dependent vari-able. We then conducted a mtiltivariate logisticregression with all the individual predictors to-gether. Logistic regression! generates an odds ratio,which is a statistic that can provide informationon the likelihood of a particular outcome. Theadjusted odds ratio generated from the multivari-ate logistic regression represents, for each level ofthe independent variable^ the increased probabil-ity that children were declassified relative to otherlevels ofthat variable. Thé odds ratio can be inter-preted as a iuseful predictor of the outcome whenthe 95% confidence interval around the oddsratio does not include the value 1.0. Conversely, ifthe value of 1.0 is included in the 95% confi-dence interval, the results suggest that there areno significant differences in the probability of agiven outcqrrie for the two groups (i.e., the sub-group in question and the reference group).
In data preparation and analysis, imputationwas conducted for selected items on the child as-sessment data, teacher questionnaire data, andparent interview data. In general, the item miss-ing rate was qtiite;low, mostly less than 10%. Dif-ferent methods of irnputation were useddepending on the nature of missing data andavailable information for imputation. The meth-ods included hot-deck imputation, regression, ex-ternal data source, and deterministic or derivarionmethod, based on the internal consistency princi-ple of interrelated variables. In some cases, a pos-
Siimmer 2009
tulated value was imputed after analyzing missingpatterns.
The data presented here are population esti-mates statistically weighted to represent all chil-dren ages 3 through 5 receiving special educationservices. Analyses were conducted using WesVarVersion 4.2 (Westat, 2002) and PROC SURVEY-LOGISTIC in SAS to account for the complexprobability sampling used in PEELS,
RESULTS
Between winter/spring of school year 2003—2004and winter/spring of school year 2004-2005,16% of preschoolers with disabilities had theirspecial education services discontinued. Of thosechildren who were receiving services in2004—2005, once again, 16% were no longer re-ceiving special education services 1 year later,
UNIVARIATE PREDICTION OF CHANCE
IN ELICIBILITY STATUS
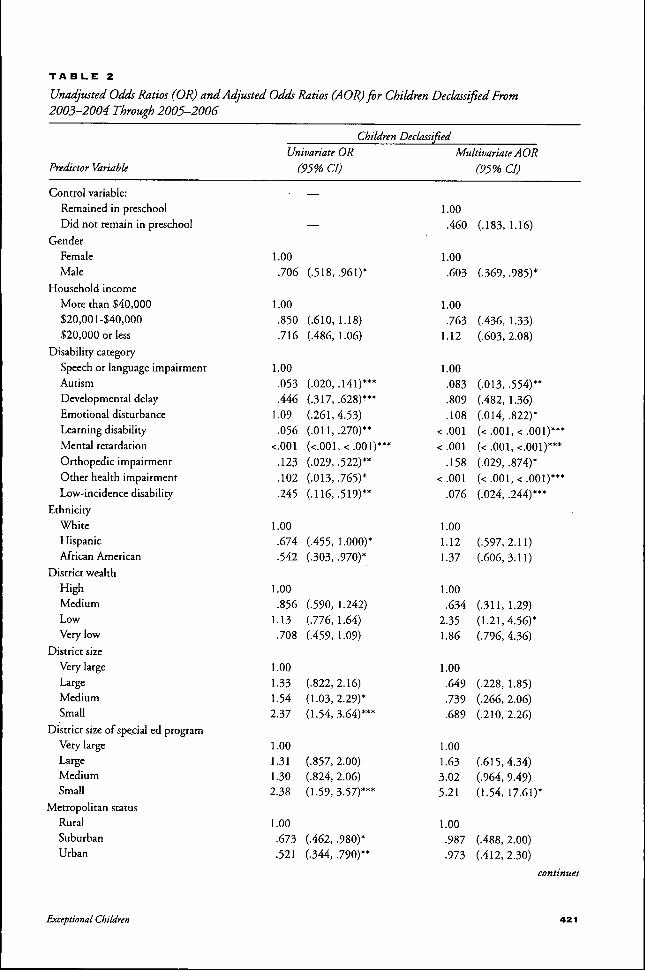
Table 1 presents frequencies for all predictors, andTable 2 presents the univariate odds ratios foreach predictor as it relates to declassification.
Demographic and Household Characteristics.By 2005-2006, 31% of girls and 24% of boyswere declassified; the odds of declassification forgirls were 1,41 times as high as the odds were forboys. Income was not significantly associated withdeclassification, but there was an effect forrace/ethnicity. Children who were White weremore likely than African American or Hispanicchildren to be declassified; 27% of White chil-dren, 20% of African American children, and17% of Hispanic children left special educationby 2005-2006,
Disability Category. Certain disability groupshad a greater percentage of children declassifiedthan others. By 2005-2006, 37% of childrenwith a speech or language impairment and 21%of those with a developmental delay were declassi-fied. Thirty-nine percent of children identified ashaving an emotional disturbance were also declas-sified. Despite the high percentage of children inthe emotional disturbance group who were de-classified, this group represents only 1,1% of thesample and therefore only 1,4% of the total chil-dren declassified by 2005-2006 (see Table 3), In
contrast, children with a speech or language im-pairment constitute 50% of preschoolers with dis-abilities and approximately 70% of allpreschoolers who were declassified. Every disabil-ity category except mental retardation had one ormore children declassified.
District Characteristics. The probability of de-classification was relatively evenly distributedacross districts based on wealth, with high-,medium-, low-, and very low-wealth districts eachdeclassifying between 21% and 30% of children.In contrast to district wealth, both overall districtsize and district preschool special education en-rollment were significantly associated with declas-sification. Approximately 37% of children fromsmall districts and 20% from very large districtswere declassified, and, in fact, total district sizewas a significant predictor of declassification.Likewise, compared to districts with large andvery large preschool special education programs,those with small programs were more likely to de-classify students; the odds of declassification forchildren from districts with small preschool spe-cial education programs was twice that of childrenfrom districts with very large programs. Last, chil-dren from rural areas were significantly morelikely to be declassified than those from suburbanand rural areas (34%, 26%, and 21%, respec-tively). All odds ratios are presented in Table 2,
School/Program Outreach, Parent Involvement,and Parent Satisfaction. Univariate logistic regres-sions showed lower odds of declassification forchildren whose parents reported more frequentprogram/school outreach, in the form of personalnotes, notices, and phone calls. Higher levels ofparent satisfaction were associated with greaterlikelihood of declassification; there was no signifi-cant effect for parent involvement.
Ability and Functioning. Comparisons ofchildren's ability and functioning revealed signifi-cant baseline (2003—2004) differences betweenchildren subsequently declassified by 2005-2006and those who continued to receive servicesunder IDEA; and, across all measures, higherscores (or better functioning) were a significantpredictor of declassification. Children who weredeclassified had standardized scores that were twothirds of a standard deviation higher on the base-line measure of the PPVT and four tenths of astandard deviation higher on the baseline
Exceptional Children
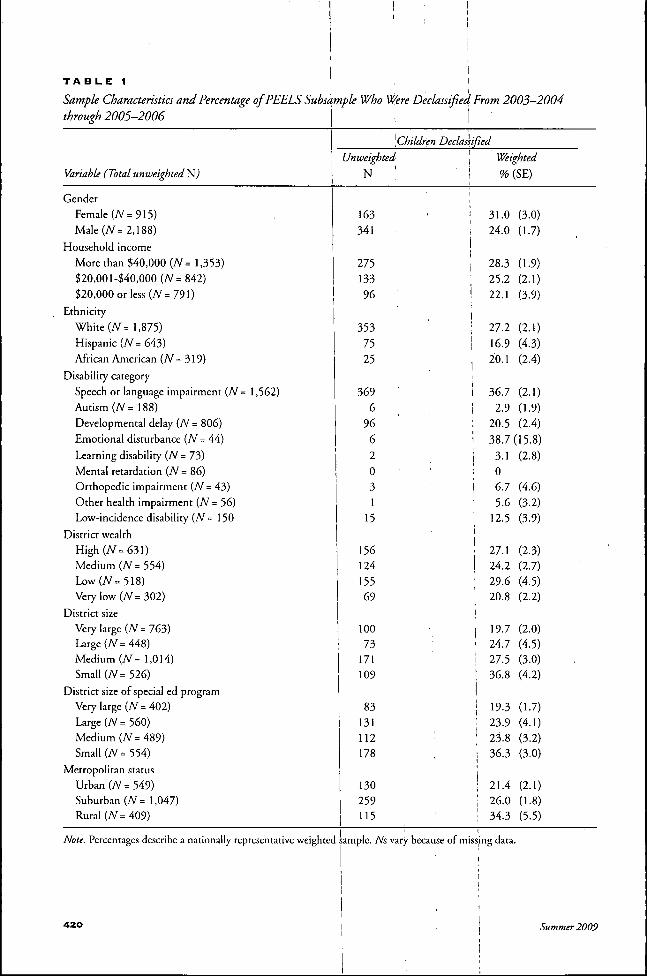
TABLE 1
Sample Characteristics and Percentage of PEELS Suhsample Who Were Declassified Erom 2003-2004
through 2005-2006
Variable (Total unweighted^)
GenderFemale (Ai= 915)Male (Af= 2,188)
Household incomeMore than $40,000 (A = 1,353)$20,001-$40,000(A'=842)$20,000 ot less (A = 791)
EthnicityWhite (Af= 1,875)Hispanic (iV= 643)African American (A = 319)
Disability categorySpeech or language impairment (N = 1,562)Autism (A = 188)Developmental delay (A = 806)Emotional disturbance {N = 44)Learning di.sahility (A' = 73)Mental retardation (A = 86)Orthopedic impairment (jV= 43)Other health impairment (A'= 56)Low-incidence disability (A =150
District wealthHigh (A = 631)Medium (7V= 554)Low(A^=518)Very low (A'=302)
District sizeVery large (A^= 763)Large (A'=448)
Medium (Af= 1,014)
Small (A'=526)
District size of special ed program
Very large (Af= 402)
Large (Af= 560)
Medium (Af= 489)Small (A^= 554)
Metropolitan statusUrhan(A^=549)Suburban (A' = 1,047)Rural (Af= 409)
[Children Declassified
Unweighted ^
N ' ' î
1163 • 1341 '
iI
275 i13396 !
353 ' '7 5 • i
25 i
369
6 ,9662031
15
15612415569
100
73 '171109
83131112 '178
130259115
Weighted
%(SE)
31.0 (3.0)24.0 (1.7)
28.3 (1.9)25.2 (2.1)22.1 (3.9)
27.2 (2.1)16.9 (4.3)20.1 (2.4)
36.7 (2.1)2.9 (1.9)
20.5 (2.4) •
38.7(15.8)3.1 (2.8)06.7 {4.6)5.6 (3.2)
12.5 (3.9)
27.1 (2.3)24.2 (2.7)29.6 (4.5)20.8 (2.2)
1 19.7 (2.0)' 24.7 (4.5)
27.5 (3.0)36.8 (4.2)
119.3 (1.7)
: 23.9 (4.1)¡ 23.8 (3.2)
36.3 (3.0)
j' 21.4 (2.1); 26.0 (1.8)! 34.3 (5.5)
Note. Percentages describe a nationally representative weighted sample. A s vary because of missing data.
42O Summer 2009
TA B LE 2
Unadjusted Odds Ratios (OR) and Adjusted Odds Ratios (AORJfor Children Declassified Erom2003-2004 Through 2005-2006
Predictor VariabU
Control variable:Remained in preschoolDid not remain in preschool
GenderFemaleMale
Household incomeMore than $40,000$20,001-$40,000$20,000 or less
Disability categorySpeech or language impairmentAutismDevelopmental delayEmotional disturbanceLearning disabilityMental retardationOrthopedic impairmentOther health impairmentLow-incidence disability
EthnicityWhiteHispanicAfrican American
District wealthHighMediumLowVery low
District sizeVery largeLargeMediumSmall
District size of special ed programVery largeLargeMediumSmall
Metropolitan statusRuralSuburbanUrban
ChildrenUnivariate OR
(95% CI)
—
1.00.706 (.318, .961)*
1.00.850 (.610,1.18).716 (.486, 1.06)
1.00.053 (.020, .141)***.446 (.317, .628)***
1.09 (.261,4.53).056 (.011, .270)**
<.OO1 (<.001,<.001)***.123 (.029, .522)**.102 (.013, .765)*.245 (.116, .519)**
1.00.674 (.455, 1.000)*.542 (.303, .970)*
1.00.856 (.590, 1.242)
1.13 (.776, 1.64).708 (.459, 1.09)
1.001.33 (.822,2.16)1.54 (1.03,2.29)*2.37 (1.54,3.64)***
1.001.31 (.857,2.00)1.30 (.824,2.06)2.38 (1.59,3.57)***
1.00.673 (.462, .980)*.521 (.344, .790)**
DeclassifiedMultivariate A OR
1.00.460
1.00.603
1.00.763
1.12
1.00.083.809.108
< .001<.OO1
.158<.OO1
.076
1.001.121.37
1.00.634
2.351.86
1.00.649.739.689
1.001.633.025.21
1.00.987.973
(95% CI)
(.183, 1.16)
(.369, .985)*
(.436, 1.33)(.603, 2.08)
(.013, .554)**(.482, 1.36)(.014, .822)*(<.001,<.001)***(<.001,<.001)***(.029, .874)*(<.001,<.001)***(.024, .244)***
(.597,2.11)(.606,3.11)
(.311,1.29)(1.21,4.56)*(.796, 4.36)
(.228, 1.85)(.266, 2.06)(.210, 2.26)
(.615,4.34)(.964, 9.49)(1.54,17.61)*
(.488, 2.00)(.412, 2.30)
continues
Exceptional Children
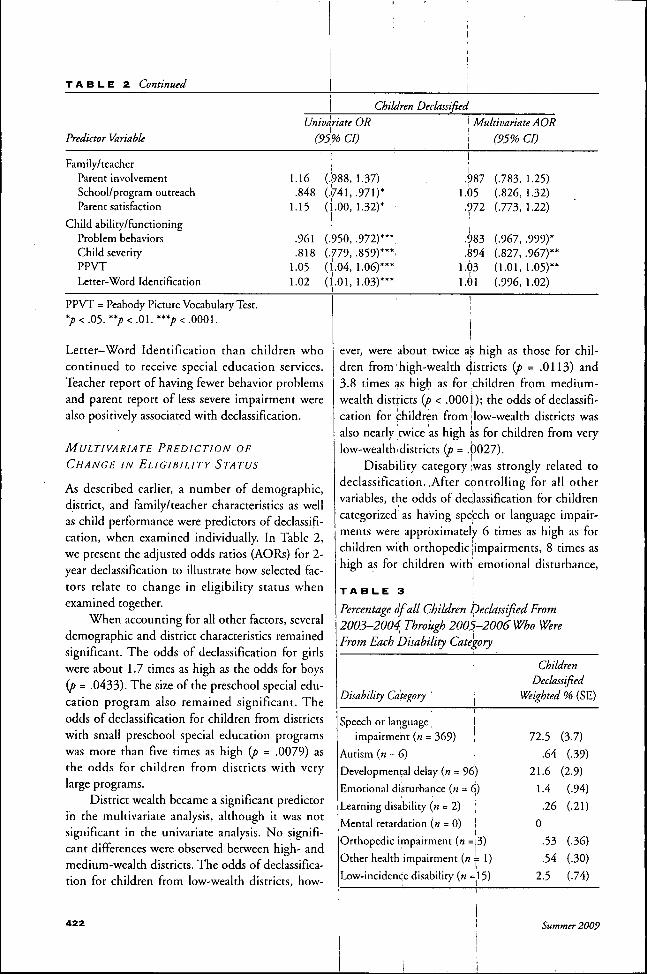
TABLE 2 Continued
Predictor Variable
Family/teacherParent involvementSchool/program outreachParent satisfaction
Child ability/functioningProblem behaviorsChild severityPPVTLetter-Word Identification
Children Declassified
Univariate OR
(
1.16.848
1.15
.961
.8181.051.02
95% CI)
(.988, 1.37)(.¡741, .971)*(i.OO, 1.32)* '
(.950, .972)***,
(.•779, .859)***'(1.04, 1.06)***
(i.Ol, 1.03)***
1 Multivariate AOR
1111
.9871.05.972
.983
.8941.031.01
(95% CI)
(.783,1.25)(.826, 1.32)(.773,1.22)
(.967, .999)*(.827, .967)**(1.01, 1.05)**(.996, 1.02)
PPVT = Peabody Picture Vocabulary Test.*;.<.05. **;><.01. ***/)< .0001.
Letter-Word Identification than children whocontinued to receive special education services.Teacher report of having fewer behavior problemsand parent report of less severe impairment werealso positively associated with declassification.
MULTIVARIATE PREDICTION OF
CHANGE IN ELIGIBILITY STATUS
As described earlier, a number of demographic,district, and family/teacher characteristics as wellas child performance were predictors of declassifi-cation, when examined individually. In Table 2,we present the adjusted odds ratios (AORs) for 2-year declassification to illustrate how selected fac-tors relate to change in eligibility status whenexamined together.
When accounting for all other factors, severaldemographic and district characteristics remainedsignificant. The odds of declassification for girlswere about 1.7 times as high as the odds for boys(p = .0433). The size of the preschool special edu-cation program also remained significant. Theodds of declassification for children from districtswith small preschool special education programswas more than five times as high (j> = .0079) asthe odds for children from districts with verylarge programs.
District wealth became a significant predictorin the multivariate analysis, although it was notsignificant in the univariate analysis. No signifi-cant differences were observed between high- andmedium-wealth districts. The odds of declassifica-tion for children from low-wealth districts, how-
ever, were about, twice as high as those for chil-dren from high-wealth districts (/> = .0113) and3.8 times as high as for ¡children from medium-wealth districts {p < .0001); the odds of declassifi-
i ¡
cation for children from ¡low-wealth districts wasalso nearly twice as high as for children from verylow-wealth I districts (p = .0027).
Disability category ;was strongly related todeclassification.,After controlling for all othervariables, the odds of declassification for childrencategorized as having speech or language impair-ments were approximately 6 times as high as forchildren with orthopedic ¡impairments, 8 times ashigh as for children with emotional disturbance,TA B LE 3
Percentage of all Children Declassified From2003-2004 Through 2005-2006 Who WereFrom Fach Disability Category
Disability CategoryI
Children
Declassified
Weighted % (SE)
Speech or lariguage !impairment (n = 369) ¡ 72.5 (3.7)
Autism (« = 6) i .64 (.39)
Developmental delay (« = 96) 21.6 (2.9)
Emotional disturbance (« = 6) 1.4 (.94)
Learning disability (n = 2) \ .26 (.21)
Mental retardation (« = 0) Î 0
Orthopedic inipairment (« =j3) .53 (.36)
Other health impairment («= 1) .54 (.30)
Low-incidence disability (« =15) 2.5 (.74)
Summer 2009
and more than 12 times as high as for childrenwith autism and low-incidence disabilities. Thenumber of children with learning disabilities andother health impairments was too small to makeinterpretation of the logistic regression reliable.
Of the four variables that reflect children'sability and functioning, three were significantpredictors of declassification for children by2005—2006. The odds of declassification were sig-nificantly higher for children with less severe dis-abilities, and better performance on the PPVTwas also significantly associated with declassifica-tion. The odds of declassification were lower forchildren with more severe behavior problems.
A number of variables that were significantlyassociated with declassification in the univariateanalyses did not reach statistical significance in themultivariate model. These included race/ethnicity,metropolitan status, district size, school/programoutreach, parent satisfaction, and Letter-WordIdentification scores. In addition, household in-come and parent involvement were not significantpredictors of declassification in either the univari-ate or multivariate analyses.
D I S C U S S I O N
This study examined whether exiting special edu-cation—declassification—can be predicted fromfactors that logically reflect children's abilities andfunctioning, given that receipt of services is in-tended for those who need it most. Of determin-ing which children enter special education, Hibeland his colleagues (2006) asked:
What if, independent of the student's abilityto learn, special education placement is af-fected by characteristics such as the child'ssocial class background, race/ethnicity, orgender? What if such placement varies ac-cording to the social context of the school, orof the family within the school? (p. 3)
In this study, one goal was to address the questionraised by Hibel and his colleagues with respect towho leaves special education. Our regression mod-els included factors representing both ability andfunctioning and those such as social class back-ground, race/ethnicity, gender, and district char-acteristics, which we believe should be unrelatedto declassification.
Our results suggest some positive news: chil-dren's problem behaviors, severity of impairment,and cognitive functioning were all significant pre-dictors of declassification and in the expected di-rection. This finding is consistent with pastresearch (e.g., Halgren & Clarizio, 1993; Ys-seldyke & Bielinski, 2002) and suggests that someof the variance in declassification can be ac-counted for by children's performance on measuresclosely aligned with special edtication eligibility.
In addition, the troubling effect of some fac-tors, such as metropolitan status and race/eth-nicity, disappeared once other variables werecontrolled. This finding is encouraging for thoselooking for greater objectivity in the special educa-tion eligibility process, given the long history ofoverrepresentation of African American childrenin certain disability categories. The finding may beconsidered in conjunction with recent data fromHibel and colleagues (2006) that suggest overrep-resentation of African American children haswaned. One explanation for a shift—if such a shiftis indeed occurring—may be a greater emphasison identifying and rectifying disproportionality;starting with IDEA 1997, states have been re-quired to collect data to determine if significantdisproportionality on the basis of race is occtirring.
The less encouraging results, however, arethat some factors unrelated to a child's individualneeds continiied to show an effect, even whenmore proximal measures of children's abilitieswere included. Most notably, the odds of declassi-fication were greater for children from low-wealthdistricts than from high-wealth districts and thosedistricts with smaller preschool special educationprograms compared to larger ones. One explana-tion for this finding could be that low-wealth dis-tricts and those serving fewer children in specialeducation are more sensitive to the economics ofspecial education and therefore mtist be morecareful in selecting which children receive ser-vices. Districts with fewer special education stu-dents and lower wealth may have limited serviceoptions; an administrator may exit a child withlesser needs to serve a child with greater needs.Or, if a child needs a service that is unavailable,an administrator may choose to formally exit achild from special education rather than risk non-compliance, although both these actions areclearly inconsistent with the mandate of IDEA.
Exceptional Children
At least historically, this may have been the case;Thurlow, Lehr, and Ysseldyke (1987) found that24% of surveyed preschool programs based exitdecisions on staffing availability,
A more positive interpretation is that districtswith fewer young children in special educationmay have greater familiarity with each individualchild and a more flexible infrastructure. In this sit-uation, an administrator could make a well-planned choice to provide support for children atthe niargins of eligibility by working more infor-mally with teachers rather than through an IEP,Whatever the reason for this finding, the associa-tion between district factors and declassificationdeserves further examination from a policy equityperspective and is also important in the context ofboth accountability and program improvement.However, it should be noted that the relationshipbetween district wealth and declassification wasnot a wholly linear one; children from low-wealthdistricts were also more likely to be declassifiedthan children frorn very low-wealth districts. Wedo riot have a straightforward explanation for thisfinding, but one possibility is that the smallernurnber of students from very low-wealth districts(approximately half the number as from lowwealth, medium, and high wealth) may have con-tributed to unreliability of the estimate in this case.
Our study found that, once other factors werecontrolled, school outreach, parent involvement,and parent satisfaction did not predict declassifica-tion. It is possible that our parent measures wereriot sensitive enough to detect the infiuence par-ents may have on this process or that, despite itsintuitive appeal, these are not powerful factors indeclassification once more proximal indicators ofchild functioning are considered.
We cannot make any definitive staternentsabout whether a 16% anntial declassification rateis too high, too low, or jtist right. Likewise, wecannot say vyhether declassification was appropri-ate for any individual child in the sample. Somechildren may leave special education because it istheir parent's choice to rernove them, whether rec-ommended by the school or not. In a recent re-port of declassification among school-agechildren, 5% of students left special education be-cause either the parent did not want their child tobe in the program or the child did not want to bein the program (SRI International, 2005),
There is reason to believe that a subgroup ofchildren declassified from special education mayneed services at a later time, Carlson and Parshall(1996) found 11% of children who exited specialeducation in Michigan had teachers yho felt thestudents still needed services, and ultirnately, 4%of the students who left special education werefound to be eligible again within 3 years. Simi-larly, Ysseldyke and Bielinski (2002) found that
¡ 16% of children who moved to general educationj after fourth grade returned to special educatioriafter fifth grade and noted that more than 6,100students in their sample changed special educa-
I tion status at least twice over a 5-year period. OfI course, it is possible that it was appropriate toboth leave and return for some of these children.Therefore, although our data shovy that childrenwho are declassified, as a group, were performingbetter on standardized measures and teacher rat-ing scales than children vvho remained in specialeducation, it may take a number of years to deter-mine whether they continue to perform wellwithout special education support.
Some children may leave special
education because it is their parent's
choice to remove them, whether
! recommended by the school or not.
This study had several limitations. First,teacher report formed the! primary source of dataIon classification status. Clearly, independent con-firmation through school records would have beenpreferable, but, because of the large-scale nature ofthe study, such data collection was not conducted.Second, although PEELS is a nationally represen-tative sample, and the data presented here can begeneralized to all preschoolers receiving special ed-ucation services in the United States inÍ2003-2004, the conclusions drawn may not applyto older children declassified from special educa-tion, because preschoolers, as a group, have less se-vere impairments than their school-age peers;approximately 75% of preschoolers in special edu-cation were categorized as either having a speechor language impairment or a developmental delay,' In sum, this study provided an examinationof declassification over a 2-year period and found
Summer 2009
the percetitage of preschoolers leaving special edu-
cation each year to be in the range of previous esti-
mates. In contrast to past research, our i-esults
demonstrated relationships between deciassifica-
tion and a number of independent variables, in-
cluding child gender, the number of preschoolers
with disabilities served vvithin a district; and dis-
trict vi^ealth. If these factors do indeed influence
deciassification decisions, then children may lose
vital support and be placed at risk for school fail-
ure (Thurlow et al., 1988). Districts should be
aware of this potential when reevaluating children.
The controlled data collection and use of multiple
data sources across time in thé PEELS sample of-
fers some of the strongest evidence to date of the
complexity of deciassification decisions, and sug-
gests a need for more explicit criteria to assist ad-
ministrators in the process. If such criteria can be
developed, they will provide a degree of standard-
ization that ensures the appropriai:e children are
receiving services. Such criteria can also ensure
that the process of deciassification remains an in-
dividualized one, as intended under the regula-
tions of IDEA.
R E F E R E N C E S
Bailey, D. B., Simeonsson, R. J., Buysse, V., & Smith,
T. (1993). Reliability of an index of child characteris-
tics. Developmental Medicine and Child Neurology, 35,
806-815.
Carlson, E. (1997). Outcomes for students declassified
from special education. Dissertation Abstracts Interna-
tional, 58, 4231. (UMI No. 9815240)
Carlson, E., & Parshall, L. (1996). Academic, social,
and behavioral adjustrnent for students declassified from
special education. Exceptional Children, 63, 89-1Ö0.
Cromwell, R. L., Blashfield, R. K., & Strauss, J. S.
(1975). Criteria for classification systems. In N. Hobbs
(Ed.), issues in the classification of children (pp. 4—25).
San Francisco: Jossey-Bass.
Daley, T. C , Simeonsson, R. J., ÔC Carlson, E. (2008).
Constructing a measure of severity of disability in a na-
tional sample of preschoolers with disabilities. Disabil-
ity and Rehabilitation. 1-15.
Donovan, M. S., & Cross, C. T. (Eds.). (2002). Minor-
ity children in special andgified education. Washington,
DC: National Academies Press.
Dunn, L. M., & Dunn, L. M. (1997). Peabody Picture
Vocabulary Test (3rd ed.). Circle Pines, MN: American
Guidance Services.
Edgar,E., Heggelund, M., & Fischei-, M. (1988). A
longitudinal study of graduates of special education
preschoois: Educational placement after preschool. Top-
ics in Early Childhood Special Education, 8, 61—74.
Edgar, E., McNulty, B., Caetz, J., & Maddox, M.
(1984). Educational placement of graduates of
preschool programs for handicapped children. Topics in
Early Childhood Special Education, 4, 19-29.
Fihn, C. E., Rotherham, A. J., & Hokanson, C. R.
(Eds.). (2000). Rethinking special education for a new
century. Washington DC: Thomas B. Fordham Foun-
dation and the Progressive Policy Institute.
Halgren, D. P., ÔC Clarizio, H. E (1993). Categorical
and programming changes in special education services.
Exceptional Children, 59, 547-555.
Hallahan, D. P, Keller, C. E., Martinez, E. A., Byrd, E.
S., Celman, J. A., & Fan, X. (2007). How variable are
interstate prevalence rates of learning disabilities and
other special education categories? A longitudinal com-
parison. Exceptional Children, 73, 136—146.
Harrison, J., & Oakland, T (2003). Adaptive Behavior
Assessment System (2nd ed.). San Antonio, TX: The Psy-
chological Corporation.
Heller, K. A., Hoitzman, W. H., & Messick, S. (Eds.).
(1982). Placing children in special education: A strategy
for equity. Washington, DC: National Academies Press.
Hibel, J., Farkas, C , & Morgan, P. (2Ö06). Who is
placed into special education? (Working Paper No. 06-
05). University Park: Pennsylvania State University
Population Institute.
Hobbs, N. (Ed.). (1975). Issues in the classification of
children. San Francisco: Jbssey-Bass.
Individuals With Disabilities Education Act Amend-
ments of 2004 (IDEA). U.S.C. §§1400 etseq (2004).
Innocenti, M. S. (2005). Classification status of children
once enrolled in early intervention programs. Report sub-
mitted to the Utah State Office of Education, Salt Lake
City.
MAGI Educational Services, Inc. (2003). Program
quality and its effect on the placement of preschool educa-
tion children in school-age programs. Special Education
Quality Indicator Study. The University of the State of
New York. Retrieved March 9, 2Ó06, from http://www.
vesid.nysed.gov/specialed/publications/preschool/
reseatchbul/b ulletin.pdf
Markovvitz, J., & Bridges-Cline, F. (Noveinber, 1991).
A six-year study of children enrolled in special education
Exceptional Children
under the age of five years. Rockville, MD: MontgomeryCounty Public Schools.
Markowitz, J., Carlson, E., Frey, W., Riley, J., Shim-shak. A., Heinzen, H., et al. (2006). Preschoolers withdisabilities: Characteristics, services and results. Wave 1
overview report from the Pre-Elementary Education Lon-
gitudinal Study (PEELS). Retrieved December 1, 2007,from the PEELS Web site: www.peels.org
Masters, G. N. (1982). A Rasch model for partial creditscoring. Psychometrika, 47{2), 149-174.
McGrew, K. S., & Woodcock, R. W. (2001). Technicalmanual. Woodcock-Johnson IlL Itasca, IL: Riverside.
Metrell, K. W. (2002). Preschool and kindergarten be-havior scales (2nd ed.). Austin, TX: Pro-ed.
Molloy, H., & Vasil, L. (2002). The social constructionof Asperger syndrome: The pathologising of difference?Disability & Society, 17, 659-669.
Singer, J. D., Palfrey, J. S., Buder, J. A, & Walker, D.K. (1989). Variation in special education classificationacross school districts: How does where you live affectwhat you are labeled? American Educational ResearchJournal, 26, 2G\-29,\.
Skiba, R. J., Poloni-Staudinger, L., Gallini, S., Sim-mons, A. B., & Feggins-Azziz, L. R. (2006). Disparateaccess: The disproportionality of African American stu-dehts with disabilities across educational environments.Exceptional Children, 72, 411-424.
Sleeter, C. E. (1986). Learning disabilities: The socialconstruction of a special education category. Excep-tional Children, 53, 46-54.
SRI International. (2005). Declassification—Studentswho leave special education. A Special Topic Repoi-t fromthe Special Education Elementary Longitudinal Study(SRI Project No. PI0656). Menlo Park, CA: Author.
Stile, S. W, LeCrone, J., & Ames, M. (1991). Post-preschool placement of young students with developmental
disabilities exiting public special education preschool pro-
grams. Final Report. (Report No. 1 EC 300500). SantaFe: New Mexico Department of Education, Special Ed-ucation Unit. (ERIC Document Reproduction ServiceNo. ED 334754)
Thurlow, M. L., Lehr, C. A., & Ysseldyke, J. E. (1987).Exit criteria in early childhood programs for handi-capped children. Journal of the Division for Early Child-
hood, 11, 118-123.
Thurlow, M. L., Ysseldyke, J. E., & Weiss, J. A. (1988).Early childhood special education exit decisions: Howare they made? How are they evaluated? Journal of theDivision for Early Childhood, 12, 253-262.
Walker, D., Singer, J., Palfrey, J., Orza, M., Wenger,M., & Buder, J. (1988). Who leaves and who stays in
426
special education: A 2-year follow-up study. ExceptionalChildren, 54, 393-402. ,
Westat. (2002). WesVar Velsion 4.2. Rockville, MD:Author. i
Wong, M. M. (1997). Patterns of special educationplacement for preschool and school-age children. Dis-sertation Abstracts International, 58, 4616. (UMI No.9819362) !
Woodcock, R. W, McGrew, K. S., & Mather, N.(2001). Woodcock-Johnson III Tests of Achievement.Itasca, IL: Riverside. j
Wright, B. D., & Linacre, J. M. (1994). Reasonablemean-square frt values. Rasch,Measurement Transactions,
8, 370. ' ,
Ysseldyke, J., S¿ Bielinski, J. (2002). Effect of differentmethods of reporting and reclassification on trends intest scores for students with disabilities. ExceptionalChildren, 68, 189-200. j
lYsseldyke, J. E. (2001). Reflections on á research ca-reer: Generalizations from 25 years of research on as-I . 'sessment and instructional decision making.Exceptional Children, 67, 295-!-309.
Ysseldyke, J. E., Thurlow, M.|, Graden, J., Wesson, C ,Algozzine, B., & Deno, S. ¡(1983). Generalizationsfrom five years of research ori assessment and decisionrnaking: The University of Minnesota Institute. Excep-tional Education Quarterly, 4, 75-93.
iVBOUT THE A U T H | O R S
TAMARA c. DALEY, Senior Study Director,Westat, Durham, North^ Carolina. ELAINECARLSON (CEC MD Federation), Senior StudyDirector, Westat, Rockville,; Maryland.
PEELS is funded by the U'S. Department of Ed-tication. Institute of Education Sciences, undercohtract number ED-04-CÖ-0059.
The authors thank Sam Odom, Tom Fiore, CloriaHarbin, and four anonytnotis reviewers for helpfulcomments on an earlier draft of this article.
Address all correspondence about this article toTamara Daley, Westat, 1009 Slater Road, Suite110, Durham, NC 277Ö3 ¡[e-mail: [email protected]). . |
Manuscript received May 2007; accepted Febru-ary 2008. i
Summer 2009

Recommended