JOURNAL OF EXPERIMENTAL CHILD PSYCHOLOGY 64, 67–78 (1997)ARTICLE NO. CH962337
Processing Time, Imagery, and Spatial Memory
ROBERT KAIL
Purdue University
Measures of cognitive processing time, imagery skill, and spatial memory spanwere administered to 128 8- to 20-year-olds. Age correlated positively with spatialmemory span and accuracy on the imagery tasks but negatively with times on thecognitive processing and imagery tasks. Results of path analyses and structural-equa-tion modeling were consistent with a causal model in which age-related change inspeed of processing is associated with more effective imagery. In turn, imagery isassociated with spatial memory span. Age was also associated with imagery and spatialspan, indicating that other age-related variables need to be incorporated into the causalmodel. q 1997 Academic Press
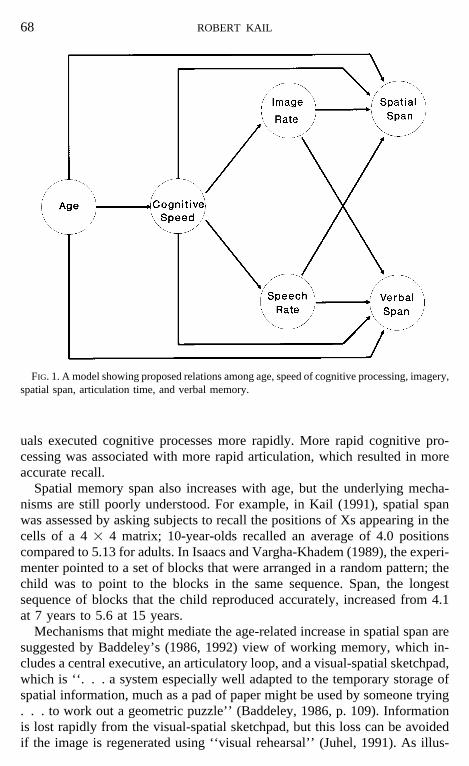
Performance on memory span tasks that are verbally based, such as digitspan or letter span, increases steadily during childhood and adolescence. Thischange occurs, in part, because older children and adolescents can articulatedigits and letters more rapidly than young children. Rapid articulation meansthat information is less likely to be lost from working memory prior to recall(Hitch, Halliday, & Littler, 1989). Age-related change in articulation rate, inturn, reflects developmental change in speed of processing information. Thatis, as shown in Fig. 1, age-related increases in processing speed permit morerapid articulation, which, in turn, permit more accurate retention.
Support for this general view comes from a study by Kail and Park (1994)in which 7- to 14-year-olds and adults were tested on multiple measures ofmemory span, rate of articulation, and cognitive processing time. Age corre-lated positively with a composite measure of memory but negatively withcomposite measures of articulation and processing times. Path analyses indi-cated the following links between the measures: With increasing age, individ-
The research described in this article was supported by grants from the National Institute ofChild Health and Human Development (HD-19947) and the National Science Foundation (SBR-9413019). I thank Leah Burgy and Laura Curry for testing subjects and two reviewers for theirhelpful comments on a previous draft of this manuscript. Address correspondence and reprintrequests to Robert Kail, the Department of Psychological Sciences, Purdue University, WestLafayette, IN 47907. E-mail: [email protected].
0022-0965/97 $25.00Copyright q 1997 by Academic Press
All rights of reproduction in any form reserved.
67
AID JECP 2337 / ad06h$$121 12-11-96 22:51:16 jecpa AP: JECP
68 ROBERT KAIL
FIG. 1. A model showing proposed relations among age, speed of cognitive processing, imagery,spatial span, articulation time, and verbal memory.
uals executed cognitive processes more rapidly. More rapid cognitive pro-cessing was associated with more rapid articulation, which resulted in moreaccurate recall.
Spatial memory span also increases with age, but the underlying mecha-nisms are still poorly understood. For example, in Kail (1991), spatial spanwas assessed by asking subjects to recall the positions of Xs appearing in thecells of a 4 1 4 matrix; 10-year-olds recalled an average of 4.0 positionscompared to 5.13 for adults. In Isaacs and Vargha-Khadem (1989), the experi-menter pointed to a set of blocks that were arranged in a random pattern; thechild was to point to the blocks in the same sequence. Span, the longestsequence of blocks that the child reproduced accurately, increased from 4.1at 7 years to 5.6 at 15 years.
Mechanisms that might mediate the age-related increase in spatial span aresuggested by Baddeley’s (1986, 1992) view of working memory, which in-cludes a central executive, an articulatory loop, and a visual-spatial sketchpad,which is ‘‘. . . a system especially well adapted to the temporary storage ofspatial information, much as a pad of paper might be used by someone trying. . . to work out a geometric puzzle’’ (Baddeley, 1986, p. 109). Informationis lost rapidly from the visual-spatial sketchpad, but this loss can be avoidedif the image is regenerated using ‘‘visual rehearsal’’ (Juhel, 1991). As illus-
AID JECP 2337 / ad06h$$122 12-11-96 22:51:16 jecpa AP: JECP
69COGNITIVE PROCESSING TIME
trated in Fig. 1, just as the facility with which information is articulatedpredicts performance on verbally oriented tasks such as digit span, the easewith which images are regenerated in the visual–spatial sketchpad shouldpredict visual-spatial span.
Other links are possible. Speed of image regeneration might be related toverbal span, and articulation might be related to spatial span, because subjectsmay recode spatial stimuli verbally (Brandimonte, Hitch, & Bishop, 1992).Speeds of other processes might influence verbal and spatial spans. And, ifspeeds of global and specific processes cannot account for all age-relatedchange in verbal and spatial span, then these constructs would be linkeddirectly to age.
The aim of the present work was to provide a preliminary evaluation ofthe spatial elements of the framework in Fig. 1, within a path-analytic ap-proach similar to that used in the previous studies of processing time, articula-tion rate, and memory (e.g., Kail & Park, 1994). The study included measuresof cognitive processing time, imagery skill, and spatial span. The primarygoal was to determine the extent to which age-related change in spatial spanwas mediated by processing speed and imagery skill.
METHOD
Subjects
The sample included 112 8- to 16-year-olds, 16 at each of the followingages: 8, 9, 10, 11, 12, 14, and 16 years. Their mean ages were 8.18, 9.26,10.25, 11.22, 12.28, 14.35, and 16.25 years, respectively. (Age was sampledmore densely between 8 and 12 years because processing speed changes mostrapidly in these years.) These subjects were recruited via advertisements andpaid $5. Most lived in or near a small city in the Midwestern United States.Also participating were 16 undergraduates at Purdue University (mean ageÅ 20.23 years) who participated to satisfy a course requirement. Each groupcontained 8 males and 8 females except at age 8 (11 boys, 5 girls).
Tasks
There were seven measures: three of processing speed, two of imageryskill, and two of spatial span.
Processing speed. Speed was assessed with variants of existing paper-and-pencil tests. The measures—Coding, Number Comparisons, and IdenticalPictures—were selected because each is sensitive to age-related change andeach loads heavily on speed factors in correlational work (Cyphers, Fulker,Plomin, & DeFries, 1989; Laux & Lane, 1985). On the Coding task, fivegeometric figures appeared at the top of the page, each with distinctive linesin the interior (e.g., single vertical line inside a star). The remainder of thepage included 50 empty geometric figures; the subject’s task was to draw thecorrect lines. Subjects solved the first five problems for practice, then they
AID JECP 2337 / ad06h$$122 12-11-96 22:51:16 jecpa AP: JECP
70 ROBERT KAIL
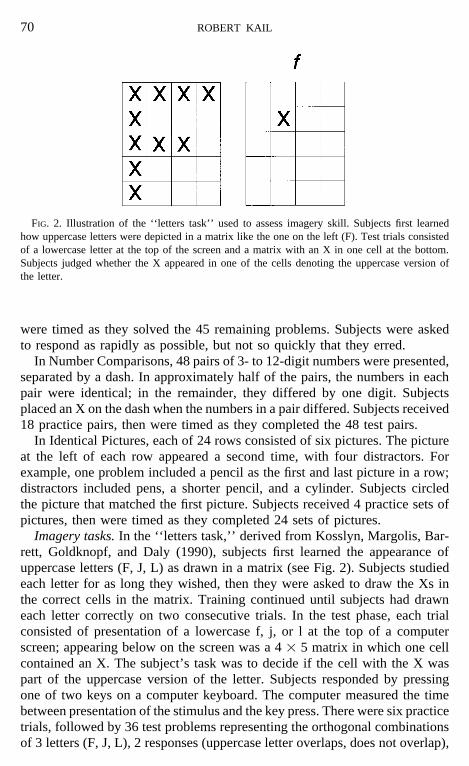
FIG. 2. Illustration of the ‘‘letters task’’ used to assess imagery skill. Subjects first learnedhow uppercase letters were depicted in a matrix like the one on the left (F). Test trials consistedof a lowercase letter at the top of the screen and a matrix with an X in one cell at the bottom.Subjects judged whether the X appeared in one of the cells denoting the uppercase version ofthe letter.
were timed as they solved the 45 remaining problems. Subjects were askedto respond as rapidly as possible, but not so quickly that they erred.
In Number Comparisons, 48 pairs of 3- to 12-digit numbers were presented,separated by a dash. In approximately half of the pairs, the numbers in eachpair were identical; in the remainder, they differed by one digit. Subjectsplaced an X on the dash when the numbers in a pair differed. Subjects received18 practice pairs, then were timed as they completed the 48 test pairs.
In Identical Pictures, each of 24 rows consisted of six pictures. The pictureat the left of each row appeared a second time, with four distractors. Forexample, one problem included a pencil as the first and last picture in a row;distractors included pens, a shorter pencil, and a cylinder. Subjects circledthe picture that matched the first picture. Subjects received 4 practice sets ofpictures, then were timed as they completed 24 sets of pictures.
Imagery tasks. In the ‘‘letters task,’’ derived from Kosslyn, Margolis, Bar-rett, Goldknopf, and Daly (1990), subjects first learned the appearance ofuppercase letters (F, J, L) as drawn in a matrix (see Fig. 2). Subjects studiedeach letter for as long they wished, then they were asked to draw the Xs inthe correct cells in the matrix. Training continued until subjects had drawneach letter correctly on two consecutive trials. In the test phase, each trialconsisted of presentation of a lowercase f, j, or l at the top of a computerscreen; appearing below on the screen was a 4 1 5 matrix in which one cellcontained an X. The subject’s task was to decide if the cell with the X waspart of the uppercase version of the letter. Subjects responded by pressingone of two keys on a computer keyboard. The computer measured the timebetween presentation of the stimulus and the key press. There were six practicetrials, followed by 36 test problems representing the orthogonal combinationsof 3 letters (F, J, L), 2 responses (uppercase letter overlaps, does not overlap),
AID JECP 2337 / ad06h$$122 12-11-96 22:51:16 jecpa AP: JECP
71COGNITIVE PROCESSING TIME
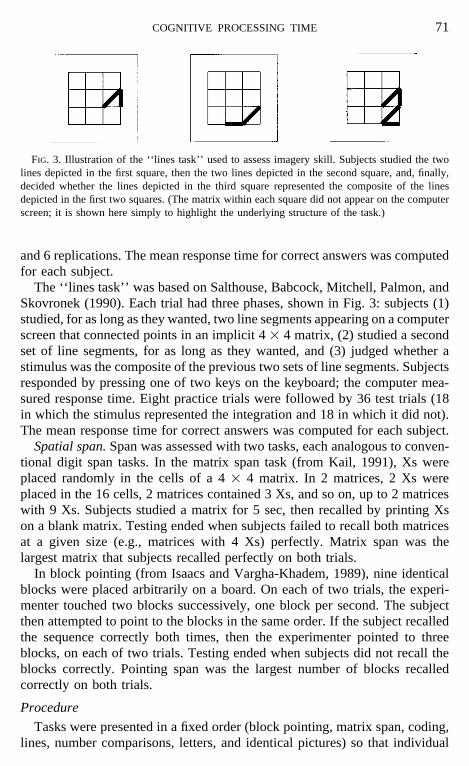
FIG. 3. Illustration of the ‘‘lines task’’ used to assess imagery skill. Subjects studied the twolines depicted in the first square, then the two lines depicted in the second square, and, finally,decided whether the lines depicted in the third square represented the composite of the linesdepicted in the first two squares. (The matrix within each square did not appear on the computerscreen; it is shown here simply to highlight the underlying structure of the task.)
and 6 replications. The mean response time for correct answers was computedfor each subject.
The ‘‘lines task’’ was based on Salthouse, Babcock, Mitchell, Palmon, andSkovronek (1990). Each trial had three phases, shown in Fig. 3: subjects (1)studied, for as long as they wanted, two line segments appearing on a computerscreen that connected points in an implicit 4 1 4 matrix, (2) studied a secondset of line segments, for as long as they wanted, and (3) judged whether astimulus was the composite of the previous two sets of line segments. Subjectsresponded by pressing one of two keys on the keyboard; the computer mea-sured response time. Eight practice trials were followed by 36 test trials (18in which the stimulus represented the integration and 18 in which it did not).The mean response time for correct answers was computed for each subject.
Spatial span. Span was assessed with two tasks, each analogous to conven-tional digit span tasks. In the matrix span task (from Kail, 1991), Xs wereplaced randomly in the cells of a 4 1 4 matrix. In 2 matrices, 2 Xs wereplaced in the 16 cells, 2 matrices contained 3 Xs, and so on, up to 2 matriceswith 9 Xs. Subjects studied a matrix for 5 sec, then recalled by printing Xson a blank matrix. Testing ended when subjects failed to recall both matricesat a given size (e.g., matrices with 4 Xs) perfectly. Matrix span was thelargest matrix that subjects recalled perfectly on both trials.
In block pointing (from Isaacs and Vargha-Khadem, 1989), nine identicalblocks were placed arbitrarily on a board. On each of two trials, the experi-menter touched two blocks successively, one block per second. The subjectthen attempted to point to the blocks in the same order. If the subject recalledthe sequence correctly both times, then the experimenter pointed to threeblocks, on each of two trials. Testing ended when subjects did not recall theblocks correctly. Pointing span was the largest number of blocks recalledcorrectly on both trials.
Procedure
Tasks were presented in a fixed order (block pointing, matrix span, coding,lines, number comparisons, letters, and identical pictures) so that individual
AID JECP 2337 / ad06h$$122 12-11-96 22:51:16 jecpa AP: JECP
72 ROBERT KAIL
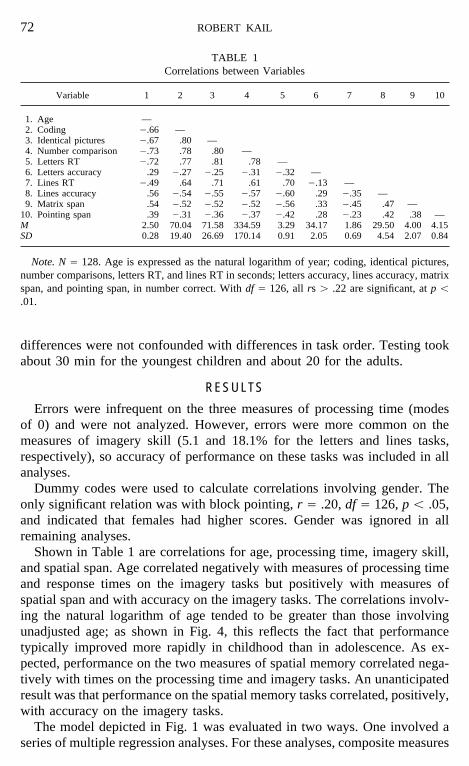
TABLE 1Correlations between Variables
Variable 1 2 3 4 5 6 7 8 9 10
1. Age —2. Coding 0.66 —3. Identical pictures 0.67 .80 —4. Number comparison 0.73 .78 .80 —5. Letters RT 0.72 .77 .81 .78 —6. Letters accuracy .29 0.27 0.25 0.31 0.32 —7. Lines RT 0.49 .64 .71 .61 .70 0.13 —8. Lines accuracy .56 0.54 0.55 0.57 0.60 .29 0.35 —9. Matrix span .54 0.52 0.52 0.52 0.56 .33 0.45 .47 —
10. Pointing span .39 0.31 0.36 0.37 0.42 .28 0.23 .42 .38 —M 2.50 70.04 71.58 334.59 3.29 34.17 1.86 29.50 4.00 4.15SD 0.28 19.40 26.69 170.14 0.91 2.05 0.69 4.54 2.07 0.84
Note. N Å 128. Age is expressed as the natural logarithm of year; coding, identical pictures,number comparisons, letters RT, and lines RT in seconds; letters accuracy, lines accuracy, matrixspan, and pointing span, in number correct. With df Å 126, all rs ú .22 are significant, at p õ.01.
differences were not confounded with differences in task order. Testing tookabout 30 min for the youngest children and about 20 for the adults.
RESULTS
Errors were infrequent on the three measures of processing time (modesof 0) and were not analyzed. However, errors were more common on themeasures of imagery skill (5.1 and 18.1% for the letters and lines tasks,respectively), so accuracy of performance on these tasks was included in allanalyses.
Dummy codes were used to calculate correlations involving gender. Theonly significant relation was with block pointing, r Å .20, df Å 126, p õ .05,and indicated that females had higher scores. Gender was ignored in allremaining analyses.
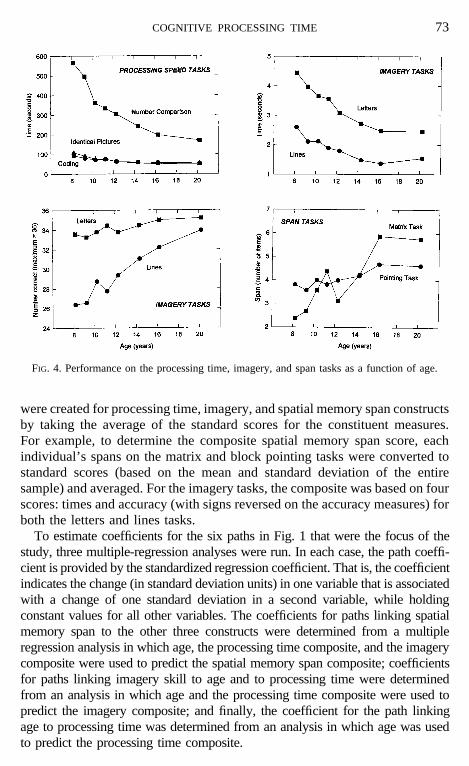
Shown in Table 1 are correlations for age, processing time, imagery skill,and spatial span. Age correlated negatively with measures of processing timeand response times on the imagery tasks but positively with measures ofspatial span and with accuracy on the imagery tasks. The correlations involv-ing the natural logarithm of age tended to be greater than those involvingunadjusted age; as shown in Fig. 4, this reflects the fact that performancetypically improved more rapidly in childhood than in adolescence. As ex-pected, performance on the two measures of spatial memory correlated nega-tively with times on the processing time and imagery tasks. An unanticipatedresult was that performance on the spatial memory tasks correlated, positively,with accuracy on the imagery tasks.
The model depicted in Fig. 1 was evaluated in two ways. One involved aseries of multiple regression analyses. For these analyses, composite measures
AID JECP 2337 / ad06h$$122 12-11-96 22:51:16 jecpa AP: JECP
73COGNITIVE PROCESSING TIME
FIG. 4. Performance on the processing time, imagery, and span tasks as a function of age.
were created for processing time, imagery, and spatial memory span constructsby taking the average of the standard scores for the constituent measures.For example, to determine the composite spatial memory span score, eachindividual’s spans on the matrix and block pointing tasks were converted tostandard scores (based on the mean and standard deviation of the entiresample) and averaged. For the imagery tasks, the composite was based on fourscores: times and accuracy (with signs reversed on the accuracy measures) forboth the letters and lines tasks.
To estimate coefficients for the six paths in Fig. 1 that were the focus of thestudy, three multiple-regression analyses were run. In each case, the path coeffi-cient is provided by the standardized regression coefficient. That is, the coefficientindicates the change (in standard deviation units) in one variable that is associatedwith a change of one standard deviation in a second variable, while holdingconstant values for all other variables. The coefficients for paths linking spatialmemory span to the other three constructs were determined from a multipleregression analysis in which age, the processing time composite, and the imagerycomposite were used to predict the spatial memory span composite; coefficientsfor paths linking imagery skill to age and to processing time were determinedfrom an analysis in which age and the processing time composite were used topredict the imagery composite; and finally, the coefficient for the path linkingage to processing time was determined from an analysis in which age was usedto predict the processing time composite.
AID JECP 2337 / ad06h$$122 12-11-96 22:51:16 jecpa AP: JECP
74 ROBERT KAIL
TABLE 2Summary of Multiple Regression Analyses
Independent variable(s) Dependent variable R2
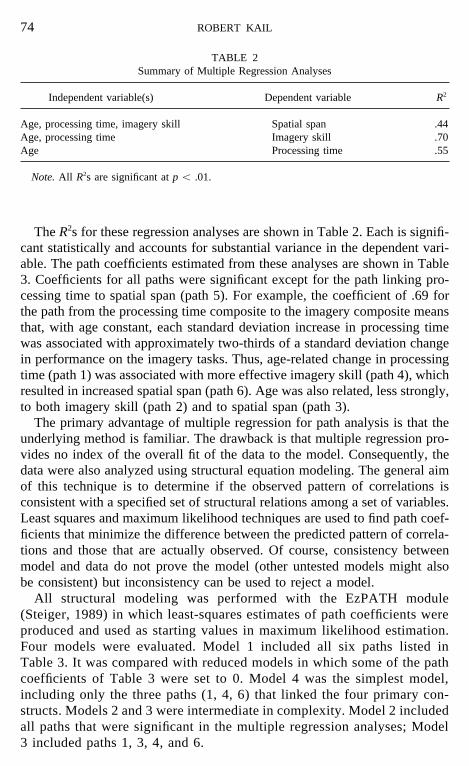
Age, processing time, imagery skill Spatial span .44Age, processing time Imagery skill .70Age Processing time .55
Note. All R2s are significant at p õ .01.
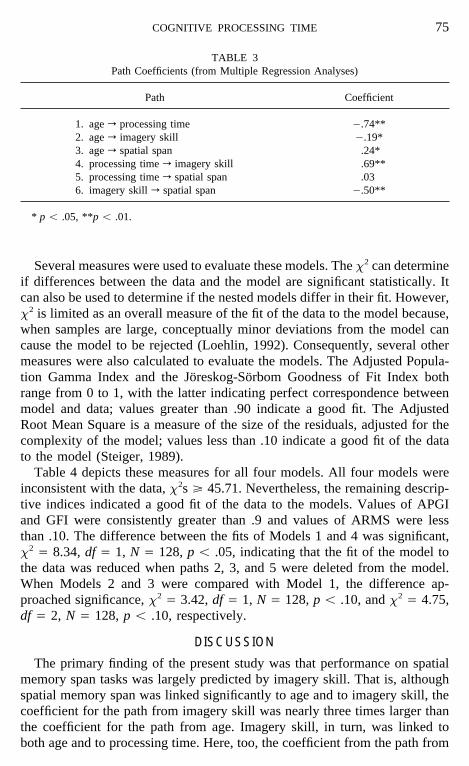
The R2s for these regression analyses are shown in Table 2. Each is signifi-cant statistically and accounts for substantial variance in the dependent vari-able. The path coefficients estimated from these analyses are shown in Table3. Coefficients for all paths were significant except for the path linking pro-cessing time to spatial span (path 5). For example, the coefficient of .69 forthe path from the processing time composite to the imagery composite meansthat, with age constant, each standard deviation increase in processing timewas associated with approximately two-thirds of a standard deviation changein performance on the imagery tasks. Thus, age-related change in processingtime (path 1) was associated with more effective imagery skill (path 4), whichresulted in increased spatial span (path 6). Age was also related, less strongly,to both imagery skill (path 2) and to spatial span (path 3).
The primary advantage of multiple regression for path analysis is that theunderlying method is familiar. The drawback is that multiple regression pro-vides no index of the overall fit of the data to the model. Consequently, thedata were also analyzed using structural equation modeling. The general aimof this technique is to determine if the observed pattern of correlations isconsistent with a specified set of structural relations among a set of variables.Least squares and maximum likelihood techniques are used to find path coef-ficients that minimize the difference between the predicted pattern of correla-tions and those that are actually observed. Of course, consistency betweenmodel and data do not prove the model (other untested models might alsobe consistent) but inconsistency can be used to reject a model.
All structural modeling was performed with the EzPATH module(Steiger, 1989) in which least-squares estimates of path coefficients wereproduced and used as starting values in maximum likelihood estimation.Four models were evaluated. Model 1 included all six paths listed inTable 3. It was compared with reduced models in which some of the pathcoefficients of Table 3 were set to 0. Model 4 was the simplest model,including only the three paths (1, 4, 6) that linked the four primary con-structs. Models 2 and 3 were intermediate in complexity. Model 2 includedall paths that were significant in the multiple regression analyses; Model3 included paths 1, 3, 4, and 6.
AID JECP 2337 / ad06h$$122 12-11-96 22:51:16 jecpa AP: JECP
75COGNITIVE PROCESSING TIME
TABLE 3Path Coefficients (from Multiple Regression Analyses)
Path Coefficient
1. age r processing time 0.74**2. age r imagery skill 0.19*3. age r spatial span .24*4. processing time r imagery skill .69**5. processing time r spatial span .036. imagery skill r spatial span 0.50**
* p õ .05, **p õ .01.
Several measures were used to evaluate these models. The x2 can determineif differences between the data and the model are significant statistically. Itcan also be used to determine if the nested models differ in their fit. However,x2 is limited as an overall measure of the fit of the data to the model because,when samples are large, conceptually minor deviations from the model cancause the model to be rejected (Loehlin, 1992). Consequently, several othermeasures were also calculated to evaluate the models. The Adjusted Popula-tion Gamma Index and the Joreskog-Sorbom Goodness of Fit Index bothrange from 0 to 1, with the latter indicating perfect correspondence betweenmodel and data; values greater than .90 indicate a good fit. The AdjustedRoot Mean Square is a measure of the size of the residuals, adjusted for thecomplexity of the model; values less than .10 indicate a good fit of the datato the model (Steiger, 1989).
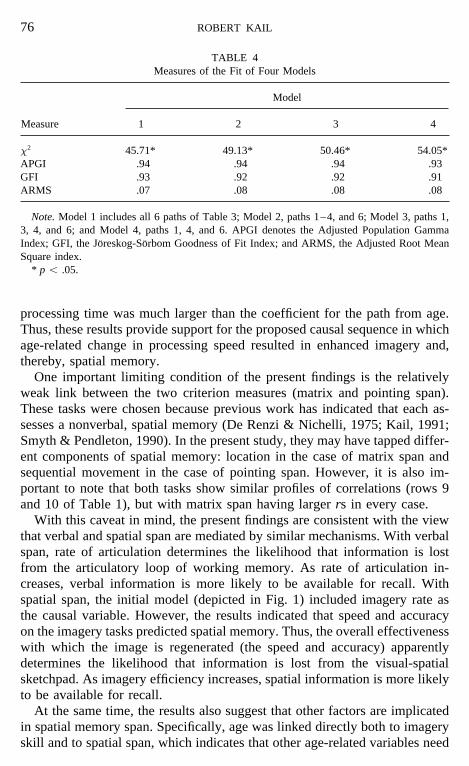
Table 4 depicts these measures for all four models. All four models wereinconsistent with the data, x2s § 45.71. Nevertheless, the remaining descrip-tive indices indicated a good fit of the data to the models. Values of APGIand GFI were consistently greater than .9 and values of ARMS were lessthan .10. The difference between the fits of Models 1 and 4 was significant,x2 Å 8.34, df Å 1, N Å 128, p õ .05, indicating that the fit of the model tothe data was reduced when paths 2, 3, and 5 were deleted from the model.When Models 2 and 3 were compared with Model 1, the difference ap-proached significance, x2 Å 3.42, df Å 1, N Å 128, p õ .10, and x2 Å 4.75,df Å 2, N Å 128, p õ .10, respectively.
DISCUSSION
The primary finding of the present study was that performance on spatialmemory span tasks was largely predicted by imagery skill. That is, althoughspatial memory span was linked significantly to age and to imagery skill, thecoefficient for the path from imagery skill was nearly three times larger thanthe coefficient for the path from age. Imagery skill, in turn, was linked toboth age and to processing time. Here, too, the coefficient from the path from
AID JECP 2337 / ad06h$$122 12-11-96 22:51:16 jecpa AP: JECP
76 ROBERT KAIL
TABLE 4Measures of the Fit of Four Models
Model
Measure 1 2 3 4
x2 45.71* 49.13* 50.46* 54.05*APGI .94 .94 .94 .93GFI .93 .92 .92 .91ARMS .07 .08 .08 .08
Note. Model 1 includes all 6 paths of Table 3; Model 2, paths 1–4, and 6; Model 3, paths 1,3, 4, and 6; and Model 4, paths 1, 4, and 6. APGI denotes the Adjusted Population GammaIndex; GFI, the Joreskog-Sorbom Goodness of Fit Index; and ARMS, the Adjusted Root MeanSquare index.
* p õ .05.
processing time was much larger than the coefficient for the path from age.Thus, these results provide support for the proposed causal sequence in whichage-related change in processing speed resulted in enhanced imagery and,thereby, spatial memory.
One important limiting condition of the present findings is the relativelyweak link between the two criterion measures (matrix and pointing span).These tasks were chosen because previous work has indicated that each as-sesses a nonverbal, spatial memory (De Renzi & Nichelli, 1975; Kail, 1991;Smyth & Pendleton, 1990). In the present study, they may have tapped differ-ent components of spatial memory: location in the case of matrix span andsequential movement in the case of pointing span. However, it is also im-portant to note that both tasks show similar profiles of correlations (rows 9and 10 of Table 1), but with matrix span having larger rs in every case.
With this caveat in mind, the present findings are consistent with the viewthat verbal and spatial span are mediated by similar mechanisms. With verbalspan, rate of articulation determines the likelihood that information is lostfrom the articulatory loop of working memory. As rate of articulation in-creases, verbal information is more likely to be available for recall. Withspatial span, the initial model (depicted in Fig. 1) included imagery rate asthe causal variable. However, the results indicated that speed and accuracyon the imagery tasks predicted spatial memory. Thus, the overall effectivenesswith which the image is regenerated (the speed and accuracy) apparentlydetermines the likelihood that information is lost from the visual-spatialsketchpad. As imagery efficiency increases, spatial information is more likelyto be available for recall.
At the same time, the results also suggest that other factors are implicatedin spatial memory span. Specifically, age was linked directly both to imageryskill and to spatial span, which indicates that other age-related variables need
AID JECP 2337 / ad06h$$122 12-11-96 22:51:16 jecpa AP: JECP
77COGNITIVE PROCESSING TIME
to be incorporated into the causal model. As suggested previously, somesubjects may recode spatial information verbally. Consequently, age-relatedchange in such recoding, as well as in rate of articulation and verbal span,may be implicated in performance on tasks that are ostensibly spatial. Thispossibility could be evaluated in research in which all of the constructs inFig. 1 are assessed.
More generally, the present findings contribute to a growing literaturedemonstrating that the impact of age-related change in processing speed isnot restricted to tasks with an obvious speeded element. Speed of processingmay influence performance whenever a number of activities must be com-pleted in a fixed period. In these instances, slow processing speed may resultin reduced performance because children or adolescents do not complete thenecessary components of task performance in the time allotted. Previousexperimentation has shown the impact of age-related change in processingspeed on word decoding (Kail & Hall, 1994) and verbal memory (Kail &Park, 1994); from the present findings, spatial memory would appear to repre-sent another developmental change that can be linked, in part, to more rapidprocessing of information as children develop.
REFERENCESBaddeley, A. (1986). Working memory. Oxford: Clarendon.Baddeley, A. (1992). Is working memory working? The fifteenth Bartlett lecture. The Quarterly
Journal of Experimental Psychology, 44A, 1–31.Brandimonte, M. A., Hitch, G. J., & Bishop, D. V. (1992). Influence of short-term memory
codes on visual image processing: Evidence from image transformational tasks. Journal ofExperimental Psychology: Learning, Memory, and Cognition, 18, 157–165.
Cyphers, L., Fulker, D. W., Plomin, R., & DeFries, J. C. (1989). Cognitive abilities in the earlyschool years: No effects of shared environment between parents and offspring. Intelligence,13, 369–386.
De Renzi, E., & Nichelli, P. (1975). Verbal and non-verbal short-term memory impairmentfollowing hemispheric damage. Cortex, 11, 341–354.
Hitch, G. J., Halliday, M. S., & Littler, J. E. (1989). Item identification time and rehearsal rateas predictors of memory span in children. The Quarterly Journal of Experimental Psychol-ogy, 41A, 321–337.
Isaacs, E. B., & Vargha-Khadem, F. (1989). Differential course of development of spatial andverbal memory span: A normative study. British Journal of Developmental Psychology, 7,377–380.
Juhel, J. (1991). Spatial abilities and individual differences in visual information processing.Intelligence, 15, 117–137.
Kail, R. (1991). Controlled and automatic processing during mental rotation. Journal of Experi-mental Child Psychology, 51, 337–347.
Kail, R., & Hall, L. K. (1994). Processing speed, naming speed, and reading. DevelopmentalPsychology, 30, 949–954.
Kail, R., & Park, Y. (1994). Processing time, articulation time, and memory span. Journal ofExperimental Child Psychology, 57, 281–291.
Kosslyn, S. M., Margolis, J. A., Barrett, A. M., Goldknopf, E. J., & Daly, P. F. (1990). Agedifferences in imagery abilities. Child Development, 61, 995–1010.
Laux, L. F., & Lane, D. M. (1985). Information processing components of substitution testperformance. Intelligence, 9, 111–136.
AID JECP 2337 / ad06h$$123 12-11-96 22:51:16 jecpa AP: JECP

78 ROBERT KAIL
Loehlin, J. C. (1992). Latent variable models (2nd ed.). Hillsdale, NJ: Erlbaum.Salthouse, T. A., Babcock, R. L., Mitchell, D. R. D., Palmon, R., & Skovronek, E. (1990). Sources
of individual differences in spatial visualization ability. Intelligence, 14, 187–230.Smyth, M. M., & Pendleton, L. R. (1990). Space and movement in working memory. The Quar-
terly Journal of Experimental Psychology, 42A, 291–304.Steiger, J. H. (1989). EzPath: Causal modeling. Evanston, IL: Systat.
RECEIVED: April 10, 1995; REVISED: January 22, 1996
AID JECP 2337 / ad06h$$123 12-11-96 22:51:16 jecpa AP: JECP
Recommended