lnrernutionul Stutisticul Review (1998), M,3,271-289, Printed in Mexico @ International Swtisticd Inslilute
Professional Development for Teachers of Probability and Statistics: Into an Era of Technology
Jane M. Watson
School of Early Childhood and Primary Education, University of Tasmania, GPO Box 252-66, Hobart, Tasmania 7001,Australia. E-mail: Jane. [email protected]
Summary
The focus of this paper is the professional development of teachers of probability and statistics at school level. Within a world where the statistics curriculum is changing at school level, the professional development needs of teachers of statistics are changing and the technology to meet these needs is changing as well. This paper reviews the work in the field, describes the development of a multimedia package for professional development of statistics teachers and looks to the future.
Key words: Statistics education; Professional development of teachers; Multimedia; Technology for teaching; Pedagogy; School curriculum.
1 Introduction
Perhaps the greatest change to the school mathematics curriculum in the 1990s has been the increased coverage of probability and statistics. Change has occurred at all levels from early childhood to upper secondary. What often has not been acknowledged by those attempting to realise this classroom change is the lack of appropriate statistical background of teachers at all levels. At the elementary level most teachers would have experienced no mathematics curriculum work in the area, although some may have struggled with the statistics component of an introductory psychology course. At the secondary level many teachers with strong backgrounds in mathematics nevertheless did no courses in probability and statistics as part of their preparatory degrees and again no curriculum work in their pre-service education courses. The professional development needs of these teachers, as well as those in other subject areas with statistical literacy requirements, have only slowly been recognised and are only now beginning to be met comprehensively. In Section 2, after setting the context in terms of changes to the mathematics curriculum, the increasing concern about the professional development needs of teachers since the beginning of the 1980s is documented from two perspectives. One reflects the needs of teachers as perceived by statistics educators. The other reflects needs gleaned from profiling teachers in the light of the more general perceptions of the education community concerning the professional performance of teachers. Within this wider milieu, the use of new technologies for the delivery of professional development and the experiences in one country, Australia, are described in Section 3. This provides an extensive case study which may assist those in other countries in devising in-service programs with similar objectives, particularly if distance is an issue. Finally, there is a discussion of future possibilities for professional development in Section 4.
J.M. WATSON
2 History of Curriculum and Pedagogical Change
This section looks at the background against which technology has been introduced into the provision of professional development of teachers of statistics. This history includes the changes in the mathematics curriculum, the progressive introduction of in-service programs, and the recognition that aspects of teacher performance should influence program content.
2.1 The Statistics Curriculum
Among English-speaking countries the first to produce curriculum materials which included an emphasis on probability and statistics was the United Kingdom. With the publishing of the School Mathematics Project (SMP) draft book on statistics and probability (SMP, 1971), there was an acknowledgment of the importance of these topics for senior high school students. This was further developed in thc work of Holmes (1980). The publication of the National Council of Teachers of Mathematics (NCTM) Yearbook in 198 1 (Shultc, 1981) drew the attention of mathematics teachers in the United States to the topics of statistics and probability. Later in the 1980s the American Statistical Association (ASA) joined with the NCTM to produce the ~uantitatiGe Literacy Series (e.g., Landwchr & Watkins, 1986) for middle and high school students, while in England Graham (1 987) produccd an introductory data investigations book for the same students.
In I989 the NCTM published its Curriculum trnd Evaluation Standards for School Mathematics which included five standards for probability and statistics across the school years. As well as specifically stating the content leading to formal statistical analysis, the Standards in its overviews gcncrally notcd the increasing importance of collecting and organising data and exploring chance for grades K-3 (NCTM, 1989, p. 20). It also stressed the use of statistical methods to describe, analyse, evaluate and make decisions, and the creation of experimental and theoretical models of situations involving probabilities for grades 5-8 (NCTM, 1989, p. 70). These were suggested in preference to topics such as number operations, algorithms and memorising rote formulas.
Similar changcs were also reflected In the curr~culum documents of other countries, for example, Australia (Australian Education Council [AEC] 1991, 1994a), New Zealand (Ministry of Education, 1992) and England and Wales (Department for Education, 1995). In AustraliaA National Statement on Mat1zemuticsfi)r Ailstraliarz Schools (AEC, 199 1) included one fifth of the mathematical content under thc hcading "chance and data". The justification for the inclusion of three aspects in the content was the following.
A sound grasp of concepts in the areas of chance, data handling and statistical inference is critical for the levels of numeracy appropriate for informed participation in society today.. . (p. 163)
The National Statement was followed three ycars later by Mathonutics-A Curriculum Profilefir Australian Schools (AEC, I994a), which su~n~narised the skills expected of students at eight levels between the beginning of school and grade 10. An accompanying document, Matlienzutics-Work Sunrp1r.s (AEC. 1994b). provided 20 exemplary work samples for chance and data over seven levels, to illustrate how the Projzle outcomes could be used to assess students. Similarly in the United States the NCTM produccd a supporting Addenda series with books at all levels to assist in implementing the probability and statistics curriculu~n (Zawojewski, 1991 ;Burrill et al., 1992; Lindquist, 1992). Whilc these documents provided a great deal of information for teachers, change also occurred in other areas of the school curriculum, and many teachers felt overwhelmed in this area where their background was weak.
Professional Development for Teachers of Probability and Statistics 273
2.2 Professional Developntent in Statistics
While the early curriculum materials undoubtedly assisted teachers in their personal development of statistical content knowledge, the literature reports little in the way of specific professional development programs. Although the NCTM Yearbook (Shulte, 1981), for example, is still used as a resource for the professional development of teachers today, it did not make any specific proposals for in-service work with teachers.
Calls for the professional development of teachers of statistics at the secondary level date back at least as far as the First International Conference on the Teaching of Statistics (ICOTS) in 1982. Although no papers were presented which focused on this Issue, calls were made that attention should be given to the senior secondary group by Morley (1983), in the related context of training tertiary teachers, and by Nemetz (1983), in discussing the ideal world of teaching statistics to 16 to 18-year-old students. Both authors made calls for in-service work with teachers of these students. By the time of the Second ICOTS in 1986, there were reports on professional development projects for middle and high school teachers in the United States (Scheaffer & Burrill, 1987), South Africa (Glencross, 1987), and Germany (Steinbring, 1987). These programs were based on face-to-face sessions with teachers, with the use of videotapes of previous sessions being suggested as a method of encouraging discussion in two of the reports. While the use of computers was noted briefly in one report, the technology at that time was not generally available and proponents did not want to discourage the introduction of statistics if computers were not yet available in classrooms.
The 1988 International Statistical Institute (ISI) Roundtable (Hawkins, 1990) sought to address specifically the issues associated with the training of teachers of statistics. While many papers dealt with programs for pre-service teachers, several looked at general theoretical issues relevant to teachers of the subject. Also, examples of in-service programs were provided by New Zealand, the United States, Sweden, the United Kingdom, France, Germany and Australia. These programs varied in their content, approach and length but mainly involved face-to-face workshops or equivalent sessions. Only one paper (Gallimore, 1990) dealt specifically with distance delivery for in-service training. The program offered a postgraduate Diploma in Statistics and Statistical Education at Sheffield Hallam University. One or two weekends of contact were required, with written and telephone communication for the rest of the interaction. Many issues of importance for professional development were raised at the Roundtable but again technology generally received little attention.
Three further reports of in-service programs were included in the proceedings of the Third ICOTS. Updates were provided on the in-service aspects of the ASA-NCTM Quantitative Literacy Project (Scheaffr, 1991; Hurrill, 1991) and the postgraduate diploma at Sheffield Hallam University (Gal- limore, I99 1 j. Kinncy ( 1 99 l ) described developments in the United States in the late 1980s based on workshops, regional conferences and summer schools. While employing technology, including computer and video resources, this was not the medium of instruction, since face-to-face teaching models were used.
In 1992 Hawkins, Jolliffe & Glickman produced a handbook for teachers of statistics, which contained many of the aspects one would include in a professional development program: the place of statistics in the curriculum, difficulties expressed by teachers themselves, three stages in the teaching of statistics (descriptive statistics, probability and inference), research in statistics education, project work, computer usage, multimedia resources for teaching, and assessment. Such a book could be used as a text in a professional development program for teachers in either the traditional or the distance mode. The difficulties associated with a text book are the need for updated editions to keep up with changes in teachers' perceptions, research and improved technologies and the need, in the case of distance education in particular, to provide animation and motivation of the type difficult to provide in the book format.
At the First Scientific Meeting of the International Association for Statistical Education (IASE) in 1993, Frierson, Friel, Berenson, Bright & Tremblay (1994) reported on a professional development
274 J.M. WATSON
project, Teach-Stat, for elementary school teachers in North Carolina. This innovativeprogram for 55 teachers included summer school sessions with follow-up during the next school year. Teacher change was monitored by responses to questionnaires. The major focus of the professional development was to help teachers come to terms with a four-step process for data handling in relation to their classroom teaching-pose questions, collect data, analyse data, and interpret results (Bright, Berenson & Friel, 1993).
The following year, at the Fourth ICOTS, there were two reports on professional development: one on an extension of the Quantitative Literacy Project to include elementary school teachers (Scheaffer, 1994) and one reviewing all methods employed for in-service programs in Australia (Jones & Lipson, 1994). The increasing attention to the use of multimedia for teaching statistics was seen in the presence of sections on the topic at both the First Scientific Meeting of IASE in 1993 and at the Fourth ICOTS in 1994. None of the papers, however, was directed at using these media for the professional development of teachers.
The use of multimedia for providing professional development f ~ r mathematics teachers in general was discussed by Hatfield & Bitter (1994) in terms of providing a virtual classroom for consideration of issues. Among their objectives was the promotion of active learning, models of exemplary and non-exemplary practice, an interactive work environment, multiple pathways, and motivation. These objectives were similar to those of Velleman & Moore (1996) in reviewing the use of multimedia in teaching introductory tertiary statistics courses. In the statistics classroom and more generally in mathematics in-service and pre-service teacher education, the new technologies were beginning to have an impact. The provision of professional development, specifically for teachers of probability and statistics using new technologies, had not been addressed however, as the middle of the decade approached.
By 1996, when the International Handbook of Mathematics Education (Bishop, Clements, Keitel, Kilpatrick & Laborde, 1996) was published, the use of computer technology for the teaching of data handling was attracting considerable attention, but professional development and in particular professional development at a distance received little (Shaughnessy, Garfield & Greer, 1996). Noted among the challenges for the future was "the professional development of teachers of data handling" (p. 225). The projects identified as leading the way, even when advocating the use of technology in the classroom, were delivered in traditional face-to-face workshop courses for teachers. In the same volume, Borovcnik & Peard (1996) addressed strategies to improve the teaching of probability and made many suggestions which would be useful in professional development programs. They did not, however, make specific suggestions or describe any existing programs.
While the distance teaching of statistics has attracted some attention, for example at the Third and Fourth ICOTS, only the work of Gallimore (1990, 1991) has been directed at in-service school teach- ers of the subject. In discussing general issues associated with mathematics education at distance, Arnold, Shiu & Ellerton (1996) gave examples of the use of "technology rich contexts" including CD-ROM and the internet. It was noted that multimedia resources could be employed either in traditional or distance modes to complement group discussion or text-based materials. While the case studies described were implemented for pre-service training of mathematics teachers, the same media are also available for in-service programs.
Information on the specific professional development needs of teachers of probability and statistics has appeared only rarely. After a survey of 40 schools at all levels in Northern Ireland, Greer & Ritson (1993) found a need for in-service training for both understanding of the subject matter and awareness of appropriate teaching methodologies. Shaughnessy (1992) had earlier noted this need in the context of the introduction of the NCTM's Sturrdurds. This aspect is addressed in the next section.
Professional Development for Teachers of Probability and Statistics 275
2.3 General Professional Development Needs
In presenting its Professional Standards for Teaching Mathematics (NCTM, 1991) to follow its Curriculum and Evaluation Standards, the NCTM listed six standards for the professional devel- opment of teachers of mathematics: (1) experiencing good mathematics teaching, which includes enhancing mathematical discourse with a variety of tools, creating learning environments to support change, expecting teachers to take risks, and affirming participation by all students; (2) knowing mathematics and school mathematics, which of course includes statistics and school statistics, and its role and applications in society; (3) knowing students as learners of mathematics; (4) knowing mathematical pedagogy, including resources, instructional strategies, the promotion of discourse, and assessment; (5) developing as a teacher of mathematics in terms of reflection on approaches to teaching and content; and (6) participating actively in professional development. These standards provide a foundation for planning any type of professional development.
In the wider context of factors associated with teacher performance, Shulman (1987, p. 8) produced a characterisation which is also useful for teachers of statistics. He claimed that the following types of knowledge are important: (1) content knowledge, (2) general pedagogical knowledge, (3) curriculum knowledge, (4) pedagogical content knowledge, (5) knowledge of learners and their characteristics, (6) knowledge of education contexts, and (7) knowledge of education ends, purposes and values. Implicit in this characterisation is the importance of considering these factors with respect to the specific content area of the curriculum, in this case probability and statistics.
While the opinions, experiences and recommendations of others in the field greatly influence the development of any new in-service program for teachers, it is also important to reinforce current beliefs with information from teachers themselves who are likely to be involved in such programs. This was the case in the Australian experience reported here. Prior to the trialing of professional development models in the Australian context, 72 teachers of all grades up to grade-10 were inter- viewed with respect to teaching chance and data in relation to the aspects of teacher performance noted as important by Shulman. This section summarises the findings and the implications they had for the development of an in-service program; more details of the outcomes are found in Watson & Moritz (1997b).
Content Knowledge. The assessment of teachers' content knowledge in probability and statistics was possible from various perspectives, including self-report questions-for example on previous courses completed, previous topics studied, confidence in teaching topics in the curriculum, and confidence in handling the ideas in society-as well as specific questions about content. Assessment of specific content knowledge was based on responses to general questions on the terms "average" and "sample" and to some survey questions administered earlier to school students.
The range of responses concerning previous study of statistics-from none to several courses in psychology, biology, economics or education-indicated the diverse backgrounds which must be taken into account in providing professional development. Similarly the time lag since study, from 1 to 30 years, indicated that for many recall may be a problem. When asked to remember topics studied previously, teachers mentioned statistical topics twice as often as probability. This may reflect previous and current curriculum emphases and again calls for decisions in planning in-service experiences. In terms of confidence about teaching individual topics, some variation was observed but generally there were no extremes. For confidence in coping with statistics in society (using instruments based on Gal & Wagner, 1992), average responses were on the positive side of neutral, indicating that teachers generally were not uncomfortable with statistics in their daily lives.
There were two ways of looking more specifically at teachers' current content understanding. One was to ask the question, "what do you think of when you hear the word 'average'?" and similarly for the word "sample". The responses provided an indication of the sophistication of teachers' ideas on these topics with responses for "average" being more closely related to curriculum expectations than those for "sample". In both cases, very few teachcrs noted the representative nature of the concepts.
J.M. WATSON
The other way of assessing teachers' content knowledge was to consider their responses to survey items which had previously been used in research with students (Watson, 1994a). On these items teachers performed less adequately than desirable for those who would be teaching the topics; for example, less than half appreciated the regression-to-the-mean effect, a quarter saw nothing wrong with a pie chart where the percentages summed to 128%, only a quarter recognised the correct direction of an odds statement, only 10% recognised a biased sample, and only 30% could suggest acceptable reasons as to why the median would be an appropriate measure to use when discussing house prices. These results indicate that care needs to be taken about the assumptions of content knowledge made when beginning a professional development program.
Pedagogical content knowledge. Pedagogical content knowledge for the teachers interviewed was illustrated in three ways: in the structuring of lessons described, in descriptions of the use of the concepts of "average" and "sample" in relation to teaching statistics, and in the use of aids such as calculators and concrete materials. When asked to outline briefly how they would teach a topic which they had selected themselves, responses varied from a single phrase to a six-stage description. While many teachers knew of contexts in which the terms "average" and "sample" could be applied, limited descriptions were given for how to use the terms in classroom situations. Nearly all teachers indicated that calculators and concrete materials were available at some stage during the mathematics program, but far fewer said they were available for work in probability and statistics. The results suggested that there were many pedagogical issues to explore with teachers of probability and statistics.
Curriculum knowledge. Teachers' knowledge of the probability and statistics curriculum was gleaned in three ways: a self-report of usage of curriculum documents, a listing of three important concepts in the chance and data curriculum at the levels the teachers taught, and an outline of how one of the topics might be taught. Disappointingly few teachers reported familiarity with or use of state and national curriculum documents. Also, commercial curriculum materials were used by few. It was of considerable concern that teachers were not making greater use of resources, pointing to a potentially important focus for professional development.
When asked to list three concepts which they thought were important for students, elementary teachers' suggestions fell into three categories: they gave three related ideas, three quite different topics, or three very general topics, such as "everyday life" or "study can be fun". When asked for an outline of how they would teach the topic they felt was the most important of the three, again responses varied. While no specific suggestions were inappropriate, rnany lacked detail and did not indicate an awareness of some of the subtleties associated with topics in the chance and data curriculum. This reinforces the need to provide some detailed lesson structures in an in-service program.
Knowledge of learners and their characteristics. Information on teachers' knowledge of their students was obtained from two questions answered by teachers who indicated that they were currently teaching topics in probability and/or statistics. They were asked which topics their students enjoyed the most and which topics gave their students the most difficulty. Multiple responses were frequently given to the first question but not to the second. Responses to the first may be an indication of teachers' awareness of the reinforcement they receive from the positive reactions of their students. Responses to the second may indicate that students do not have many difficulties or that teachers are not attempting to discover them.
In noting topics with which their students had difficulty, elementary teachers most often noted the working out of probability calculations or calculations in general, followed by the language associated with the concept of chance and topics related to graphs. Secondary teachers mentioned the general problem of motivation and most frequently noted topics associated with central tendency, followed by certain specific graphical procedures, and working out theoretical probabilities. A few of the responses showed that teachers were aware of difficulties at higher levels of functioning in relation to the curriculum, and point to topics requiring attention as part of professional development.
Professional Development for Teachers of Probability and Statistics 277
Knowledge of education contexts. Knowledge of specific education contexts for teaching par- ticular topics in probability and statistics was illustrated in responses to questions on the teaching of the concepts of "average" and "sample". Although not many teachers suggested contexts, those mentioned were sensible. The teachers were asked both what professional development they had experienced and what they felt they needed in the future. Sixty-five percent of the teachers reported taking part in professional development associated with chance and data, the range of time used being one hour to 3.5days. When asked what suggestions they would make for professional development in the future, teachers preferred leaders who were their peers or someone who understood the classroom environment as well as knowing probability and statistics. There was a definite request for "hands on" activities to be used directly in the classroom. A few noted the need to base professional devel- opment on the recently released national and st :te curriculum documents. All comments reflected the belief that professional development takes p l x e in a face-to-face setting with the leader. This is a significant observation if other media are to be employed.
Knowledge of education ends, purposes and values. To some extent the knowledge of ends, purposes and values was identified throughout the teacher survey by the teachers' willingness to be involved in interviews. Teachers also indicated their levels of agreement with four statements on the place of statistics in society (Gal & Wagner, 1992). Overall, the average responses were on the socially expected side of neutral in each case.
Within the context of professional development programs, the information gathered from the teacher interviews reinforced the areas of content and pedagogical knowledge which needed to be addressed in an in-service program. While teachers wished for "hands on" activities to be used immediately in the classroom, there were also needs, as gleaned from other parts of the interviews, for greater content knowledge, exposure to the curriculum documents, and awareness of student behaviours.
3 The Development and Evaluation of a Multimedia Package for Teachers
The development of a multimedia package for the in-service professional development of statistics teachers in Australia took place over a three-year period and was part of a government-funded project titled "Learning the Unlikely at Distance Delivered as an Information Technology Enterprise", shortened to LUDDITE. This section discusses the context and the preliminary trials which led to the decision to produce a CD-ROM linking a package of materials, the contents of the CD, and its evaluation by teachers. The main issues were associated with the content which would be most helpful to teachers and the mode of delivery which would be most satisfactory for teachers separated by distance across the continent of Australia.
3.1 Context and Preliminary Trials
The initial efforts to provide professional development in statistics in Australia were directly associated with the publication of A National Statement on Mathematics for Australian Schools (AEC, 1991). In order to disseminate this new curriculum document, the Australian Association of Mathematics Teachers, Inc. (AAMT) received a government grant to produce eight professional development packages covering various aspects of the National Statement. One of these was Maths Works: Teaching and Learning Chance and Data (Watson, 1994b), which consisted of ten modules to be used with teachers and/or parents. The content included the use of newspapers to motivate the need for chance and data in the curriculum, activities for young and middle school children, simulation of events, common misunderstandings and key extracts from the National Statement. Maths Works explicitly stated that the modules did not constitute a course which could on its own provide a qualified statistics teacher and it was recommended that workshops based on the modules
278 J.M. WATSON
be conducted by leaders with strong statistical backgrounds.
At the same time the Australian Mathematics Curriculum and Teaching Project was expanding to include probability and statistics. Two volumes of Chance and Data Investigations (Lovitt & Lowe, 1993) included 40 detailed topics with lesson plans, photos, teachers' comments, work sheets, extensions and in some cases software and video extracts. Chance and Data: Exploring Real Data (Finlay & Lowe, 1993) included 46 shorter investigations based on data sets available from the Australian Council for Overseas Aid, with graphs and extended data sets on disk. These three books were intended for direct classroom use by teachers but were also used for professional development in face-to-face sessions with teachers across the country by their authors and other state supervisors of mathematics.
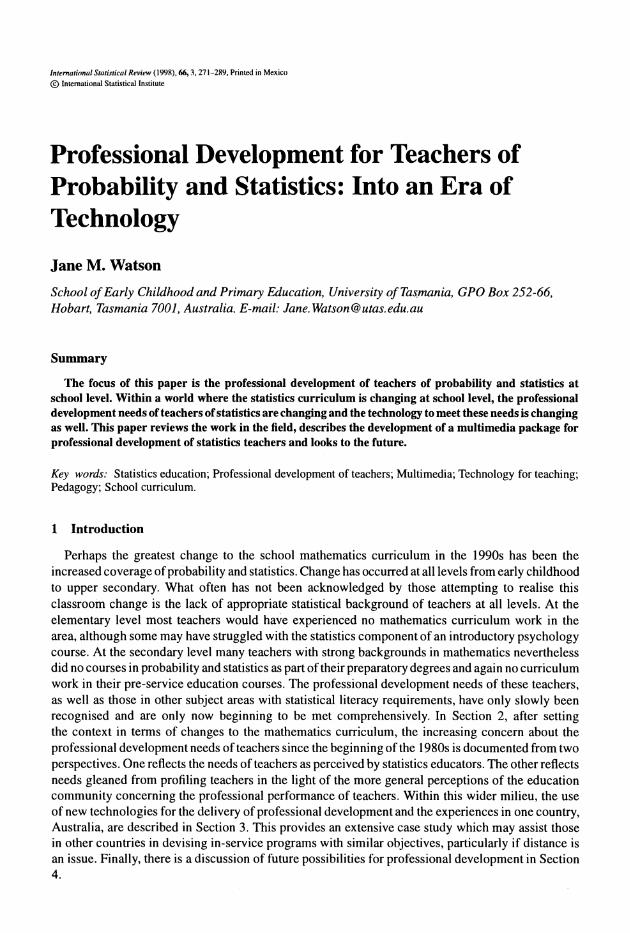
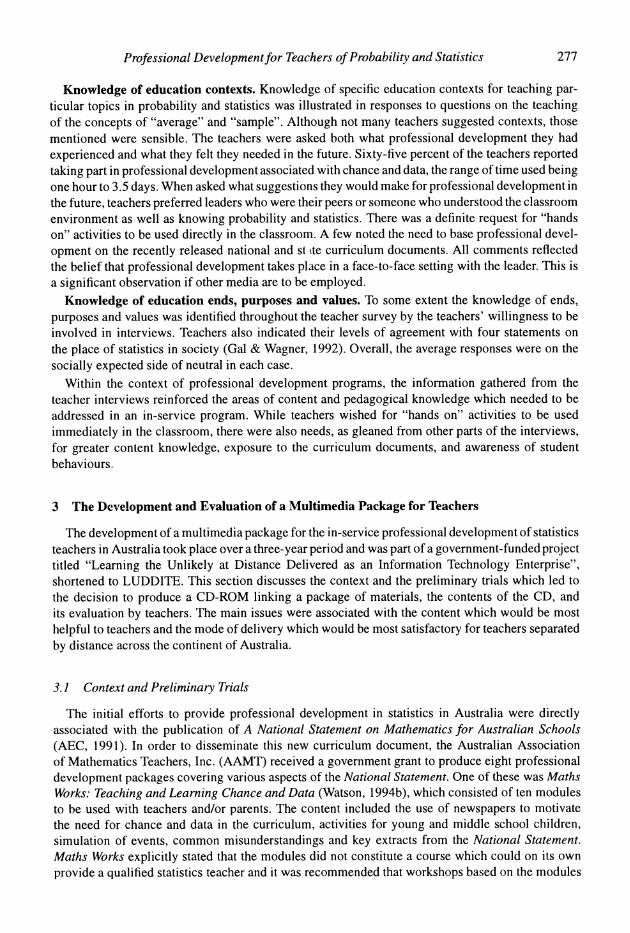
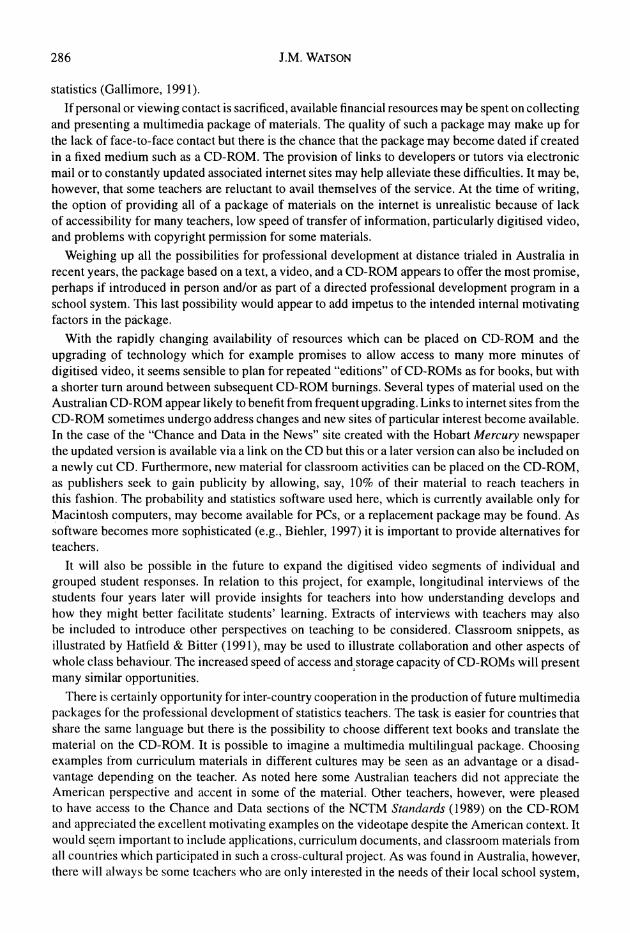
Among the concerns in using these materials to provide professional development for teachers across Australia was the vast distance involved in reaching potential participants. Australia is a country about the size of the United States but with a dispersed population of only 18,000,000. The next stage in the. evolution of professional development, the LUDDITE project, was to concentrate on methods of delivery which could reach teachers and/or schools on a scale not practical on a face-to-face basis. The acronym for the project, which recalled the nineteenth century movement in England which set out to destroy the technology of the industrial revolution, was meant to convey a new message about the current technology revolution. The first phase of the project employed local satellite television from Melbourne to reach (potentially) 2000 schools which had been provided with satellite dishes in the region shown in Figure 1. To trial this medium, four 1.5 hour programs were scheduled at the end of 1994 and the beginning of 1995. The content of the programs was based on two of the Maths Works modules, an activity from Chance and Data Investigations, and a panel discussion on assessment following the publication of Mathematics-A Curriculum Projile for Australian Schools (AEC, 1994a). Each program contained a transmission break in the middle for teachers to carry out activities and discussion in their own schools. For the first two programs four teachers provided a studio audience to model activities.
The major advantages of the narrowcast technology were the potential geographical coverage, the ability to provide motivating, custom-made video extracts and the presentation of current affairs topics while still current (for example, activities using the newspaper of that day). The major drawback of the satellite was the lack of ability for the presenters to see the participants at their school sites. Communication from the sites to the studio was via telephone or fax. It was impossible to determine how many schools participated because teachers may have watched the telecast but not responded when requested to do so. Further details of this phase of the trial are found in Watson, Baxter, Olssen & Lovitt (1996).
Several aspects of the first phase of the LUDDITE project led to variations in phase two. Foremost among these was the desire for the presenters to see the participants as well as being seen by them. It was also felt that the regional limitation of the satellite coverage was incompatible with the AAMT's national responsibilities. Video conferencing was therefore chosen.as an alternative delivery mode to satellite television. Due to lack of compatibility of systems, two sets of video conferences were conducted. Series I consisted of five fortnightly sessions, of I to 1.5 hour duration, originating in Adelaide. Three to five teachers were present in the Adelaide studio, and a similar number of participants joined the video conferences from studios in each of Mt Gambier, Brisbane, Townsville, Alice Springs and Perth (see Figure I ) . Series 2 consisted of six fortnightly sessions of two hours' duration, originating in Hobart, involving nine participants in Burnie (see Figure 1).
The other extension of phase two of LUDDITE was the provision of a more complete set of resources than had been available up until that time for in-service work in Australia. Not wishing to duplicate existing good materials, a package was put together for each participant consisting of four components.
Profssional Development for Teachers of Probability and Statistics 279
Townsville _ -
I.rcIuc
Figure 1. Australia with satellite television region (rudiuting from Melbourne) und video conferencing sites (x) indicuted
1. The book, Statistics: Concepts and Controversies (Moore, 1991) was a liberal arts text felt suitable for teachers of grades 5 to 9.
2. Extracts from the video series, Statistics: Decisions through Data (Moore, 1992) contained motivating contexts and animated graphical illustrations for both the teachers and their students.
3. Macintosh software packages, ProbSim and DataScope (Konold & Miller, 1992a, 1992b) provided simulation and data handling packages appropriate for both teachers and their stu- dents.
4. Hypertext on a 1.4Mb floppy disk provided the linking material for the local context, including links to the Australian and United States curriculum documents noted before, to newspaper articles for motivation, to discussions of commercial cumculum materials, to documents from other areas of the school curriculum, to ideas for using the software, to six complete Maths Works modules (Watson, 1994b), and to a suggested middle school curriculum.
Because of the potential difficulties accessing hypertext material, a hard copy version was also prepared.
The feedback on phase two of LUDDITE was varied. Reaction to the package of materials was positive with the only complaints coming from PC users who could not use ProbSim and DataScope and from those whose learning styles were not compatible with a non-linear hypertext format. The feedback on video conferencing as a professional development medium was mixed. The Hobart-Burnie link was the more comfortable one for participants who sat around a table with the
280 J.M. WATSON
presenter in a television screen at the end of the table. What they missed was the opportunity to exchange ideas with teachers in other parts of Australia. The video link of six sites from Adelaide was much more complex and there were more technical hitches. The system allowed only one site to be seen simultaneously by all other sites and the site automatically chosen was based on voice activation. This created some confusion when a participant made an inadvertent or very short comment. Participants were tolerant but it was a distraction. There were differing views about how much time should be spent on getting to know people at other sites and on being involved in hands-on chance or data activities, as opposed to proceeding with the mathematical presentation. The presenter faced a danger of the video conference becoming similar to a lecture format with no feedback from participants. Further discussion of the second phase of the project is found in Watson (1996).
At the end of this phase of the project, there was a perception that although being a step in the right direction, neither satellite television nor video conferencing reached a sufficient number of Australian teachers to be considered a totally viable solution to the distance problems existing in Australia. The increasing availability of computers with CD-ROM drives encouraged the belief that if the hardware were available on a virtually universal basis across the country then the consolidation of resources, begun on the 1.4Mb floppy disk, on a platform that could include digitised video-clips and software, should be the next phase in trialing professional development.
3.2 A Multimedia Package for Teachers
The final phase of the LUDDITE project sought to consolidate the provision of materials in a format which would be accessible to any teacher with a video recorder and the appropriate computer hardware to read a CD-ROM. This meant that teachers did not require satellite dishes in their schools or access to a nearby video conferencing centre. It also meant that visual contact with the presenters and other participants was sacrificed. To compensate for this an electronic mail list server was established for those who wished to communicate with other participants or the author/developer in this way. Telephone and fax were also available means of communication.
The package of materials continued to include Moore's text book (1991) and video tape (1992) to provide the basic statistical content and motivating examples with graphics. There were several reasons for continuing to include these materials: it was uneconomical and beyond the scope of the project to duplicate material which already exemplified best practice in the field, and the provision of three media-written, video and computer-offered variety for users. Written words, for example, stored on a CD-ROM could present monotonous reading and the multiple linkages available on a CD-ROM were not readily presented in a linear paged book format. Moore's book was the best medium for telling the story of the statistics content and the video was the best medium for showing the visual aspects of the statistics in a motivating fashion (Moore, 1997). The CD-ROM provided the links and interactive choices of pathway.
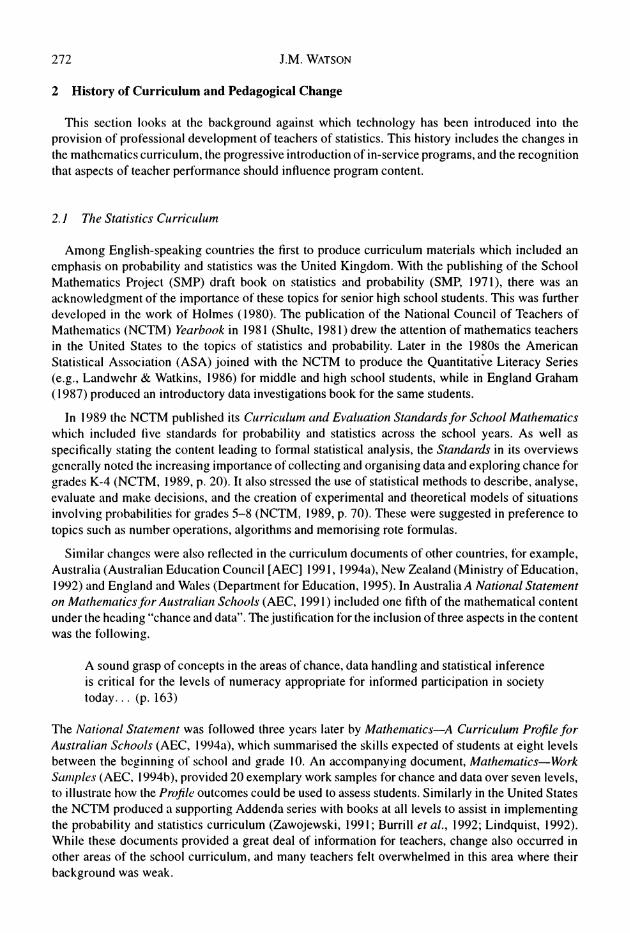
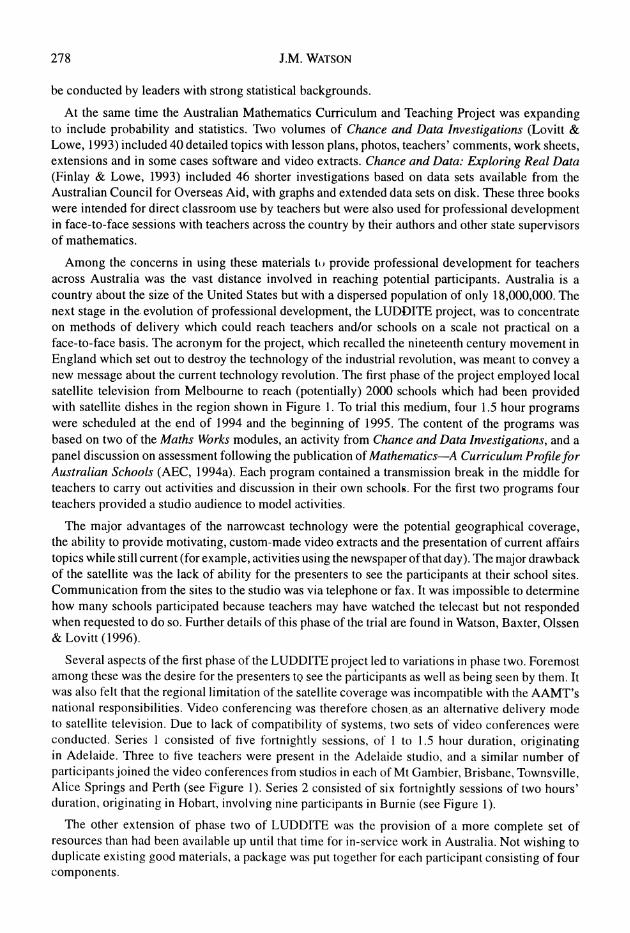
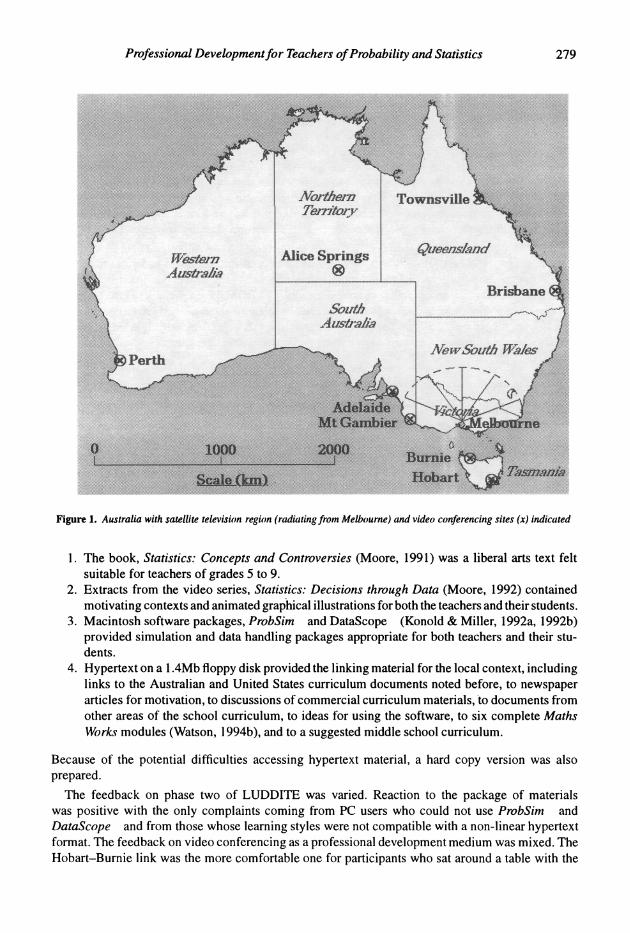
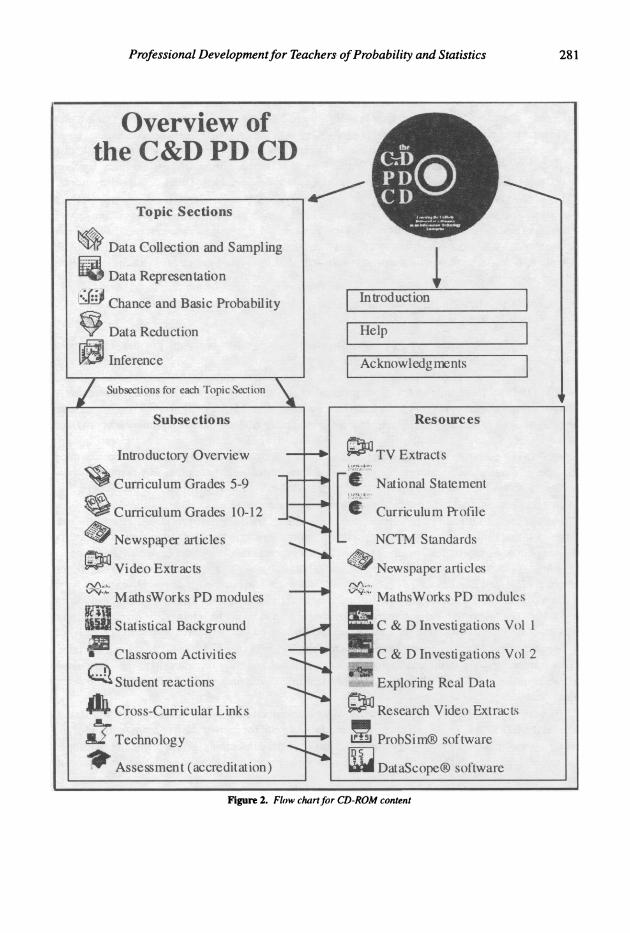
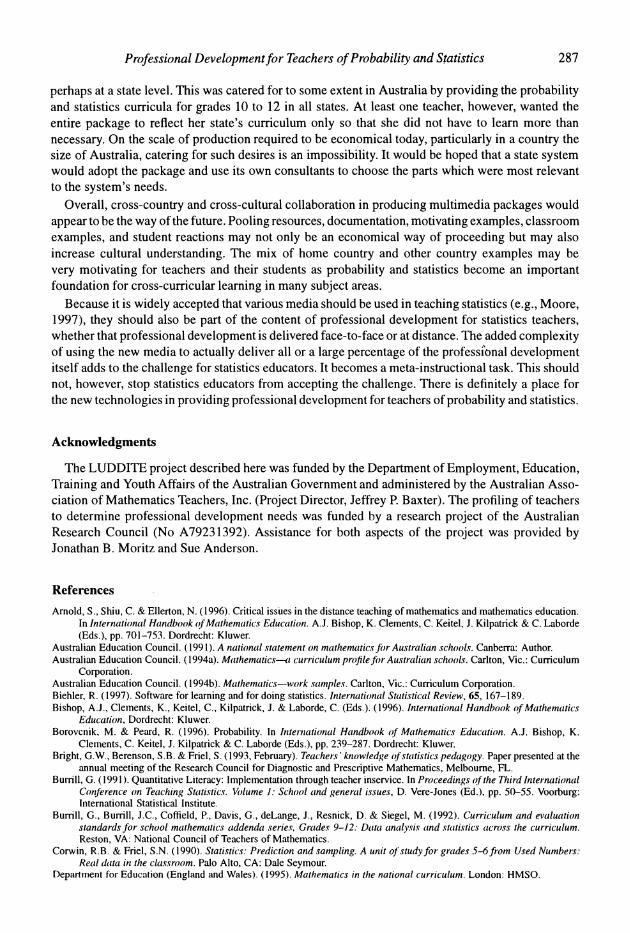
As the text and video extracts are available commercially, this section will describe in detail the structure of the CD-ROM and its objective to link together all other material felt necessary to assist teachers from grade 5 with the probability and statistics curriculum. Figure 2 illustrates the framework for the linkages which were created on the CD-ROM, which was titled "The C&D PD CD" to represent "The Chance and Data Professional Development CD-ROM". The structure was expanded from that trialed on floppy disk in the previous phase of the project. While modelled to some extent on the chapter structure one might expect in a book, there was the possibility to reference the non-text-oriented resources provided on the CD-ROM from the text as well as the possibility to jump to related sections of the mainly text-based material. As seen in Figure 2, it was possible to go directly to the additional resources provided, although it was strongly advised that users proceed through the main content sections of the CD.
The content of the probability and statistics curriculum was divided into five parts, using a model
Professional Developmentfor Teachers-ofProbability and Statistics 281
Overview of the C&D PD CD
Topic Sections /
@? Data Collection and Sampling
Data Representation
$4 Chance and Basic Probability In trod uction
1 Data Reductionq Help
Inference Acknowlcdgmcnts I Subsect~onsfor each Topic .Sect on +
Subsections Resoilrces
Introductory Overview ..% .-9Curriculum Grades 5-9
@Curriculum Gradcs 10-12 CurriculumPrntile
@Newspaper articles NCTM Standards
@Video Extracts 8 - 4 . .
-'" MathsWorks PD mtxlules -
fScSifi fit= Statistical Backgound
$3Classroom Activities
---. QStudent reactions --. # Cross-Curr icular Links &
Technology*h s e s m e n t (accred,t&ion)
Figure 2. Flow churtfor CD-ROMcontent
-0/
-C
' u s -'-
PJ',. . -' MathqWorks PD mdulcs
@C & D Inve~t~gationsVtd 1
9C & D Inveqtigations VoI 2 #%?
Exploring Real Data
@Research V i h o Exlrak Fa I'T5r ProbSirdB software
DataScopeB software
282 J.M. WATSON
which dates back at least as far as Holmes (1980). The five main sections of the material were Data Collection and Sampling, Data Representation, Chance and Basic Probability, Data Reduction and Inference. The topic Chance and Basic Probability was placed in the middle of the other four topics for several related reasons. It was felt that probability is an integral part of the curriculum and should not be seen as an extra to be added at the end if time allows. Placing probability in the middle also helped to provide a basis for inference. With a hypertext format with many possible links, teachers in different circumstances with different purposes, could choose varying paths through the content.
Within each of the five main sections there were twelve subsections addressing different aspects of the content necessary for enriched teaching. The Introduction presented a rationale for considering the subject matter in the section plus two motivating digitised video clips. These included a television news story, advertisements, and extracts from a television program which takes a critical look at media coverage in Australia. The video extracts were intended to create humour; for example a snippet quoted a reporter as saying,
The irony of the Northern Territory's law on euthanasia is tbat its citizens are among the most least likely to use it.
Two curriculum subsections were provided to assist teachers across the country in making decisions on what to teach. In the subsection for grades 5 to 9 the author suggested a feasible coverage of topics based on research experience and important curriculum documents (AEC, 199 1; AEC, 1994a; NCTM, 1989). The chance and data, or probability and statistics sections of the documents were linked to this subsection in order for teachers to be able to attend to suggestions made on the national level in Australia and the United States. In the subsection for grades 9 to 12, a summary was provided of the senior secondary curriculum in probability and statistics for each of the states and territories of Australia. The purpose of this was to aid communication across the country and encourage a coming together of curriculum developers. At the teacher's level it was felt that in this way resources could be shared across the country. Again, links were provided to the formal curriculum documents which themselves had internal hypertext links created for easier perusal.
The subsections related to newspapers were significant both for motivation and classroom use. After an initial difficulty in obtaining copyright permission from newspapers in several countries for the use of interesting articles from their papers, an agreement was struck with The Mercury newspaper in Hobart, Tasmania to create an internet site using that newspaper as a resource. Articles were chosen which represented good usage of probability and statistics as well as poor usage. Discussions were written for each article, describing the feature to be highlighted from the article with suggestions for use in the classroom. While this resource has since been updated on the internet, the original material was placed on the CD-ROM in the exact hypertext form as on the World Wide Web site (HREFI).
For each of the four sections of the material for which video extracts (Moore, 1992) were available, short summaries were written indicating the main features and their relationship to the curriculum. These could be used by teachers for their own learning or for their students if judged to be at the appropriate level.
Six of the Maths Works modules (Watson, 1994b) described earlier were reformatted for presenta- tion on the CD-ROM. There was at least one module relevant for each of the five main sections of the materials and these were briefly described and linked to the subsections. While originally developed for use with parents and teachers, there was ample opportunity to adapt the activities for classroom use.
The statistical background subsections detailed the specific chapters and parts of chapters from Statistics, Concepts and Controversies (Moore, 199 1) which were relevant for the content of the sec- tions. The reinforcement of this link was important as content understanding was assumed elsewhere on the CD-ROM.
The classroom activities subsections provided reviews of some resources available commercially
283 Professional Development for Teachers of Probability and Statistics
which would provide activities suitable and readily adaptable for classroom use. Examples of re- sources described included books in the Quantitative Literacy series (e.g., Landwehr & Watkins, 1986) and the Used Numbers series (e.g., Corwin & Friel, 1990; Friel, Mokros & Russell, 1992). As well as highlighting these resources, 10% of the content from the Australian Curriculum Cor- poration's three-volume series of Chance and Data Investigations (Lovitt & Lowe, 1993; Finlay & Lowe, 1993) was provided on the CD-ROM. It was reproduced in the same page format as in the hard copy of the books for ease of reading. Lessons included the topics of radioactive decay, winning streaks when playing games, estimating measurements for playground equipment, collecting data from a c-metery, sampling to determine the length of a "rod", distribution of the world's food, world population, automobile accidents, and the relationship of energy use and life style-all intended to satisfy teachers' requests for "hands-on" classroom activities.
The student reactions subsections contained responses to interview questions from students in grades 3 to 9 on topics related to the five sections of curriculum. In many cases digitised video clips allowed teachers to hear the students expressing their reasoning, as well as being able to read tran- scripts. The purpose of these extracts was to provide examples of the range of student understanding teachers were likely to experience in the classroom, especially in the light of evidence from the pre- vious profiling of teachers which indicated that many were not familiar with the potential problems students might have. Examples included extracts related to what a sample is, the methodology of sampling, creating and interpreting pictographs and bar charts, recognising an error in a pie chart, fair dice, luck, the choice of lottery numbers, average, the comparison of two groups based on a graphical presentation, and the concept of randomness.
The subsections on cross-curricular links contained extracts, as appropriate, from other Australian curriculum documents on Science, Studies of Society and Environment, Health and Physical Edu- cation, Technology, English, the Arts and Languages other than English. These illustrated contexts where chance and data, or statistical literacy more generally, could be emphasised.
In relation to technology, links to sites on the World Wide Web were provided for those with internet access. Use of the two Macintosh software packages, ProbSim and Datascope (Konold & Miller, 1992a, 1992b) was demonstrated with problems related to the Maths Works modules appropriate for adaptation for classroom use. User's Guides for each of the two packages, prepared by their authors, were accessible, with other examples for classroom use.
For those teachers who desired tertiary accreditation for working through the materials in the package, subsections were provided with exercises for each part of the contents and instructions for submitting work to the University of Tasmania. This aspect will be amplified in the next section.
The CD-ROM material which related to the book and video, while structured in main sections according to content, was also intended to satisfy the needs of all of the types of knowledge noted by Shulman (1987) earlier as important for high level teacher performance. The needs of teachers surveyed earlier also influenced the choice of some material included. The content knowledge was provided mainly through reference to Moore's text and video. Curriculum knowledge was available through access to the two major Australian national curriculum documents (AEC, 1991, 1994a), the NCTM Standards (l989), a proposed middle school curriculum for chance and data, a summary of all Australian state and territory curricula for grades 10 to 12, and reference to relevant parts of other Australian subject area curriculum documents. General pedagogical knowledge and pedagogical content knowledge were included in subsections related to classroom activities, the use of the videos, a short general summary on assessment, and applications using computer software. Knowledge of learners and their characteristics was supplied on many topics across the probability and statistics curriculum for students from grades 3 to 9 in both digitised video clip and written form. Knowledge of educational contexts was included in the videotape material which provided many contexts for applying statistics, in the examples from Maths Works and Curriculum Corporation material, and finally in suggestions for using technology. Knowledge of education goals, purposes and values was
284 J.M. WATSON
provided through newspaper articles, through motivational video extracts from television news and advertising, through other professional articles and references, and through curriculum links to other subject areas where probabilistic and statistical ideas are utilised.
3.3 Evaluation of the Final Professional Development Package
While the CD-ROM was sent to statistics educators around the world for feedback, the major evaluation was based on the experience of Australian teachers. Within the official period of the piloting process, 35 teachers across Australia volunteered to trial the complete package of niaterials: book, video and CD-ROM. Following the end of funding, other teachers in the state of New South Wales worked with the CD-ROM only, as part of personal or group professional development. The summary in this section is based primarily on the detailed feedback from 19 teachers who participated in the original trial (Watson & Moritz, 1997a).
The comments of teachers were based on an average of 14 hours spent reading the book, 5.5 hours watching the video and 15 hours using the CD-ROM. In rating the importance of the three media for their purposes, teachers ranked the three equally with averages of 4.3 on a scale from 1 to 5, with 5 as the most positive rating. In terms of ease of use, the video ranked as easiest (4.4) followed by the text (4.2) and then the CD-ROM (3.7). This is not a surprising result as many of the teachers had not accessed a CD-ROM before.
The positive responses to the total package often reflected the developers' objectives, noting the well-rounded package with background as well as classroom materials and appreciating the linking mechanism across media. Less positive comments were related to availability and familiarity with the technology. The linking facility, which was well received by most teachers, caused difficulty for a few.
With reference to Moore's text, teachers' backgrounds influenced their comments. Those who taught lower grades typically thought the first few chapters were good but that the later chapters were only relevant for senior secondary teachers. On the other hand some senior secondary teachers felt there were gaps in the detail needed for the level they taught. Those who were high school mathematics teachers found the material easy to read and could have handled a more rigorous treatment. The only criticism of the video material was that it was produced with an American voice-over and used examples from the American context. Overall the reaction, however, was positive.
The reaction to the CD-ROM was more varied, as might be expected. Some teachers experienced difficulties with the browser used for the hypertext or the plug-ins required to run Quicktime movies. The time required to load movies was a problem for some computers and the restricted size of pictures due to storage limitations prompted one teacher to characterise the movies as a gimmick. Among the requests for additional material on the CD-ROM were the following: a definitions section for teachers of lower levels, formal and conditional probability content for senior levels, discussion of media video clips in a similar fashion to newspaper articles, and closer linkage to state curricula. Most teachers, however, felt the coverage was comprehensive as it stood. Other comments included the need to use printouts to avoid reading from the computer screen or to take periodic breaks from the computer.
A significant aspect of the feedback related to this stage of the professional development program was teachers' reactions to the distance rather than face-to-face presentation of the package of materials. Having agreed to participate in this type of trial, generally teachers' reactions were positive. Those with previous experience involving distance learning appreciated the addition of Quicktime movies not included elsewhere. One teacher who missed the personal contact with others admitted choosing not to use email or telephone. In terms of suggestions for the improvement of contact between participants and developers, these often referred to face-to-face meetings, including half- day workshops at the beginning, a series of seminars, teleconferences, or clusters formed in local
Professional Development for Teachers of Probability and Statistics 285
areas where teachers would work together. The issue of learning styles was of concern for some teachers. They found it difficult to navigate
through the CD-ROM and became frustrated if lost or if they felt they might have missed some- thing. On the other hand, some teachers revelled in the opportunity to explore widely according to momentary whim and did not feel the need to read every "page" as in a book.
As the government funding body requested that accreditation be provided for any participant in the pilot program who desired it, the University of Tasmania offered a Graduate Certificate of Statistics Education for those who used the package of materials, completed a series of assignment questions from Moore's text, and wrote essays on the implementation of relevant sections of the materials in their classrooms. All teachers were given the opportunity to enrol in the program at either the graduate certificate or the masters degree level. This possibility was taken up by only three of the teachers in the pilot trials during 1997. Two of these availed themselves of the opportunity to use telephone, fax and email communication for questions, clarification, and some submission of assignments. The other teacher worked completely independently.
Except for two of the students enrolled in the Graduate Certificate, there was a disappointing lack of use of electronic mail, fax or telephone in asking questions about the materials. Almost all queries were of a technical nature. It would appear that while some teachers would have appreciated face-to-face meetings with the developer and other participants, they did not wish to substitute the other form of contact. This is an important point to be kept in mind in future programs.
Three variations on the method of introduction of the CD-ROM to teachers were trialed in the Australian state of New South Wales following the initial piloting described above. In the first setting, a mathematics consultant employed by the state education authority presented the CD-ROM to a group of teachers who had gathered together from a region for a one-day workshop. Teachers were then given a CD-ROM to take away and use. In the second setting the consultant and the developer presented a face-to-face one-hour seminar to 60 teachers at a state conference, inviting those interested to collect a CD and explore it further to provide feedback later. Of the 60 teachers, 12 took up the opportunity to explore the CD. In the third setting a similar presentation was made to a regional conference session of 16teachers with the consultant on the site and the developer connected to the group via a telephone link. A dialogue took place between the two presenters with questions to both from the audience. Feedback on the methods of presentation were positive in each case and illustrate possibilities for combining personal contact in the provision of a multimedia package.
4 The Future of Technologically-based Professional Development for Teachers of Probability and Statistics
The experiences of this extended professional development project, intended to cater for teachers of probability and statistics separated by distance, raise many issues to be considered when fu- ture professional development is planned. In some cases solutions will be suggested and in others dilemmas raised for consideration.
The proliferation of various technologies for presentation of content associated in some way with the teaching and learning of statistics presents many quandaries for those who provide professional development for teachers separated by distance. It appears that no one single medium offers ev- erything one might desire. Costs vary tremendously as do the learning preferences of individual teachers. If "live" contact is considered essential, as it is by Moore (1997) in the tertiary statistics teaching context, then budgets must be very large in situations where people do not congregate as on a university campus. For the professional development of in-service teachers, as opposed to their preservice university education, it must be realised that the density of participants in a region is a significant factor. Even in an area the size of England, much smaller than Australia where the program described here occurred, it was necessary to use distance methods of delivery to reach teachers of
286 J.M. WATSON
statistics (Gallimore, 1991).
If personal or viewing contact is sacrificed, available financial resources may be spent on collecting and presenting a multimedia package of materials. The quality of such a package may make up for the lack of face-to-face contact but there is the chance that the package may become dated if created in a fixed medium such as a CD-ROM. The provision of links to developers or tutors via electronic mail or to constant.1~ updated associated internet sites may help alleviate these difficulties. It may be, however, that some teachers are reluctant to avail themselves of the service. At the time of writing, the option of providing all of a package of materials on the internet is unrealistic because of lack of accessibility for many teachers, low speed of transfer of information, particularly digitised video, and problems with copyright permission for some materials.
Weighing up all the possibilities for professional development at distance trialed in Australia in recent years, the package based on a text, a video, and a CD-ROM appears to offer the most promise, perhaps if introduced in person and/or as part of a directed professional development program in a school system. This last possibility would appear to add impetus to the intended internal motivating factors in the package.
With the rapidly changing availability of resources which can be placed on CD-ROM and the upgrading of technology which for example promises to allow access to many more minutes of digitised video, it seems sensible to plan for repeated "editions" of CD-ROMs as for books, but with a shorter turn around between subsequent CD-ROM burnings. Several types of material used on the Australian CD-ROM appear likely to benefit from frequent upgrading. Links to internet sites from the CD-ROM sometimes undergo address changes and new sites of particular interest become available. In the case of the "Chance and Data in the News" site created with the Hobart Mercury newspaper the updated version is available via a link on the CD but this or a later version can also be included on a newly cut CD. Furthermore, new material for classroom activities can be placed on the CD-ROM, as publishers seek to gain publicity by allowing, say, 10% of their material to reach teachers in this fashion. The probability and statistics software used here, which is currently available only for Macintosh computers, may become available for PCs, or a replacement package may be found. As software becomes more sophisticated (e.g., Biehler, 1997) it is important to provide alternatives for teachers.
It will also be possible in the future to expand the digitised video segments of individual and grouped student responses. In relation to this project, for example, longitudinal interviews of the students four years later will provide insights for teachers into how understanding develops and how they might better facilitate students' learning. Extracts of interviews with teachers may also be included to introduce other perspectives on teaching to be considered. Classroom snippets, as illustrated by Hatfield & Bitter (1991), may be used to illustrate collaboration and other aspects of whole class behaviour. The increased speed of access and,storage capacity of CD-ROMs will present many similar opportunities.
There is certainly opportunity for inter-country cooperation in the production of future multimedia packages for the professional development of statistics teachers. The task is easier for countries that share the same language but there is the possibility to choose different text books and translate the material on the CD-ROM. It is possible to imagine a multimedia multilingual package. Choosing examples from curriculum materials in different cultures may be seen as an advantage or a disad- vantage depending on the teacher. As noted here some Australian teachers did not appreciate the American perspective and accent in some of the material. Other teachers, however, were pleased to have access to the Chance and Data sections of the NCTM Standards (1989) on the CD-ROM and appreciated the excellent motivating examples on the videotape despite the American context. It would seem important to include applications, curriculum documents, and classroom materials from all countries which participated in such a cross-cultural project. As was found in Australia, however, there will always be some teachers who are only interested in the needs of their local school system,
287 Professional Development for Teachers of Probability and Statistics
perhaps at a state level. This was catered for to some extent in Australia by providing the probability and statistics curricula for grades 10 to 12 in all states. At least one teacher, however, wanted the entire package to reflect her state's curriculum only so that she did not have to learn more than necessary. On the scale of production required to be economical today, particularly in a country the size of Australia, catering for such desires is an impossibility. It would be hoped that a state system would adopt the package and use its own consultants to choose the parts which were most relevant to the system's needs.
Overall, cross-country and cross-cultural collaboration in producing multimedia packages would appear to be the way of the future. Pooling resources, documentation, motivating examples, classroom examples, and student reactions may not only be an economical way of proceeding but may also increase cultural understanding. The mix of home country and other country examples may be very motivating for teachers and their students as probability and statistics become an important foundation for cross-curricular learning in many subject areas.
Because it is widely accepted that various media should be used in teaching statistics (e.g., Moore, 1997), they should also be part of the content of professional development for statistics teachers, whether that professional development is delivered face-to-face or at distance. The added complexity of using the new media to actually deliver all or a large percentage of the professi'onal development itself adds to the challenge for statistics educators. It becomes a meta-instructional task. This should not, however, stop statistics educators from accepting the challenge. There is definitely a place for the new technologies in providing professional development for teachers of probability and statistics.
Acknowledgments
The LUDDITE project described here was funded by the Department of Employment, Education, Training and Youth Affairs of the Australian Government and administered by the Australian Asso- ciation of Mathematics Teachers, Inc. (Project Director, Jeffrey P. Baxter). The profiling of teachers to determine professional development needs was funded by a research project of the Australian Research Council (No A79231392). Assistance for both aspects of the project was provided by Jonathan B. Moritz and Sue Anderson.
References
Arnold, S., Shiu, C. & Ellerton, N. (1996). Critical issues in the distance teaching of mathematics and mathematics education. In Inrerncttionctl Handbook c!fMuthemctrics Educcttion. A.J. Bishop, K. Clements, C. Keitel, J. Kilpatrick & C. Laborde (Eds.), pp. 701-753. Dordrecht: Kluwer.
Australian Education Council. (199 1). A nurionctl stctrement on muthemctrics,for Ausrruliun schools. Canberra: Author. Australian Education Council. (1994a). M(tthemcttics-+I curriculum profile,for Austrctlicln schools. Carlton, Vic.: Cuniculum
Corporation. Australian Education Council. (1994b). Mathemcttics-work sc1mple.r. Carlton, Vic.: Curriculum Corporation. Biehler, R. (1997). Software for learning and for doing statistics. Inrernctrioncll Stcttisricctl Review, 65, 167-1 89. Bishop, A.J., Clernents, K., Keitel, C., Kilpatrick, J . & Laborde, C. (Eds.). (1996). Interncltionul Hundbook c!fMuthemctric.r
Educurion, Dordrecht: Kluwer. Borovcnik. M. & Peard, R. (1996). Probability. In Inrertlcctionctl Hctndbook of Mclthemctrics Educcttion. A.J. Bishop, K.
Clernents, C. Keitel, J. Kilpatrick & C. Laborde (Eds.), pp. 239-287. Dordrecht: Kluwer. Bright, G.W., Berenson, S.B. & Friel, S. (1993, February). Teuchers' knowledge of.~rctrisrics pedagogy. Paper presented at the
annual meeting of the Research Council for Diagnostic and Prescriptive Mathematics, Melbourne, FL. Burrill, G. (199 1). Quantitative L~teracy: Implementation through teacher inservice. In Proceedings ofthe Third lnrernuriontrl
Conference on Tetcching Srcttistics. Volume I : School ctnd generctl lssues, D. Vere-Jones (Ed.), pp. 5@55. Voorburg: International Statistical Institute.
Burrill, G., Burrill, J C., Coffield, P., Davis, G., deLange, J., Resnick, D. & Siegel, M. (1992). Curriculum und evuluctrion standards for school mctthemtttlcs ttddendtt series. Grades 9-12: Datct ctnctly.ris ctnd srctrisrics ctcross the curriculum. Reston, VA: Nat~onal Council of Teachers of Mathematics.
Corwin, R.B. & Friel, S.N. (1990). Statistics Prediction and sampling. A unit oj study for grctdes 5-6 from Used Ntrmbers. Rectl dlttct in the clcts.rroom. Palo Alto, CA: Dale Seymour.
Department for Education (England and Wales). ( 1995).Mathematics in the national curriculum. London: HMSO.
288 J.M. WATSON
Finlay, E. & Lowe, 1. (1993). Chance and dutu: Exploring real dutu. Carlton, Vic.: Curriculum Corporation. Friel, S.N., Mokros, J.R. & Russell, S.J. (1992). Stutistics: Middles, means, und in-betweens. A unit of studyfor grades 5 4
from Used Numbers: Reul dutu in the classroom. Palo Alto, CA: Dale Seymour Publications. ~riersbn, D., Friel, S., Berenson, S., Bright, G. & Tremblay, C. (1994). Teach-Stat: A professional development program
for elementary teachers (grades k-6) in North Carolina, USA. In Internutionul Associution,for Stutisticul Education: Proceedings of the First Scientflc Meeting, L. Brunelli & G. Cicchitelli (Eds.), pp. 37-45. Perugia, Italy: University of Perugia.
Gal, I. & Wagner, D.A. (1992). Project STARC: Stutisticul reasoning in the clussroorn. (Annual Report: Year 2, NSF Grant No. MDR9G50006). Philadelphia, PA: Literacy Research Center, University of Pennsylvania.
Gallimore, M. (1 990). In-service training for teachers of statistics by distance learning. In Truining teachers to teuch stutistics, A. Hawkins (Ed.), pp. 233-249. Voorburg: International Statistical Institute.
Gallimore, M. (1991). The loneliness of the long distance statistics teacher. In Proceedings of the Third Internutionul Conference on Teuching Stutistics. Volume I: School und generul issues, D. Vere-Jones (Ed.), pp. 372-375. Voorburg: International Statistical Institute.
Glencross, M.J. (1987). Initial and in-service training of teachers of statistics: In-service training to assist junior high school teachers to implement a new syllabus in statistics. In Proceedings of the Second Internutionul Conference on Teuching Stcltistics, R. Davidson & J. Swift (Eds.), pp. 145-149. Victoria, BC: Organizing Committee, ICOTS.
Graham, A. (1987). Stutisticul investigutions in the secondury school. Cambridge: University Press. Greer, B. & Ritson, R. (1993). Teclching dutu handling with the Northern Ireland Muthemutics Curriculum: Report on survey
in schools. Belfast: Queen's University. Hatfield, M.M. & Bitter, G.G. (1 994). A multimediaapproach to the professional development of teachers: A virtual classroom.
In Prc?fessionul development,fbr teclchers of muthemutics. 1994 Yearbook, D.B. Aichele (Ed.), pp. 102-1 15. Reston, VA: National Council of Teachers of Mathematics.
Hawkins, A. (Ed.) (1990). Trclining tectchers to teuch stutistics. Voorburg: International Statistical Institute. Hawkins, A,, Jolliffe, F. & Glickman, L. (1992). Teuching stutisticul concepts. London: Longman. Holmes, P. (1980). Teuching stutistics 1 1 4 . Berkshire, U.K.: Schools Council, Foulsham Education. Jones, P. & Lipson, K. (1994). Training teachers to teach statistics in Australia. In Proceedings o f the Fourth Internutionul
Conference on Teuching Stutistics. Volume 1, National Organizing Committee (Ed.), pp. 99-104. Rabat, Morocco: National Institute of Statistics and Applied Economics.
Kinney, J. (1991). Teacher statistical education models. In Proceedings of the Third Internutionul Conference on Teuching Stutistics. Volume I: School dnd generul issues, D. Vere-Jones (Ed.), pp. 376-380. Voorburg: International Statistical Institute.
Konold, C. & Miller, C. (1992a). DutuScope [Computer program]. Amherst, MA: Authors. Konold, C. & Miller, C. (1992b). ProbSim [Computer program]. Amherst, MA: Authors. Landwehr, J.M. & Watkins, A.E. (1986). Exploring dutu. Quuntitutive Literucy Series. Palo Alto, CA: Dale Seymour
Publications. Lindquist, M.M. (1992). Curriculum und evuluution stundurds,for school muthemutics uddendu series, Grades K 4 : Muking
sense o f dutu. Reston, VA: National Council of Teachers of Mathematics. Lovitt, C. & Lowe, 1. (1993). Chance and dutu investigations. Volume 1 und k l u m e 2. Carlton, Vic.: Curriculum Corporation. Ministry of Education (1992). Muthemutics in the New Zeulund curriculum. Wellington, NZ: Author. Moore, D.S. (1991). Stutisttcs: Concepts und controversies. 3rd. edn. New York: Freeman. Moore, D.S. (1992). Stutistics: Decisions through dutu [Video tape]. Lexington, MA: CoMap. Moore, D.S. (1997). New pedagogy and new content: The case of statistics. Internutionul Stutisticul Review, 65, 123-137. Morley, A. (1983). Discussion of teacher-training papers. In Proceedings of the First Internutionul Conference on Teuching
Stutistics. Wlume I , D.R. Grey, P. Holmes, V. Barnett & G.M.,Constable (Eds.), pp. 302-303. Sheffield: Teaching Statistics Trust.
National Council of Teachers of Mathematics. (1 989). Curriculum and evaluation stundurds,for school muthemutics. Reston, VA: Author.
National Council of Teachers of Mathematics. (1991). Professionul stundurds,for teaching muthemutics. Reston, VA.: Author. Nemetz, J. (1983). Teaching statistics to 16-18 year olds: Dreams and reality. In Proceedings of the First International
Conference on Teuching Stutistics. Volume 1, D.R. Grey, P. Holmes, V. Barnett & G.M. Constable (Eds.), pp. 199-204. Sheffield: Teaching Statistics Trust.
Scheaffer, R.L. (199 1). The ASA-NCTM Quantitative Literacy Project: An overview. In Proceedings of the Third Internutionul Conference on Teuching Stutistics. Volume I: School and generul issues, D. Vere-Jones (Ed.), pp. 4 5 4 9 . Voorburg: International Statistical Institute.
Scheaffer, R.L. (1994). Enhancing elementary education through quantitative literacy. In Proceedings of the Fourth Internu- tiontcl Conference on Teuching Stutistics, Volume I , National Organizing Committee (Ed.), pp. 93-98. Rabat, Morocco: National Institute of Statistics and Applied Economics.
Scheaffer, R. & Bunill, G. (1987). Statistics and probability in the school mathematics cuniculum: A review of the ASA- NCTM Quantitative Literacy Project. In Proceedings of the Second Internutionul Conference on Teuching Stutistics, R. Davidson & J. Swift (Eds.), pp. 141-144. Victoria, BC: Organizing Committee, ICOTS.
School Mathematics Project. (1971). Further muthemutics I!Stutistics andprobability (Draft edition). Cambridge: University Press.
Shaughnessy, J.M. (1992). Research in probability and statistics: Reflections and directions. In Handbook of reseurch on mctthemutic.r teuching and leclrning, D. A. Grouws (Ed.), pp. 465494. New York: NCTM & MacMillan.
Shaughnessy, J.M., Garfield, J. & Greer, B. (1996). Data handling. In Interncltionul Ht~ndbook ofMurhemutics Educution A.J.
289 Professional Development for Teachers of Probability and Statistics
Bishop, K. Clements, C. Keitel, J. Kilpatrick & C. Laborde (Eds.), pp. 205-237. Dordrecht: Kluwer. Shulman, L.S. (1987). Knowledge and teaching: Foundations of the new reform. Harvurd Educational Review, 57, 1-22. Shulte, A.P. (Ed.) (1981). Teuching statistics und probability 1981 Yeurbook. Reston, VA: National Council of Teachers of
Mathematics. Steinbring, H. (1987). The interaction between teaching practice and theoretical conceptions-A cooperative model of
in-service training in statistics for mathematics teachers (Grades 5-10). In Proceedings of the Second lnternutionul Conference on Teuching Stutistics, R. Davidson & J. Swift (Eds.), pp. 15G155. Victoria, BC: Organizing Committee, ICOTS.
Velleman, P.F. & Moore, D.S. (1996). Multimedia for teaching statistics: Promises and pitfalls. American Statistician, 50, 2 17-225.
Watson, J.M. (1994a). Instruments to assess statistical concepts in the school curriculum. In Proceedings of the Fourth lnternutionul Conference on Teuching Stutistics. Volume 1, National Organizing Committee (Ed.), pp. 73-80. Rabat, Morocco: National Institute of Statistics and Applied Economics.
Watson, J. (1994b). Muths Workr: Teaching and learning chance und dutu. (assisted by W. Ransley) Adelaide: Australian Association of Mathematics Teachers.
Watson, J.M. (1996). Reflections on videoconferencing and hypertext as media for professional development. In Muthemutics educution in changing times: Reactive or prouctive, R. Zevenbergen (Ed.), pp. 165-176. Melbourne: Mathematics Education Lecturers' Association.
Watson, J.M., Baxter, J.P., Olssen, K.H. &Lovitt, C. (1996). Professional development at distance as an information technology enterprise. Asiu Pucific Journal of Teucher Education, 24, 139-146.
Watson, J.M. & Moritz, J.B. (1997a). The C&D PD CD: Professional development in chance and data in the technological age. In Muthemutics-creuting the ,future, N. Scott & H. Hollingsworth (Eds.), pp. 442450. Adelaide: Australian Association of Mathematics Teachers, Inc.
Watson, J.M. & Moritz, J.B. (1997b. December). Measuring teachers' reactions to new ureus of the curriculum: A case study ,from chunce und dutu. Paper presented to the Annual Conference of the Australian Association for Research in Education, Brisbane.
Zawojewski, J.S.(1991). Curriculum und evuluution stundurds,fir school muthemutics uddendu series, Grades 5-8: Deuling with dutu und chance. Reston, VA: National Council of Teachers of Mathematics.
HREF1 http://www.ni.com.au/mercury/mathguys/mercury.htm - Chance and Data in the News
Cette contribution porte sur la formation professionnelle de ceux qui enseignent les probabilitts et les statistiques au niveau de I'tcole (primaire et secondaire). Dans un monde ou le programme scolaire de statistiques change, les besoins en formation professionelle des enseignants et la technologie pour rtpondre j. ces besoins changent aussi. Cette contribution passe en revue les dtveloppements dans ce domaine et leurs perspectives. On prtsente aussi le dtveloppement d'un pack~gernultim~klia pour la formation professionelle des enseignants en statistique.
Mots clifs: Enseignement de la statistique; Formation professionelle des enseignants; Multimtdia; Technologie pour l'enseignement; Ptdagogie; Programme scolaire.
[Received November 1997, accepted May 19981
Recommended