Profitability and Ownership Structure of US Foreign Ventures:
Are Majority-Owned Ventures More Profitable Than Other Ventures?
Benjamin Gomes-Casseres, Mauricio Jenkins and Peter Zámborský
This version: July 2007. For discussion only. Please do not cite or copy without permission.
Abstract
This paper explores a striking empirical pattern that has gone unnoticed in the literature: U.S. multinationals’ majority-owned ventures abroad are substantially and systematically more profitable than their minority-owned and 50-50 joint ventures. On average, majority-owned foreign affiliates in manufacturing earned a 6.4% return on assets in 1977-2003, compared to 3% for minority-owned affiliates and 50-50 joint ventures. This pattern is found across many industries and regions. To explain these findings, we develop a new framework that views both the ownership structure and the profitability of a foreign venture as functions of the value created by the ownership-specific capabilities that the multinational company brings to the host country. Where these capabilities are strong, the multinational is likely to choose whole ownership; its profits are also likely to be highest in these activities. Where the firm’s capabilities are weak, it is likely to seek additional capabilities from local firms through a joint venture; these investments are also likely to yield lower profits. We test these theoretical predictions by constructing measures of the ownership-specific capabilities, i.e. relative international competitive advantage of US multinationals. These measures show a substantial association with the gap. We also test for the possible effects of size, age, foreign tax rates and non-dividend payments.
Key words: Joint ventures, FDI theory, profitability, diversification
© Benjamin Gomes-Casseres, Mauricio Jenkins and Peter Zamborsky, 2007
Benjamin Gomes-Casseres , Brandeis University, International Business School (please direct comments to him), [email protected]; Mauricio Jenkins, INCAE, [email protected]; Peter Zamborsky, Brandeis University, International Business School, [email protected].
2
1. Introduction
This research explores a striking empirical pattern that has gone unnoticed in the literature: The
majority-owned ventures abroad by U.S. multinational companies (MNCs) are substantially and
systematically more profitable than 50%-owned and minority-owned joint ventures of these
firms. The paper reports our empirical work to date on identifying and attempting to explain this
pattern using data from the U.S. Commerce Department. It presents summary tables,
comparative graphs, and statistical analyses that show this pattern across industries and
countries.
Although the performance of U.S. joint ventures abroad has received a notable attention in the
business press recently1, their profitability has not been rigorously studied in the academic
literature. Desai, Foley and Hines (2004) document the sharply declining propensity of
American firms to organize their foreign operations as joint ventures over the last two decades,
but focus on the determinants of the ownership structure rather than profitability.
Several previous studies have examined the determinants of profits of MNCs' foreign affiliates
[e.g., Leftwich (1974), Lupo et al. (1978), Connor and Mueller (1982), Lecraw (1984), Fairchild
and Sosin (1986), Landefeld et al. (1992), Kumar (1991) and (1994)]. None of these studies
discovered the empirical pattern we study.
1 Wall Street Journal has reported that dozens of international JVs in India, including those of Goldman Sachs Group and Merrill Lynch & Co., have bogged down, and in many cases dissolved (“Foreign Firms Find Rough Passage to India”, WSJ February 1, 2007). Financial Times reports on Anheuser Busch’s dual approach to the Chinese market, as unlike most foreign investors there, Anheuser decided to operate both a JV (with Tsingtao Brewery) and wholly owned ventures, (“Two-barrel Approach for Anheuser”, FT February 13, 2007).

3
We test several obvious hypotheses that might explain the pattern, including possible effects of
(1) subsidiary size, (2) subsidiary age, (3) host-country tax rates, and (4) subsidiary financial
structure. None of these factors explains the pattern.
We develop a simple framework using well-known elements of the theory of foreign direct
investment (FDI), the economics of project finance, and the resource-based view of the firm.
This framework is simple, but powerful. It even helps explain other puzzles in the fields of
international business and strategy, such as why expansion abroad seems to lead to “value
destruction” (Click and Harrison, 2000).
Our framework views both the ownership structure and the profitability of a foreign venture as
functions of the value created by the ownership-specific capabilities that the multinational
company brings to the host country. In sum, we begin by assuming that firms will invest in a new
project as long as the rate of return on that project exceeds their cost of capital. Second, we use
elements of FDI theory to argue that the return to a foreign firm doing a project in a host country
is higher than that of a local firm undertaking the same project. But this excess return may vary:
MNCs investing in “core” areas of their business can be expected to have strong resources that
exceed those of local firms; MNCs investing in more “peripheral” areas of their business are less
likely to have less dominant resources.
Based on these fundamental assumptions, the crux of our explanation is as follows. MNCs
investing in peripheral areas of their business will be more likely to share ownership with a local
firm in a joint venture, in an effort to shore up their resources with local resources. At the same
4
time, the MNC can naturally expect to earn lower returns on these resources than on investments
in its core business. As a result, the projects elected for joint ownership are likely to have lower
profitability than those in which the MNC preferred to keep whole ownership.
An alternative formulation of this framework is that the joint ventures we see are not by the same
MNCs that invest in the wholly-owned ventures, but instead are by smaller or less-capable rivals
that by necessity take on partners to match the strategies of their more-capable rivals. In this
view, the joint ventures are not peripheral projects inside the same firms, but instead are
subsidiaries of firms that themselves are in some sense peripheral in the industry. This
formulation of the argument can explain the same aggregate patterns that we see, and we have as
yet no way of distinguishing between the two formulations.
To test the predictions of our model we construct two measures of the competitive advantage of
US firms compared to foreign firms—a ratio of foreign sales of US MNCs to their domestic
sales, and a ratio of foreign sales of US MNCs to the domestic sales of all firms, including
foreign, in their industry at home. Industries that send a relatively large share of their sales
abroad should be industries where US MNCs can successfully challenge foreign rivals. If our
model is correct, this measure should be correlated with the profitability gap. Our analysis
confirms that in the sectors where the measures of ownership-specific advantage of US MNCs
are high, the profitability gaps also tend to be high.
The paper begins with an exposition of the empirical patterns in Section 2 that follows; we will
use graphical presentations extensively, because the profitability measures of interest vary subtly
5
across industries, regions, and time. Unfortunately, we do not have raw data that is detailed
enough to take account of these variations in econometric analysis; but the graphical patterns are
striking and, we believe, sufficiently clear to support our arguments. Following the exposition of
patterns, we develop a model to explain these patterns in Section 3, again using a graphical
method. Extensions of this model to related topics are in Section 4. In Section 5, we examine a
series of more-or-less traditional explanations for the profitability gap; none of these explain the
patterns we see. We also test here alternative explanatory factors that are in line with our model:
measures of the international competitive advantage of US firms. Section 6 concludes.
2. Patterns of Profitability and Affiliate Ownership
2.1. Measuring Profitability and Ownership. The measures of profitability we employ are
calculated from the Annual and Benchmark Surveys of U.S. Foreign Direct Investment Abroad
published by the Bureau of Economic Analysis (BEA).2 The BEA data groups all foreign
affiliates into two broad categories: “All” affiliates and “Majority-Owned” affiliates. Majority-
owned affiliates are those in which the U.S. voting ownership is higher than 50%, including
wholly-owned subsidiaries. The bulk of the affiliates that fall into the majority-owned category
are in fact wholly-owned subsidiaries;3 in our model, we term these cases wholly-owned
ventures. Those affiliates which are not classified as majority-owned by the BEA, we will
usually call “minority-owned” in this paper, even though they include 50-50 joint ventures.4 In
our model, we refer to these cases as jointly-owned ventures. Financial and operating data for
2 The Bureau of Economic Analysis (BEA), a subdivision of the U.S. Department of Commerce collects detailed operating and financial data of the entire universe of U.S. foreign
affiliates every five years approximately. These data are published in the so called Benchmark Surveys. In addition, the BEA collects a data for a sample of the universe every
year and publishes the results in the so called Annual Surveys. Under U.S. law every person or company having more than 10% of voting ownership in a foreign business, has to
fill the BEA surveys. Only data for non-bank affiliates of non-bank parents are used in this paper.
3 According to Mataloni and Fahim-Nader (1996), 90% of the majority-owned affiliates in the BEA Surveys are wholly-owned subsidiaries (88% and 85% if measured by assets
and sales, respectively).
4 Within our joint venture category, 54% of the affiliates are 50-50 joint ventures (40% and 44% if measured by assets and sales, respectively), according to Mataloni and Fahim-
Nader (1996).

6
these joint venture affiliates is calculated as the difference between the All Affiliates and
Majority-owned Affiliates in the BEA data.
We use return on assets (ROA) as the primary measure of profitability; it is calculated as net
income over book assets. It is important to note that this return is measured at the level of the
affiliate – it is not the return that is repatriated to the MNC, but the actual ratio of net income to
assets for the subsidiary’s business. Even so, the use of accounting profit ratios to assess
performance of companies has been criticized by, for example Schmalensee (1989) and
Bresnahan (1989). According to these critics, accounting measures may not adequately reflect
real economic returns. The discrepancy comes from the fact that accounting measures are
generally not adjusted for inflation, and that costs such as depreciation, research and
development, and personnel training are accounted for as period expenses (in order to minimize
tax liabilities), and therefore total assets may not reflect the real economic value of a firm's
investment at a particular point in time. In general these practices tend to overstate steady-state
accounting rates of return. Unfortunately, adjusting accounting data for these potential biases
requires detailed firm-level data, which is very seldom available. Since the BEA data we use
below do not provide any firm specific information,5 for the rest of the paper were are forced to
assume that most of these biases do not affect asymmetrically majority and minority-owned
foreign affiliates.6
The industrial organization literature has also addressed the question of which profit measure is a
better indicator of investor’s profitability, e.g., return on equity, return on assets, or price-cost
(sales) margins. In general, return on assets is preferred over return on equity since it gives an
indication of profitability regardless of capital structure (Schmalensee, 1989). Return on assets
5 Under U.S. law, the BEA cannot publish any information that permits the identification of specific firms or persons.
6 There is evidence that indicates that these biases are in fact important in BEA data. For example, when affiliate assets valued at historical costs are adjusted to current cost or
market value, rates of return change considerably (see Howenstine and Lawson (1991)). However, there is no reason to believe that they effect differently majority and minority-
owned subsidiaries.
7
is also preferred over sales margins because the latter one ignores the investment necessary to
generate a dollar of net profit (Salamon, 1985). However, sales margins are less prone to suffer
from inflation biases than return on assets.7 Hence, in the empirical part of the paper we use
return on assets (ROA); in tests not shown here we also used sales margins as alternative
measures of profitability of foreign affiliates.8
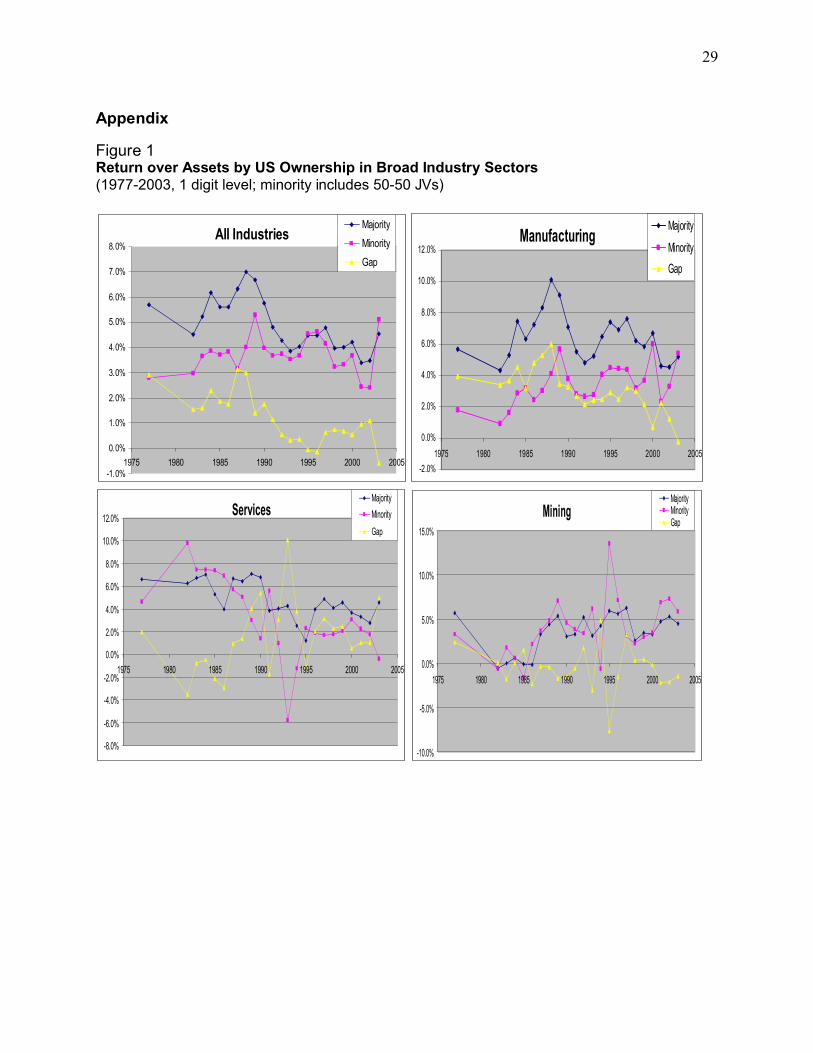
2.2 Profitability Gaps Across Industries. The ratio of net income to total assets (ROA) for
majority-owned and minority-owned affiliates in several broad industry sectors9 is shown in
Figure 1. In the graphs for All Industries, majority-owned affiliates are more profitable than
minority-owned affiliates in all years except for 1995, 1996 and 2003, with an average
“profitability gap” of 1 percentage point. But this gap is not the same for all sectors or time
periods. In the Mining sector, for example, majority and minority-owned affiliates show similar
returns over assets. The pattern in Manufacturing, which accounted for about a quarter to third of
US foreign affiliates, shows a robust profitability gap higher than 2 percentage points in all but
three years. The average gap in manufacturing was 3.4% percentage points in 1977-2003.
Services show a mixed pattern, with a substantial negative gap in the first half of the 1980s, but
an overall overage gap of 2 percentage points.10 While the trend in the services sector is towards
a larger gap, the data for manufacturing and for all industries show a gradual narrowing of the
gap over time. The gap for all industries had shrunk from 2.1% points in 1977-1990 to 0.5%
points in 1991-2003 and the gap for manufacturing had halved from 4.2% to 2.1% points during
the same time period.
7 In fact, if sales margins are calculated as earnings before depreciation and taxes over sales, the resulting measure is free of inflation biases (see Lupo et al. (1978)).
8 Since these ratios are calculated as total net income over total assets of all affiliates, they can be seen as weighted averages (weighted by assets) of the individual rates of return
of all the firms in the industry. Since sales margins (i.e., income after taxes/sales) showed very similar patterns, we include here only the figures for the returns over assets.
Some statistical tests used results for both return on assets and sales margins.
9 These sectors are at the 1-digit level in the BEA’s industry classification, which corresponds roughly to the 1-digit categories in the Standard Industrial Classification (SIC).10 Because the gap is always defined as the excess of majority ROA over minority ROA, we use the terms “positive” and “negative” to indicate the direction of the gap.
8
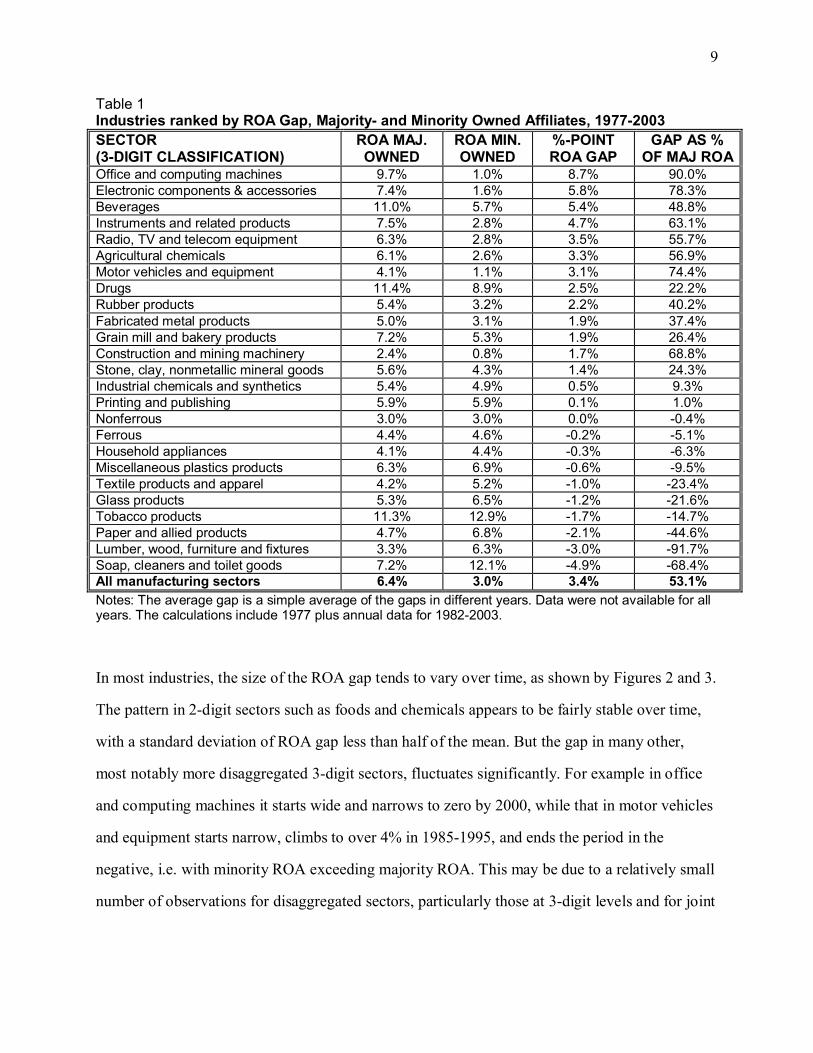
Within the manufacturing sector, there are important differences in the profitability gap across
different industries. The following table ranks industries by the average size of the gap in ROA
between majority and minority affiliates over the period 1977-2003. Two measures of this gap
are shown – the percentage point difference in ROA levels and the size of this difference as a
share of the ROA for majority-owned affiliates in the industry. The second measure is useful to
confirm that the percentage-point gap is not due to higher overall levels of ROA. On average,
manufacturing majority-owned affiliates earned a return on assets of 6.4% while minority-owned
affiliates earned 3.0% in 1997-2003. These ratios yield the gap of 3.4 percentage points shown in
the last line of the table, which is 53% of the 6.4% return to majority affiliates.
The industry ranking in Table 1 already begins to suggest where to look for underlying causes of
this pattern. The ranking by ROA gap appears to correspond to some well-known patterns of
investment of US MNCs – the industries at the top of the table are those that we traditionally
associate with high firm-specific advantages for US MNCs and those at the bottom are those that
we traditionally associate with lack of such advantages. We will pursue this point further in
explanation below. For now, however, it is important to realize that the ROA gaps do not reflect
the average profitability of US MNC investment, as might be suggested by a simple application
of the traditional FDI model. (On the overall profitability of FDI, see Connor and Mueller, 1982;
and Kumar, 1991 and 1994.)
9
Table 1Industries ranked by ROA Gap, Majority- and Minority Owned Affiliates, 1977-2003SECTOR(3-DIGIT CLASSIFICATION)
ROA MAJ. OWNED
ROA MIN. OWNED
%-POINT ROA GAP
GAP AS % OF MAJ ROA
Office and computing machines 9.7% 1.0% 8.7% 90.0%Electronic components & accessories 7.4% 1.6% 5.8% 78.3%Beverages 11.0% 5.7% 5.4% 48.8%Instruments and related products 7.5% 2.8% 4.7% 63.1%Radio, TV and telecom equipment 6.3% 2.8% 3.5% 55.7%Agricultural chemicals 6.1% 2.6% 3.3% 56.9%Motor vehicles and equipment 4.1% 1.1% 3.1% 74.4%Drugs 11.4% 8.9% 2.5% 22.2%Rubber products 5.4% 3.2% 2.2% 40.2%Fabricated metal products 5.0% 3.1% 1.9% 37.4%Grain mill and bakery products 7.2% 5.3% 1.9% 26.4%Construction and mining machinery 2.4% 0.8% 1.7% 68.8%Stone, clay, nonmetallic mineral goods 5.6% 4.3% 1.4% 24.3%Industrial chemicals and synthetics 5.4% 4.9% 0.5% 9.3%Printing and publishing 5.9% 5.9% 0.1% 1.0%Nonferrous 3.0% 3.0% 0.0% -0.4%Ferrous 4.4% 4.6% -0.2% -5.1%Household appliances 4.1% 4.4% -0.3% -6.3%Miscellaneous plastics products 6.3% 6.9% -0.6% -9.5%Textile products and apparel 4.2% 5.2% -1.0% -23.4%Glass products 5.3% 6.5% -1.2% -21.6%Tobacco products 11.3% 12.9% -1.7% -14.7%Paper and allied products 4.7% 6.8% -2.1% -44.6%Lumber, wood, furniture and fixtures 3.3% 6.3% -3.0% -91.7%Soap, cleaners and toilet goods 7.2% 12.1% -4.9% -68.4%All manufacturing sectors 6.4% 3.0% 3.4% 53.1%
Notes: The average gap is a simple average of the gaps in different years. Data were not available for all years. The calculations include 1977 plus annual data for 1982-2003.
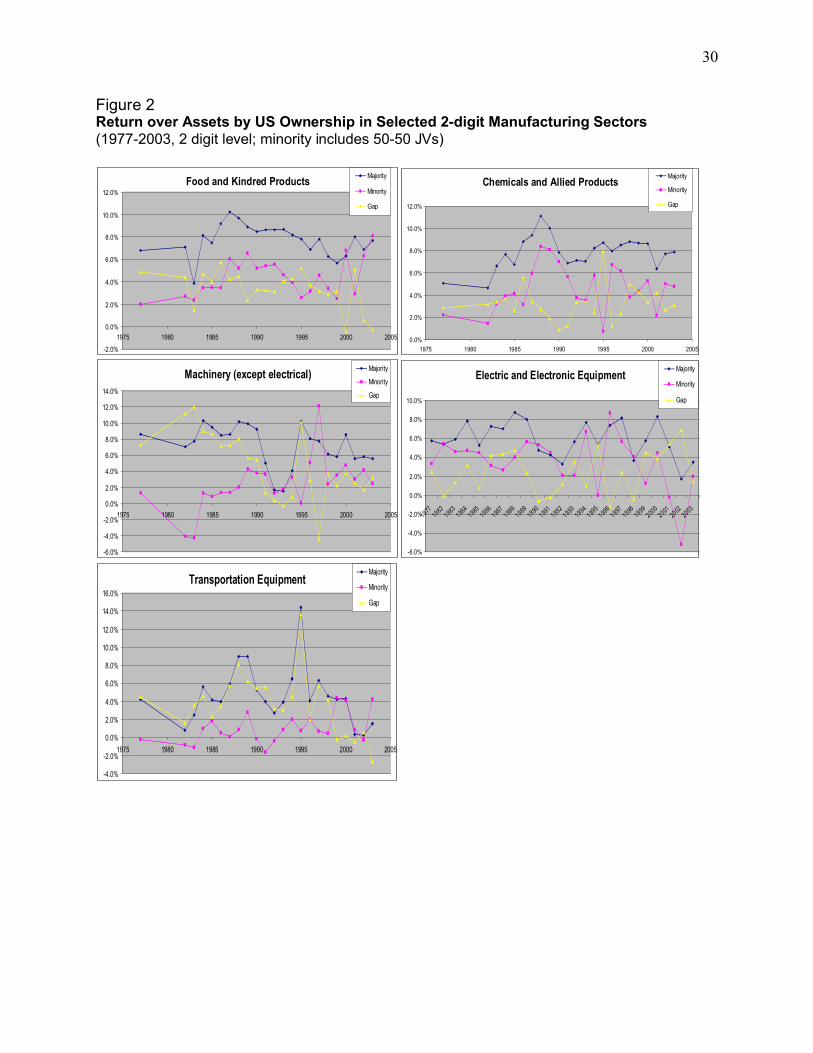
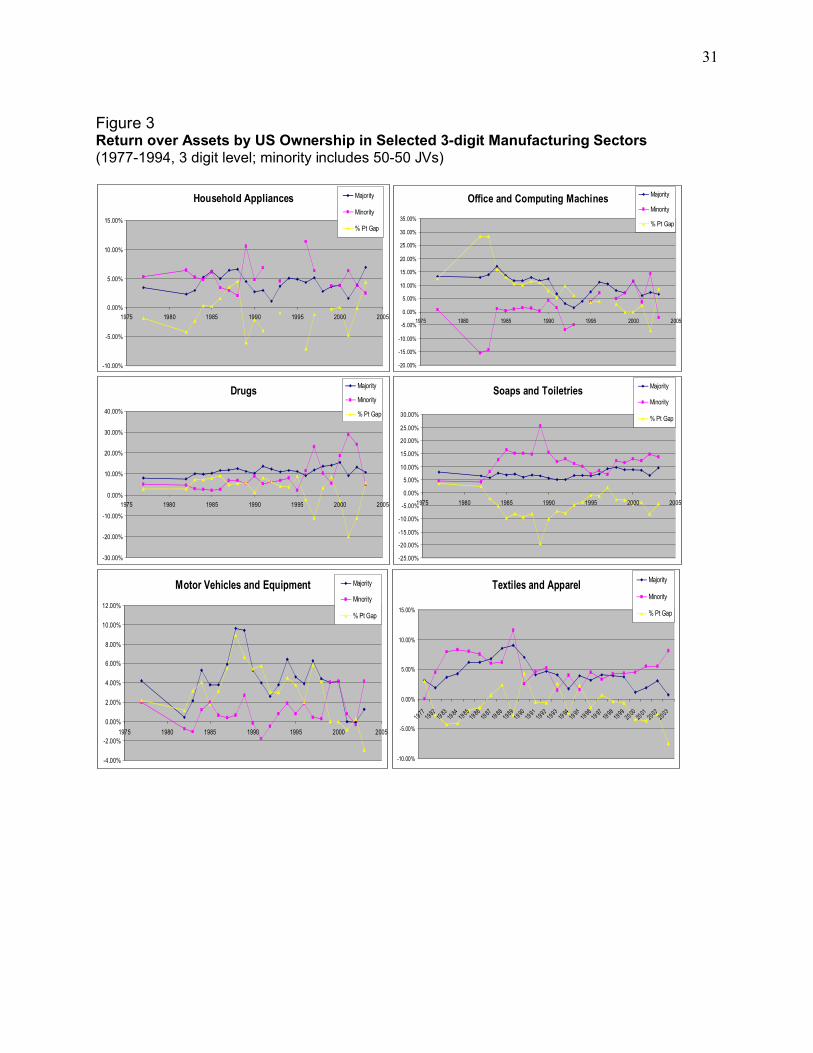
In most industries, the size of the ROA gap tends to vary over time, as shown by Figures 2 and 3.
The pattern in 2-digit sectors such as foods and chemicals appears to be fairly stable over time,
with a standard deviation of ROA gap less than half of the mean. But the gap in many other,
most notably more disaggregated 3-digit sectors, fluctuates significantly. For example in office
and computing machines it starts wide and narrows to zero by 2000, while that in motor vehicles
and equipment starts narrow, climbs to over 4% in 1985-1995, and ends the period in the
negative, i.e. with minority ROA exceeding majority ROA. This may be due to a relatively small
number of observations for disaggregated sectors, particularly those at 3-digit levels and for joint
10
ventures. Table 2 summarizes means and standard deviations of ROA and gap estimates and
provides data on the number of observations for majority-owned and other ventures.
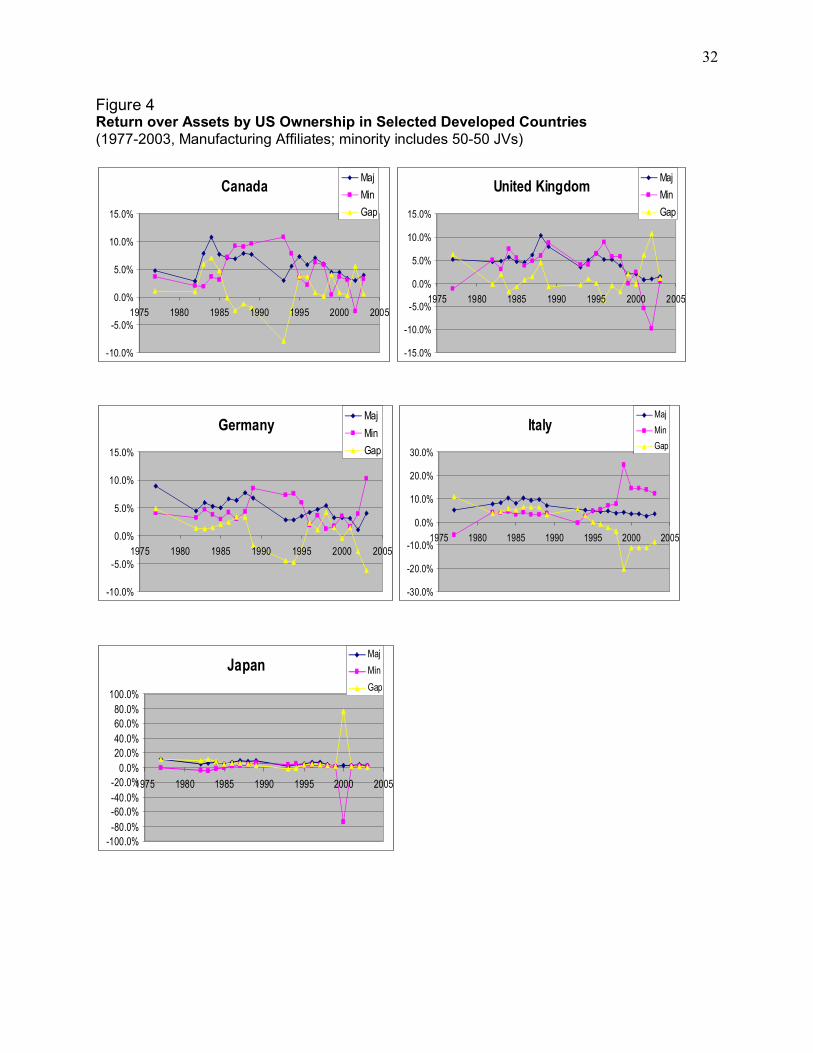
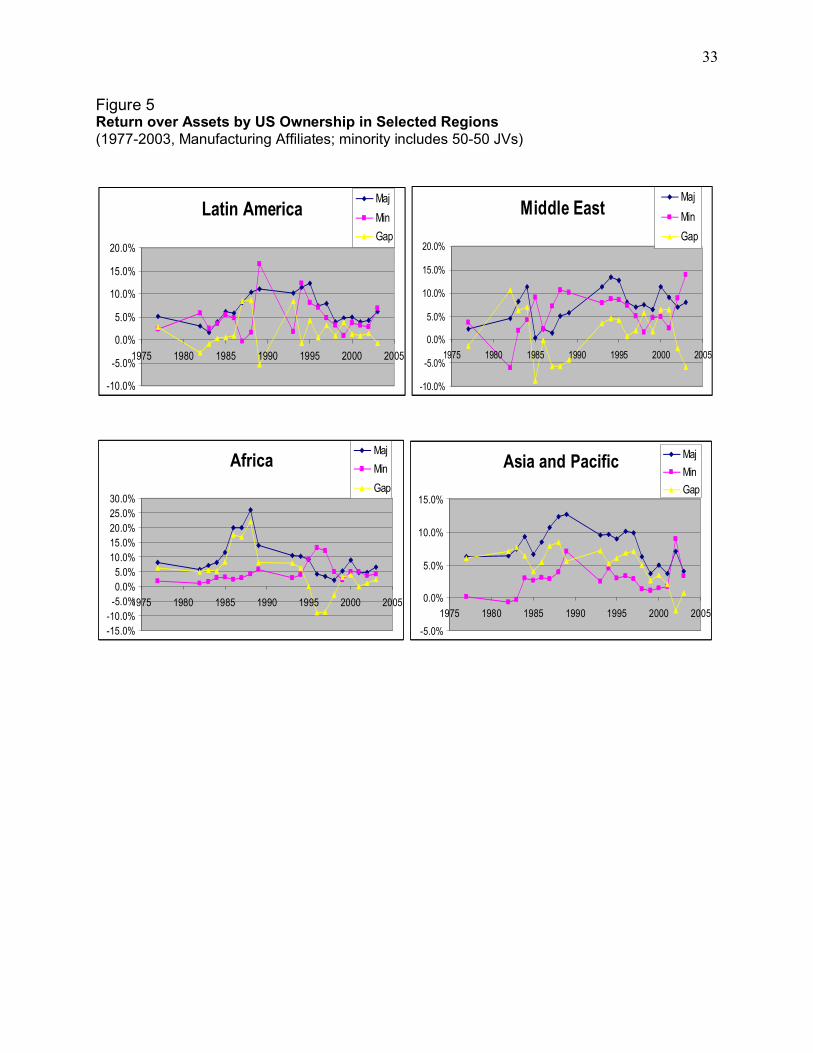
2.3. Profitability Gaps across Countries. An obvious problem that arises when comparing
profitability at the country level is that we are not able to control for industry characteristics that
may influence affiliate profitability.11 In an effort to control partially for these differences, and
to check the robustness of results in the last section regarding manufacturing affiliates, we
restrict our attention to manufacturing affiliates in the cross-country analysis.12 The country
patterns are shown in Figures 4 and 5. The analysis of profitability at the country level tends to
confirm the basic results at the industry level. In no case did minority affiliates earn consistently
higher ROAs than majority affiliates. The ROA gaps closed gradually over the period in many
countries, most notably in Italy, Japan and Asia-Pacific. In some regions—e.g. Latin America
and Middle East—the gaps remained roughly constant at close to zero.
2.4. The Stylized Patterns. The BEA data reveal the following stylized facts, which we will
begin to explain in the rest of this paper:
1. The overall profitability of majority-owned ventures is higher than those of other ventures in
most industries; we call this the profitability gap. Profitability is measured here as a return
on assets for the venture as a whole, not as the repatriated return to equity invested by the
MNC.
11 Since published BEA data contains industry observations (3-digit level) for some countries and regions, it may be possible to control for industry characteristics there.
However, many observations in these tabulations are not available because of confidentiality reasons. In the future we intend to incorporate the analysis of profit measures at this
level of detail if possible.
12 As argued before, inter-industry differences within manufacturing seem to be less important for subsidiary profitability than U.S. ownership, but even if they were not, the
analysis at the country level would still be warranted if the industry distribution of investment within a particular country is not too dissimilar for majority and minority-owned
affiliates.
11
2. This profitability gap is especially pronounced in those industries in which US MNCs have
strong firm-specific advantages. For example, majority-owned ventures in computers and
beverages are much more profitable than minority-owned joint ventures in those sectors; the
reverse is true in textiles and soaps.
3. The profitability gap had narrowed notably over time for the aggregate industry and
manufacturing sectors. The gap narrowed for most of the 3-digit, disaggregated
manufacturing sectors studied although it varied significantly over time. Only few of the
sectors (services, for example) showed a consistent trend of widening of the gap.
3. A Model of Affiliate Profitability
We develop below a model of FDI investment that we believe can explain the empirical patterns
discussed so far. Unfortunately, we do not yet have the firm-level data to test the details of the
model, or help us distinguish between variants of the model. Our argument will be presented
using the illustrations in Figures 6 through 10. Our explanation combines elements from three
strands of the literature that have developed separately: (1) the economics of project investment;
(2) the theory of foreign direct investment (FDI); (3) and the resource-based view of the firm.
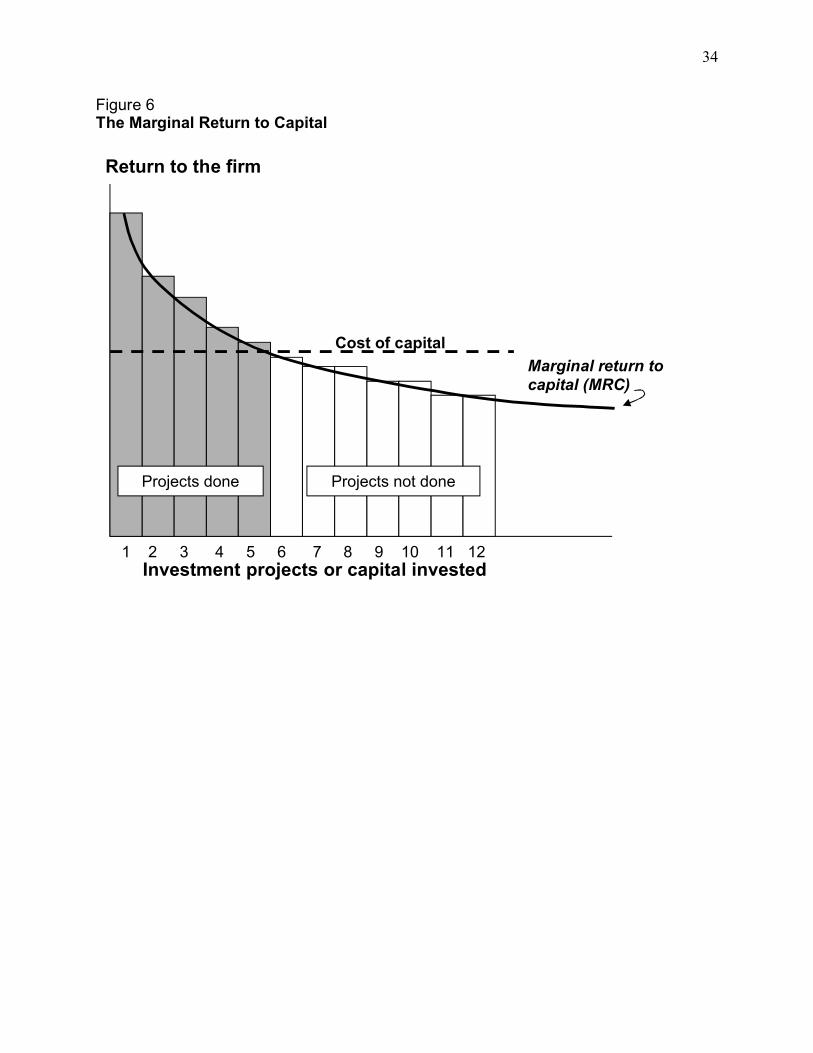
3.1. Economics of Project Investment. We begin by assuming that at any time a firm has a
choice among many investment projects and that it will choose to invest in those projects that
yield a return higher than its cost of capital. If these projects are arranged in descending order of
return, they will determine the marginal return to capital (MRC) for the firm, as shown in Figure
6.13 To the left of where this curve crosses the cost of capital curve, the firm will invest; to the
13 We use return on investment here without distinguishing between assets and equity. In tests not shown here we found that the profitability gap pattern is not sensitive to how profitability is measured and is independent of financial structure of subsidiaries. For the sake of this argument, therefore, we simply assume that all projects are financed from equity and that return on investment is the same as return on assets.

12
right it will not. These assumptions are consistent with traditional project finance and do not
reflect any special conditions in FDI.
3.2. Marginal Returns in FDI. There is no reason why this simple project-finance model would
not also hold for investments across borders. In other words, a firm will face multiple investment
projects in a given host country that, if arranged by descending order of return, will determine its
MRC in that host country. Whether or not these foreign returns are higher or lower than returns
in the home country is not material to our argument. The theory of FDI does not require that
foreign returns be lower or higher than home returns, though it is often informally assumed that
returns abroad are lower than in the home market.
The theory of FDI does require that the returns to the MNC be higher than the returns to local
firms, because the former must overcome the “liability of foreignness.”14 In other words, the bare
returns on the project in the host location must be higher for an MNC-project than for a project
undertaken by a local firm, because the MNC has added costs of transferring technology,
communicating at a distance, and overcoming lack of knowledge and contacts in the host
economy.
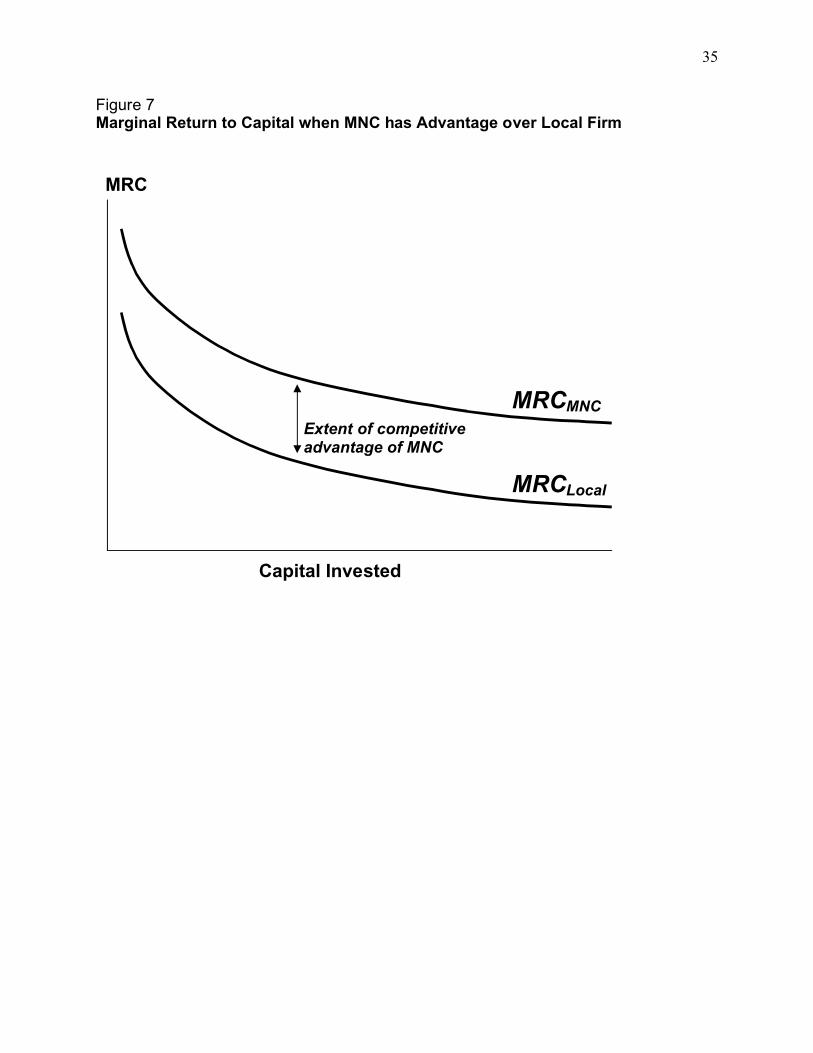
As a result, FDI theory predicts that if we see an investment by a foreign firm, it must be because
that firm has some sort of competitive advantage over local firms. In our framework, we can
illustrate this in by allowing the MRC curve for the MNC to be higher than that for the local
firm, as shown in Figure 7. The spread between these two curves indicates the extent of the
competitive advantage of the foreign firm – when the MNC has great advantages, its MRC will
be higher, relative to the local firm’s, than when its advantages are thin.15
14 The earliest discussion of this liability is in Hymer (1966) and Caves (1972); the point is well established in the literature; see a recent review in the special issue of Journal of International Management (2002).15 We are assuming implicitly that the cost of capital to MNCs and local firms are the same. This is usually not the case, but there is no need to complicate the model with such differentials. One can think of this assumption as stemming from an efficient market for international financial capital – by no means a reality, but an assumption that
13
A corollary argument is that the MNC must have firm-specific resources that produce advantages
over the local firm. Traditionally, the FDI literature has identified resources like proprietary
technology, brand-name, management skills, access to export markets, and such as the kind of
firm-specific resources that could grant an MNC advantages over local firms.16 In our model, the
MNC can be said to have firm-specific advantages that are transferable to the host country
through ownership and that will yield then in that environment a return higher than what local
firms could earn on their own resources.
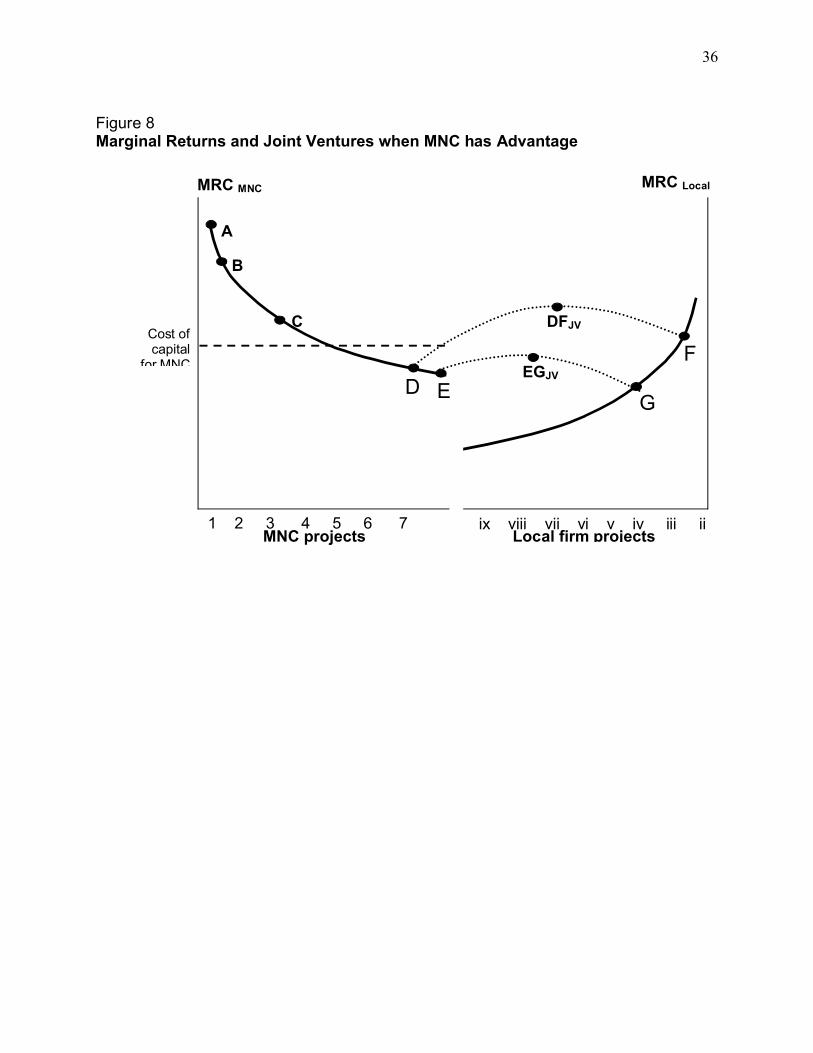
3.3. Marginal Returns and Ownership Structures. The discussion so far has assumed
implicitly that the foreign firm and local firm exploit their competitive advantages through
wholly-owned ventures. But the model also allows us to see when a joint venture between the
two firms would be attractive. This is shown in Figure 8.
The MRC curves for MNC and local firm are shown in separate panels in Figure 8; the directions
of the horizontal axes are reversed in the two panels. The lettered locations represent projects
that rely on specific bundles of resources of the each firm. Projects A, B, and C are all above the
MNC’s cost of capital and so can be done solo by the foreign firm. Projects A and B, especially,
can be said to draw on the firm’s “core” capabilities – they provide the highest returns to the
proprietary advantages of the firm. Projects D and E are below the cost of capital and so would
not be done, at least not solo; these projects are more “peripheral” to the firm – they may draw
only marginally on its key proprietary advantages.
focuses attention on firm-specific factors that are even less likely to be transferred across borders through perfect markets.16 In Dunning’s eclectic framework (1977), these are “ownership advantages.” For now, we leave aside his “internalization advantages,” which refer to the factors that lead the firm to internalize the transfer of these ownership advantages rather than exploit them through contracts. Since we do not have evidence on contractual transfers, we are in effect assuming that the firm-specific advantages in our model require internalization if they are to yield competitive advantage abroad.
14
Even so, when combined in joint ventures with resources that the local firm would use for
projects F and G, the firm’s peripheral bundles D and E would yield returns DF and EG. Of
these, DF lies above the firm’s cost of capital, and so it would pay to devote D to that project (D
otherwise would have earned a lower return). The key to this argument is, of course, the concave
form of the dotted line indicating the joint ventures’ returns. In our framework, these curves must
be concave if a firm is ever going to do a joint venture. Put differently, if a joint venture
promises returns that are below the return to each firm’s private use of the resources it
contributes to the venture, then the firm would not do the joint venture. This concave form
represents the “value creation” or “synergy” of the joint venture.
3.4. Varying Advantages of MNC and Local Firms. The situation in Figure 8, in which the
MNC has competitive advantages over the local firm, would lead to investment in three projects
– A, B, and C would be wholly-owned by the MNC and DF would be a joint venture. It should
be evident how this leads to the empirical patterns we saw earlier: the average return on A, B,
and C (all wholly-owned projects) are higher in this situation than the return to DF (a joint
venture project). Furthermore, the profitability gap between the wholly-owned and jointly-owned
ventures increases with the relative advantage of the foreign firm – precisely what we saw in the
data, most strikingly in the ranking in Table 1. As the relative advantage of the foreign firm
increases, the MNC’s MRC curve will rise higher on the left, so that the distance between A and
B and DF will increase.
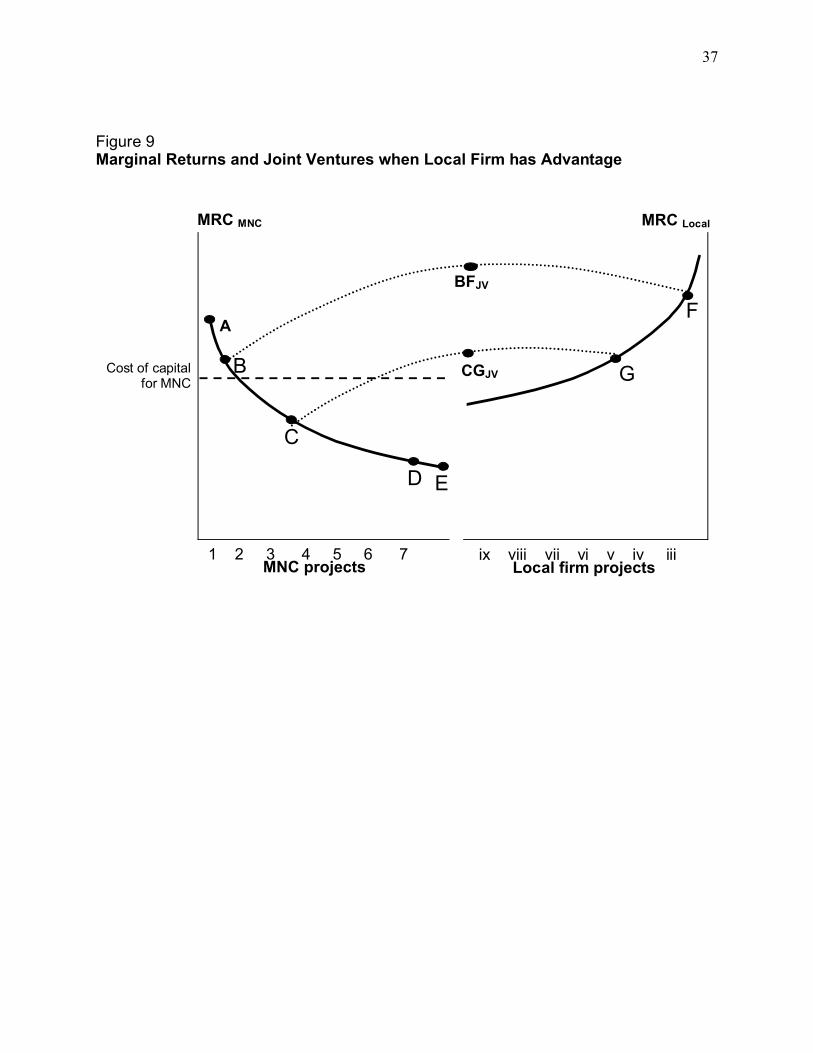
It is also easy to see from this graphic model when the profitability gap might be reversed, that
is, when the average return on wholly-owned projects would be lower than on joint ventures.
That situation is shown in Figure 9. In this illustration, the local firm has competitive advantages
over the foreign firm – not the usual assumption in the FDI literature, but one logically consistent
with our model. In this situation, it will again pay for the foreign firm to invest in some wholly-
owned projects (such as A), but the returns on a joint venture that draws on strong local
15
capabilities (BF) may in fact be higher than the return to the solo venture. Why would the local
firm be willing to form this joint venture? Again, only because of the concave form of the dotted
line – the local firm will get a higher return in BF than if it used its F resources solo.
When might a situation like this arise? Two conditions must apply. First, the local firm does have
all the resources needed to compete successfully and could keep the foreign firm out of the
market, particularly considering the liability of foreignness. But the foreign firm might have
some resources that, by themselves, might not be sufficient to sustain a wholly-owned
investment but that could add value to a local venture. Examples might be the very industries in
which we saw “negative” profitability gaps – soap, toiletries, textiles, and so on. The local firm
might be able to do fine by itself, but an MNC might bring value with a brand-name or chemical
formula.
By varying the relative positions of the MRC curves, therefore, we can generate the full range of
profitability gaps shown in the data. Large positive gaps stem from strong MNC advantages;
negligible gaps suggest parity; and large negative gaps stem from weak MNC advantages. We do
not observe the extreme situation in which local firms so dominate foreign firms that there is no
FDI at all, for obvious reasons.
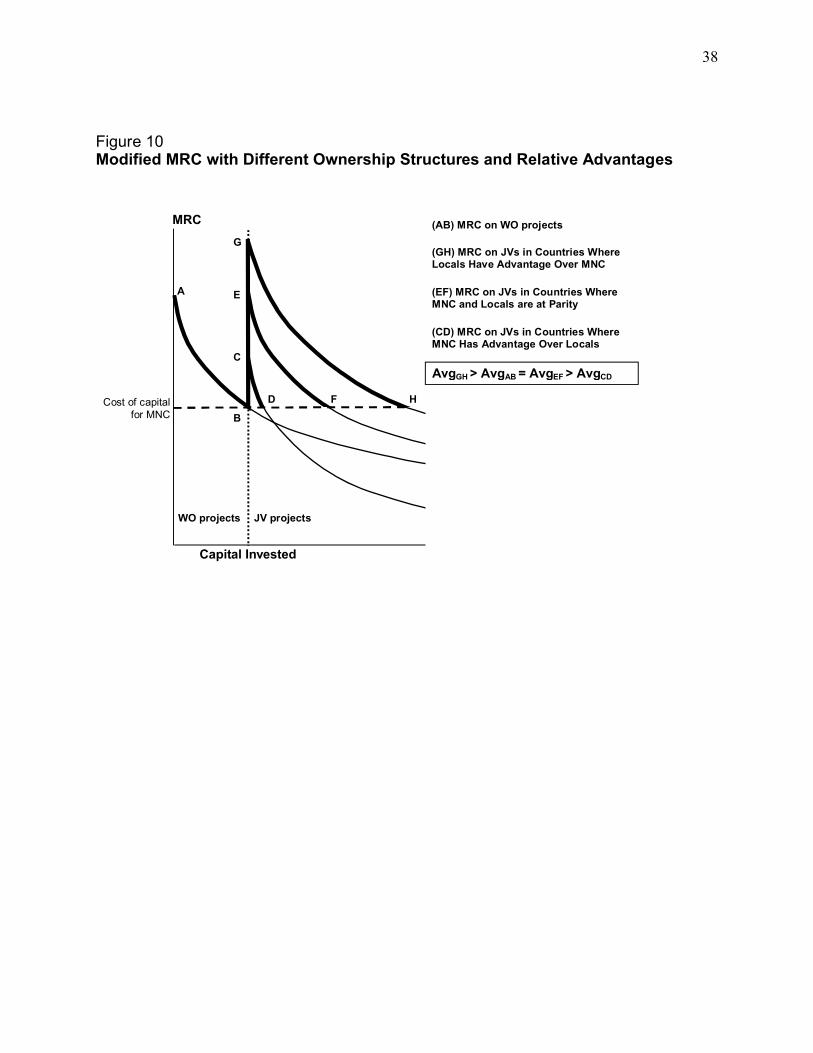
The full range of possibilities for a given MNC is shown in Figure 10, which represents a
modified MRC curve that takes into account the possibility of joint ventures with another firm
with varying capabilities. The MNC can invest solo along the line AB; below B, it will not
invest. But when offered the option of forming a joint venture with another firm, it may find
projects to the right of the vertical line that are above its cost of capital. When the potential
partner has only mildly attractive capabilities, these joint ventures can only achieve returns along
CD; in this case, the average return of the wholly-owned ventures will exceed that of the joint
ventures. When the firms are at parity, the return to joint ventures should be equal to returns on
16
wholly-owned ventures.17 Finally, when the potential partner has capabilities that far exceed the
MNC’s, then the joint-venture returns in GH will on average exceed the solo returns.
3.5. Profitability Gaps as an Indicator of Relative Advantages. If this model reflects reality,
then one can interpret the profitability gap in a particular industry and country as the “revealed”
competitive advantage of U.S. firms compared to local firms. The data discussed above
correspond roughly with such an interpretation. For example, as noted already, it is reasonable to
argue that the competitive advantage of U.S. firms is strongest in computers and
pharmaceuticals, lowest in soaps and textiles, and moderate in such sectors as machinery.
In addition, we saw that the profitability gap widened and narrowed over time in some industries
and countries. These trends might indicate changes in the revealed advantages of U.S. firms
compared to local firms. The narrowing profitability gap in Europe and Japan might reflect this.
On the other hand, the gap in Asia-Pacific was seen to grow over time; this would seem to
contradict the fact that capabilities of local firms in such countries as Taiwan and South Korea
have increased since the 1970s. One explanation for the observed pattern may be the level of
aggregation of the data – the Asia-Pacific region also includes an increasing share of FDI into
countries that have yet to develop strong local industries; as FDI into such countries grows, the
average profitability gap for the region will increase. More disaggregated country and industry
data would be needed to test this explanation.
3.6. Profitability Gaps and Host Government Policies. The argument that profitability gaps
reflect revealed competitive advantage does assume that the firm is free to invest in whatever
projects it wishes. What if there are restrictions on foreign investment, especially ownership
17 Of course, each firm only gets a share of these returns, but they also contribute only a corresponding share of the assets. One way to visualize this case of parity is to think about the two firms as identical – mixing and matching each other’s resources then does not yield more, or less, than using one’s own resources.
17
restrictions?18 In such cases, the firm in Figure 8 may simply not be allowed to invest in A, B,
and C, or at least will have such restrictions placed on it that these investments will yield lower
returns. On the other hand, the firm will be encouraged to invest in DF, and indeed may receive
incentives that will increase the return to that joint venture. It is easy to see that the result will
then be a smaller profitability gap than without host-government restrictions, even in situations
when the foreign firm enjoys competitive advantages.
This argument may explain the negative and fluctuating profitability gap for Mexico in Figure 5,
a country well known for having had strong disincentives for wholly-owned foreign investment,
at least until recently. (Interestingly, the gap turns positive from 1990 onwards.) The host-
restrictions argument may also explain the negative gaps in Petroleum and Mining in Figure 1;
these are industries in which many host governments have long restricted wholly-owned
investments or have found ways to extract profits from wholly-owned affiliates. As a result, they
may have equalized the returns to wholly-owned and jointly-owned ventures, to the extent that
MNCs in these industries have become indifferent between these entry modes. Finally, the
reversal over time of the profitability gap in Services (Figure 1) is intriguing – it suggests that
before the 1990s U.S. firms were either barred from wholly-owned investments in such fields or
did not enjoy much advantage; later this changed.
3.7. An Alternative Formulation of the Model. Our model describes project choices by a
single firm. From this perspective, projects along the MRC curve in Figure 6 represent
successively less attractive ways of using the firm’s proprietary advantages. The MRC is then the
investment frontier for a given firm and the resulting wholly-owned and jointly-owned ventures
are then different projects in the firm’s portfolio.
18 The investment calculus in countries with host-government restrictions is systematically different from that in countries without such restrictions, as explained in Gomes-Casseres (1990).

18
A different formulation of the model would see the MRC curve as representing the investment
frontier for an industry or collection of firms; the projects underlying this curve might then be
investments by rivals in the industry. In this view, the leading firms would have the highest
returns on their assets in a given industry, followed by second-tier rivals with lower returns.
In this interpretation of Figure 8, it would be the second-tier firms that would form joint ventures
and the leading firms that form wholly-owned ventures in the industry. Indeed, there is some
evidence that small firms in an industry are often compelled by competition to follow their larger
rivals abroad and that they then often need joint ventures to enter markets in which they could
not succeed alone (Gomes-Casseres, 1989).
The aggregate data and stylized facts discussed above are consistent with this formulation too,
and we have as yet no way to discriminate between the explanations. Because the data we have
are at the industry level (or country level), we do not observe single firms and cannot disentangle
average returns for the industry from average returns for firms in the industry. One implication of
the industry-MRC model may be that the steepness of the MRC curve depends on industrial
organization variables, such as the distribution of firms in the industry.
4. Extensions of the Model
4.1. Diversification and Multinationality
Our model has one more attractive feature that makes it compelling. With minor revisions, it can
be used to explain two other types of empirically-observed profitability gaps, one of which has
long been a puzzle in the strategy literature.

19
There is a long literature on the “diversification discount,” by which is meant the empirical
observation that firms that diversify outside their core business tend to have a relative lower
market value, all else equal, than those which don’t diversify. Usually, this discount is measured
by Tobin’s Q, which is roughly the difference between the market capitalization of a firm and the
total book value of its assets.
Our framework is readily modified to explain this puzzle. Firms that invest in projects outside
their core will receive a lower return on those projects than on their core projects. As they do
that, their average return on assets will decline, leading to a lower market capitalization, holding
constant the value of assets. Indeed, the business-level data in a study of conglomerates by
Maksimovic and Phillips (2002) seems consistent with this approach.
A more recent observation in the finance literature is the “multinationality discount,” also
measured by Tobin’s Q. The pattern here is that the value of the firm (again relative to its book
assets) declines as it invests in more countries. This observation seemed to fly in the face of
claims about the positive role of global strategies. Among the first papers to explore this was
Click and Harrison (2000); in Denis, Denis, and Yost (2002) the multinationality discount is
explicitly compared to the diversification discount and found to be of roughly equal magnitude.
Curiously, neither of these papers finds a satisfactory explanation for their strong empirical
results. Denis, Denis, and Yost (2002) even conclude that the costs of globalization outweigh the
benefits.
Our framework would suggest otherwise. First, it should be easy to see how the model applies to
investment outside the home country. The same liability of foreignness discussed above would
mean that, all else equal, projects outside the home country would carry a lower return than
projects that use the same firm capabilities inside the home country. An additional reason for
lower returns abroad might be that the firm’s home-grown capabilities may, in fact, not be fully

20
appropriate to the foreign environment. In either case, the average return to projects abroad
would be lower than the average return to domestic projects. As a result, for a given level of
assets, the net income of the firm would be lower, leading to a lower market capitalization.
But this does not mean that it is destructive for the firm to invest abroad (or, indeed, for firms to
diversify, in the preceding puzzle). Even in the foreign investments, the return to investment
exceeds the firm’s cost of capital – the price that shareholders and debtors ask for their money.
As a result, the firm is still creating value for these investors, even if it is reducing its excess of
market over book value.
4.2. Value Destruction in JVs? We do not have data to test whether Tobin’s Q would rise or fall
as firms invest in relatively more joint ventures. But we bet it would fall. The data suggest
strongly that average profitability of a firm’s assets would decline the more it invests in joint
ventures; as argued above, this would lead to a decline in the excess of market over book value.
But, as above, this need not be an irrational move for the firm; nor would it have to be justified
by “strategic” or non-financial arguments. The rationale for such investments is the same as the
rationale for diversification and for foreign investment – to exploit more fully the firm’s
capabilities. As long as the investments outside the core continue to yield returns over the firm’s
cost of capital, they create value for the firm’s owners.
But, inside the firm, managers would be well-advised to apply a different yardstick to their joint
ventures than they do to their wholly-owned ventures. They cannot expect the same average
return across these organizational forms, much like they would not expect the same return for a
foreign investment and a project in the firm’s home base. In this respect, popular reports that
alliances are more profitable than wholly-owned ventures are downright misleading. Better to
recognize that joint ventures and other alliances are used when the firm cannot go it alone, and
that it cannot expect to get its choice returns in these cases.
21
The same is true for every other project that in some way extends the firm’s capabilities into a
new area. Here, we tackled the puzzle of profitability gaps among organizational forms; we have
seen that the approach applies equally well to profitability gaps among industrial or geographic
portfolios.
5. Empirical Tests for Possible Determinants of the Profitability Gap
We examined a number of possible explanations for these patterns using variables that previous
researchers have found were important to MNC profitability. Due to the lack of detailed firm-
level data, we have to limit our analysis to the effects of affiliate size, age, foreign income tax
rate and non-dividend payments. No of these factors was sufficient in explaining the gap. In line
with our model, we propose to use the international competitive advantage of US multinationals
as an explanatory variable for the profitability gap. We use the ratio of foreign sales of US MNEs
to their total US sales, and a ratio of foreign sales of US MNEs to total sales in their sector in the
US, as measures of this revealed competitive advantage of US firms compared to local firms.
5.1 Effects of Affiliate Size. One explanation for the profitability gap may be that majority-
owned affiliates are larger than minority-owned ones and benefit from economies of scale. But
our tests using affiliate assets as well as sales as measures of size, indicate that majority-owned
affiliates in fact are not systematically larger than minority-owned affiliates; on the contrary, the
latter seem on average slightly larger than the former. The average size of assets of a majority-
owned affiliate in manufacturing in 1989 was $59 million compared to $98 million for a
minority-owned affiliate; the story for size of sales is similar, and the differences for both
measures of size are sustained over time.

22
To test the significance of this finding across industries, we performed a test for the difference in
mean size across all 32 manufacturing industries (3 digit level) for which we have data. In all the
cases, the null hypothesis of majority-owned and minority owned-affiliates having similar sizes
cannot be rejected (tests not shown in this paper).19 We performed similar tests for data
aggregated at the country level and obtained fundamentally the same results (i.e., that minority-
owned affiliates are not systematically smaller than majority-owned ones). Because of space
considerations we do not report the results here.
We also ran a regression of the difference in profitability on differences in size of foreign
affiliates in manufacturing industries (not shown in this paper). Here too, differences in size do
not explain differences in profitability. In all the regressions, the coefficient of the size variable
is either insignificant or has the wrong sign. The overall explanatory power of the regressions is
also very poor. (Regressions using country-level data gave very similar results.) Overall, these
results lead us to conclude that the positive relationship between U.S, ownership and profitability
cannot be explained by differences in affiliate sizes.
5.2. Effects of Affiliate Age. Another explanation for the profitability gap may be that majority-
owned affiliates are older than minority-owned ones, and so benefit from economies of
experience or depreciated assets. Since we do not have access to information regarding the
average age of affiliates, we again cannot test directly whether the difference in profitability is
caused by differences in age. However, based on an examination of how assets and sales of both
affiliate types have grown over time, we believe that this explanation is highly unlikely.
19 A caution note is in order here. Using industry averages to compare firm sizes is not ideal since it is well known that distributions of firm
sizes are highly skewed (Schmalensee (1989)). Thus, by using industry averages to compute our tests, we are implicitly assuming that the
distribution of firm sizes within a particular industry is not too dissimilar for majority and minority-owned affiliates.
23
Since the second half of the 1980s, investment in majority-owned affiliates has grown much
faster than investment in minority-owned affiliates, suggesting that the average age of assets in
majority-owned affiliates should be lower. Thus, if age and profitability are positive correlated,
as some researchers have suggested, the univariate tests for differences in mean returns that we
performed earlier are probably biased towards acceptance of the null hypothesis of equal means.
In fact this constitutes a plausible explanation for the reduction in the statistical significance of
our mean tests during the 1990s. In short, we do not believe that the positive relationship
between U.S. ownership and affiliate profitability is caused by differences in the age of the
subsidiaries.
5.3. Effects of Foreign Tax Rates. A third possible explanation for the profitability gap may be
that regulations in host countries may influence accounting practices for foreign subsidiaries and
so the accounting measures of profitability that we use. In particular, one can expect profits from
majority-owned subsidiaries to be more easily shifted to locations with lower tax rates, which
would then show higher profitability than otherwise. (Here it is important to remember that most
of majority-owned affiliates in BEA data are in fact wholly-owned subsidiaries.)
To test for such effects, we plotted the profitability gap against the effective foreign tax rate of
host countries in 1989 (from Desai and Hines, 1996). There appeared to be a tendency for the difference
in profitability to decline as the foreign tax rate increases. To further test this apparent
relationship, we ran a regression of the profitability gap on the foreign tax rate (not shown in this
paper). The coefficients of the tax variable are negative significantly different from zero,
indicating that the profitability gap was smaller in countries with relatively higher tax rates. That
is what one would expect if MNCs were able to shift profits of wholly-owned ventures from
high- to low-rate countries.
24
However, this relationship needs to be corroborated for other years and for more countries (we
have tax rates for about 33 out of the 50 or so countries for which we have return data). In
particular, we suspect that high-rate countries also share other characteristics that may influence
FDI ownership policies, as discussed later. And, regardless of this possibility of excluded
country factors, we do not find that the tax rate effect is large enough to explain all the difference
in profitability between majority and minority-owned affiliates.
5.4. Possible Effects of Non-dividend Payments. A fourth possible explanation for the
profitability gap is that MNC receive returns in different forms from majority- and minority-
owned ventures. In particular, they use transfer pricing, royalties, fees, and debt charges more
extensively in minority-owned ventures; these costs would then depress the profitability of the
ventures as compared to majority affiliates. While an MNC would have an incentive to extract
profits in this way in minority-owned ventures, it may not always be able to do so, because of
limited voting rights in the venture. On balance, therefore, it is an empirical matter whether we
observe more non-dividend payments in minority ventures than in majority ones.
The BEA data used here do not show detail of dividend and non-dividend payments. But in
another data series, the BEA publishes data on the U.S. direct investment position and balance of
payments by ownership (i.e., all affiliates and majority-owned affiliates). The direct investment
position is equal to the U.S. parent share in equity plus any net outstanding loans at the end of
each year; it intends to be a measure of the total funds committed by the U.S. parent to their
foreign affiliates. From the balance of payments statistics BEA derives direct investment income
(which includes the U.S. share in earnings and net interest payments from affiliates), investment
royalties and license fees, and other investment services (which includes management and other
fees). By adding all these sources of U.S. parent income and dividing by their investment
position, we can calculate an alternative measure of total return over total funds committed
abroad according to U.S. ownership. The results of tests with these data were mixed.
25
We first tested the significance of the difference in mean returns for both types of affiliates.
Unfortunately, we only had access to Position and Balance of Payments data for the Benchmark
Surveys of 1977, 1982, and 1989. Furthermore, even for these years many of the observations
(especially for industry data) were not available. There were also a fair number of outlying data
points that skewed the results. As a result, a simple test of means was inconclusive – we could
not reject the hypothesis that majority and minority ventures earned the same average return.
We then used a Wilcoxon Rank Test to evaluate the different between majority or minority
returns. In all but one of the tests majority-owned affiliates’ returns ranked higher than minority-
owned. The difference in ranks was significant at the 10% level in five of twelve cases. This
suggests that, even after considering non-dividend income streams, majority-owned affiliates
remain relatively more profitable than minority-owned ventures.
5.5 Effects of Differences in Competitiveness
The crux of our model is that large positive gaps stem from strong advantages of US MNCs
relative to local firms abroad; negligible gaps suggest parity; and large negative gaps stem from
weak US MNC advantages. To test whether one can interpret the profitability gap in a particular
industry as the “revealed” competitive advantage of US firms compared to local firms, we need
to consider an alternative measure of US MNCs’ international competitive advantage and
explore how it relates to (explains) the profitability gap. One way to measure the international
competitive advantage of US firms is to look at the relative importance of their foreign sales.
Two such measures of competitiveness are US Fsales / US Sales and US Fsales / Sales US,
26
where US Fsales are sales of US MNCs abroad, US Sales are total sales in their sector at home,
and Sales US are sales of US MNCs at home. We have derived Sales US as a difference between
US Sales and sales of foreign MNCs in the US (in a specific sector), denoted as Fsales US20.
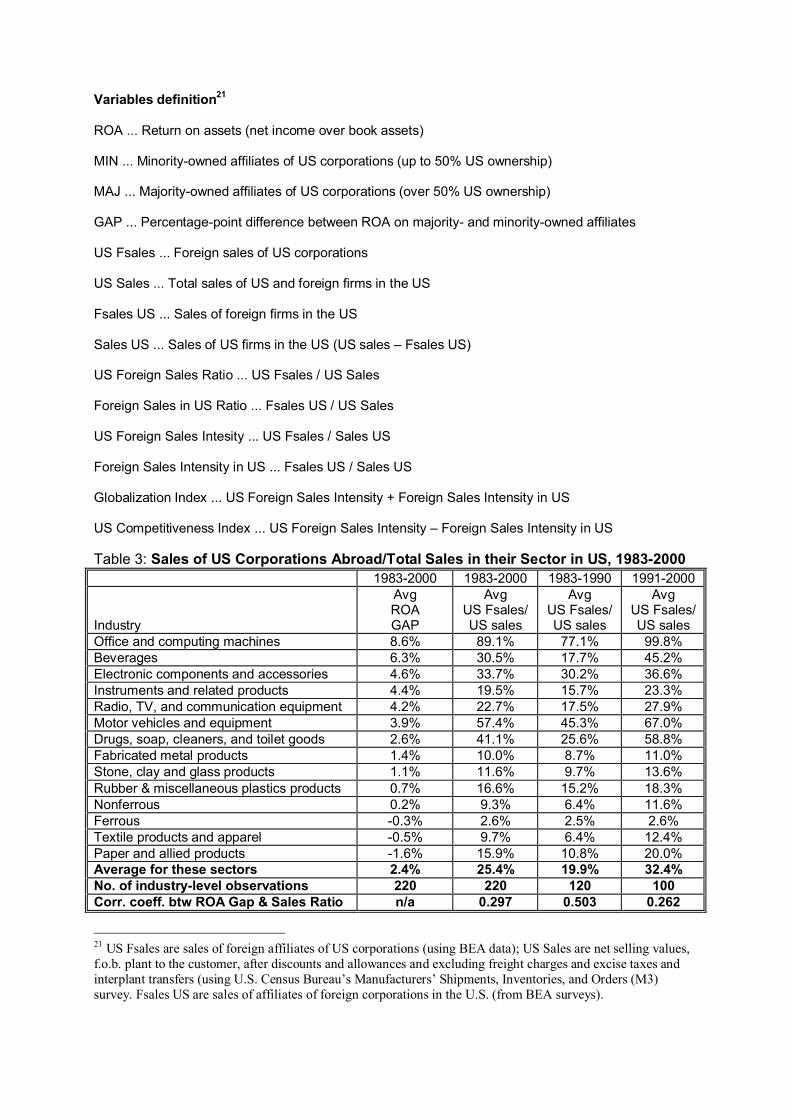
Tables 3 and 4 capture these ratios and their correlation with the ROA gap studied in this paper.
Table 3 suggests that there was an overall trend towards more international engagement in all 14
sectors where data were available. The average foreign sales intensity (using total US Sales) had
grown from 19.9% in 1983-1990 to 32.4% in 1991-2000. In line with the predictions of our
theoretical model, the seven sectors with the highest profitability gap are the sectors with the
highest ratio of foreign to US sales for those sectors. The correlation between this ratio and the
ROA gap is 0.30, although it has dropped notably from 0.50 in 1983-1990 to 0.26 in 1991-2000.
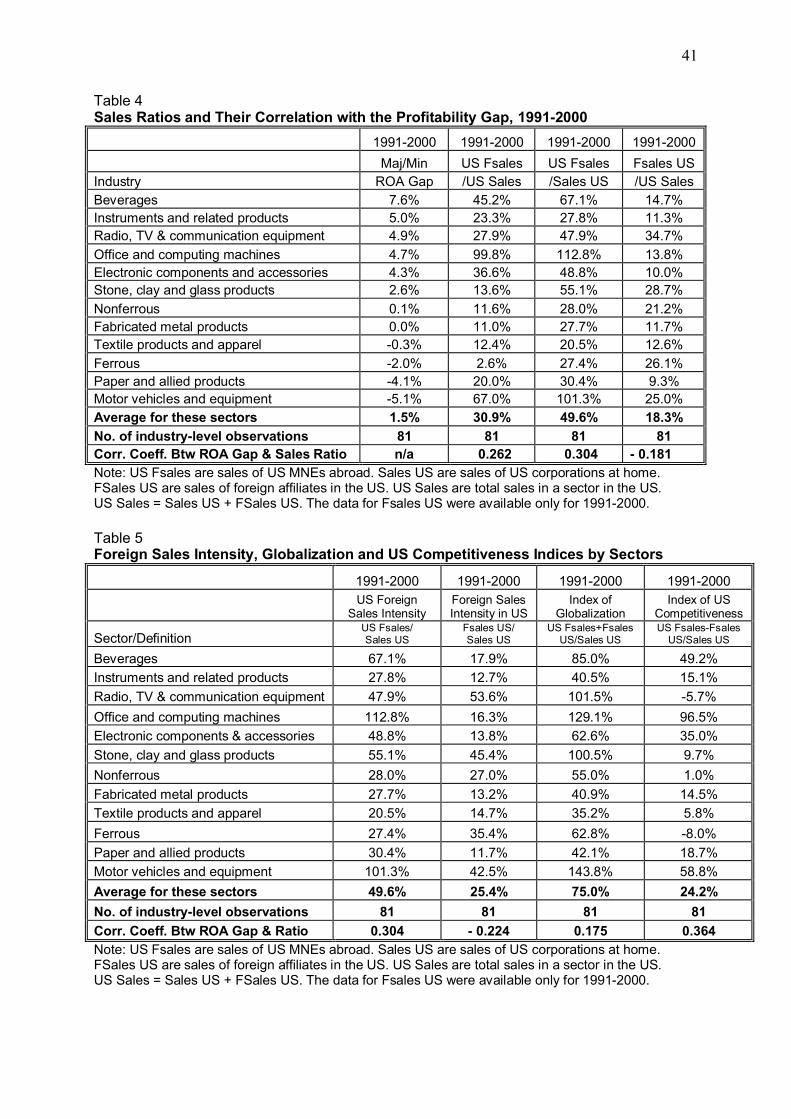
Table 4 explores the same relationship using a ratio of foreign sales of US MNEs to their US
sales, and finds the same correlation of 0.30 between this ratio and the profitability gap.
A high foreign presence may reflect overall globalization of an industry, i.e. conditions that favor
internationa expansion of all firms. To control for this effect, we also incorporate foreign sales
penetration in the US into the measures of competitiveness. The ratios of foreign sales to all sales
and domestic sales of US firms both show a negative correlation with our profitability gap, as
should be expected. When we construct and index of US competitiveness that has a difference
between US sales abroad and foreign sales in the US in the numerator and sales by US firms in
the same sector in the denominator ([US Fsales-Fsales US]/Sales US), we find even stronger
correlation with the gap (0.36, please see Table 5).
20 US Fsales are sales of foreign affiliates of US corporations (using BEA data); US Sales are net selling values, f.o.b. plant to the customer, after discounts and allowances and excluding freight charges and excise taxes and interplant transfers (using U.S. Census Bureau’s Manufacturers’ Shipments, Inventories, and Orders (M3) survey.FSales US are sales of affiliates of foreign corporations in the U.S. (from BEA surveys).
27
6. Conclusion
This paper is a first cut at what seems to be a pervasive and important empirical pattern.
Limitations of our methods and data have already been noted along the way. Foremost among
these is the lack of disaggregated data from the BEA and thus our inability to use multivariate
tests. We intend to pursue this with the BEA, in the hope of deepening and refining this research
with better data.
But if the general direction of our arguments here holds true, there may be important
implications for research in other areas and with other methods. Research on boundaries of the
firm–including work on alliances and networks–has seldom dealt directly with the question of
profitability. Transaction-cost models and market-entry models are predicated on the relative
profitability of different organizational firms, but seldom attempted to test directly whether and
why one form is more profitable than another. The same holds for resource-based models of the
firm.
Our research suggests that developing an explicit model of profitability of the MNC will yield
various benefits. We applied such a model here to explain one set of strategic choices faced by
an MNC – the conditions under which the firm will invest in wholly-owned and in jointly-owned
ventures. Related models can no doubt be used to explain other strategic choices, including
exporting, market entry, diversification, and mergers.
Our model also highlights the need for research in areas that we would have thought were
already well known. Chief among these is the definition and measurement of an MNC’s firm-
specific advantage compared to local firms. We used this well-known construct to explain the
higher profitability of wholly-owned projects in certain industries. Our preliminary tests for this
relationship, using foreign sales intensity ratios have been encouraging, but further refinement of

28
the measures and their use in multivariate regression analysis will be needed to provide a firmer
support for our theoretical arguments. At any rate, we would encourage such research that
returns to the basic micro-economic foundations of MNC theory.
29
Appendix
Figure 1Return over Assets by US Ownership in Broad Industry Sectors(1977-2003, 1 digit level; minority includes 50-50 JVs)
All Industries
-1.0%
0.0%
1.0%
2.0%
3.0%
4.0%
5.0%
6.0%
7.0%
8.0%
1975 1980 1985 1990 1995 2000 2005
Majority
Minority
Gap
Manufacturing
-2.0%
0.0%
2.0%
4.0%
6.0%
8.0%
10.0%
12.0%
1975 1980 1985 1990 1995 2000 2005
Majority
Minority
Gap
Services
-8.0%
-6.0%
-4.0%
-2.0%
0.0%
2.0%
4.0%
6.0%
8.0%
10.0%
12.0%
1975 1980 1985 1990 1995 2000 2005
Majority
Minority
Gap
Mining
-10.0%
-5.0%
0.0%
5.0%
10.0%
15.0%
1975 1980 1985 1990 1995 2000 2005
MajorityMinorityGap
30
Figure 2Return over Assets by US Ownership in Selected 2-digit Manufacturing Sectors(1977-2003, 2 digit level; minority includes 50-50 JVs)
Food and Kindred Products
-2.0%
0.0%
2.0%
4.0%
6.0%
8.0%
10.0%
12.0%
1975 1980 1985 1990 1995 2000 2005
Majority
Minority
Gap
Chemicals and Allied Products
0.0%
2.0%
4.0%
6.0%
8.0%
10.0%
12.0%
1975 1980 1985 1990 1995 2000 2005
Majority
Minority
Gap
Machinery (except electrical)
-6.0%
-4.0%
-2.0%
0.0%
2.0%
4.0%
6.0%
8.0%
10.0%
12.0%
14.0%
1975 1980 1985 1990 1995 2000 2005
Majority
Minority
Gap
Electric and Electronic Equipment
-6.0%
-4.0%
-2.0%
0.0%
2.0%
4.0%
6.0%
8.0%
10.0%
1977
1982
1983
1984
198519
86198
7198
81989
1990
1991
1992
199319
94199
5199
61997
1998
1999
2000
200120
0220
03
Majority
Minority
Gap
Transportation Equipment
-4.0%
-2.0%
0.0%
2.0%
4.0%
6.0%
8.0%
10.0%
12.0%
14.0%
16.0%
1975 1980 1985 1990 1995 2000 2005
Majority
Minority
Gap
31
Figure 3Return over Assets by US Ownership in Selected 3-digit Manufacturing Sectors(1977-1994, 3 digit level; minority includes 50-50 JVs)
Household Appliances
-10.00%
-5.00%
0.00%
5.00%
10.00%
15.00%
1975 1980 1985 1990 1995 2000 2005
Majority
Minority
% Pt Gap
Office and Computing Machines
-20.00%
-15.00%
-10.00%
-5.00%
0.00%
5.00%
10.00%
15.00%
20.00%
25.00%
30.00%
35.00%
1975 1980 1985 1990 1995 2000 2005
Majority
Minority
% Pt Gap
Drugs
-30.00%
-20.00%
-10.00%
0.00%
10.00%
20.00%
30.00%
40.00%
1975 1980 1985 1990 1995 2000 2005
Majority
Minority
% Pt Gap
Soaps and Toiletries
-25.00%
-20.00%
-15.00%
-10.00%
-5.00%
0.00%
5.00%
10.00%
15.00%
20.00%
25.00%
30.00%
1975 1980 1985 1990 1995 2000 2005
Majority
Minority
% Pt Gap
Motor Vehicles and Equipment
-4.00%
-2.00%
0.00%
2.00%
4.00%
6.00%
8.00%
10.00%
12.00%
1975 1980 1985 1990 1995 2000 2005
Majority
Minority
% Pt Gap
Textiles and Apparel
-10.00%
-5.00%
0.00%
5.00%
10.00%
15.00%
19771982
1983
1984
19851986
1987
1988
198919 90
1991
19921993
1994
1995
199619 97
1998
199920 00
2001
20022003
Majority
Minority
% Pt Gap
32
Figure 4Return over Assets by US Ownership in Selected Developed Countries(1977-2003, Manufacturing Affiliates; minority includes 50-50 JVs)
Canada
-10.0%
-5.0%
0.0%
5.0%
10.0%
15.0%
1975 1980 1985 1990 1995 2000 2005
Maj
Min
Gap
United Kingdom
-15.0%
-10.0%
-5.0%
0.0%
5.0%
10.0%
15.0%
1975 1980 1985 1990 1995 2000 2005
Maj
Min
Gap
Germany
-10.0%
-5.0%
0.0%
5.0%
10.0%
15.0%
1975 1980 1985 1990 1995 2000 2005
Maj
Min
Gap
Italy
-30.0%
-20.0%
-10.0%
0.0%
10.0%
20.0%
30.0%
1975 1980 1985 1990 1995 2000 2005
Maj
Min
Gap
Japan
-100.0%-80.0%-60.0%-40.0%-20.0%
0.0%20.0%40.0%60.0%80.0%
100.0%
1975 1980 1985 1990 1995 2000 2005
Maj
Min
Gap
33
Figure 5Return over Assets by US Ownership in Selected Regions(1977-2003, Manufacturing Affiliates; minority includes 50-50 JVs)
Latin America
-10.0%
-5.0%
0.0%
5.0%
10.0%
15.0%
20.0%
1975 1980 1985 1990 1995 2000 2005
Maj
Min
Gap
Middle East
-10.0%
-5.0%
0.0%
5.0%
10.0%
15.0%
20.0%
1975 1980 1985 1990 1995 2000 2005
Maj
Min
Gap
Africa
-15.0%-10.0%
-5.0%0.0%5.0%
10.0%15.0%20.0%25.0%30.0%
1975 1980 1985 1990 1995 2000 2005
Maj
Min
Gap
Asia and Pacific
-5.0%
0.0%
5.0%
10.0%
15.0%
1975 1980 1985 1990 1995 2000 2005
Maj
Min
Gap
34
Figure 6The Marginal Return to Capital
Investment projects or capital invested
Return to the firm
Cost of capital
1 2 3 4 5 6 7 8 9 10 11 12
Marginal return to capital (MRC)
Projects done Projects not done
35
Figure 7Marginal Return to Capital when MNC has Advantage over Local Firm
MRC
MRCMNC
MRCLocal
Extent of competitive advantage of MNC
Capital Invested
36
Figure 8Marginal Returns and Joint Ventures when MNC has Advantage
1 2 3 4 5 6 7 ix viii vii vi v iv iii ii
MRC MNC MRC Local
MNC projects Local firm projects
Cost of capital
for MNC
D
F
DFJV
EG
EGJV
A
B
C
37
Figure 9Marginal Returns and Joint Ventures when Local Firm has Advantage
1 2 3 4 5 6 7 ix viii vii vi v iv iii MNC projects Local firm projects
Cost of capitalfor MNC
F
GCGJV
BFJV
A
B
C
MRC LocalMRC MNC
D E
38
Figure 10Modified MRC with Different Ownership Structures and Relative Advantages
MRC
Cost of capitalfor MNC
(CD) MRC on JVs in Countries Where MNC Has Advantage Over Locals
(EF) MRC on JVs in Countries Where MNC and Locals are at Parity
(GH) MRC on JVs in Countries Where Locals Have Advantage Over MNC
WO projects
Capital Invested
JV projects
(AB) MRC on WO projects
A
B
C
E
G
D F H
AvgGH > AvgAB = AvgEF > AvgCD
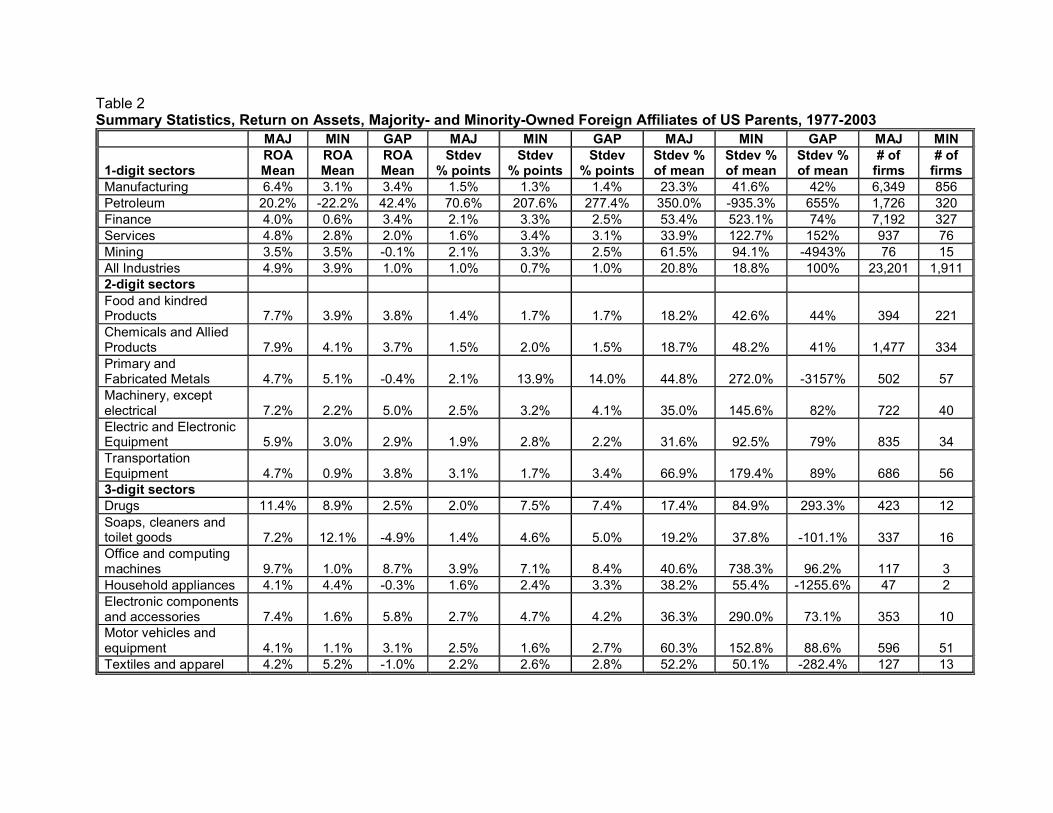
Table 2 Summary Statistics, Return on Assets, Majority- and Minority-Owned Foreign Affiliates of US Parents, 1977-2003
MAJ MIN GAP MAJ MIN GAP MAJ MIN GAP MAJ MIN
1-digit sectorsROA Mean
ROA Mean
ROAMean
Stdev% points
Stdev% points
Stdev% points
Stdev %of mean
Stdev %of mean
Stdev %of mean
# of firms
# of firms
Manufacturing 6.4% 3.1% 3.4% 1.5% 1.3% 1.4% 23.3% 41.6% 42% 6,349 856Petroleum 20.2% -22.2% 42.4% 70.6% 207.6% 277.4% 350.0% -935.3% 655% 1,726 320Finance 4.0% 0.6% 3.4% 2.1% 3.3% 2.5% 53.4% 523.1% 74% 7,192 327Services 4.8% 2.8% 2.0% 1.6% 3.4% 3.1% 33.9% 122.7% 152% 937 76Mining 3.5% 3.5% -0.1% 2.1% 3.3% 2.5% 61.5% 94.1% -4943% 76 15All Industries 4.9% 3.9% 1.0% 1.0% 0.7% 1.0% 20.8% 18.8% 100% 23,201 1,9112-digit sectorsFood and kindred Products 7.7% 3.9% 3.8% 1.4% 1.7% 1.7% 18.2% 42.6% 44% 394 221Chemicals and Allied Products 7.9% 4.1% 3.7% 1.5% 2.0% 1.5% 18.7% 48.2% 41% 1,477 334Primary and Fabricated Metals 4.7% 5.1% -0.4% 2.1% 13.9% 14.0% 44.8% 272.0% -3157% 502 57Machinery, except electrical 7.2% 2.2% 5.0% 2.5% 3.2% 4.1% 35.0% 145.6% 82% 722 40Electric and Electronic Equipment 5.9% 3.0% 2.9% 1.9% 2.8% 2.2% 31.6% 92.5% 79% 835 34Transportation Equipment 4.7% 0.9% 3.8% 3.1% 1.7% 3.4% 66.9% 179.4% 89% 686 563-digit sectorsDrugs 11.4% 8.9% 2.5% 2.0% 7.5% 7.4% 17.4% 84.9% 293.3% 423 12Soaps, cleaners and toilet goods 7.2% 12.1% -4.9% 1.4% 4.6% 5.0% 19.2% 37.8% -101.1% 337 16Office and computing machines 9.7% 1.0% 8.7% 3.9% 7.1% 8.4% 40.6% 738.3% 96.2% 117 3Household appliances 4.1% 4.4% -0.3% 1.6% 2.4% 3.3% 38.2% 55.4% -1255.6% 47 2Electronic components and accessories 7.4% 1.6% 5.8% 2.7% 4.7% 4.2% 36.3% 290.0% 73.1% 353 10Motor vehicles and equipment 4.1% 1.1% 3.1% 2.5% 1.6% 2.7% 60.3% 152.8% 88.6% 596 51Textiles and apparel 4.2% 5.2% -1.0% 2.2% 2.6% 2.8% 52.2% 50.1% -282.4% 127 13
Variables definition21
ROA ... Return on assets (net income over book assets)
MIN ... Minority-owned affiliates of US corporations (up to 50% US ownership)
MAJ ... Majority-owned affiliates of US corporations (over 50% US ownership)
GAP ... Percentage-point difference between ROA on majority- and minority-owned affiliates
US Fsales ... Foreign sales of US corporations
US Sales ... Total sales of US and foreign firms in the US
Fsales US ... Sales of foreign firms in the US
Sales US ... Sales of US firms in the US (US sales – Fsales US)
US Foreign Sales Ratio ... US Fsales / US Sales
Foreign Sales in US Ratio ... Fsales US / US Sales
US Foreign Sales Intesity ... US Fsales / Sales US
Foreign Sales Intensity in US ... Fsales US / Sales US
Globalization Index ... US Foreign Sales Intensity + Foreign Sales Intensity in US
US Competitiveness Index ... US Foreign Sales Intensity – Foreign Sales Intensity in US
Table 3: Sales of US Corporations Abroad/Total Sales in their Sector in US, 1983-20001983-2000 1983-2000 1983-1990 1991-2000
Industry
AvgROAGAP
AvgUS Fsales/US sales
AvgUS Fsales/US sales
AvgUS Fsales/US sales
Office and computing machines 8.6% 89.1% 77.1% 99.8%Beverages 6.3% 30.5% 17.7% 45.2%Electronic components and accessories 4.6% 33.7% 30.2% 36.6%Instruments and related products 4.4% 19.5% 15.7% 23.3%Radio, TV, and communication equipment 4.2% 22.7% 17.5% 27.9%Motor vehicles and equipment 3.9% 57.4% 45.3% 67.0%Drugs, soap, cleaners, and toilet goods 2.6% 41.1% 25.6% 58.8%Fabricated metal products 1.4% 10.0% 8.7% 11.0%Stone, clay and glass products 1.1% 11.6% 9.7% 13.6%Rubber & miscellaneous plastics products 0.7% 16.6% 15.2% 18.3%Nonferrous 0.2% 9.3% 6.4% 11.6%Ferrous -0.3% 2.6% 2.5% 2.6%Textile products and apparel -0.5% 9.7% 6.4% 12.4%Paper and allied products -1.6% 15.9% 10.8% 20.0%Average for these sectors 2.4% 25.4% 19.9% 32.4%No. of industry-level observations 220 220 120 100Corr. coeff. btw ROA Gap & Sales Ratio n/a 0.297 0.503 0.262
21 US Fsales are sales of foreign affiliates of US corporations (using BEA data); US Sales are net selling values, f.o.b. plant to the customer, after discounts and allowances and excluding freight charges and excise taxes and interplant transfers (using U.S. Census Bureau’s Manufacturers’ Shipments, Inventories, and Orders (M3) survey. Fsales US are sales of affiliates of foreign corporations in the U.S. (from BEA surveys).
41
Table 4Sales Ratios and Their Correlation with the Profitability Gap, 1991-2000
1991-2000 1991-2000 1991-2000 1991-2000
Maj/Min US Fsales US Fsales Fsales USIndustry ROA Gap /US Sales /Sales US /US SalesBeverages 7.6% 45.2% 67.1% 14.7%Instruments and related products 5.0% 23.3% 27.8% 11.3%Radio, TV & communication equipment 4.9% 27.9% 47.9% 34.7%
Office and computing machines 4.7% 99.8% 112.8% 13.8%Electronic components and accessories 4.3% 36.6% 48.8% 10.0%Stone, clay and glass products 2.6% 13.6% 55.1% 28.7%
Nonferrous 0.1% 11.6% 28.0% 21.2%Fabricated metal products 0.0% 11.0% 27.7% 11.7%Textile products and apparel -0.3% 12.4% 20.5% 12.6%
Ferrous -2.0% 2.6% 27.4% 26.1%Paper and allied products -4.1% 20.0% 30.4% 9.3%Motor vehicles and equipment -5.1% 67.0% 101.3% 25.0%Average for these sectors 1.5% 30.9% 49.6% 18.3%
No. of industry-level observations 81 81 81 81Corr. Coeff. Btw ROA Gap & Sales Ratio n/a 0.262 0.304 - 0.181Note: US Fsales are sales of US MNEs abroad. Sales US are sales of US corporations at home. FSales US are sales of foreign affiliates in the US. US Sales are total sales in a sector in the US. US Sales = Sales US + FSales US. The data for Fsales US were available only for 1991-2000.
Table 5Foreign Sales Intensity, Globalization and US Competitiveness Indices by Sectors
1991-2000 1991-2000 1991-2000 1991-2000US Foreign
Sales IntensityForeign Sales Intensity in US
Index of Globalization
Index of USCompetitiveness
Sector/DefinitionUS Fsales/Sales US
Fsales US/Sales US
US Fsales+Fsales US/Sales US
US Fsales-Fsales US/Sales US
Beverages 67.1% 17.9% 85.0% 49.2%
Instruments and related products 27.8% 12.7% 40.5% 15.1%
Radio, TV & communication equipment 47.9% 53.6% 101.5% -5.7%
Office and computing machines 112.8% 16.3% 129.1% 96.5%
Electronic components & accessories 48.8% 13.8% 62.6% 35.0%
Stone, clay and glass products 55.1% 45.4% 100.5% 9.7%
Nonferrous 28.0% 27.0% 55.0% 1.0%
Fabricated metal products 27.7% 13.2% 40.9% 14.5%
Textile products and apparel 20.5% 14.7% 35.2% 5.8%
Ferrous 27.4% 35.4% 62.8% -8.0%
Paper and allied products 30.4% 11.7% 42.1% 18.7%
Motor vehicles and equipment 101.3% 42.5% 143.8% 58.8%
Average for these sectors 49.6% 25.4% 75.0% 24.2%
No. of industry-level observations 81 81 81 81
Corr. Coeff. Btw ROA Gap & Ratio 0.304 - 0.224 0.175 0.364Note: US Fsales are sales of US MNEs abroad. Sales US are sales of US corporations at home. FSales US are sales of foreign affiliates in the US. US Sales are total sales in a sector in the US. US Sales = Sales US + FSales US. The data for Fsales US were available only for 1991-2000.
42
References
Bresnahan, T. (1989). "Empirical Studies of Industries with Market Power," in The Handbook of Industrial Organization, Vol. II, R. Schmalensee and R. D. Willig. Amsterdam: North Holland.
Caves, Richard (1971), “International Corporations: The Industrial Economics of Foreign Investment,” Economica, 38 (February), pp. 1-27.
Click, Reid W. and Paul Harrison (2000). “Does Multinationality Matter? Evidence of Value Destruction in U.S. Multinational Corporations,” Finance and Economics Discussion Series, Federal Reserve Board, Washington, DC, No. 2000-21.
Connor, J. M., and W. F. Mueller (1982). "Market Structure and Performance of US Multinationals in Brazil and Mexico," Journal of Development Studies, 18, 329-53.
Denis, David, Diane Denis, and Kevin Yost (2002), “Global Diversification, Industrial Diversification, and Firm Value,” The Journal of Finance, forthcoming.
Desai, M. A. and J. R. Hines (1996). "Basket Cases: International Joint Ventures after the Tax Reform Act of 1986," John F. Kennedy School of Government Working Paper.
Desai, M. A., Foley, C.F., and Hines, Jr, J. R. (2004). The Costs of Shared Ownership: Evidence From International Joint Ventures. Journal of Financial Economics, 73(2):323-374
Dunning, John (1980), “Toward an Eclectic Theory of International Production: Some Empirical Tests,” Journal of International Business Studies, 11 (Spring-Summer), pp. 9-31.
Fairchild, L., and K. Sosin (1986). “Evaluating Differences in Technological Activity Between Transnational and domestic Firms in Latin America,” The Journal of Development Studies, 22, 697-708.
Gomes-Casseres, Benjamin (1989), “Ownership Structures of Foreign Subsidiaries: Theory and Evidence,” Journal of Economic Behavior and Organization, January, 1989, pp. 1-25.
Gomes-Casseres, Benjamin (1990), “Firm Ownership Preferences and Host Government Restrictions: An Integrated Approach,” Journal of International Business Studies, First Quarter, 1990, pp. 1-22.
Hymer, Stephen (1960). The International Operations of National Firms: A Study of Direct Foreign Investment. MIT PhD Dissertation, published by MIT Press, 1976.
Journal of International Management (2002), Special Issue on Liabilities of Foreignness, Volume 8, No. 3.
Kumar, N. (1991), "Mode of Rivalry and Comparative Behavior of Multinational and Local Enterprises: Case of Indian Manufacturing," Journal of Development Economics, 35, 381-92.Kumar, N. (1994). Multinational Enterprises and Industrial Organization. New Delhi: Sage Publications.
43
Landefeld, J. S., A. M. Lawson, and D. B. Weinberg (1992). “Rates of Return on Direct Investment,” Survey of Current Business, (August), 79-87.
Lecraw, D. J. (1984). "Bargaining Power, Ownership, and Profitability of Transnational Corporations in Developing Countries," Journal of International Business Studies, 15, 27-43
Leftwich, R. B. (1974). “U.S. Multinational Companies: Profitability, Financial Leverage, and Effective Income Tax Rates,” Survey of Current Business, 54 (May), 27-36.
Lupo, L. A., A. Gilbert, and M. Liliestedt (1978). “The Relationship between Age and Rate of Return of Foreign Manufacturing Affiliates of U.S. Manufacturing Parent Companies,” Survey of Current Business, 58 (August), 60-6.
Maksimovic, Vojislaw and Gordon Phillips (2002), “Do Conglomerate Firms Allocate Resources Inefficiently Across Industries? Theory and Evidence,” The Journal of Finance, April, Vol. LVII, No. 2, pp. 721-767.
Mataloni, R. J., and M. Fahim-Nader (1996). “Operations of U.S. Multinational Companies: Preliminary Results From the 1994 Benchmark Survey,” Survey of Current Business, (December), 11-37.
Salamon, G. L. (1985)."Accounting Rates of Return," American Economic Review, 75 (3), 495-504.
Schmalensee, R. (1989). "Inter-Industry Studies of Structure and Performance," in The Handbook of Industrial Organization, Vol. II, edited by R. Schmalensee and R. D. Willig. Amsterdam: North Holland.
U.S. Department of Commerce, Bureau of Economic Analysis (1981)."U.S. Direct Investment Abroad: 1977," Washington, DC: USGPO.
U.S. Department of Commerce, Bureau of Economic Analysis (1985). "U.S. Direct Investment Abroad: 1982 Benchmark Survey Data." Washington, DC: USGPO.
U.S. Department of Commerce, Bureau of Economic Analysis (1992). "U.S. Direct Investment Abroad: 1989 Benchmark Survey, Final Results." Washington, DC: USGPO.
U.S. Department of Commerce, Bureau of Economic Analysis (1996). "U.S. Direct Investment Abroad: 1994 Benchmark Survey (Preliminary Results)," Washington, DC: USGPO.
U.S. Department of Commerce, Bureau of Economic Analysis (several years). "U.S. Direct Investment Abroad: Annual Survey," Washington, DC: USGPO.
Recommended