PROGRESS TOWARDS UNDERSTANDING PSA FOAM TAPE DESIGN Dr. Kerstin van Wijk, Senior Associate, National Adhesives, Kleve, Germany Frank Voermans, Technical Manager, ALVEO AG, Lucerne, Switzerland Abstract The performance properties of a PSA tape are depending on several parameters: The type of the adhesive and the carrier material are forming the framework but the final properties of the tape are also depending on the thickness of the carrier, the adhesive coat weight and the interactions between carrier material and adhesive. This presentation will describe the influence of the different carrier materials like crosslinked polyolefin foam or filmic materials and acrylic PSAs on the final properties and performance of the tape. The investigation of the mechanical and chemical properties of the carrier material, the adhesive properties and the final tape should enable development of a model which makes the properties of a tape more predictable. 1. Introduction 1.1. Theory Double side coated adhesive tapes are increasingly being used in the industry to mount and fix parts. They usually consist of four components, a carrier material is sandwiched between two layers of pressure sensitive adhesive (psa), and a release liner is covering one of the adhesive layers. There are a large number of pressure sensitive adhesives available on the market to produce industrial tapes. Solvent borne acrylic adhesives are generally used for more demanding applications. Carrier materials used are polymeric films, non-wovens, fabrics, and polymeric foams. Typically, polymer foams offer the best conformability and are especially used in applications where the tape should stick to rough surfaces, act as a cushion or to compensate tolerances. There are various test methods to assess the mechanical performance of double side coated tapes, like the dynamic and the static shear test, the peel test or the tack test. One of the most common peel test method in the industry for pressure sensitive tapes is the AFERA 5001 (2003 revision of AFERA 4001). In the scientific literature, the peel test has been analysed from the theoretical side with basically three approaches: 1. The stress distribution is analysed around the crack tipi). Unfortunately, this approach is quite
complicated due to the complex stress distribution and the difficulty to define a failure criterionii). 2. A fracture mechanics method with a stress-intensity factor is also not very successful mainly
because the physical basis is not very evidentii). 3. The most promising way to analyse the mechanics of the peel test is based on applying a fracture-
mechanics method using an energy-balanced approachii). In this latest approach, a value for the adhesive fracture energy, Gc, is determined, which is the energy needed to propagate a crack through a unit area of the joint. Gc should ideally be independent of
geometric values (peel angle, thickness of the peeled element, and thickness of adhesive). However, since there is some plastic and viscoelastic deformation involved at the crack tip, it is a function of both temperature and deformation rate. In the simplest form the adhesive fracture energy can be written as:
( )θθ cos1)cos1( −=−=bP
bdaPdaGc (1)
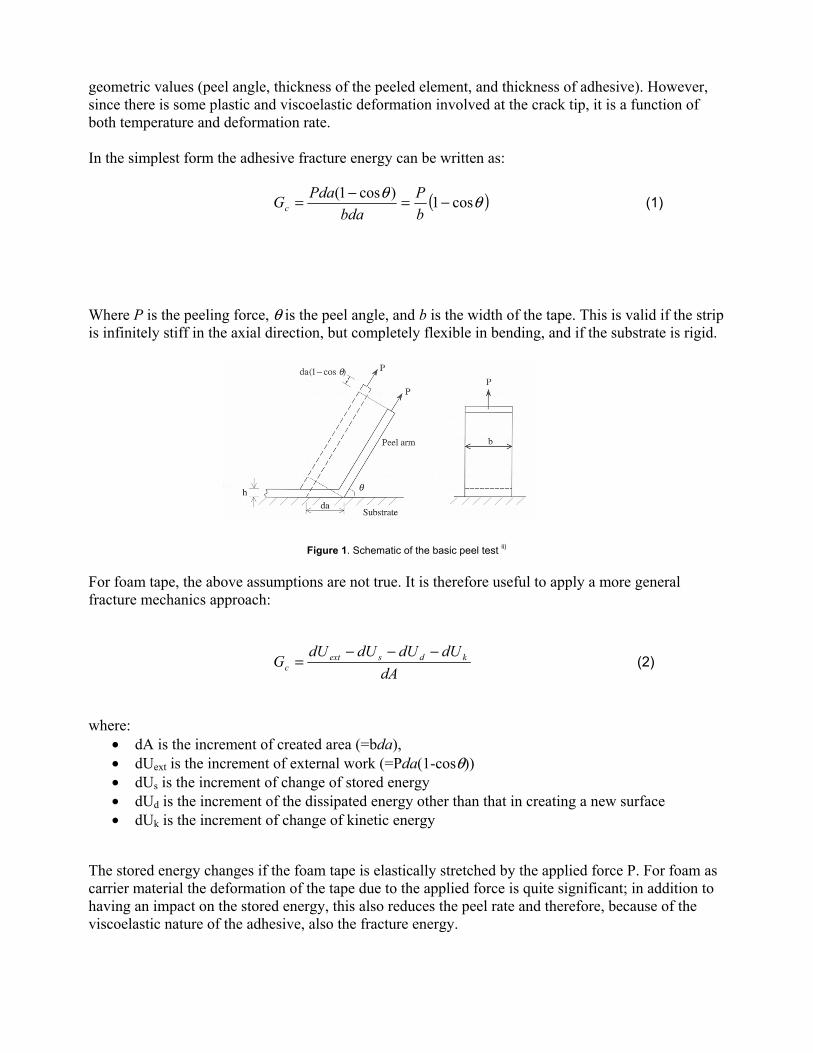
Where P is the peeling force, θ is the peel angle, and b is the width of the tape. This is valid if the strip is infinitely stiff in the axial direction, but completely flexible in bending, and if the substrate is rigid.
Figure 1. Schematic of the basic peel test ii) For foam tape, the above assumptions are not true. It is therefore useful to apply a more general fracture mechanics approach:
dA
dUdUdUdUG kdsextc
−−−= (2)
where:
• dA is the increment of created area (=bda), • dUext is the increment of external work (=Pda(1-cosθ)) • dUs is the increment of change of stored energy • dUd is the increment of the dissipated energy other than that in creating a new surface • dUk is the increment of change of kinetic energy
The stored energy changes if the foam tape is elastically stretched by the applied force P. For foam as carrier material the deformation of the tape due to the applied force is quite significant; in addition to having an impact on the stored energy, this also reduces the peel rate and therefore, because of the viscoelastic nature of the adhesive, also the fracture energy.
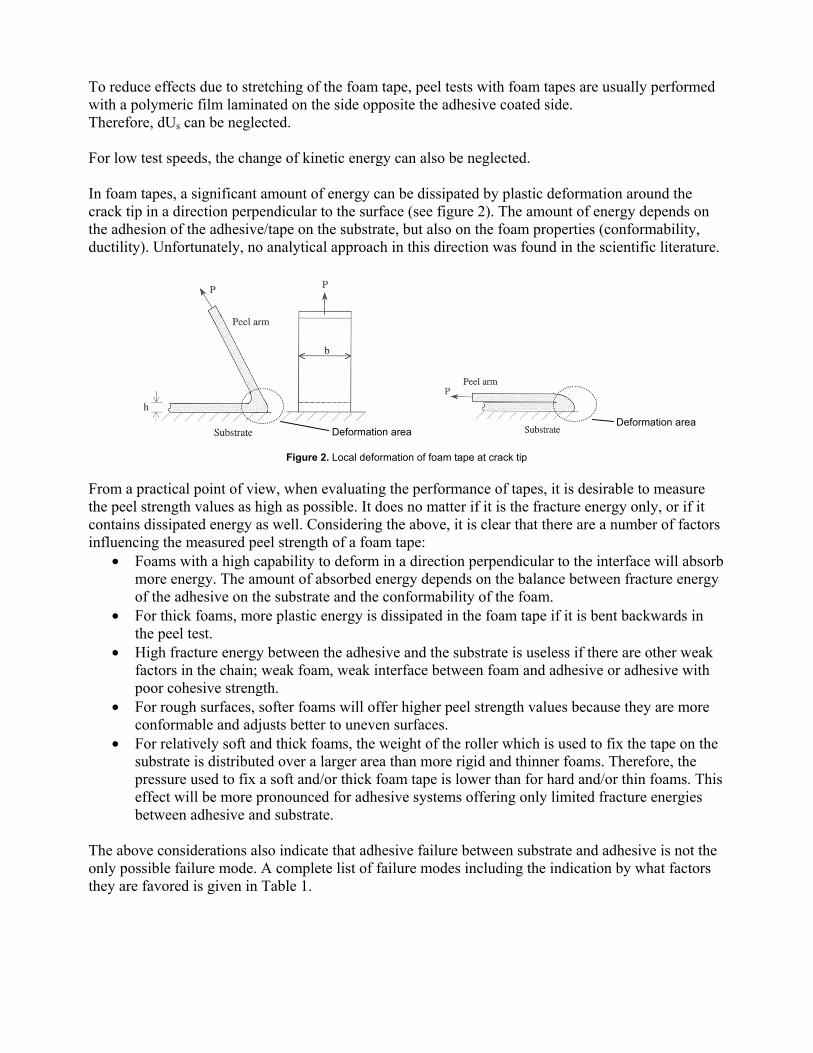
To reduce effects due to stretching of the foam tape, peel tests with foam tapes are usually performed with a polymeric film laminated on the side opposite the adhesive coated side. Therefore, dUs can be neglected. For low test speeds, the change of kinetic energy can also be neglected. In foam tapes, a significant amount of energy can be dissipated by plastic deformation around the crack tip in a direction perpendicular to the surface (see figure 2). The amount of energy depends on the adhesion of the adhesive/tape on the substrate, but also on the foam properties (conformability, ductility). Unfortunately, no analytical approach in this direction was found in the scientific literature.
Figure 2. Local deformation of foam tape at crack tip From a practical point of view, when evaluating the performance of tapes, it is desirable to measure the peel strength values as high as possible. It does no matter if it is the fracture energy only, or if it contains dissipated energy as well. Considering the above, it is clear that there are a number of factors influencing the measured peel strength of a foam tape:
• Foams with a high capability to deform in a direction perpendicular to the interface will absorb more energy. The amount of absorbed energy depends on the balance between fracture energy of the adhesive on the substrate and the conformability of the foam.
• For thick foams, more plastic energy is dissipated in the foam tape if it is bent backwards in the peel test.
• High fracture energy between the adhesive and the substrate is useless if there are other weak factors in the chain; weak foam, weak interface between foam and adhesive or adhesive with poor cohesive strength.
• For rough surfaces, softer foams will offer higher peel strength values because they are more conformable and adjusts better to uneven surfaces.
• For relatively soft and thick foams, the weight of the roller which is used to fix the tape on the substrate is distributed over a larger area than more rigid and thinner foams. Therefore, the pressure used to fix a soft and/or thick foam tape is lower than for hard and/or thin foams. This effect will be more pronounced for adhesive systems offering only limited fracture energies between adhesive and substrate.
The above considerations also indicate that adhesive failure between substrate and adhesive is not the only possible failure mode. A complete list of failure modes including the indication by what factors they are favored is given in Table 1.
Deformation area Deformation area
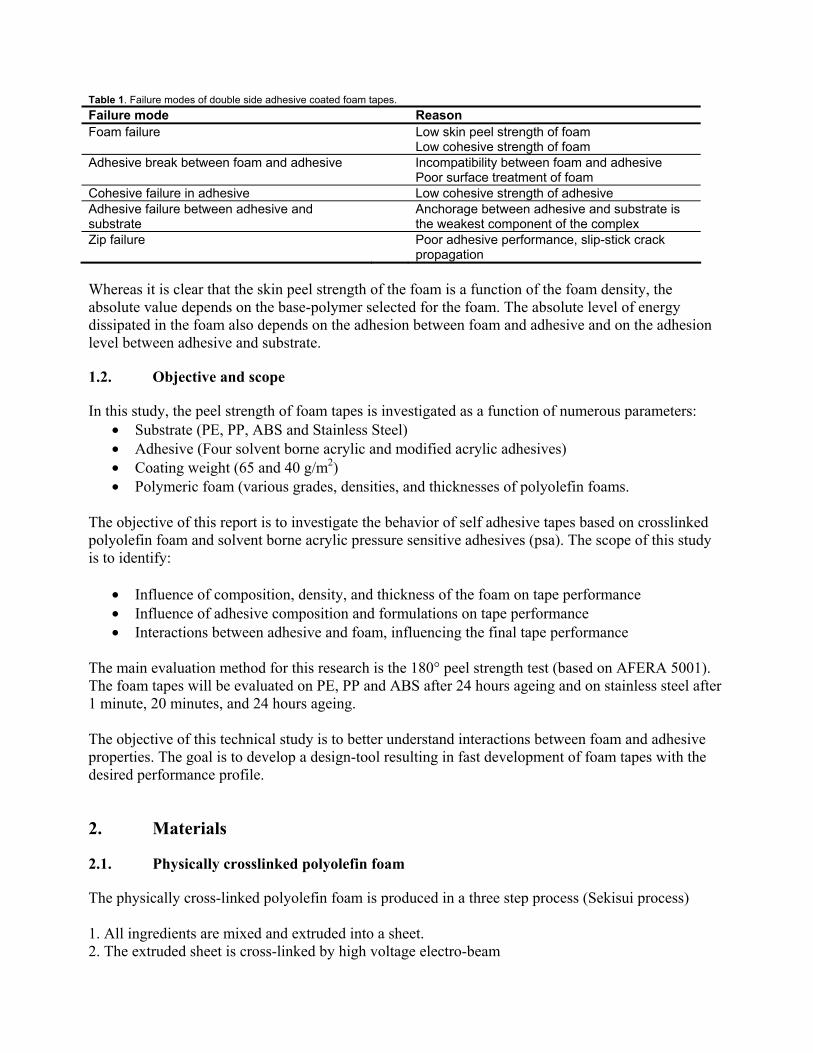
Table 1. Failure modes of double side adhesive coated foam tapes. Failure mode Reason Foam failure Low skin peel strength of foam
Low cohesive strength of foam Adhesive break between foam and adhesive Incompatibility between foam and adhesive
Poor surface treatment of foam Cohesive failure in adhesive Low cohesive strength of adhesive Adhesive failure between adhesive and substrate
Anchorage between adhesive and substrate is the weakest component of the complex
Zip failure Poor adhesive performance, slip-stick crack propagation
Whereas it is clear that the skin peel strength of the foam is a function of the foam density, the absolute value depends on the base-polymer selected for the foam. The absolute level of energy dissipated in the foam also depends on the adhesion between foam and adhesive and on the adhesion level between adhesive and substrate. 1.2. Objective and scope In this study, the peel strength of foam tapes is investigated as a function of numerous parameters:
• Substrate (PE, PP, ABS and Stainless Steel) • Adhesive (Four solvent borne acrylic and modified acrylic adhesives) • Coating weight (65 and 40 g/m2) • Polymeric foam (various grades, densities, and thicknesses of polyolefin foams.
The objective of this report is to investigate the behavior of self adhesive tapes based on crosslinked polyolefin foam and solvent borne acrylic pressure sensitive adhesives (psa). The scope of this study is to identify:
• Influence of composition, density, and thickness of the foam on tape performance • Influence of adhesive composition and formulations on tape performance • Interactions between adhesive and foam, influencing the final tape performance
The main evaluation method for this research is the 180° peel strength test (based on AFERA 5001). The foam tapes will be evaluated on PE, PP and ABS after 24 hours ageing and on stainless steel after 1 minute, 20 minutes, and 24 hours ageing. The objective of this technical study is to better understand interactions between foam and adhesive properties. The goal is to develop a design-tool resulting in fast development of foam tapes with the desired performance profile. 2. Materials 2.1. Physically crosslinked polyolefin foam The physically cross-linked polyolefin foam is produced in a three step process (Sekisui process) 1. All ingredients are mixed and extruded into a sheet. 2. The extruded sheet is cross-linked by high voltage electro-beam
Density
more “conformable“ polymer
more “conformable“ polymer
Con
form
abili
ty
Density
“stronger“ polymer
“stronger“ polymer
Ski
n pe
el s
treng
th
3. The foaming agent is activated and the sheet is expanded into foam The main variables in this foam manufacturing process are:
• Polymer selection • Density • Thickness
Main foam parameters influencing the tape performance are polymer selection and density. These parameters determine the skin peel strength and the conformability of the foam. The skin peel strength rises with increasing density. The conformability decreases with increasing density. The absolute level and slope of these properties mainly depends on the polymer selection, (example in figure 3 and 4).
Figure 3. Conformability Figure 4. Skin peel strength 2.2. Solvent borne acrylic PSA The solvent borne PSA’s are made in two steps. In a first reaction a base polymer is made by radical co-polymerization. In a second step the base polymer is formulated with crosslinker and additives to the final adhesive. The main variables in the adhesive manufacturing process are:
• Monomer selection The combination of monomers determines the final Glass Transition Temperature Tg of the polymer/adhesive
• Molecular weight and molecular weight distribution The reaction conditions during polymerization but also the choice of initiator and solvents determine the molecular weight and molecular weight distribution of the base polymer. The addition of crosslinker leads to a bonding between polymer chains and forming of a net-work. This can also be seen as an increase of molecular weight.
• Modification by additives e.g. tackifiers The addition of tackifiers influence the mobility of the adhesive
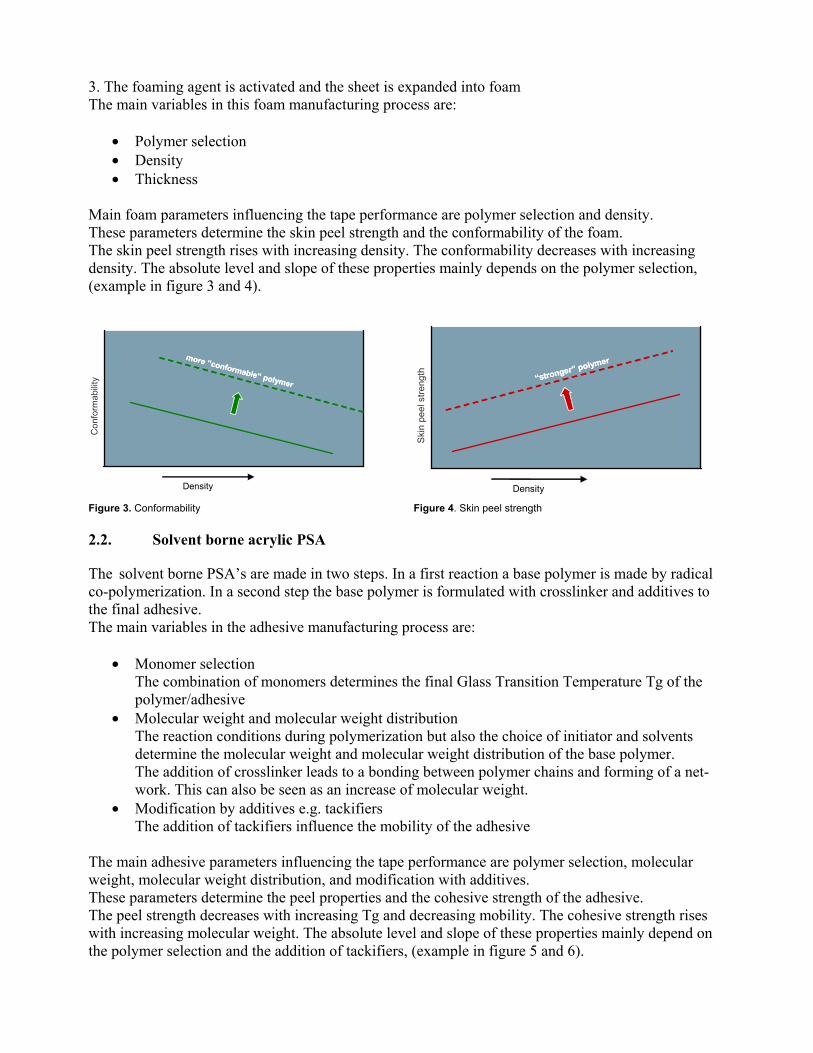
The main adhesive parameters influencing the tape performance are polymer selection, molecular weight, molecular weight distribution, and modification with additives. These parameters determine the peel properties and the cohesive strength of the adhesive. The peel strength decreases with increasing Tg and decreasing mobility. The cohesive strength rises with increasing molecular weight. The absolute level and slope of these properties mainly depend on the polymer selection and the addition of tackifiers, (example in figure 5 and 6).
Tg of polymer
Polymer
Polymer + Tackifier
Polymer + Tackifier
Pee
l stre
ngth
Mw of polymer
Polymer
Polymer + Tackifier
Polymer + Tackifier
Coh
esiv
e st
reng
th
Figure 5. Influence of Tg on Peel strength Figure 6. Influence of molecular weight on cohesive strength
3. Experimental 3.1. Material selection - Foam The foam has been selected based on the two most important design criteria for tapes: Polymer selection
• LDPE based foam • EVA based foam
Density
• 50 - 330 kg/m3 The foam surface is treated in order to increase the surface energy and improve the anchorage with the adhesive. 3.2. Material selection - Adhesive The adhesive has been selected based on Tg (monomer composition), molecular weight and modification. Table 2. Adhesive selection
Glass Transition temperature Modification Adhesive mobility Adhesive A High No Low Adhesive B Low No Medium Adhesive C High Yes Medium Adhesive D Low Yes High 3.3. Test method The AFERA 5001, 180° peel strength method has been selected for the evaluation of the various tape constructions. The tape was tested on stainless steel, ABS, PP and PE to evaluate the performance on the different substrates. In addition the tapes were tested on stainless steel after 1 minute, 20 minutes and 24 hours to evaluate the peel build-up.
180° Peel strength on steel
0
5
10
15
20
25
30
35
40
65 g/m 65 g/m 65 g/m 65 g/m 65 g/m
DUROTAK 180-154A DUROTAK 180-154A DUROTAK 180-154A DUROTAK 180-154A DUROTAK 180-154A
1 1 1 1 1
[N/2
5 m
m]
PEPPABSSteel
Density
180° Peel strength on steel
0
5
10
15
20
25
30
35
40
65 g/m 65 g/m 65 g/m 65 g/m 65 g/m
DUROTAK 180-154A DUROTAK 180-154A DUROTAK 180-154A DUROTAK 180-154A DUROTAK 180-154A
1 1 1 1 1
[N/2
5 m
m]
PEPPABSSteel
Density
180° Peel strength on steel
0
5
10
15
20
25
30
35
40
65 g/m 65 g/m 65 g/m 65 g/m 65 g/m
DUROTAK 180-154A DUROTAK 180-154A DUROTAK 180-154A DUROTAK 180-154A DUROTAK 180-154A
1 1 1 1 1
[N/2
5 m
m]
PEPPABSSteel
Density
180° Peel strength on steel
0
5
10
15
20
25
30
35
40
65 g/m 65 g/m 65 g/m 65 g/m 65 g/m
DUROTAK 180-182A DUROTAK 180-182A DUROTAK 180-182A DUROTAK 180-182A DUROTAK 180-182A
1 1 1 1 1
[N/2
5 m
m]
PEPPABSSteel
Density
180° Peel strength on steel
0
5
10
15
20
25
30
35
40
65 g/m 65 g/m 65 g/m 65 g/m 65 g/m
DUROTAK 180-182A DUROTAK 180-182A DUROTAK 180-182A DUROTAK 180-182A DUROTAK 180-182A
1 1 1 1 1
[N/2
5 m
m]
PEPPABSSteel
Density
180° Peel strength on steel
0
5
10
15
20
25
30
35
40
65 g/m 65 g/m 65 g/m 65 g/m 65 g/m
DUROTAK 180-182A DUROTAK 180-182A DUROTAK 180-182A DUROTAK 180-182A DUROTAK 180-182A
1 1 1 1 1
[N/2
5 m
m]
PEPPABSSteel
Density
180° Peel strength on steel
0
5
10
15
20
25
30
35
40
65 g/m 65 g/m 65 g/m 65 g/m 65 g/m
DUROTAK 180-184A DUROTAK 180-184A DUROTAK 180-184A DUROTAK 180-184A DUROTAK 180-184A
1 1 1 1 1
[N/2
5 m
m]
PEPPABSSteel
Density
180° Peel strength on steel
0
5
10
15
20
25
30
35
40
65 g/m 65 g/m 65 g/m 65 g/m 65 g/m
DUROTAK 180-184A DUROTAK 180-184A DUROTAK 180-184A DUROTAK 180-184A DUROTAK 180-184A
1 1 1 1 1
[N/2
5 m
m]
PEPPABSSteel
Density
180° Peel strength on steel
0
5
10
15
20
25
30
35
40
65 g/m 65 g/m 65 g/m 65 g/m 65 g/m
DUROTAK 180-184A DUROTAK 180-184A DUROTAK 180-184A DUROTAK 180-184A DUROTAK 180-184A
1 1 1 1 1
[N/2
5 m
m]
PEPPABSSteel
Density
180° Peel strength on steel
0
5
10
15
20
25
30
35
40
65 g/m 65 g/m 65 g/m 65 g/m 65 g/m
DUROTAK 180-184A DUROTAK 180-184A DUROTAK 180-184A DUROTAK 180-184A DUROTAK 180-184A
1 1 1 1 1
[N/2
5 m
m]
PEPPABSSteel
Density
Skin peel strengthSkin peel strength
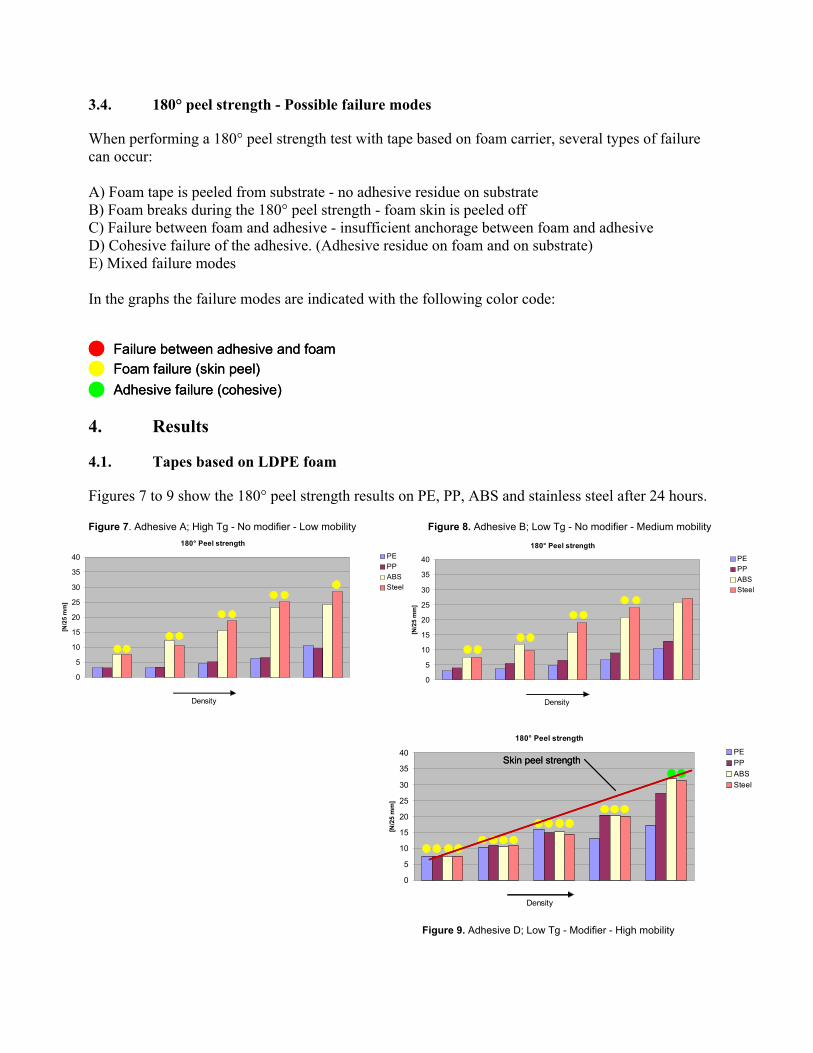
3.4. 180° peel strength - Possible failure modes When performing a 180° peel strength test with tape based on foam carrier, several types of failure can occur: A) Foam tape is peeled from substrate - no adhesive residue on substrate B) Foam breaks during the 180° peel strength - foam skin is peeled off C) Failure between foam and adhesive - insufficient anchorage between foam and adhesive D) Cohesive failure of the adhesive. (Adhesive residue on foam and on substrate) E) Mixed failure modes In the graphs the failure modes are indicated with the following color code:
Failure between adhesive and foamFoam failure (skin peel)Adhesive failure (cohesive)
Failure between adhesive and foamFoam failure (skin peel)Adhesive failure (cohesive)
4. Results 4.1. Tapes based on LDPE foam Figures 7 to 9 show the 180° peel strength results on PE, PP, ABS and stainless steel after 24 hours. Figure 7. Adhesive A; High Tg - No modifier - Low mobility Figure 8. Adhesive B; Low Tg - No modifier - Medium mobility
Figure 9. Adhesive D; Low Tg - Modifier - High mobility
180° Peel strength on steel
0
5
10
15
20
25
30
35
40
65 g/m 65 g/m 65 g/m 65 g/m 65 g/m
DUROTAK 180-154A DUROTAK 180-154A DUROTAK 180-154A DUROTAK 180-154A DUROTAK 180-154A
0.6 0.48 0.48 0.48 0.48
[N/2
5 m
m]
PEPPABSSteel
Density
180° Peel strength on steel
0
5
10
15
20
25
30
35
40
65 g/m 65 g/m 65 g/m 65 g/m 65 g/m
DUROTAK 180-154A DUROTAK 180-154A DUROTAK 180-154A DUROTAK 180-154A DUROTAK 180-154A
0.6 0.48 0.48 0.48 0.48
[N/2
5 m
m]
PEPPABSSteel
Density
180° Peel strength on steel
0
5
10
15
20
25
30
35
40
65 g/m 65 g/m 65 g/m 65 g/m 65 g/m
DUROTAK 180-154A DUROTAK 180-154A DUROTAK 180-154A DUROTAK 180-154A DUROTAK 180-154A
0.6 0.48 0.48 0.48 0.48
[N/2
5 m
m]
PEPPABSSteel
Density
180° Peel strength on steel
0
5
10
15
20
25
30
35
40
65 g/m 65 g/m 65 g/m 65 g/m 65 g/m
DUROTAK 180-182A DUROTAK 180-182A DUROTAK 180-182A DUROTAK 180-182A DUROTAK 180-182A
0.6 0.48 0.48 0.48 0.48
[N/2
5 m
m]
PEPPABSSteel
Density
180° Peel strength on steel
0
5
10
15
20
25
30
35
40
65 g/m 65 g/m 65 g/m 65 g/m 65 g/m
DUROTAK 180-182A DUROTAK 180-182A DUROTAK 180-182A DUROTAK 180-182A DUROTAK 180-182A
0.6 0.48 0.48 0.48 0.48
[N/2
5 m
m]
PEPPABSSteel
Density
180° Peel strength on steel
0
5
10
15
20
25
30
35
40
65 g/m 65 g/m 65 g/m 65 g/m 65 g/m
DUROTAK 180-182A DUROTAK 180-182A DUROTAK 180-182A DUROTAK 180-182A DUROTAK 180-182A
0.6 0.48 0.48 0.48 0.48
[N/2
5 m
m]
PEPPABSSteel
Density
180° Peel strength on steel
0
5
10
15
20
25
30
35
40
65 g/m 65 g/m 65 g/m 65 g/m 65 g/m
DUROTAK 180-184A DUROTAK 180-184A DUROTAK 180-184A DUROTAK 180-184A DUROTAK 180-184A
0.6 0.48 0.48 0.48 0.48
10 08 05 04 03
[N/2
5 m
m]
PEPPABSSteel
Density
180° Peel strength on steel
0
5
10
15
20
25
30
35
40
65 g/m 65 g/m 65 g/m 65 g/m 65 g/m
DUROTAK 180-184A DUROTAK 180-184A DUROTAK 180-184A DUROTAK 180-184A DUROTAK 180-184A
0.6 0.48 0.48 0.48 0.48
10 08 05 04 03
[N/2
5 m
m]
PEPPABSSteel
Density
180° Peel strength on steel
0
5
10
15
20
25
30
35
40
65 g/m 65 g/m 65 g/m 65 g/m 65 g/m
DUROTAK 180-184A DUROTAK 180-184A DUROTAK 180-184A DUROTAK 180-184A DUROTAK 180-184A
0.6 0.48 0.48 0.48 0.48
10 08 05 04 03
[N/2
5 m
m]
PEPPABSSteel
Density
ConformabilityConformability Skin peel strengthSkin peel strength
• Skin peel strength of foam is the limiting factor for peel performance on ABS and Steel • Modified adhesives give higher peel values on PE and PP • No apparent influence of the glass transition temperature (Tg) on peel values
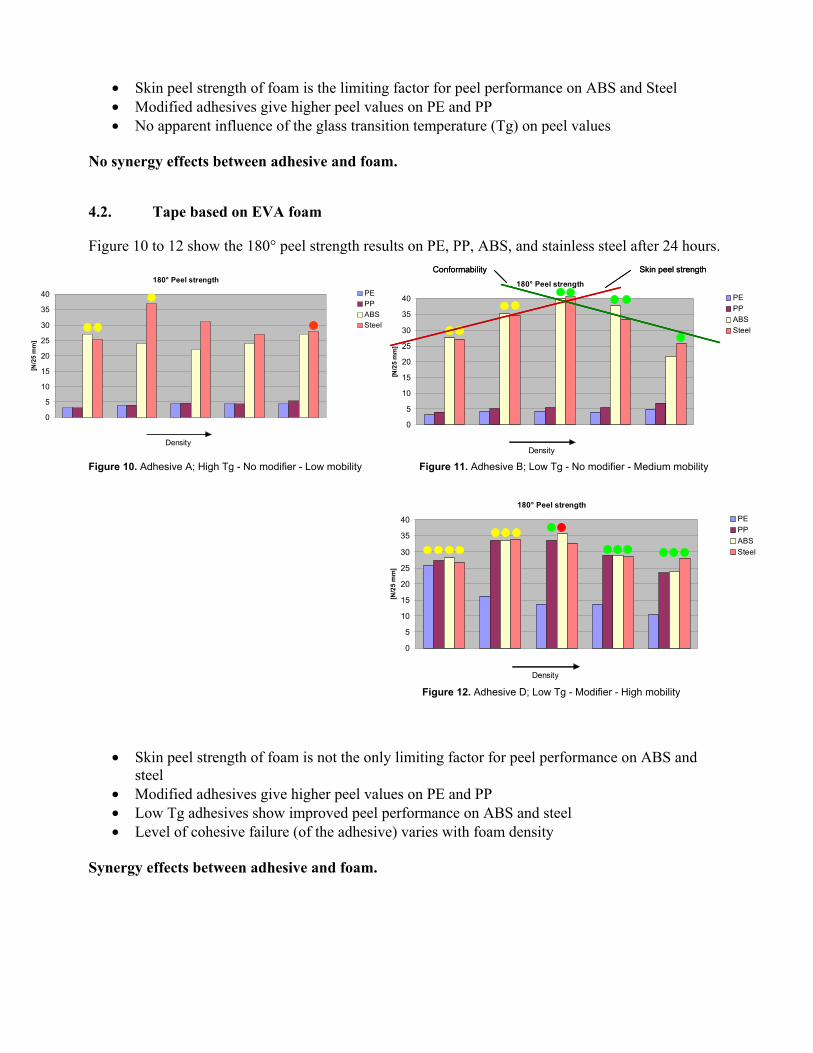
No synergy effects between adhesive and foam. 4.2. Tape based on EVA foam Figure 10 to 12 show the 180° peel strength results on PE, PP, ABS, and stainless steel after 24 hours.
Figure 10. Adhesive A; High Tg - No modifier - Low mobility Figure 11. Adhesive B; Low Tg - No modifier - Medium mobility Figure 12. Adhesive D; Low Tg - Modifier - High mobility
• Skin peel strength of foam is not the only limiting factor for peel performance on ABS and steel
• Modified adhesives give higher peel values on PE and PP • Low Tg adhesives show improved peel performance on ABS and steel • Level of cohesive failure (of the adhesive) varies with foam density
Synergy effects between adhesive and foam.
180° Peel strength on steel
0
5
10
15
20
25
30
35
40
65 g/m 65 g/m 65 g/m 65 g/m
DUROTAK 180-154A DUROTAK 180-182A DUROTAK 180-183A DUROTAK 180-184A
0.48 0.48 0.48 0.48
05 05 05 05
[N/2
5 m
m]
Steel 1 minSteel 20 minSteel 24h
High Tg Low Tg High Tg Low TgNo modifier No modifier Modifier Modifier
180° Peel strength on steel
0
5
10
15
20
25
30
35
40
65 g/m 65 g/m 65 g/m 65 g/m
DUROTAK 180-154A DUROTAK 180-182A DUROTAK 180-183A DUROTAK 180-184A
0.48 0.48 0.48 0.48
05 05 05 05
[N/2
5 m
m]
Steel 1 minSteel 20 minSteel 24h
High Tg Low Tg High Tg Low TgNo modifier No modifier Modifier Modifier
180° Peel strength on steel
0
5
10
15
20
25
30
35
40
65 g/m 65 g/m 65 g/m 65 g/m
DUROTAK 180-154A DUROTAK 180-182A DUROTAK 180-183A DUROTAK 180-184A
0.48 0.48 0.48 0.48
05 05 05 05
[N/2
5 m
m]
PPSteel 24h
High Tg Low Tg High Tg Low TgNo modifier No modifier Modifier Modifier
180° Peel strength on steel
0
5
10
15
20
25
30
35
40
65 g/m 65 g/m 65 g/m 65 g/m
DUROTAK 180-154A DUROTAK 180-182A DUROTAK 180-183A DUROTAK 180-184A
0.48 0.48 0.48 0.48
05 05 05 05
[N/2
5 m
m]
PPSteel 24h
High Tg Low Tg High Tg Low TgNo modifier No modifier Modifier Modifier
180° Peel strength on steel
0
5
10
15
20
25
30
35
40
65 g/m 65 g/m 65 g/m 65 g/m
DUROTAK 180-154A DUROTAK 180-182A DUROTAK 180-183A DUROTAK 180-184A
0.48 0.48 0.48 0.48
05 05 05 05
[N/2
5 m
m]
PPSteel 24h
High Tg Low Tg High Tg Low TgNo modifier No modifier Modifier Modifier
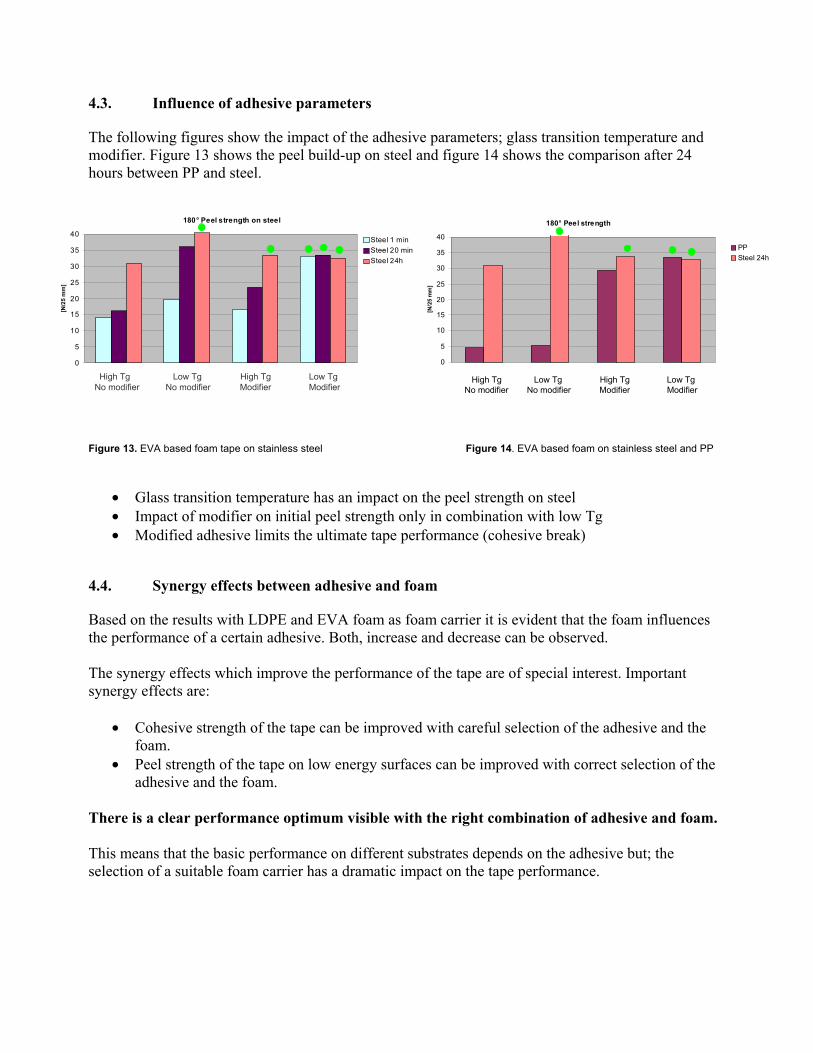
4.3. Influence of adhesive parameters The following figures show the impact of the adhesive parameters; glass transition temperature and modifier. Figure 13 shows the peel build-up on steel and figure 14 shows the comparison after 24 hours between PP and steel.
Figure 13. EVA based foam tape on stainless steel Figure 14. EVA based foam on stainless steel and PP
• Glass transition temperature has an impact on the peel strength on steel • Impact of modifier on initial peel strength only in combination with low Tg • Modified adhesive limits the ultimate tape performance (cohesive break)
4.4. Synergy effects between adhesive and foam Based on the results with LDPE and EVA foam as foam carrier it is evident that the foam influences the performance of a certain adhesive. Both, increase and decrease can be observed. The synergy effects which improve the performance of the tape are of special interest. Important synergy effects are:
• Cohesive strength of the tape can be improved with careful selection of the adhesive and the foam.
• Peel strength of the tape on low energy surfaces can be improved with correct selection of the adhesive and the foam.
There is a clear performance optimum visible with the right combination of adhesive and foam. This means that the basic performance on different substrates depends on the adhesive but; the selection of a suitable foam carrier has a dramatic impact on the tape performance.
180° Peel strength
0
5
10
15
20
25
30
35
40
27
[N/2
5 m
m]
PEPPABSSteel 1 minSteel 20 minSteel 24h
180° Peel strength
0
5
10
15
20
25
30
35
40
27
[N/2
5 m
m]
PEPPABSSteel 1 minSteel 20 minSteel 24h
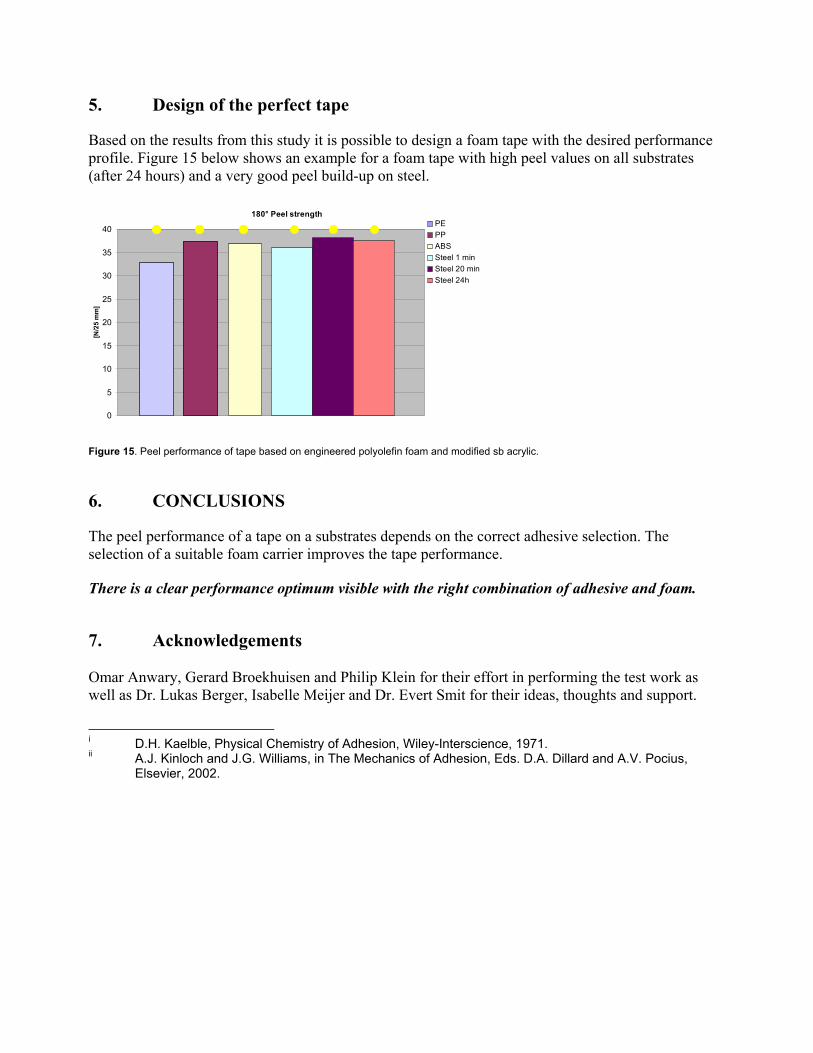
5. Design of the perfect tape Based on the results from this study it is possible to design a foam tape with the desired performance profile. Figure 15 below shows an example for a foam tape with high peel values on all substrates (after 24 hours) and a very good peel build-up on steel.
Figure 15. Peel performance of tape based on engineered polyolefin foam and modified sb acrylic. 6. CONCLUSIONS The peel performance of a tape on a substrates depends on the correct adhesive selection. The selection of a suitable foam carrier improves the tape performance. There is a clear performance optimum visible with the right combination of adhesive and foam. 7. Acknowledgements Omar Anwary, Gerard Broekhuisen and Philip Klein for their effort in performing the test work as well as Dr. Lukas Berger, Isabelle Meijer and Dr. Evert Smit for their ideas, thoughts and support. i D.H. Kaelble, Physical Chemistry of Adhesion, Wiley-Interscience, 1971. ii A.J. Kinloch and J.G. Williams, in The Mechanics of Adhesion, Eds. D.A. Dillard and A.V. Pocius, Elsevier, 2002.
Recommended