Real-Time Polling Technology in a Public Opinion CourseAuthor(s): Cindy D. Kam and Barbara SommerSource: PS: Political Science and Politics, Vol. 39, No. 1 (Jan., 2006), pp. 113-117Published by: American Political Science AssociationStable URL: http://www.jstor.org/stable/20451690 .
Accessed: 14/06/2014 00:49
Your use of the JSTOR archive indicates your acceptance of the Terms & Conditions of Use, available at .http://www.jstor.org/page/info/about/policies/terms.jsp
.JSTOR is a not-for-profit service that helps scholars, researchers, and students discover, use, and build upon a wide range ofcontent in a trusted digital archive. We use information technology and tools to increase productivity and facilitate new formsof scholarship. For more information about JSTOR, please contact [email protected].
.
American Political Science Association is collaborating with JSTOR to digitize, preserve and extend access toPS: Political Science and Politics.
http://www.jstor.org
This content downloaded from 185.2.32.110 on Sat, 14 Jun 2014 00:50:00 AMAll use subject to JSTOR Terms and Conditions
------- --
-----------THE TEACHER ~
Real-Time Polling Technology in a Public
Opinion Course
Cindy D. Kam, University of California, Davis Barbara Sommer, University of California, Davis
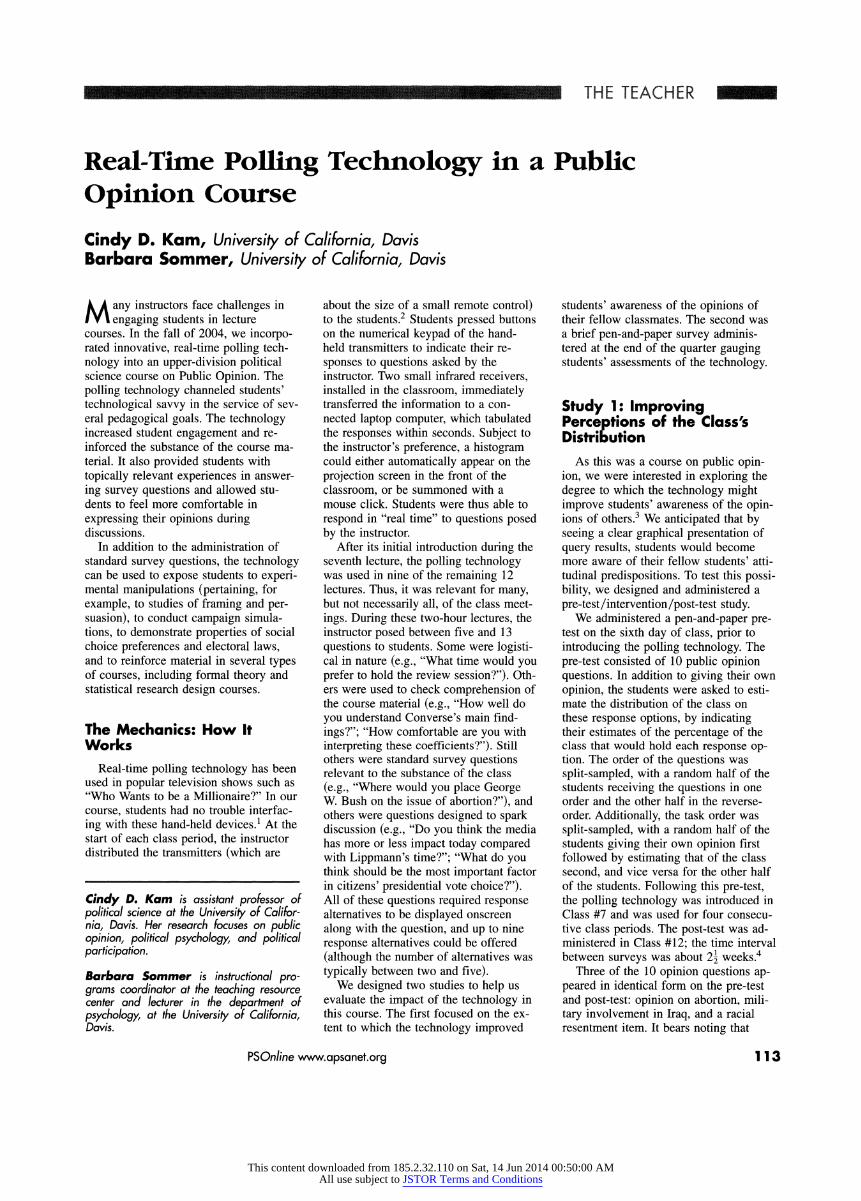
Many instructors face challenges in engaging students in lecture
courses. In the fall of 2004, we incorpo rated innovative, real-time polling tech nology into an upper-division political science course on Public Opinion. The polling technology channeled students' technological savvy in the service of sev eral pedagogical goals. The technology increased student engagement and re inforced the substance of the course ma terial. It also provided students with topically relevant experiences in answer ing survey questions and allowed stu dents to feel more comfortable in expressing their opinions during discussions.
In addition to the administration of standard survey questions, the technology can be used to expose students to experi
mental manipulations (pertaining, for example, to studies of framing and per suasion), to conduct campaign simula tions, to demonstrate properties of social choice preferences and electoral laws, and to reinforce material in several types of courses, including formal theory and statistical research design courses.
The Mechanics: How It Works
Real-time polling technology has been used in popular television shows such as "Who Wants to be a Millionaire?" In our course, students had no trouble interfac ing with these hand-held devices.' At the start of each class period, the instructor distributed the transmitters (which are
about the size of a small remote control) to the students.2 Students pressed buttons on the numerical keypad of the hand held transmitters to indicate their re sponses to questions asked by the instructor. Two small infrared receivers, installed in the classroom, immediately transferred the information to a con nected laptop computer, which tabulated the responses within seconds. Subject to the instructor's preference, a histogram could either automatically appear on the projection screen in the front of the classroom, or be summoned with a
mouse click. Students were thus able to respond in "real time" to questions posed by the instructor.
After its initial introduction during the seventh lecture, the polling technology
was used in nine of the remaining 12 lectures. Thus, it was relevant for many, but not necessarily all, of the class meet ings. During these two-hour lectures, the instructor posed between five and 13 questions to students. Some were logisti cal in nature (e.g., "What time would you prefer to hold the review session?"). Oth ers were used to check comprehension of the course material (e.g., "How well do you understand Converse's main find ings?"; "How comfortable are you with interpreting these coefficients?"). Still others were standard survey questions relevant to the substance of the class (e.g., "Where would you place George
W. Bush on the issue of abortion?"), and others were questions designed to spark discussion (e.g., "Do you think the media has more or less impact today compared with Lippmann's time?"; "What do you think should be the most important factor in citizens' presidential vote choice?").
All of these questions required response alternatives to be displayed onscreen along with the question, and up to nine response alternatives could be offered (although the number of alternatives was typically between two and five).
We designed two studies to help us evaluate the impact of the technology in this course. The first focused on the ex tent to which the technology improved
students' awareness of the opinions of their fellow classmates. The second was a brief pen-and-paper survey adminis tered at the end of the quarter gauging students' assessments of the technology.
Study 1: Improving Perceptions of the Class's Distribution
As this was a course on public opin ion, we were interested in exploring the degree to which the technology might improve students' awareness of the opin ions of others.3 We anticipated that by seeing a clear graphical presentation of query results, students would become
more aware of their fellow students' atti tudinal predispositions. To test this possi bility, we designed and administered a pre-test/intervention/post-test study.
We administered a pen-and-paper pre test on the sixth day of class, prior to introducing the polling technology. The pre-test consisted of 10 public opinion questions. In addition to giving their own opinion, the students were asked to esti
mate the distribution of the class on these response options, by indicating their estimates of the percentage of the class that would hold each response op tion. The order of the questions was split-sampled, with a random half of the students receiving the questions in one order and the other half in the reverse order. Additionally, the task order was split-sampled, with a random half of the students giving their own opinion first followed by estimating that of the class second, and vice versa for the other half of the students. Following this pre-test, the polling technology was introduced in
Class #7 and was used for four consecu tive class periods. The post-test was ad
ministered in Class #12; the time interval between surveys was about 21 weeks.4
Three of the 10 opinion questions ap peared in identical form on the pre-test and post-test: opinion on abortion, mili tary involvement in Iraq, and a racial resentment item. It bears noting that
Cindy D. Kam is assistant professor of political science at the University of Califor nia, Davis. Her research focuses on public opinion, political psychology, and political participation.
Barbara Sommer is instructional pro grams coordinator at the teaching resource center and lecturer in the department of psychology, at the University of California, Davis.
PSOnline wwwapsanet.org 1 13
This content downloaded from 185.2.32.110 on Sat, 14 Jun 2014 00:50:00 AMAll use subject to JSTOR Terms and Conditions
Table 1 Deviation Scores, Before and After Technology Was Introduced
/1 N '
Deviation Score = N (XiX - xt) , calculated for Before and After groups,
Where XZt is subject i's estimate of the class mean at time t and Xt is the actual class mean at time t.
One-tailed Difference Before After of Means Test
"By law, abortion should never be permitted." -0.68 -0.21 p < 0.01 1 = Strongly agree, to 5 = Strongly disagree (0.55) (0.47)
N = 45 N = 41
"All in all, do you think it was worth going to war in Iraq, or not?" -0.222 0.009 p < 0.03 1 = Strongly believe worth it, to 5 = Strongly believe not worth it (0.544) (0.562)
N = 46 N = 39
"It's really a matter of some people not trying hard enough; -0.367 0.038 p < 0.001 if blacks would only try harder they could be just as well off as whites." (0.603) (0.564) 1 = Strongly agree, to 5 = Strongly disagree N = 45 N = 39
Mean deviation score appears with standard deviation in parentheses below.
none of these questions was specifically asked during the four class periods.5 Hence, any improvement in perceptions of the class distribution can be attributed not simply to rote memorizing of the information that appeared onscreen but rather to inference based on other ques tions asked during the class periods.
For each respondent, we calculated the raw difference (henceforth, deviation score) between the student's estimate of the class mean (calculated from the student's estimates of the percentage of the class that would fall within each cat egory) and the actual class mean (com piled from each student's self-placement) for each of the three repeated statements. Table 1 shows the individual statements, the average deviation scores in the two groups, and the two-tailed p-values for two-sample difference of means tests.6
On the abortion item, we see that before the technology was introduced, students on average viewed the class as more lib eral than it actually was (indicated by the value of -0.68 in Table 1). Following the introduction of the technology, this leftward bias fell significantly to -0.22.
For the question on military involvement in Iraq, we see that the class initially held a conservative misperception; in the post-test, this rightward bias significantly fell. We see the same pattern in the third item. The difference between the stu dents' estimates of the class means and the actual class means was significantly smaller after the introduction of the poll ing technology for all three items.
A final item, asking students to indicate their party identification and to estimate the partisan composition of the class, was also repeated on the pre-test and post-test. Before using the polling technology, the students tended to overestimate the per
centage of Republicans in the class com pared with the actual percentage. The mean estimate of the percentage of Re publicans in the pre-test was 25.8% (s.d. 15.1), but the actual percentage was 17.3%; in the post-test, the mean estimate dropped to 15.6% (s.d. 10.5), and the ac tual percentage was 18.6%. In absolute value, the average estimate in the post-test was smaller than the estimate in the pre test (one-tailed p < 0.05), suggesting a significant improvement in estimates in the percentage of Republicans in the class. Further, the dispersion of estimates of percentage of Republican identifiers de clined significantly (one-tailed p < 0.011). There was no difference between the pre-test and the post-test in estimating the percentage of Independents in the class (for both the pre-test and the post test, the class on average underestimated the percentage of Independents by about five percentage points). For the percent age of Democrats, the class underesti
mated the percentage of Democrats in the pre-test (with a mean estimate of 59.5% (s.d. = 16.5) when the actual percentage
was 65.4%), but then overestimated the percentage of Democrats in the post-test (with a mean estimate of 72.4% (s.d. = 13.5), when the actual percentage was 65.1%). On party identification, at least, the technology did not consistently im prove accuracy of perceptions.
An alternative hypothesis is that the passage of time improved students' accu racy. Based on this simple design, we are unable to rule out this possibility. How ever, it is also likely that some students become self-conscious when asked to express an opinion in front of their class mates, especially when a controversial topic is being discussed, and particularly
when there exists some expectation of
what the majority of students will think (be it a predominantly liberal or a pre dominantly conservative campus). When students feel that their views represent those of a minority, or when they fear that their minority views may be misunder stood (Berinsky 1999), they may simply demur from revealing their views. This pattem of non-response could compound over the course of the term, yielding a "spiral of silence" that accentuates stu dents' hesitation to voice their views and that eventually results in silencing stu dents who feel that they may hold minor ity views (Noelle-Neuman 1974; 1993).
As a consequence, class discussions, without this technology, could become more, rather than less, homogeneous. This process could stifle the expression of di verse opinions and thus distort students' perceptions of the class's preferences. This technology provides one way of im proving students' sense of the opinions of others, while offering several other ben efits, detailed below.
Study 2: Student Evaluations of the Technology
At the end of the quarter, students were given a brief pen-and-paper ques tionnaire. The students' responses to the polling technology were overwhelmingly positive, and they support our conten tions of increased willingness to partici pate and increased knowledge of the views of others. The raw frequencies appear in Table 2. Nearly all students (98%) liked using the system in class; nearly 90% believed the polling technol ogy made it easier to express honest opinions; and over 90% believed it helped the class discuss controversial
1 14 PS January 2006
This content downloaded from 185.2.32.110 on Sat, 14 Jun 2014 00:50:00 AMAll use subject to JSTOR Terms and Conditions
Table 2 Students' Assessment of the Polling Technology
Strongly Neither Agree Strongly Question Disagree Disagree nor Disagree Agree Agree
In general, I liked using the PRS technology in class. 0% 0% 2% 22% 76% The PRS technology made it easier to express my 0% 0% 11% 37% 52%
honest opinion in class. My interest in the issues covered in class was decreased 54% 41% 6% 0% 0%
as a result of the PRS technology. The PRS technology helped me pay more attention in class. 0% 0% 11% 48% 41% Too much class time was devoted to discussing the results 36% 57% 8% 0% 0%
from the PRS technology. The PRS technology made it easier to discuss controversial 0% 0% 7% 50% 43%
issues. I recommend that the PRS technology be used in other 0% 0% 6% 28% 67%
political science courses.
N = 54
issues. The vast majority (95%) dis agreed with the statement that the tech nology decreased their interest in the course; nearly 90% believed that the technology helped them pay more attention in class; and nearly all (93%) disagreed with the statement that too much class time was devoted to the technology. Finally, 95% heartily en dorsed its use in other courses, with two thirds of the class giving the strongest endorsement possible.
At the end of the questionnaire, stu dents were given the opportunity to pro vide open-ended comments. These comments reflect their wide-ranging, yet nearly unanimous, enthusiasm for the technology.7 Several of the comments reflected our expectations regarding how the technology would influence student participation, engagement, and learning. One student remarked, "I enjoyed the PRS technology very much. It helped me participate in class which is usually a bit difficult for me, because I am usu ally more reserved and shy." Another student was intrigued by the results: "Thought these were fun and helpful. Some of the results REALLY surprised me." Another student remarked on the extent to which the technology allowed for unbiased expression of views: "USE IT! Had an immediate comforting effect that allowed me to express my views and see where my preferences were rel ative to other data such as the NES without being too partisan in voice." Finally, another student noted how the interface encouraged greater attention and engagement: "I was raised on video games and have no trouble admitting that this 'tricked' me into paying more attention than I usually would. In addi tion, it generally proved to be a really good discussion starter."
A Springboard for Discusslon
The real-time polling technology en abled students to visualize clearly the distribution of responses within the class (i.e., in graphical form, rather than in a rough show of hands) and provided a clearer way of comparing and contextu alizing the views of the students relative to those of the American public. Addi tionally, use of the technology has stimu lated a number of lively discussions along the way!
One of the most vivid cases in which the polling technology spurred discussion concerned students' responses to the standard gender norms question in the
National Election Studies: "Recently there has been a lot of talk about
women's rights. Some people feel that women should have an equal role with men in running business, industry, and government. Others feel that a woman's place is in the home. Where would you place yourself on this scale?" After the students registered their views-but be fore the results appeared on screen-the students were asked about their expecta tions regarding the class's distribution.
One female student remarked, "I know what it should be!" (implying, under no uncertain terms, that she hoped to see strong agreement for equality). When the projected histogram revealed less than universal convergence on the scale, the students had a lively discussion about
what might possibly account for this di versity in views. As an extension to the discussion, they were asked to conjecture about the distribution of opinion for the national sample. They hypothesized that it would be skewed toward the conserva tive side, for a number of reasons. The results from the 2000 National Election
Study were displayed in similar format, so that students could immediately com pare the distribution of the class to that of the national sample (and see for them selves the surprising similarity between the two).
The real-time polling technology pro vided a means of stimulating analytic discussion, by measuring the class's views, displaying the class's views graphically, and comparing them to re sults from the public at large. These ac tivities gave students the opportunity to contextualize their views, work through their preconceptions about college stu dents, and reason through the possible effects of various characteristics (age, education, socioeconomic status, etc.) in accounting for similarities and differ ences between themselves and the public at large. The technology assisted us in conducting lively discussions focused on building hypotheses to understand empir ical results.
Experiencing Research
There are several extensions to the ap plicability of the polling technology. As one example, the technology can be used to field a public opinion poll from the students at the start of a term. Having stu dents respond to standard survey ques tions is valuable in many ways: it sparks introspection, a sense of empathy with survey respondents, and even criticism of and frustration with standard question wordings and response altematives. In short, by having students actively respond to questions, they reflect more on the
methodology of survey research. Further, because the responses are saved electroni cally, the responses from the poll can be converted to a usable dataset available for students to analyze during the course.
PSOnline www.apsanet.org 1 15
This content downloaded from 185.2.32.110 on Sat, 14 Jun 2014 00:50:00 AMAll use subject to JSTOR Terms and Conditions
Another application of the technology incorporates elements of experimental research into courses. For example, the technology allowed us to gather real-time responses to Tversky and
Kahneman's (1981) classic framing example:
[Survival frame] Imagine that the U.S. is preparing for an outbreak of an unusual disease, which is expected to kill 600 people. If program A is adopted, 200 people will be saved. If program B is adopted, there is a 1/3 probability that 600 people will be saved and 2/3 proba bility that no people will be saved.
[Mortality frame] Imagine that the U.S. is preparing for an outbreak of an un usual disease, which is expected to kill
600 people. If program C is adopted, 400 people will die. If program D is
adopted, there is a 1/3 probability that nobody will die, and 2/3 probability the
600 people will die.
Half of the class received the survival frame, and half of the class received the
mortality frame (the questions were passed out on pieces of paper, so that students responded to only one version of the question). Each half of the class registered their preferences, and students could immediately see the impact of the framing experiment on their views.8
As another example of having students experience experimental manipulations, we used the technology to examine the impact of source cue manipulations. Half of the students were told a position was endorsed by a conservative political elite and the other half were told that the po sition was endorsed by a liberal elite, and they were asked to register their preferences.
The technology enables students to respond to survey questions and interact
with experimental manipulations, giving them first-hand experience with the re search that we as political scientists conduct. By directly experiencing the experimental stimuli, students were more engaged in the substance of the course
material and could not hold themselves invulnerable to these framing and persua sion effects. They are transformed from passive observers to active participants, and this increases their critical evaluation of research methodology and empirical findings.
Checking In and Monitoring Progress
The polling technology also provides opportunities to monitor students' progress. Each of the transmitters has a unique identification number that can be linked to each student's name (although, to preserve anonymity, we did not take advantage of this in the public opinion course). The transmitters can therefore be used for taking attendance or even for in-class multiple-choice examinations.
The polling technology can also be used for assessing students' levels of un derstanding. Some students may feel too intimidated to raise questions for clarifi cation. In this course, students were given several occasions to indicate whether they wanted clarification on sub stantive points and on assignments.
When students saw that others in the class had questions, this seemed to legiti
mize their desires for clarification, and the floor was open for questions. Another
way the technology assessed levels of understanding was through the incor poration of multiple-choice questions on concepts discussed in the lectures using pre- and post-lecture questions to deter mine if students showed improvement in their understanding of concepts following the lecture (which they did).
Other Applications Instructors might explore still other
applications with the technology. These include (but are not limited to) campaign simulations, demonstrations of electoral laws, and methodological courses in for
mal theory and statistical research meth ods. We have used the technology as part of a teaching collaboration centered on a campaign simulation. One instructor's class had the task of crafting a presiden tial campaign between three political par ties, while the other instructor's class served as the mock electorate. We began the collaboration by having each of the three political parties contribute questions for a public opinion poll. We then fielded the public opinion poll among the mock electorate. The political parties analyzed the results of the public opinion poll to craft their campaign strategies. At the end of the term, each political party "ran" their campaign (by way of a presentation to the mock electorate). Following these presentations, the mock electorate voted
in the final election using the polling technology. The instructors then led a discussion relating the campaign strat egies to the relevant readings and lectures in both courses.
The technology can also provide effi ciency gains to instructors who already use some form of balloting or hand raising in their courses. For example, in courses on electoral laws, the real-time polling technology can be used to dem onstrate several concepts, such as prefer ence cycling predicted by Arrow's theorem. Instructors can also use the technology to illustrate the impact of
manipulations of the number of choice altermatives, the number of decision mak ers, and the electoral rules (e.g., majority rule, Borda count, Hare system, Single Transferable Vote). For instructors who typically rely on hand-raises to illustrate properties of electoral laws, the real-time polling technology promises vast in creases in efficiency and enables more spontaneity in demonstrations.
Another application of the technology applies to courses in formal theory and statistical research methods. The technol ogy would enable instructors to play
multiple player games (e.g., N-player prisoners' dilemmas and coordination games, public goods games, and beauty contests) in real-time with students to demonstrate and reinforce concepts of rationality. Game theory instructors could also ask students to, for example, solve a
Nash Equilibrium in a simple game, reg ister their answers, and then hold a class discussion regarding the results. For in structors of statistical research methods, the technology would easily lend itself to
monitoring student comprehension of concepts and formulae, especially by having students solve problems, register their answers, and discuss how they ar rived at their solutions.
Real-time polling technology has multiple applications for use in political science courses, from courses on public opinion and voting behavior to those on game theory and statistical research methods. It is, by no means, a panacea for the challenges of teaching lecture courses. It does, however, provide an opportunity for increasing student en gagement, spurring discussion, monitor ing student progress, demonstrating core concepts, and encouraging critical thinking regarding political science research.
Notes * We thank Victoria Cross, James Fowler,
Ethan Scheiner, Walter Stone, and Elizabeth
Zechmeister for helpful suggestions. Funding for
the technology was generously provided by the
Undergraduate Instructional Improvement
Program, supported by the vice provost
undergraduate studies at the University of Cali
fornia, Davis.
1 16 PS January 2006
This content downloaded from 185.2.32.110 on Sat, 14 Jun 2014 00:50:00 AMAll use subject to JSTOR Terms and Conditions
1. Several of these real-time polling systems are currently available. We used the InterWrite
PRS (Personal Response System); see www.
gtcocalcomp.com for further information. The cost of the hardware (receivers, hand-held trans
mitters, cables, etc.) was approximately $3,200, which did not include the laptop and projection
system. In future use, much of the cost could be
passed onto the students by having students pur chase the $35 transmitters and bring them to
class. During this first trial-run, the transmitters
were retained by the instructor and were distrib
uted at the start and collected at the end of each
class period. None were lost. For reviews of this
technology in other settings, see Draper and
Brown (2004); Stuart, Brown, and Draper
(2004). 2. In this case, responses were strictly anon
ymous; there was no connection between stu
dents' identities and the transmitters they used.
The system has the capacity to tie responses to
identities, the advantages of which we discuss
later in this article.
3. It is possible that students could intention
ally misrepresent their views. Nothing in the
technology per se can prevent this, but it did not
seem to be an issue in our use of the technology. 4. Class attendance for Class #12 was regret
tably lower than normal (the midterm occurred
during Class #11).
5. A variant of the abortion item was admin
istered, but the exact question text and available
response alternatives differed between the in
class question and the survey question. 6. A small number of students refused to
place the class or misunderstood the instructions;
they are omitted from analysis. 7. The question text read as follows: "Do
you have any other reactions to the PRS? If so,
please list your comments on the other side.
Thanks very much!"
8. The results were fairly consistent with
Tversky and Kahneman's (1981) findings.
References
Berinsky, Adam J. 1999. "The Two Faces of
Public Opinion." American Journal of Polit
ical Science 43 (4): 1209-30.
Draper, S. W, and M. I. Brown. 2004. "Increas
ing Interactivity in Lectures Using an Elec
tronic Voting System." Journal of Computer Assisted Learning 20: 81-94.
Noelle-Neuman, Elisabeth. 1974. "The Spiral of
Silence: A Theory of Public Opinion." Jour
nal of Communication 24 (2): 43-51. -. 1993. The Spiral of Silence: Public
Opinion, Our Social Skin. Chicago: Univer
sity of Chicago Press.
Stuart, S. A. J., M. I. Brown, and S. W Draper. 2004. "Using an Electronic Voting System in
Logic Lectures: One Practitioner's Applica tion." Journal of Computer Assisted Learn
ing 20: 95-102.
Tversky, Amos, and Daniel Kahneman. 1981.
"The Framing of Decisions and the
Psychology of Choice." Science 211 (4481): 453-8.
PSOnline www.apsanet.org 1 17
This content downloaded from 185.2.32.110 on Sat, 14 Jun 2014 00:50:00 AMAll use subject to JSTOR Terms and Conditions
Recommended