ICES ADVICE 2012 AVIS DU CIEM
Books 1- 10
Report of the ICES Advisory Committee 2012
Book 4 The Faroe Plateau Ecosystem
International Council for the Exploration of the Sea Conseil International pour l’Exploration de la Mer
H.C. Andersens Boulevard 44-46 DK-1553 Copenhagen V Denmark Telephone (+45) 33 38 67 00 Telefax (+45) 33 93 42 15 www.ices.dk [email protected] Report of the ICES Advisory Committee 2012. Books 1 - 10 December 2012 Recommended format for purposes of citation: ICES. 2012. Report of the ICES Advisory Committee 2012. ICES Advice, 2012. Book 4. 33 pp. For permission to reproduce material from this publication, please apply to the General Secretary.
ISBN 978-87-7482-119-9
BOOK 4 Section Page 4 THE FAROE PLATEAU ECOSYSTEM ............................................................................................................... 1
4.1 Ecosystem Overview ...................................................................................................................................... 1 4.2 Human impacts on the ecosystem .................................................................................................................. 1
4.2.1 Fishery effects on benthos and fish communities ........................................................................... 1
4.3 Assessments and advice ................................................................................................................................. 1
4.3.1 Assessments and advice regarding protection of biota and habitats ............................................... 1 4.3.2 Assessments and advice regarding fisheries................................................................................... 1
4.4 Stock summaries ......................................................................................................................................... 4
4.4.1 Cod in Subdivision Vb1 (Faroe Plateau) ........................................................................................ 4 4.4.2 Cod in Subdivision Vb2 (Faroe Bank).......................................................................................... 11 4.4.3 Haddock in Division Vb .............................................................................................................. 15 4.4.4 Saithe in Division Vb ................................................................................................................... 24

ICES Advice 2011, Book 4 1
4 FAROE PLATEAU ECOSYSTEM 4.1 Ecosystem overview This Section has not been updated in 2012. The most recent ecosystem overview is available in ICES Advisory Report 2008, Section 4.1. This overview can also be found on the ICES website: http://www.ices.dk/committe/acom/comwork/report/2008/2008/4.1-4.2%20Faroe%20plateau%20ecosystem%20overview.pdf 4.2 Human impacts on the ecosystem 4.2.1 Fishery effects on benthos and fish communities This Section has not been updated in 2012. The most recent description on Fishery effects on benthos and fish communities is available in ICES Advisory Report 2008, Section 4.2. This description can also be found on the ICES website http://www.ices.dk/committe/acom/comwork/report/2008/2008/4.1-4.2%20Faroe%20plateau%20ecosystem%20overview.pdf: 4.3 Assessments and Advice 4.3.1 Assessment and advice regarding protection of biota and habitats In 2012, ICES has not provided advice regarding protection of biota and habitats for this area. 4.3.2 Assessments and Advice regarding fisheries Mixed fisheries and fisheries interactions This Section has not been updated in 2012. The most recent description on mixed fisheries and fisheries interactions is available in ICES Advisory Report 2008, Section 4.3. This description can also be found on the ICES website: http://www.ices.dk/committe/acom/comwork/report/2008/2008/4.3%20Faroe%20Islands%20Fisheries%20Advice.pdf. Sources of Information ICES. 2008. Report of the ICES Advisory Committee, 2008. ICES Advice, 2008. Book 4.
2 ICES Advice 2010, Book 4
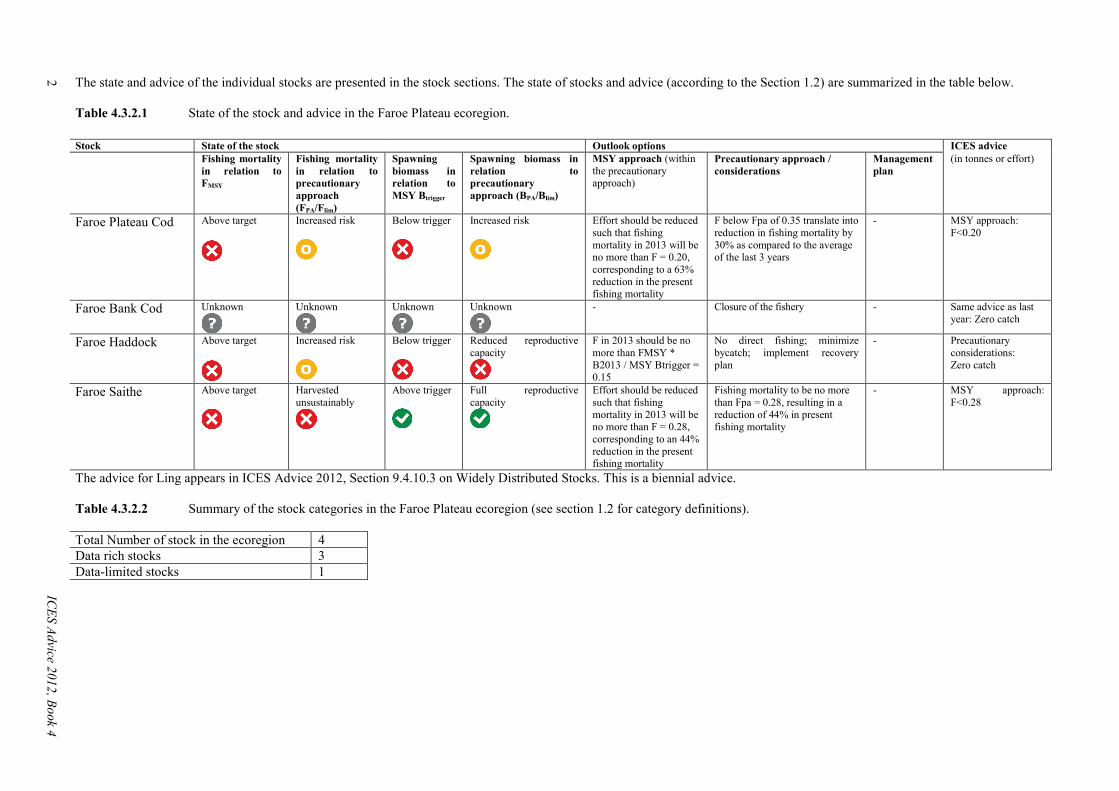
The state and advice of the individual stocks are presented in the stock sections. The state of stocks and advice (according to the Section 1.2) are summarized in the table below. Table 4.3.2.1 State of the stock and advice in the Faroe Plateau ecoregion. Stock State of the stock Outlook options ICES advice Fishing mortality
in relation to FMSY
Fishing mortality in relation to precautionary approach (FPA/Flim)
Spawning biomass in relation to MSY Btrigger
Spawning biomass in relation to precautionary approach (BPA/Blim)
MSY approach (within the precautionary approach)
Precautionary approach / considerations
Management plan
(in tonnes or effort)
Faroe Plateau Cod Above target
Increased risk
Below trigger
Increased risk
Effort should be reduced such that fishing mortality in 2013 will be no more than F = 0.20, corresponding to a 63% reduction in the present fishing mortality
F below Fpa of 0.35 translate into reduction in fishing mortality by 30% as compared to the average of the last 3 years
- MSY approach: F<0.20
Faroe Bank Cod Unknown
Unknown
Unknown
Unknown
- Closure of the fishery - Same advice as last year: Zero catch
Faroe Haddock Above target
Increased risk
Below trigger
Reduced reproductive capacity
F in 2013 should be no more than FMSY * B2013 / MSY Btrigger = 0.15
No direct fishing; minimize bycatch; implement recovery plan
- Precautionary considerations: Zero catch
Faroe Saithe Above target
Harvested unsustainably
Above trigger
Full reproductive capacity
Effort should be reduced such that fishing mortality in 2013 will be no more than F = 0.28, corresponding to an 44% reduction in the present fishing mortality
Fishing mortality to be no more than Fpa = 0.28, resulting in a reduction of 44% in present fishing mortality
- MSY approach: F<0.28
The advice for Ling appears in ICES Advice 2012, Section 9.4.10.3 on Widely Distributed Stocks. This is a biennial advice. Table 4.3.2.2 Summary of the stock categories in the Faroe Plateau ecoregion (see section 1.2 for category definitions). Total Number of stock in the ecoregion 4 Data rich stocks 3 Data-limited stocks 1
2
ICES Advice 2012, Book 4
ICES Advice 2011, Book 4 3
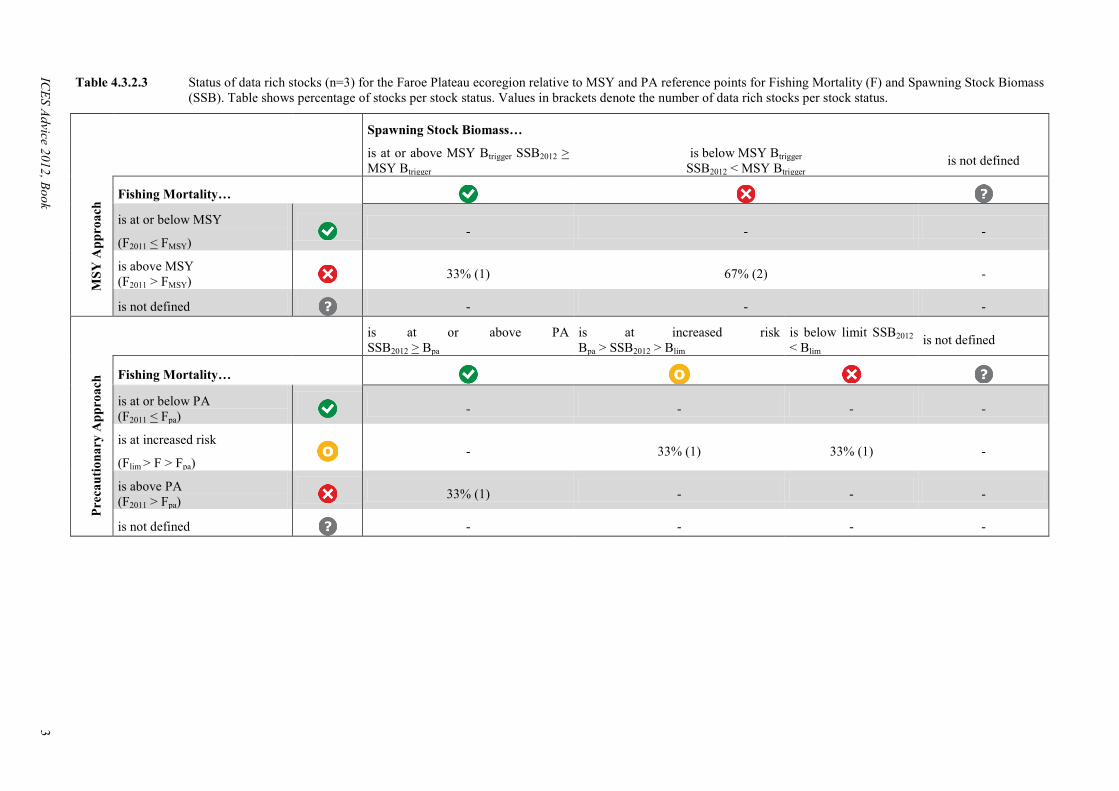
Table 4.3.2.3 Status of data rich stocks (n=3) for the Faroe Plateau ecoregion relative to MSY and PA reference points for Fishing Mortality (F) and Spawning Stock Biomass (SSB). Table shows percentage of stocks per stock status. Values in brackets denote the number of data rich stocks per stock status.
Spawning Stock Biomass…
is at or above MSY Btrigger SSB2012 > MSY Btrigger
is below MSY Btrigger SSB2012 < MSY Btrigger
is not defined
MSY
App
roac
h
Fishing Mortality…
is at or below MSY
(F2011 < FMSY)
- - -
is above MSY (F2011 > FMSY)
33% (1) 67% (2) -
is not defined
- - -
is at or above PA SSB2012 > Bpa
is at increased risk Bpa > SSB2012 > Blim
is below limit SSB2012 < Blim is not defined
Prec
autio
nary
App
roac
h Fishing Mortality…
is at or below PA (F2011 < Fpa)
- - - -
is at increased risk
(Flim > F > Fpa)
- 33% (1) 33% (1) -
is above PA (F2011 > Fpa)
33% (1) - - -
is not defined
- - - -
ICES Advice 2012, Book
3
4 ICES Advice 2012, Book 4
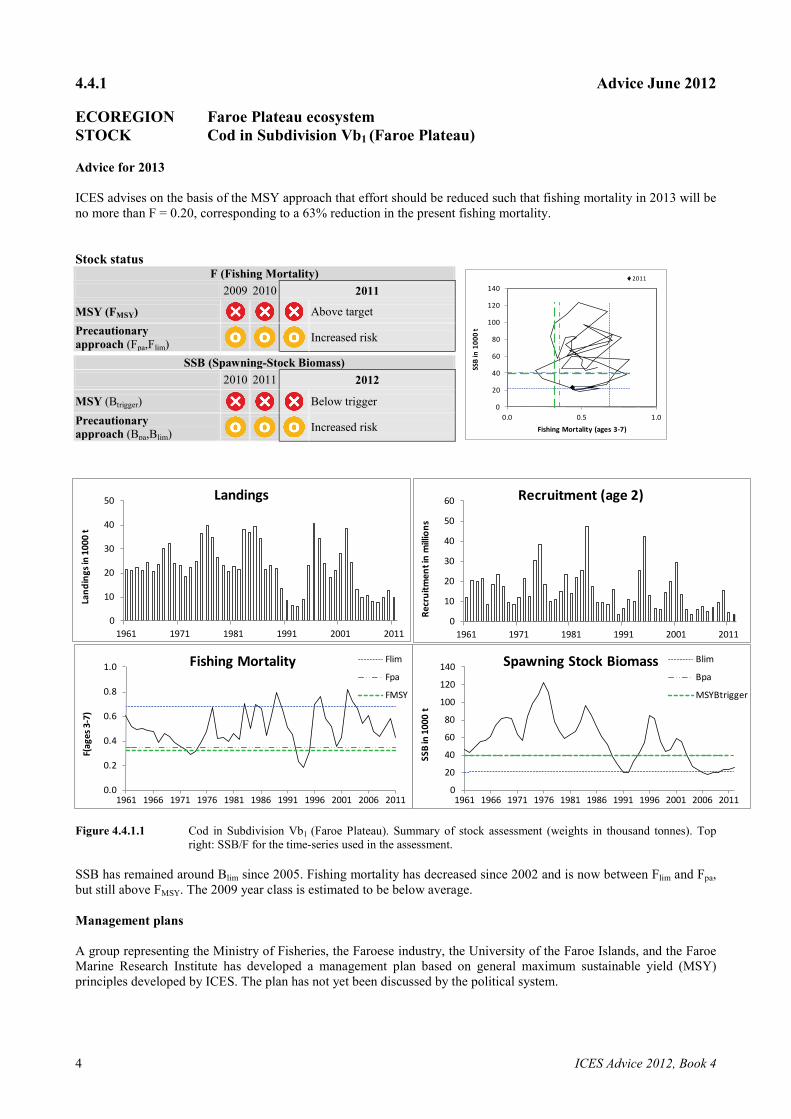
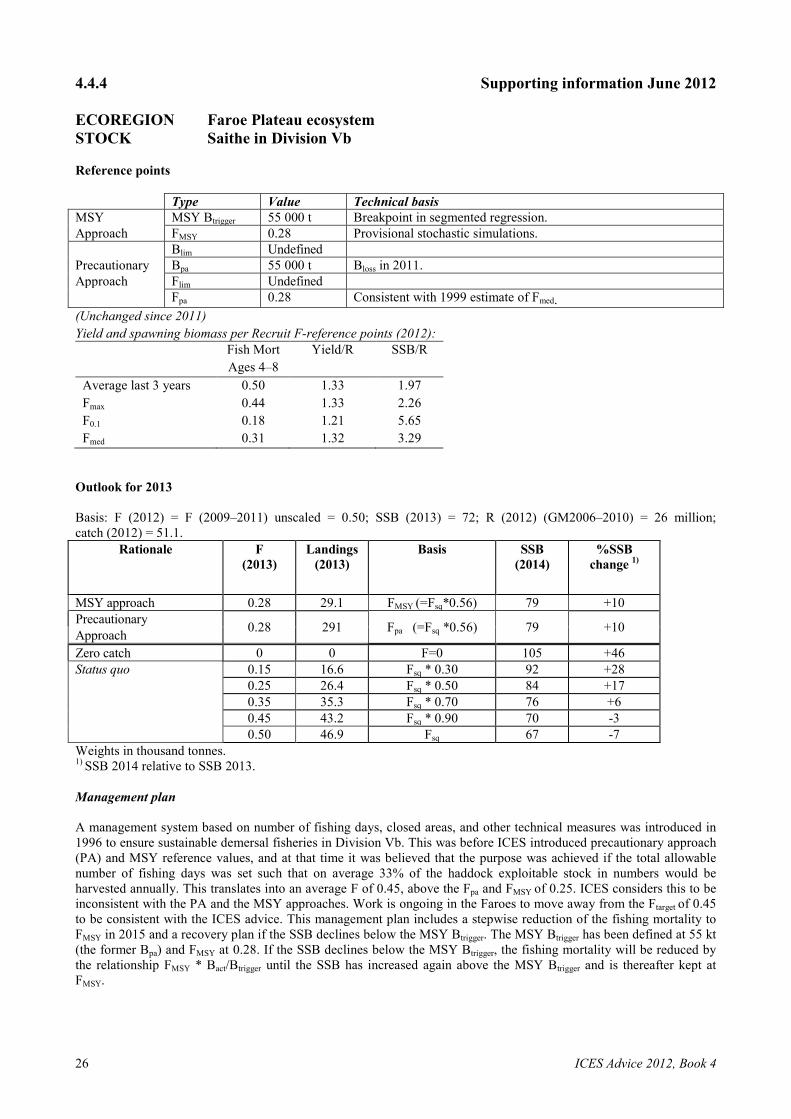
4.4.1 Advice June 2012 ECOREGION Faroe Plateau ecosystem STOCK Cod in Subdivision Vb1 (Faroe Plateau) Advice for 2013 ICES advises on the basis of the MSY approach that effort should be reduced such that fishing mortality in 2013 will be no more than F = 0.20, corresponding to a 63% reduction in the present fishing mortality. Stock status
F (Fishing Mortality) 2009 2010 2011
MSY (FMSY) Above target Precautionary approach (Fpa,Flim) Increased risk
SSB (Spawning-Stock Biomass) 2010 2011 2012
MSY (Btrigger) Below trigger Precautionary approach (Bpa,Blim) Increased risk
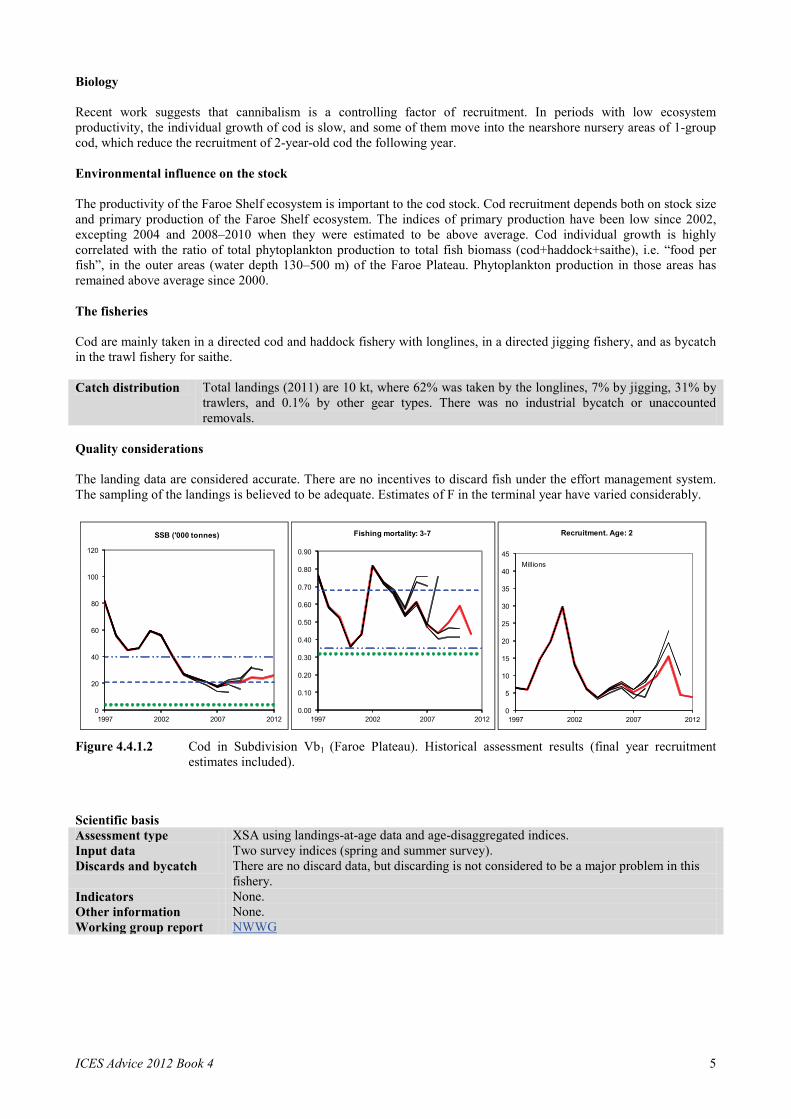
Figure 4.4.1.1 Cod in Subdivision Vb1 (Faroe Plateau). Summary of stock assessment (weights in thousand tonnes). Top
right: SSB/F for the time-series used in the assessment. SSB has remained around Blim since 2005. Fishing mortality has decreased since 2002 and is now between Flim and Fpa, but still above FMSY. The 2009 year class is estimated to be below average. Management plans A group representing the Ministry of Fisheries, the Faroese industry, the University of the Faroe Islands, and the Faroe Marine Research Institute has developed a management plan based on general maximum sustainable yield (MSY) principles developed by ICES. The plan has not yet been discussed by the political system.
0
10
20
30
40
50
1961 1971 1981 1991 2001 2011
Land
ings
in 1
000
t
Landings
0
20
40
60
80
100
120
140
1961 1966 1971 1976 1981 1986 1991 1996 2001 2006 2011
SSB
in 1
000
t
Spawning Stock Biomass Blim
Bpa
MSYBtrigger
0
20
40
60
80
100
120
140
0.0 0.5 1.0
SSB
in 1
000
t
Fishing Mortality (ages 3-7)
2011
0
10
20
30
40
50
60
1961 1971 1981 1991 2001 2011
Recr
uitm
ent i
n m
illio
ns
Recruitment (age 2)
0.0
0.2
0.4
0.6
0.8
1.0
1961 1966 1971 1976 1981 1986 1991 1996 2001 2006 2011
F(ag
es 3
-7)
Fishing Mortality Flim
Fpa
FMSY
ICES Advice 2012 Book 4 5
Biology Recent work suggests that cannibalism is a controlling factor of recruitment. In periods with low ecosystem productivity, the individual growth of cod is slow, and some of them move into the nearshore nursery areas of 1-group cod, which reduce the recruitment of 2-year-old cod the following year. Environmental influence on the stock The productivity of the Faroe Shelf ecosystem is important to the cod stock. Cod recruitment depends both on stock size and primary production of the Faroe Shelf ecosystem. The indices of primary production have been low since 2002, excepting 2004 and 2008–2010 when they were estimated to be above average. Cod individual growth is highly correlated with the ratio of total phytoplankton production to total fish biomass (cod+haddock+saithe), i.e. “food per fish”, in the outer areas (water depth 130–500 m) of the Faroe Plateau. Phytoplankton production in those areas has remained above average since 2000. The fisheries Cod are mainly taken in a directed cod and haddock fishery with longlines, in a directed jigging fishery, and as bycatch in the trawl fishery for saithe. Catch distribution Total landings (2011) are 10 kt, where 62% was taken by the longlines, 7% by jigging, 31% by
trawlers, and 0.1% by other gear types. There was no industrial bycatch or unaccounted removals.
Quality considerations The landing data are considered accurate. There are no incentives to discard fish under the effort management system. The sampling of the landings is believed to be adequate. Estimates of F in the terminal year have varied considerably.
0
20
40
60
80
100
120
1997 2002 2007 2012
SSB ('000 tonnes)
0.00
0.10
0.20
0.30
0.40
0.50
0.60
0.70
0.80
0.90
1997 2002 2007 2012
Fishing mortality: 3-7
0
5
10
15
20
25
30
35
40
45
1997 2002 2007 2012
Millions
Recruitment. Age: 2
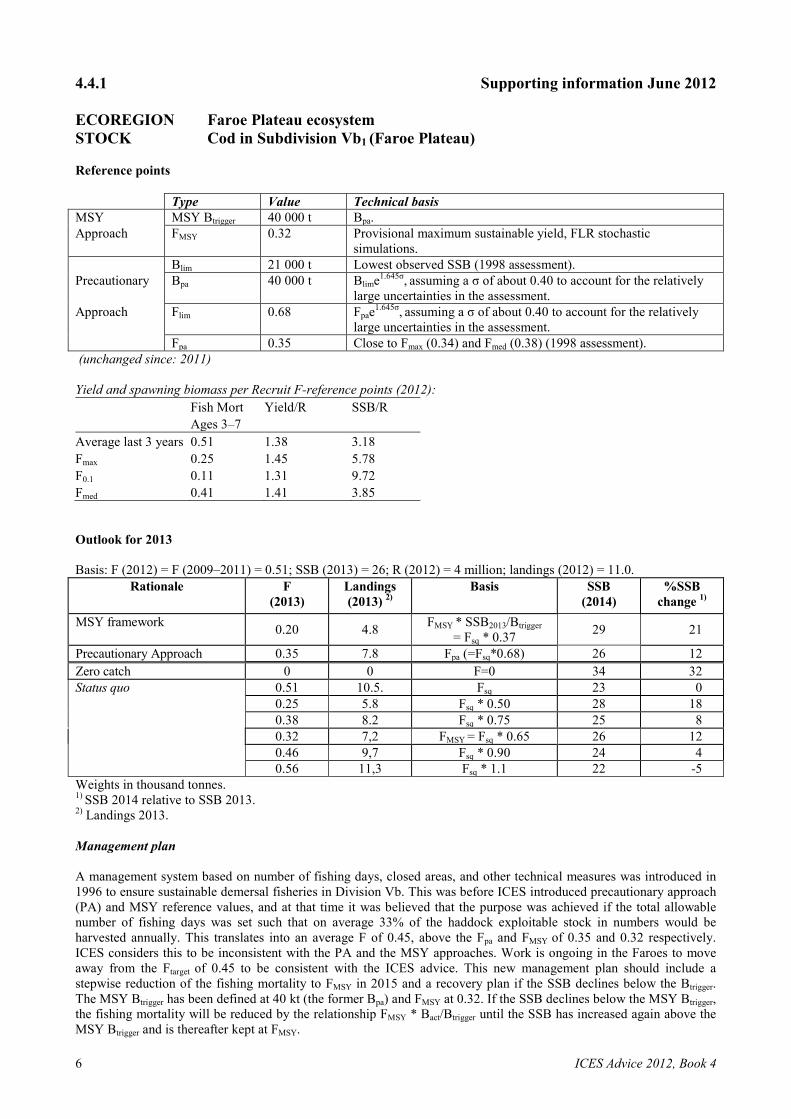
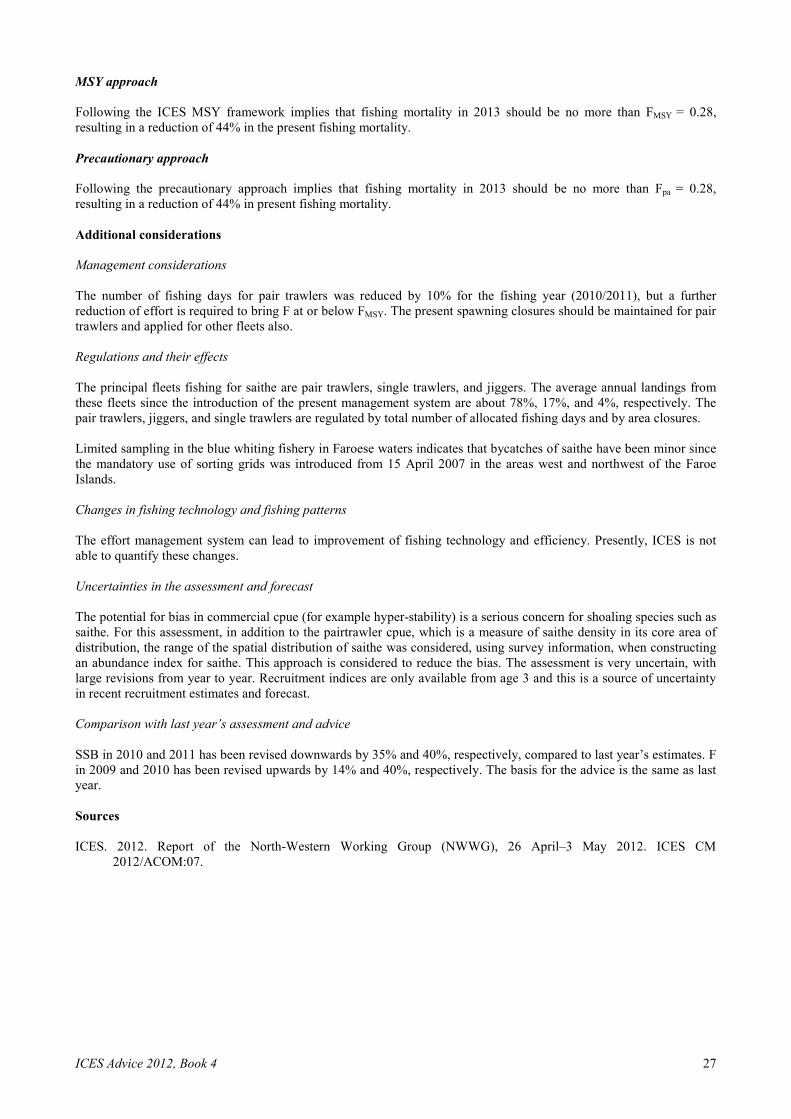
Figure 4.4.1.2 Cod in Subdivision Vb1 (Faroe Plateau). Historical assessment results (final year recruitment
estimates included). Scientific basis Assessment type XSA using landings-at-age data and age-disaggregated indices. Input data Two survey indices (spring and summer survey). Discards and bycatch There are no discard data, but discarding is not considered to be a major problem in this
fishery. Indicators None. Other information None. Working group report NWWG
6 ICES Advice 2012, Book 4
4.4.1 Supporting information June 2012 ECOREGION Faroe Plateau ecosystem STOCK Cod in Subdivision Vb1 (Faroe Plateau) Reference points Type Value Technical basis MSY MSY Btrigger 40 000 t Bpa. Approach FMSY 0.32 Provisional maximum sustainable yield, FLR stochastic
simulations. Blim 21 000 t Lowest observed SSB (1998 assessment). Precautionary Bpa 40 000 t Blime1.645σ, assuming a σ of about 0.40 to account for the relatively
large uncertainties in the assessment. Approach Flim 0.68 Fpae1.645σ, assuming a σ of about 0.40 to account for the relatively
large uncertainties in the assessment. Fpa 0.35 Close to Fmax (0.34) and Fmed (0.38) (1998 assessment). (unchanged since: 2011) Yield and spawning biomass per Recruit F-reference points (2012): Fish Mort Yield/R SSB/R Ages 3–7 Average last 3 years 0.51 1.38 3.18 Fmax 0.25 1.45 5.78 F0.1 0.11 1.31 9.72 Fmed 0.41 1.41 3.85 Outlook for 2013 Basis: F (2012) = F (2009–2011) = 0.51; SSB (2013) = 26; R (2012) = 4 million; landings (2012) = 11.0.
Rationale F (2013)
Landings (2013) 2)
Basis SSB (2014)
%SSB change 1)
MSY framework 0.20 4.8 FMSY * SSB2013/Btrigger = Fsq * 0.37 29 21
Precautionary Approach 0.35 7.8 Fpa (=Fsq*0.68) 26 12 Zero catch 0 0 F=0 34 32
Status quo 0.51 10.5. Fsq 23 0 0.25 5.8 Fsq * 0.50 28 18 0.38 8.2 Fsq * 0.75 25 8 0.32 7,2 FMSY = Fsq * 0.65 26 12 0.46 9,7 Fsq * 0.90 24 4 0.56 11,3 Fsq * 1.1 22 -5 Weights in thousand tonnes. 1) SSB 2014 relative to SSB 2013. 2) Landings 2013. Management plan A management system based on number of fishing days, closed areas, and other technical measures was introduced in 1996 to ensure sustainable demersal fisheries in Division Vb. This was before ICES introduced precautionary approach (PA) and MSY reference values, and at that time it was believed that the purpose was achieved if the total allowable number of fishing days was set such that on average 33% of the haddock exploitable stock in numbers would be harvested annually. This translates into an average F of 0.45, above the Fpa and FMSY of 0.35 and 0.32 respectively. ICES considers this to be inconsistent with the PA and the MSY approaches. Work is ongoing in the Faroes to move away from the Ftarget of 0.45 to be consistent with the ICES advice. This new management plan should include a stepwise reduction of the fishing mortality to FMSY in 2015 and a recovery plan if the SSB declines below the Btrigger. The MSY Btrigger has been defined at 40 kt (the former Bpa) and FMSY at 0.32. If the SSB declines below the MSY Btrigger, the fishing mortality will be reduced by the relationship FMSY * Bact/Btrigger until the SSB has increased again above the MSY Btrigger and is thereafter kept at FMSY.
ICES Advice 2012 Book 4 7
MSY approach ICES advises on the basis of the MSY approach to reduce fishing mortality by 63% in 2013 to 0.20. This is 38% below FMSY, because SSB in 2013 is 38% below MSY Btrigger. Precautionary approach The fishing mortality should be kept below an Fpa of 0.35. This translates into a reduction in fishing mortality by 30% as compared to the average of the last 3 years (0.51). Additional considerations Management considerations The present estimate of FMSY should be regarded as provisional. Simulation studies that take the productivity of the ecosystem into account have been tried, but this model is still under development. One of the expected benefits of the effort management system was more stability for the fishing fleet. The fleets were expected to target the most abundant fish species, thus reducing the fishing mortality on stocks that are at low levels. However, low prices on saithe and haddock and high prices for cod have kept the fishing mortality high on cod; the economic factors seem to be more important than the relative abundance of the stocks in determining which species is targeted. When considering future management, protection mechanisms should be included to ensure that appropriate action is taken when one or more stocks or fisheries develop in an unfavourable way. It is not easy to control fishing mortality by effort management if catchability varies. For baited hook gear, catchability may be related to the amount of food available in the ecosystem (Steingrund et al., 2009). Therefore, during the current low-productive period, fishing mortality may increase even though the number of fishing days is decreased. Regulations and their effects An effort management system was implemented 1 June 1996. Fishing days are allocated to all fleets fishing in waters < 380 m depth for the period 1 September–31 August. In addition the majority of the waters < ca. 200 m depth are closed to trawlers, and are mainly utilized by longliners. The main spawning areas for cod are closed for nearly all fishing gears during spawning time. In 2011, additional areas were closed in order to protect incoming year classes of cod. Changes in fishing technology and fishing patterns The effort management system can lead to improvement of fishing technology and efficiency. Presently, ICES is not able to quantify these changes. Comparison with last year’s assessment and advice The perception of the status of the stock with respect to reference points and trends in this year's assessment is similar to that of last year's assessment.. Comparing the 2010 estimates in last year’s assessment (2011) with this year’s assessment (2012) shows that recruitment has been revised downwards by 21%, the spawning-stock biomass revised downwards by 23%, and the fishing mortality revised upwards by 42%. The basis of the advice is the same as last year. Sources ICES. 2012. Report of the North-Western Working Group, 26 April–3 May 2012. ICES CM 2012/ACOM:07. Steingrund, P., Clementsen, D. H., and Mouritsen, R. 2009. Higher food abundance reduces the catchability of cod
(Gadus morhua) to longlines on the Faroe Plateau. Fisheries Research, 100: 230–239.
8 ICES Advice 2012, Book 4
0
10
20
30
40
50
60
0 20 40 60 80 100 120 140
Recr
uitm
ent (
age
2) in
mill
ions
SSB in 1000 t
Stock - Recruitment Blim
Bpa
MSYBtrigger
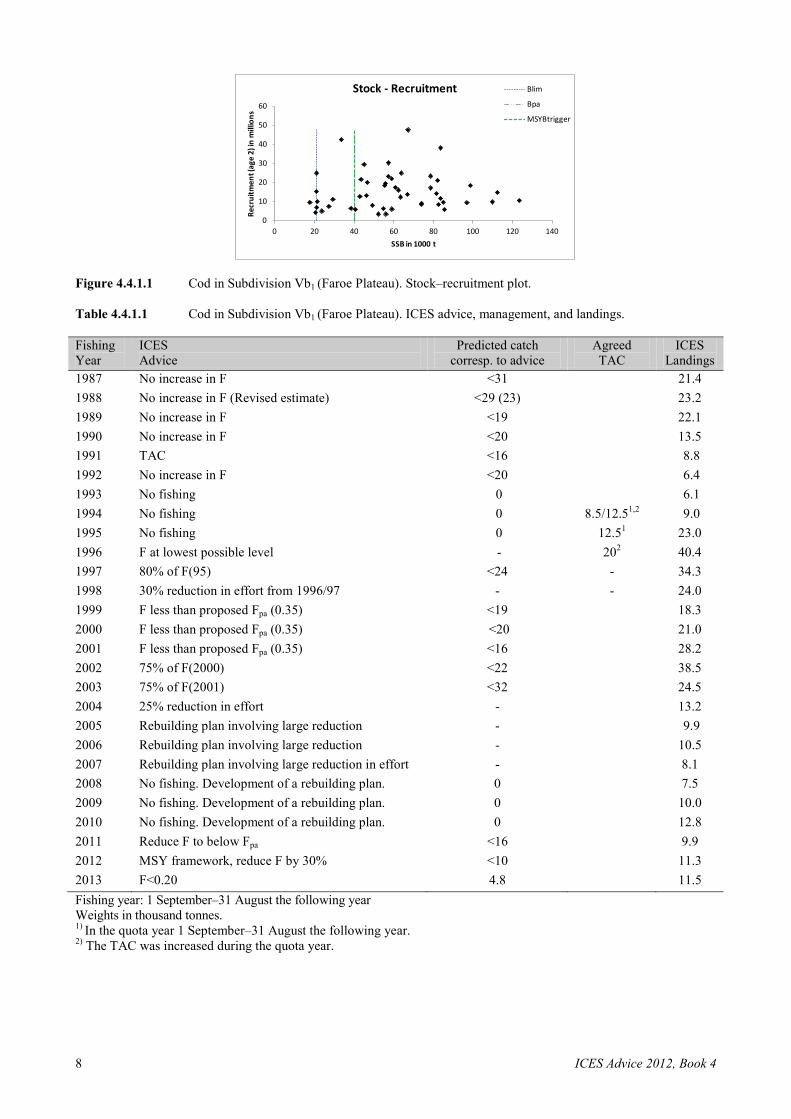
Figure 4.4.1.1 Cod in Subdivision Vb1 (Faroe Plateau). Stock–recruitment plot. Table 4.4.1.1 Cod in Subdivision Vb1 (Faroe Plateau). ICES advice, management, and landings. Fishing Year
ICES Advice
Predicted catch corresp. to advice
Agreed TAC
ICES Landings
1987 No increase in F <31 21.4 1988 No increase in F (Revised estimate) <29 (23) 23.2 1989 No increase in F <19 22.1 1990 No increase in F <20 13.5 1991 TAC <16 8.8 1992 No increase in F <20 6.4 1993 No fishing 0 6.1 1994 No fishing 0 8.5/12.51,2 9.0 1995 No fishing 0 12.51 23.0 1996 F at lowest possible level - 202 40.4 1997 80% of F(95) <24 - 34.3 1998 30% reduction in effort from 1996/97 - - 24.0 1999 F less than proposed Fpa (0.35) <19 18.3 2000 F less than proposed Fpa (0.35) <20 21.0 2001 F less than proposed Fpa (0.35) <16 28.2 2002 75% of F(2000) <22 38.5 2003 75% of F(2001) <32 24.5 2004 25% reduction in effort - 13.2 2005 Rebuilding plan involving large reduction - 9.9 2006 Rebuilding plan involving large reduction - 10.5 2007 Rebuilding plan involving large reduction in effort - 8.1 2008 No fishing. Development of a rebuilding plan. 0 7.5 2009 No fishing. Development of a rebuilding plan. 0 10.0 2010 No fishing. Development of a rebuilding plan. 0 12.8 2011 Reduce F to below Fpa <16 9.9 2012 MSY framework, reduce F by 30% <10 11.3 2013 F<0.20 4.8 11.5 Fishing year: 1 September–31 August the following year Weights in thousand tonnes. 1) In the quota year 1 September–31 August the following year. 2) The TAC was increased during the quota year.
ICES Advice 2012 Book 4 9
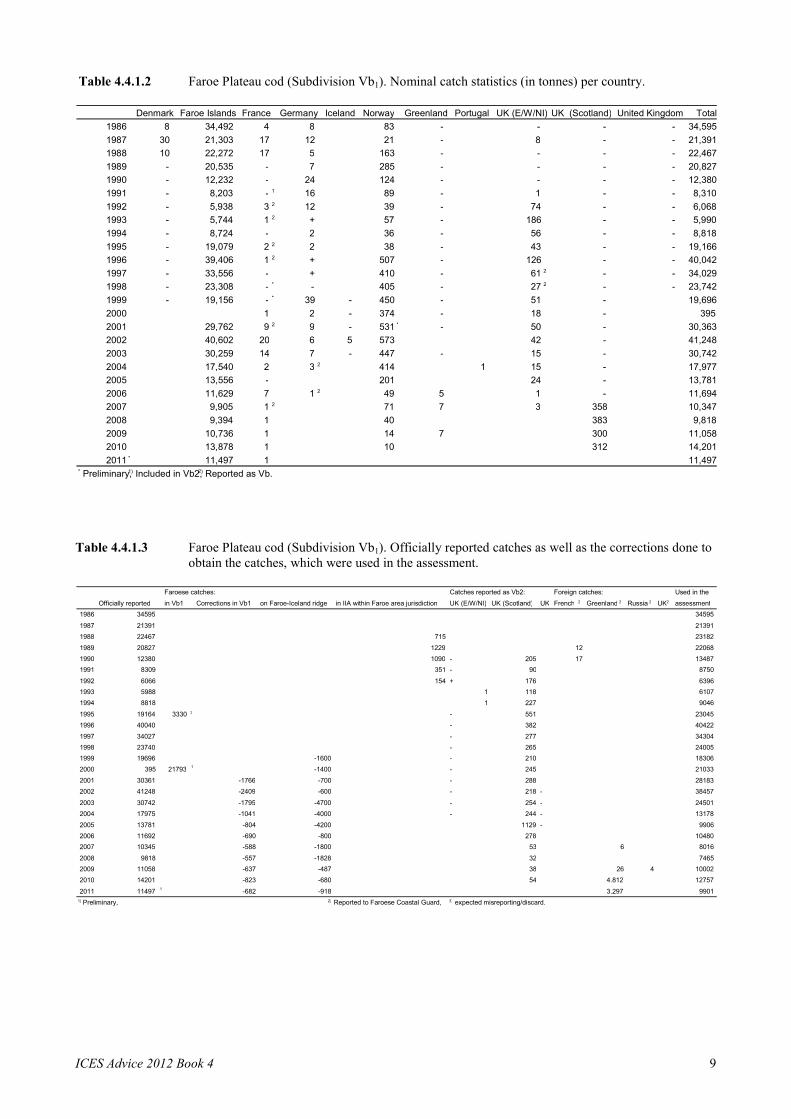
Table 4.4.1.2 Faroe Plateau cod (Subdivision Vb1). Nominal catch statistics (in tonnes) per country.
Table 4.4.1.3 Faroe Plateau cod (Subdivision Vb1). Officially reported catches as well as the corrections done to
obtain the catches, which were used in the assessment.
Faroese catches: Catches reported as Vb2: Foreign catches: Used in the Officially reported in Vb1 Corrections in Vb1 on Faroe-Iceland ridge in IIA within Faroe area jurisdiction UK (E/W/NI) UK (Scotland) UK French 2 Greenland 2 Russia 2 UK 2 assessment
1986 34595 34595 1987 21391 21391 1988 22467 715 23182 1989 20827 1229 12 22068 1990 12380 1090 - 205 17 13487 1991 8309 351 - 90 8750 1992 6066 154 + 176 6396 1993 5988 1 118 6107 1994 8818 1 227 9046 1995 19164 3330 3 - 551 23045 1996 40040 - 382 40422 1997 34027 - 277 34304 1998 23740 - 265 24005 1999 19696 -1600 - 210 18306 2000 395 21793 1
-1400 - 245 21033
2001 30361 -1766 -700 - 288 28183 2002 41248 -2409 -600 - 218 - 38457 2003 30742 -1795 -4700 - 254 - 24501 2004 17975 -1041 -4000 - 244 - 13178 2005 13781 -804 -4200 1129 - 9906 2006 11692 -690 -800 278 10480 2007 10345 -588 -1800 53 6 8016 2008 9818 -557 -1828 32 7465 2009 11058 -637 -487 38 26 4 10002 2010 14201 -823 -680 54 4.812 12757 2011 11497 1
-682 -918 3.297 9901
1) Preliminary, 2) Reported to Faroese Coastal Guard, 3) expected misreporting/discard.
Denmark Faroe Islands France Germany Iceland Norway Greenland Portugal UK (E/W/NI) UK (Scotland) United Kingdom Total 1986 8 34,492 4 8 83 - - - - 34,595 1987 30 21,303 17 12 21 - 8 - - 21,391 1988 10 22,272 17 5 163 - - - - 22,467 1989 - 20,535 - 7 285 - - - - 20,827 1990 - 12,232 - 24 124 - - - - 12,380 1991 - 8,203 - 1 16 89 - 1 - - 8,310 1992 - 5,938 3 2 12 39 - 74 - - 6,068 1993 - 5,744 1 2 + 57 - 186 - - 5,990 1994 - 8,724 - 2 36 - 56 - - 8,818 1995 - 19,079 2 2 2 38 - 43 - - 19,166 1996 - 39,406 1 2 + 507 - 126 - - 40,042 1997 - 33,556 - + 410 - 61 2 - - 34,029 1998 - 23,308 - * - 405 - 27 2 - - 23,742 1999 - 19,156 - * 39 - 450 - 51 - 19,696 2000 1 2 - 374 - 18 - 395 2001 29,762 9 2 9 - 531 * - 50 - 30,363 2002 40,602 20 6 5 573 42 - 41,248 2003 30,259 14 7 - 447 - 15 - 30,742 2004 17,540 2 3 2 414 1 15 - 17,977 2005 13,556 - 201 24 - 13,781 2006 11,629 7 1 2 49 5 1 - 11,694 2007 9,905 1 2 71 7 3 358 10,347 2008 9,394 1 40 383 9,818 2009 10,736 1 14 7 300 11,058 2010 13,878 1 10 312 14,201 2011 * 11,497 1 11,497
* Preliminary, 1) Included in Vb2, 2) Reported as Vb.
10 ICES Advice 2012, Book 4
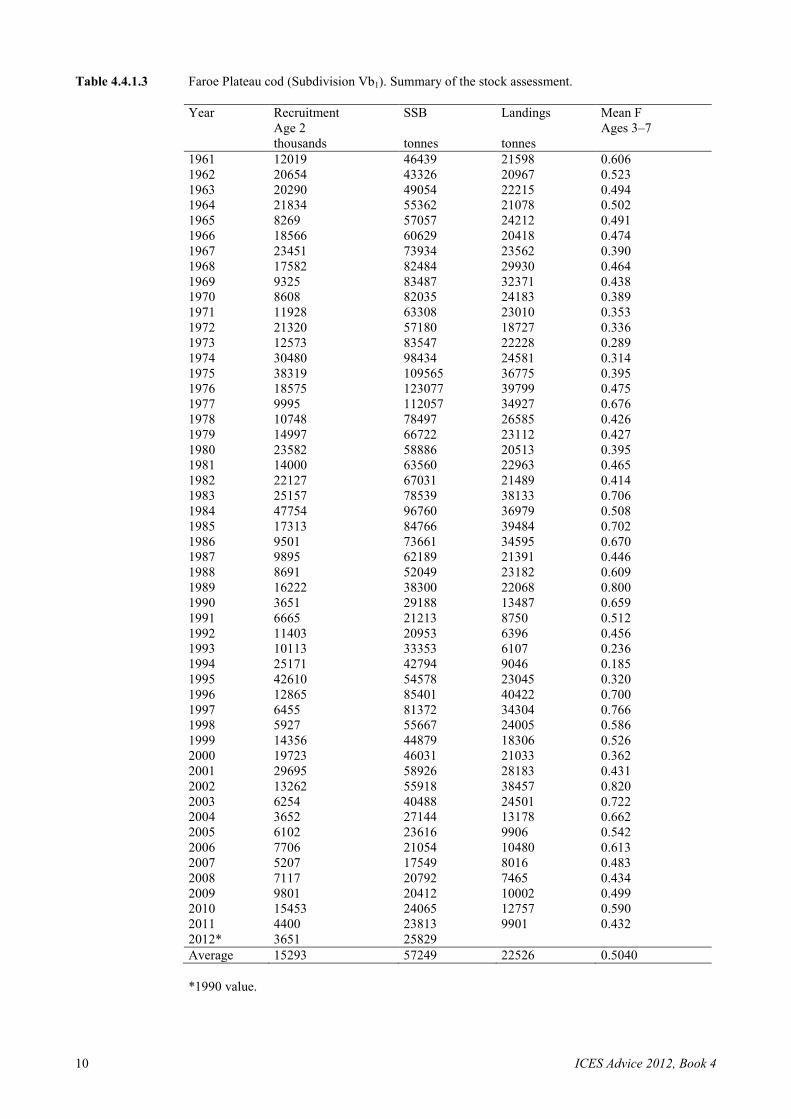
Table 4.4.1.3 Faroe Plateau cod (Subdivision Vb1). Summary of the stock assessment.
Year Recruitment SSB Landings Mean F
Age 2
Ages 3–7
thousands tonnes tonnes 1961 12019 46439 21598 0.606 1962 20654 43326 20967 0.523 1963 20290 49054 22215 0.494 1964 21834 55362 21078 0.502 1965 8269 57057 24212 0.491 1966 18566 60629 20418 0.474 1967 23451 73934 23562 0.390 1968 17582 82484 29930 0.464 1969 9325 83487 32371 0.438 1970 8608 82035 24183 0.389 1971 11928 63308 23010 0.353 1972 21320 57180 18727 0.336 1973 12573 83547 22228 0.289 1974 30480 98434 24581 0.314 1975 38319 109565 36775 0.395 1976 18575 123077 39799 0.475 1977 9995 112057 34927 0.676 1978 10748 78497 26585 0.426 1979 14997 66722 23112 0.427 1980 23582 58886 20513 0.395 1981 14000 63560 22963 0.465 1982 22127 67031 21489 0.414 1983 25157 78539 38133 0.706 1984 47754 96760 36979 0.508 1985 17313 84766 39484 0.702 1986 9501 73661 34595 0.670 1987 9895 62189 21391 0.446 1988 8691 52049 23182 0.609 1989 16222 38300 22068 0.800 1990 3651 29188 13487 0.659 1991 6665 21213 8750 0.512 1992 11403 20953 6396 0.456 1993 10113 33353 6107 0.236 1994 25171 42794 9046 0.185 1995 42610 54578 23045 0.320 1996 12865 85401 40422 0.700 1997 6455 81372 34304 0.766 1998 5927 55667 24005 0.586 1999 14356 44879 18306 0.526 2000 19723 46031 21033 0.362 2001 29695 58926 28183 0.431 2002 13262 55918 38457 0.820 2003 6254 40488 24501 0.722 2004 3652 27144 13178 0.662 2005 6102 23616 9906 0.542 2006 7706 21054 10480 0.613 2007 5207 17549 8016 0.483 2008 7117 20792 7465 0.434 2009 9801 20412 10002 0.499 2010 15453 24065 12757 0.590 2011 4400 23813 9901 0.432 2012* 3651 25829
Average 15293 57249 22526 0.5040 *1990 value.
ICES Advice 2012, Book 4 11
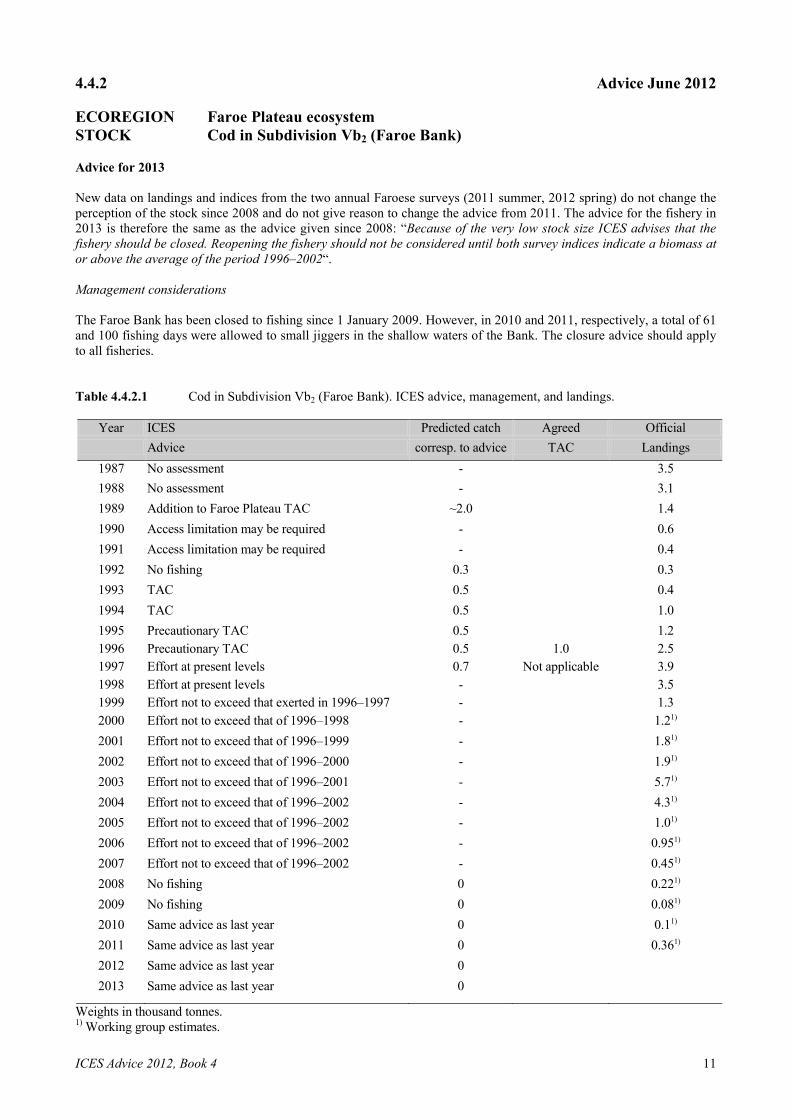
4.4.2 Advice June 2012 ECOREGION Faroe Plateau ecosystem STOCK Cod in Subdivision Vb2 (Faroe Bank) Advice for 2013 New data on landings and indices from the two annual Faroese surveys (2011 summer, 2012 spring) do not change the perception of the stock since 2008 and do not give reason to change the advice from 2011. The advice for the fishery in 2013 is therefore the same as the advice given since 2008: “Because of the very low stock size ICES advises that the fishery should be closed. Reopening the fishery should not be considered until both survey indices indicate a biomass at or above the average of the period 1996–2002“. Management considerations The Faroe Bank has been closed to fishing since 1 January 2009. However, in 2010 and 2011, respectively, a total of 61 and 100 fishing days were allowed to small jiggers in the shallow waters of the Bank. The closure advice should apply to all fisheries. Table 4.4.2.1 Cod in Subdivision Vb2 (Faroe Bank). ICES advice, management, and landings.
Year ICES Predicted catch Agreed Official Advice corresp. to advice TAC Landings
1987 No assessment - 3.5 1988 No assessment - 3.1 1989 Addition to Faroe Plateau TAC ~2.0 1.4 1990 Access limitation may be required - 0.6 1991 Access limitation may be required - 0.4 1992 No fishing 0.3 0.3 1993 TAC 0.5 0.4 1994 TAC 0.5 1.0 1995 Precautionary TAC 0.5 1.2 1996 Precautionary TAC 0.5 1.0 2.5 1997 Effort at present levels 0.7 Not applicable 3.9 1998 Effort at present levels - 3.5 1999 Effort not to exceed that exerted in 1996–1997 - 1.3 2000 Effort not to exceed that of 1996–1998 - 1.21)
2001 Effort not to exceed that of 1996–1999 - 1.81)
2002 Effort not to exceed that of 1996–2000 - 1.91)
2003 Effort not to exceed that of 1996–2001 - 5.71)
2004 Effort not to exceed that of 1996–2002 - 4.31)
2005 Effort not to exceed that of 1996–2002 - 1.01)
2006 Effort not to exceed that of 1996–2002 - 0.951)
2007 Effort not to exceed that of 1996–2002 - 0.451) 2008 No fishing 0 0.221) 2009 No fishing 0 0.081) 2010 Same advice as last year 0 0.11) 2011
Same advice as last year 0 0.361)
2012 Same advice as last year 0 2013 Same advice as last year 0
Weights in thousand tonnes. 1) Working group estimates.
12 ICES Advice 2012, Book 4
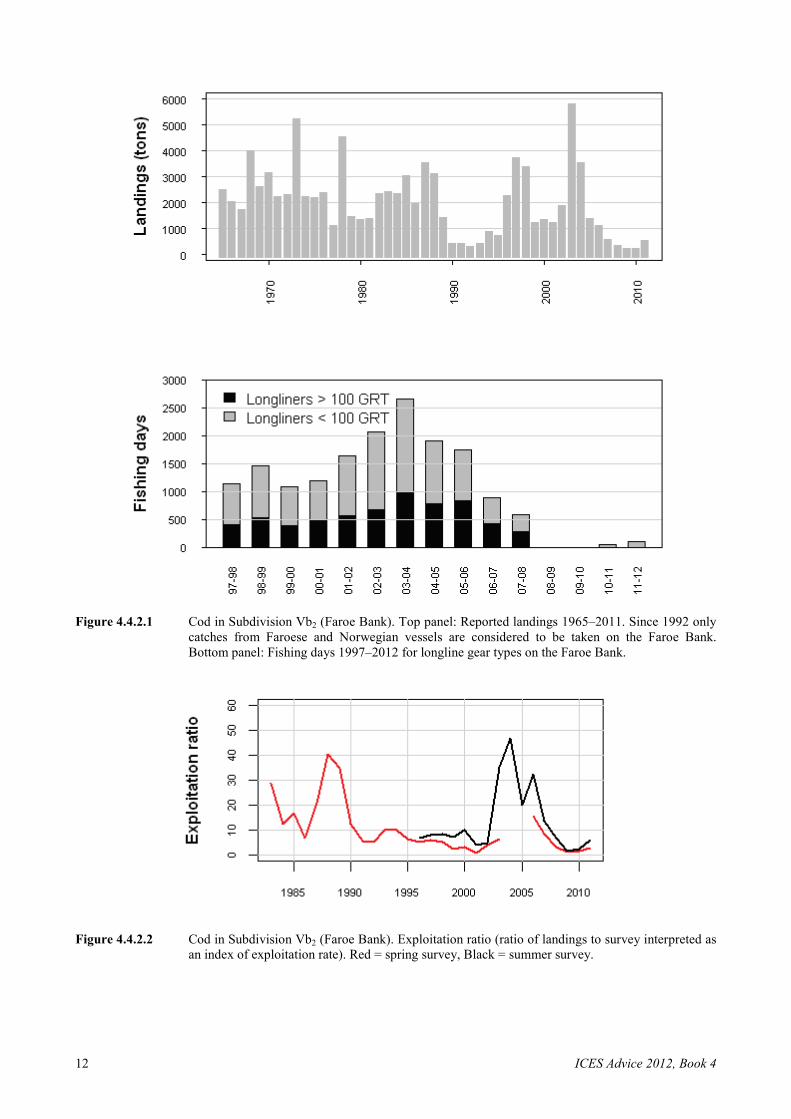
Figure 4.4.2.1 Cod in Subdivision Vb2 (Faroe Bank). Top panel: Reported landings 1965–2011. Since 1992 only
catches from Faroese and Norwegian vessels are considered to be taken on the Faroe Bank. Bottom panel: Fishing days 1997–2012 for longline gear types on the Faroe Bank.
Figure 4.4.2.2 Cod in Subdivision Vb2 (Faroe Bank). Exploitation ratio (ratio of landings to survey interpreted as
an index of exploitation rate). Red = spring survey, Black = summer survey.
ICES Advice 2012, Book 4 13
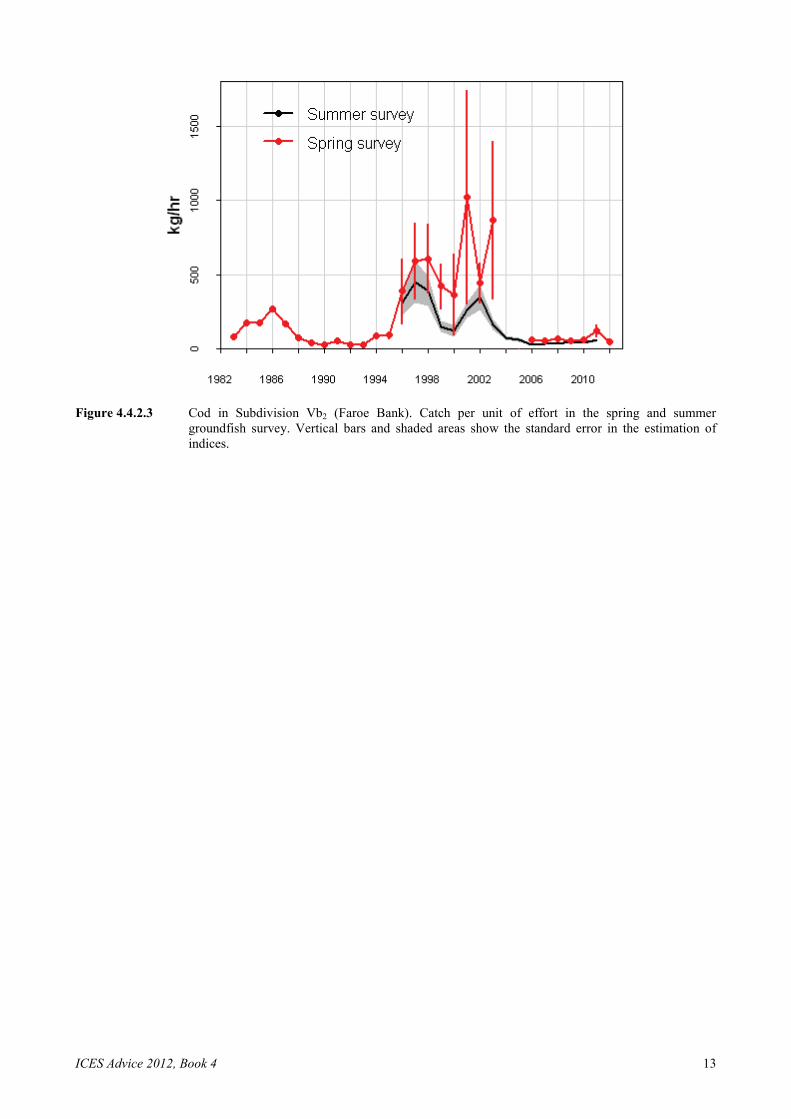
Figure 4.4.2.3 Cod in Subdivision Vb2 (Faroe Bank). Catch per unit of effort in the spring and summer
groundfish survey. Vertical bars and shaded areas show the standard error in the estimation of indices.
14 ICES Advice 2012, Book 4
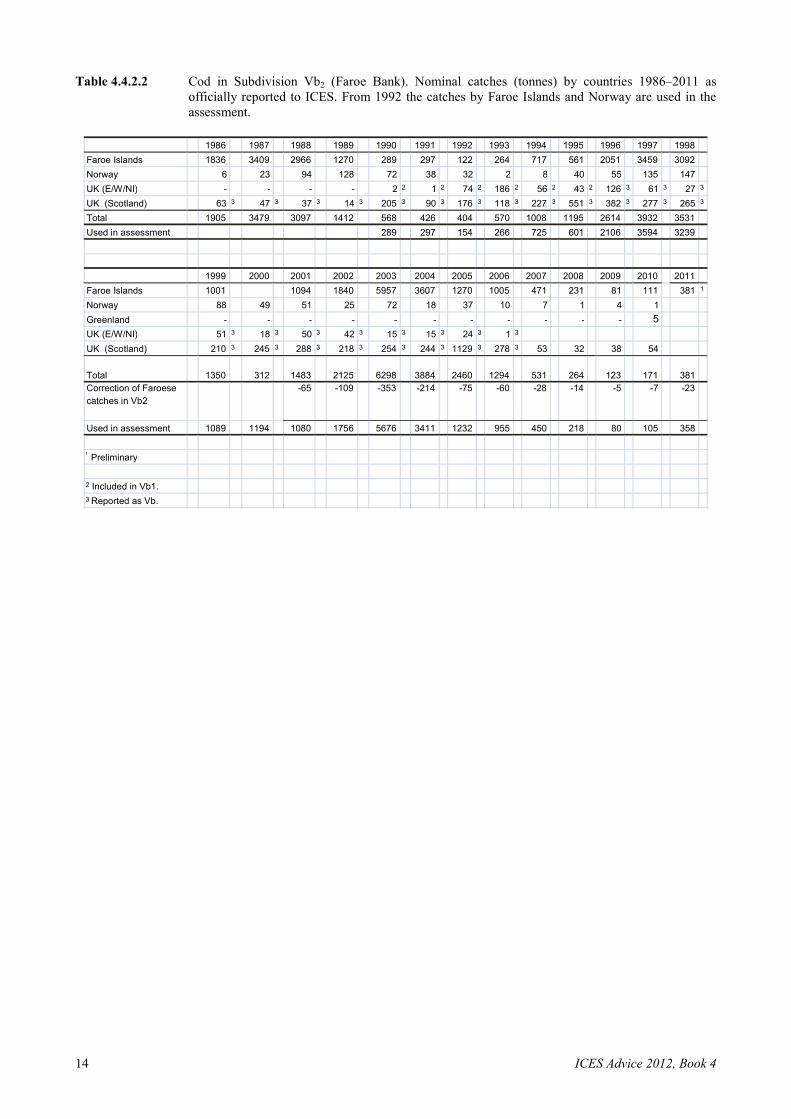
Table 4.4.2.2 Cod in Subdivision Vb2 (Faroe Bank). Nominal catches (tonnes) by countries 1986–2011 as officially reported to ICES. From 1992 the catches by Faroe Islands and Norway are used in the assessment.
1986 1987 1988 1989 1990 1991 1992 1993 1994 1995 1996 1997 1998 Faroe Islands 1836 3409 2966 1270 289 297 122 264 717 561 2051 3459 3092 Norway 6 23 94 128 72 38 32 2 8 40 55 135 147 UK (E/W/NI) - - - - 2 2 1 2 74 2 186 2 56 2 43 2 126 3 61 3 27 3 UK (Scotland) 63 3 47 3 37 3 14 3 205 3 90 3 176 3 118 3 227 3 551 3 382 3 277 3 265 3 Total 1905 3479 3097 1412 568 426 404 570 1008 1195 2614 3932 3531 Used in assessment 289 297 154 266 725 601 2106 3594 3239
1999 2000 2001 2002 2003 2004 2005 2006 2007 2008 2009 2010 2011 Faroe Islands 1001 1094 1840 5957 3607 1270 1005 471 231 81 111 381 1 Norway 88 49 51 25 72 18 37 10 7 1 4 1 Greenland - - - - - - - - - - - 5 UK (E/W/NI) 51 3 18 3 50 3 42 3 15 3 15 3 24 3 1 3 UK (Scotland) 210 3 245 3 288 3 218 3 254 3 244 3 1129 3 278 3 53 32 38 54
Total 1350 312 1483 2125 6298 3884 2460 1294 531 264 123 171 381 Correction of Faroese catches in Vb2
-65 -109 -353 -214 -75 -60 -28 -14 -5 -7 -23
Used in assessment 1089 1194 1080 1756 5676 3411 1232 955 450 218 80 105 358
1 Preliminary 2 Included in Vb1. 3 Reported as Vb.
ICES Advice 2012, Book 4 15
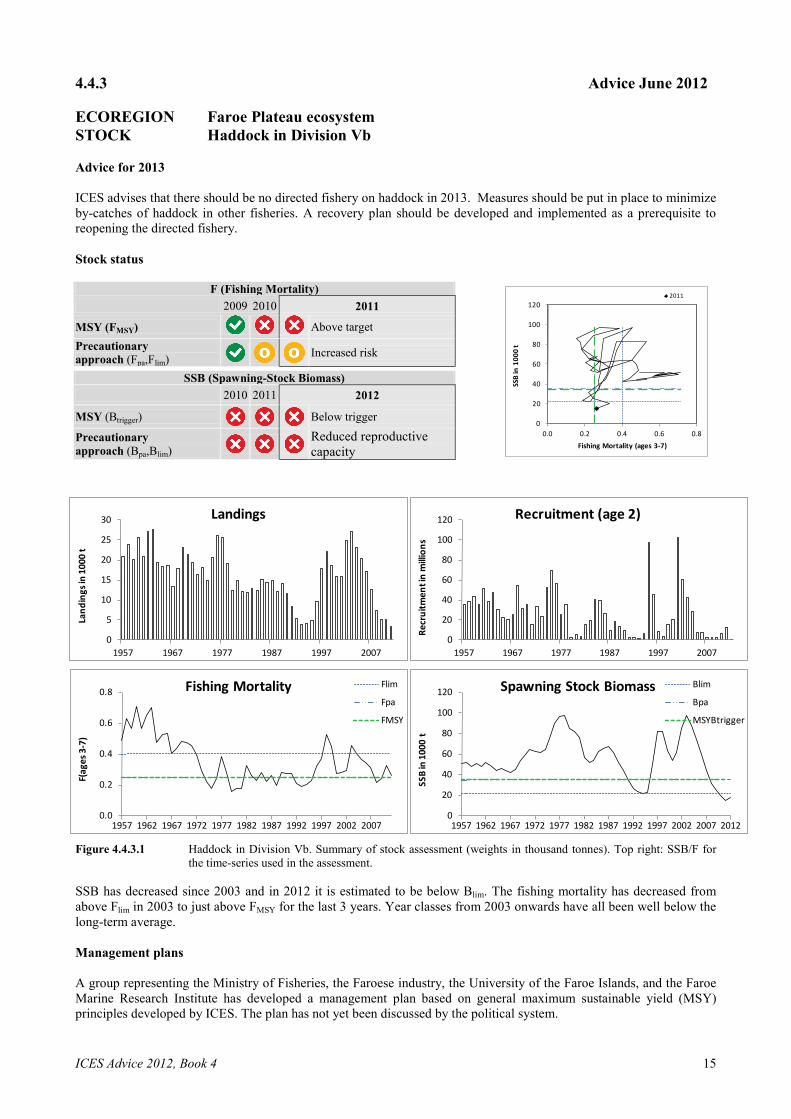
4.4.3 Advice June 2012 ECOREGION Faroe Plateau ecosystem STOCK Haddock in Division Vb Advice for 2013 ICES advises that there should be no directed fishery on haddock in 2013. Measures should be put in place to minimize by-catches of haddock in other fisheries. A recovery plan should be developed and implemented as a prerequisite to reopening the directed fishery. Stock status
F (Fishing Mortality) 2009 2010 2011
MSY (FMSY) Above target Precautionary approach (Fpa,Flim) Increased risk
SSB (Spawning-Stock Biomass) 2010 2011 2012
MSY (Btrigger) Below trigger
Precautionary approach (Bpa,Blim)
Reduced reproductive capacity
Figure 4.4.3.1 Haddock in Division Vb. Summary of stock assessment (weights in thousand tonnes). Top right: SSB/F for
the time-series used in the assessment. SSB has decreased since 2003 and in 2012 it is estimated to be below Blim. The fishing mortality has decreased from above Flim in 2003 to just above FMSY for the last 3 years. Year classes from 2003 onwards have all been well below the long-term average. Management plans A group representing the Ministry of Fisheries, the Faroese industry, the University of the Faroe Islands, and the Faroe Marine Research Institute has developed a management plan based on general maximum sustainable yield (MSY) principles developed by ICES. The plan has not yet been discussed by the political system.
0
5
10
15
20
25
30
1957 1967 1977 1987 1997 2007
Land
ings
in 1
000
t
Landings
0
20
40
60
80
100
120
1957 1967 1977 1987 1997 2007
Recr
uitm
ent i
n m
illio
ns
Recruitment (age 2)
0.0
0.2
0.4
0.6
0.8
1957 1962 1967 1972 1977 1982 1987 1992 1997 2002 2007
F(ag
es 3
-7)
Fishing Mortality Flim
Fpa
FMSY
0
20
40
60
80
100
120
1957 1962 1967 1972 1977 1982 1987 1992 1997 2002 2007 2012
SSB
in 1
000
t
Spawning Stock Biomass Blim
Bpa
MSYBtrigger
0
20
40
60
80
100
120
0.0 0.2 0.4 0.6 0.8
SSB
in 1
000
t
Fishing Mortality (ages 3-7)
2011
16 ICES Advice 2012, Book 4
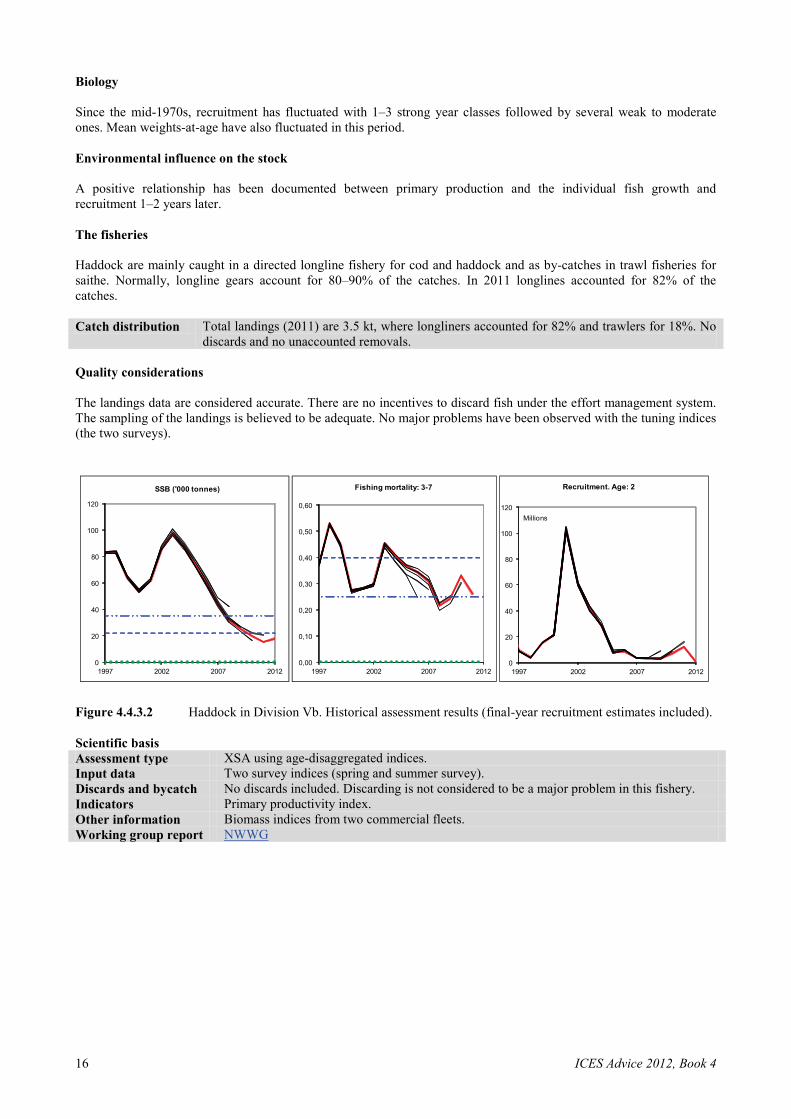
Biology Since the mid-1970s, recruitment has fluctuated with 1–3 strong year classes followed by several weak to moderate ones. Mean weights-at-age have also fluctuated in this period. Environmental influence on the stock A positive relationship has been documented between primary production and the individual fish growth and recruitment 1–2 years later. The fisheries Haddock are mainly caught in a directed longline fishery for cod and haddock and as by-catches in trawl fisheries for saithe. Normally, longline gears account for 80–90% of the catches. In 2011 longlines accounted for 82% of the catches. Catch distribution Total landings (2011) are 3.5 kt, where longliners accounted for 82% and trawlers for 18%. No
discards and no unaccounted removals. Quality considerations The landings data are considered accurate. There are no incentives to discard fish under the effort management system. The sampling of the landings is believed to be adequate. No major problems have been observed with the tuning indices (the two surveys).
0
20
40
60
80
100
120
1997 2002 2007 2012
SSB ('000 tonnes)
0,00
0,10
0,20
0,30
0,40
0,50
0,60
1997 2002 2007 2012
Fishing mortality: 3-7
0
20
40
60
80
100
120
1997 2002 2007 2012
Millions
Recruitment. Age: 2
Figure 4.4.3.2 Haddock in Division Vb. Historical assessment results (final-year recruitment estimates included). Scientific basis Assessment type XSA using age-disaggregated indices. Input data Two survey indices (spring and summer survey). Discards and bycatch No discards included. Discarding is not considered to be a major problem in this fishery. Indicators Primary productivity index. Other information Biomass indices from two commercial fleets. Working group report NWWG
ICES Advice 2012, Book 4 17
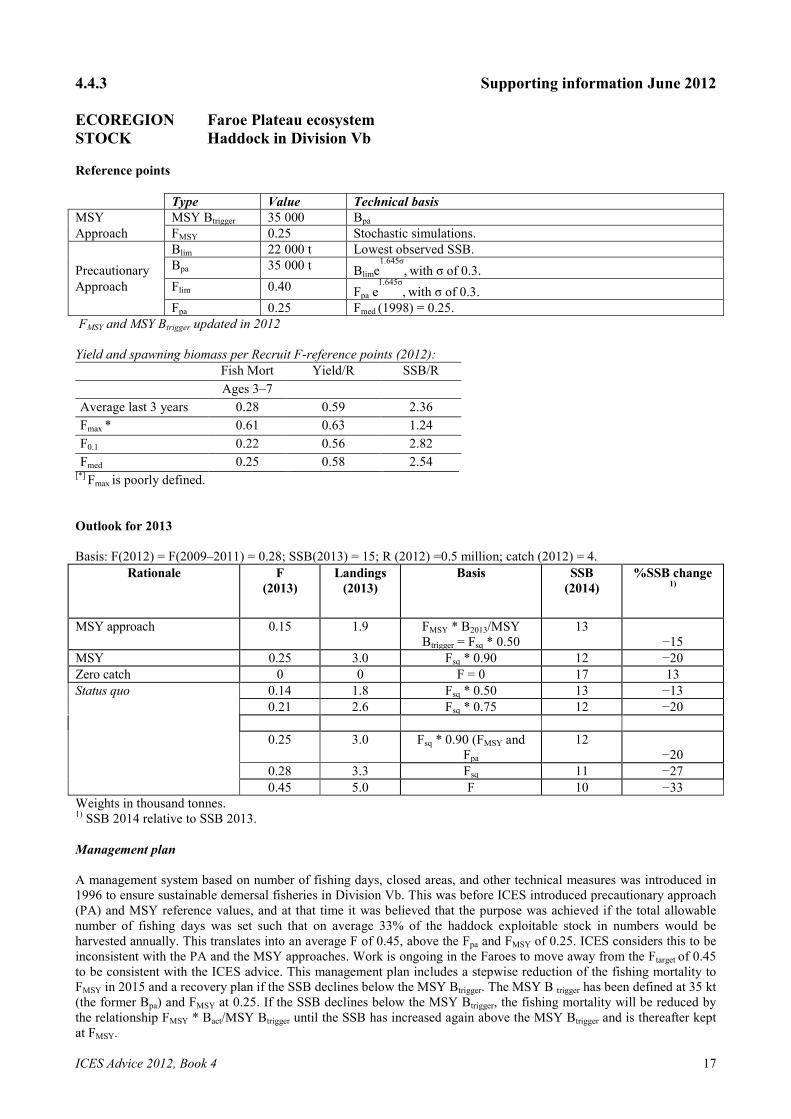
4.4.3 Supporting information June 2012 ECOREGION Faroe Plateau ecosystem STOCK Haddock in Division Vb Reference points Type Value Technical basis MSY MSY Btrigger 35 000 Bpa Approach FMSY 0.25 Stochastic simulations. Blim 22 000 t Lowest observed SSB. Precautionary Bpa 35 000 t Blime
1.645σ, with σ of 0.3.
Approach Flim 0.40 Fpa e1.645σ
, with σ of 0.3.
Fpa 0.25 Fmed (1998) = 0.25. FMSY and MSY Btrigger updated in 2012 Yield and spawning biomass per Recruit F-reference points (2012): Fish Mort Yield/R SSB/R Ages 3–7 Average last 3 years 0.28 0.59 2.36 Fmax * 0.61 0.63 1.24 F0.1 0.22 0.56 2.82 Fmed 0.25 0.58 2.54
[*] Fmax is poorly defined. Outlook for 2013 Basis: F(2012) = F(2009–2011) = 0.28; SSB(2013) = 15; R (2012) =0.5 million; catch (2012) = 4.
Rationale F (2013)
Landings (2013)
Basis SSB (2014)
%SSB change 1)
MSY approach 0.15 1.9 FMSY * B2013/MSY Btrigger = Fsq * 0.50
13 −15
MSY 0.25 3.0 Fsq * 0.90 12 −20 Zero catch 0 0 F = 0 17 13 Status quo 0.14 1.8 Fsq * 0.50 13 −13 0.21 2.6 Fsq * 0.75 12 −20 0.25 3.0 Fsq * 0.90 (FMSY and
Fpa 12
−20 0.28 3.3 Fsq 11 −27 0.45 5.0 F 10 −33 Weights in thousand tonnes. 1) SSB 2014 relative to SSB 2013. Management plan A management system based on number of fishing days, closed areas, and other technical measures was introduced in 1996 to ensure sustainable demersal fisheries in Division Vb. This was before ICES introduced precautionary approach (PA) and MSY reference values, and at that time it was believed that the purpose was achieved if the total allowable number of fishing days was set such that on average 33% of the haddock exploitable stock in numbers would be harvested annually. This translates into an average F of 0.45, above the Fpa and FMSY of 0.25. ICES considers this to be inconsistent with the PA and the MSY approaches. Work is ongoing in the Faroes to move away from the Ftarget of 0.45 to be consistent with the ICES advice. This management plan includes a stepwise reduction of the fishing mortality to FMSY in 2015 and a recovery plan if the SSB declines below the MSY Btrigger. The MSY B trigger has been defined at 35 kt (the former Bpa) and FMSY at 0.25. If the SSB declines below the MSY Btrigger, the fishing mortality will be reduced by the relationship FMSY * Bact/MSY Btrigger until the SSB has increased again above the MSY Btrigger and is thereafter kept at FMSY.
18 ICES Advice 2012, Book 4
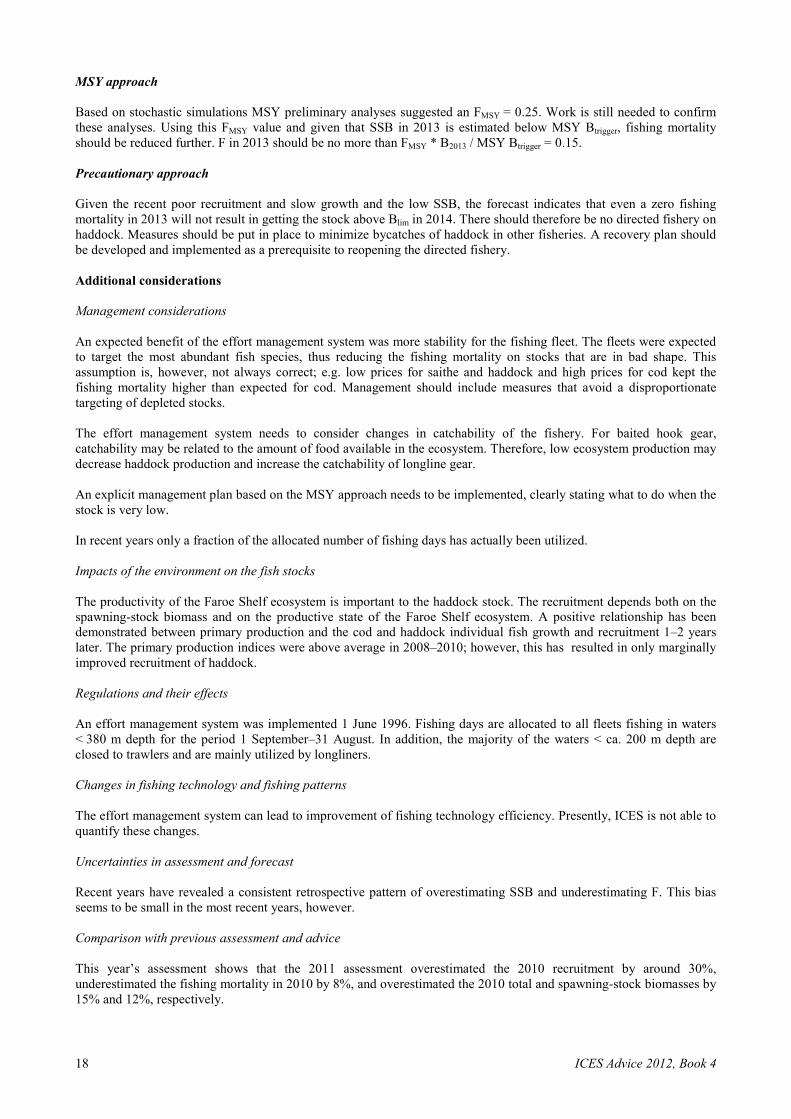
MSY approach Based on stochastic simulations MSY preliminary analyses suggested an FMSY = 0.25. Work is still needed to confirm these analyses. Using this FMSY value and given that SSB in 2013 is estimated below MSY Btrigger, fishing mortality should be reduced further. F in 2013 should be no more than FMSY * B2013 / MSY Btrigger = 0.15. Precautionary approach Given the recent poor recruitment and slow growth and the low SSB, the forecast indicates that even a zero fishing mortality in 2013 will not result in getting the stock above Blim in 2014. There should therefore be no directed fishery on haddock. Measures should be put in place to minimize bycatches of haddock in other fisheries. A recovery plan should be developed and implemented as a prerequisite to reopening the directed fishery. Additional considerations Management considerations An expected benefit of the effort management system was more stability for the fishing fleet. The fleets were expected to target the most abundant fish species, thus reducing the fishing mortality on stocks that are in bad shape. This assumption is, however, not always correct; e.g. low prices for saithe and haddock and high prices for cod kept the fishing mortality higher than expected for cod. Management should include measures that avoid a disproportionate targeting of depleted stocks. The effort management system needs to consider changes in catchability of the fishery. For baited hook gear, catchability may be related to the amount of food available in the ecosystem. Therefore, low ecosystem production may decrease haddock production and increase the catchability of longline gear. An explicit management plan based on the MSY approach needs to be implemented, clearly stating what to do when the stock is very low. In recent years only a fraction of the allocated number of fishing days has actually been utilized. Impacts of the environment on the fish stocks The productivity of the Faroe Shelf ecosystem is important to the haddock stock. The recruitment depends both on the spawning-stock biomass and on the productive state of the Faroe Shelf ecosystem. A positive relationship has been demonstrated between primary production and the cod and haddock individual fish growth and recruitment 1–2 years later. The primary production indices were above average in 2008–2010; however, this has resulted in only marginally improved recruitment of haddock. Regulations and their effects An effort management system was implemented 1 June 1996. Fishing days are allocated to all fleets fishing in waters < 380 m depth for the period 1 September–31 August. In addition, the majority of the waters < ca. 200 m depth are closed to trawlers and are mainly utilized by longliners. Changes in fishing technology and fishing patterns The effort management system can lead to improvement of fishing technology efficiency. Presently, ICES is not able to quantify these changes. Uncertainties in assessment and forecast Recent years have revealed a consistent retrospective pattern of overestimating SSB and underestimating F. This bias seems to be small in the most recent years, however. Comparison with previous assessment and advice This year’s assessment shows that the 2011 assessment overestimated the 2010 recruitment by around 30%, underestimated the fishing mortality in 2010 by 8%, and overestimated the 2010 total and spawning-stock biomasses by 15% and 12%, respectively.
ICES Advice 2012, Book 4 19
The advice last year was for no directed fishery on haddock in 2012, based on the precautionary approach, and to minimize bycatches in other fisheries. This year’s advice is based on the MSY approach. Source ICES. 2012. Report of the North-Western Working Group. 26 April–3 May 2012. ICES CM 2012/ACOM:07.
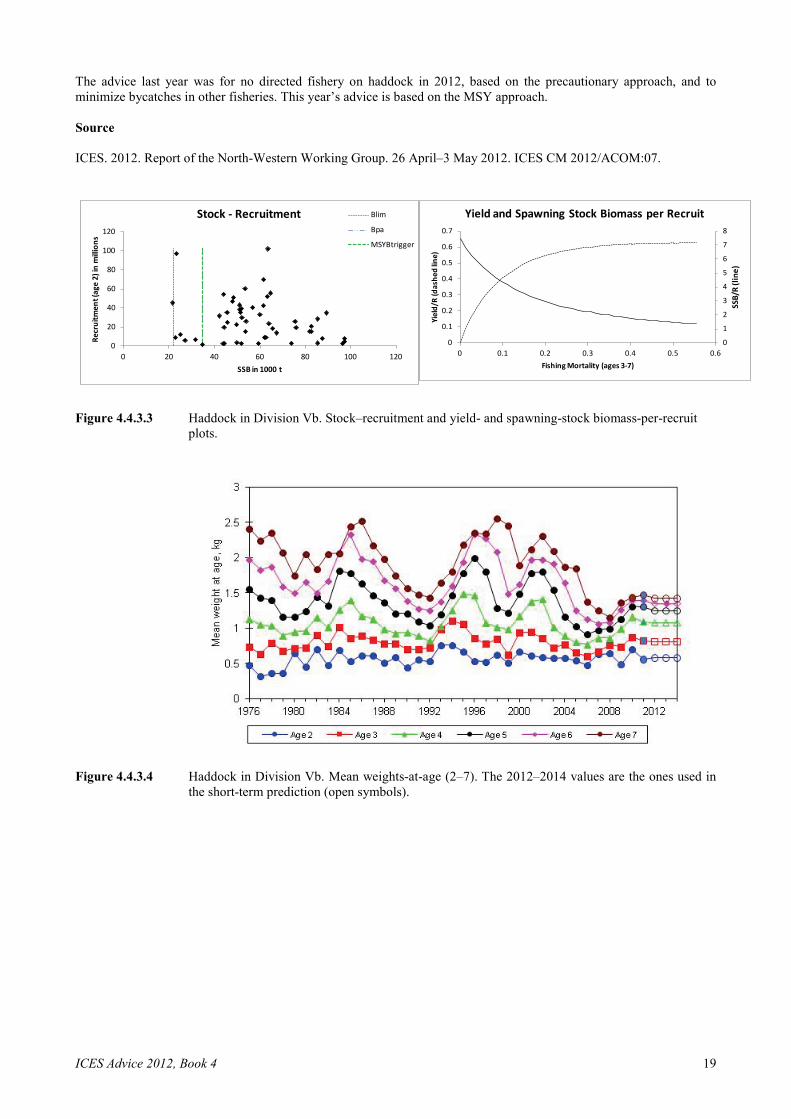
Figure 4.4.3.3 Haddock in Division Vb. Stock–recruitment and yield- and spawning-stock biomass-per-recruit
plots.
Figure 4.4.3.4 Haddock in Division Vb. Mean weights-at-age (2–7). The 2012–2014 values are the ones used in the short-term prediction (open symbols).
0
1
2
3
4
5
6
7
8
0
0.1
0.2
0.3
0.4
0.5
0.6
0.7
0 0.1 0.2 0.3 0.4 0.5 0.6
SSB/
R (li
ne)
Yiel
d/R
(das
hed
line)
Fishing Mortality (ages 3-7)
Yield and Spawning Stock Biomass per Recruit
0
20
40
60
80
100
120
0 20 40 60 80 100 120
Recr
uitm
ent (
age
2) in
mill
ions
SSB in 1000 t
Stock - Recruitment Blim
Bpa
MSYBtrigger
20 ICES Advice 2012, Book 4
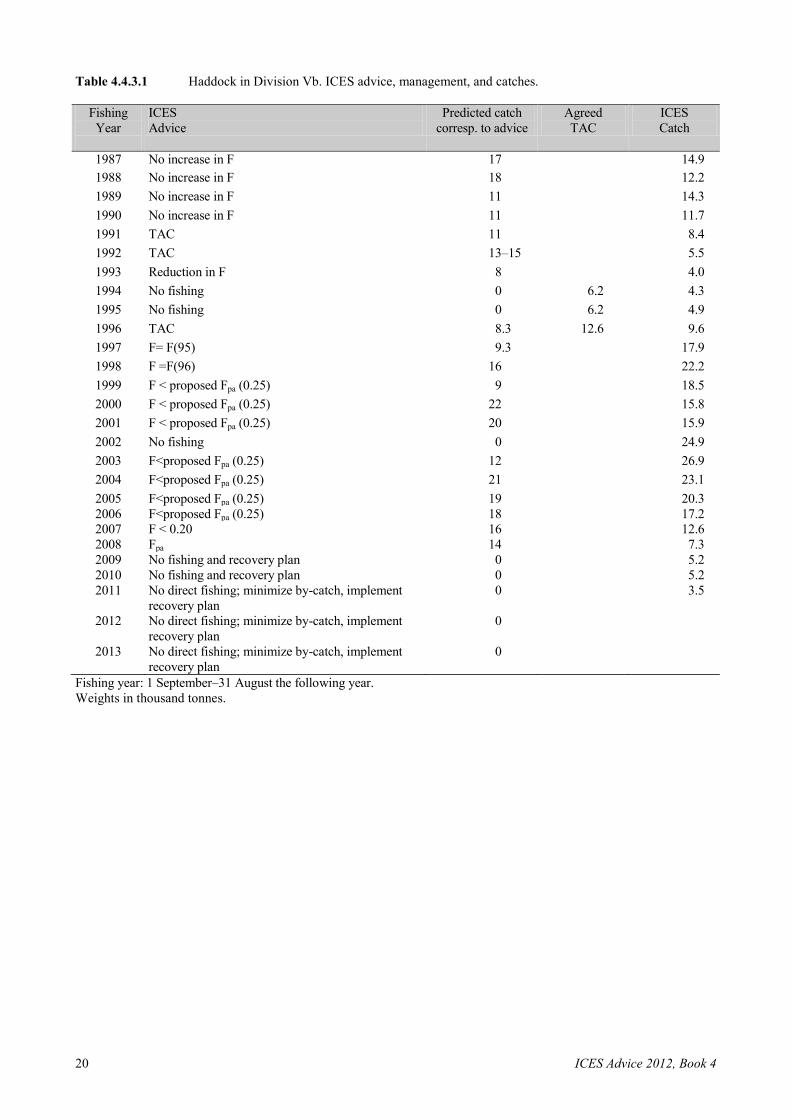
Table 4.4.3.1 Haddock in Division Vb. ICES advice, management, and catches.
Fishing Year
ICES Advice
Predicted catch corresp. to advice
Agreed TAC
ICES Catch
1987 No increase in F 17 14.9 1988 No increase in F 18 12.2 1989 No increase in F 11 14.3 1990 No increase in F 11 11.7 1991 TAC 11 8.4 1992 TAC 13–15 5.5 1993 Reduction in F 8 4.0 1994 No fishing 0 6.2 4.3 1995 No fishing 0 6.2 4.9 1996 TAC 8.3 12.6 9.6 1997 F= F(95) 9.3 17.9 1998 F =F(96) 16 22.2 1999 F < proposed Fpa (0.25) 9 18.5 2000 F < proposed Fpa (0.25) 22 15.8 2001 F < proposed Fpa (0.25) 20 15.9 2002 No fishing 0 24.9 2003
F<proposed Fpa (0.25)
12
26.9 2004 F<proposed Fpa (0.25) 21 23.1
2005 F<proposed Fpa (0.25) 19 20.3 2006 F<proposed Fpa (0.25) 18 17.2 2007 F < 0.20 16 12.6 2008 Fpa 14 7.3 2009 No fishing and recovery plan 0 5.2 2010 No fishing and recovery plan 0 5.2 2011 No direct fishing; minimize by-catch, implement
recovery plan 0 3.5
2012 No direct fishing; minimize by-catch, implement recovery plan
0
2013 No direct fishing; minimize by-catch, implement recovery plan
0
Fishing year: 1 September–31 August the following year. Weights in thousand tonnes.
ICES Advice 2010, Book 4 21
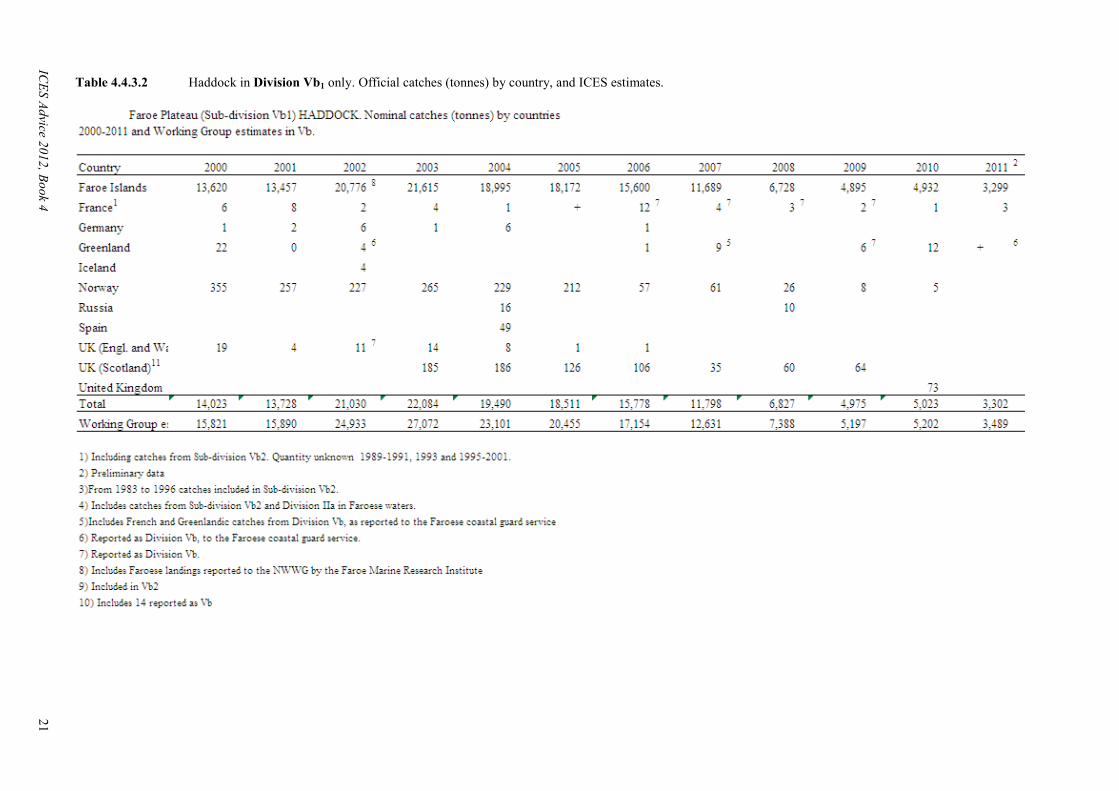
Table 4.4.3.2 Haddock in Division Vb1 only. Official catches (tonnes) by country, and ICES estimates.
ICES Advice 2012, Book 4
21
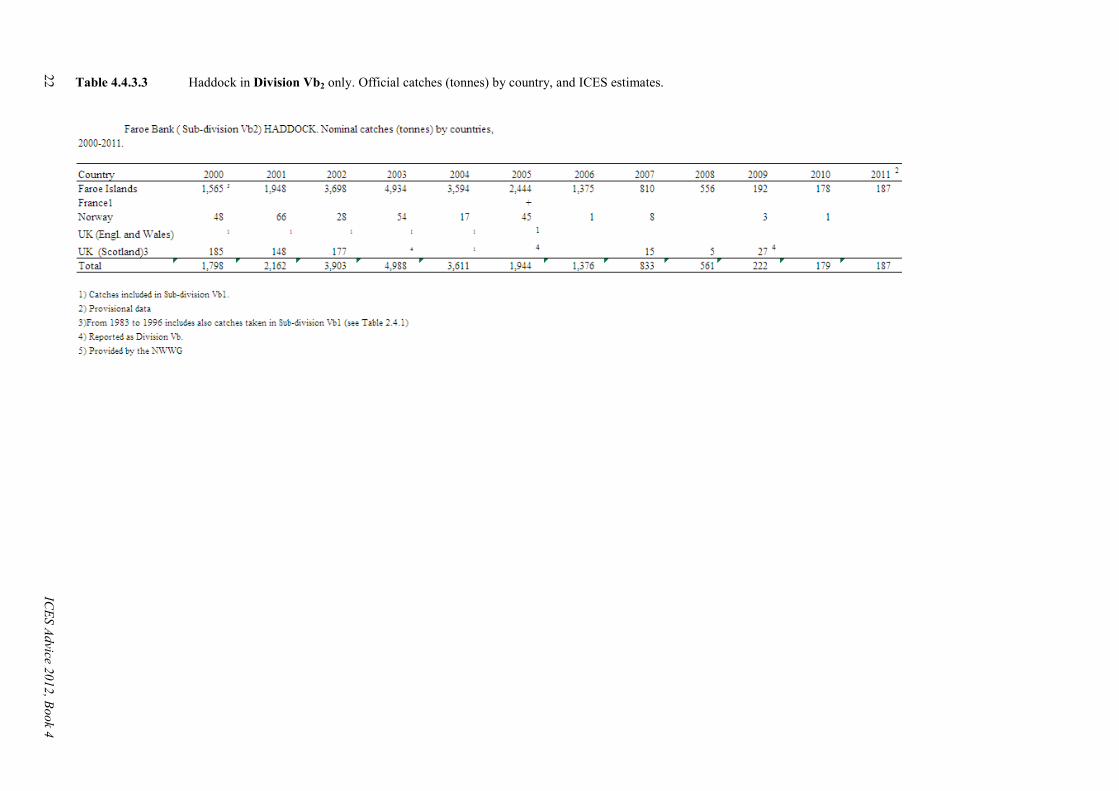
22 ICES Advice 2010, Book 4
Table 4.4.3.3 Haddock in Division Vb2 only. Official catches (tonnes) by country, and ICES estimates.
22
ICES Advice 2012, Book 4
ICES Advice 2012, Book 4 23
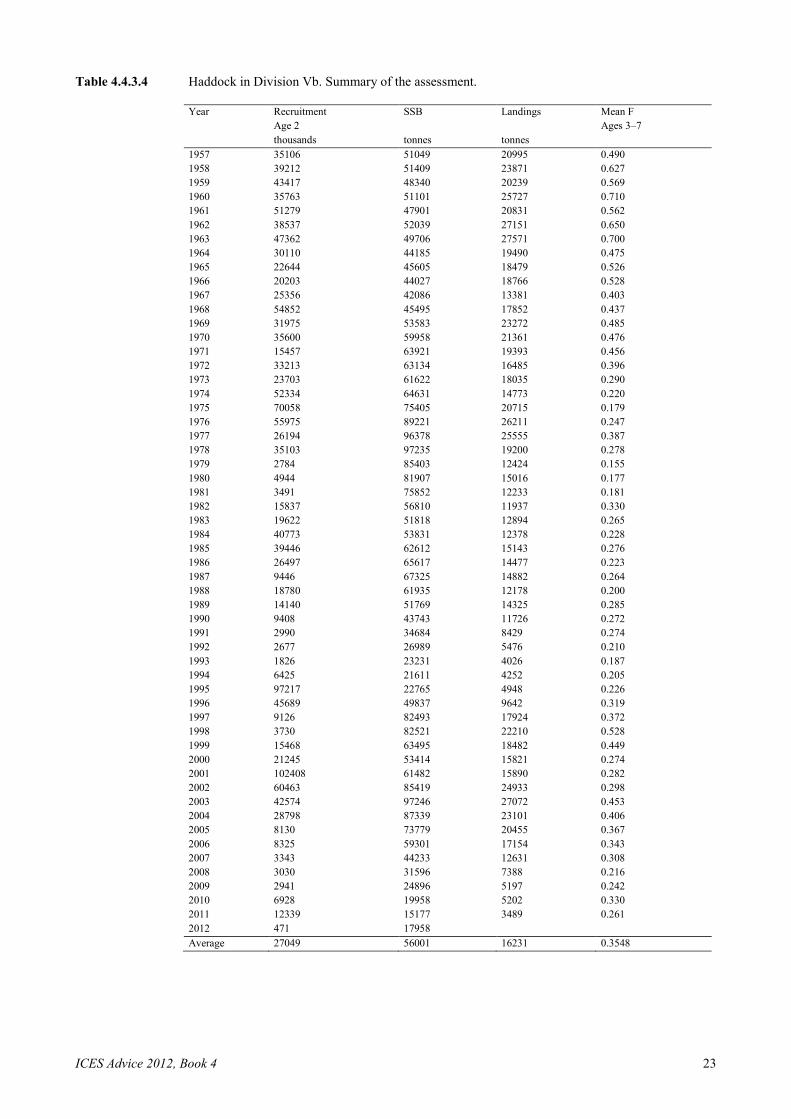
Table 4.4.3.4 Haddock in Division Vb. Summary of the assessment.
Year Recruitment SSB Landings Mean F
Age 2
Ages 3–7
thousands tonnes tonnes 1957 35106 51049 20995 0.490 1958 39212 51409 23871 0.627 1959 43417 48340 20239 0.569 1960 35763 51101 25727 0.710 1961 51279 47901 20831 0.562 1962 38537 52039 27151 0.650 1963 47362 49706 27571 0.700 1964 30110 44185 19490 0.475 1965 22644 45605 18479 0.526 1966 20203 44027 18766 0.528 1967 25356 42086 13381 0.403 1968 54852 45495 17852 0.437 1969 31975 53583 23272 0.485 1970 35600 59958 21361 0.476 1971 15457 63921 19393 0.456 1972 33213 63134 16485 0.396 1973 23703 61622 18035 0.290 1974 52334 64631 14773 0.220 1975 70058 75405 20715 0.179 1976 55975 89221 26211 0.247 1977 26194 96378 25555 0.387 1978 35103 97235 19200 0.278 1979 2784 85403 12424 0.155 1980 4944 81907 15016 0.177 1981 3491 75852 12233 0.181 1982 15837 56810 11937 0.330 1983 19622 51818 12894 0.265 1984 40773 53831 12378 0.228 1985 39446 62612 15143 0.276 1986 26497 65617 14477 0.223 1987 9446 67325 14882 0.264 1988 18780 61935 12178 0.200 1989 14140 51769 14325 0.285 1990 9408 43743 11726 0.272 1991 2990 34684 8429 0.274 1992 2677 26989 5476 0.210 1993 1826 23231 4026 0.187 1994 6425 21611 4252 0.205 1995 97217 22765 4948 0.226 1996 45689 49837 9642 0.319 1997 9126 82493 17924 0.372 1998 3730 82521 22210 0.528 1999 15468 63495 18482 0.449 2000 21245 53414 15821 0.274 2001 102408 61482 15890 0.282 2002 60463 85419 24933 0.298 2003 42574 97246 27072 0.453 2004 28798 87339 23101 0.406 2005 8130 73779 20455 0.367 2006 8325 59301 17154 0.343 2007 3343 44233 12631 0.308 2008 3030 31596 7388 0.216 2009 2941 24896 5197 0.242 2010 6928 19958 5202 0.330 2011 12339 15177 3489 0.261 2012 471 17958
Average 27049 56001 16231 0.3548
24 ICES Advice 2012, Book 4
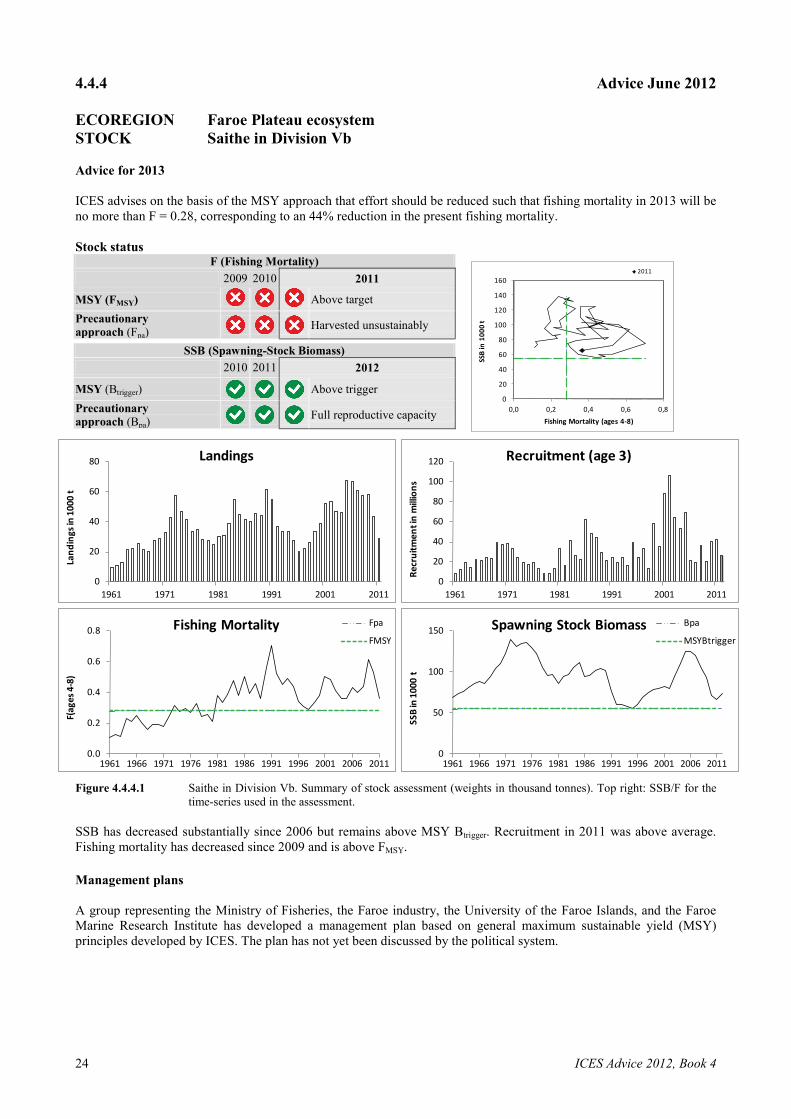
4.4.4 Advice June 2012 ECOREGION Faroe Plateau ecosystem STOCK Saithe in Division Vb Advice for 2013 ICES advises on the basis of the MSY approach that effort should be reduced such that fishing mortality in 2013 will be no more than F = 0.28, corresponding to an 44% reduction in the present fishing mortality. Stock status
F (Fishing Mortality) 2009 2010 2011
MSY (FMSY) Above target Precautionary approach (Fpa) Harvested unsustainably
SSB (Spawning-Stock Biomass) 2010 2011 2012
MSY (Btrigger) Above trigger Precautionary approach (Bpa) Full reproductive capacity
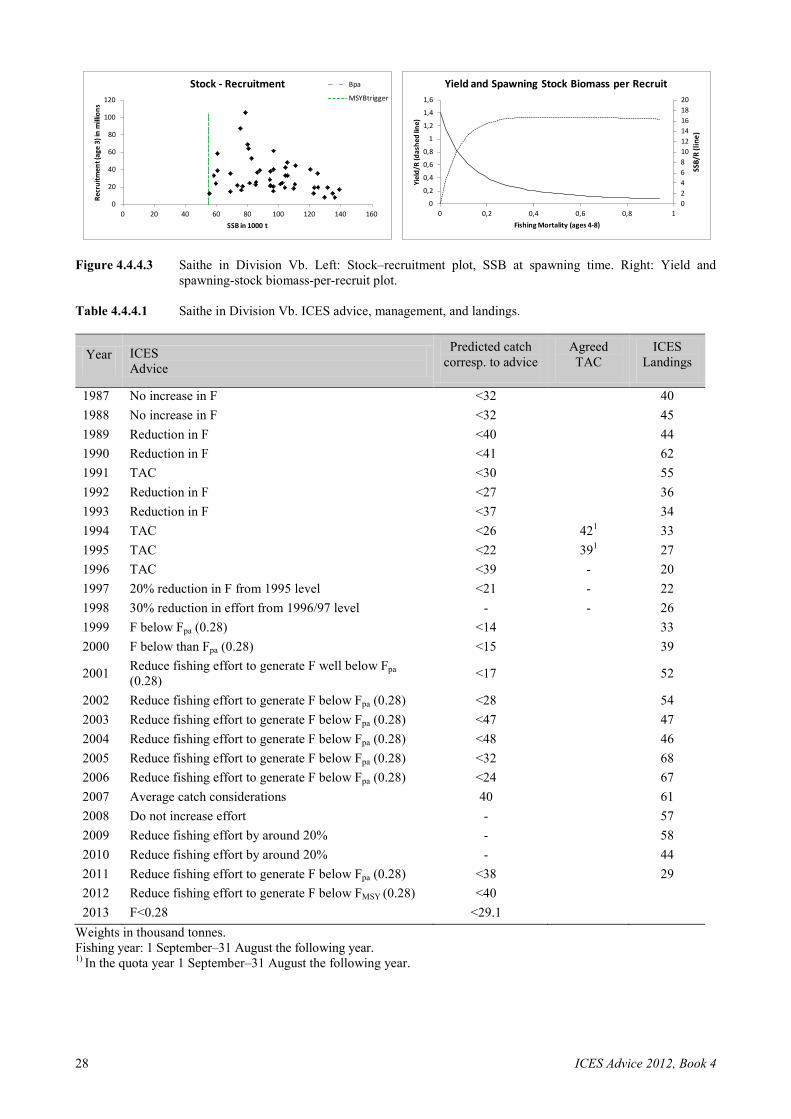
Figure 4.4.4.1 Saithe in Division Vb. Summary of stock assessment (weights in thousand tonnes). Top right: SSB/F for the
time-series used in the assessment. SSB has decreased substantially since 2006 but remains above MSY Btrigger. Recruitment in 2011 was above average. Fishing mortality has decreased since 2009 and is above FMSY. Management plans A group representing the Ministry of Fisheries, the Faroe industry, the University of the Faroe Islands, and the Faroe Marine Research Institute has developed a management plan based on general maximum sustainable yield (MSY) principles developed by ICES. The plan has not yet been discussed by the political system.
0
20
40
60
80
100
120
140
160
0,0 0,2 0,4 0,6 0,8
SSB
in 1
000
t
Fishing Mortality (ages 4-8)
2011
0
20
40
60
80
1961 1971 1981 1991 2001 2011
Land
ings
in 1
000
t
Landings
0.0
0.2
0.4
0.6
0.8
1961 1966 1971 1976 1981 1986 1991 1996 2001 2006 2011
F(ag
es 4
-8)
Fishing Mortality Fpa
FMSY
0
20
40
60
80
100
120
1961 1971 1981 1991 2001 2011
Recr
uitm
ent i
n m
illio
ns
Recruitment (age 3)
0
50
100
150
1961 1966 1971 1976 1981 1986 1991 1996 2001 2006 2011
SSB
in 1
000
t
Spawning Stock Biomass Bpa
MSYBtrigger
ICES Advice 2012, Book 4 25
Biology Saithe in Division Vb is regarded as one management unit although tagging experiments have demonstrated migrations between the Faroes, Iceland, Norway, west of Scotland, and the North Sea. Nursery areas for saithe are found very close to land (in the littoral zone). These areas are not covered by the existing surveys and therefore recruitment estimates are not available until saithe enter the fishery at age 3; this hampers the prediction of biomass and catch. Environmental influence on the stock Preliminary studies suggest a positive relationship between ocean productivity (gyre index) and the biomass of saithe. The fisheries Saithe are mainly caught in a directed trawl fishery (pair and single trawlers), with bycatches of cod and haddock. Catch distribution Total landings (2011) are 29 kt, of which 91% was taken by pair trawlers, 4.5% by single
trawlers, and 3.6% by jiggers.
Quality considerations There are no incentives to discard fish under the effort management system. The sampling of the landings has increased since 2009 and is considered to be adequate. Recruitment indices are only available from age 3 and this is a source of uncertainty in recent recruitment estimates and forecast.
0
20
40
60
80
100
120
140
160
1997 2002 2007 2012
SSB ('000 tonnes)
0,00
0,10
0,20
0,30
0,40
0,50
0,60
0,70
0,80
1997 2002 2007 2012
Fishing mortality: 4-8
0
20
40
60
80
100
120
1997 2002 2007 2012
Millions
Recruitment. Age: 3
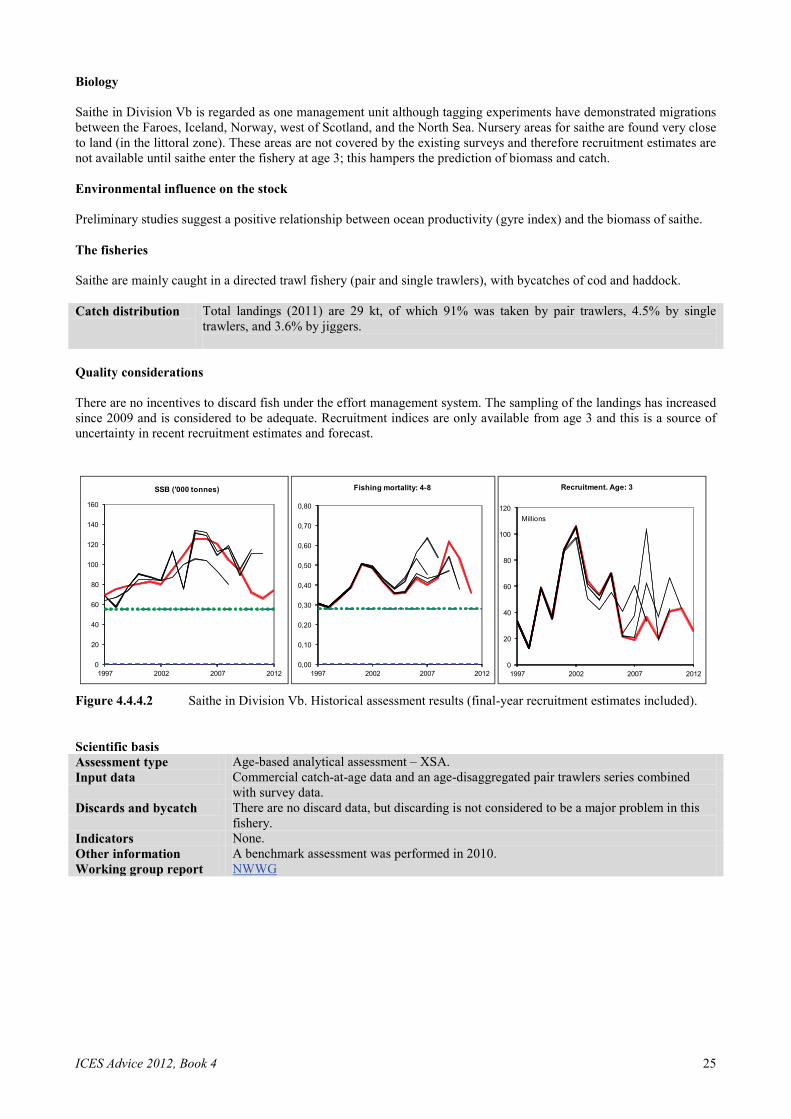
Figure 4.4.4.2 Saithe in Division Vb. Historical assessment results (final-year recruitment estimates included). Scientific basis Assessment type Age-based analytical assessment – XSA. Input data Commercial catch-at-age data and an age-disaggregated pair trawlers series combined
with survey data. Discards and bycatch There are no discard data, but discarding is not considered to be a major problem in this
fishery. Indicators None. Other information A benchmark assessment was performed in 2010. Working group report NWWG
26 ICES Advice 2012, Book 4
4.4.4 Supporting information June 2012 ECOREGION Faroe Plateau ecosystem STOCK Saithe in Division Vb Reference points Type Value Technical basis MSY MSY Btrigger 55 000 t Breakpoint in segmented regression. Approach FMSY 0.28 Provisional stochastic simulations. Blim Undefined Precautionary Bpa 55 000 t Bloss in 2011. Approach Flim Undefined Fpa 0.28 Consistent with 1999 estimate of Fmed. (Unchanged since 2011) Yield and spawning biomass per Recruit F-reference points (2012):
Fish Mort Yield/R SSB/R Ages 4–8 Average last 3 years 0.50 1.33 1.97 Fmax 0.44 1.33 2.26 F0.1 0.18 1.21 5.65 Fmed 0.31 1.32 3.29
Outlook for 2013 Basis: F (2012) = F (2009–2011) unscaled = 0.50; SSB (2013) = 72; R (2012) (GM2006–2010) = 26 million; catch (2012) = 51.1.
Rationale F (2013)
Landings (2013)
Basis SSB (2014)
%SSB change 1)
MSY approach 0.28 29.1 FMSY (=Fsq*0.56) 79 +10 Precautionary 0.28 291 Fpa (=Fsq *0.56) 79 +10 Approach Zero catch 0 0 F=0 105 +46 Status quo 0.15 16.6 Fsq * 0.30 92 +28 0.25 26.4 Fsq * 0.50 84 +17 0.35 35.3 Fsq * 0.70 76 +6 0.45 43.2 Fsq * 0.90 70 -3 0.50 46.9 Fsq 67 -7 Weights in thousand tonnes. 1) SSB 2014 relative to SSB 2013. Management plan A management system based on number of fishing days, closed areas, and other technical measures was introduced in 1996 to ensure sustainable demersal fisheries in Division Vb. This was before ICES introduced precautionary approach (PA) and MSY reference values, and at that time it was believed that the purpose was achieved if the total allowable number of fishing days was set such that on average 33% of the haddock exploitable stock in numbers would be harvested annually. This translates into an average F of 0.45, above the Fpa and FMSY of 0.25. ICES considers this to be inconsistent with the PA and the MSY approaches. Work is ongoing in the Faroes to move away from the Ftarget of 0.45 to be consistent with the ICES advice. This management plan includes a stepwise reduction of the fishing mortality to FMSY in 2015 and a recovery plan if the SSB declines below the MSY Btrigger. The MSY Btrigger has been defined at 55 kt (the former Bpa) and FMSY at 0.28. If the SSB declines below the MSY Btrigger, the fishing mortality will be reduced by the relationship FMSY * Bact/Btrigger until the SSB has increased again above the MSY Btrigger and is thereafter kept at FMSY.
ICES Advice 2012, Book 4 27
MSY approach Following the ICES MSY framework implies that fishing mortality in 2013 should be no more than FMSY = 0.28, resulting in a reduction of 44% in the present fishing mortality. Precautionary approach Following the precautionary approach implies that fishing mortality in 2013 should be no more than Fpa = 0.28, resulting in a reduction of 44% in present fishing mortality. Additional considerations Management considerations The number of fishing days for pair trawlers was reduced by 10% for the fishing year (2010/2011), but a further reduction of effort is required to bring F at or below FMSY. The present spawning closures should be maintained for pair trawlers and applied for other fleets also. Regulations and their effects The principal fleets fishing for saithe are pair trawlers, single trawlers, and jiggers. The average annual landings from these fleets since the introduction of the present management system are about 78%, 17%, and 4%, respectively. The pair trawlers, jiggers, and single trawlers are regulated by total number of allocated fishing days and by area closures. Limited sampling in the blue whiting fishery in Faroese waters indicates that bycatches of saithe have been minor since the mandatory use of sorting grids was introduced from 15 April 2007 in the areas west and northwest of the Faroe Islands. Changes in fishing technology and fishing patterns The effort management system can lead to improvement of fishing technology and efficiency. Presently, ICES is not able to quantify these changes. Uncertainties in the assessment and forecast The potential for bias in commercial cpue (for example hyper-stability) is a serious concern for shoaling species such as saithe. For this assessment, in addition to the pairtrawler cpue, which is a measure of saithe density in its core area of distribution, the range of the spatial distribution of saithe was considered, using survey information, when constructing an abundance index for saithe. This approach is considered to reduce the bias. The assessment is very uncertain, with large revisions from year to year. Recruitment indices are only available from age 3 and this is a source of uncertainty in recent recruitment estimates and forecast. Comparison with last year’s assessment and advice SSB in 2010 and 2011 has been revised downwards by 35% and 40%, respectively, compared to last year’s estimates. F in 2009 and 2010 has been revised upwards by 14% and 40%, respectively. The basis for the advice is the same as last year. Sources ICES. 2012. Report of the North-Western Working Group (NWWG), 26 April–3 May 2012. ICES CM
2012/ACOM:07.
28 ICES Advice 2012, Book 4
Figure 4.4.4.3 Saithe in Division Vb. Left: Stock–recruitment plot, SSB at spawning time. Right: Yield and
spawning-stock biomass-per-recruit plot. Table 4.4.4.1 Saithe in Division Vb. ICES advice, management, and landings.
Year ICES Advice
Predicted catch corresp. to advice
Agreed TAC
ICES Landings
1987 No increase in F <32 40 1988 No increase in F <32 45 1989 Reduction in F <40 44 1990 Reduction in F <41 62 1991 TAC <30 55 1992 Reduction in F <27 36 1993 Reduction in F <37 34 1994 TAC <26 421 33 1995 TAC <22 391 27 1996 TAC <39 - 20 1997 20% reduction in F from 1995 level <21 - 22 1998 30% reduction in effort from 1996/97 level - - 26 1999 F below Fpa (0.28) <14 33 2000 F below than Fpa (0.28) <15 39
2001 Reduce fishing effort to generate F well below Fpa (0.28) <17 52
2002 Reduce fishing effort to generate F below Fpa (0.28) <28 54 2003 Reduce fishing effort to generate F below Fpa (0.28) <47 47 2004 Reduce fishing effort to generate F below Fpa (0.28) <48 46 2005 Reduce fishing effort to generate F below Fpa (0.28) <32 68 2006 Reduce fishing effort to generate F below Fpa (0.28) <24 67 2007 Average catch considerations 40 61 2008 Do not increase effort - 57 2009 Reduce fishing effort by around 20% - 58 2010 Reduce fishing effort by around 20% - 44 2011 Reduce fishing effort to generate F below Fpa (0.28) <38 29 2012 Reduce fishing effort to generate F below FMSY (0.28) <40 2013 F<0.28 <29.1
Weights in thousand tonnes. Fishing year: 1 September–31 August the following year. 1) In the quota year 1 September–31 August the following year.
02468101214161820
0
0,2
0,4
0,6
0,8
1
1,2
1,4
1,6
0 0,2 0,4 0,6 0,8 1
SSB/
R (li
ne)
Yiel
d/R
(das
hed
line)
Fishing Mortality (ages 4-8)
Yield and Spawning Stock Biomass per Recruit
0
20
40
60
80
100
120
0 20 40 60 80 100 120 140 160
Recr
uitm
ent (
age
3) in
mill
ions
SSB in 1000 t
Stock - Recruitment Bpa
MSYBtrigger
ICES Advice 2012, Book 4 29
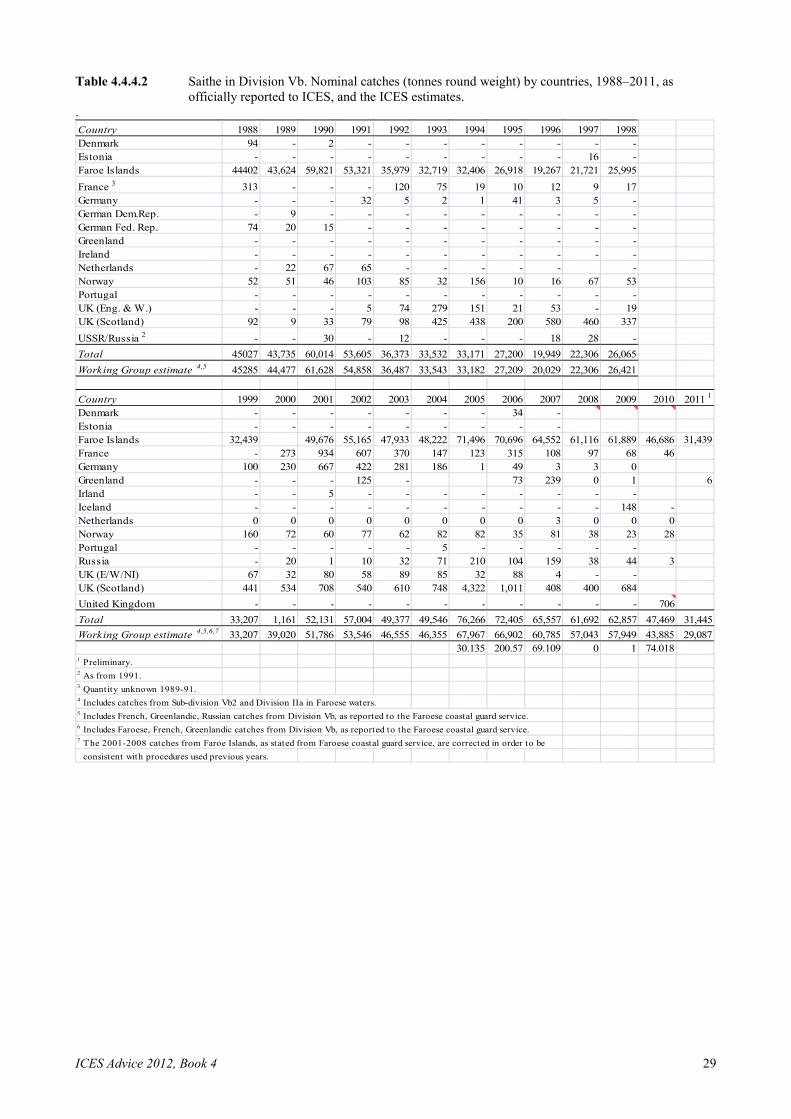
Table 4.4.4.2 Saithe in Division Vb. Nominal catches (tonnes round weight) by countries, 1988–2011, as officially reported to ICES, and the ICES estimates.
. Country 1988 1989 1990 1991 1992 1993 1994 1995 1996 1997 1998Denmark 94 - 2 - - - - - - - -Estonia - - - - - - - - - 16 -Faroe Islands 44402 43,624 59,821 53,321 35,979 32,719 32,406 26,918 19,267 21,721 25,995France 3 313 - - - 120 75 19 10 12 9 17Germany - - - 32 5 2 1 41 3 5 -German Dem.Rep. - 9 - - - - - - - - -German Fed. Rep. 74 20 15 - - - - - - - -Greenland - - - - - - - - - - -Ireland - - - - - - - - - - -Netherlands - 22 67 65 - - - - - -Norway 52 51 46 103 85 32 156 10 16 67 53Portugal - - - - - - - - - - -UK (Eng. & W.) - - - 5 74 279 151 21 53 - 19UK (Scotland) 92 9 33 79 98 425 438 200 580 460 337USSR/Russia 2 - - 30 - 12 - - - 18 28 -Total 45027 43,735 60,014 53,605 36,373 33,532 33,171 27,200 19,949 22,306 26,065Working Group estimate 4,5 45285 44,477 61,628 54,858 36,487 33,543 33,182 27,209 20,029 22,306 26,421
Country 1999 2000 2001 2002 2003 2004 2005 2006 2007 2008 2009 2010 2011 1
Denmark - - - - - - - 34 -Estonia - - - - - - - - -Faroe Islands 32,439 49,676 55,165 47,933 48,222 71,496 70,696 64,552 61,116 61,889 46,686 31,439France - 273 934 607 370 147 123 315 108 97 68 46Germany 100 230 667 422 281 186 1 49 3 3 0Greenland - - - 125 - 73 239 0 1 6Irland - - 5 - - - - - - - -Iceland - - - - - - - - - - 148 -Netherlands 0 0 0 0 0 0 0 0 3 0 0 0Norway 160 72 60 77 62 82 82 35 81 38 23 28Portugal - - - - - 5 - - - - -Russia - 20 1 10 32 71 210 104 159 38 44 3UK (E/W/NI) 67 32 80 58 89 85 32 88 4 - -UK (Scotland) 441 534 708 540 610 748 4,322 1,011 408 400 684United Kingdom - - - - - - - - - - - 706Total 33,207 1,161 52,131 57,004 49,377 49,546 76,266 72,405 65,557 61,692 62,857 47,469 31,445Working Group estimate 4,5,6,7 33,207 39,020 51,786 53,546 46,555 46,355 67,967 66,902 60,785 57,043 57,949 43,885 29,087
30.135 200.57 69.109 0 1 74.0181 Preliminary.2 As from 1991.3 Quantity unknown 1989-91.4 Includes catches from Sub-division Vb2 and Division IIa in Faroese waters.5 Includes French, Greenlandic, Russian catches from Division Vb, as reported to the Faroese coastal guard service.6 Includes Faroese, French, Greenlandic catches from Division Vb, as reported to the Faroese coastal guard service.7 The 2001-2008 catches from Faroe Islands, as stated from Faroese coastal guard service, are corrected in order to be consistent with procedures used previous years.
30 ICES Advice 2012, Book 4
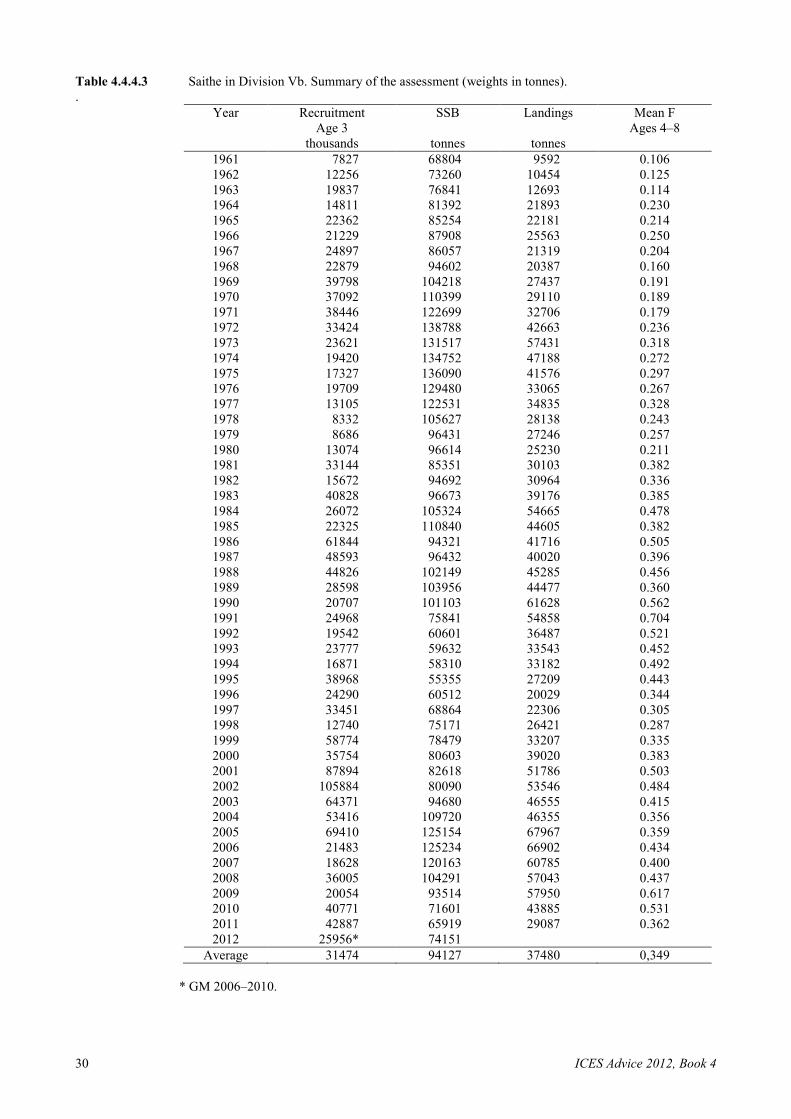
Table 4.4.4.3 Saithe in Division Vb. Summary of the assessment (weights in tonnes). .
Year Recruitment SSB Landings Mean F
Age 3
Ages 4–8
thousands tonnes tonnes 1961 7827 68804 9592 0.106 1962 12256 73260 10454 0.125 1963 19837 76841 12693 0.114 1964 14811 81392 21893 0.230 1965 22362 85254 22181 0.214 1966 21229 87908 25563 0.250 1967 24897 86057 21319 0.204 1968 22879 94602 20387 0.160 1969 39798 104218 27437 0.191 1970 37092 110399 29110 0.189 1971 38446 122699 32706 0.179 1972 33424 138788 42663 0.236 1973 23621 131517 57431 0.318 1974 19420 134752 47188 0.272 1975 17327 136090 41576 0.297 1976 19709 129480 33065 0.267 1977 13105 122531 34835 0.328 1978 8332 105627 28138 0.243 1979 8686 96431 27246 0.257 1980 13074 96614 25230 0.211 1981 33144 85351 30103 0.382 1982 15672 94692 30964 0.336 1983 40828 96673 39176 0.385 1984 26072 105324 54665 0.478 1985 22325 110840 44605 0.382 1986 61844 94321 41716 0.505 1987 48593 96432 40020 0.396 1988 44826 102149 45285 0.456 1989 28598 103956 44477 0.360 1990 20707 101103 61628 0.562 1991 24968 75841 54858 0.704 1992 19542 60601 36487 0.521 1993 23777 59632 33543 0.452 1994 16871 58310 33182 0.492 1995 38968 55355 27209 0.443 1996 24290 60512 20029 0.344 1997 33451 68864 22306 0.305 1998 12740 75171 26421 0.287 1999 58774 78479 33207 0.335 2000 35754 80603 39020 0.383 2001 87894 82618 51786 0.503 2002 105884 80090 53546 0.484 2003 64371 94680 46555 0.415 2004 53416 109720 46355 0.356 2005 69410 125154 67967 0.359 2006 21483 125234 66902 0.434 2007 18628 120163 60785 0.400 2008 36005 104291 57043 0.437 2009 20054 93514 57950 0.617 2010 40771 71601 43885 0.531 2011 42887 65919 29087 0.362 2012 25956* 74151
Average 31474 94127 37480 0,349 * GM 2006–2010.
Recommended