The highest peak in the Carpathians - Gerlachovský Štít (The Gerlach mountain - 2655 m above sea level) - photograph by Jadwiga Czernecka Report on water resources and natural disasters (climate change) and flood risk mapping
Institute of Meteorology and Water Management
BRANCH OFFICE IN CRACOW Disclaimer:
This publication has been produced by the Carpathian Project under the INTERREG III B CADSES Neighbourhood Programme and co-financed by the European Union. The contents of this document are the sole responsibility of the author(s) and can under no circumstances be regarded as reflecting the position of the European Union, of the United Nations Environment Programme (UNEP), of the Carpathian Convention or of the partner institutions. Presentation of material in this publication does not imply the expression of any opinion or view of the Institute of Meteorology and Water Management.
Cracow, October 2007
“Report on water resources and natural disasters (climate change) and flood risk mapping” ___________________________________________________________________________________________________________________________________________________________________________________________________
2 / 106
Authors:
Walczykiewicz Tomasz
Barszczyńska Małgorzata
Biedroń Ilona
Czernecka Jadwiga
Kubacka Danuta
Rataj Celina
Paluszkiewicz Bartłomiej
“Report on water resources and natural disasters (climate change) and flood risk mapping” ___________________________________________________________________________________________________________________________________________________________________________________________________
3 / 106
Table of Contents
1. STATUS OF WATERS IN CARPATHIANS................................................................................... 6 1.1. Introduction ........................................................................................................................ 6 1.2. Water policy ....................................................................................................................... 9 1.3. Natural hazards................................................................................................................ 10 1.4. New policy initiatives........................................................................................................ 10 1.5. General overview of the Carpathian waters .................................................................... 12
2. GENERAL DESCRIPTION ON THE BASE OF THE CARPATHIAN ARC................................. 17 2.1. Situation of water resources in Carpathians.................................................................... 17
2.1.1. The Baltic Sea Basin................................................................................................................. 17 2.1.1.1. Droughts and floods ........................................................................................................ 20 2.1.1.2. Water use ........................................................................................................................ 21
2.1.2. The Black Sea Basin................................................................................................................. 22 2.1.2.1. Droughts and floods ........................................................................................................ 27 2.1.2.2. Water use ........................................................................................................................ 30
2.1.3. The main lakes of the Carpathian region .................................................................................. 33 2.1.4. Transboundary groundwaters in the Carpathian Region........................................................... 38 2.1.5. Habitat and species protection areas........................................................................................ 39
2.2. The water “reservoir” Carpathians - water tower for surrounding areas.......................... 40 2.3. Background data.............................................................................................................. 46
2.3.1. Inhabitants ................................................................................................................................ 46 2.3.2. Annual precipitation .................................................................................................................. 49 2.3.3. Temperature ............................................................................................................................. 49 2.3.4. Land Cover ............................................................................................................................... 52
3. SHORT DESCRIPTION OF PRESSURES AND IMPACTS ........................................................ 58 3.1. Water quality .................................................................................................................... 58
3.1.1. Significant point sources and diffuse sources ........................................................................... 58 3.1.2. Risk of failure to reach environmental objectives ...................................................................... 60
3.2. Hydromorphology ............................................................................................................ 70 3.3. Water quantity.................................................................................................................. 73
3.3.1. Significant water abstractions ................................................................................................... 73 3.4. Management approaches to deal with flood, drought and water scarcity ...................... 77
3.4.1. Management solutions.............................................................................................................. 77 3.4.2. Technical solutions ................................................................................................................... 80
4. CLIMATE CHANGE-NATURAL HAZARDS................................................................................ 83 4.1. Predictable future pressures............................................................................................ 83 4.2. Trends in climate and their potential influence on water related natural hazards ........... 92
5. SIGNIFICANT WATER MANAGEMENT ISSUES ....................................................................... 94 5.1. Water use......................................................................................................................... 94 5.2. Droughts and floods......................................................................................................... 98 5.3. Legal transposition of the EU policy .............................................................................. 101
6. REFERENCE MATERIAL .......................................................................................................... 105
“Report on water resources and natural disasters (climate change) and flood risk mapping” ___________________________________________________________________________________________________________________________________________________________________________________________________
4 / 106
List of Figures Figure 1: The main rivers in the Carpathian region............................................................................... 13
Figure 2: Carpathian Region on a background of European political map ........................................... 14
Figure 3: River basins in the Carpathian Region .................................................................................. 15
Figure 4: The Neusiedler See Lake – topography map. ....................................................................... 35
Figure 5: The Neusiedler See Lake....................................................................................................... 35
Figure 6: Transboundary groundwaters in the Carpathian Region ....................................................... 38
Figure 7: Habitat and species protected areas in the Carpathian Region ............................................ 39
Figure 8: The relief of the Carpathian Region ....................................................................................... 42
Figure 9: Annual precipitation in the Carpathian Region....................................................................... 43
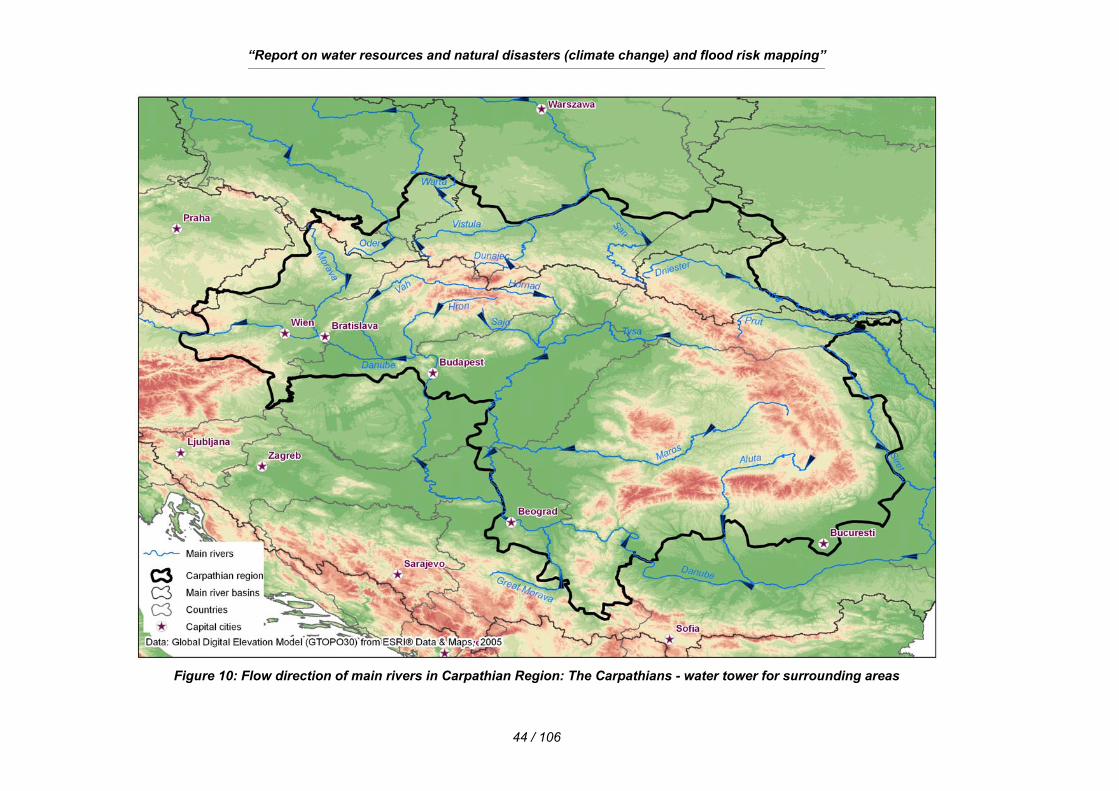
Figure 10: Flow direction of main rivers in Carpathian Region: The Carpathians - water tower for
surrounding areas.................................................................................................................................. 44
Figure 11: Surface flow direction (slopes) in Carpathian region ........................................................... 45
Figure 12: Population density in NUTS 3 in the Carpathian Region. .................................................... 47
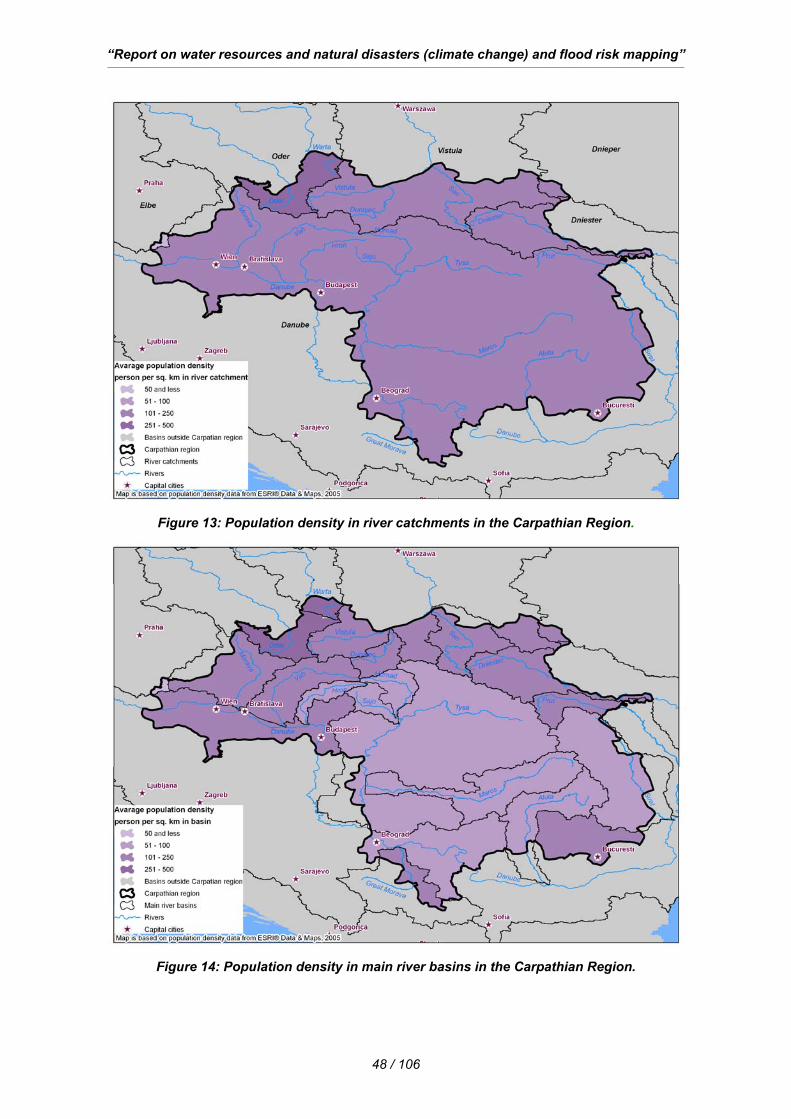
Figure 13: Population density in river catchments in the Carpathian Region. ...................................... 48
Figure 14: Population density in main river basins in the Carpathian Region....................................... 48
Figure 15: Annual precipitation in the Carpathian region ...................................................................... 50
Figure 16 Seasonal average temperature in the Carpathian Region.................................................... 51
Figure 17: Percentage participation of each land cover area in Carpathian country parties ................ 54
Figure 18: Percentage participation of each land cover area in Carpathian river catchments. ............ 55
Figure 19: Land Cover in the Carpathian Region – countries ............................................................... 56
Figure 20: Land Cover in the Carpathian Region – river catchments ................................................... 57
Figure 21: Significant point sources and diffuse sources in the Carpathian Region............................. 59
Figure 22: Risk of failure to reach the Environmental Objectives – Organic Substances..................... 64
Figure 23: Risk of failure to reach the Environmental Objectives – Nutrients....................................... 65
Figure 24: Risk of failure to reach the Environmental Objectives – Hazardous Substances................ 66
Figure 25: Risk of failure to reach the Environmental Objectives – Hydromorphological alterations ... 67
Figure 26: Water quality monitoring stations in Carpathian region ....................................................... 69
Figure 27: Danube drainage basin and position of the Iron Gate dams. .............................................. 71
Figure 28: Hydro morphological changes in Carpathian region............................................................ 72
Figure 29: Significant water abstractions in the Carpathian Region ..................................................... 74
Figure 30: The gauging stations on the main Carpathian rivers ........................................................... 76
Figure 31: Change in mean annual precipitation by the end of this century in Carpathian region ....... 86
Figure 32: Change in mean annual temperature by the end of this century in Carpathian region ....... 87
Figure 33: Changes in river discharge for a flood events for main rivers in the Carpathian Region..... 93
Figure 34: Percentage of surface water bodies at risk of failing WFD objectives per Member State of
EU within the Carpathian....................................................................................................................... 95
Figure 35: Percentage of provisionally identified Heavily Modified Water Bodies ................................ 97
Figure 36: Percentage of groundwater bodies at risk of failing WFD objectives per Member .............. 97
“Report on water resources and natural disasters (climate change) and flood risk mapping” ___________________________________________________________________________________________________________________________________________________________________________________________________
5 / 106
List of Tables Table 1: Length of the main river [km]................................................................................................... 12
Table 2: The percentage share of each country within the Carpathian Region.................................... 14
Table 3: Surface area of the river basin ................................................................................................ 16
Table 4: The main rivers in Baltic Sea Basin......................................................................................... 17
Table 5: The main rivers in the Black Sea basin................................................................................... 23
Table 6: Some of major drought events in the Danube river basin....................................................... 27
Table 7: Some extreme flood events in the Danube river basin ........................................................... 28
Table 8: The biggest lakes in the Carpathian Region ........................................................................... 34
Table 9: The percentage share of slopes within the Carpathian Region .............................................. 45
Table 10: Population density in main river basins in Carpathian region: .............................................. 47
Table 11: Average seasonal temperature in Carpathian region............................................................ 49
Table 12: The list of Classnames in Corine Land Cover 2000.............................................................. 52
Table 13: Participation of each land cover area in the Carpathian Region........................................... 53
Table 14: Percentage participation of each land cover area in Carpathian country parties ................. 54
Table 15: Percentage participation of each land cover area in Carpathian river catchments............... 55
Table 16: Percentage participation of diffuse sources in each river catchment.................................... 58
Table 17: Configuration of percentage length in means of pollutions and hydromorphological
alterations for main rivers ...................................................................................................................... 62
Table 18: Amount of water quality monitoring stations in Carpathian river catchments. ...................... 68
Table 19: Amount of water quality monitoring stations in Carpathian countries. .................................. 68
Table 20: Participation of significant water abstractions in countries.................................................... 73
Table 21: Quantity of gauge stations in each country ........................................................................... 75
Table 22: Quantity of gauge stations in each river catchment .............................................................. 75
Table 23: Quantity of gauge stations in main river basins .................................................................... 75
Table 24: Temperature change areas ................................................................................................... 85
Table 25: Major flood events in the Region........................................................................................... 88
Table 26: Changes in river discharge for a flood events for main......................................................... 92
Table 27: Insured losses connected with floods ................................................................................... 99
Table 28: Flood losses in Carpathian countries in 2002 ..................................................................... 100
Table 29: The list of the river basin of river basin districts within the Carpathian Region identified in
accordance with Article 3 (1) of the Water Framework Directive ........................................................ 101
Table 30: The list of competent authorities identified in accordance with Article 3 (2) of the Water
Framework Directive............................................................................................................................ 102
“Report on water resources and natural disasters (climate change) and flood risk mapping” ___________________________________________________________________________________________________________________________________________________________________________________________________
6 / 106
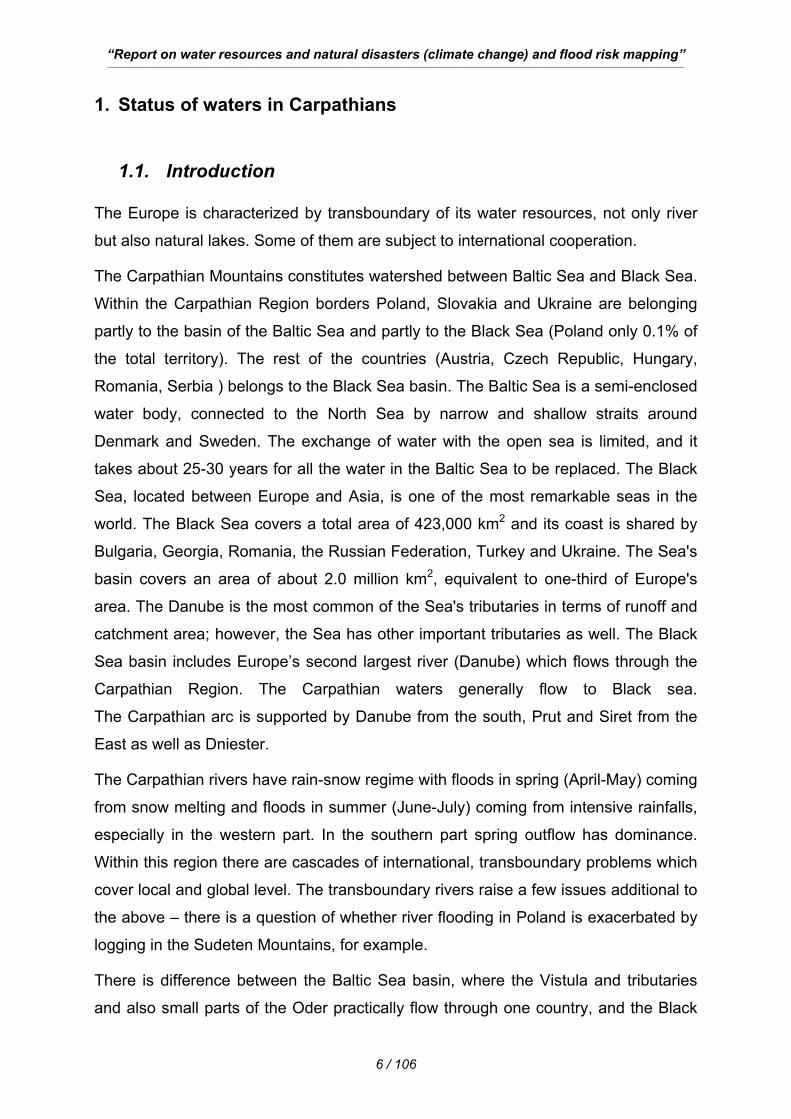
1. Status of waters in Carpathians
1.1. Introduction The Europe is characterized by transboundary of its water resources, not only river
but also natural lakes. Some of them are subject to international cooperation.
The Carpathian Mountains constitutes watershed between Baltic Sea and Black Sea.
Within the Carpathian Region borders Poland, Slovakia and Ukraine are belonging
partly to the basin of the Baltic Sea and partly to the Black Sea (Poland only 0.1% of
the total territory). The rest of the countries (Austria, Czech Republic, Hungary,
Romania, Serbia ) belongs to the Black Sea basin. The Baltic Sea is a semi-enclosed
water body, connected to the North Sea by narrow and shallow straits around
Denmark and Sweden. The exchange of water with the open sea is limited, and it
takes about 25-30 years for all the water in the Baltic Sea to be replaced. The Black
Sea, located between Europe and Asia, is one of the most remarkable seas in the
world. The Black Sea covers a total area of 423,000 km2 and its coast is shared by
Bulgaria, Georgia, Romania, the Russian Federation, Turkey and Ukraine. The Sea's
basin covers an area of about 2.0 million km2, equivalent to one-third of Europe's
area. The Danube is the most common of the Sea's tributaries in terms of runoff and
catchment area; however, the Sea has other important tributaries as well. The Black
Sea basin includes Europe’s second largest river (Danube) which flows through the
Carpathian Region. The Carpathian waters generally flow to Black sea.
The Carpathian arc is supported by Danube from the south, Prut and Siret from the
East as well as Dniester.
The Carpathian rivers have rain-snow regime with floods in spring (April-May) coming
from snow melting and floods in summer (June-July) coming from intensive rainfalls,
especially in the western part. In the southern part spring outflow has dominance.
Within this region there are cascades of international, transboundary problems which
cover local and global level. The transboundary rivers raise a few issues additional to
the above – there is a question of whether river flooding in Poland is exacerbated by
logging in the Sudeten Mountains, for example.
There is difference between the Baltic Sea basin, where the Vistula and tributaries
and also small parts of the Oder practically flow through one country, and the Black
“Report on water resources and natural disasters (climate change) and flood risk mapping” ___________________________________________________________________________________________________________________________________________________________________________________________________
7 / 106
Sea basin, where the Danube and it’s tributaries flow through several countries within
the borders of the Carpathian Region (Austria, Slovakia, Hungary, Serbia and
Romania). It is important to underline that within Carpathian Region all countries
except Serbia and Ukraine are the member states of European Union. During the
past decades, nitrogen and phosphorus loads have reduced the water quality of the
Black Sea and caused significant damage to this unique ecosystem, including
decline in its fishery. Poor water quality and deficient coastal zone management have
also reduced tourism revenues. Nutrient loads come from all over the Black Sea
basin, in particular through the Danube. Losses and deterioration of wetlands in the
Black Sea and the Danube have also contributed to the poor water quality.
The Baltic Marine Environment Protection Commission (HELCOM) is the secretariat
of the parties to the Convention on the Protection of the Marine Environment,
or Helsinki Convention, which was signed on 22 March 1974. The parties to this
convention committed themselves to protection of the marine environment of the
Baltic, including mitigation of land-based pollution and to combating marine pollution
from oil. Taking into account political changes and changes in international
environmental and maritime law, a new convention was signed in 1992 by all the
states bordering the Baltic Sea and the European Community. A Strategic Action
Plan for protection of the Baltic Sea, called the Joint Comprehensive Environmental
Action Program for the Baltic Sea (JCP) has been prepared by HELCOM.
The Program's measures include:
• policy, legal and regulatory measures,
• institutional strengthening,
• investments in point source and non-point source control,
• management of coastal lagoons and wetlands, recognized as natural pollution
traps and as providing variable levels of treatment of biodegradable waste, as
well as habitat for diverse flora and fauna,
• applied research,
• public awareness and environmental education.
Cooperation on issues that affect the Danube goes beyond the issue of navigation
that prompted the Vienna Convention (1948). In 1994 the Danube River Protection
Convention was signed by most riparian countries, committing the countries to
“Report on water resources and natural disasters (climate change) and flood risk mapping” ___________________________________________________________________________________________________________________________________________________________________________________________________
8 / 106
cooperate for the protection and sustainable use of the Danube. This treaty charged
the International Commission for the Protection of the Danube River (ICPDR) with
implementing the Danube Convention. The ICPDR' s secretariat is in Vienna.
The GEF works with the ICPDR toward the goal of increasing transboundary
cooperation in the Danube basin and reducing nutrient effluent to the Danube.
The Black Sea Commission is charged with implementing the Convention for the
Protection of the Black Sea against Pollution, an agreement among the six countries
bordering on the Black Sea. This Convention was signed in Bucharest in April 1992
and ratified by the legislative assemblies of its signatories: Bulgaria, Georgia,
Romania, the Russian Federation, Turkey and Ukraine. Known as the Bucharest
Convention, the document includes a basic framework of agreement and protocols
addressing control of land-based sources of pollution, dumping of waste and joint
action in case of accidents (such as oil spills). The Black Sea Commission has
a permanent secretariat in Istanbul (the Istanbul Commission). The GEF also works
with the Black Sea Commission, in this case toward rehabilitation of the Black Sea
ecosystem through control of eutrophication and hazardous substances, among
other measures.
“Report on water resources and natural disasters (climate change) and flood risk mapping” ___________________________________________________________________________________________________________________________________________________________________________________________________
9 / 106
1.2. Water policy An understanding of the European water policy is useful to explain major aspects in
the evolution of the Member States water policies. As everyone knows European
directives are legally binding and directly applicable in the Member States.
The directives are transposed integrally in the national law within compulsory
deadlines.
If they are not properly transposed and applied, the Member States at fault are
condemned and sanctioned by the European Court of Justice.
The EU Water Framework Directive 2000/60/EC (WFD) introduces new and different
approaches towards water management, both for the members who recently joined
the EU as well as for the older EU-member states. The WFD has far-reaching
consequences at institutional, organisational and technical levels. The central feature
of the WFD, around which all its other elements are arranged, is the use of river
basins as the basic unit for all water planning and management actions.
This recognises that water respects physical and hydrological boundaries, but not
political and administrative limits. Mainly through the development and
implementation of River Basin Management Plans, the WFD’s overall environmental
objective is the achievement of ‘good status’ for all of Europe’s surface- and ground-
waters within a 15-year period. As a consequence, WFD implementation will involve
a vast range of stakeholders, ranging from individual consumers, major water-using
sectors such as agriculture and industry, and secondary uses like water-based
recreation, to water supply/treatment companies, scientists, nature conservationists
and the authorities involved in planning land and water use at local, regional, national
and international levels. The Water Framework Directive:
• sets uniform standards in water policy throughout the European Union and
integrates different policy areas involving water issues,
• introduces the river basin approach for the development of integrated and
coordinated river basin management plans for all European river systems,
• includes public participation in the development of river basin management
plans encouraging active involvement of interested parties including
stakeholders, non-governmental organizations and citizens,
“Report on water resources and natural disasters (climate change) and flood risk mapping” ___________________________________________________________________________________________________________________________________________________________________________________________________
10 / 106
• stipulates a defined time-frame for the achievement of the good status of
surface water and groundwater,
• requests a comprehensive ecological assessment and classification on the
basis of the composition and abundance of the aquatic fauna and flora taking
into account the type-specific reference conditions of the water body,
• includes the definition of lower environmental objectives for heavily modified
water bodies,
• introduces the economic analysis of water use in order to estimate the most
cost-effective combination of measures in respect to water uses.
1.3. Natural hazards Some natural hazards are weather events related to climate and water (floods, flash
floods, thermal extremes and droughts). Each hazard is in same way unique. For
example flash floods are short-lived, violent events ,affecting relatively small area.
Others like droughts develop slowly but can affect relatively great area. An extreme
weather event can involve multiple hazard at the same time or one by one. Floods
can occur anywhere after heavy rain events. Floodplains are vulnerable and heavy
storms can also cause flash flooding. Flash flood can occur even after a period of
drought when heavy rain falls onto hard ground. (the water cannot penetrate).
The primary cause of an drought is a deficiency of rainfall. Drought is different from
other hazards in that it develops slowly. In some case droughts are recognize too late
for emergency measures to be effective.
1.4. New policy initiatives New policy initiatives of EU are related to the natural hazards. The next directive with
the river basin approach is the directive on the assessment and management of
floods. The Directive was enacted on 18 September 2007. The objective of the
Directive is to reduce and manage the risks which floods pose to human health, the
environment, infrastructure and property. It will provide for flood mapping in all areas
with a significant flood risk, for coordination within shared river basins, and for
producing flood risk management plans through a broad participatory process.
“Report on water resources and natural disasters (climate change) and flood risk mapping” ___________________________________________________________________________________________________________________________________________________________________________________________________
11 / 106
A preliminary flood risk assessment shall be undertaken to provide an assessment of
potential risks based on available or readily derivable information, such as records
and studies on long-term developments, in particular climate change. Member States
shall, at the level of the river basin district or unit of management prepare flood
hazard maps and flood risk maps, at the most appropriate scale. Flood hazard maps
shall cover the geographical areas which could be flooded according to the following
scenarios: (a) floods with a low probability, or extreme events scenarios; (b) floods
with a medium probability (likely return period ≥ 100 years);(c) floods with a high
probability, where appropriate. Member States shall establish flood risk management
plans coordinated at the level of the river basin district or unit of management. Flood
risk management plans shall address all aspects of flood risk management focusing
on prevention, protection, preparedness, including flood forecasts and early warning
systems and taking into account the characteristics of the particular river basin or
sub-basin. Flood risk management plans may also include the controlled flooding of
certain areas in the case of a flood event.
While "drought" means a temporary decrease in water availability due for instance to
rainfall deficiency, "water scarcity" means that water demand exceeds the water
resources exploitable under sustainable conditions. In a context where changes in
climate are foreseen in spite of significant EU mitigation efforts, this trend is expected
to continue and even worsen, as underscored in the recently adopted Commission
Green Paper on adaptation to climate change. EC adopted also on 18th of 1July 2007
COMMUNICATION FROM THE COMMISSION TO THE EUROPEAN PARLIAMENT
AND THE COUNCIL entitled “Addressing the challenge of water scarcity and
droughts in the European Union”. This Communication also responds to the request
for action on water scarcity and droughts from the Environment Council in June 2006.
“Report on water resources and natural disasters (climate change) and flood risk mapping” ___________________________________________________________________________________________________________________________________________________________________________________________________
12 / 106
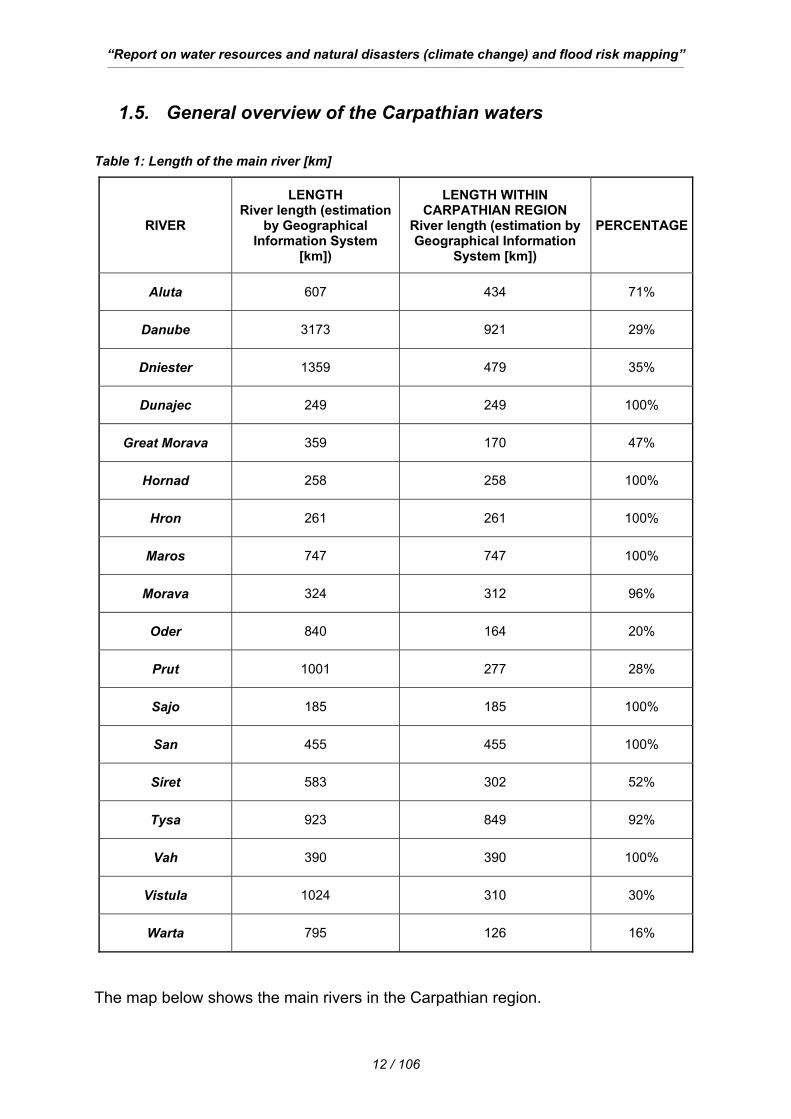
1.5. General overview of the Carpathian waters Table 1: Length of the main river [km]
RIVER
LENGTH River length (estimation
by Geographical Information System
[km])
LENGTH WITHIN CARPATHIAN REGION
River length (estimation by Geographical Information
System [km])
PERCENTAGE
Aluta 607 434 71%
Danube 3173 921 29%
Dniester 1359 479 35%
Dunajec 249 249 100%
Great Morava 359 170 47%
Hornad 258 258 100%
Hron 261 261 100%
Maros 747 747 100%
Morava 324 312 96%
Oder 840 164 20%
Prut 1001 277 28%
Sajo 185 185 100%
San 455 455 100%
Siret 583 302 52%
Tysa 923 849 92%
Vah 390 390 100%
Vistula 1024 310 30%
Warta 795 126 16%
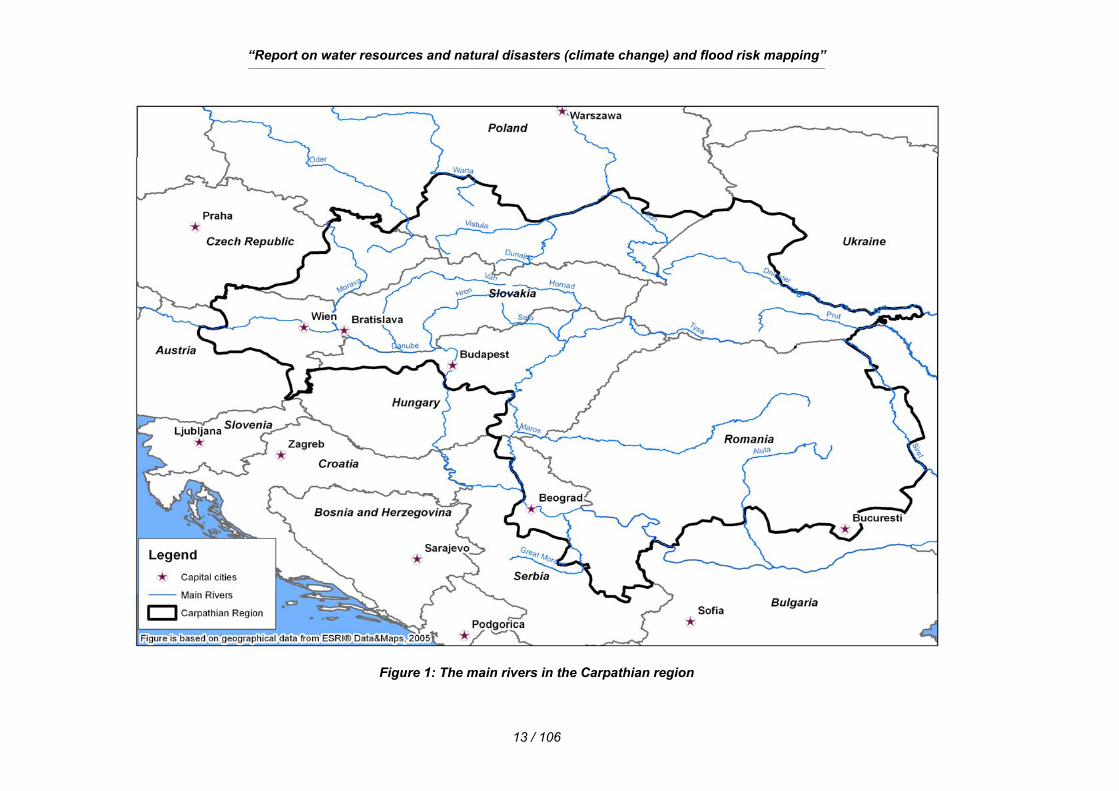
The map below shows the main rivers in the Carpathian region.
“Report on water resources and natural disasters (climate change) and flood risk mapping” ___________________________________________________________________________________________________________________________________________________________________________________________________
13 / 106
Figure 1: The main rivers in the Carpathian region
“Report on water resources and natural disasters (climate change) and flood risk mapping” ___________________________________________________________________________________________________________________________________________________________________________________________________
14 / 106
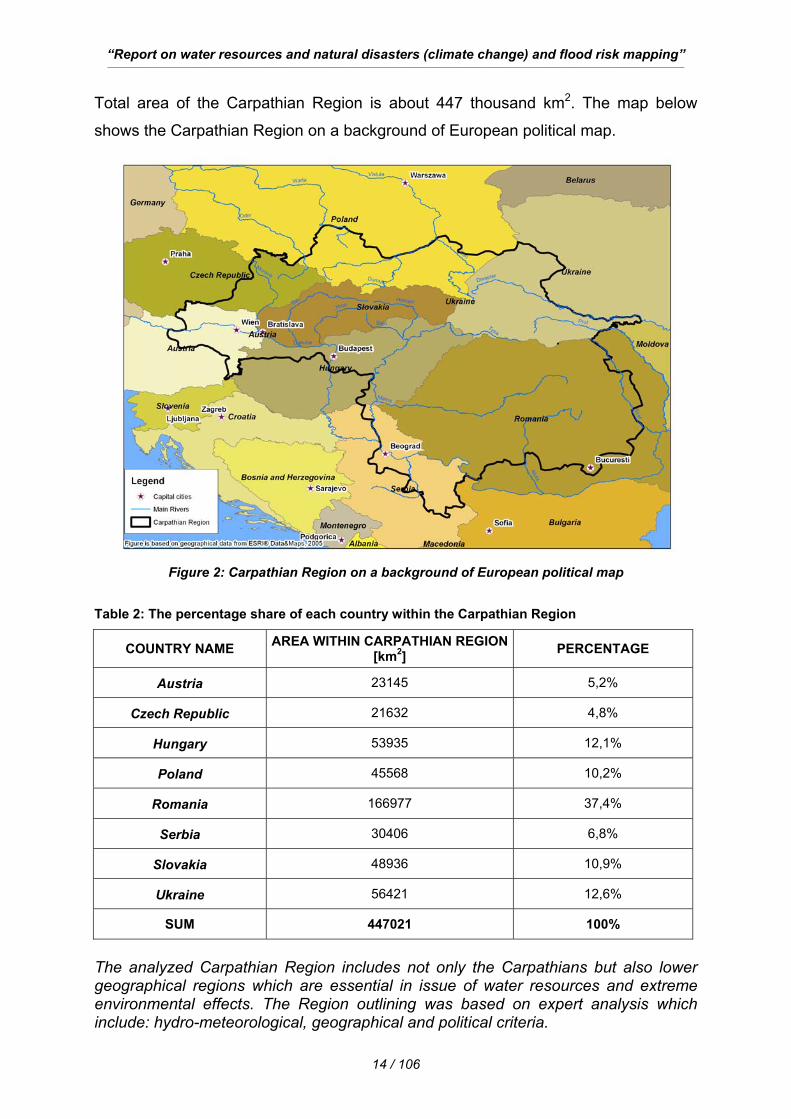
Total area of the Carpathian Region is about 447 thousand km2. The map below
shows the Carpathian Region on a background of European political map.
Figure 2: Carpathian Region on a background of European political map
Table 2: The percentage share of each country within the Carpathian Region
COUNTRY NAME AREA WITHIN CARPATHIAN REGION [km2] PERCENTAGE
Austria 23145 5,2%
Czech Republic 21632 4,8%
Hungary 53935 12,1%
Poland 45568 10,2%
Romania 166977 37,4%
Serbia 30406 6,8%
Slovakia 48936 10,9%
Ukraine 56421 12,6%
SUM 447021 100%
The analyzed Carpathian Region includes not only the Carpathians but also lower geographical regions which are essential in issue of water resources and extreme environmental effects. The Region outlining was based on expert analysis which include: hydro-meteorological, geographical and political criteria.
“Report on water resources and natural disasters (climate change) and flood risk mapping” ___________________________________________________________________________________________________________________________________________________________________________________________________
15 / 106
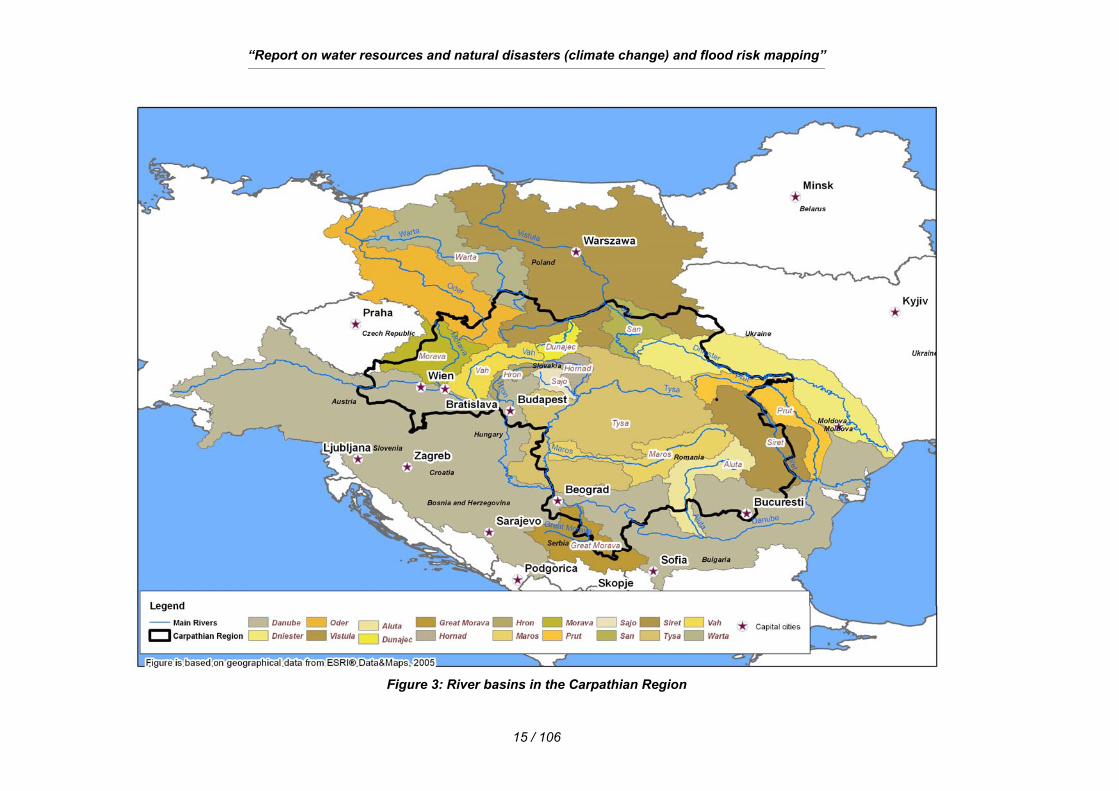
Figure 3: River basins in the Carpathian Region
“Report on water resources and natural disasters (climate change) and flood risk mapping” ___________________________________________________________________________________________________________________________________________________________________________________________________
16 / 106
Table 3: Surface area of the river basin
RIVER
AREA River basin surface area
(estimation by Geographical
Information System [km2])
AREA WITHIN CARPATHIAN REGION
River basin surface area (estimation by Geographical Information System [km2])
PERCENTAGE
Aluta 25259 20645 82%
Danube 804480 360671 45%
Dniester 72905 20913 29%
Dunajec 6753 6753 100%
Great Morava 30641 7476 24%
Hornad 6911 6911 100%
Hron 5366 5366 100%
Maros 31706 31706 100%
Morava 26476 20648 78%
Oder 116860 14132 12%
Prut 29761 9214 31%
Sajo 12506 12506 100%
San 16969 14381 85%
Siret 44272 34482 78%
Tysa 166300 157107 94%
Vah 20394 20394 100%
Vistula 194545 48652 25%
Warta 47241 3155 7%
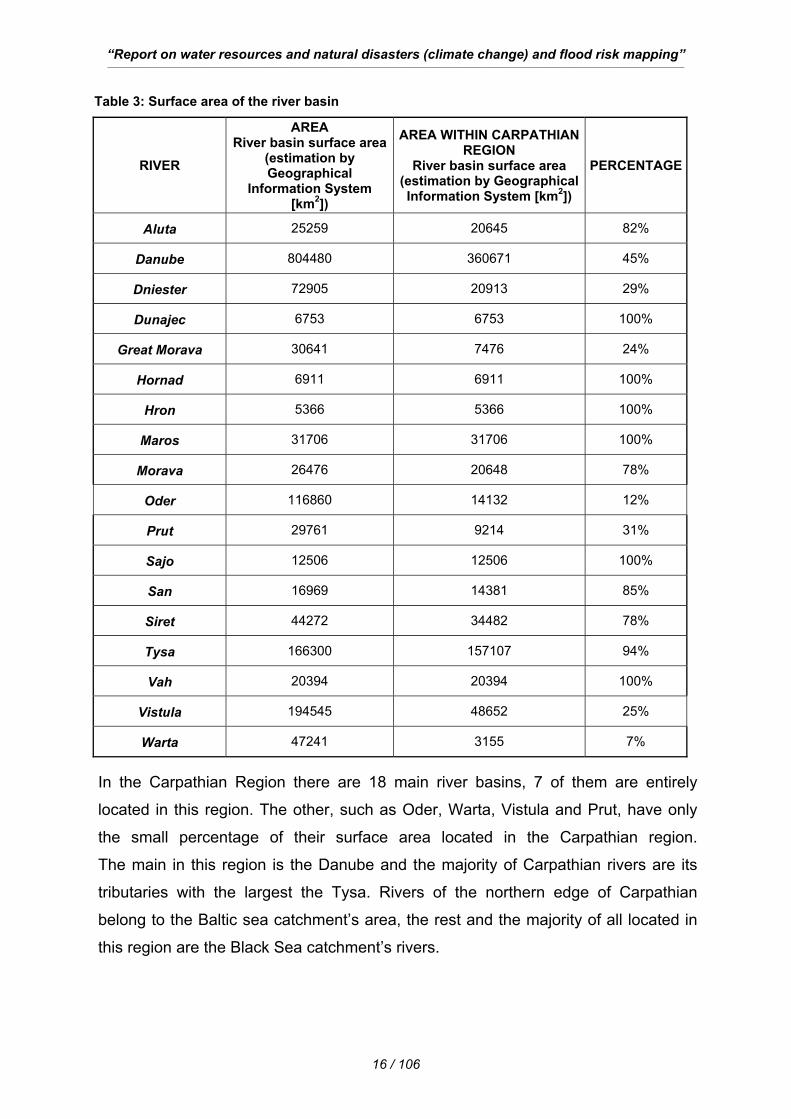
In the Carpathian Region there are 18 main river basins, 7 of them are entirely
located in this region. The other, such as Oder, Warta, Vistula and Prut, have only
the small percentage of their surface area located in the Carpathian region.
The main in this region is the Danube and the majority of Carpathian rivers are its
tributaries with the largest the Tysa. Rivers of the northern edge of Carpathian
belong to the Baltic sea catchment’s area, the rest and the majority of all located in
this region are the Black Sea catchment’s rivers.
“Report on water resources and natural disasters (climate change) and flood risk mapping” ___________________________________________________________________________________________________________________________________________________________________________________________________
17 / 106
2. General Description on the base of the Carpathian arc
2.1. Situation of water resources in Carpathians
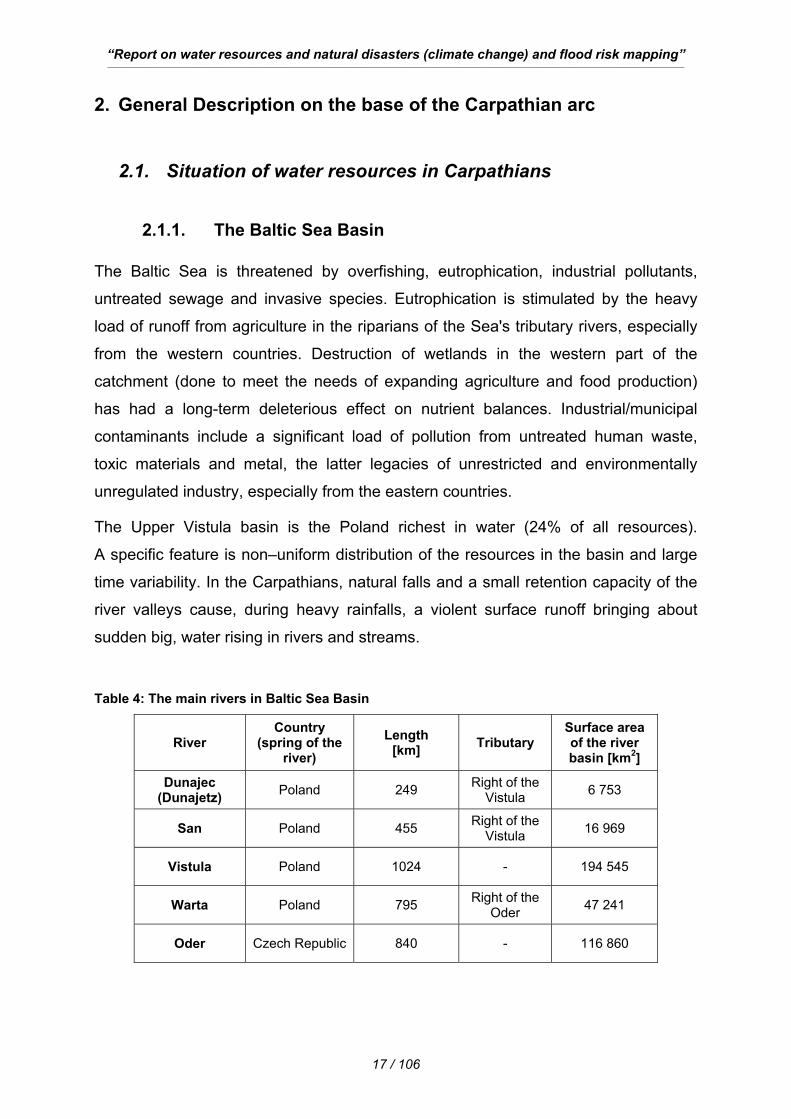
2.1.1. The Baltic Sea Basin The Baltic Sea is threatened by overfishing, eutrophication, industrial pollutants,
untreated sewage and invasive species. Eutrophication is stimulated by the heavy
load of runoff from agriculture in the riparians of the Sea's tributary rivers, especially
from the western countries. Destruction of wetlands in the western part of the
catchment (done to meet the needs of expanding agriculture and food production)
has had a long-term deleterious effect on nutrient balances. Industrial/municipal
contaminants include a significant load of pollution from untreated human waste,
toxic materials and metal, the latter legacies of unrestricted and environmentally
unregulated industry, especially from the eastern countries.
The Upper Vistula basin is the Poland richest in water (24% of all resources).
A specific feature is non–uniform distribution of the resources in the basin and large
time variability. In the Carpathians, natural falls and a small retention capacity of the
river valleys cause, during heavy rainfalls, a violent surface runoff bringing about
sudden big, water rising in rivers and streams.
Table 4: The main rivers in Baltic Sea Basin
River Country
(spring of the river)
Length [km] Tributary
Surface area of the river basin [km2]
Dunajec (Dunajetz) Poland 249 Right of the
Vistula 6 753
San Poland 455 Right of the Vistula 16 969
Vistula Poland 1024 - 194 545
Warta Poland 795 Right of the Oder 47 241
Oder Czech Republic 840 - 116 860
“Report on water resources and natural disasters (climate change) and flood risk mapping” ___________________________________________________________________________________________________________________________________________________________________________________________________
18 / 106
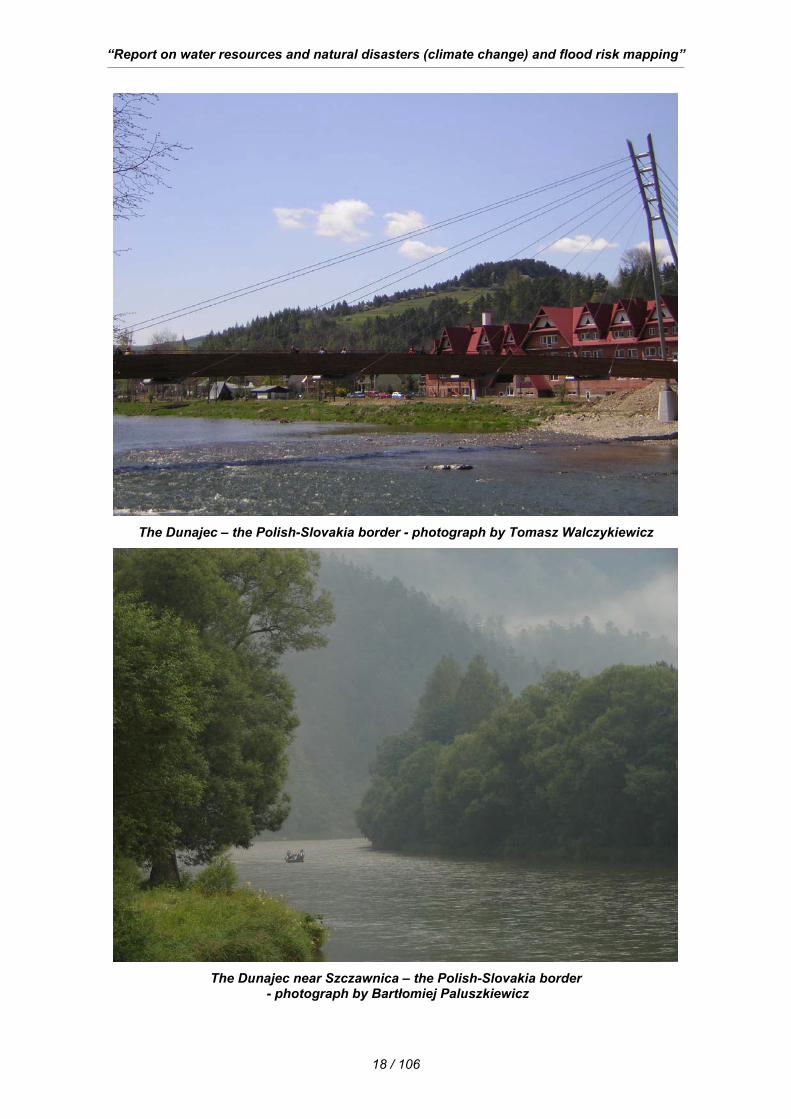
The Dunajec – the Polish-Slovakia border - photograph by Tomasz Walczykiewicz
The Dunajec near Szczawnica – the Polish-Slovakia border
- photograph by Bartłomiej Paluszkiewicz
“Report on water resources and natural disasters (climate change) and flood risk mapping” ___________________________________________________________________________________________________________________________________________________________________________________________________
19 / 106
The water resources of the Carpathian rivers constitute current and potential water
resources on both regional and national scale. Assuming the average annual flow-
rate as the basic index of surface water resources the flow rate of the Vistula under
the mouth of the San river reaches approximately 445 m3/s. Upon balancing the
available resources of underground waters, they are estimated at 25,8 m3/s.
The Oder is the second major river in Poland. The third largest river is the Warta,
a right tributary of the Oder. Generally speaking the Oder is not rich in water but on
the contrary flooding is very frequent. Thanks to the river regulation the Oder is the
best inland waterway in Poland.
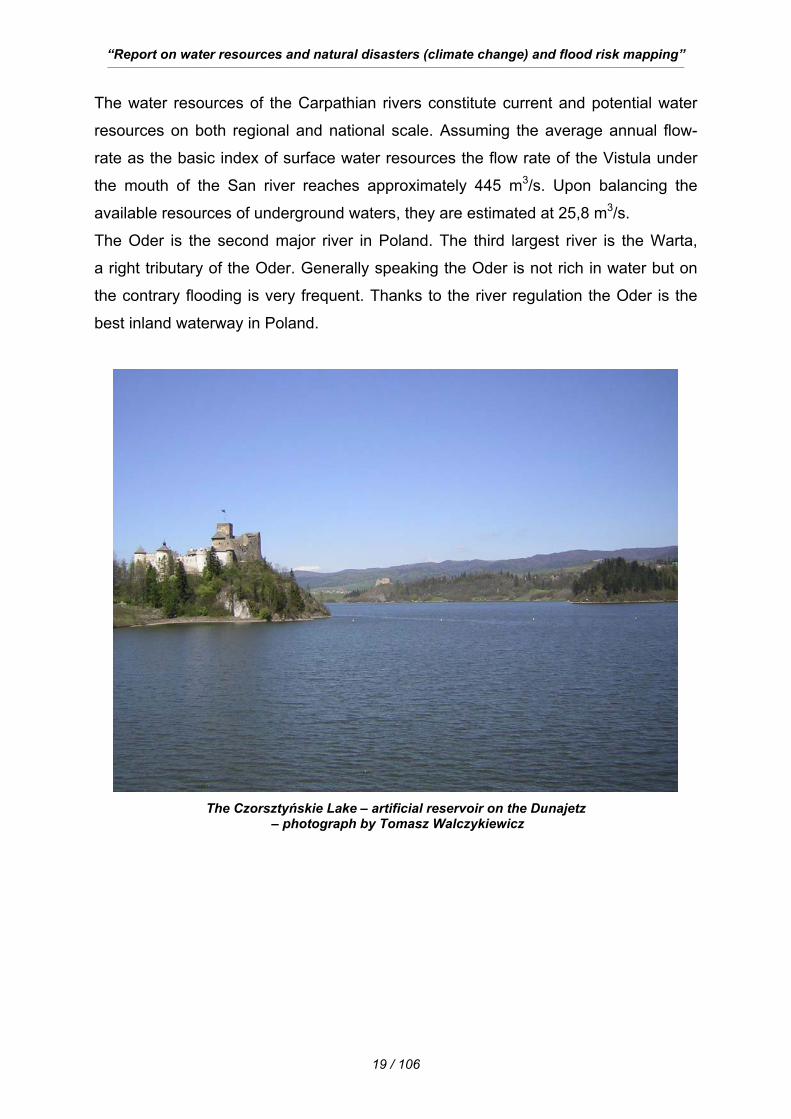
The Czorsztyńskie Lake – artificial reservoir on the Dunajetz
– photograph by Tomasz Walczykiewicz
“Report on water resources and natural disasters (climate change) and flood risk mapping” ___________________________________________________________________________________________________________________________________________________________________________________________________
20 / 106
2.1.1.1. Droughts and floods Variability in the surface runoff is significant for both the regional economy and
agriculture; it has also an important social dimension, especially during low and high
runoffs. In the 20th century particularly low levels occurred in the years 1904, 1921,
1930, 1951, 1959, 1961, 1983, 1984, 1992, 2003.
The Carpathian Vistula is a zone with precipitation and runoff exceed the mean
values in Poland. Due to the mountainous type of the river basin it causes high flood
hazard. The highest annual precipitation reaches 1675 mm in the Tatra Mountains.
Important factor determining the flood hazard in the basin is the growing settlement
over the last years with concentration along river valleys which in fact have lost their
natural functions of draining high waters. Dating back from the 10th to 19th centuries
about 70 disastrous floods came upon those areas. In the 20th century the floods took
place in 1903, 1934, 1970, 1976, 1997. The great flood in 1997 was not only related
to the nature phenomena but also to a poor condition of many facilities of passive
and active flood protection. After the flood in 1997 the Polish government adopted
the National Plan of Reconstruction and Modernization. A $ 200 million loan
agreement was signed with the World Bank in order to give financial support.
The main objective of the program was to offer aid to people who suffered losses
during the flood, reconstruction of towns, settlements and modernization of
infrastructure in the areas affected by the flood.
“Report on water resources and natural disasters (climate change) and flood risk mapping” ___________________________________________________________________________________________________________________________________________________________________________________________________
21 / 106
2.1.1.2. Water use The basic water supply source within the Upper Vistula basin are the resources of
surface waters. More than 70% is used for industrial purposes, in that number 90% is
consumed by power sector. Agriculture uses about 6% of water and the remaining
14% is used by municipal waterworks. The contaminants contained in the municipal
sewage are one of the basic factors affecting the quality of surface waters. Large
population density in the western part of the Carpathian Vistula, lack of the
satisfactory capacity of treatment plants as well as their inefficient operation bring
high contents of the organic compounds. Big amounts of biogens running off to
rainfall water courses from arable lands, green lands, woodlands are significant in the
overall balance. The main source of mineral compounds in the Upper Vistula is hard
coal mining. The coal wastes produced by the coal mining sector constitute near 60%
of all industrial wastes in the western part of that region. The Upper Vistula basin is a
zone of intensive activity of a large number of industrial sectors which are
characterized by high water consumption and causing contamination of surface and
underground waters. Less populated is the north and east part of the Upper Vistula
basin. Woodlands cover 32% of the area. Agriculture is highly dispersed and the
average area of a single farmstead is very low (4 ha). The cultivated crop structures
are responsible for creating condition for considerable soil erosion related to
intensive surface runoff.
Many sewage treatment plants are already being built. Compared to 1985 the volume
of sewage subject either to biological treatment or to more extensive removal of
biogens has increased more than 60% in the Upper Vistula river basin. Important
activities regarding municipal wastes have already been undertaken, within the
framework of the Waste Water Treatment Program.
“Report on water resources and natural disasters (climate change) and flood risk mapping” ___________________________________________________________________________________________________________________________________________________________________________________________________
22 / 106
2.1.2. The Black Sea Basin
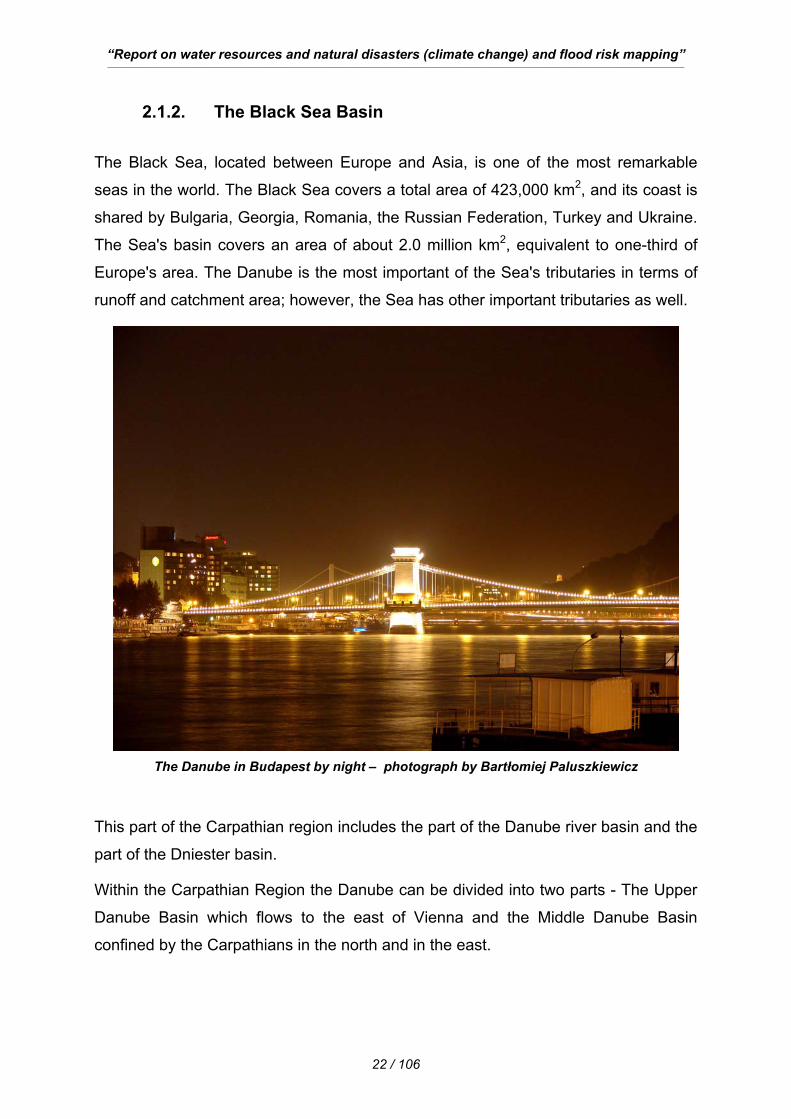
The Black Sea, located between Europe and Asia, is one of the most remarkable
seas in the world. The Black Sea covers a total area of 423,000 km2, and its coast is
shared by Bulgaria, Georgia, Romania, the Russian Federation, Turkey and Ukraine.
The Sea's basin covers an area of about 2.0 million km2, equivalent to one-third of
Europe's area. The Danube is the most important of the Sea's tributaries in terms of
runoff and catchment area; however, the Sea has other important tributaries as well.
The Danube in Budapest by night – photograph by Bartłomiej Paluszkiewicz
This part of the Carpathian region includes the part of the Danube river basin and the
part of the Dniester basin.
Within the Carpathian Region the Danube can be divided into two parts - The Upper
Danube Basin which flows to the east of Vienna and the Middle Danube Basin
confined by the Carpathians in the north and in the east.
“Report on water resources and natural disasters (climate change) and flood risk mapping” ___________________________________________________________________________________________________________________________________________________________________________________________________
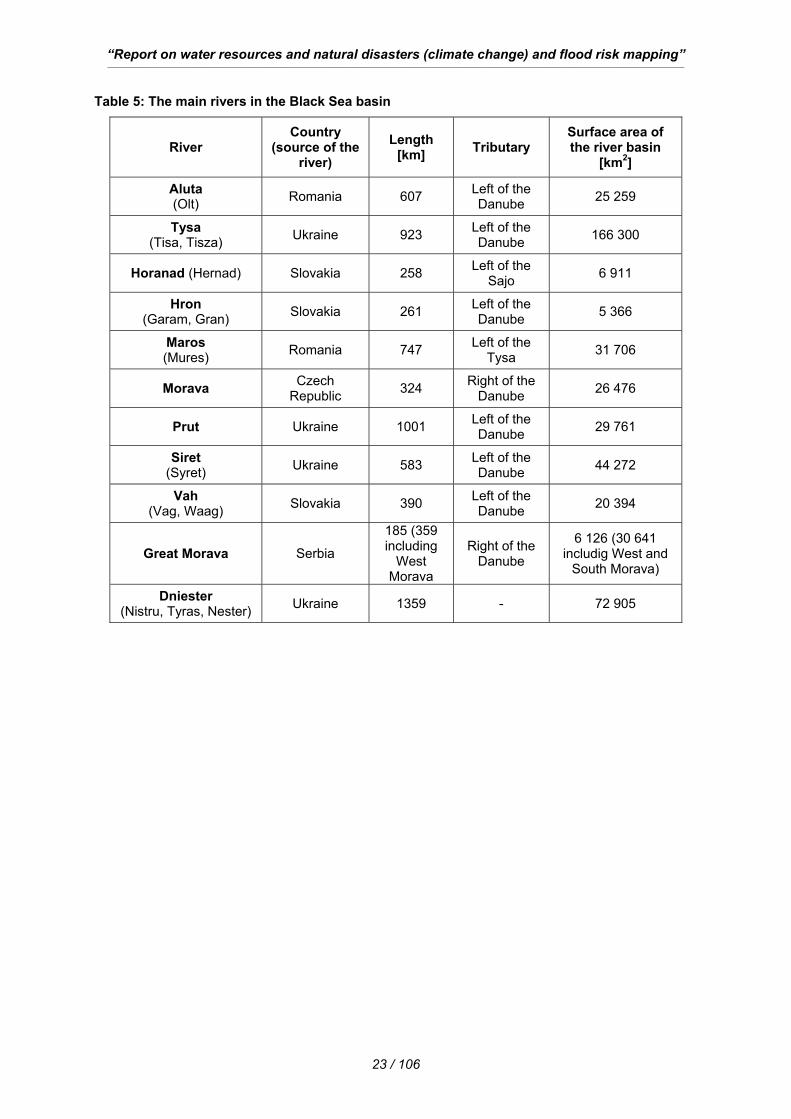
23 / 106
Table 5: The main rivers in the Black Sea basin
River Country
(source of the river)
Length [km] Tributary
Surface area of the river basin
[km2]
Aluta (Olt) Romania 607 Left of the
Danube 25 259
Tysa (Tisa, Tisza) Ukraine 923 Left of the
Danube 166 300
Horanad (Hernad) Slovakia 258 Left of the Sajo 6 911
Hron (Garam, Gran) Slovakia 261 Left of the
Danube 5 366
Maros (Mures) Romania 747 Left of the
Tysa 31 706
Morava Czech Republic 324 Right of the
Danube 26 476
Prut Ukraine 1001 Left of the Danube 29 761
Siret (Syret) Ukraine 583 Left of the
Danube 44 272
Vah (Vag, Waag) Slovakia 390 Left of the
Danube 20 394
Great Morava Serbia
185 (359 including
West Morava
Right of the Danube
6 126 (30 641 includig West and
South Morava)
Dniester (Nistru, Tyras, Nester) Ukraine 1359 - 72 905
“Report on water resources and natural disasters (climate change) and flood risk mapping” ___________________________________________________________________________________________________________________________________________________________________________________________________
24 / 106
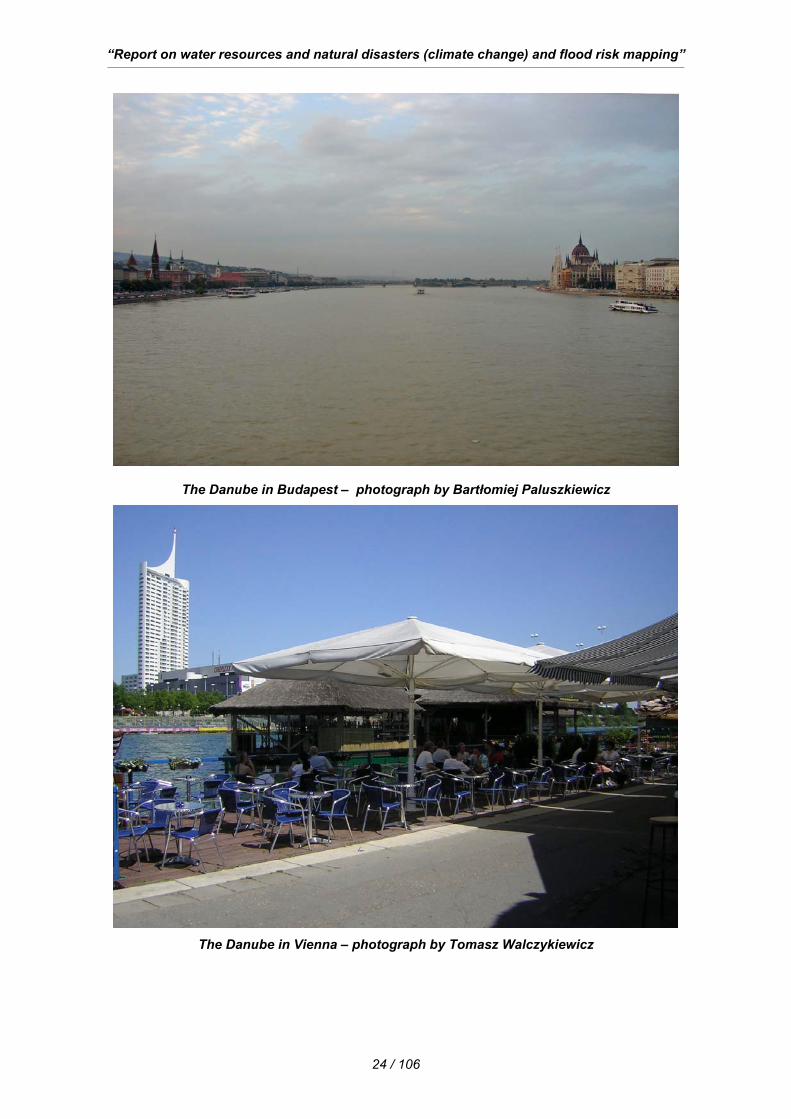
The Danube in Budapest – photograph by Bartłomiej Paluszkiewicz
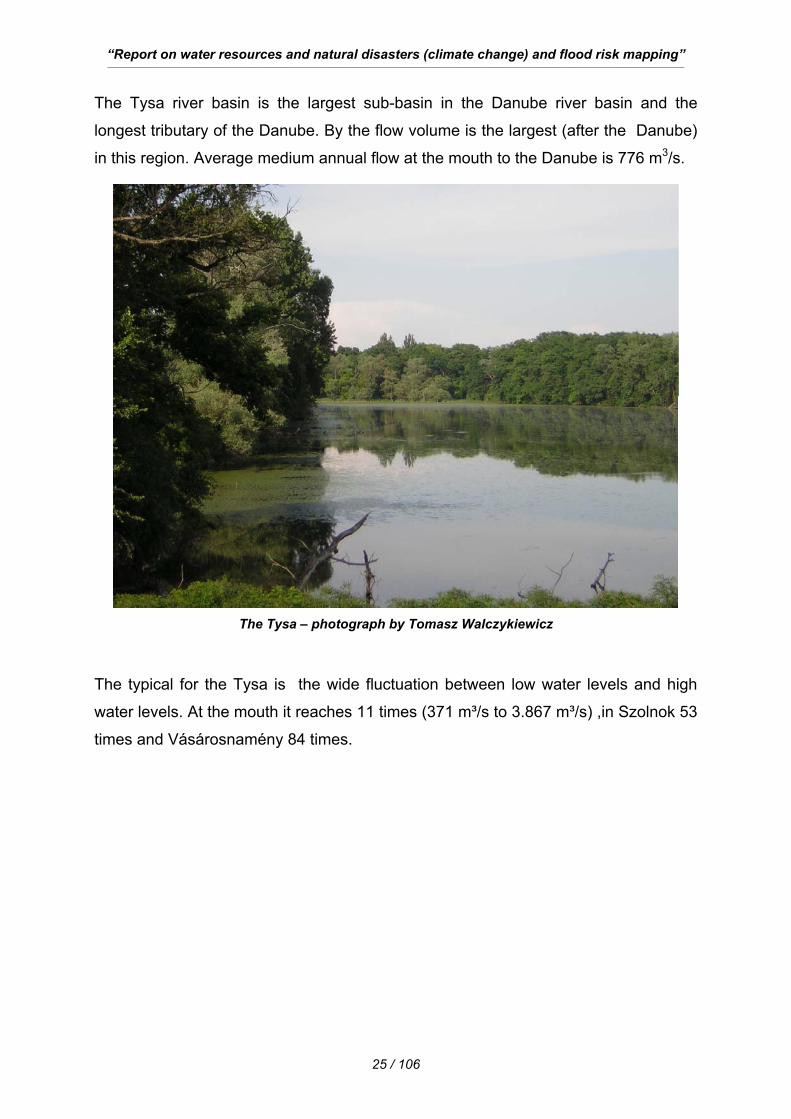
The Danube in Vienna – photograph by Tomasz Walczykiewicz
“Report on water resources and natural disasters (climate change) and flood risk mapping” ___________________________________________________________________________________________________________________________________________________________________________________________________
25 / 106
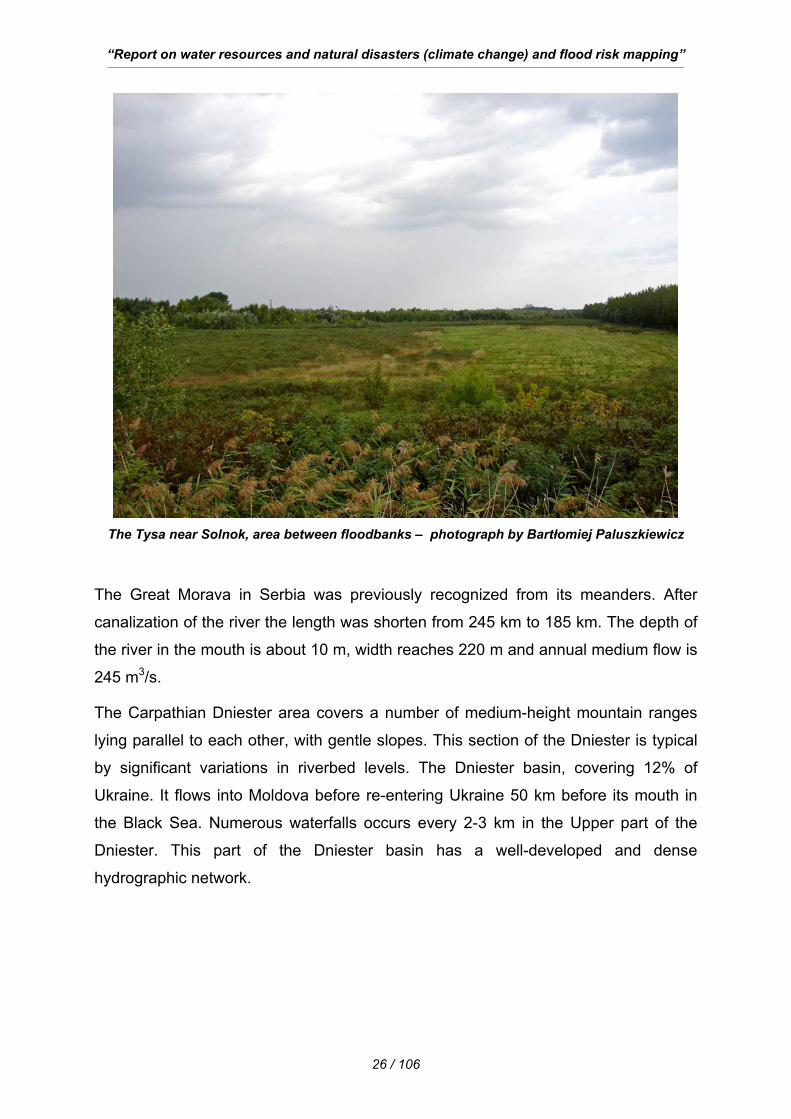
The Tysa river basin is the largest sub-basin in the Danube river basin and the
longest tributary of the Danube. By the flow volume is the largest (after the Danube)
in this region. Average medium annual flow at the mouth to the Danube is 776 m3/s.
The Tysa – photograph by Tomasz Walczykiewicz
The typical for the Tysa is the wide fluctuation between low water levels and high
water levels. At the mouth it reaches 11 times (371 m³/s to 3.867 m³/s) ,in Szolnok 53
times and Vásárosnamény 84 times.
“Report on water resources and natural disasters (climate change) and flood risk mapping” ___________________________________________________________________________________________________________________________________________________________________________________________________
26 / 106
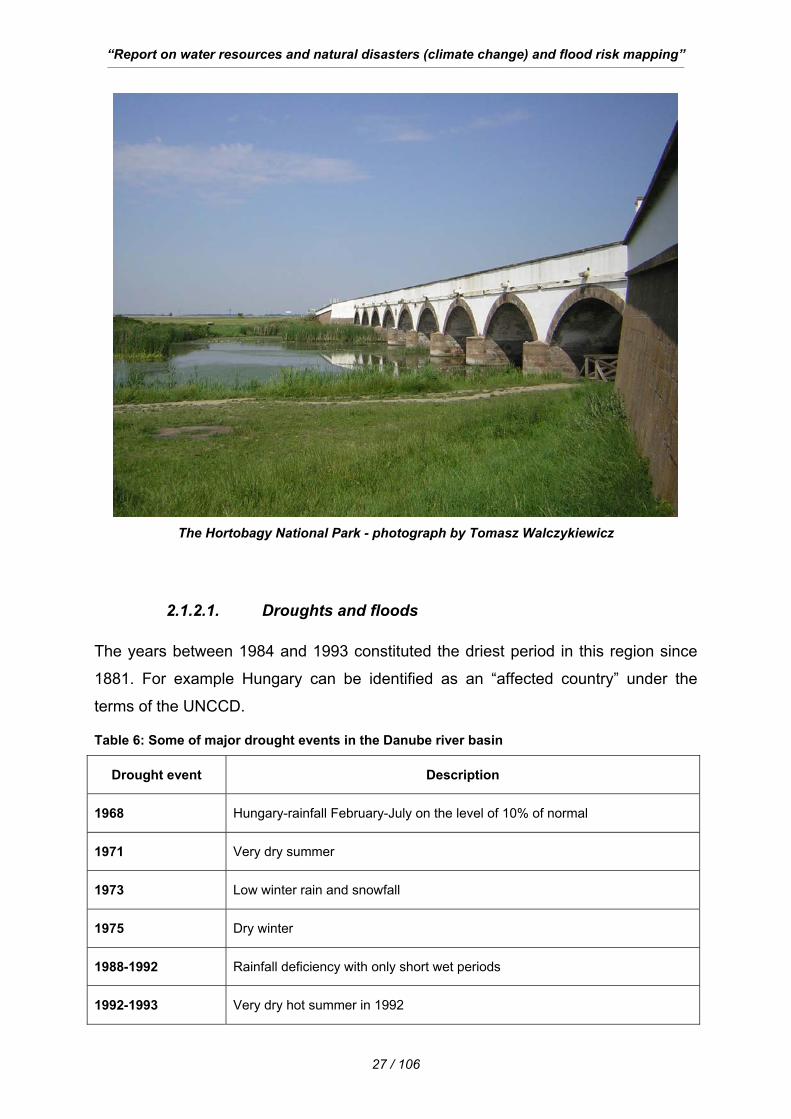
The Tysa near Solnok, area between floodbanks – photograph by Bartłomiej Paluszkiewicz
The Great Morava in Serbia was previously recognized from its meanders. After
canalization of the river the length was shorten from 245 km to 185 km. The depth of
the river in the mouth is about 10 m, width reaches 220 m and annual medium flow is
245 m3/s.
The Carpathian Dniester area covers a number of medium-height mountain ranges
lying parallel to each other, with gentle slopes. This section of the Dniester is typical
by significant variations in riverbed levels. The Dniester basin, covering 12% of
Ukraine. It flows into Moldova before re-entering Ukraine 50 km before its mouth in
the Black Sea. Numerous waterfalls occurs every 2-3 km in the Upper part of the
Dniester. This part of the Dniester basin has a well-developed and dense
hydrographic network.
“Report on water resources and natural disasters (climate change) and flood risk mapping” ___________________________________________________________________________________________________________________________________________________________________________________________________
27 / 106
The Hortobagy National Park - photograph by Tomasz Walczykiewicz
2.1.2.1. Droughts and floods The years between 1984 and 1993 constituted the driest period in this region since
1881. For example Hungary can be identified as an “affected country” under the
terms of the UNCCD.
Table 6: Some of major drought events in the Danube river basin
Drought event Description
1968 Hungary-rainfall February-July on the level of 10% of normal
1971 Very dry summer
1973 Low winter rain and snowfall
1975 Dry winter
1988-1992 Rainfall deficiency with only short wet periods
1992-1993 Very dry hot summer in 1992
“Report on water resources and natural disasters (climate change) and flood risk mapping” ___________________________________________________________________________________________________________________________________________________________________________________________________
28 / 106
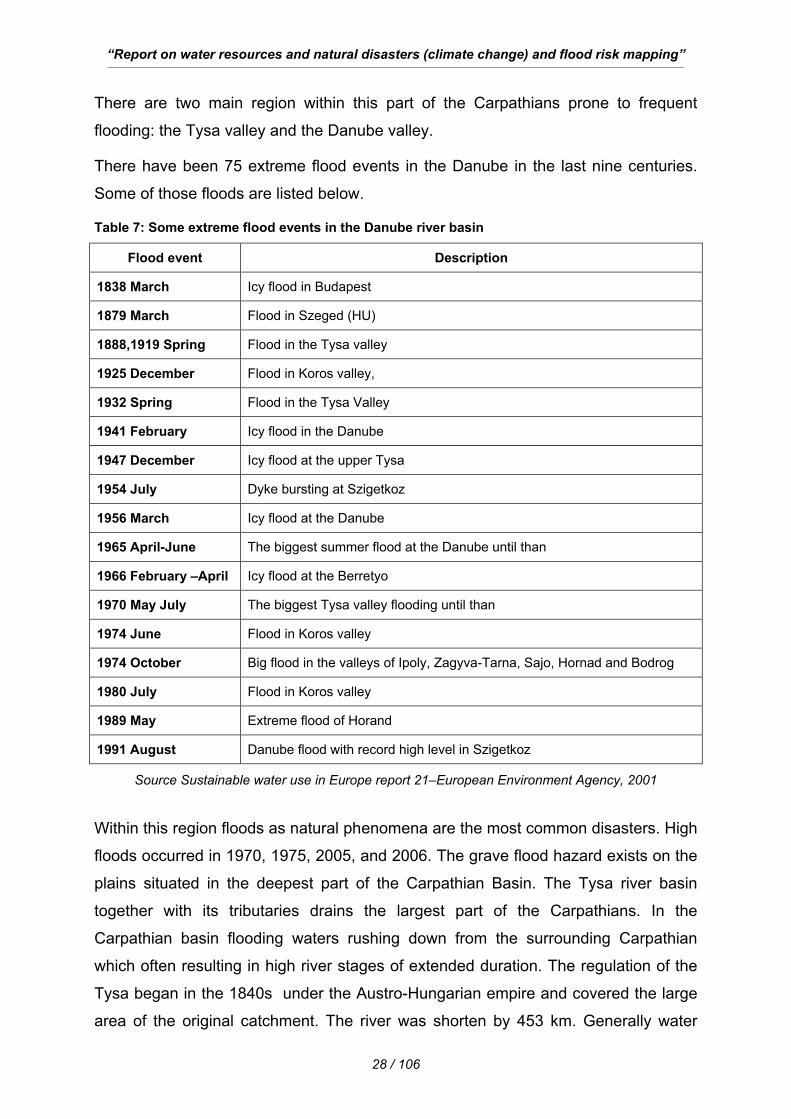
There are two main region within this part of the Carpathians prone to frequent
flooding: the Tysa valley and the Danube valley.
There have been 75 extreme flood events in the Danube in the last nine centuries.
Some of those floods are listed below.
Table 7: Some extreme flood events in the Danube river basin
Flood event Description
1838 March Icy flood in Budapest
1879 March Flood in Szeged (HU)
1888,1919 Spring Flood in the Tysa valley
1925 December Flood in Koros valley,
1932 Spring Flood in the Tysa Valley
1941 February Icy flood in the Danube
1947 December Icy flood at the upper Tysa
1954 July Dyke bursting at Szigetkoz
1956 March Icy flood at the Danube
1965 April-June The biggest summer flood at the Danube until than
1966 February –April Icy flood at the Berretyo
1970 May July The biggest Tysa valley flooding until than
1974 June Flood in Koros valley
1974 October Big flood in the valleys of Ipoly, Zagyva-Tarna, Sajo, Hornad and Bodrog
1980 July Flood in Koros valley
1989 May Extreme flood of Horand
1991 August Danube flood with record high level in Szigetkoz
Source Sustainable water use in Europe report 21–European Environment Agency, 2001
Within this region floods as natural phenomena are the most common disasters. High
floods occurred in 1970, 1975, 2005, and 2006. The grave flood hazard exists on the
plains situated in the deepest part of the Carpathian Basin. The Tysa river basin
together with its tributaries drains the largest part of the Carpathians. In the
Carpathian basin flooding waters rushing down from the surrounding Carpathian
which often resulting in high river stages of extended duration. The regulation of the
Tysa began in the 1840s under the Austro-Hungarian empire and covered the large
area of the original catchment. The river was shorten by 453 km. Generally water
“Report on water resources and natural disasters (climate change) and flood risk mapping” ___________________________________________________________________________________________________________________________________________________________________________________________________
29 / 106
works have been finished in 1880. It was done in order to get good arable land and
to protect villages from the floods. After that the river became navigable. Now this is
one of Europe’s most unique ecosystem with the wide biodiversity. The last great
change was creation of the great artificial lake (Lake Tysa) in years
1973 - 1990. The large area of the Danube wetlands are nowadays under the
pressure of navigation, hydropower and agriculture as well as new developments.
It brings new risks regarding floods. About 80% of historical flood plains of the
Danube River basin have been lost within the last 150 years. Typical downstream
conditions are in Hungary, were 96% of surface waters and floods are generated
outside the country. In the upstream parts close to the Carpathian arc 28-36 hours
after rainfall water level rise 8-10 meters. In Hungary the area of protected floodplain
reaches 21200 km2, which is 23% territory of the country - the length of defense
infrastructure is 4200 km2. Generally between 1998 and 2005 river catchments in the
Carpathian region were affected by floods from 3 to more then 6 times. The changes
in forestry patterns are introduced as well as the great plan of the flood plain
reactivation. Flash floods in the mountain part typically occur in the spring - summer
period of time. Some of those, which have been recorded recently, were extreme
from the precipitation intensity and flood effects points of view. The ice phenomena
occurs on almost all the mountain rivers and their evolution during the January –
March period and also in December determines great level variations, exceeding
sometimes the warning levels. In 2006 in Carpathian Danube basin due to heavy
rainfalls and snow melt high water levels were registered in the downstream and as
well as upstream parts of the rivers. The level of the River Danube in Austria and of
many rivers to the north of the country was critical. A state of emergency was
declared for the whole area of the South Moravian department in Czech Republic.
In Hungary the third highest level (861 cm) in the Danube was recorded (867 cm in
1876 and 848 cm in 2002).
The Dniester has specific flow regime, featuring up to five flood events annually.
During these events, water levels in the river may increase by 3-4 m, and sometimes
more at times of intensive rainfalls. Another characteristic feature of Dniester is the
fact that flow volume, recorded during a flood event, are significantly higher than
those occurring during a spring high-water period.
From the history of observations, the largest and most intensive flooding event
occurred in September 1941. Another exceptional flood event occurred in June 1969.
“Report on water resources and natural disasters (climate change) and flood risk mapping” ___________________________________________________________________________________________________________________________________________________________________________________________________
30 / 106
2.1.2.2. Water use In the Middle Danube Basin the core problems are unsustainable agricultural
practices, not sufficient management of municipal sewage and waste and in many
cases industry. Eutrophication is a problem for all slow flowing rivers in that region.
It causes the oxygen depletion. In some tributaries of the Danube high nitrate
concentration are seen as a potential human health hazard. Hazardous substances
are accumulated in sediments. The problem of toxic waste depositories was
extremely underlined during the major spill of cyanide-rich mine tailings near Baia
Mare in Romania in 2000 caused the major ecological damage to the Tysa. Pollution
of the water with heavy metals, exist in Sasar, Crisul Negru, Crisul Alb and Aries river
basins in Romania, where are important mining perimeters with rocks which reach
the surface and which are washed by the precipitation. On the other hand many of
water bodies from Carpathian areas of the Romania are undisturbed by the major
anthropogenic pressure. Generally they are in a high and good status, providing
good environment for species and representing high ecological value.
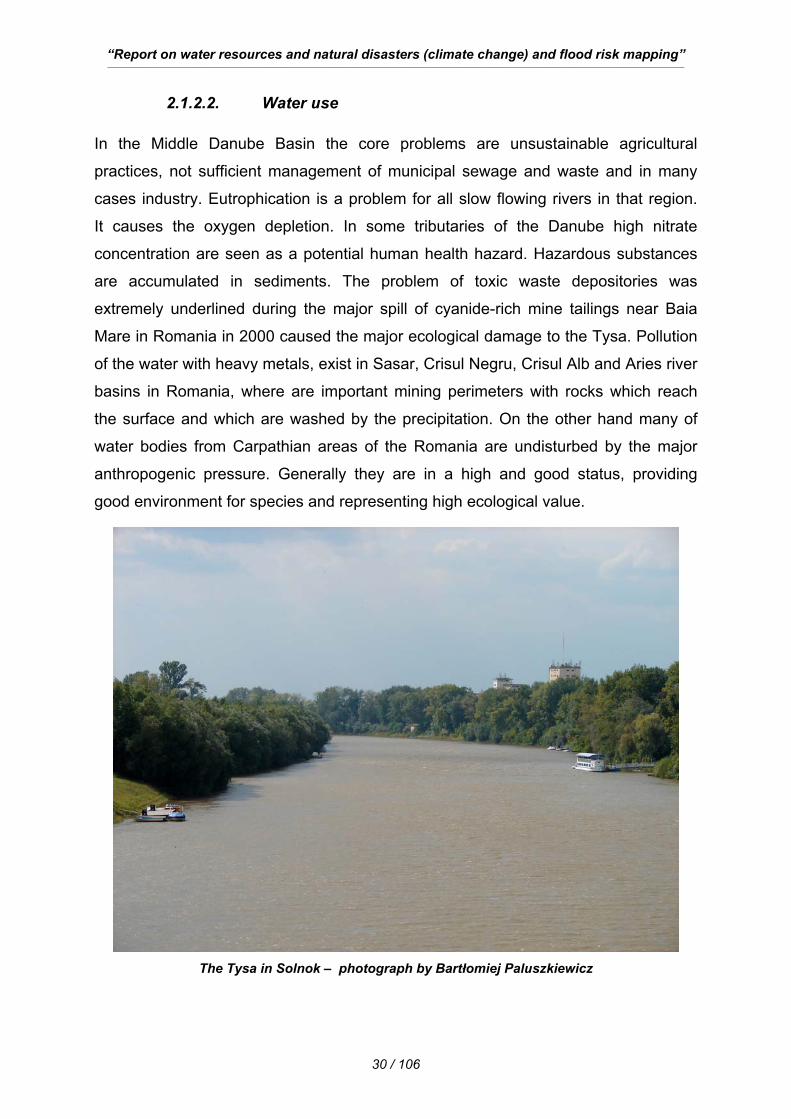
The Tysa in Solnok – photograph by Bartłomiej Paluszkiewicz
“Report on water resources and natural disasters (climate change) and flood risk mapping” ___________________________________________________________________________________________________________________________________________________________________________________________________
31 / 106
On a local scale microbiological contamination is a major problem in the Danube
basin because river itself as well as tributaries receive untreated waste water from
municipalities. Large organic loads discharge in river valleys due to slow river flow
and oxygen depletion may result in elimination of aquatic plants and animals. On the
contrary the fast flowing Danube and its tributaries are unaffected by such issue.
The Danube is characterized by a high number of hydrotechnical structures.
It causes possible transboundary impacts. The typical is case the Gabcikovo-
Nagymaros. The project was agreed in 1977 by Czechoslovakian and Hungarian
governments to eliminate flooding, provide clear water energy and create possible
navigation of the river as a part of Rhine-Main-Danube Canal. The plan was to divert
part of the river into artificial canal at Dunakiliti in Hungary to the hydroelectric power
plant near Gabcíkovo (now in Slovakia). Because of the protest in Hungary justified
by environmental problems and the problems to the water supply to Budapest.
This case was referred to the International Court of Justice in the Hague. Only the
part of the project – Gabcikovo Waterworks have been finished. In 1997 The Court
stated that the project agreement is still valid. The dispute is not solve.
In Serbia case according to the materials of the Regional Environmental Center for
Central and Eastern Europe, this country has plenty of freshwater, but distribution
varies across space and time. It is estimated that about 8 percent of all available
surface water originates within Serbia. The remainder comes from outside national
borders through the Danube, Sava, Tysa, Drina and other rivers.
Existing groundwater resources in Serbia amount to 244 m3 per capita per year.
Total abstraction is about 180 million cubic meters per year. The extraction of
groundwater exceeds the natural capacity of replenishment in certain aquifers,
leading to reduced levels of groundwater. Groundwater resources are of special
significance for Serbia, as they provide up to 90 percent of the water supply for
households and industry and about 70 percent of drinking water. In many areas of
Serbia, groundwater cannot be used for drinking purposes without prior treatment.
This is particularly true in certain areas close to the Morava and the Danube in the
Vojvodina Region.
Household surveys show that around 84 percent of the population in Serbia has
running water. According to the findings from the Public Health Institute of the
Republic of Serbia, 29 percent of samples from water supply systems did not satisfy
physical, chemical or bacteriological standards in 2001. The sewage system in
“Report on water resources and natural disasters (climate change) and flood risk mapping” ___________________________________________________________________________________________________________________________________________________________________________________________________
32 / 106
Serbia serves only about 33 percent of the country’s population, insufficient for
adequate protection of water quality. According to a 2003 World Bank report, sewage
systems serve 45 percent in urban areas of Vojvodina, 76% in the cities of central
Serbia and about 22% in rural areas of Serbia. Only 28 towns in Serbia have
municipal and industrial wastewater treatment plants. The water quality in Serbia is
generally low and is deteriorating. Examples of very clean water of Class I and I/II are
rare, and those that exist are found mainly in mountainous regions.
The Dniester in Ukraine is mainly polluted with ammonia, oil products, chromium,
copper, zinc and magnesia. The chromium and ammonia content is increasing.
Water quantity and water quality became as the limiting factors of usage of water
resources and sustainable development. With respect to the potential water
resources (1.6 km3 of water in a year per an inhabitant) Ukraine is one of the poorest
countries in Europe. The large volume of pollutants (oil products, sulphates,
chlorides, organic matter, pesticides, heavy metals and so on) have been thrown
down into the waters together with a sewage waters. The river inundations are one of
the most frequent hazards in Ukraine.
About 79% of the total population is connected to the centralized water supply
systems (house and yard connection). While coverage in urban areas in about
92.7%, coverage in rural areas reaches only 49.4%. Drinking water supply fails to
meet the standards of drinking water, which poses a major threat to the public health.
In 1997, about 260 settlements consumed water that did not meet the standards.
The situation in rural areas is worse. The smaller tributaries are more heavily polluted
than the main river. Waste-water treatment is a major problem in Ukraine. The major
problem in rural areas is that most waste water is discharged untreated. The urban
problem, however, is the poor quality and inefficiency of waste-water and sludge
treatment due to the technical state and capacity of existing installations.
“Report on water resources and natural disasters (climate change) and flood risk mapping” ___________________________________________________________________________________________________________________________________________________________________________________________________
33 / 106
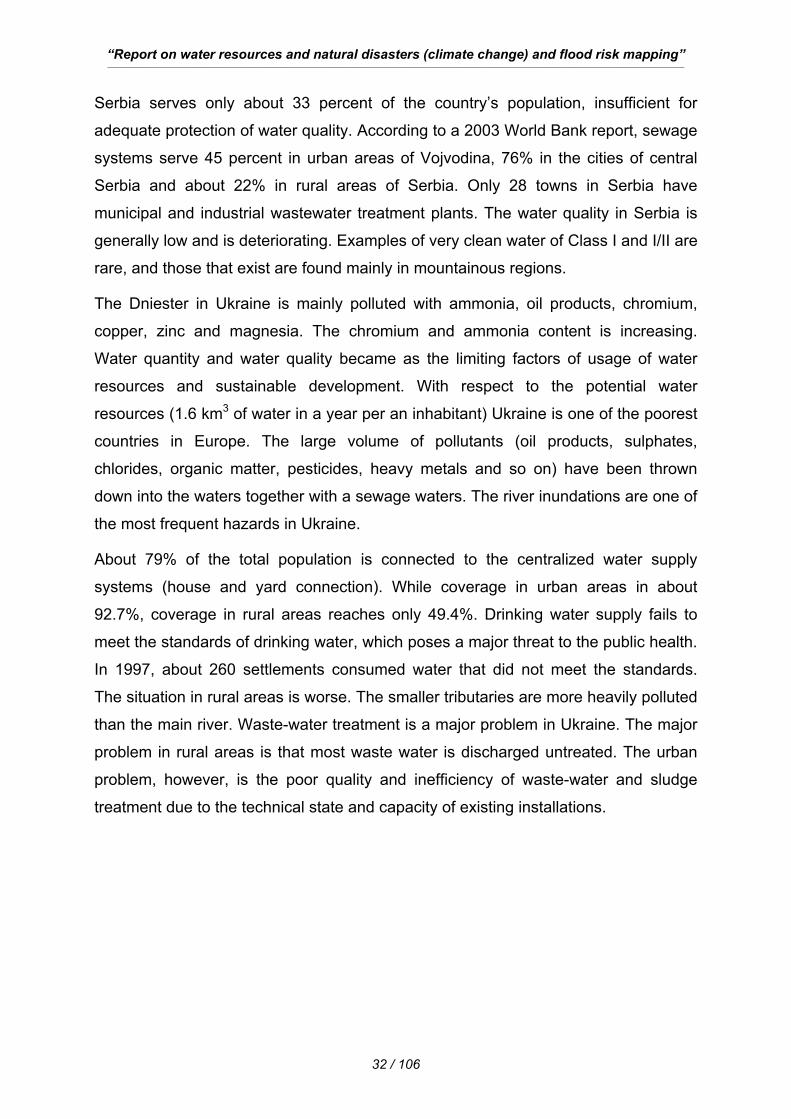
The Tysa - hydropower plant - photograph by Tomasz Walczykiewicz
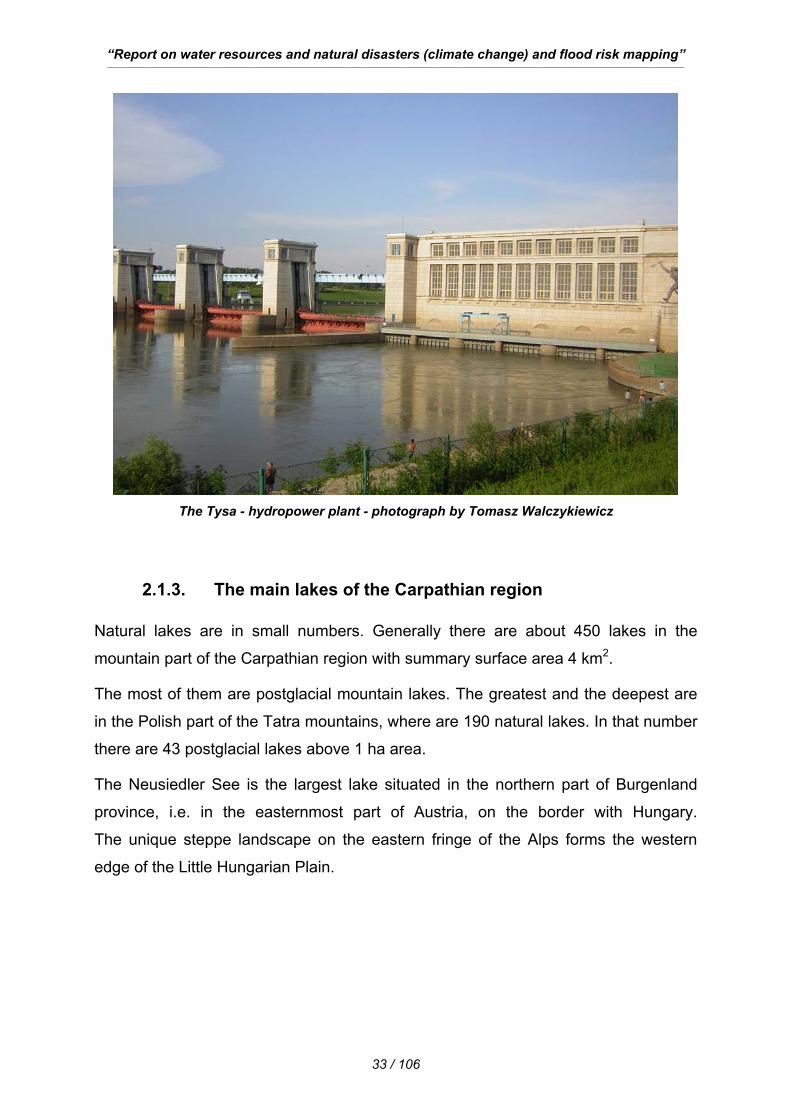
2.1.3. The main lakes of the Carpathian region Natural lakes are in small numbers. Generally there are about 450 lakes in the
mountain part of the Carpathian region with summary surface area 4 km2.
The most of them are postglacial mountain lakes. The greatest and the deepest are
in the Polish part of the Tatra mountains, where are 190 natural lakes. In that number
there are 43 postglacial lakes above 1 ha area.
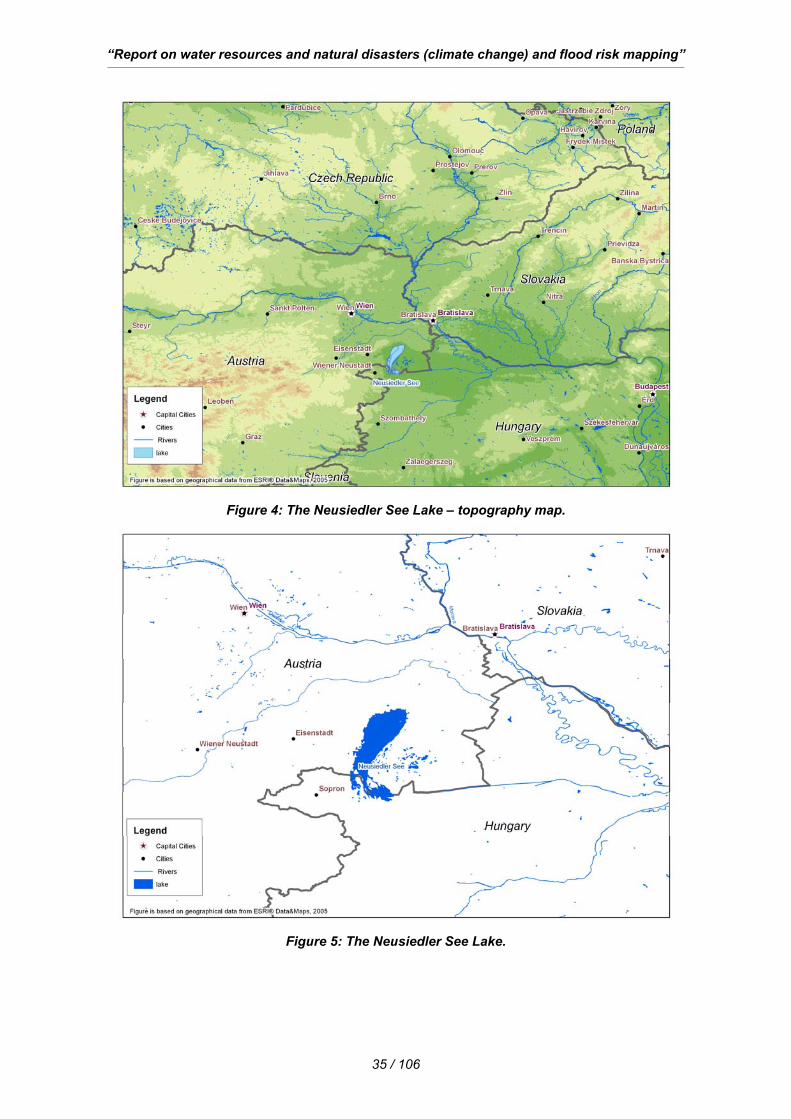
The Neusiedler See is the largest lake situated in the northern part of Burgenland
province, i.e. in the easternmost part of Austria, on the border with Hungary.
The unique steppe landscape on the eastern fringe of the Alps forms the western
edge of the Little Hungarian Plain.
“Report on water resources and natural disasters (climate change) and flood risk mapping” ___________________________________________________________________________________________________________________________________________________________________________________________________
34 / 106
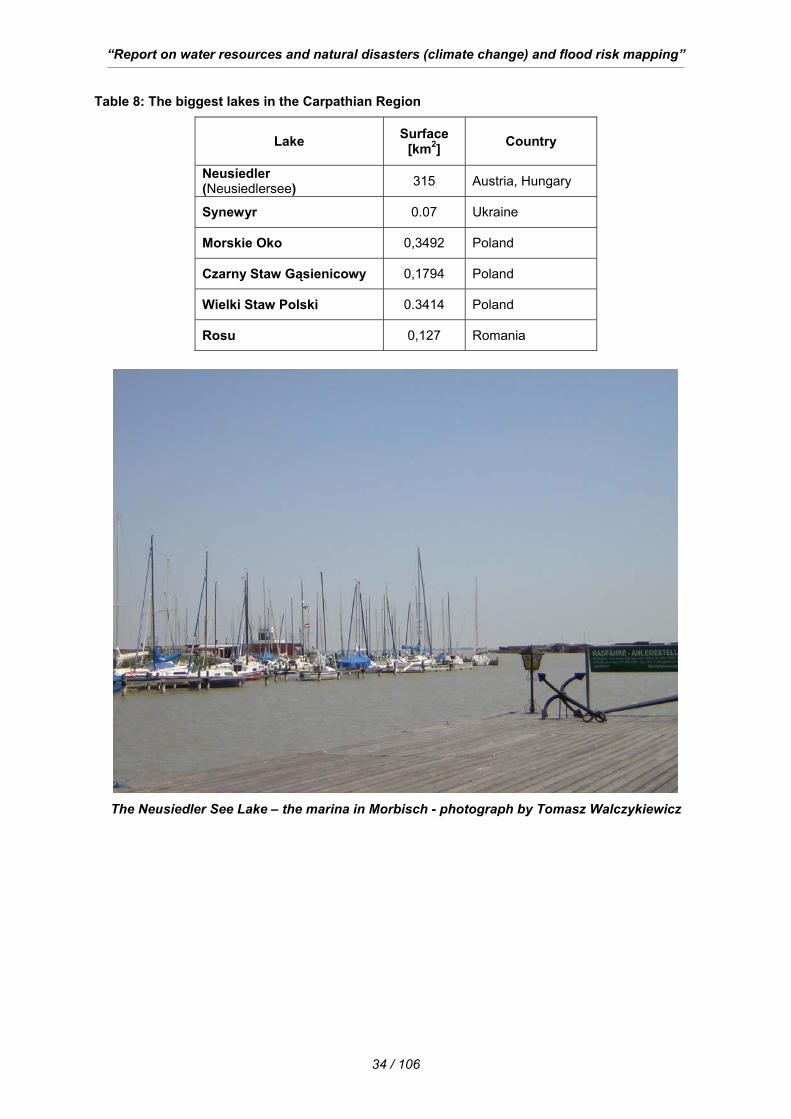
Table 8: The biggest lakes in the Carpathian Region
Lake Surface [km2] Country
Neusiedler (Neusiedlersee) 315 Austria, Hungary
Synewyr 0.07 Ukraine
Morskie Oko 0,3492 Poland
Czarny Staw Gąsienicowy 0,1794 Poland
Wielki Staw Polski 0.3414 Poland
Rosu 0,127 Romania
The Neusiedler See Lake – the marina in Morbisch - photograph by Tomasz Walczykiewicz
“Report on water resources and natural disasters (climate change) and flood risk mapping” ___________________________________________________________________________________________________________________________________________________________________________________________________
35 / 106
Figure 4: The Neusiedler See Lake – topography map.
Figure 5: The Neusiedler See Lake.
“Report on water resources and natural disasters (climate change) and flood risk mapping” ___________________________________________________________________________________________________________________________________________________________________________________________________
36 / 106
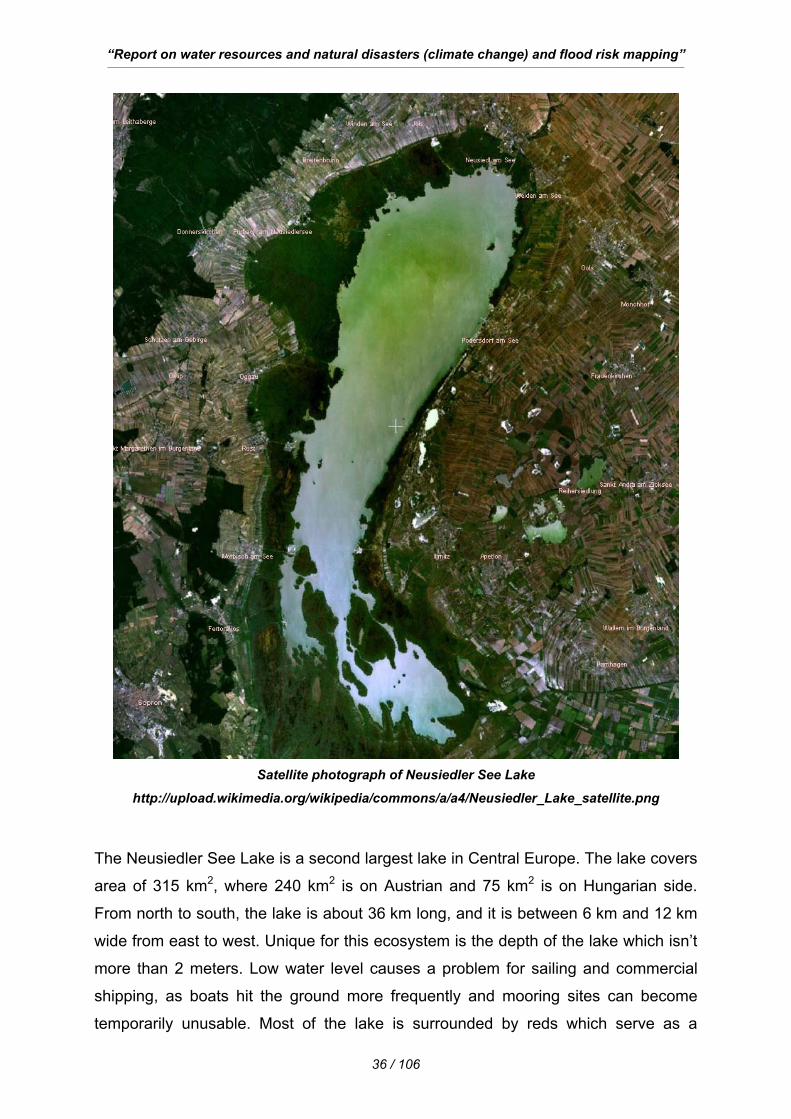
Satellite photograph of Neusiedler See Lake
http://upload.wikimedia.org/wikipedia/commons/a/a4/Neusiedler_Lake_satellite.png
The Neusiedler See Lake is a second largest lake in Central Europe. The lake covers
area of 315 km2, where 240 km2 is on Austrian and 75 km2 is on Hungarian side.
From north to south, the lake is about 36 km long, and it is between 6 km and 12 km
wide from east to west. Unique for this ecosystem is the depth of the lake which isn’t
more than 2 meters. Low water level causes a problem for sailing and commercial
shipping, as boats hit the ground more frequently and mooring sites can become
temporarily unusable. Most of the lake is surrounded by reds which serve as a
“Report on water resources and natural disasters (climate change) and flood risk mapping” ___________________________________________________________________________________________________________________________________________________________________________________________________
37 / 106
habitat for and are harvested in winter as soon as the ice is solid enough. The reed is
sold for various purposes, mostly related to construction and housing. Water quality
is determined by temperature, wind, the amount of salt and mud emanating with the
ground water from the sediments.
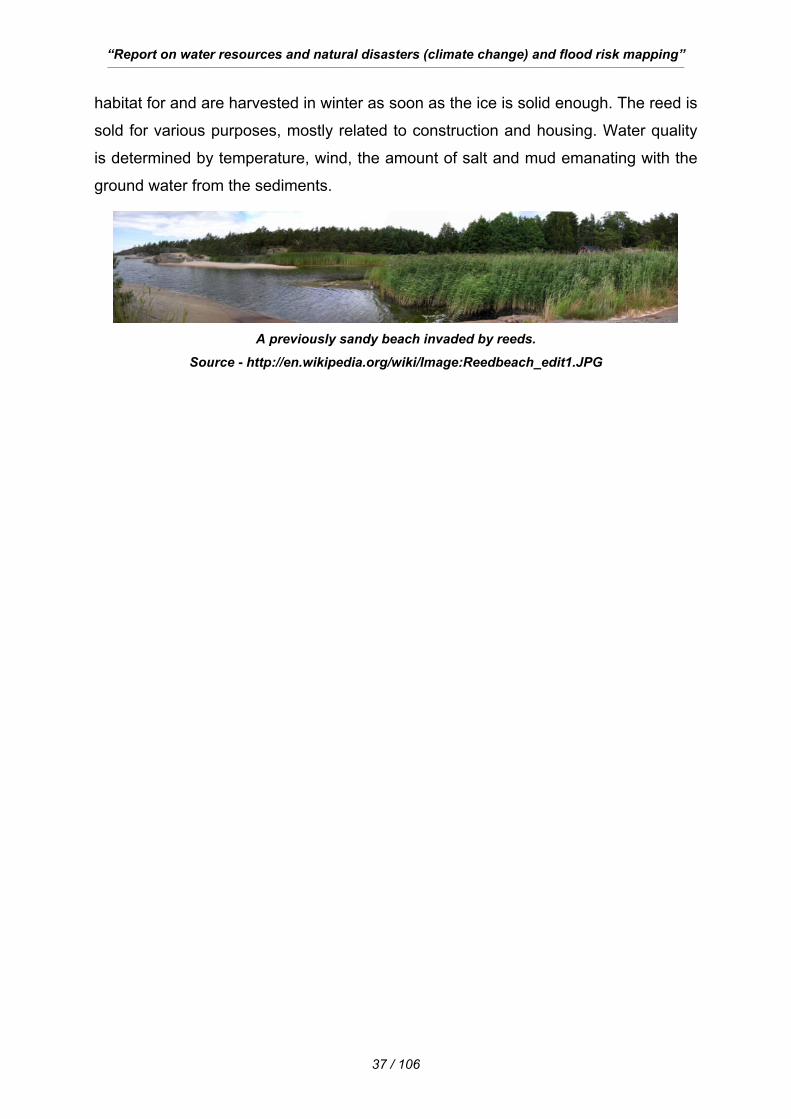
A previously sandy beach invaded by reeds.
Source - http://en.wikipedia.org/wiki/Image:Reedbeach_edit1.JPG
“Report on water resources and natural disasters (climate change) and flood risk mapping” ___________________________________________________________________________________________________________________________________________________________________________________________________
38 / 106
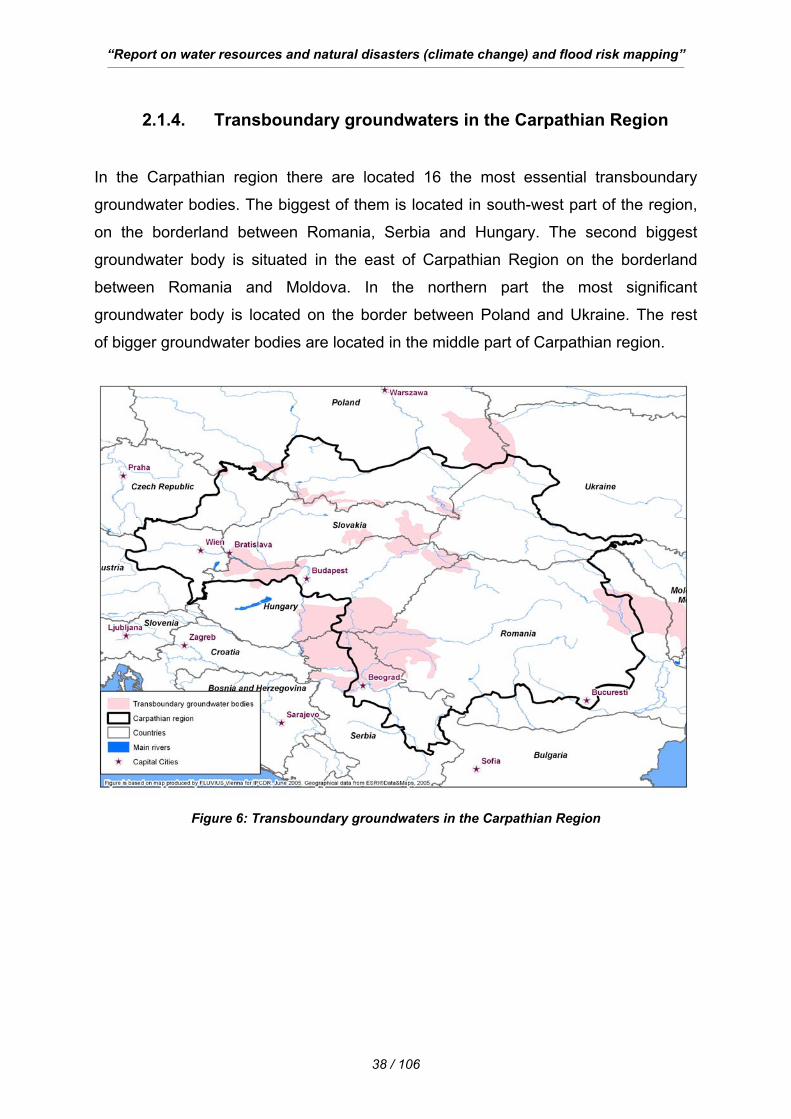
2.1.4. Transboundary groundwaters in the Carpathian Region
In the Carpathian region there are located 16 the most essential transboundary
groundwater bodies. The biggest of them is located in south-west part of the region,
on the borderland between Romania, Serbia and Hungary. The second biggest
groundwater body is situated in the east of Carpathian Region on the borderland
between Romania and Moldova. In the northern part the most significant
groundwater body is located on the border between Poland and Ukraine. The rest
of bigger groundwater bodies are located in the middle part of Carpathian region.
Figure 6: Transboundary groundwaters in the Carpathian Region
“Report on water resources and natural disasters (climate change) and flood risk mapping” ___________________________________________________________________________________________________________________________________________________________________________________________________
39 / 106
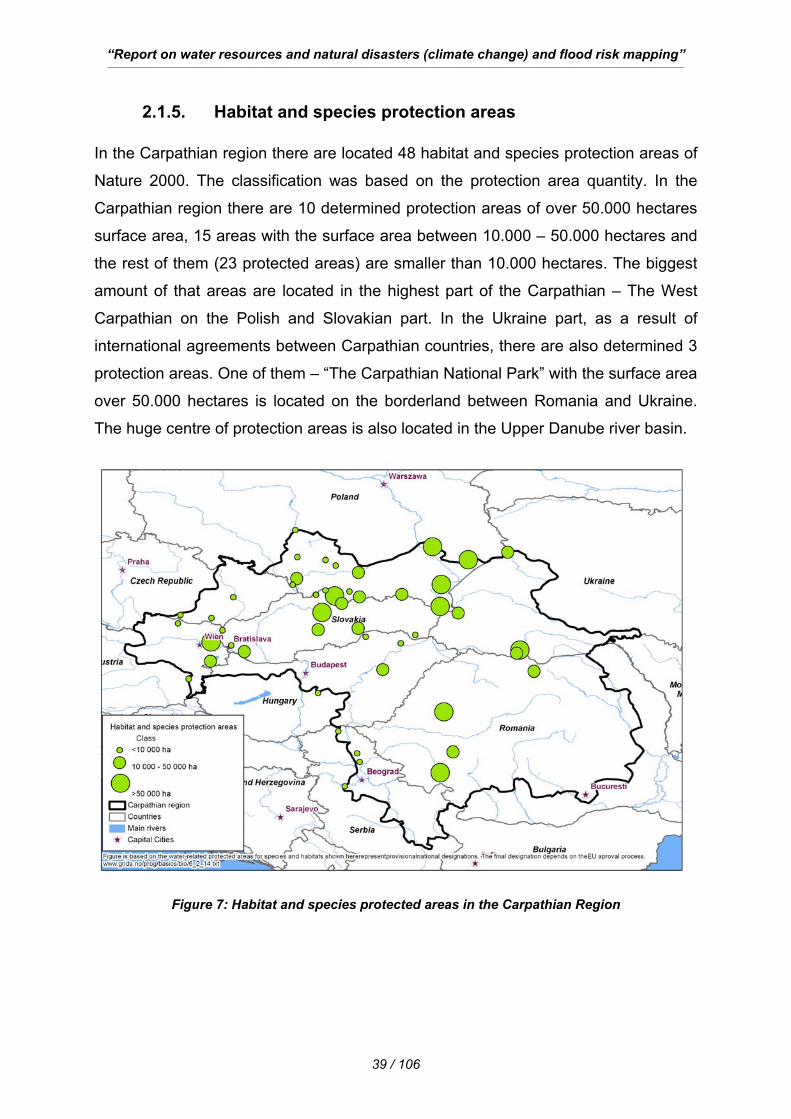
2.1.5. Habitat and species protection areas In the Carpathian region there are located 48 habitat and species protection areas of
Nature 2000. The classification was based on the protection area quantity. In the
Carpathian region there are 10 determined protection areas of over 50.000 hectares
surface area, 15 areas with the surface area between 10.000 – 50.000 hectares and
the rest of them (23 protected areas) are smaller than 10.000 hectares. The biggest
amount of that areas are located in the highest part of the Carpathian – The West
Carpathian on the Polish and Slovakian part. In the Ukraine part, as a result of
international agreements between Carpathian countries, there are also determined 3
protection areas. One of them – “The Carpathian National Park” with the surface area
over 50.000 hectares is located on the borderland between Romania and Ukraine.
The huge centre of protection areas is also located in the Upper Danube river basin.
Figure 7: Habitat and species protected areas in the Carpathian Region
“Report on water resources and natural disasters (climate change) and flood risk mapping” ___________________________________________________________________________________________________________________________________________________________________________________________________
40 / 106
2.2. The water “reservoir” Carpathians - water tower for surrounding areas
The Carpathian Mountains are the eastern wing of the great Central Mountain
System of Europe, curving 1500 km along the borders of Austria, the Czech
Republic, Slovakia, Poland, Ukraine, Romania, Serbia and northern Hungary.
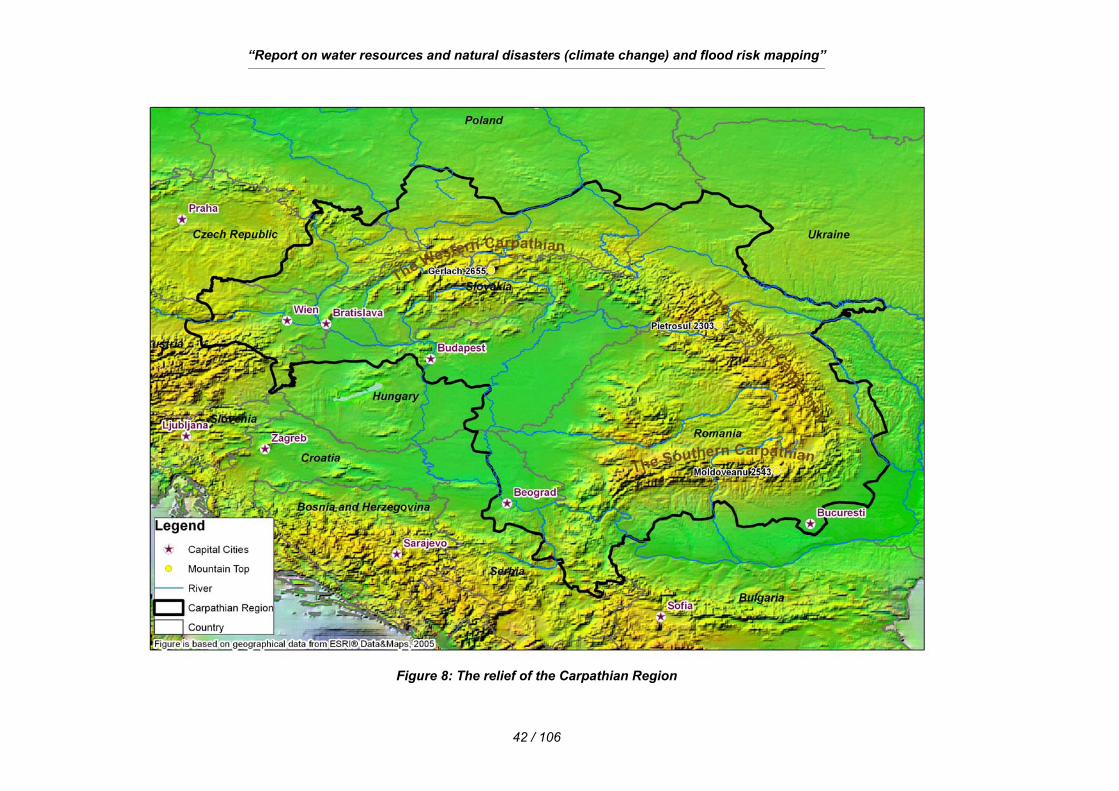
The Carpathian Mountains are divided in three ranges: Western Carpathians
(Western and Eastern Beskidy with the highest “Gerlach Mountain”, 2655 meters
above sea level, in High Tatras), Eastern Carpathians (with the highest “Pietrosul
Mountain” 2303 meters above sea level) and Southern Carpathians (with the highest
“Moldoveanu Mountain” 2543 meters above sea level. The Carpathians are also the
boundary for “Great Hungarian Plain” occupying the middle part of the mountains – in
the Tysa valley.
Romania contains by far the largest area of the Carpathians, and forms the eastern
and southern boundaries of the region. Large extension from west to east and
diverse relief, the Carpathians also shows great differences in climate.
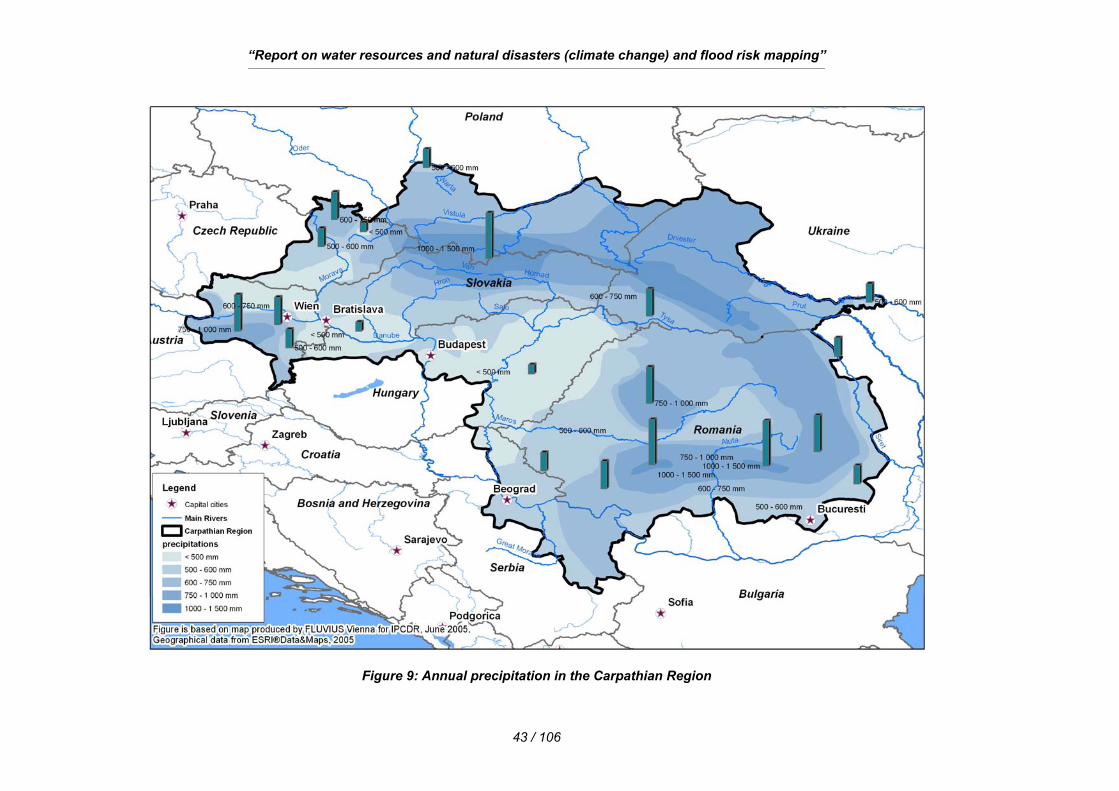
The precipitation in whole region of the Carpathians ranges from < 500 mm to > 2000
mm based on differences in the of the relief, especially the differences in the extent
of exposure to the predominantly westerly winds, as well as the differences in
altitude. The shape of the Carpathian arc as well as the distribution of the
precipitation has strong effects on the surface run-off and the discharge in the
streams. The hydrologic regime of the Carpathian rivers, in particular the discharge
regime, is distinctly influenced by the regional precipitation patterns.
The water resources in the Carpathian region show a large variability in terms of
groundwater quantity. Within that region exist a large number of transboundary
aquifers.
The wetlands in the Carpathians also represent valuable drinking water reserves for
millions of people.
For these reasons we can define the Carpathians as a water tower for the whole region.
“Report on water resources and natural disasters (climate change) and flood risk mapping” ___________________________________________________________________________________________________________________________________________________________________________________________________
41 / 106
The main Carpathian rivers which form these conditions are listed below:
• The Tysa
• The Morava
• The Velika Morava in Serbia
• The Prut
• The Vah is the left tributary of the Danube
• The Dniester
• The Vistula
• The San
• The Dunajec
The characteristics linked with the water “Reservoir” Carpathians are shown in the
figures below.
“Report on water resources and natural disasters (climate change) and flood risk mapping” ___________________________________________________________________________________________________________________________________________________________________________________________________
42 / 106
Figure 8: The relief of the Carpathian Region
“Report on water resources and natural disasters (climate change) and flood risk mapping” ___________________________________________________________________________________________________________________________________________________________________________________________________
43 / 106
Figure 9: Annual precipitation in the Carpathian Region
“Report on water resources and natural disasters (climate change) and flood risk mapping” ___________________________________________________________________________________________________________________________________________________________________________________________________
44 / 106
Figure 10: Flow direction of main rivers in Carpathian Region: The Carpathians - water tower for surrounding areas
“Report on water resources and natural disasters (climate change) and flood risk mapping” ___________________________________________________________________________________________________________________________________________________________________________________________________
45 / 106
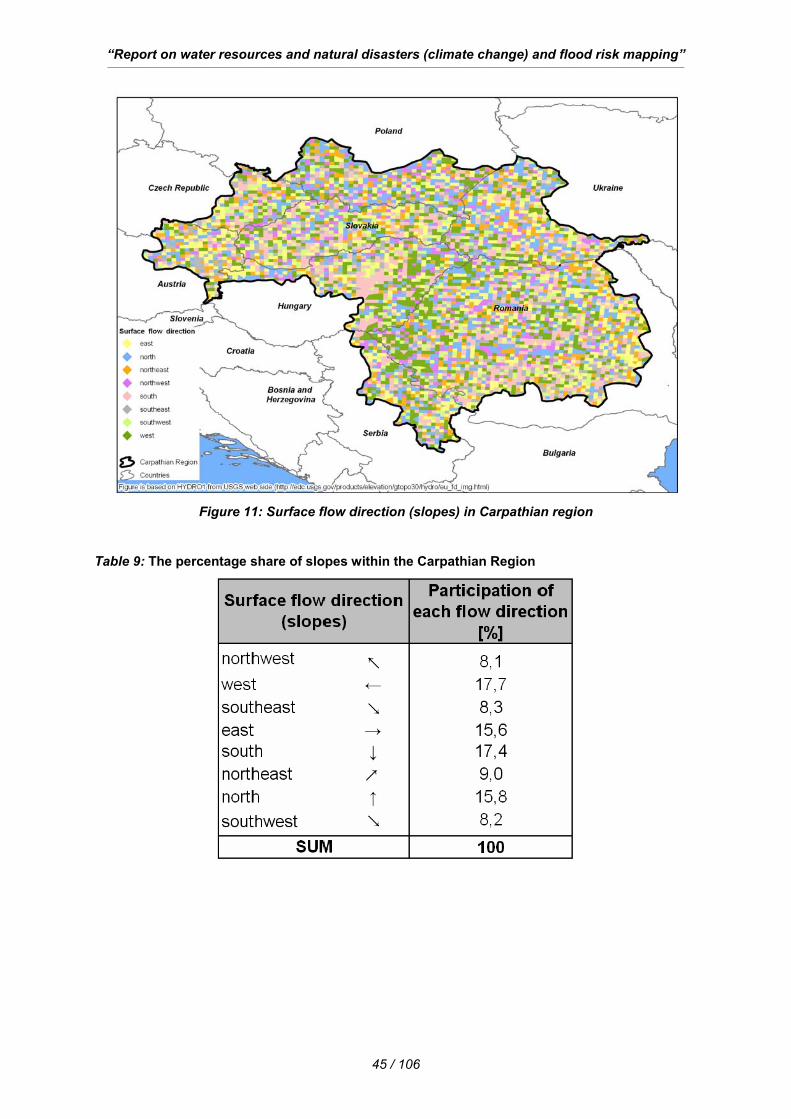
Figure 11: Surface flow direction (slopes) in Carpathian region
Table 9: The percentage share of slopes within the Carpathian Region
“Report on water resources and natural disasters (climate change) and flood risk mapping” ___________________________________________________________________________________________________________________________________________________________________________________________________
46 / 106
2.3. Background data
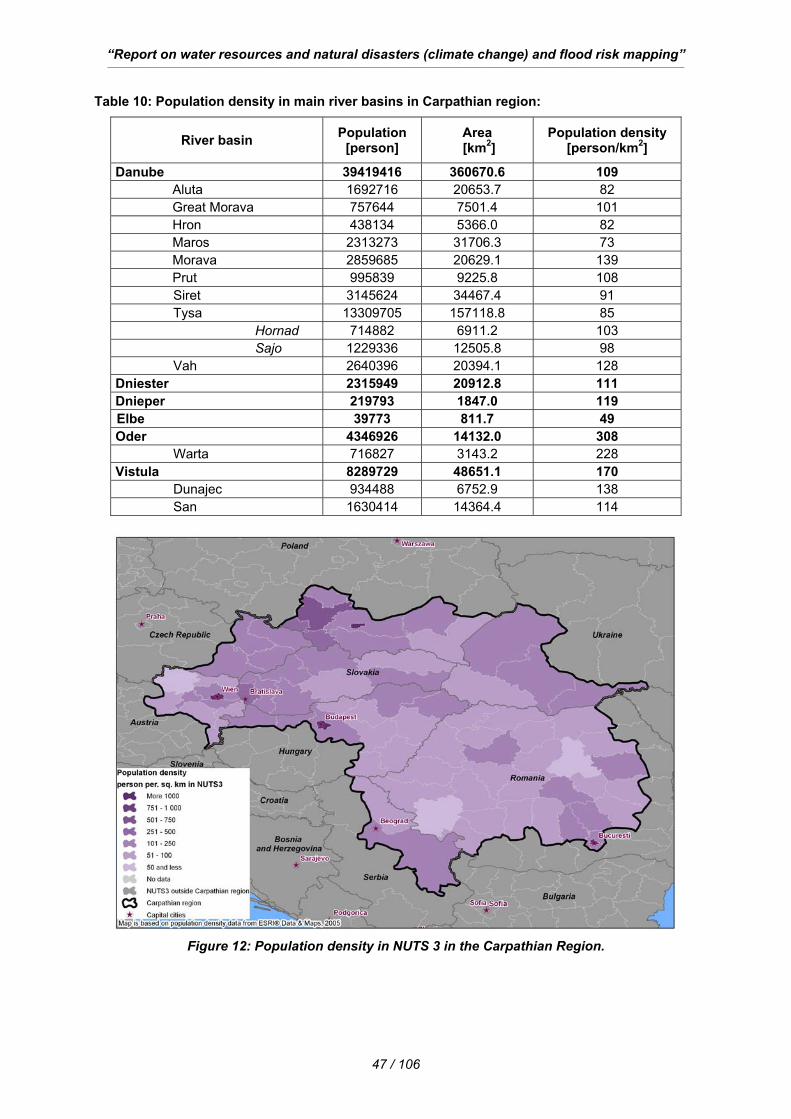
2.3.1. Inhabitants The analysis of population density is based on data from ESRI® Data & Maps, 2005.
Original data were concerned NUTS3 – third level of Nomenclature of Units for
Territorial Statistics.
In the Carpathian Region population density is about 120 person per sq. km, so in
the whole area live about 55 million people. But population is bigger in and around
big cities (Cracow – more than 750 thousand people, Vienna – more than 1,5 million
people, Budapest – about 1,7 million people, Bucuresti – about 2 million people) and
in agglomerations like Silesia in Poland (about 3 million people).
Definitely bigger population density is in the northern Carpathian region (besides
west part in Austria), than in central and southern parts of examine region (Figure
12).
In the region we can notice that almost in all river catchments population density is
contained between 109 (the Danube) and 170 (the Vistula) person per square
kilometer. In Oder catchment population is the biggest – 308 person/km2 because of
Silesia region. Very small population density equals 49 is in small part of Elbe
catchment (Figure 13).
In analysis based on particular river basins small population density is in Danube
tributaries - Siret, Aluta, Maros, Tysa, Hron – less than 100 person/km2, definitely
bigger is in the Danube and it’s rest tributaries and another river basins – between
101 and 170 person/km2. The list of total population and population density in river
basins in the Carpathian Region is contained in table below and Figure 14.
“Report on water resources and natural disasters (climate change) and flood risk mapping” ___________________________________________________________________________________________________________________________________________________________________________________________________
47 / 106
Table 10: Population density in main river basins in Carpathian region:
River basin Population [person]
Area [km2]
Population density [person/km2]
Danube 39419416 360670.6 109 Aluta 1692716 20653.7 82 Great Morava 757644 7501.4 101 Hron 438134 5366.0 82 Maros 2313273 31706.3 73 Morava 2859685 20629.1 139 Prut 995839 9225.8 108 Siret 3145624 34467.4 91 Tysa 13309705 157118.8 85
Hornad 714882 6911.2 103 Sajo 1229336 12505.8 98
Vah 2640396 20394.1 128 Dniester 2315949 20912.8 111 Dnieper 219793 1847.0 119 Elbe 39773 811.7 49 Oder 4346926 14132.0 308
Warta 716827 3143.2 228 Vistula 8289729 48651.1 170
Dunajec 934488 6752.9 138 San 1630414 14364.4 114
Figure 12: Population density in NUTS 3 in the Carpathian Region.
“Report on water resources and natural disasters (climate change) and flood risk mapping” ___________________________________________________________________________________________________________________________________________________________________________________________________
48 / 106
Figure 13: Population density in river catchments in the Carpathian Region.
Figure 14: Population density in main river basins in the Carpathian Region.
“Report on water resources and natural disasters (climate change) and flood risk mapping” ___________________________________________________________________________________________________________________________________________________________________________________________________
49 / 106
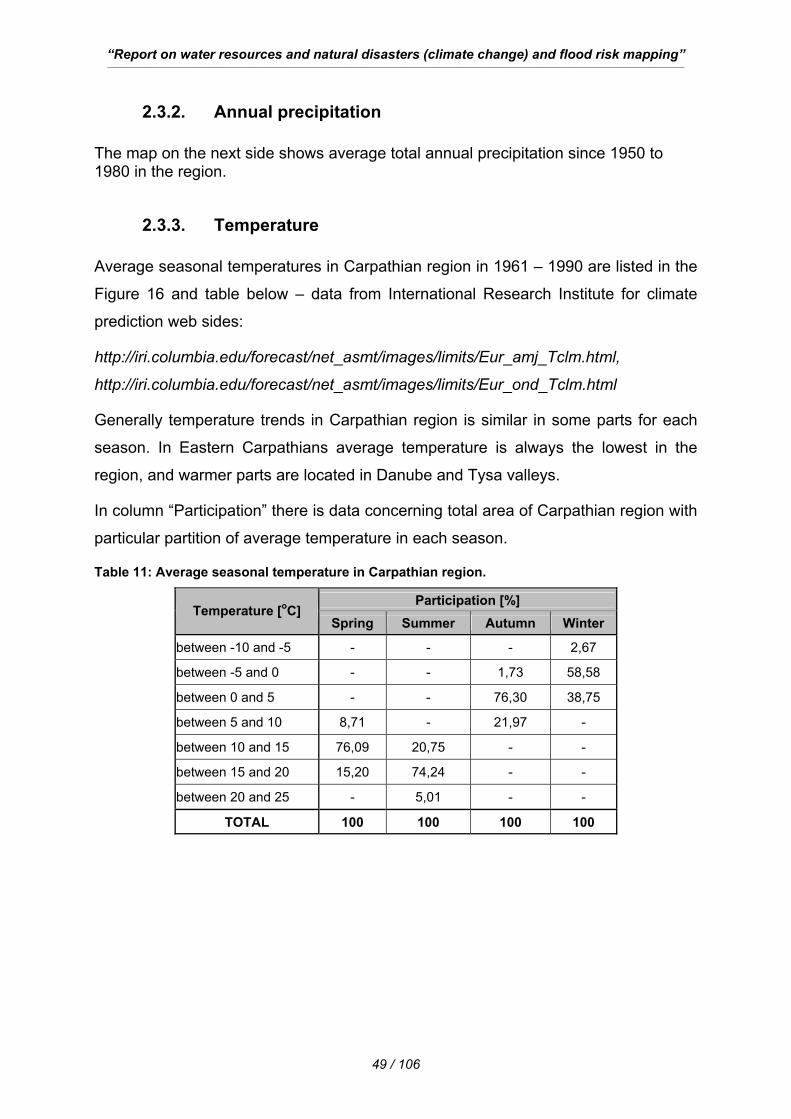
2.3.2. Annual precipitation The map on the next side shows average total annual precipitation since 1950 to 1980 in the region.
2.3.3. Temperature Average seasonal temperatures in Carpathian region in 1961 – 1990 are listed in the
Figure 16 and table below – data from International Research Institute for climate
prediction web sides:
http://iri.columbia.edu/forecast/net_asmt/images/limits/Eur_amj_Tclm.html,
http://iri.columbia.edu/forecast/net_asmt/images/limits/Eur_ond_Tclm.html
Generally temperature trends in Carpathian region is similar in some parts for each
season. In Eastern Carpathians average temperature is always the lowest in the
region, and warmer parts are located in Danube and Tysa valleys.
In column “Participation” there is data concerning total area of Carpathian region with
particular partition of average temperature in each season.
Table 11: Average seasonal temperature in Carpathian region.
Participation [%] Temperature [oC]
Spring Summer Autumn Winter
between -10 and -5 - - - 2,67
between -5 and 0 - - 1,73 58,58
between 0 and 5 - - 76,30 38,75
between 5 and 10 8,71 - 21,97 -
between 10 and 15 76,09 20,75 - -
between 15 and 20 15,20 74,24 - -
between 20 and 25 - 5,01 - -
TOTAL 100 100 100 100
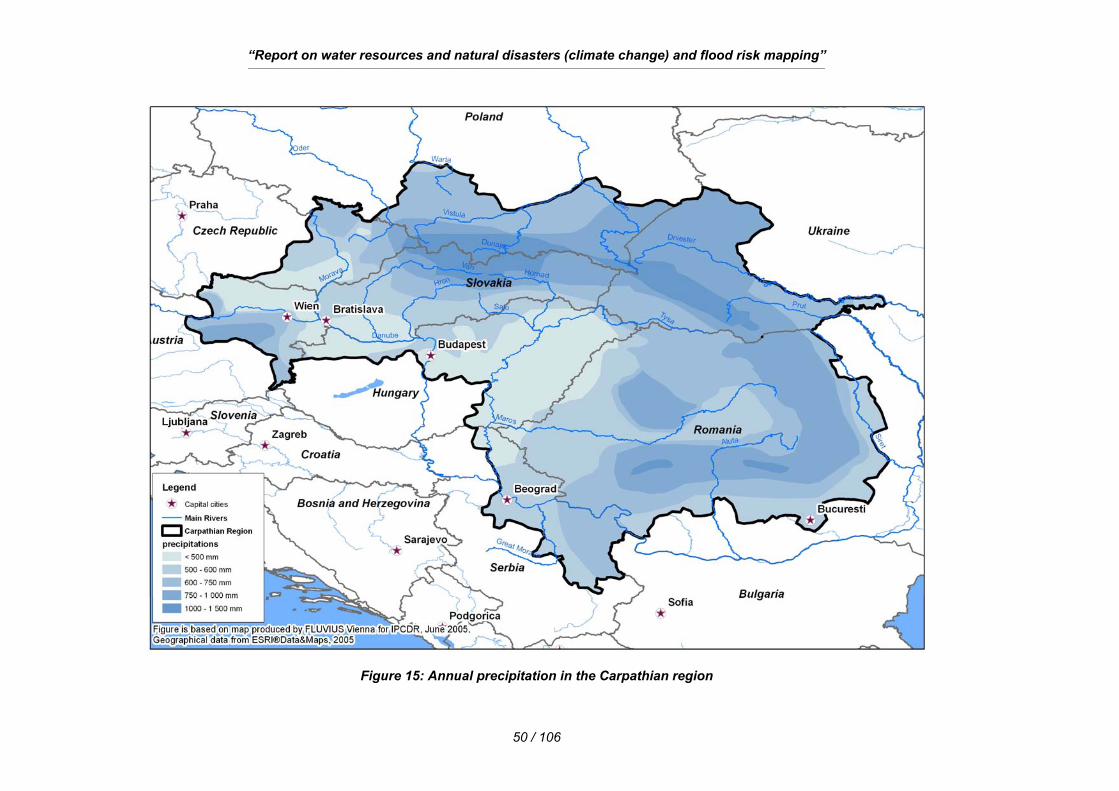
“Report on water resources and natural disasters (climate change) and flood risk mapping” ___________________________________________________________________________________________________________________________________________________________________________________________________
50 / 106
Figure 15: Annual precipitation in the Carpathian region
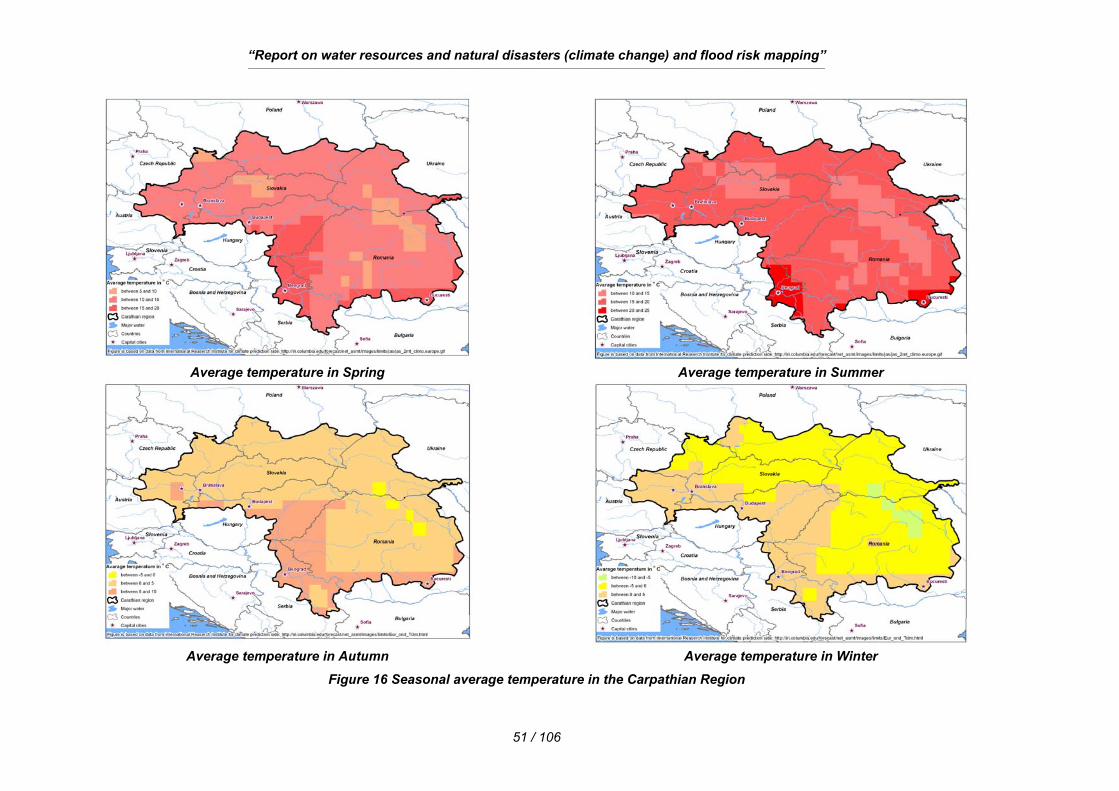
“Report on water resources and natural disasters (climate change) and flood risk mapping” ___________________________________________________________________________________________________________________________________________________________________________________________________
51 / 106
Average temperature in Spring Average temperature in Summer
Average temperature in Autumn Average temperature in Winter
Figure 16 Seasonal average temperature in the Carpathian Region
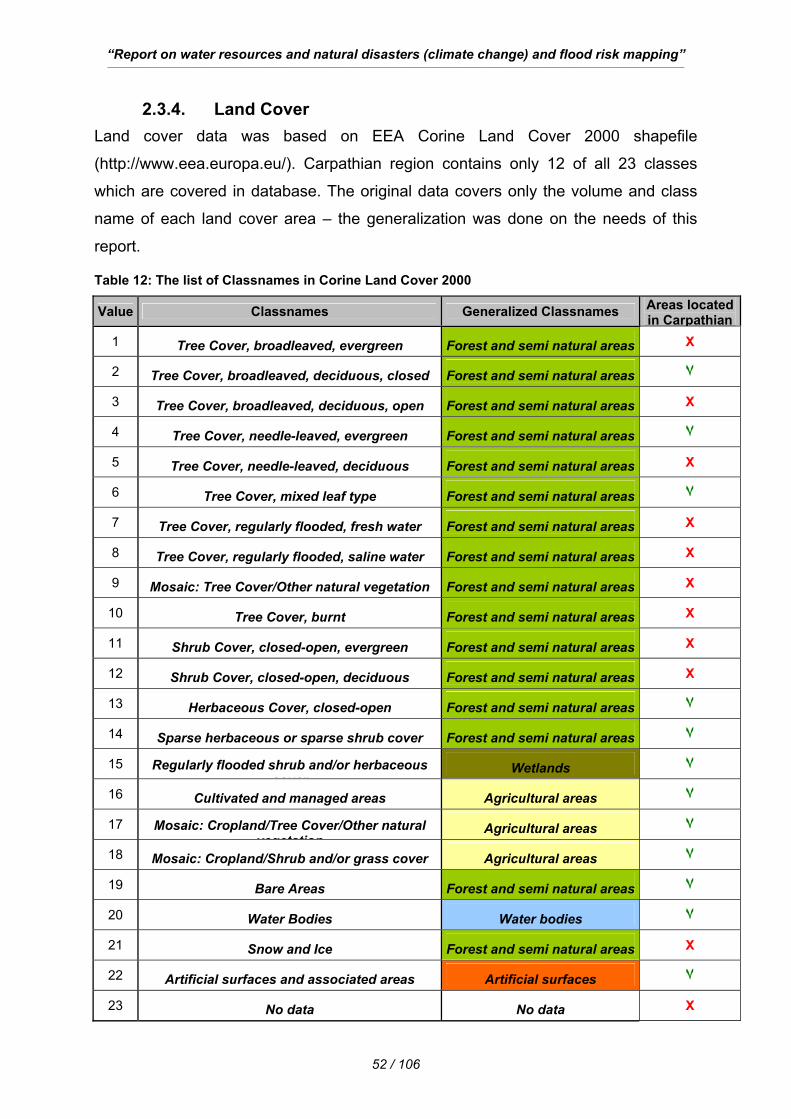
“Report on water resources and natural disasters (climate change) and flood risk mapping” ___________________________________________________________________________________________________________________________________________________________________________________________________
52 / 106
2.3.4. Land Cover Land cover data was based on EEA Corine Land Cover 2000 shapefile
(http://www.eea.europa.eu/). Carpathian region contains only 12 of all 23 classes
which are covered in database. The original data covers only the volume and class
name of each land cover area – the generalization was done on the needs of this
report.
Table 12: The list of Classnames in Corine Land Cover 2000
Value Classnames Generalized Classnames Areas located in Carpathian
1 Tree Cover, broadleaved, evergreen Forest and semi natural areas X
2 Tree Cover, broadleaved, deciduous, closed Forest and semi natural areas ٧ 3 Tree Cover, broadleaved, deciduous, open Forest and semi natural areas X
4 Tree Cover, needle-leaved, evergreen Forest and semi natural areas ٧ 5 Tree Cover, needle-leaved, deciduous Forest and semi natural areas X
6 Tree Cover, mixed leaf type Forest and semi natural areas ٧ 7 Tree Cover, regularly flooded, fresh water Forest and semi natural areas X
8 Tree Cover, regularly flooded, saline water Forest and semi natural areas X
9 Mosaic: Tree Cover/Other natural vegetation Forest and semi natural areas X
10 Tree Cover, burnt Forest and semi natural areas X
11 Shrub Cover, closed-open, evergreen Forest and semi natural areas X
12 Shrub Cover, closed-open, deciduous Forest and semi natural areas X
13 Herbaceous Cover, closed-open Forest and semi natural areas ٧ 14 Sparse herbaceous or sparse shrub cover Forest and semi natural areas ٧ 15 Regularly flooded shrub and/or herbaceous
coverWetlands ٧
16 Cultivated and managed areas Agricultural areas ٧ 17 Mosaic: Cropland/Tree Cover/Other natural
vegetationAgricultural areas ٧
18 Mosaic: Cropland/Shrub and/or grass cover Agricultural areas ٧ 19 Bare Areas Forest and semi natural areas ٧ 20 Water Bodies Water bodies ٧ 21 Snow and Ice Forest and semi natural areas X
22 Artificial surfaces and associated areas Artificial surfaces ٧
23 No data No data X
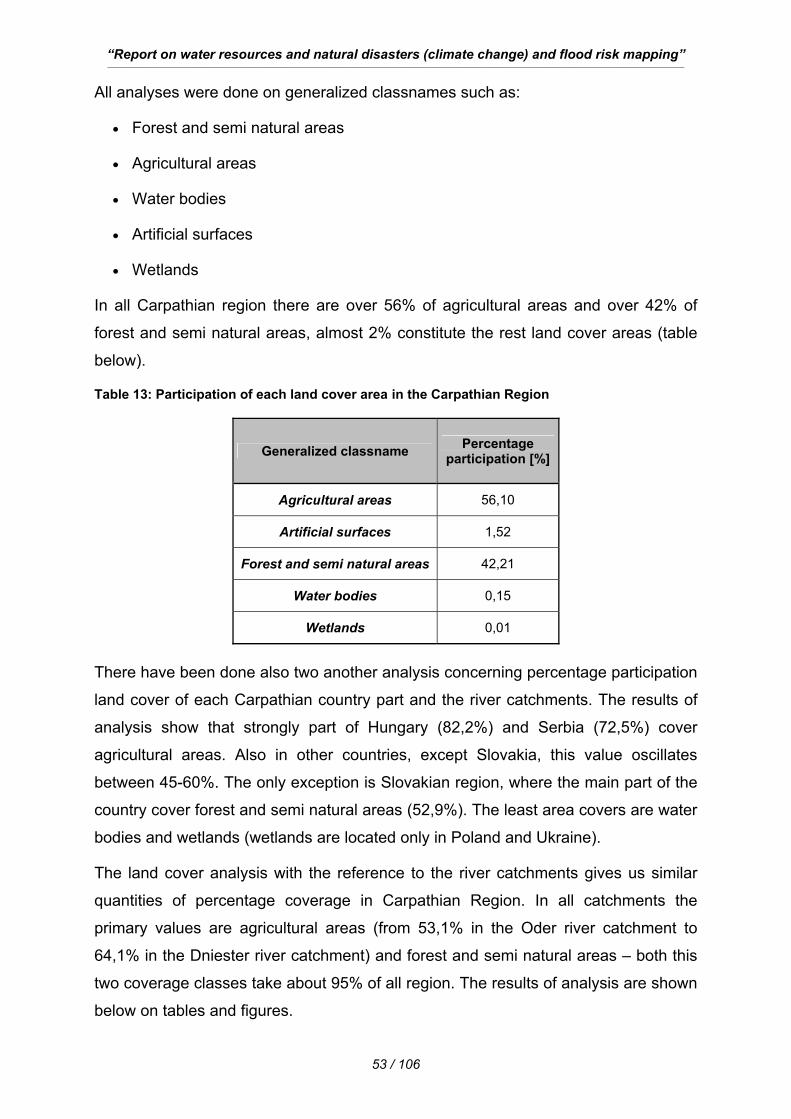
“Report on water resources and natural disasters (climate change) and flood risk mapping” ___________________________________________________________________________________________________________________________________________________________________________________________________
53 / 106
All analyses were done on generalized classnames such as:
• Forest and semi natural areas
• Agricultural areas
• Water bodies
• Artificial surfaces
• Wetlands
In all Carpathian region there are over 56% of agricultural areas and over 42% of
forest and semi natural areas, almost 2% constitute the rest land cover areas (table
below).
Table 13: Participation of each land cover area in the Carpathian Region
Generalized classname Percentage participation [%]
Agricultural areas 56,10
Artificial surfaces 1,52
Forest and semi natural areas 42,21
Water bodies 0,15
Wetlands 0,01
There have been done also two another analysis concerning percentage participation
land cover of each Carpathian country part and the river catchments. The results of
analysis show that strongly part of Hungary (82,2%) and Serbia (72,5%) cover
agricultural areas. Also in other countries, except Slovakia, this value oscillates
between 45-60%. The only exception is Slovakian region, where the main part of the
country cover forest and semi natural areas (52,9%). The least area covers are water
bodies and wetlands (wetlands are located only in Poland and Ukraine).
The land cover analysis with the reference to the river catchments gives us similar
quantities of percentage coverage in Carpathian Region. In all catchments the
primary values are agricultural areas (from 53,1% in the Oder river catchment to
64,1% in the Dniester river catchment) and forest and semi natural areas – both this
two coverage classes take about 95% of all region. The results of analysis are shown
below on tables and figures.
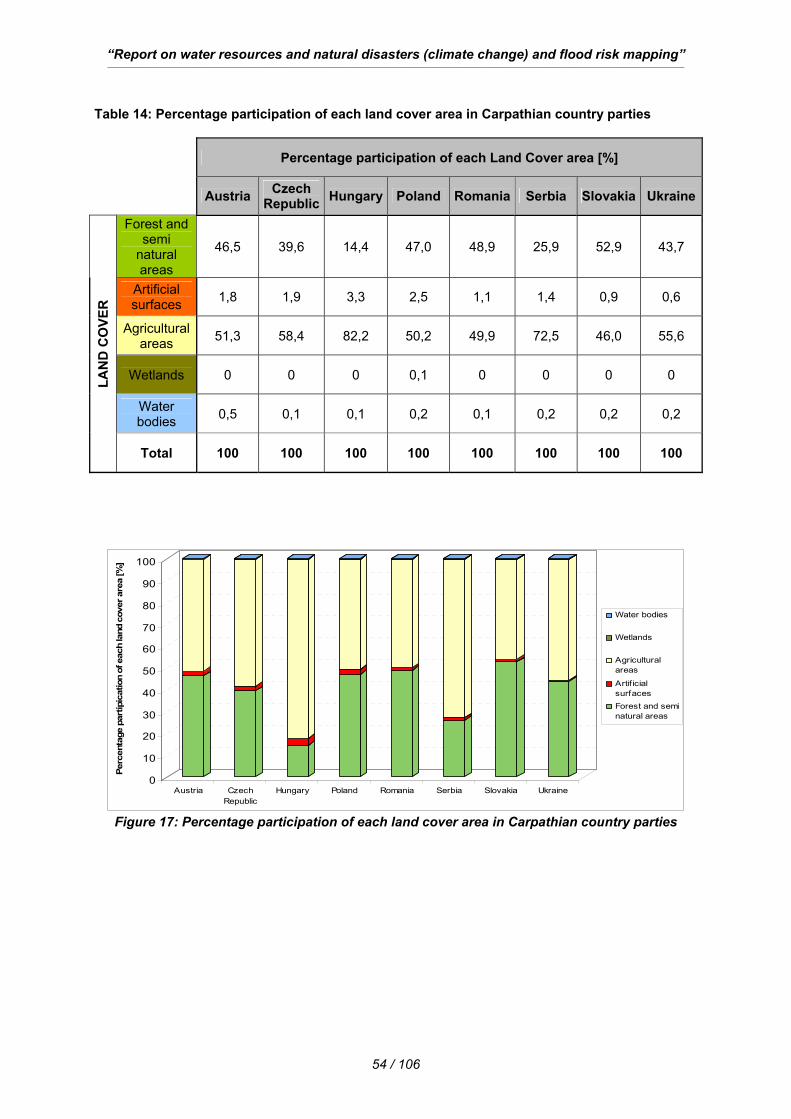
“Report on water resources and natural disasters (climate change) and flood risk mapping” ___________________________________________________________________________________________________________________________________________________________________________________________________
54 / 106
Table 14: Percentage participation of each land cover area in Carpathian country parties
Percentage participation of each Land Cover area [%]
Austria Czech Republic Hungary Poland Romania Serbia Slovakia Ukraine
Forest and semi
natural areas
46,5 39,6 14,4 47,0 48,9 25,9 52,9 43,7
Artificial surfaces 1,8 1,9 3,3 2,5 1,1 1,4 0,9 0,6
Agricultural areas 51,3 58,4 82,2 50,2 49,9 72,5 46,0 55,6
Wetlands 0 0 0 0,1 0 0 0 0
Water bodies 0,5 0,1 0,1 0,2 0,1 0,2 0,2 0,2
LAN
D C
OVE
R
Total 100 100 100 100 100 100 100 100
0
10
20
30
40
50
60
70
80
90
100
Perc
enta
ge p
artip
icat
ion
of e
ach
land
cov
er a
rea
[%]
Austria CzechRepublic
Hungary Poland Romania Serbia Slovakia Ukraine
Water bodies
Wetlands
Agriculturalareas
Artif icialsurfacesForest and seminatural areas
Figure 17: Percentage participation of each land cover area in Carpathian country parties
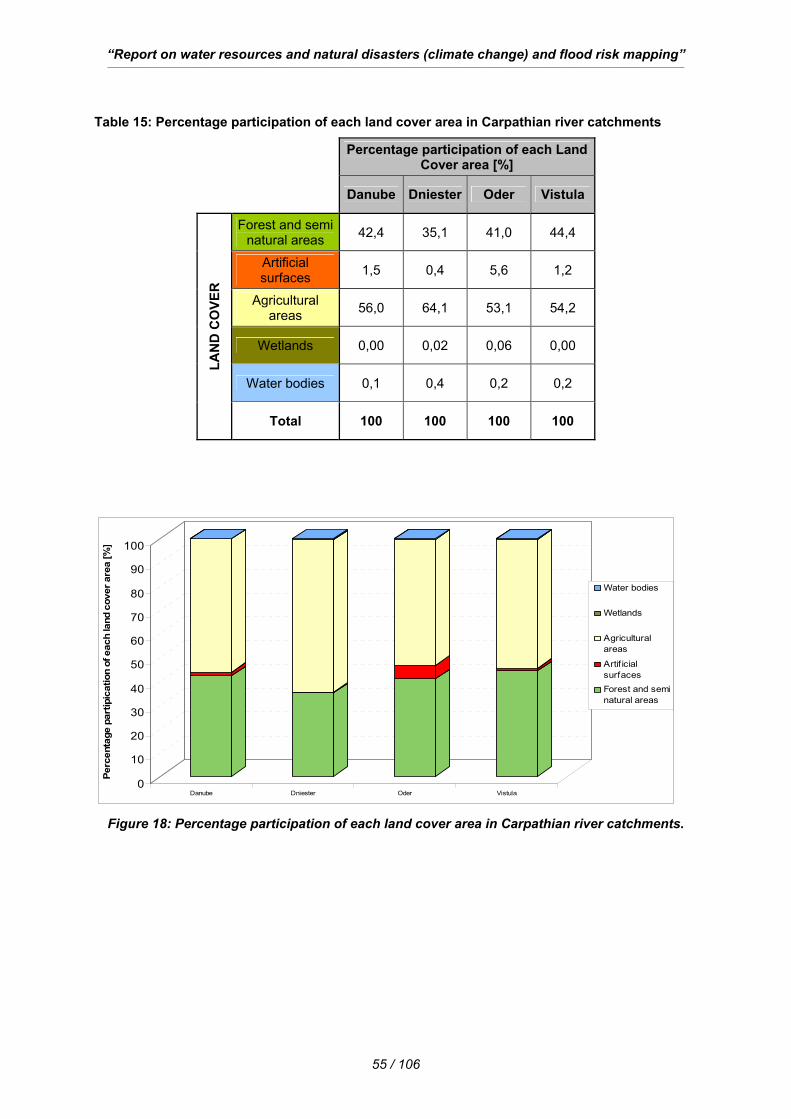
“Report on water resources and natural disasters (climate change) and flood risk mapping” ___________________________________________________________________________________________________________________________________________________________________________________________________
55 / 106
Table 15: Percentage participation of each land cover area in Carpathian river catchments
Percentage participation of each Land
Cover area [%]
Danube Dniester Oder Vistula
Forest and semi natural areas 42,4 35,1 41,0 44,4
Artificial surfaces 1,5 0,4 5,6 1,2
Agricultural areas 56,0 64,1 53,1 54,2
Wetlands 0,00 0,02 0,06 0,00
Water bodies 0,1 0,4 0,2 0,2
LAN
D C
OVE
R
Total 100 100 100 100
0
10
20
30
40
50
60
70
80
90
100
Perc
enta
ge p
artip
icat
ion
of e
ach
land
cov
er a
rea
[%]
Danube Dniester Oder Vistula
Water bodies
Wetlands
Agriculturalareas
Artif icialsurfacesForest and seminatural areas
Figure 18: Percentage participation of each land cover area in Carpathian river catchments.
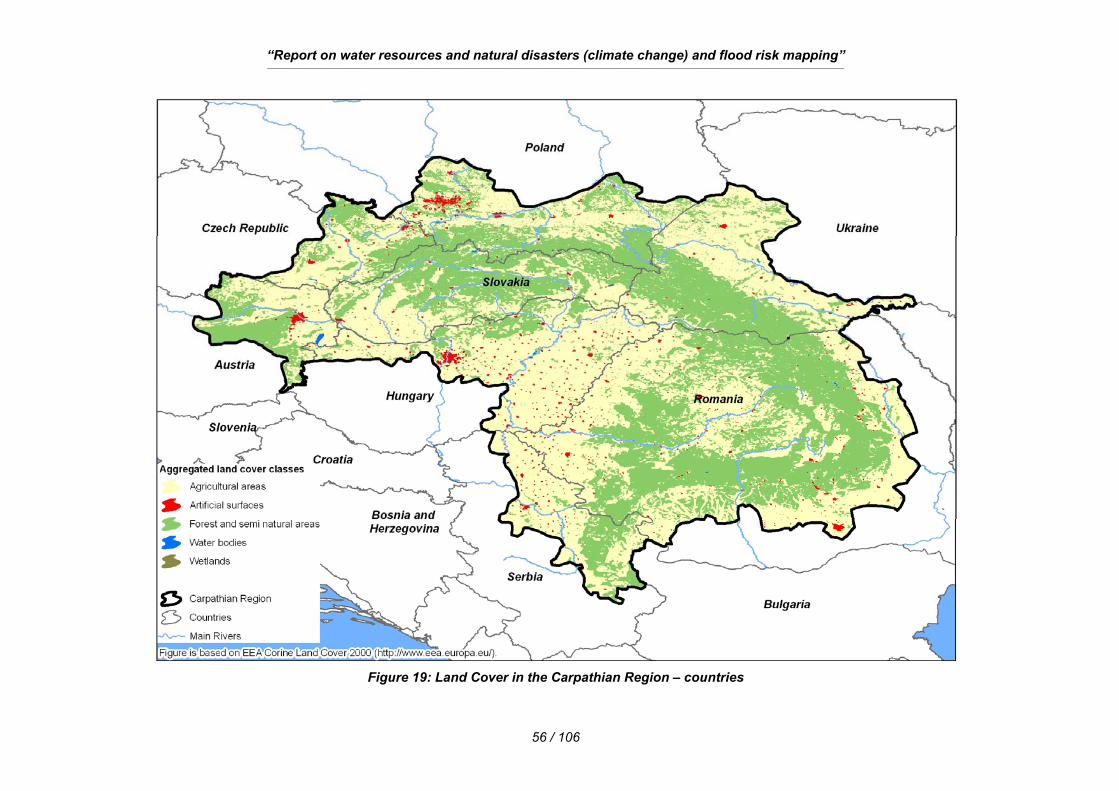
“Report on water resources and natural disasters (climate change) and flood risk mapping” ___________________________________________________________________________________________________________________________________________________________________________________________________
56 / 106
Figure 19: Land Cover in the Carpathian Region – countries
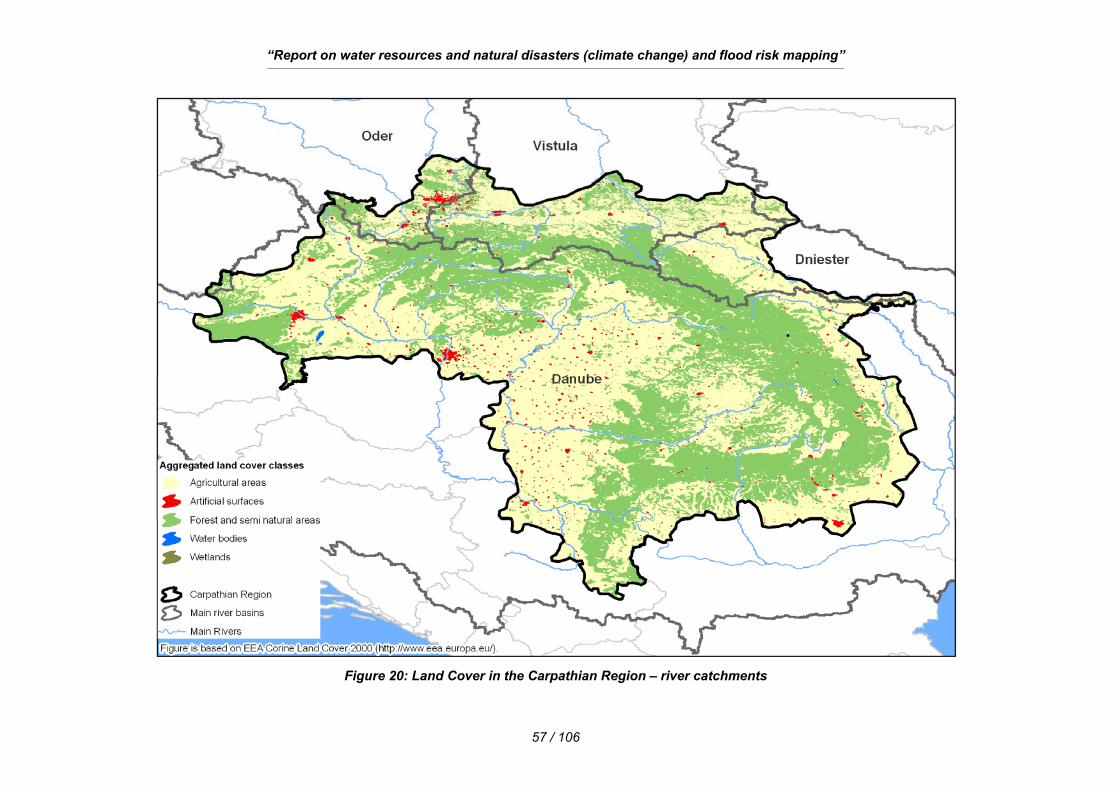
“Report on water resources and natural disasters (climate change) and flood risk mapping” ___________________________________________________________________________________________________________________________________________________________________________________________________
57 / 106
Figure 20: Land Cover in the Carpathian Region – river catchments
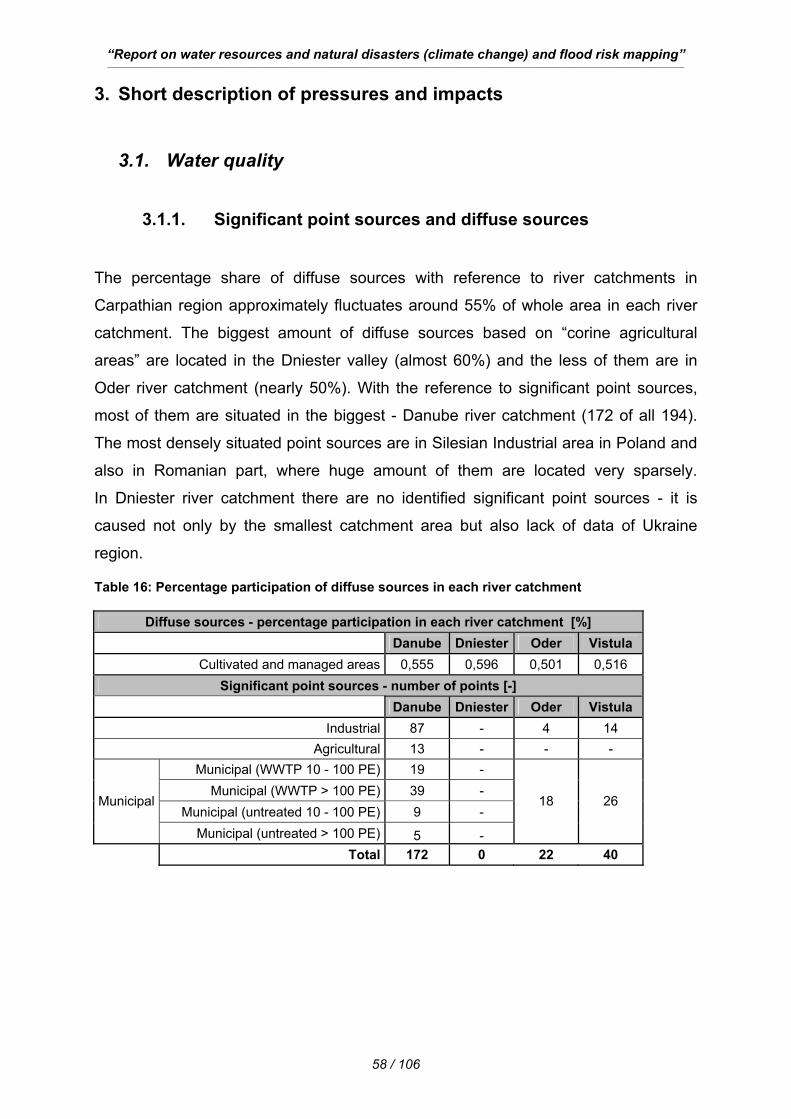
“Report on water resources and natural disasters (climate change) and flood risk mapping” ___________________________________________________________________________________________________________________________________________________________________________________________________
58 / 106
3. Short description of pressures and impacts
3.1. Water quality
3.1.1. Significant point sources and diffuse sources
The percentage share of diffuse sources with reference to river catchments in
Carpathian region approximately fluctuates around 55% of whole area in each river
catchment. The biggest amount of diffuse sources based on “corine agricultural
areas” are located in the Dniester valley (almost 60%) and the less of them are in
Oder river catchment (nearly 50%). With the reference to significant point sources,
most of them are situated in the biggest - Danube river catchment (172 of all 194).
The most densely situated point sources are in Silesian Industrial area in Poland and
also in Romanian part, where huge amount of them are located very sparsely.
In Dniester river catchment there are no identified significant point sources - it is
caused not only by the smallest catchment area but also lack of data of Ukraine
region.
Table 16: Percentage participation of diffuse sources in each river catchment
Diffuse sources - percentage participation in each river catchment [%]
Danube Dniester Oder Vistula Cultivated and managed areas 0,555 0,596 0,501 0,516
Significant point sources - number of points [-]
Danube Dniester Oder Vistula Industrial 87 - 4 14
Agricultural 13 - - - Municipal (WWTP 10 - 100 PE) 19 -
Municipal (WWTP > 100 PE) 39 - Municipal (untreated 10 - 100 PE) 9 -
Municipal
Municipal (untreated > 100 PE) 5 -
18 26
Total 172 0 22 40
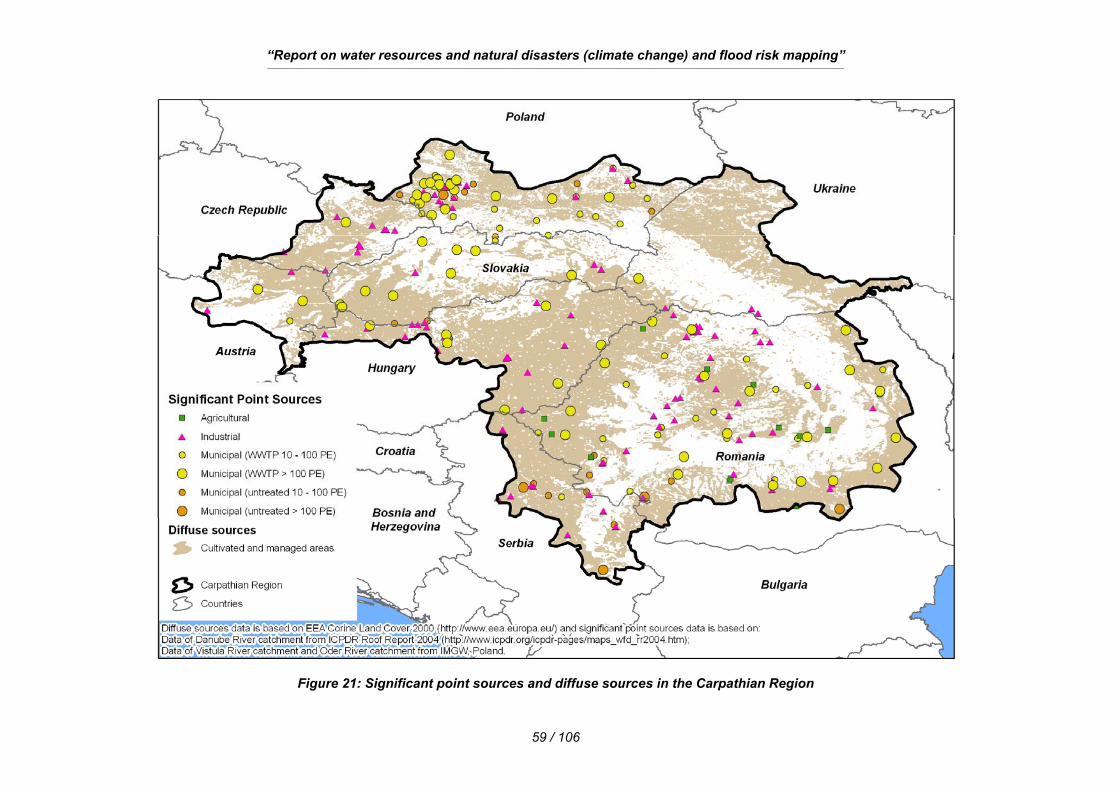
“Report on water resources and natural disasters (climate change) and flood risk mapping” ___________________________________________________________________________________________________________________________________________________________________________________________________
59 / 106
Figure 21: Significant point sources and diffuse sources in the Carpathian Region
“Report on water resources and natural disasters (climate change) and flood risk mapping” ___________________________________________________________________________________________________________________________________________________________________________________________________
60 / 106
3.1.2. Risk of failure to reach environmental objectives Data about risk of failure to reach the Environmental Objectives for Danube River
Catchment is from ICPDR Roof Report 2004 and for Oder and Vistula River
Catchment are from IMGW, Poland.
There was no data for Dniester, Prut, Great Morava rivers, the Tysa on section in the
border between Ukraine and Romania, section downstream the Maros, and upper
sections of the Oder and the Sajo.
Organic Pollution At risk of failure to reach the Environmental Objectives are the Danube along the
border between Romania and Serbia, and downstream the Horn to border of
Carpathian region.
Water bodies not at risk are almost for every spring rivers’ sections. A good status of
water with regard organic pollution are San and Dunajec rivers, the Tysa and it’s
tributaries: Hornad and Sajo Rivers. There are only three short sections in Hornad at
risk and possibly at risk. Mostly at risk of failure to reach environmental objectives in
this range are: Siret, Vah and Vistula rivers.
Nutrient Pollution Taking into consideration nutrient pollution, the problem doesn’t apply all the San,
and the Upper Dunajec, the Danube in western part of the region, springs sections of
Siret, Aluta, Maros, Hornad, Horn and Vistula rivers. Water bodies not at risk of
failure to reach the Environmental Objectives are also in the middle pats of
Carpathians rivers.
Hazardous Substances Water bodies which are visibly at risk or possibly at risk of failure to reach the
Environmental Objectives in means Hazardous Substances are: the Danube along
the border between Romania and Serbia, almost all Aluta, Tysa and Vah rivers, and
in half the Morava.
Not at risk in this issue are all Polish water bodies, almost on their all length: the
Siret, the Maros (only in estuaries section is possibly at risk), and the Hornad.
“Report on water resources and natural disasters (climate change) and flood risk mapping” ___________________________________________________________________________________________________________________________________________________________________________________________________
61 / 106
Hydromorphological Alterations
The highest risk of failure to reach the Environmental Objectives in Carpathian water
bodies is in means hydromorphological alterations. Many of them are at risk or
possibly at risk. Only San and Dunajec rivers aren’t at risk.
Risk of failure to reach the Environmental Objectives for water bodies – Figure 24 -
Figure 22.
Configuration of percentage length in means of each element for rivers are in table
below.
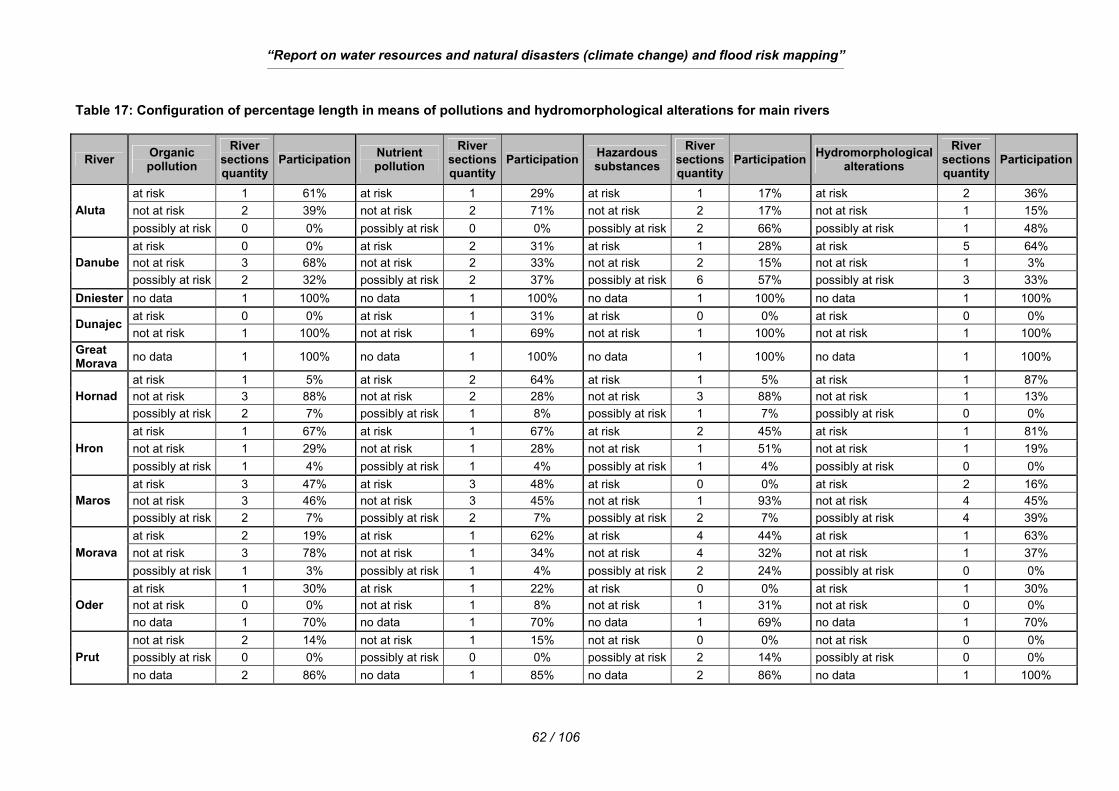
“Report on water resources and natural disasters (climate change) and flood risk mapping” ___________________________________________________________________________________________________________________________________________________________________________________________________
62 / 106
Table 17: Configuration of percentage length in means of pollutions and hydromorphological alterations for main rivers
River Organic pollution
River sections quantity
Participation Nutrient pollution
River sections quantity
Participation Hazardous substances
River sections quantity
Participation Hydromorphological alterations
River sections quantity
Participation
at risk 1 61% at risk 1 29% at risk 1 17% at risk 2 36% not at risk 2 39% not at risk 2 71% not at risk 2 17% not at risk 1 15% Aluta possibly at risk 0 0% possibly at risk 0 0% possibly at risk 2 66% possibly at risk 1 48% at risk 0 0% at risk 2 31% at risk 1 28% at risk 5 64% not at risk 3 68% not at risk 2 33% not at risk 2 15% not at risk 1 3% Danube possibly at risk 2 32% possibly at risk 2 37% possibly at risk 6 57% possibly at risk 3 33%
Dniester no data 1 100% no data 1 100% no data 1 100% no data 1 100% at risk 0 0% at risk 1 31% at risk 0 0% at risk 0 0% Dunajec not at risk 1 100% not at risk 1 69% not at risk 1 100% not at risk 1 100%
Great Morava no data 1 100% no data 1 100% no data 1 100% no data 1 100%
at risk 1 5% at risk 2 64% at risk 1 5% at risk 1 87% not at risk 3 88% not at risk 2 28% not at risk 3 88% not at risk 1 13% Hornad possibly at risk 2 7% possibly at risk 1 8% possibly at risk 1 7% possibly at risk 0 0% at risk 1 67% at risk 1 67% at risk 2 45% at risk 1 81% not at risk 1 29% not at risk 1 28% not at risk 1 51% not at risk 1 19% Hron possibly at risk 1 4% possibly at risk 1 4% possibly at risk 1 4% possibly at risk 0 0% at risk 3 47% at risk 3 48% at risk 0 0% at risk 2 16% not at risk 3 46% not at risk 3 45% not at risk 1 93% not at risk 4 45% Maros possibly at risk 2 7% possibly at risk 2 7% possibly at risk 2 7% possibly at risk 4 39% at risk 2 19% at risk 1 62% at risk 4 44% at risk 1 63% not at risk 3 78% not at risk 1 34% not at risk 4 32% not at risk 1 37% Morava possibly at risk 1 3% possibly at risk 1 4% possibly at risk 2 24% possibly at risk 0 0% at risk 1 30% at risk 1 22% at risk 0 0% at risk 1 30% not at risk 0 0% not at risk 1 8% not at risk 1 31% not at risk 0 0% Oder no data 1 70% no data 1 70% no data 1 69% no data 1 70% not at risk 2 14% not at risk 1 15% not at risk 0 0% not at risk 0 0% possibly at risk 0 0% possibly at risk 0 0% possibly at risk 2 14% possibly at risk 0 0% Prut no data 2 86% no data 1 85% no data 2 86% no data 1 100%
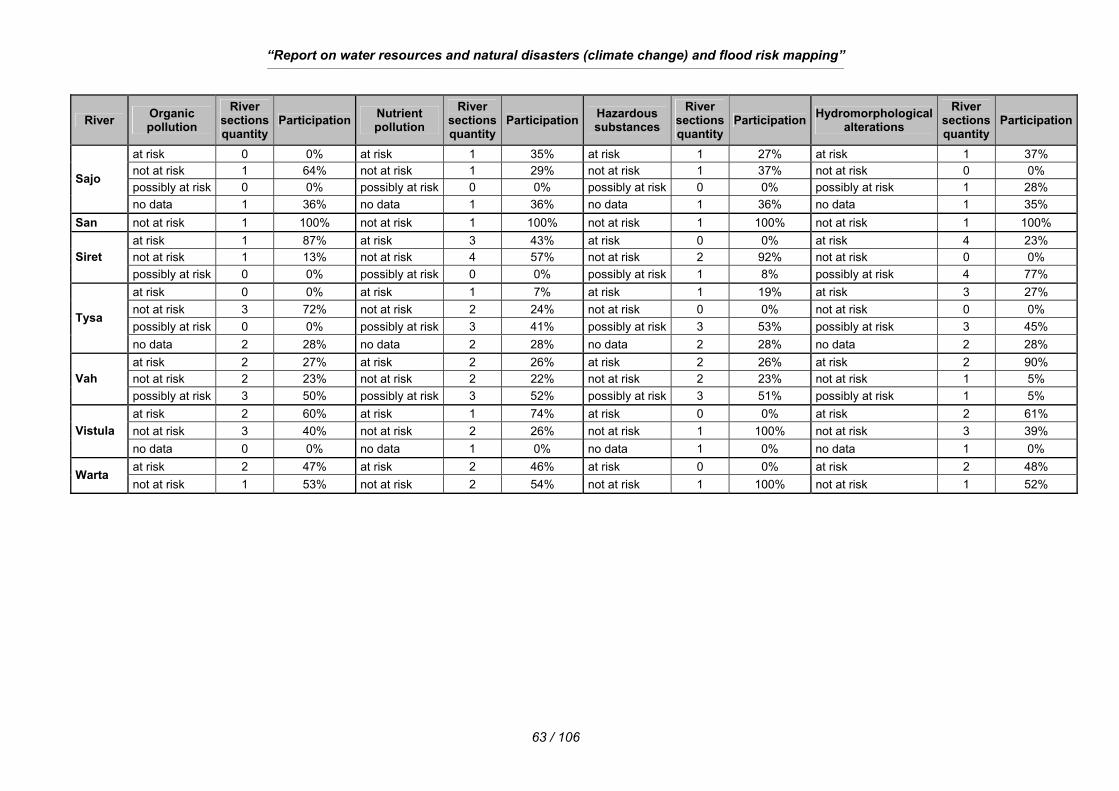
“Report on water resources and natural disasters (climate change) and flood risk mapping” ___________________________________________________________________________________________________________________________________________________________________________________________________
63 / 106
River Organic pollution
River sections quantity
Participation Nutrient pollution
River sections quantity
Participation Hazardous substances
River sections quantity
Participation Hydromorphological alterations
River sections quantity
Participation
at risk 0 0% at risk 1 35% at risk 1 27% at risk 1 37% not at risk 1 64% not at risk 1 29% not at risk 1 37% not at risk 0 0% possibly at risk 0 0% possibly at risk 0 0% possibly at risk 0 0% possibly at risk 1 28%
Sajo
no data 1 36% no data 1 36% no data 1 36% no data 1 35% San not at risk 1 100% not at risk 1 100% not at risk 1 100% not at risk 1 100%
at risk 1 87% at risk 3 43% at risk 0 0% at risk 4 23% not at risk 1 13% not at risk 4 57% not at risk 2 92% not at risk 0 0% Siret possibly at risk 0 0% possibly at risk 0 0% possibly at risk 1 8% possibly at risk 4 77% at risk 0 0% at risk 1 7% at risk 1 19% at risk 3 27% not at risk 3 72% not at risk 2 24% not at risk 0 0% not at risk 0 0% possibly at risk 0 0% possibly at risk 3 41% possibly at risk 3 53% possibly at risk 3 45%
Tysa
no data 2 28% no data 2 28% no data 2 28% no data 2 28% at risk 2 27% at risk 2 26% at risk 2 26% at risk 2 90% not at risk 2 23% not at risk 2 22% not at risk 2 23% not at risk 1 5% Vah possibly at risk 3 50% possibly at risk 3 52% possibly at risk 3 51% possibly at risk 1 5% at risk 2 60% at risk 1 74% at risk 0 0% at risk 2 61% not at risk 3 40% not at risk 2 26% not at risk 1 100% not at risk 3 39% Vistula no data 0 0% no data 1 0% no data 1 0% no data 1 0% at risk 2 47% at risk 2 46% at risk 0 0% at risk 2 48%
Warta not at risk 1 53% not at risk 2 54% not at risk 1 100% not at risk 1 52%
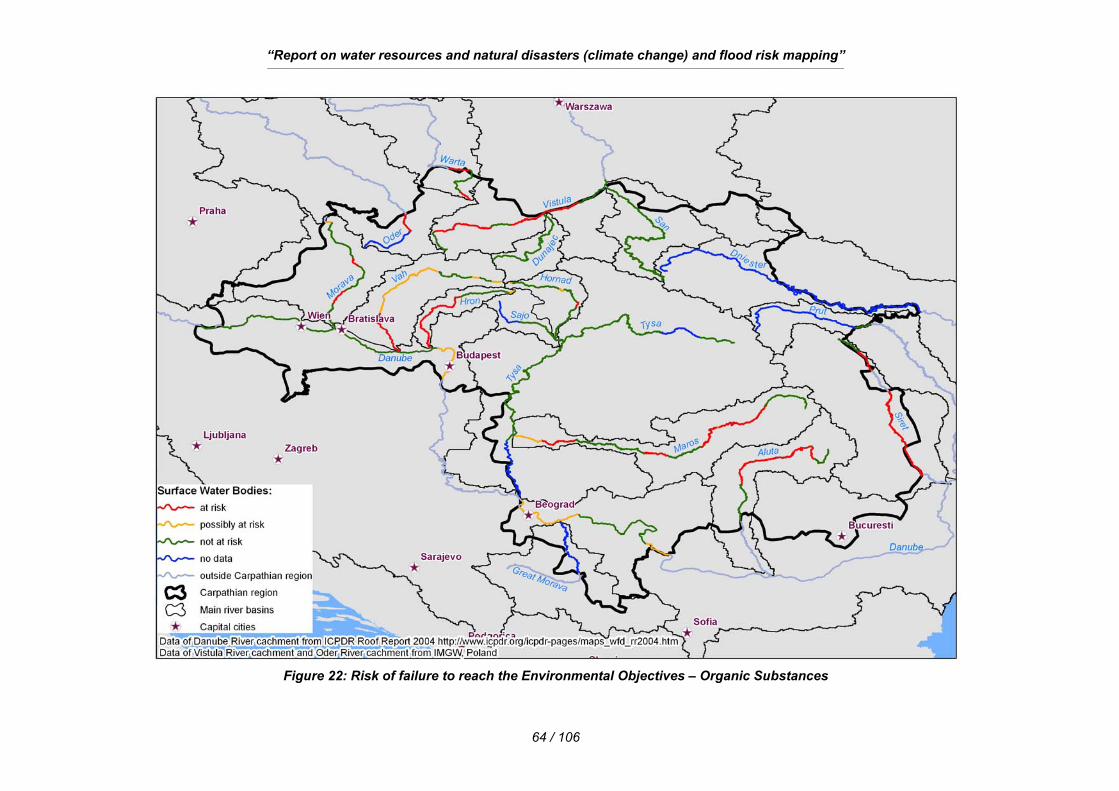
“Report on water resources and natural disasters (climate change) and flood risk mapping” ___________________________________________________________________________________________________________________________________________________________________________________________________
64 / 106
Figure 22: Risk of failure to reach the Environmental Objectives – Organic Substances
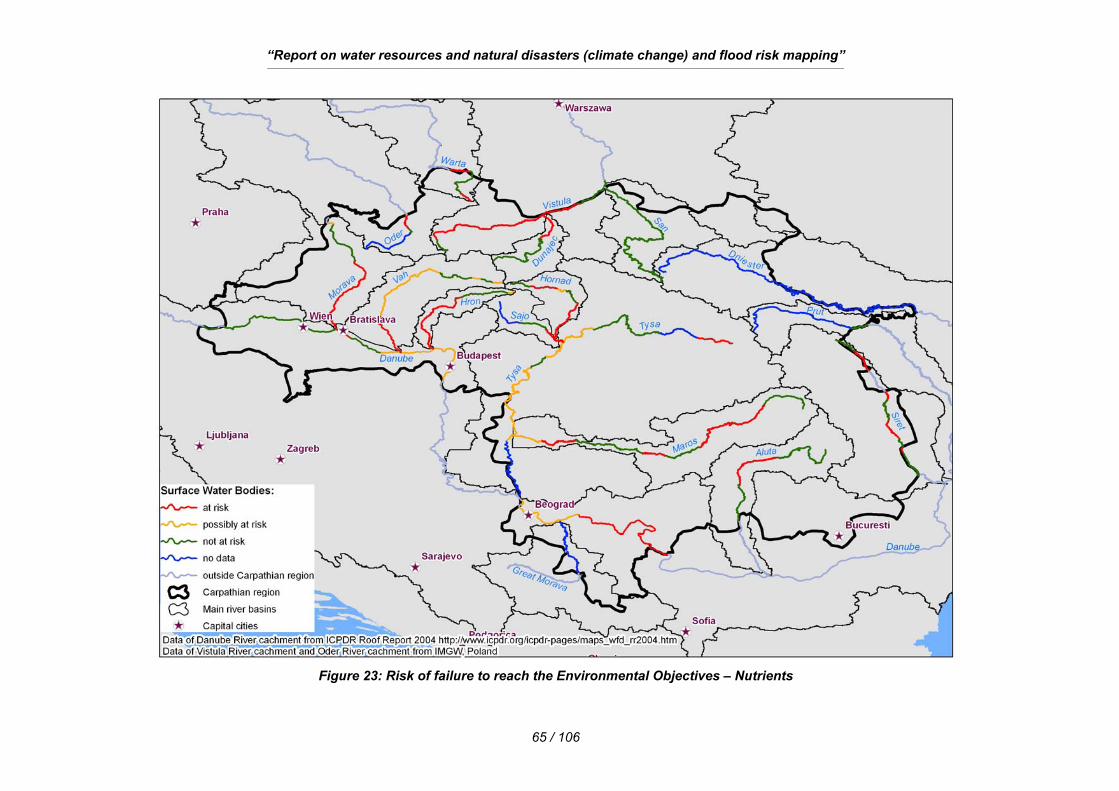
“Report on water resources and natural disasters (climate change) and flood risk mapping” ___________________________________________________________________________________________________________________________________________________________________________________________________
65 / 106
Figure 23: Risk of failure to reach the Environmental Objectives – Nutrients
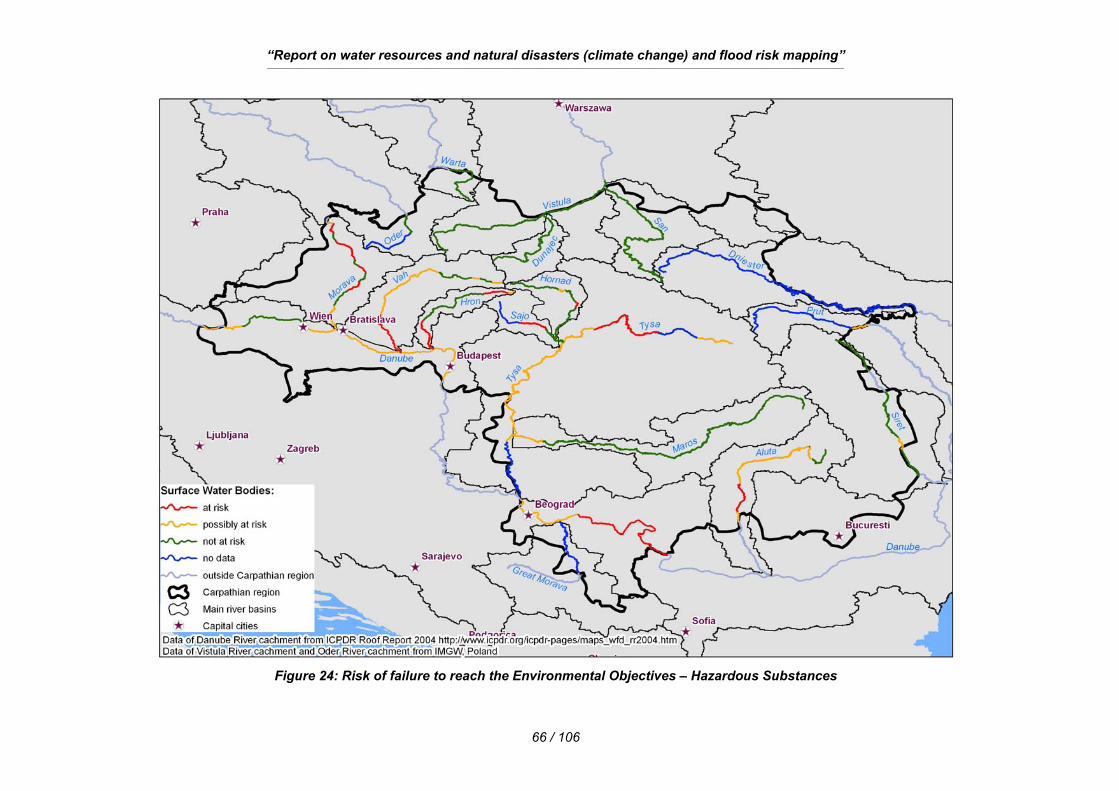
“Report on water resources and natural disasters (climate change) and flood risk mapping” ___________________________________________________________________________________________________________________________________________________________________________________________________
66 / 106
Figure 24: Risk of failure to reach the Environmental Objectives – Hazardous Substances
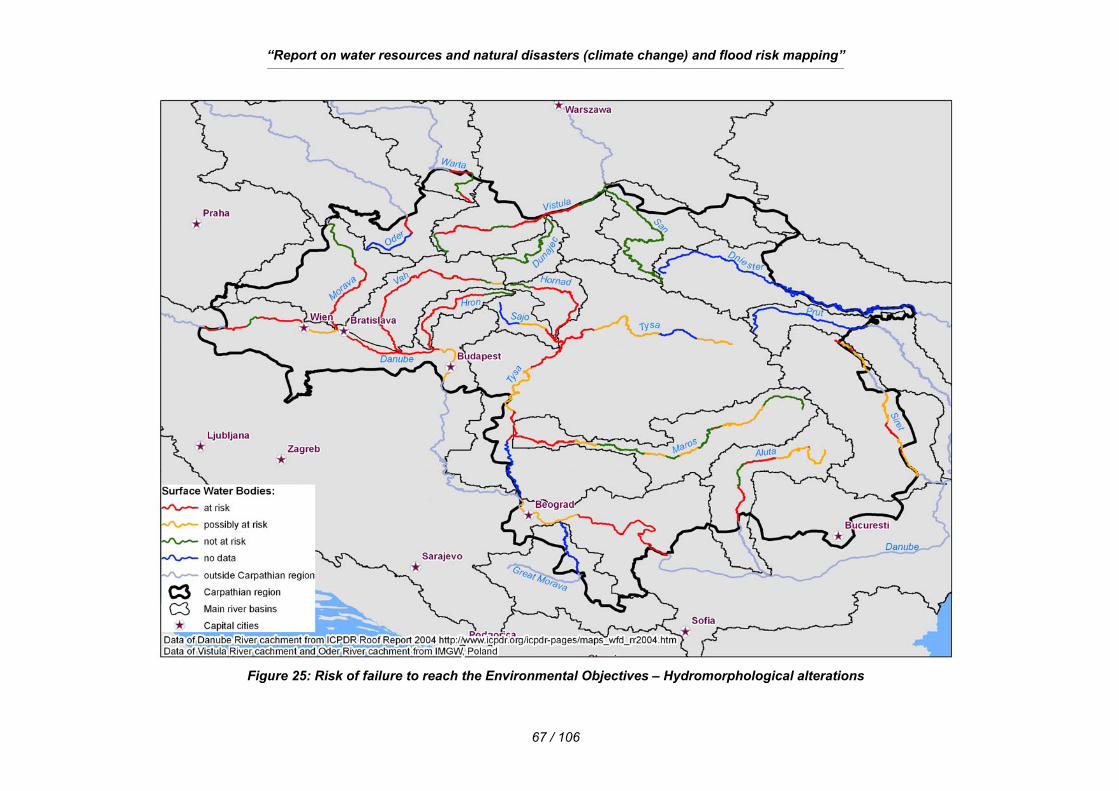
“Report on water resources and natural disasters (climate change) and flood risk mapping” ___________________________________________________________________________________________________________________________________________________________________________________________________
67 / 106
Figure 25: Risk of failure to reach the Environmental Objectives – Hydromorphological alterations
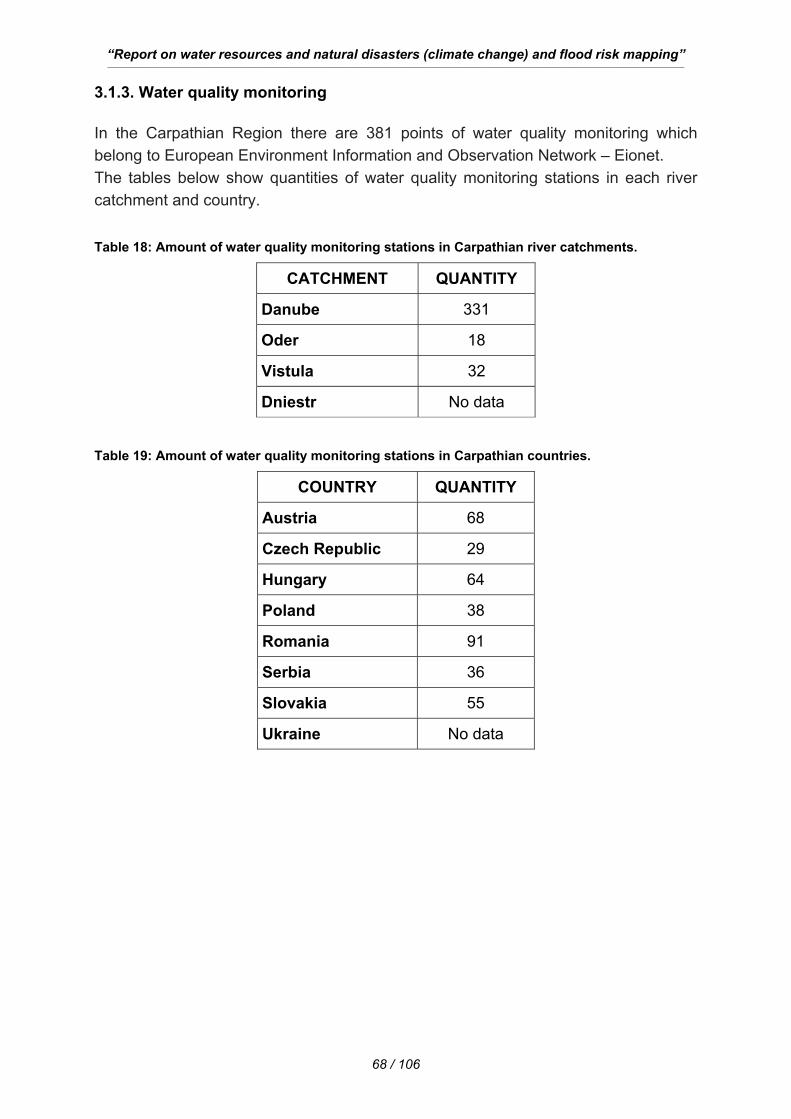
“Report on water resources and natural disasters (climate change) and flood risk mapping” ___________________________________________________________________________________________________________________________________________________________________________________________________
68 / 106
3.1.3. Water quality monitoring In the Carpathian Region there are 381 points of water quality monitoring which belong to European Environment Information and Observation Network – Eionet. The tables below show quantities of water quality monitoring stations in each river catchment and country. Table 18: Amount of water quality monitoring stations in Carpathian river catchments.
CATCHMENT QUANTITY
Danube 331
Oder 18
Vistula 32
Dniestr No data
Table 19: Amount of water quality monitoring stations in Carpathian countries.
COUNTRY QUANTITY
Austria 68
Czech Republic 29
Hungary 64
Poland 38
Romania 91
Serbia 36
Slovakia 55
Ukraine No data
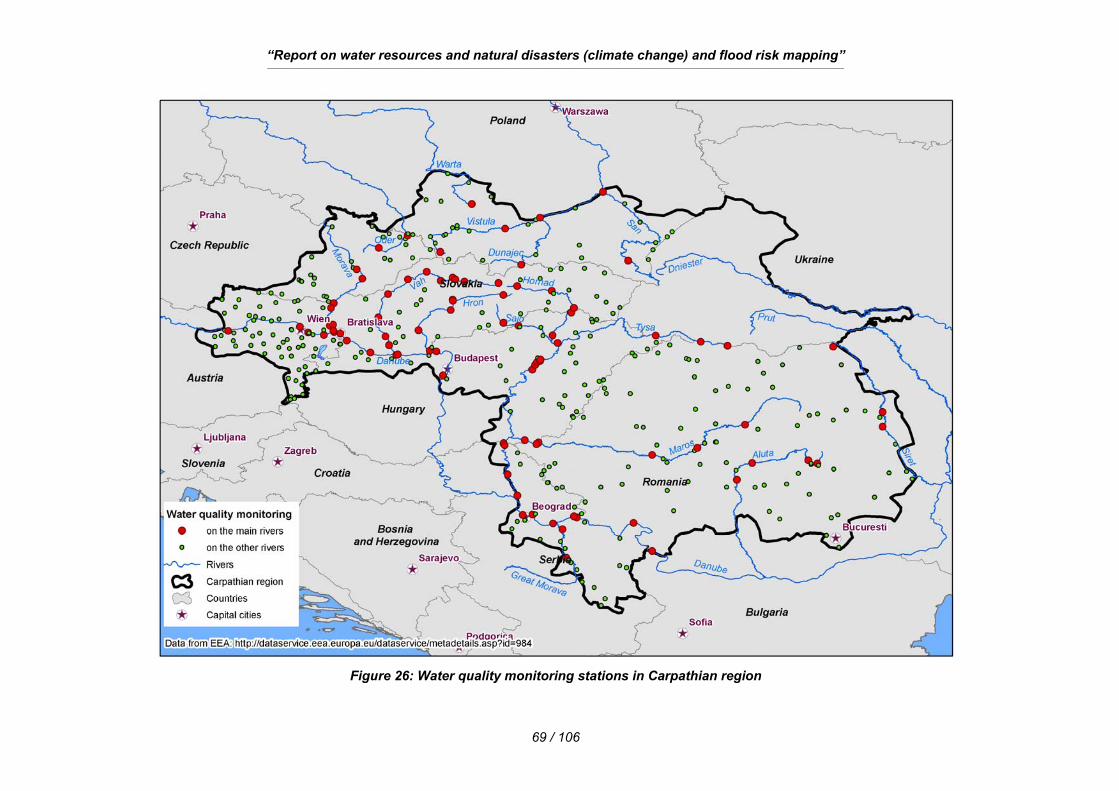
“Report on water resources and natural disasters (climate change) and flood risk mapping” ___________________________________________________________________________________________________________________________________________________________________________________________________
69 / 106
Figure 26: Water quality monitoring stations in Carpathian region
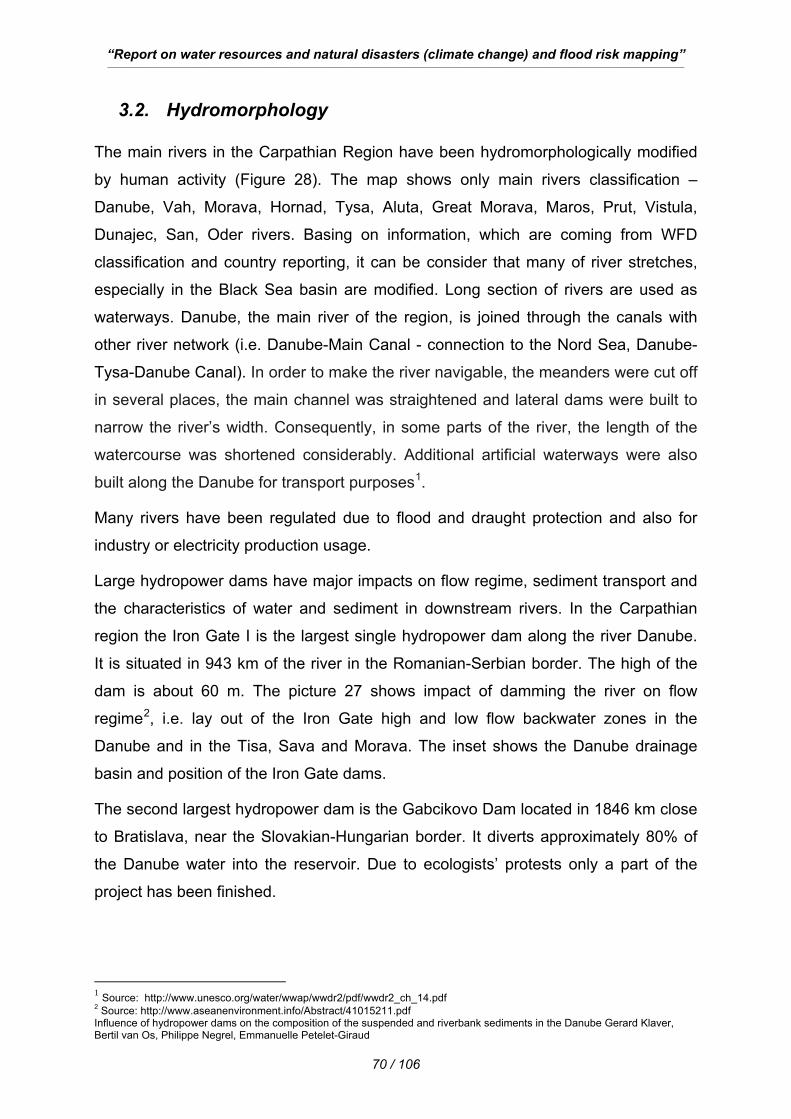
“Report on water resources and natural disasters (climate change) and flood risk mapping” ___________________________________________________________________________________________________________________________________________________________________________________________________
70 / 106
3.2. Hydromorphology The main rivers in the Carpathian Region have been hydromorphologically modified
by human activity (Figure 28). The map shows only main rivers classification –
Danube, Vah, Morava, Hornad, Tysa, Aluta, Great Morava, Maros, Prut, Vistula,
Dunajec, San, Oder rivers. Basing on information, which are coming from WFD
classification and country reporting, it can be consider that many of river stretches,
especially in the Black Sea basin are modified. Long section of rivers are used as
waterways. Danube, the main river of the region, is joined through the canals with
other river network (i.e. Danube-Main Canal - connection to the Nord Sea, Danube-
Tysa-Danube Canal). In order to make the river navigable, the meanders were cut off
in several places, the main channel was straightened and lateral dams were built to
narrow the river’s width. Consequently, in some parts of the river, the length of the
watercourse was shortened considerably. Additional artificial waterways were also
built along the Danube for transport purposes1.
Many rivers have been regulated due to flood and draught protection and also for
industry or electricity production usage.
Large hydropower dams have major impacts on flow regime, sediment transport and
the characteristics of water and sediment in downstream rivers. In the Carpathian
region the Iron Gate I is the largest single hydropower dam along the river Danube.
It is situated in 943 km of the river in the Romanian-Serbian border. The high of the
dam is about 60 m. The picture 27 shows impact of damming the river on flow
regime2, i.e. lay out of the Iron Gate high and low flow backwater zones in the
Danube and in the Tisa, Sava and Morava. The inset shows the Danube drainage
basin and position of the Iron Gate dams.
The second largest hydropower dam is the Gabcikovo Dam located in 1846 km close
to Bratislava, near the Slovakian-Hungarian border. It diverts approximately 80% of
the Danube water into the reservoir. Due to ecologists’ protests only a part of the
project has been finished.
1 Source: http://www.unesco.org/water/wwap/wwdr2/pdf/wwdr2_ch_14.pdf 2 Source: http://www.aseanenvironment.info/Abstract/41015211.pdf Influence of hydropower dams on the composition of the suspended and riverbank sediments in the Danube Gerard Klaver, Bertil van Os, Philippe Negrel, Emmanuelle Petelet-Giraud
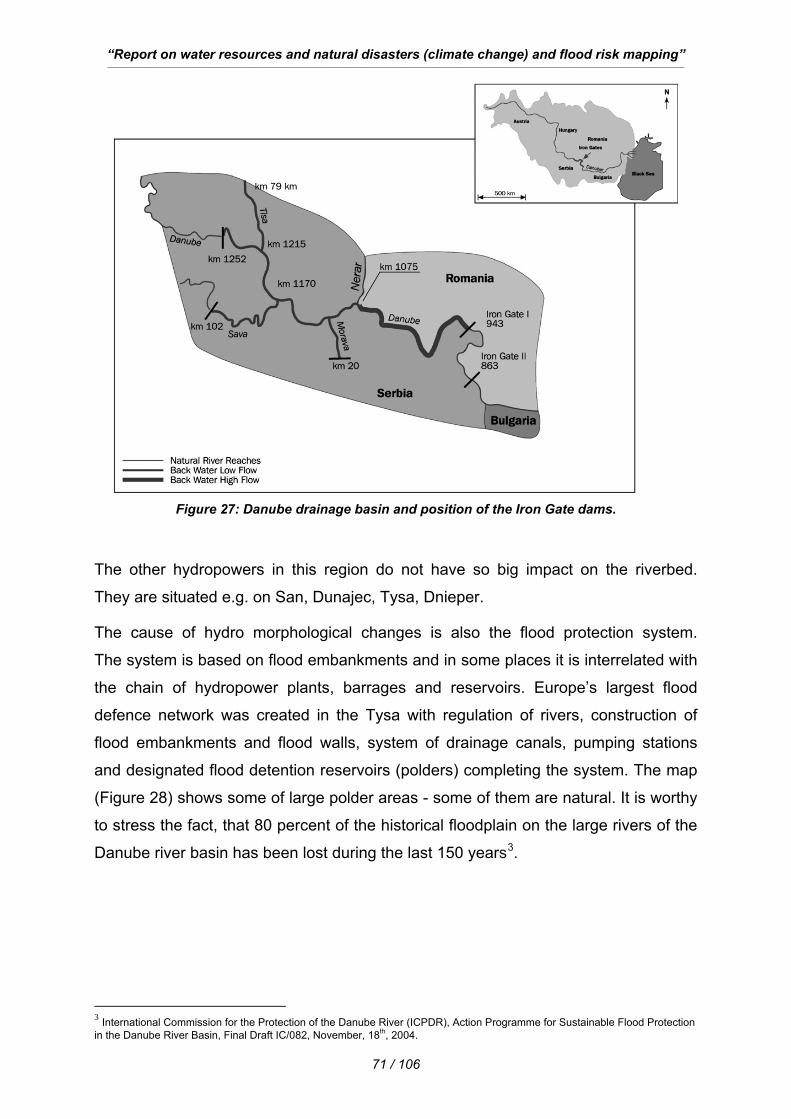
“Report on water resources and natural disasters (climate change) and flood risk mapping” ___________________________________________________________________________________________________________________________________________________________________________________________________
71 / 106
Figure 27: Danube drainage basin and position of the Iron Gate dams.
The other hydropowers in this region do not have so big impact on the riverbed.
They are situated e.g. on San, Dunajec, Tysa, Dnieper.
The cause of hydro morphological changes is also the flood protection system.
The system is based on flood embankments and in some places it is interrelated with
the chain of hydropower plants, barrages and reservoirs. Europe’s largest flood
defence network was created in the Tysa with regulation of rivers, construction of
flood embankments and flood walls, system of drainage canals, pumping stations
and designated flood detention reservoirs (polders) completing the system. The map
(Figure 28) shows some of large polder areas - some of them are natural. It is worthy
to stress the fact, that 80 percent of the historical floodplain on the large rivers of the
Danube river basin has been lost during the last 150 years3.
3 International Commission for the Protection of the Danube River (ICPDR), Action Programme for Sustainable Flood Protection in the Danube River Basin, Final Draft IC/082, November, 18th, 2004.
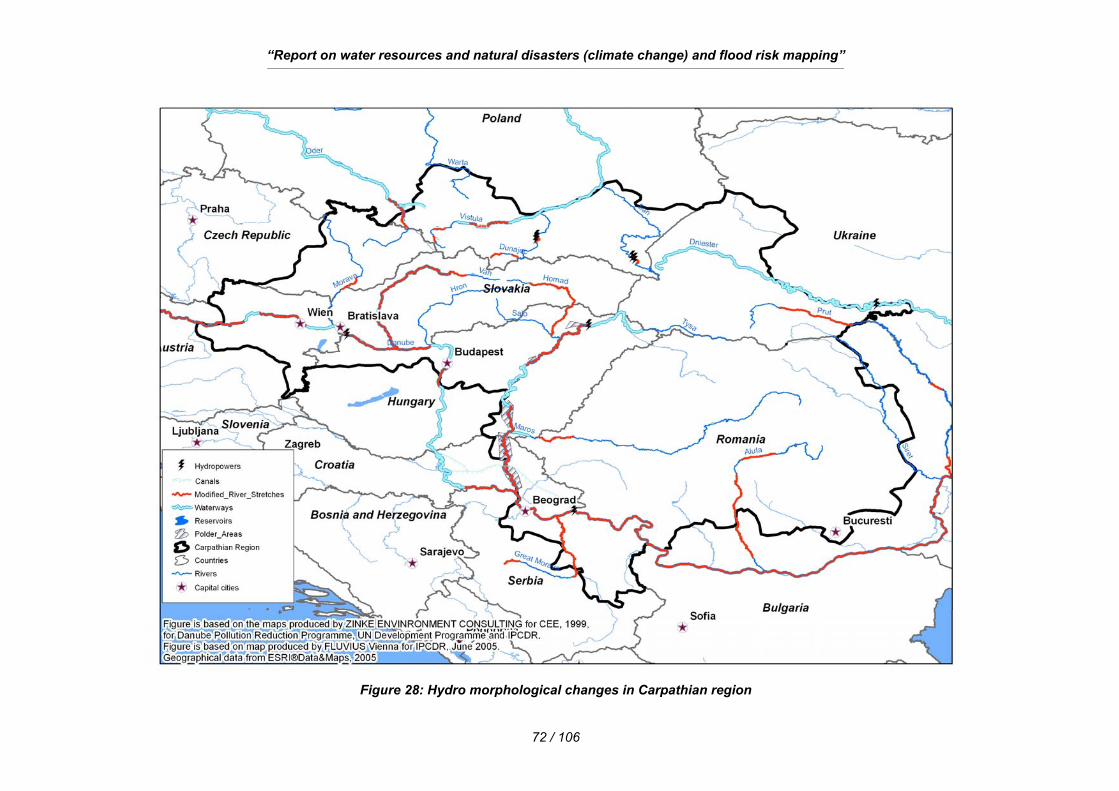
“Report on water resources and natural disasters (climate change) and flood risk mapping” ___________________________________________________________________________________________________________________________________________________________________________________________________
72 / 106
Figure 28: Hydro morphological changes in Carpathian region
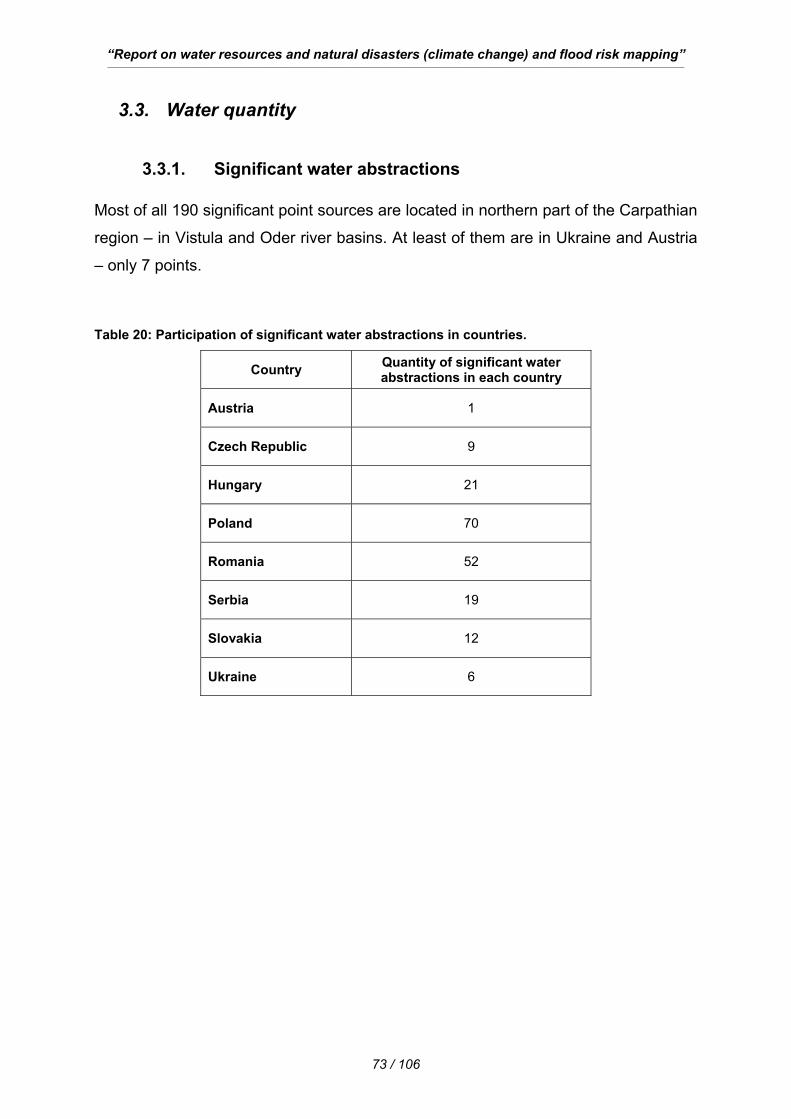
“Report on water resources and natural disasters (climate change) and flood risk mapping” ___________________________________________________________________________________________________________________________________________________________________________________________________
73 / 106
3.3. Water quantity
3.3.1. Significant water abstractions Most of all 190 significant point sources are located in northern part of the Carpathian
region – in Vistula and Oder river basins. At least of them are in Ukraine and Austria
– only 7 points.
Table 20: Participation of significant water abstractions in countries.
Country Quantity of significant water abstractions in each country
Austria 1
Czech Republic 9
Hungary 21
Poland 70
Romania 52
Serbia 19
Slovakia 12
Ukraine 6
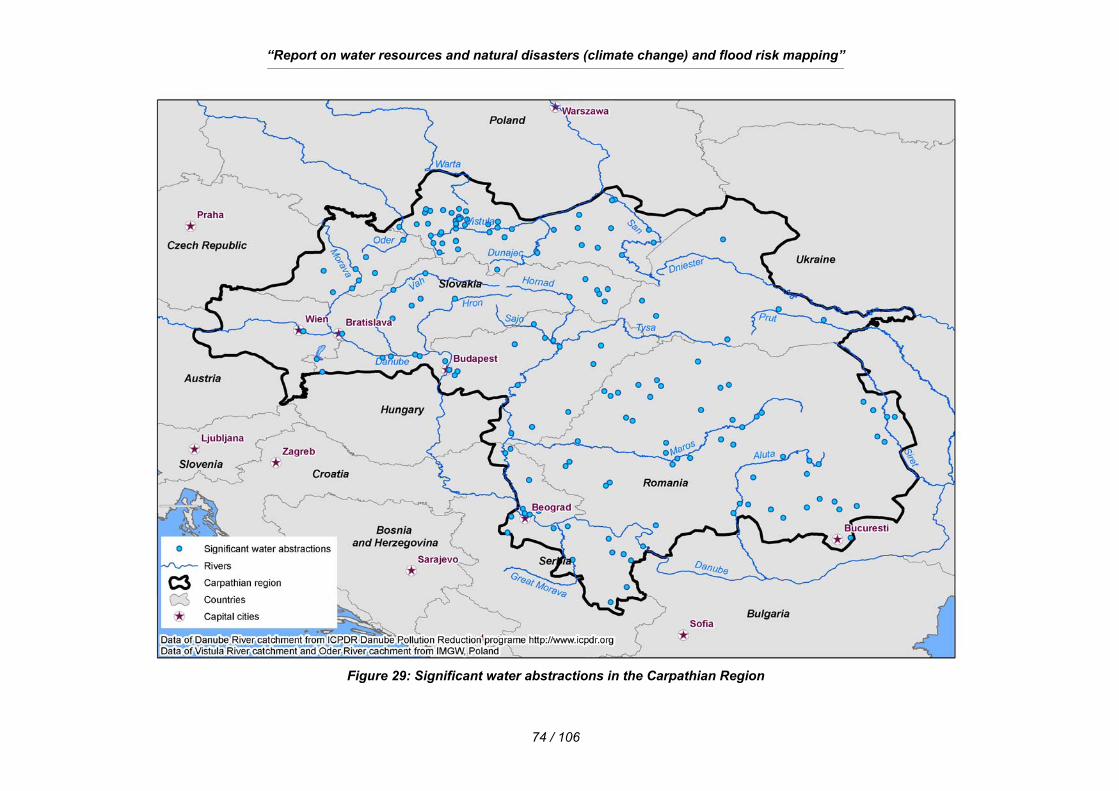
“Report on water resources and natural disasters (climate change) and flood risk mapping” ___________________________________________________________________________________________________________________________________________________________________________________________________
74 / 106
Figure 29: Significant water abstractions in the Carpathian Region
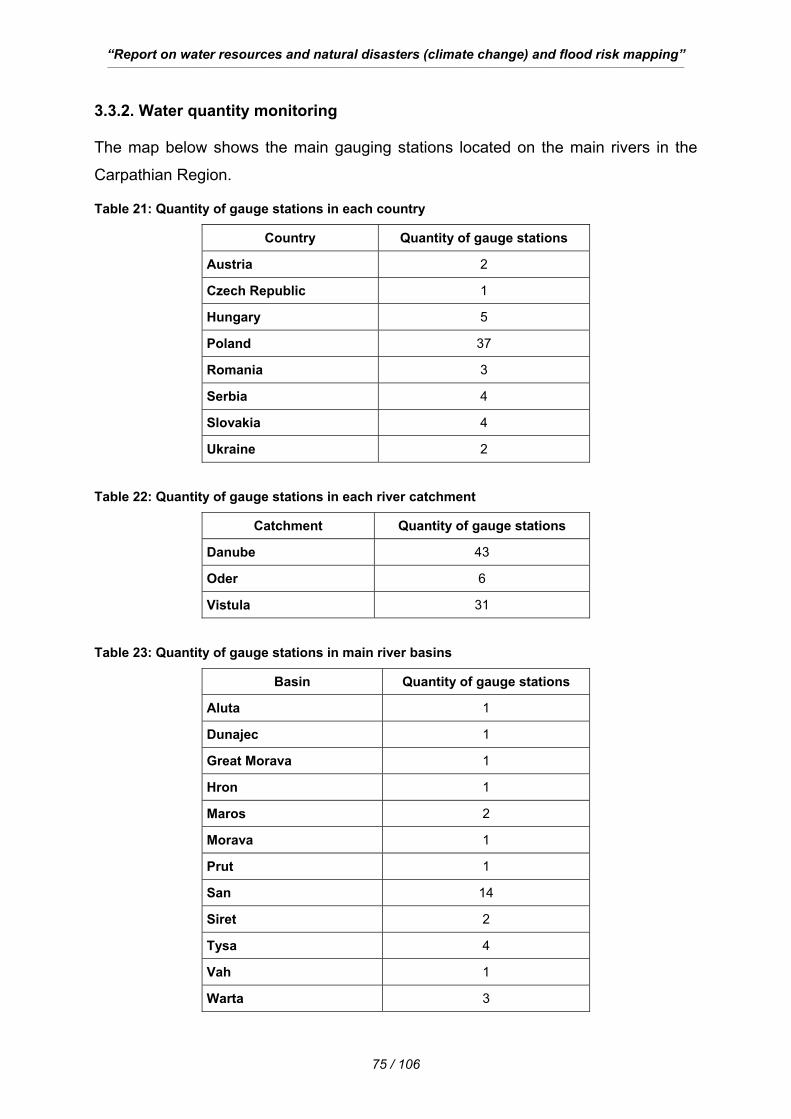
“Report on water resources and natural disasters (climate change) and flood risk mapping” ___________________________________________________________________________________________________________________________________________________________________________________________________
75 / 106
3.3.2. Water quantity monitoring The map below shows the main gauging stations located on the main rivers in the
Carpathian Region.
Table 21: Quantity of gauge stations in each country
Country Quantity of gauge stations
Austria 2
Czech Republic 1
Hungary 5
Poland 37
Romania 3
Serbia 4
Slovakia 4
Ukraine 2
Table 22: Quantity of gauge stations in each river catchment
Catchment Quantity of gauge stations
Danube 43
Oder 6
Vistula 31
Table 23: Quantity of gauge stations in main river basins
Basin Quantity of gauge stations
Aluta 1
Dunajec 1
Great Morava 1
Hron 1
Maros 2
Morava 1
Prut 1
San 14
Siret 2
Tysa 4
Vah 1
Warta 3
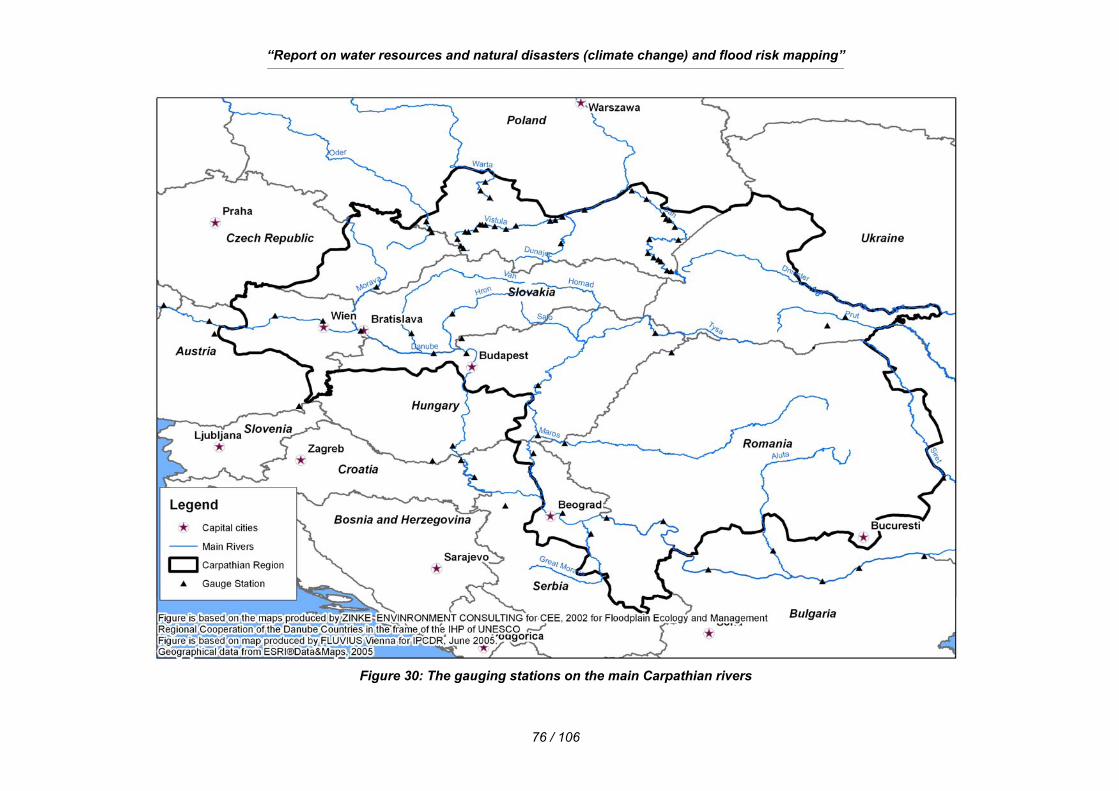
“Report on water resources and natural disasters (climate change) and flood risk mapping” ___________________________________________________________________________________________________________________________________________________________________________________________________
76 / 106
Figure 30: The gauging stations on the main Carpathian rivers
“Report on water resources and natural disasters (climate change) and flood risk mapping” ___________________________________________________________________________________________________________________________________________________________________________________________________
77 / 106
3.4. Management approaches to deal with flood, drought and water scarcity
3.4.1. Management solutions
The river basin management approach is the basis of all protection activities
regarding floods, droughts and water scarcity in the Carpathian region.
The best solution to deal with flood, drought and water scarcity is implementation of
the Integrated Water Resources Management principle. Integrated Water Resources
Management (IWRM) is a participatory planning and implementation process, based
on sound science, that brings stakeholders together to determine how to meet
society’s long-term needs for water and coastal resources while maintaining essential
ecological services and economic benefits. IWRM helps to protect the world’s
environment, foster economic growth and sustainable agricultural development,
promote democratic participation in governance, and improve human health.
Worldwide, water policy and management are beginning to reflect the fundamentally
interconnected nature of hydrological resources, and IWRM is emerging as an
accepted alternative to the sector-by-sector, top-down management style that has
dominated in the past.
Some of the principal components of IWRM:
• Managing water resources at the basin or watershed scale. This includes
integrating land and water, upstream and downstream, groundwater, surface
water, and coastal resources.
• Optimizing supply. This involves conducting assessments of surface and
groundwater supplies, analyzing water balances, adopting wastewater reuse,
and evaluating the environmental impacts of distribution and use options.
• Managing demand. This includes adopting cost recovery policies, utilizing
water-efficient technologies, and establishing decentralized water management
authorities.
• Providing equitable access to water resources through participatory and
transparent governance and management. This may include support for
“Report on water resources and natural disasters (climate change) and flood risk mapping” ___________________________________________________________________________________________________________________________________________________________________________________________________
78 / 106
effective water users’ associations, involvement of marginalized groups, and
consideration of gender issues.
• Establishing improved and integrated policy, regulatory, and institutional
frameworks. Examples are implementation of the polluter-pays principle, water
quality norms and standards, and market-based regulatory mechanisms.
• Utilizing an intersectoral approach to decision-making, where authority for
managing water resources is employed responsibly and stakeholders have a
share in the process.
The idea of IWRM may be introduced by regional authorities, development
corporations, planning executives and other bodies. Those bodies can therefore vary
in their goals. It is noted that social participation is essential for better water
management. However, it has not been easy to ensure active social participation in
water management processes. Sometimes different interest groups have attempted
to capture the water management processes to promote their own agenda’s. In such
case, legal frameworks related to river basin management (like Water Framework
Directive in EU) should be congruent with the economic, social, political and
institutional conditions of the different countries. The IWRM can be focused to
improve its coordination and oversight role. A trans-disciplinary approach is needed.
”Policing” by an independent body is very important to reduce poor implementation
and management. A clear flexible management strategy should be elaborated.
The IWRM as a practical tool also have to assure:
• socio-economic and land projections,
• updating of the water demand/supply balance,
• proposal of priority programmes of medium and long term, including structural
and non-structural measures.
Initiatives within the river basin require similar bases for various types of
development:
• political as well as legal basis,
• economic and financial bases,
• social bases,
• organizational bases.
“Report on water resources and natural disasters (climate change) and flood risk mapping” ___________________________________________________________________________________________________________________________________________________________________________________________________
79 / 106
Floods, droughts and water scarcity are the main challenges on the way of
implementation of the IWRM principle.
All activities should comprise:
• shaping the state policy,
• serving instruments including sufficient data management system and water
quality monitoring,
• issuing regulations,
• planning instruments,
• water management information system,
• education of the society and scientific research.
In the context of climate change and of recent severe flood events, flood-risk as well
as droughts management has raised as an important issue for human safety and the
competitiveness and attractiveness of the different territories.
The proposed requirements which are also include in “flood directive” that shall
undertake river basin authorities are :
• Preliminary flood risk assessment: to establish areas where potential significant
flood risks exist or are reasonably foreseeable in the future.
• Flood risk maps: flood risks would be mapped for the river basins and sub-
basins with significant potential risk of flooding, in order to increase public
awareness; support the process of prioritising, justifying and targeting
investments and developing sustainable policies and strategies; and to support
flood risk management plans, spatial planning and emergency plans.
• Flood risk management plans: flood risk management plans would then need to
be developed and implemented at river basin/sub-basin level to reduce and
manage the flood risk. These plans would include the analysis and assessment
of flood risk, the definition of the level of protection, and identification and
implementation of sustainable measures applying the principle of solidarity: not
passing on problems to upstream or downstream regions and preferably
contributing to reduction of flood risks in upstream and downstream regions.
“Report on water resources and natural disasters (climate change) and flood risk mapping” ___________________________________________________________________________________________________________________________________________________________________________________________________
80 / 106
3.4.2. Technical solutions
Identification of water bodies under WFD develops a common understanding of the
definition of water bodies and gives specific practical suggestions for the
identification of water bodies under the WFD. The integrated approach set by the
directive does not ignore socio-economical considerations. Human activities often
result in several alterations. Physical modifications usually serve not only one but
several uses, which are multipurpose alterations.
According to the European Commission communication it is important to underline,
that there is a high risk of conflict between the implementation of different policies
connected with water at all including:
• Water Framework Directive 2000/60 EC,
• flood protection including Directive on the assessment and management of
flood risks,
• hydropower - Directive 2001/77/EC,
• navigation - The Commission's European Transport White Paper and
Communication from the Commission of 17 January 2006 on the promotion of
inland waterway transport "NAIADES": an Integrated European Action
Programme for Inland Waterway Transport [COM(2006) 6 final - not published
in the Official Journal].
There is a great need of flexibility to set objectives that reflect environmental, social
and economic needs and priorities This flexibility means the needs and priorities of
other policy areas can be taken into account in water management decisions,
through the appropriate use of exemption mechanisms. On the other hand, the other
policies must also take into account water management issues.
One of the major way to find compromise is the development of the “internalization”
of the environmental costs and benefits. It is clear that to deal with floods, droughts
and water scarcity the technical solutions are also required .
At a first glance, there is a high risk of conflict between the implementation of those
different policies:
“Report on water resources and natural disasters (climate change) and flood risk mapping” ___________________________________________________________________________________________________________________________________________________________________________________________________
81 / 106
• The WFD puts a strong emphasis on the quality of hydro-morphological
conditions as they support the type specific aquatic communities that
constitutes good ecological status,
• The past developments of hydropower generation, navigation infrastructures
and activities, and flood defence facilities have often required major hydro-
morphological changes.
However:
• Whilst impacting on aquatic ecosystems, those activities are delivering
important environmental benefits (e.g. climate change) or benefits to human
safety,
• Many damaging consequences on aquatic ecosystems caused by those
activities are due to insufficient precautions and sectoral approaches that did
not take into account the multi-purpose uses of water bodies including the
environmental protection.
In other words, there is no benefit and no fatality for conflicts between the different
policies and there is room for important progresses by enhancing the recognition of
the different interests, fostering the co-operation processes between the different
competent authorities and stakeholders, and promoting more integrated development
strategies.
This will require efforts and acceptance from all the parties:
• Water managers will have to accept environmental objectives for the waters
affected by infrastructures justified by the environmental, social and economic
needs and priorities.
• Infrastructures users and developers will have to invest to mitigate and
compensate the impacts of existing equipments and activities; they will also
have to develop alternatives to the traditional solutions in order to avoid
deterioration and to progress on the justification and the environmental
integration of future needed investments. In certain cases, they will have to
accept modifications of the activities and the infrastructures to restore the
ecological continuities and the aquatic ecosystems. Achieving a good balance
between protection and uses will also require where possible modifications of
the infrastructures for the restoration of the aquatic ecosystems. Indeed, single
“Report on water resources and natural disasters (climate change) and flood risk mapping” ___________________________________________________________________________________________________________________________________________________________________________________________________
82 / 106
mitigation measures at the scale of individual infrastructure might be insufficient
in certain situations to maintain an overall ecological quality.
Where possible, technical solutions that do not cause deterioration of status should
be promoted (e.g. setting flood embankments back from the edge of the river to
make more space for the river to flood).
Three main hydromorphological driving forces have been determined as most
relevant on the basin-wide scale in the Carpathian Region:
• hydropower generation,
• flood defense,
• navigation.
Most of the large rivers in the Region in densely populated areas are characterized
by anthropogenic modifications for flood protection and to secure land for urban
development. In many cases, hydro-structures have multiple purposes often resulting
in changes of the river character. These changes affect not only the river itself but
larger areas of the valley. Major systematic regulations for flood defense and
navigation purposes began in Austria in the 19th century. On the present territories of
Hungary, Serbia, and Romania first dike systems for flood protection along the
Danube were already built in the 16th century, but were intensified in the 19th and
20th century. The former extensive floodplains with numerous side arms and
backwaters were largely altered into canalised and straightened waterways with
distinct river bank reinforcement. As a consequence, today only less than 19% of the
former flood plains in the Danube basin, compared to the situation 150 years ago,
remain. The area of floodplain affected by river regulation/flood defense is large – in
Hungary for instance 2.12 million ha were diked. The Danube itself is regulated along
over 80% of its length. The less danger situation is in that Carpathian part which
belongs to the Baltic Sea basin.
To manage with flood, droughts and water scarcity in the Carpathian region there is a
strong need of finding compromise between:
• urban development, land use planning ,
• restoration of the historical floodplains,
• inland waterway transport,
“Report on water resources and natural disasters (climate change) and flood risk mapping” ___________________________________________________________________________________________________________________________________________________________________________________________________
83 / 106
• construction of the new artificial reservoirs and compensation activities
regarding new hydro-morphological changes,
• maintaining of the Environmentally Acceptable Flow.
The base for such compromise should be the Integrated Water Resources
Management principle.
The good example is the new development in the Tysa river basin. River basin
strategy is based on planning, implementation and supervision respecting the holistic
approach, integrating land use and spatial planning. The measures are the
combination of structural flood protection, natural retention, afforestation and partial
floodplain reactivation.
4. Climate change-natural hazards
4.1. Predictable future pressures Predictable future pressures relating to climate change (snow cover, distribution of
precipitation in time and space, changes in water system and water-cycle and
impacts on water management in Carpathians and the surrounding regions –
especially concerning droughts and scarcity).
Natural phenomena of weather, climate and water are the basics for life, sustainable
development and protection of natural resources and the environment. History of our
planet is characterised by many changes in climate. On the other hand there is
strong evidence that most of the observed recent warming are connected with human
activities, in particular to emissions of greenhouse gases (GHGs).
On 29th of June 2007 The European Commission accepted GREEN PAPER FROM
THE COMMISSION TO THE COUNCIL, THE EUROPEAN PARLIAMENT, THE
EUROPEAN ECONOMIC AND SOCIAL COMMITTEE AND THE COMMITTEE OF
THE REGIONS entitled Adapting to climate change in Europe – options for EU action
(Green Paper). In this document adaptation is defined as a set of actions which are
taken “to cope with a changing climate, e.g. increased rainfall, higher temperatures,
scarcer water resources or more frequent storms, at present or anticipating such
changes in future”. Overall Europe has warmed by 1°C in the last century.
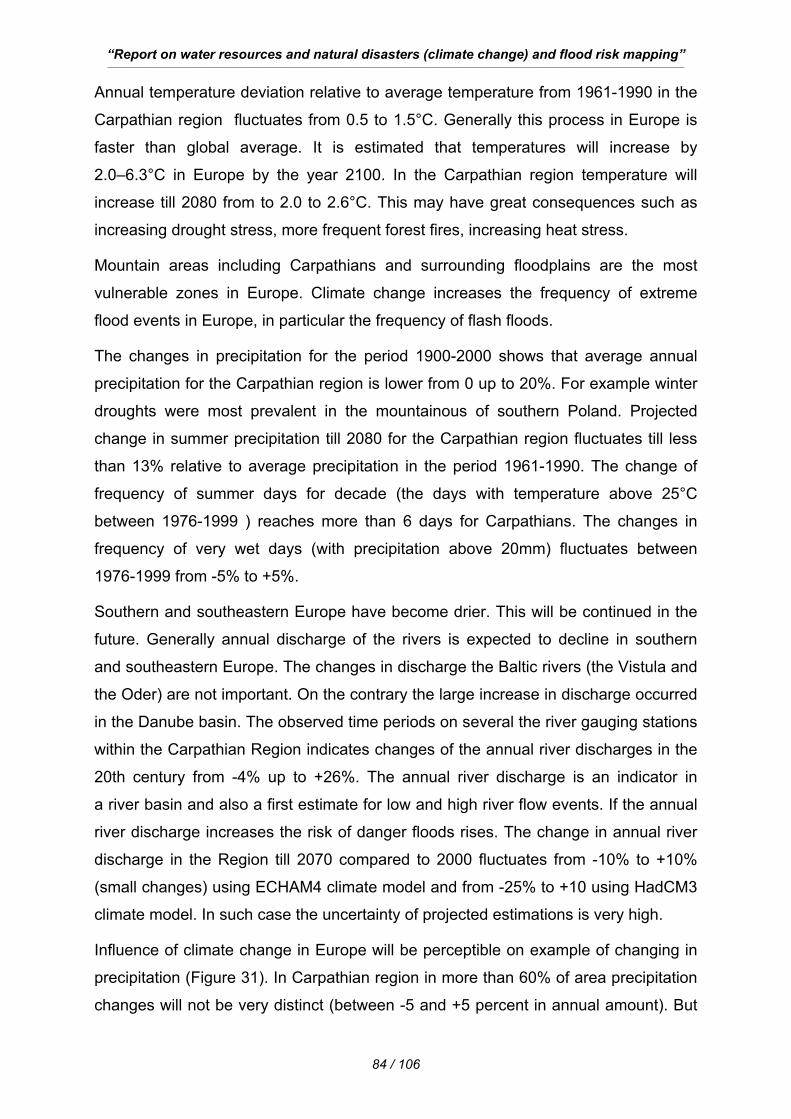
“Report on water resources and natural disasters (climate change) and flood risk mapping” ___________________________________________________________________________________________________________________________________________________________________________________________________
84 / 106
Annual temperature deviation relative to average temperature from 1961-1990 in the
Carpathian region fluctuates from 0.5 to 1.5°C. Generally this process in Europe is
faster than global average. It is estimated that temperatures will increase by
2.0–6.3°C in Europe by the year 2100. In the Carpathian region temperature will
increase till 2080 from to 2.0 to 2.6°C. This may have great consequences such as
increasing drought stress, more frequent forest fires, increasing heat stress.
Mountain areas including Carpathians and surrounding floodplains are the most
vulnerable zones in Europe. Climate change increases the frequency of extreme
flood events in Europe, in particular the frequency of flash floods.
The changes in precipitation for the period 1900-2000 shows that average annual
precipitation for the Carpathian region is lower from 0 up to 20%. For example winter
droughts were most prevalent in the mountainous of southern Poland. Projected
change in summer precipitation till 2080 for the Carpathian region fluctuates till less
than 13% relative to average precipitation in the period 1961-1990. The change of
frequency of summer days for decade (the days with temperature above 25°C
between 1976-1999 ) reaches more than 6 days for Carpathians. The changes in
frequency of very wet days (with precipitation above 20mm) fluctuates between
1976-1999 from -5% to +5%.
Southern and southeastern Europe have become drier. This will be continued in the
future. Generally annual discharge of the rivers is expected to decline in southern
and southeastern Europe. The changes in discharge the Baltic rivers (the Vistula and
the Oder) are not important. On the contrary the large increase in discharge occurred
in the Danube basin. The observed time periods on several the river gauging stations
within the Carpathian Region indicates changes of the annual river discharges in the
20th century from -4% up to +26%. The annual river discharge is an indicator in
a river basin and also a first estimate for low and high river flow events. If the annual
river discharge increases the risk of danger floods rises. The change in annual river
discharge in the Region till 2070 compared to 2000 fluctuates from -10% to +10%
(small changes) using ECHAM4 climate model and from -25% to +10 using HadCM3
climate model. In such case the uncertainty of projected estimations is very high.
Influence of climate change in Europe will be perceptible on example of changing in
precipitation (Figure 31). In Carpathian region in more than 60% of area precipitation
changes will not be very distinct (between -5 and +5 percent in annual amount). But
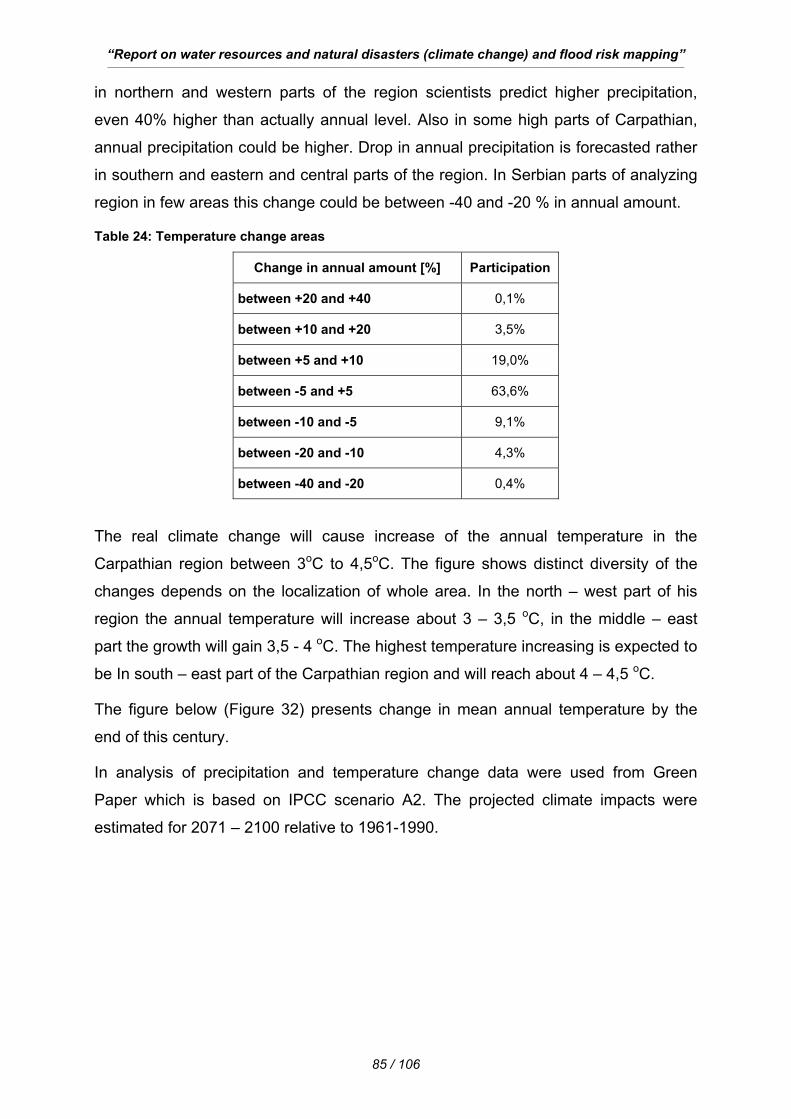
“Report on water resources and natural disasters (climate change) and flood risk mapping” ___________________________________________________________________________________________________________________________________________________________________________________________________
85 / 106
in northern and western parts of the region scientists predict higher precipitation,
even 40% higher than actually annual level. Also in some high parts of Carpathian,
annual precipitation could be higher. Drop in annual precipitation is forecasted rather
in southern and eastern and central parts of the region. In Serbian parts of analyzing
region in few areas this change could be between -40 and -20 % in annual amount.
Table 24: Temperature change areas
Change in annual amount [%] Participation
between +20 and +40 0,1%
between +10 and +20 3,5%
between +5 and +10 19,0%
between -5 and +5 63,6%
between -10 and -5 9,1%
between -20 and -10 4,3%
between -40 and -20 0,4%
The real climate change will cause increase of the annual temperature in the
Carpathian region between 3oC to 4,5oC. The figure shows distinct diversity of the
changes depends on the localization of whole area. In the north – west part of his
region the annual temperature will increase about 3 – 3,5 oC, in the middle – east
part the growth will gain 3,5 - 4 oC. The highest temperature increasing is expected to
be In south – east part of the Carpathian region and will reach about 4 – 4,5 oC.
The figure below (Figure 32) presents change in mean annual temperature by the
end of this century.
In analysis of precipitation and temperature change data were used from Green
Paper which is based on IPCC scenario A2. The projected climate impacts were
estimated for 2071 – 2100 relative to 1961-1990.
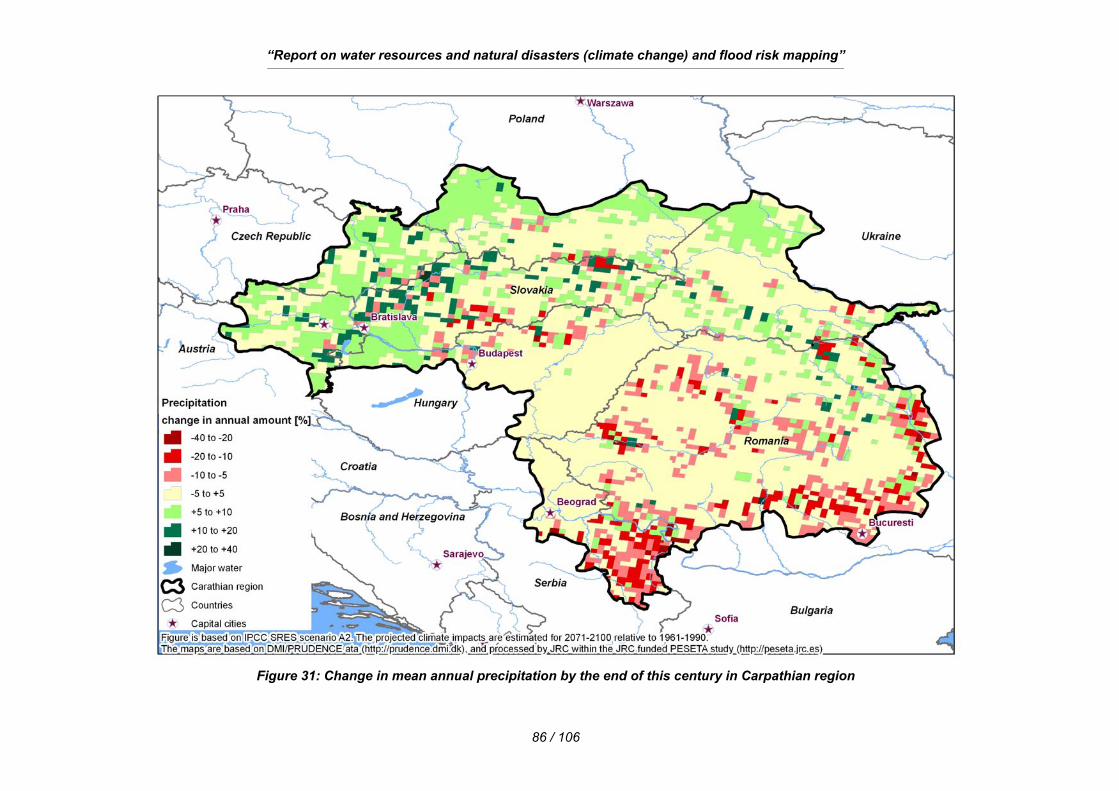
“Report on water resources and natural disasters (climate change) and flood risk mapping” ___________________________________________________________________________________________________________________________________________________________________________________________________
86 / 106
Figure 31: Change in mean annual precipitation by the end of this century in Carpathian region
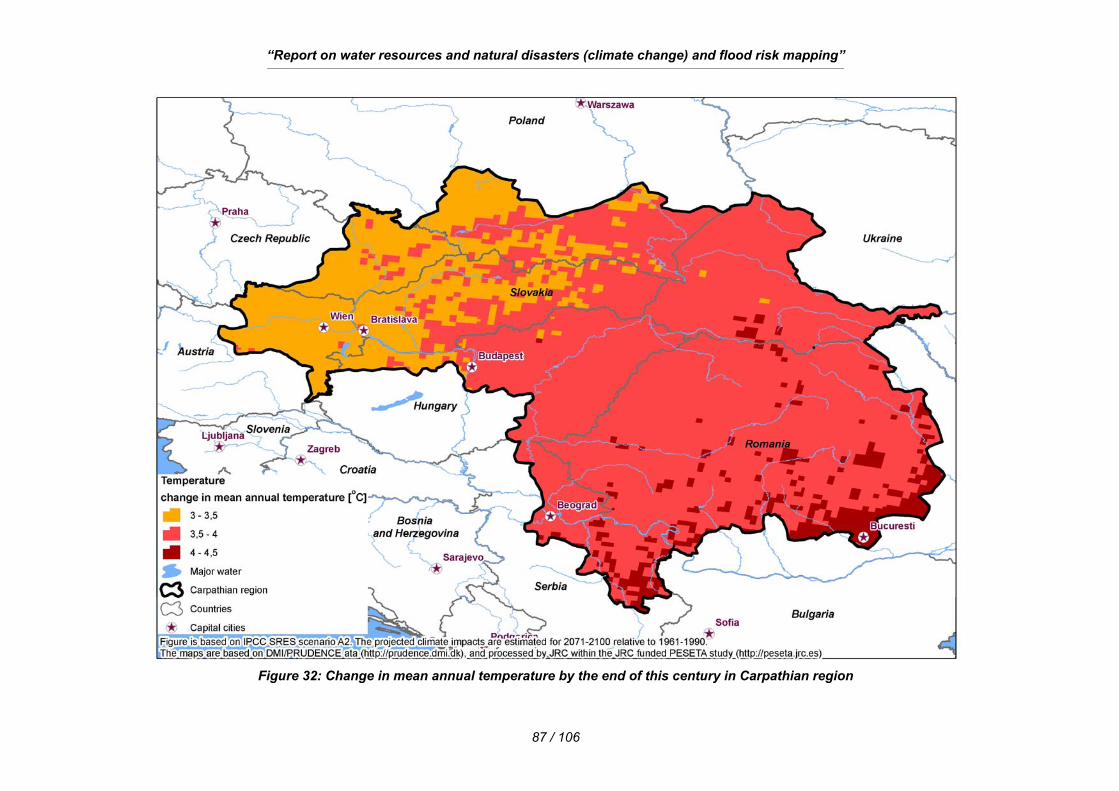
“Report on water resources and natural disasters (climate change) and flood risk mapping” ___________________________________________________________________________________________________________________________________________________________________________________________________
87 / 106
Figure 32: Change in mean annual temperature by the end of this century in Carpathian region
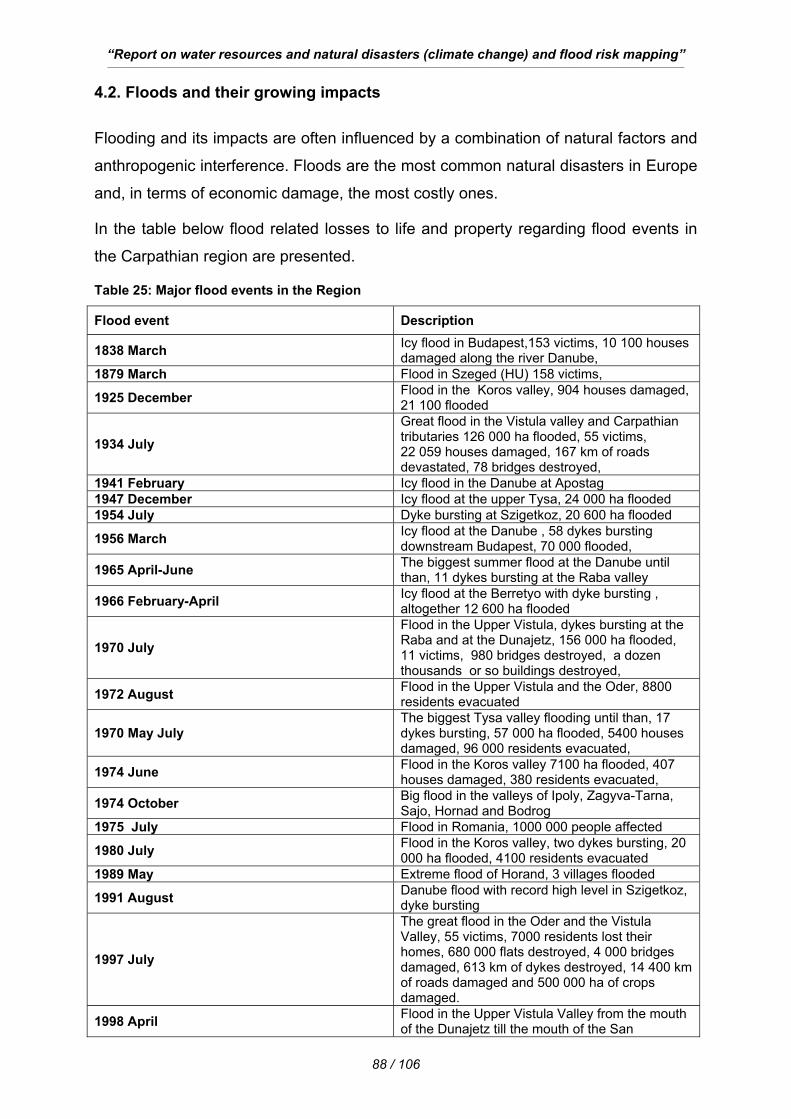
“Report on water resources and natural disasters (climate change) and flood risk mapping” ___________________________________________________________________________________________________________________________________________________________________________________________________
88 / 106
4.2. Floods and their growing impacts
Flooding and its impacts are often influenced by a combination of natural factors and
anthropogenic interference. Floods are the most common natural disasters in Europe
and, in terms of economic damage, the most costly ones.
In the table below flood related losses to life and property regarding flood events in
the Carpathian region are presented.
Table 25: Major flood events in the Region
Flood event Description
1838 March Icy flood in Budapest,153 victims, 10 100 houses damaged along the river Danube,
1879 March Flood in Szeged (HU) 158 victims,
1925 December Flood in the Koros valley, 904 houses damaged, 21 100 flooded
1934 July Great flood in the Vistula valley and Carpathian tributaries 126 000 ha flooded, 55 victims, 22 059 houses damaged, 167 km of roads devastated, 78 bridges destroyed,
1941 February Icy flood in the Danube at Apostag 1947 December Icy flood at the upper Tysa, 24 000 ha flooded 1954 July Dyke bursting at Szigetkoz, 20 600 ha flooded
1956 March Icy flood at the Danube , 58 dykes bursting downstream Budapest, 70 000 flooded,
1965 April-June The biggest summer flood at the Danube until than, 11 dykes bursting at the Raba valley
1966 February-April Icy flood at the Berretyo with dyke bursting , altogether 12 600 ha flooded
1970 July Flood in the Upper Vistula, dykes bursting at the Raba and at the Dunajetz, 156 000 ha flooded, 11 victims, 980 bridges destroyed, a dozen thousands or so buildings destroyed,
1972 August Flood in the Upper Vistula and the Oder, 8800 residents evacuated
1970 May July The biggest Tysa valley flooding until than, 17 dykes bursting, 57 000 ha flooded, 5400 houses damaged, 96 000 residents evacuated,
1974 June Flood in the Koros valley 7100 ha flooded, 407 houses damaged, 380 residents evacuated,
1974 October Big flood in the valleys of Ipoly, Zagyva-Tarna, Sajo, Hornad and Bodrog
1975 July Flood in Romania, 1000 000 people affected
1980 July Flood in the Koros valley, two dykes bursting, 20 000 ha flooded, 4100 residents evacuated
1989 May Extreme flood of Horand, 3 villages flooded
1991 August Danube flood with record high level in Szigetkoz, dyke bursting
1997 July
The great flood in the Oder and the Vistula Valley, 55 victims, 7000 residents lost their homes, 680 000 flats destroyed, 4 000 bridges damaged, 613 km of dykes destroyed, 14 400 km of roads damaged and 500 000 ha of crops damaged.
1998 April Flood in the Upper Vistula Valley from the mouth of the Dunajetz till the mouth of the San
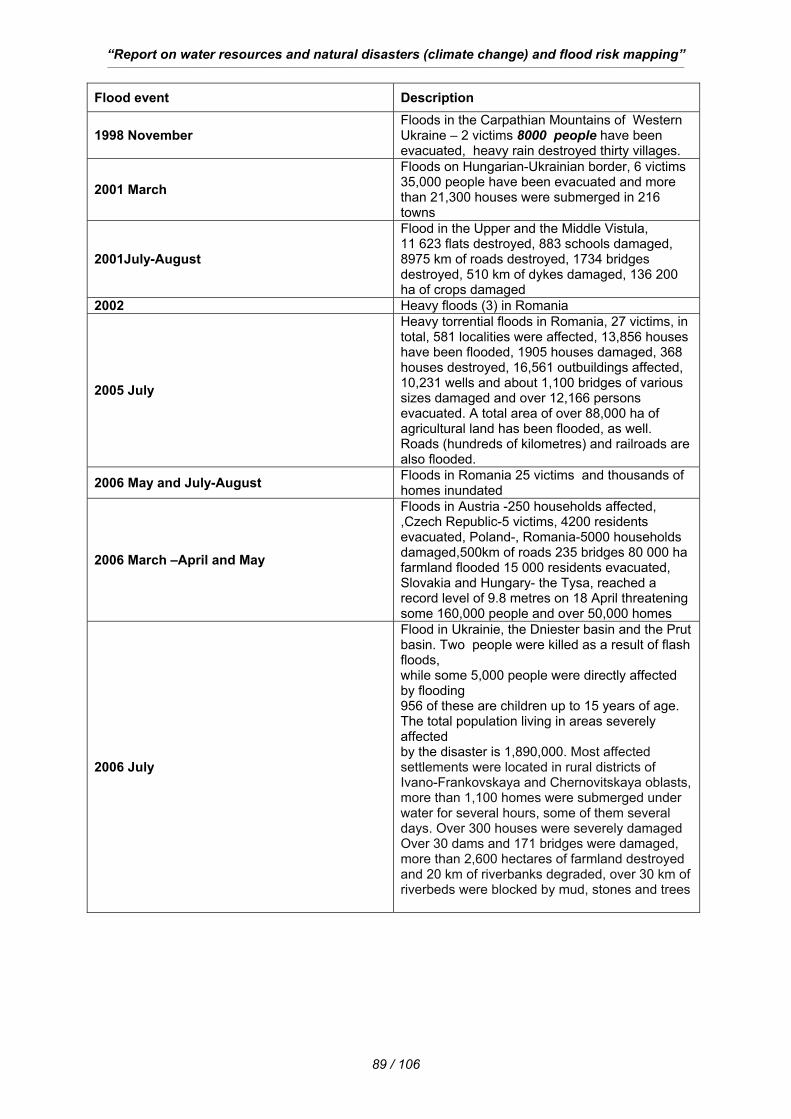
“Report on water resources and natural disasters (climate change) and flood risk mapping” ___________________________________________________________________________________________________________________________________________________________________________________________________
89 / 106
Flood event Description
1998 November Floods in the Carpathian Mountains of Western Ukraine – 2 victims 8000 people have been evacuated, heavy rain destroyed thirty villages.
2001 March Floods on Hungarian-Ukrainian border, 6 victims 35,000 people have been evacuated and more than 21,300 houses were submerged in 216 towns
2001July-August
Flood in the Upper and the Middle Vistula, 11 623 flats destroyed, 883 schools damaged, 8975 km of roads destroyed, 1734 bridges destroyed, 510 km of dykes damaged, 136 200 ha of crops damaged
2002 Heavy floods (3) in Romania
2005 July
Heavy torrential floods in Romania, 27 victims, in total, 581 localities were affected, 13,856 houses have been flooded, 1905 houses damaged, 368 houses destroyed, 16,561 outbuildings affected, 10,231 wells and about 1,100 bridges of various sizes damaged and over 12,166 persons evacuated. A total area of over 88,000 ha of agricultural land has been flooded, as well. Roads (hundreds of kilometres) and railroads are also flooded.
2006 May and July-August Floods in Romania 25 victims and thousands of homes inundated
2006 March –April and May
Floods in Austria -250 households affected, ,Czech Republic-5 victims, 4200 residents evacuated, Poland-, Romania-5000 households damaged,500km of roads 235 bridges 80 000 ha farmland flooded 15 000 residents evacuated, Slovakia and Hungary- the Tysa, reached a record level of 9.8 metres on 18 April threatening some 160,000 people and over 50,000 homes
2006 July
Flood in Ukrainie, the Dniester basin and the Prut basin. Two people were killed as a result of flash floods, while some 5,000 people were directly affected by flooding 956 of these are children up to 15 years of age. The total population living in areas severely affected by the disaster is 1,890,000. Most affected settlements were located in rural districts of Ivano-Frankovskaya and Chernovitskaya oblasts, more than 1,100 homes were submerged under water for several hours, some of them several days. Over 300 houses were severely damaged Over 30 dams and 171 bridges were damaged, more than 2,600 hectares of farmland destroyed and 20 km of riverbanks degraded, over 30 km of riverbeds were blocked by mud, stones and trees
“Report on water resources and natural disasters (climate change) and flood risk mapping” ___________________________________________________________________________________________________________________________________________________________________________________________________
90 / 106
Eastern Europe is the region for which the greatest number of flood disasters is
reported (93 disastrous floods).
Generally the reported number of disasters caused by floods has dramatically
increased in the UN European Macro-Region, from 31 in the period 1973 – 1982 to
179 during the last decade. Within the region of Eastern Europe (Belarus, Bulgaria,
Czech Republic, Hungary, Poland, Moldova, Romania, Russian Federation, Slovakia
and Ukraine); the number of flood disaster reported increased from about 8 in 1973-
1982, 20 in 1983-1992 up to 70 in 1993-2002. Romania is on the top of rank for the
number of disastrous floods, far before the other Eastern Europe countries. Fifteen
floods are reported for the last 30 years but 13 occurred since 1996 and their number
increased over the years. The highest annual number of flood was reported in 2002.
In that year three floods occurred.
For the 1993-2002 decade the most deadly floods occurred in 2002 - Poland (55
deaths in 1997) and Slovakia (54 deaths in 1998). The remaining severe floods, with
number of deaths between 10 to 30 occurred Romania (1997, 1998, twice in 1999,
2000, 2002), Czech Republic (1997 and 2002), Poland (2001) and Ukraine (1998).
Within the decade 1993-2002 Romania was affected be severe floods, with more
than ten deaths, virtually each year since 1997.
Total number of people affected by severe floods in Eastern Europe has raised from
1.000.000 in 1973-1982 to more than 5 000 000 in 1993-2002.
The total amount of damages reported for this region (Eastern Europe defined as
above) is around 12.5 billion Euros (2002). Total amount of reported damages in
Eastern Europe in 1983-1992 was more than 25 000 000 (2002 Euros X 1000) and in
1993-2002 near 10 000 000 (2002 Euros X 1000). It is important to underline that in
the decade 1983-1992 the former Soviet Union and Russia (outside the Carpathian
region) accounted for 52% (8 floods) of the reported damages, Poland for 26%
(1 flood) and Romania for 21% (1 flood). During the decade 1993-2002 two floods in
Poland accounted for 52% of the reported damages, two other floods in the Czech
Republic for 22 %. For the three decades 1973-2002 the amount of damages is the
highest for Poland (5.7 billion Euros) followed Czech Republic (2.1 billion) and
Romania (1.2 billion).
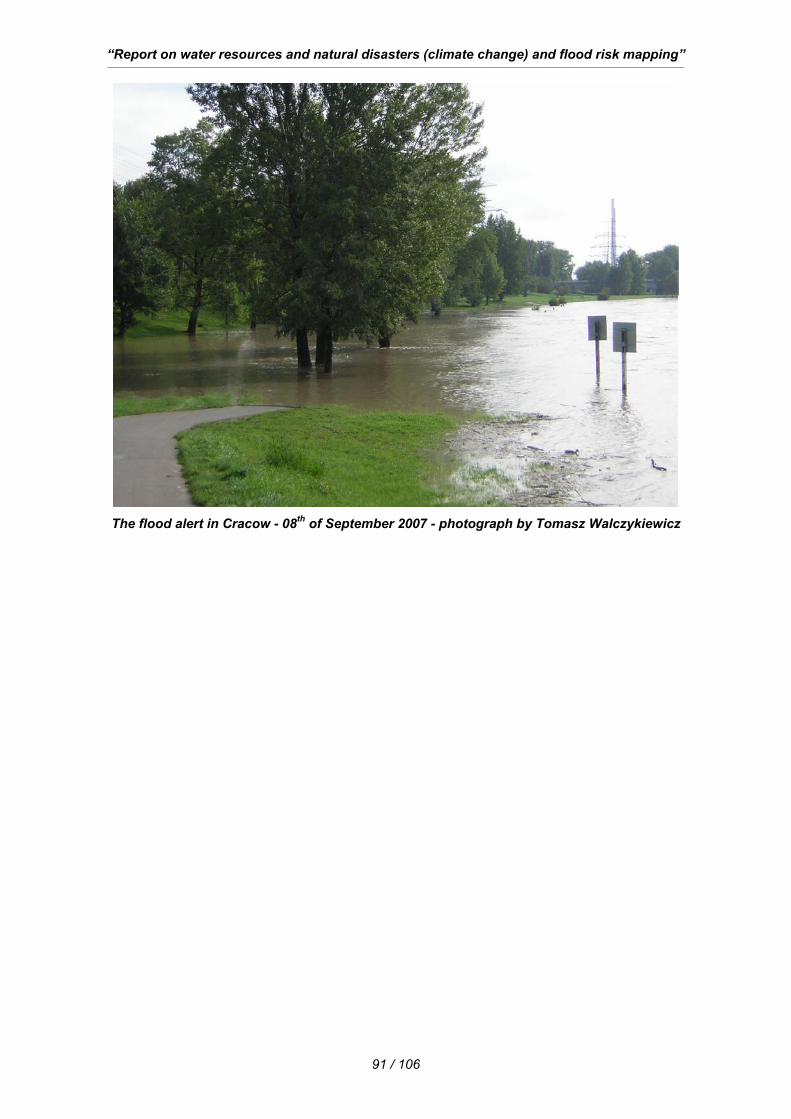
“Report on water resources and natural disasters (climate change) and flood risk mapping” ___________________________________________________________________________________________________________________________________________________________________________________________________
91 / 106
The flood alert in Cracow - 08th of September 2007 - photograph by Tomasz Walczykiewicz
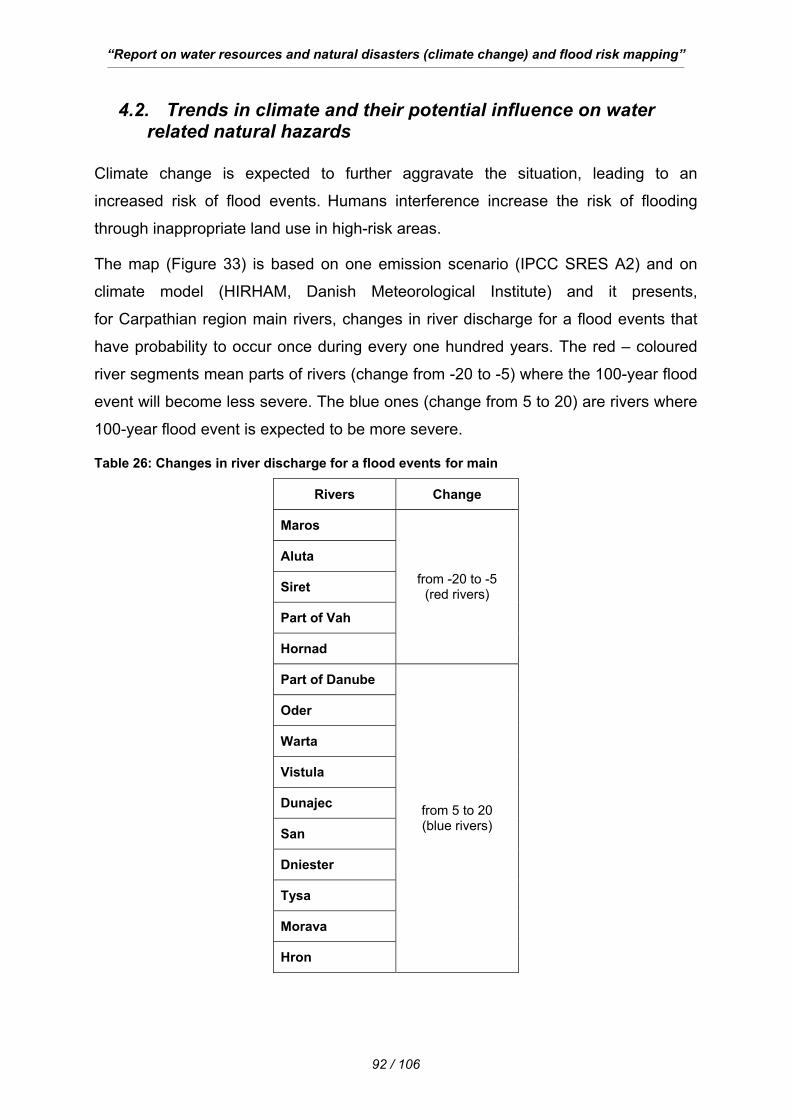
“Report on water resources and natural disasters (climate change) and flood risk mapping” ___________________________________________________________________________________________________________________________________________________________________________________________________
92 / 106
4.2. Trends in climate and their potential influence on water related natural hazards
Climate change is expected to further aggravate the situation, leading to an
increased risk of flood events. Humans interference increase the risk of flooding
through inappropriate land use in high-risk areas.
The map (Figure 33) is based on one emission scenario (IPCC SRES A2) and on
climate model (HIRHAM, Danish Meteorological Institute) and it presents,
for Carpathian region main rivers, changes in river discharge for a flood events that
have probability to occur once during every one hundred years. The red – coloured
river segments mean parts of rivers (change from -20 to -5) where the 100-year flood
event will become less severe. The blue ones (change from 5 to 20) are rivers where
100-year flood event is expected to be more severe.
Table 26: Changes in river discharge for a flood events for main
Rivers Change
Maros
Aluta
Siret
Part of Vah
Hornad
from -20 to -5 (red rivers)
Part of Danube
Oder
Warta
Vistula
Dunajec
San
Dniester
Tysa
Morava
Hron
from 5 to 20 (blue rivers)
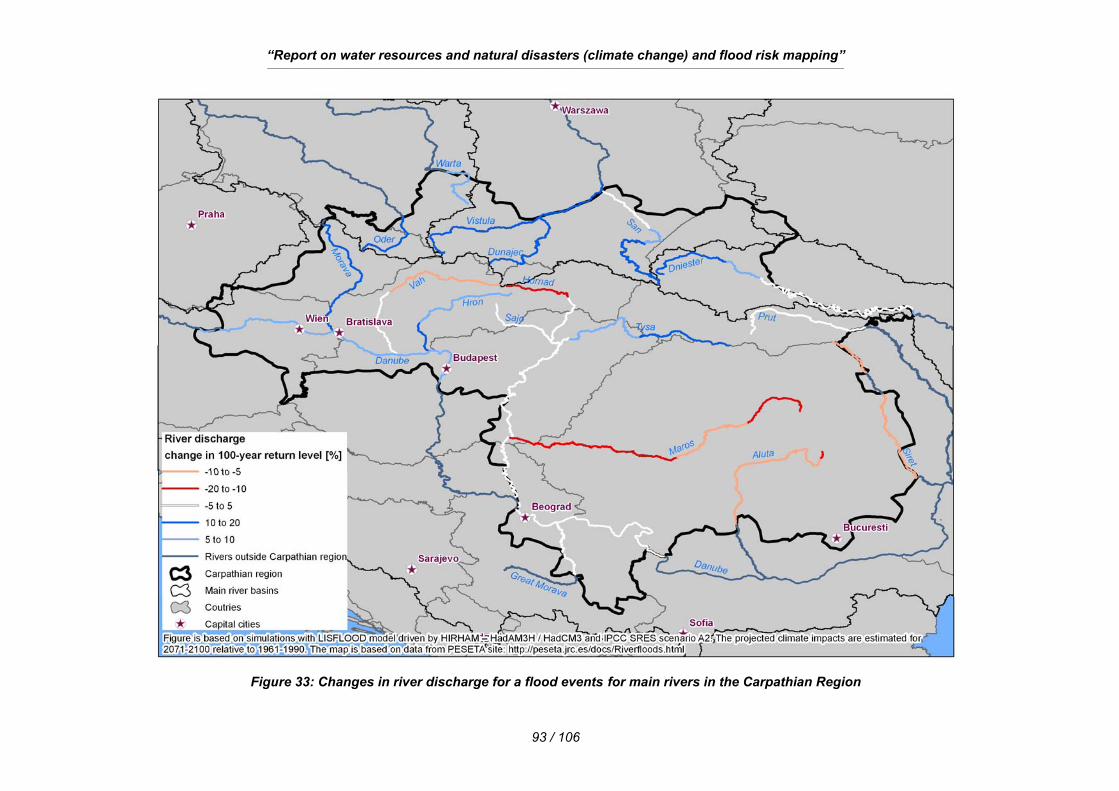
“Report on water resources and natural disasters (climate change) and flood risk mapping” ___________________________________________________________________________________________________________________________________________________________________________________________________
93 / 106
Figure 33: Changes in river discharge for a flood events for main rivers in the Carpathian Region
“Report on water resources and natural disasters (climate change) and flood risk mapping” ___________________________________________________________________________________________________________________________________________________________________________________________________
94 / 106
5. Significant water management issues
5.1. Water use The activities of inhabitants in 8 countries have an impact on the natural environment
of the Carpathian region and are also leading to serious problems with water quality
and quantity, and significant reductions in biodiversity in certain parts of the region.
The main problems are:
• Excessive nutrient loads (particularly nitrogen and phosphorous)
• Overexploitation of surface water and groundwater resources
• Changes in river flow patterns (hydromorphological alterations) and its effect on
sediment transportation
• Contamination with hazardous substances (including heavy metals, oil, oxygen
depleting substances and microbiological toxins)
• Accidental pollution
• Degradation and loss of wetlands
Adequate quantities of sufficient quality have to be available in the wilderness to
sustain wildlife, plants and unique ecosystems. The most significant and widespread
pressures are diffuse pollution, physical degradation of water ecosystems (physical
modifications).
Too much inadequately treated waste water still ends up the main rivers within
Carpathian region: the Danube, the Vistula ,the Oder, the Dniester putting at risk the
drinking water supply for millions of people, and also leading to problems for
irrigation, industry, fishing and tourism. The actual percentage of water bodies
meeting all the Water Framework Directive objectives is rather low.
Diffuse pollution of agricultural origin is a major threat for water in this region.
The main pollution problem is the excessive volumes of nutrients within this territory,
mainly from agricultural fertilisers and unthreatened or not adequately threatened
municipal sewage, including household products.
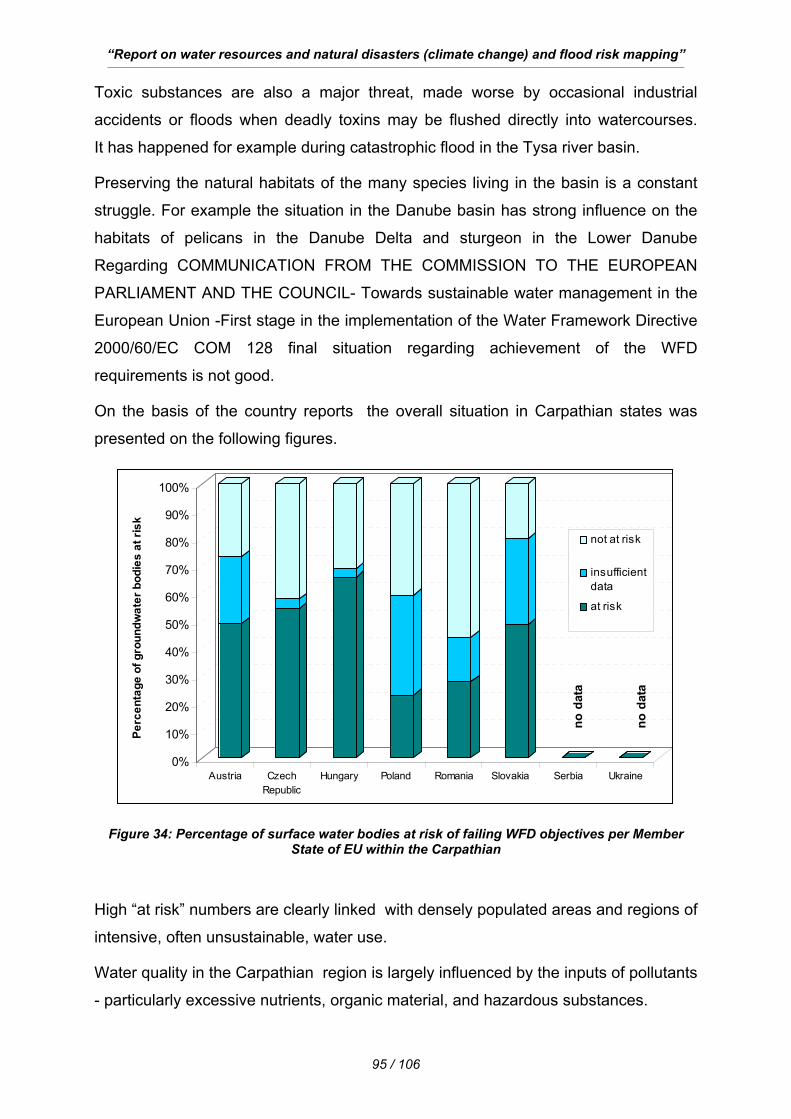
“Report on water resources and natural disasters (climate change) and flood risk mapping” ___________________________________________________________________________________________________________________________________________________________________________________________________
95 / 106
Toxic substances are also a major threat, made worse by occasional industrial
accidents or floods when deadly toxins may be flushed directly into watercourses.
It has happened for example during catastrophic flood in the Tysa river basin.
Preserving the natural habitats of the many species living in the basin is a constant
struggle. For example the situation in the Danube basin has strong influence on the
habitats of pelicans in the Danube Delta and sturgeon in the Lower Danube
Regarding COMMUNICATION FROM THE COMMISSION TO THE EUROPEAN
PARLIAMENT AND THE COUNCIL- Towards sustainable water management in the
European Union -First stage in the implementation of the Water Framework Directive
2000/60/EC COM 128 final situation regarding achievement of the WFD
requirements is not good.
On the basis of the country reports the overall situation in Carpathian states was
presented on the following figures.
no d
ata
no d
ata
0%
10%
20%
30%
40%
50%
60%
70%
80%
90%
100%
Perc
enta
ge o
f gro
undw
ater
bod
ies
at ri
sk
Austria CzechRepublic
Hungary Poland Romania Slovakia Serbia Ukraine
not at risk
insufficientdata
at risk
Figure 34: Percentage of surface water bodies at risk of failing WFD objectives per Member State of EU within the Carpathian
High “at risk” numbers are clearly linked with densely populated areas and regions of
intensive, often unsustainable, water use.
Water quality in the Carpathian region is largely influenced by the inputs of pollutants
- particularly excessive nutrients, organic material, and hazardous substances.

“Report on water resources and natural disasters (climate change) and flood risk mapping” ___________________________________________________________________________________________________________________________________________________________________________________________________
96 / 106
The main rivers of the Carpathian region flow towards the Black Sea and the Baltic
Sea and conditions in their waters change considerably. From the upper to the lower
reaches of the rivers is monitored significant overall increases in the following
determinants:
• suspended solids
• organic pollution (expressed by COD)
• organochlorine pesticides (Lindane, DDT)
• concentrations of heavy metals (especially cadmium, and with the exception of
manganese, for which the maxima were observed in the middle Danube)
• concentrations of nitrite and ammonium (however, the concentration of nitrate
decreases)
• phosphorus (both total phosphorus, and phosphate)
• conductivity (caused by dissolved salts)
• alkalinity
Not proper agricultural activities are a major source of nutrients. Agricultural
production is expected to increase in many parts of the Danube Basin as well as the
Vistula and the Oder basin after the EU enlargement, which will probably lead to
increased nutrient discharges from this sector.
Inputs of nutrients from urban areas, smaller municipalities and scattered
settlements, as well as via atmospheric deposition must also be take into account.
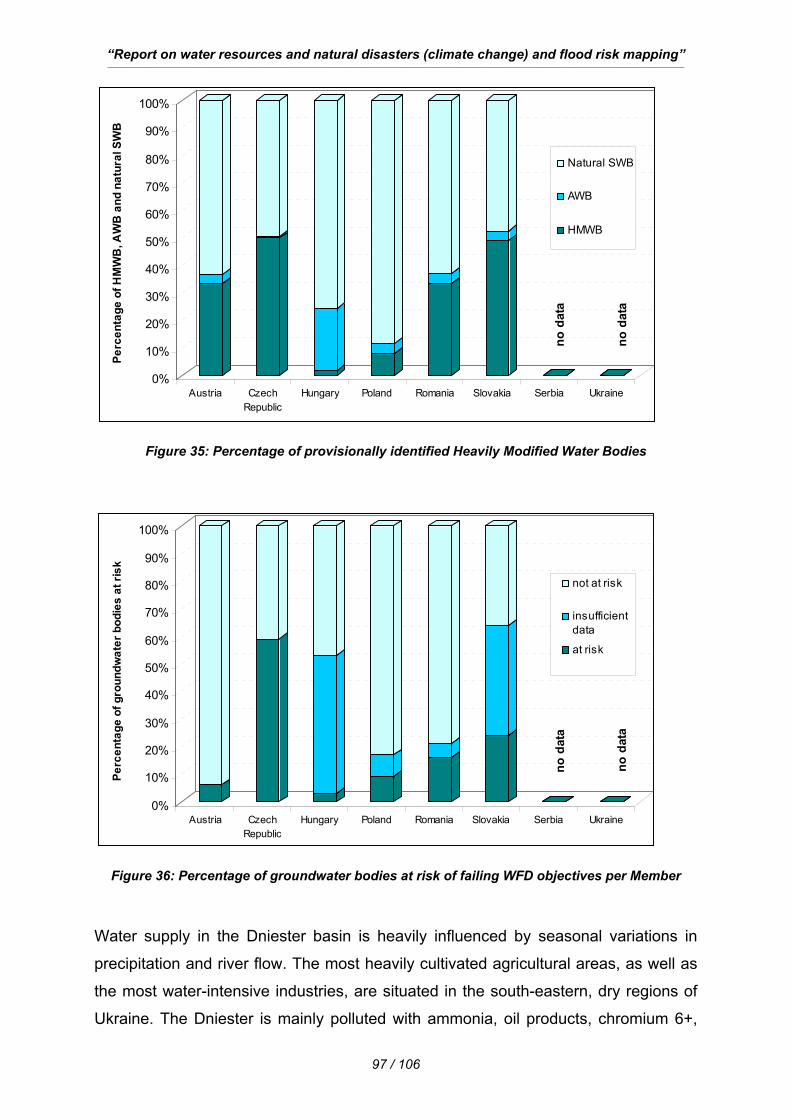
“Report on water resources and natural disasters (climate change) and flood risk mapping” ___________________________________________________________________________________________________________________________________________________________________________________________________
97 / 106
no d
ata
no d
ata
0%
10%
20%
30%
40%
50%
60%
70%
80%
90%
100%Pe
rcen
tage
of H
MW
B, A
WB
and
nat
ural
SW
B
Austria CzechRepublic
Hungary Poland Romania Slovakia Serbia Ukraine
Natural SWB
AWB
HMWB
Figure 35: Percentage of provisionally identified Heavily Modified Water Bodies
no d
ata
no d
ata
0%
10%
20%
30%
40%
50%
60%
70%
80%
90%
100%
Perc
enta
ge o
f gro
undw
ater
bod
ies
at ri
sk
Austria CzechRepublic
Hungary Poland Romania Slovakia Serbia Ukraine
not at risk
insufficientdata
at risk
Figure 36: Percentage of groundwater bodies at risk of failing WFD objectives per Member
Water supply in the Dniester basin is heavily influenced by seasonal variations in
precipitation and river flow. The most heavily cultivated agricultural areas, as well as
the most water-intensive industries, are situated in the south-eastern, dry regions of
Ukraine. The Dniester is mainly polluted with ammonia, oil products, chromium 6+,
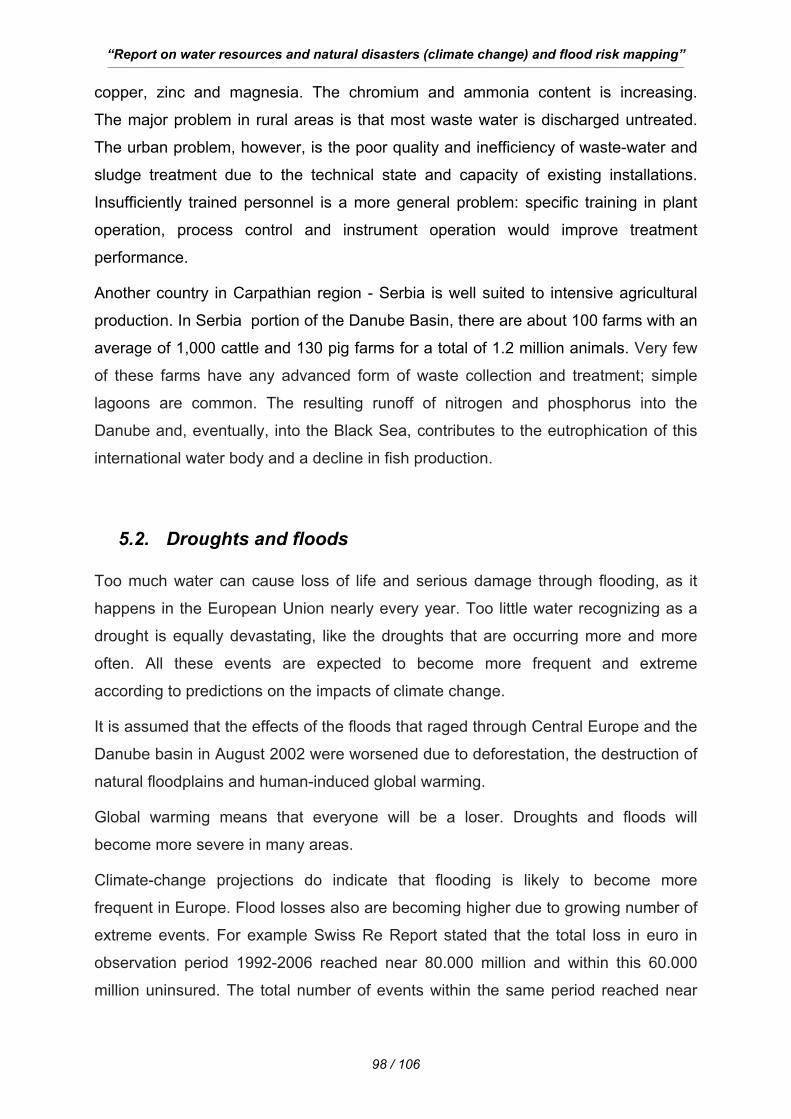
“Report on water resources and natural disasters (climate change) and flood risk mapping” ___________________________________________________________________________________________________________________________________________________________________________________________________
98 / 106
copper, zinc and magnesia. The chromium and ammonia content is increasing.
The major problem in rural areas is that most waste water is discharged untreated.
The urban problem, however, is the poor quality and inefficiency of waste-water and
sludge treatment due to the technical state and capacity of existing installations.
Insufficiently trained personnel is a more general problem: specific training in plant
operation, process control and instrument operation would improve treatment
performance.
Another country in Carpathian region - Serbia is well suited to intensive agricultural
production. In Serbia portion of the Danube Basin, there are about 100 farms with an
average of 1,000 cattle and 130 pig farms for a total of 1.2 million animals. Very few
of these farms have any advanced form of waste collection and treatment; simple
lagoons are common. The resulting runoff of nitrogen and phosphorus into the
Danube and, eventually, into the Black Sea, contributes to the eutrophication of this
international water body and a decline in fish production.
5.2. Droughts and floods Too much water can cause loss of life and serious damage through flooding, as it
happens in the European Union nearly every year. Too little water recognizing as a
drought is equally devastating, like the droughts that are occurring more and more
often. All these events are expected to become more frequent and extreme
according to predictions on the impacts of climate change.
It is assumed that the effects of the floods that raged through Central Europe and the
Danube basin in August 2002 were worsened due to deforestation, the destruction of
natural floodplains and human-induced global warming.
Global warming means that everyone will be a loser. Droughts and floods will
become more severe in many areas.
Climate-change projections do indicate that flooding is likely to become more
frequent in Europe. Flood losses also are becoming higher due to growing number of
extreme events. For example Swiss Re Report stated that the total loss in euro in
observation period 1992-2006 reached near 80.000 million and within this 60.000
million uninsured. The total number of events within the same period reached near
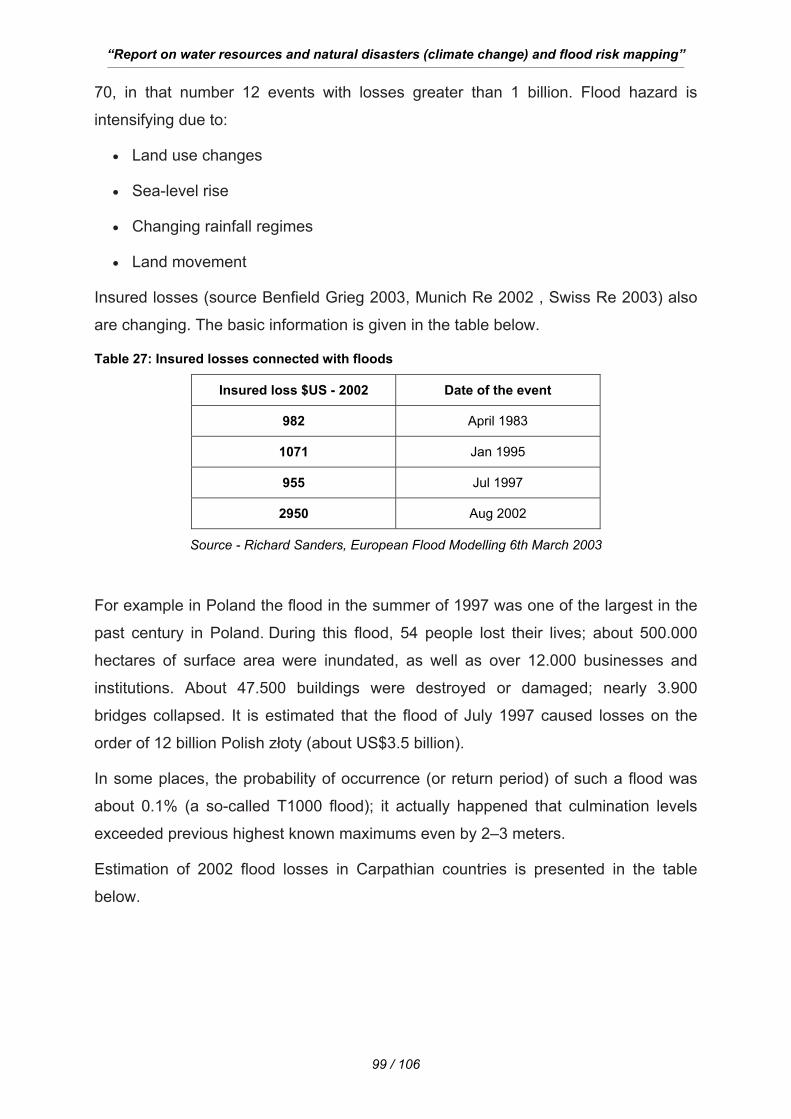
“Report on water resources and natural disasters (climate change) and flood risk mapping” ___________________________________________________________________________________________________________________________________________________________________________________________________
99 / 106
70, in that number 12 events with losses greater than 1 billion. Flood hazard is
intensifying due to:
• Land use changes
• Sea-level rise
• Changing rainfall regimes
• Land movement
Insured losses (source Benfield Grieg 2003, Munich Re 2002 , Swiss Re 2003) also
are changing. The basic information is given in the table below.
Table 27: Insured losses connected with floods
Insured loss $US - 2002 Date of the event
982 April 1983
1071 Jan 1995
955 Jul 1997
2950 Aug 2002
Source - Richard Sanders, European Flood Modelling 6th March 2003
For example in Poland the flood in the summer of 1997 was one of the largest in the
past century in Poland. During this flood, 54 people lost their lives; about 500.000
hectares of surface area were inundated, as well as over 12.000 businesses and
institutions. About 47.500 buildings were destroyed or damaged; nearly 3.900
bridges collapsed. It is estimated that the flood of July 1997 caused losses on the
order of 12 billion Polish złoty (about US$3.5 billion).
In some places, the probability of occurrence (or return period) of such a flood was
about 0.1% (a so-called T1000 flood); it actually happened that culmination levels
exceeded previous highest known maximums even by 2–3 meters.
Estimation of 2002 flood losses in Carpathian countries is presented in the table
below.
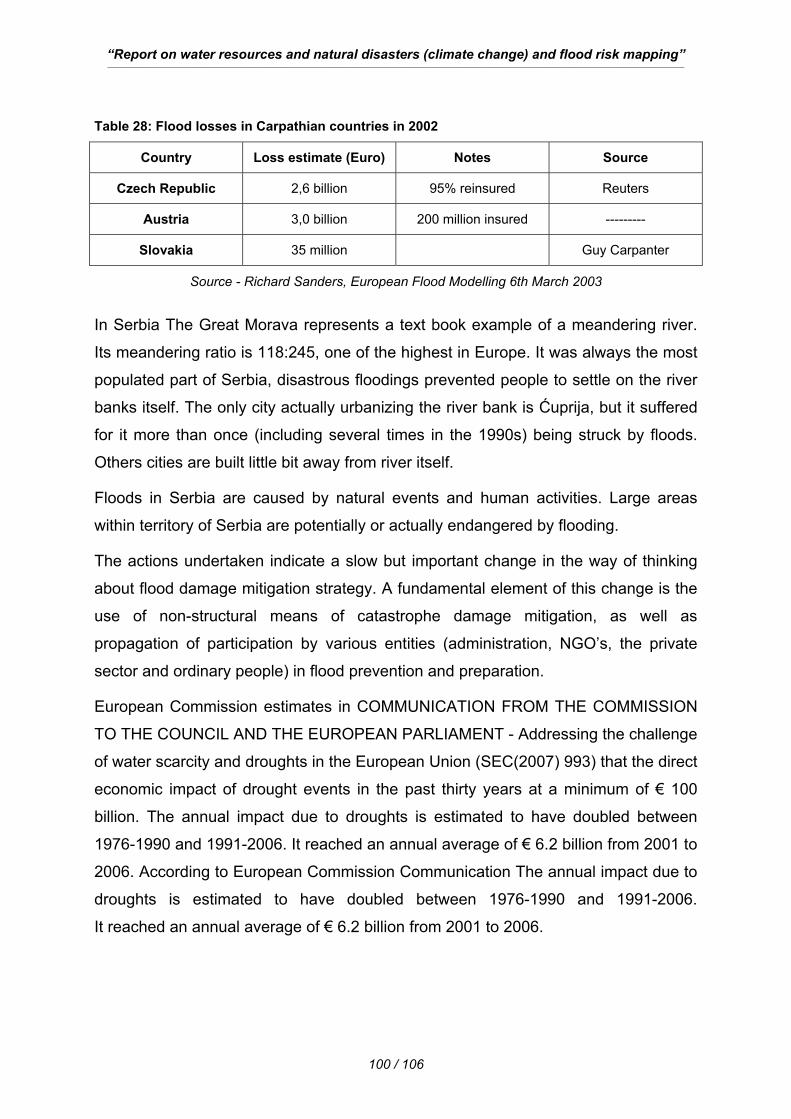
“Report on water resources and natural disasters (climate change) and flood risk mapping” ___________________________________________________________________________________________________________________________________________________________________________________________________
100 / 106
Table 28: Flood losses in Carpathian countries in 2002
Country Loss estimate (Euro) Notes Source
Czech Republic 2,6 billion 95% reinsured Reuters
Austria 3,0 billion 200 million insured ---------
Slovakia 35 million Guy Carpanter
Source - Richard Sanders, European Flood Modelling 6th March 2003
In Serbia The Great Morava represents a text book example of a meandering river.
Its meandering ratio is 118:245, one of the highest in Europe. It was always the most
populated part of Serbia, disastrous floodings prevented people to settle on the river
banks itself. The only city actually urbanizing the river bank is Ćuprija, but it suffered
for it more than once (including several times in the 1990s) being struck by floods.
Others cities are built little bit away from river itself.
Floods in Serbia are caused by natural events and human activities. Large areas
within territory of Serbia are potentially or actually endangered by flooding.
The actions undertaken indicate a slow but important change in the way of thinking
about flood damage mitigation strategy. A fundamental element of this change is the
use of non-structural means of catastrophe damage mitigation, as well as
propagation of participation by various entities (administration, NGO’s, the private
sector and ordinary people) in flood prevention and preparation.
European Commission estimates in COMMUNICATION FROM THE COMMISSION
TO THE COUNCIL AND THE EUROPEAN PARLIAMENT - Addressing the challenge
of water scarcity and droughts in the European Union (SEC(2007) 993) that the direct
economic impact of drought events in the past thirty years at a minimum of € 100
billion. The annual impact due to droughts is estimated to have doubled between
1976-1990 and 1991-2006. It reached an annual average of € 6.2 billion from 2001 to
2006. According to European Commission Communication The annual impact due to
droughts is estimated to have doubled between 1976-1990 and 1991-2006.
It reached an annual average of € 6.2 billion from 2001 to 2006.
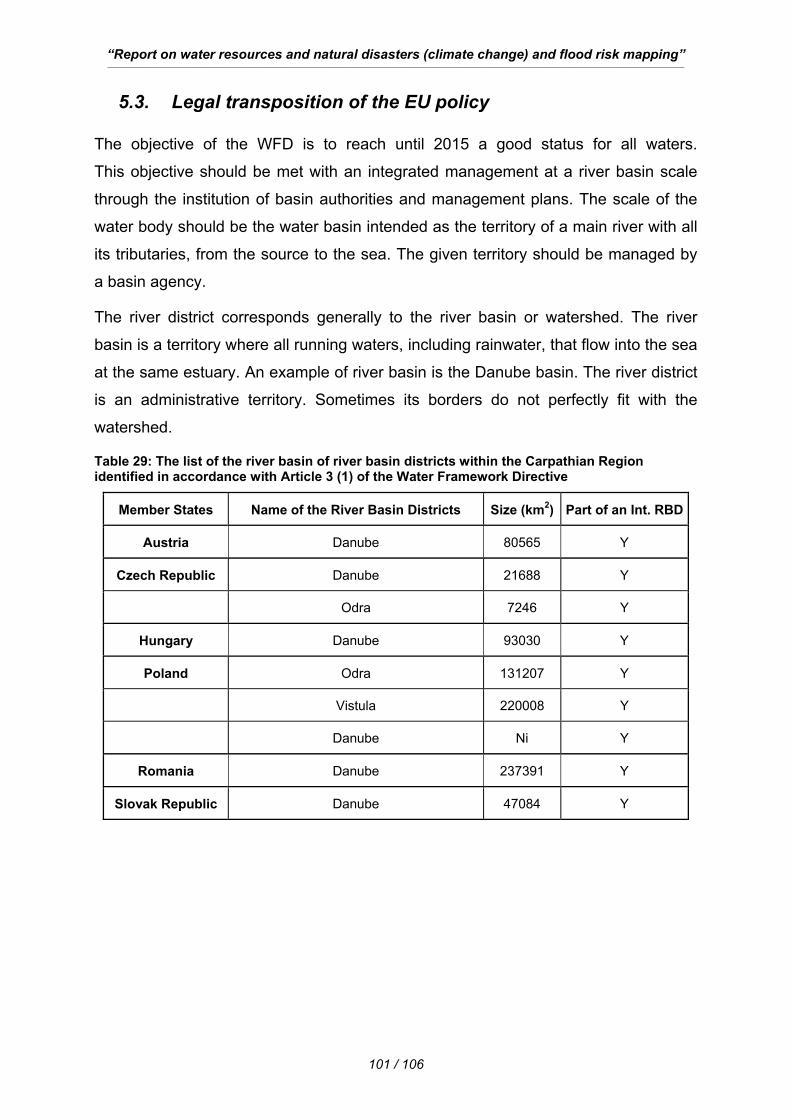
“Report on water resources and natural disasters (climate change) and flood risk mapping” ___________________________________________________________________________________________________________________________________________________________________________________________________
101 / 106
5.3. Legal transposition of the EU policy The objective of the WFD is to reach until 2015 a good status for all waters.
This objective should be met with an integrated management at a river basin scale
through the institution of basin authorities and management plans. The scale of the
water body should be the water basin intended as the territory of a main river with all
its tributaries, from the source to the sea. The given territory should be managed by
a basin agency.
The river district corresponds generally to the river basin or watershed. The river
basin is a territory where all running waters, including rainwater, that flow into the sea
at the same estuary. An example of river basin is the Danube basin. The river district
is an administrative territory. Sometimes its borders do not perfectly fit with the
watershed.
Table 29: The list of the river basin of river basin districts within the Carpathian Region identified in accordance with Article 3 (1) of the Water Framework Directive
Member States Name of the River Basin Districts Size (km2) Part of an Int. RBD
Austria Danube 80565 Y
Czech Republic Danube 21688 Y
Odra 7246 Y
Hungary Danube 93030 Y
Poland Odra 131207 Y
Vistula 220008 Y
Danube Ni Y
Romania Danube 237391 Y
Slovak Republic Danube 47084 Y
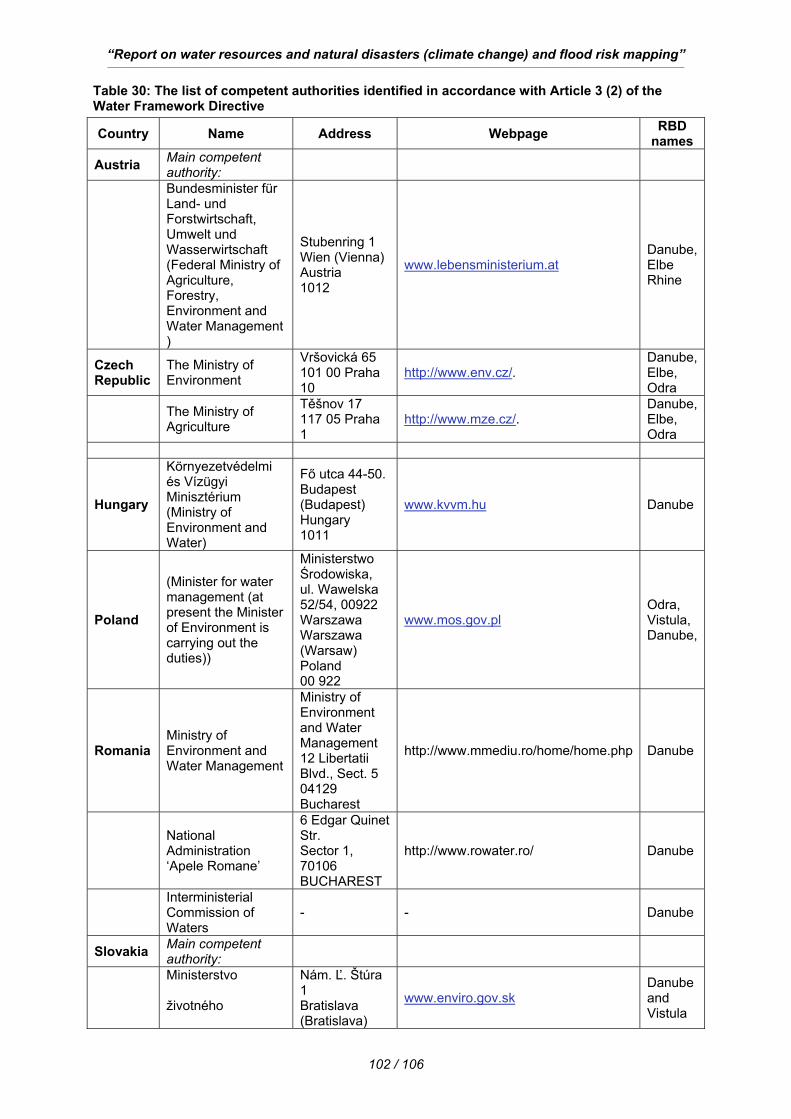
“Report on water resources and natural disasters (climate change) and flood risk mapping” ___________________________________________________________________________________________________________________________________________________________________________________________________
102 / 106
Table 30: The list of competent authorities identified in accordance with Article 3 (2) of the Water Framework Directive
Country Name Address Webpage RBD names
Austria Main competent authority:
Bundesminister für Land- und Forstwirtschaft, Umwelt und Wasserwirtschaft (Federal Ministry of Agriculture, Forestry, Environment and Water Management )
Stubenring 1 Wien (Vienna) Austria 1012
www.lebensministerium.at Danube, Elbe Rhine
Czech Republic
The Ministry of Environment
Vršovická 65 101 00 Praha 10
http://www.env.cz/. Danube, Elbe, Odra
The Ministry of Agriculture
Těšnov 17 117 05 Praha 1
http://www.mze.cz/. Danube, Elbe, Odra
Hungary
Környezetvédelmi és Vízügyi Minisztérium (Ministry of Environment and Water)
Fő utca 44-50. Budapest (Budapest) Hungary 1011
www.kvvm.hu Danube
Poland
(Minister for water management (at present the Minister of Environment is carrying out the duties))
Ministerstwo Środowiska, ul. Wawelska 52/54, 00922 Warszawa Warszawa (Warsaw) Poland 00 922
www.mos.gov.pl Odra, Vistula, Danube,
Romania Ministry of Environment and Water Management
Ministry of Environment and Water Management 12 Libertatii Blvd., Sect. 5 04129 Bucharest
http://www.mmediu.ro/home/home.php Danube
National Administration ‘Apele Romane’
6 Edgar Quinet Str. Sector 1, 70106 BUCHAREST
http://www.rowater.ro/ Danube
Interministerial Commission of Waters
- - Danube
Slovakia Main competent authority:
Ministerstvo
životného
Nám. Ľ. Štúra 1 Bratislava (Bratislava)
www.enviro.gov.sk Danube and Vistula
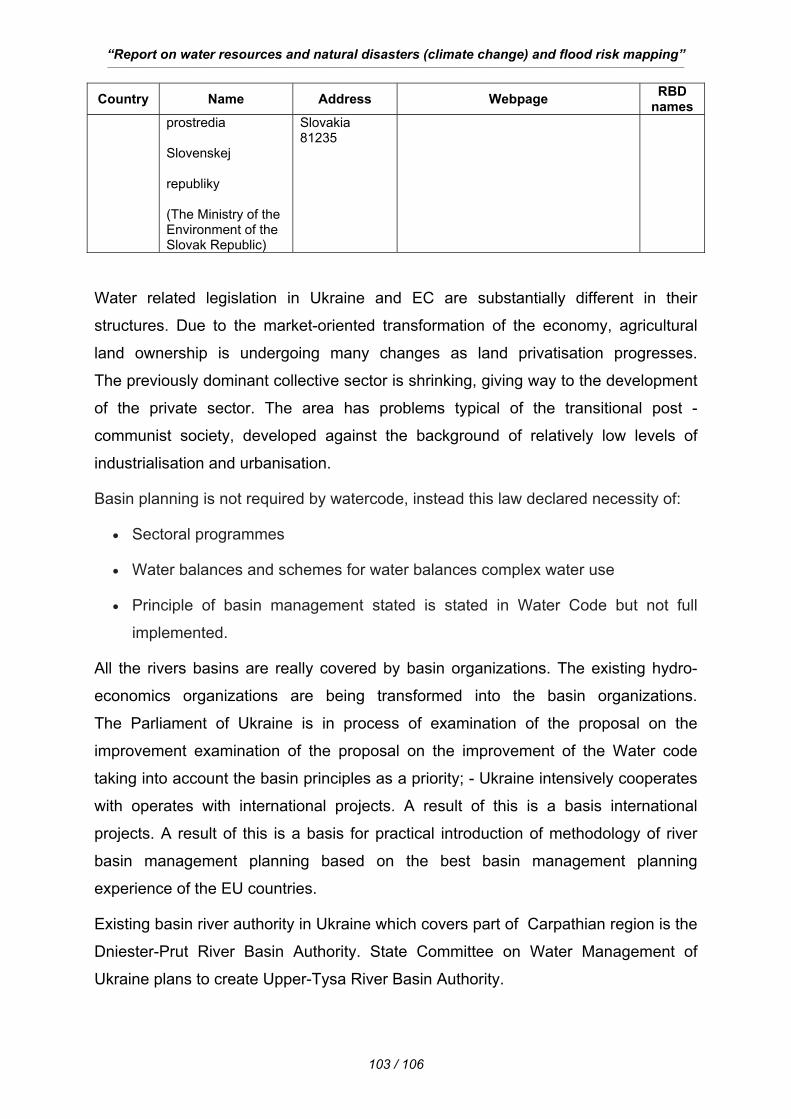
“Report on water resources and natural disasters (climate change) and flood risk mapping” ___________________________________________________________________________________________________________________________________________________________________________________________________
103 / 106
Country Name Address Webpage RBD names
prostredia
Slovenskej
republiky
(The Ministry of the Environment of the Slovak Republic)
Slovakia 81235
Water related legislation in Ukraine and EC are substantially different in their
structures. Due to the market-oriented transformation of the economy, agricultural
land ownership is undergoing many changes as land privatisation progresses.
The previously dominant collective sector is shrinking, giving way to the development
of the private sector. The area has problems typical of the transitional post -
communist society, developed against the background of relatively low levels of
industrialisation and urbanisation.
Basin planning is not required by watercode, instead this law declared necessity of:
• Sectoral programmes
• Water balances and schemes for water balances complex water use
• Principle of basin management stated is stated in Water Code but not full
implemented.
All the rivers basins are really covered by basin organizations. The existing hydro-
economics organizations are being transformed into the basin organizations.
The Parliament of Ukraine is in process of examination of the proposal on the
improvement examination of the proposal on the improvement of the Water code
taking into account the basin principles as a priority; - Ukraine intensively cooperates
with operates with international projects. A result of this is a basis international
projects. A result of this is a basis for practical introduction of methodology of river
basin management planning based on the best basin management planning
experience of the EU countries.
Existing basin river authority in Ukraine which covers part of Carpathian region is the
Dniester-Prut River Basin Authority. State Committee on Water Management of
Ukraine plans to create Upper-Tysa River Basin Authority.
“Report on water resources and natural disasters (climate change) and flood risk mapping” ___________________________________________________________________________________________________________________________________________________________________________________________________
104 / 106
The Serbian Law on Waters covers protection of waters, utilization and management
of waters, goods of general interest, conditions and methods for performing water-
related activities, organization and financing of such activities, and supervision and
monitoring for enforcement. The enforcement of the Law refers to surface and
groundwater, including drinking water, thermal and mineral waters, border and trans-
boundary water flows, and inter-Republic water bodies within the boundaries of
Serbia.
Like the body of law, water management institutions exist at the federal and republic
levels. In the 1990s the water management system in the pre-existing Federal
Republic of Yugoslavia was revamped from one that was very decentralized and
developed on the hydrographic units, to one that is more strictly centralized and built
according to the model of a state-centralized system. The State Water Management
Company “Srbijavode” is the key institutional body of water management in Serbia.
“Report on water resources and natural disasters (climate change) and flood risk mapping” ___________________________________________________________________________________________________________________________________________________________________________________________________
105 / 106
6. Reference material River Basins Management Plans National Report 2004 Romania
River Basins Management Plans – National Report Poland
Danube River Basin DistrictPart B - Report 2003 Serbia and Montenegro
Danube Basin Analysis (WFD Roof Report 2004)-ICPDR 2005
OSCE/UNECE Project: Transboundary Co-operation and Sustainable Management
of the Dniester River - 2005
EU Wasserrahmenrichtlinie 2000/60/EG Österreichischer Bericht über die
Zuständigen Behörden 2004
Report of the Slovak Republic processed for European Commission in line with
Water Framework Directive, Article 3 and Annex I Developed by: The Ministry of the
Environment of the Slovak Republic, Water Research Institute, Slovak
Hydrometeorological Institute, Slovak Environmental Agency June, 2004
Správa Slovenskej republiky o stave implementácie Rámcovej smernice o vode
spracovaná pre Európsku komisiu v súlade s článkom 5, prílohy II a prílohy III a
článkom 6, prílohy IV RSV
Water Management in Hungary- www.ovf.hu
The Tisza River Project Real-life scale integrated catchment models for supporting
water- and environmental management decisions Contract No: EVK1-CT-2001-
00099
First National Report of the Republic of Hungary on the implementation of the United
Nations Convention to Combat Desertification-2002
Flood hazard in Europe in a changing climate JRC EC- emission scenario (IPCC
SRES A2) and one climate model (HIRHAM, Danish Meteorological Institute).- 2007
EC JRC IPTS
GREEN PAPER FROM THE COMMISSION TO THE COUNCIL, THE EUROPEAN
PARLIAMENT, THE EUROPEAN ECONOMIC AND SOCIAL COMMITTEE AND
THE COMMITTEE OF THE REGIONS Adapting to climate change in Europe –
options for EU action Brussels, 29.6.2007 COM(2007) 354 final
Climate change and water adaptation issues- EEA Technical report No 2/2007
“Report on water resources and natural disasters (climate change) and flood risk mapping” ___________________________________________________________________________________________________________________________________________________________________________________________________
106 / 106
PESETA Projections of economic impacts of climate change in sectors of Europe
based on bottom-up analysis Institute of Environment and Sustainability 2006
Impacts of Europe's changing climate - EEA Report No 2/2004
Three decades of floods in Europe : a preliminary analysis of EMDAT data. Philippe
Hoyois, Debarati Guha-Sapir. WHO collaborating Centre for Research on the
Epidemiology of Disasters (CRED), Catholique University of Louvain.
Sustainable water use in Europe Part 3: Extreme hydrological events: floods and
droughts-Environmental issue report No 21 EEA, Copenhagen, 2001
2006 Floods in the Danube River Basin Working paper Vienna, July 2006
Bogdanovic, S. 2001. Federal Republic of Yugoslavia: Prospective Change in the
Water Management System. Paper presented at the AWRA/WLRI-University of
Dundee International Specialty Conference on Globalization and Water Resource
Management. Novi Sad, Serbia
Government of Serbia and Montenegro. 2000. Serbia Report on the State of
Environment for 2000 and Priorities in 2001 for Serbia. Ministry for Protection of
Natural Resources and Environment. Belgrade, Serbia and Montenegro.
Government of Serbia and Montenegro. 2001. Breaking with the Past: The Path to
Stability and Growth. Belgrade, Serbia and Montenegro.
United Nations Economic Commission for Europe. 2002. Environmental Performance
Review of Serbia and Montenegro. UNECE. Geneva, Switzerland.
Recommended