Hindawi Publishing CorporationInternational Journal of PhotoenergyVolume 2013, Article ID 583163, 6 pageshttp://dx.doi.org/10.1155/2013/583163
Research ArticleMaximum Power Point Tracking Method Based on ModifiedParticle Swarm Optimization for Photovoltaic Systems
Kuei-Hsiang Chao, Long-Yi Chang, and Hsueh-Chien Liu
Department of Electrical Engineering, National Chin-Yi University of Technology, No. 57, Section 2, Zhongshan Road,Taiping Distatrict, Taichung 41170, Taiwan
Correspondence should be addressed to Kuei-Hsiang Chao; [email protected]
Received 9 June 2013; Accepted 20 September 2013
Academic Editor: Adel M. Sharaf
Copyright © 2013 Kuei-Hsiang Chao et al. This is an open access article distributed under the Creative Commons AttributionLicense, which permits unrestricted use, distribution, and reproduction in any medium, provided the original work is properlycited.
This study investigated the output characteristics of photovoltaic module arrays with partial module shading. Accordingly, wepresented a maximum power point tracking (MPPT) method that can effectively track the global optimum of multipeak curves.This method was based on particle swarm optimization (PSO).The concept of linear decreases in weighting was added to improvethe tracking performance of the maximum power point tracker. Simulation results were used to verify that this method couldsuccessfully track maximum power points in the output characteristic curves of photovoltaic modules with multipeak values. Theresults also established that the performance of the modified PSO-based MPPT method was superior to that of conventional PSOmethods.
1. Introduction
The output power of photovoltaic (PV) systems is heavilyinfluenced by irradiation and temperature. Thus, the outputpower of these systems presents nonlinear changes. Maxi-mum power point tracking (MPPT) must be incorporated tostabilize the output power at maximum power points. Thisresearch topic is critical for photovoltaic power generationsystems.
The voltage feedback method [1] is the simplest of conve-ntionalMPPTmethods. However, this method requires priortesting of maximum power point (MPP) voltage. In add-ition, MPPs cannot be tracked when the photovoltaic mod-ules deteriorate and cause the MPPs to change unless re-measurement is performed. The framework of the constantvoltage tracking method [2, 3] is simple and does notrequire complex formulas.This method employs the extremesimilarity of MPP voltages under varying amounts of irra-diation, using MPP voltage under standard test conditionsas reference points to set the operation of the photovoltaicmodule arrays at these points. However, when the amount ofirradiation is low or when photovoltaic module temperatureschange, the difference in values between theMPP voltage andthe reference voltage becomes substantial, reducing tracking
accuracy.Theperturb and observemethod [4] uses periodicalincreases or decreases in voltage to perturb the system. Ifthese perturbations increase the output power, the same trendis used to change (i.e., increase or decrease) voltage thefollowing time. If output power decreases, the reverse trendis used to change voltage. However, this method is unableto track MPPs accurately. In addition, the method osci-llates near the MPP and increases tracking losses, therebyaffecting power generation efficiency. These conventionalmethods only perform MPPT on module arrays with single-peak characteristic curves. When multipeak values appear inthe characteristic curves, thesemethods frequently track localMPPs and miss global MPPs.
Recently, numerous scholars have presented intelligentMPPT methods [5–11] for photovoltaic module arrays, bothto track MPPs accurately and to improve the dynamic andsteady-state tracking performance. However, these methodsare applicable only to MPPT in photovoltaic module arrayswithout shading. Nevertheless, the appearance of multi-peak output curves because of partial module shading inphotovoltaic module arrays is common.Therefore, the devel-opment of an algorithm for accurately tracking the trueMPPs of complex and nonlinear output curves is crucial.Reference [12] presented a MPP tracker based on particle
2 International Journal of Photoenergy
2
1.6
1.2
0.8
0.4
00 20 40 60 80 100
0.2
0.6
1
1.8
1.4
One module at 30% shadow ratio
With no shadowTwo modules at 30% shadow ratio
Three modules at 30% shadow ratio
Four modules at 30% shadow ratio
VPV (V)
IPV
(A)
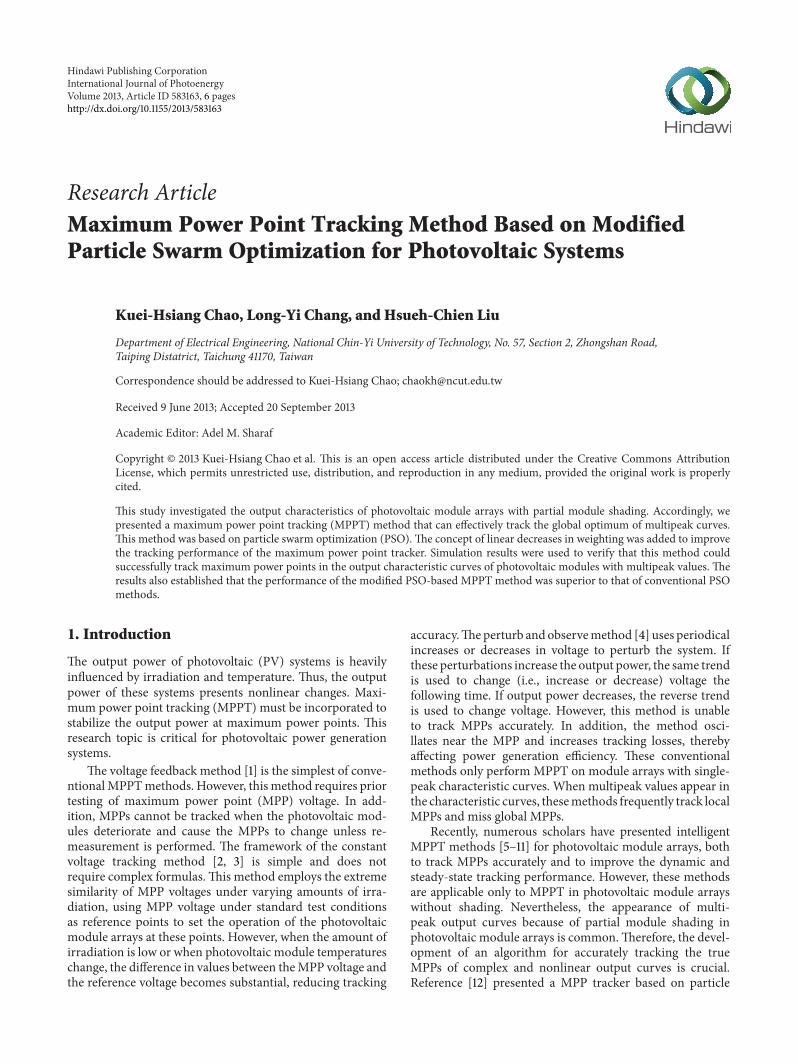
Figure 1: I-V output characteristic curves in the four-series one-parallel module array with varying numbers of modules and shaderatios of 30%, as simulated by Solar Pro software.
swarm optimization (PSO) for photovoltaic module arrays.Although this tracker was capable of tracking global MPPsof multipeak characteristic curves because fixed values wereadopted for weighing within the algorithm, the trackingperformance lacked robustness, causing low success rateswhen tracking global MPPs. Even though the MPPs weretracked successfully, the dynamic response speed was low.
Therefore, this study used PSO and added improvements,preventing it from being trapped in local MPPs (i.e., search-ing only local MPPs) and enabling it to track global MPPsquickly and consistently on the multipeak characteristiccurves of photovoltaic module arrays.
2. PV Module Array Characteristic Analysis
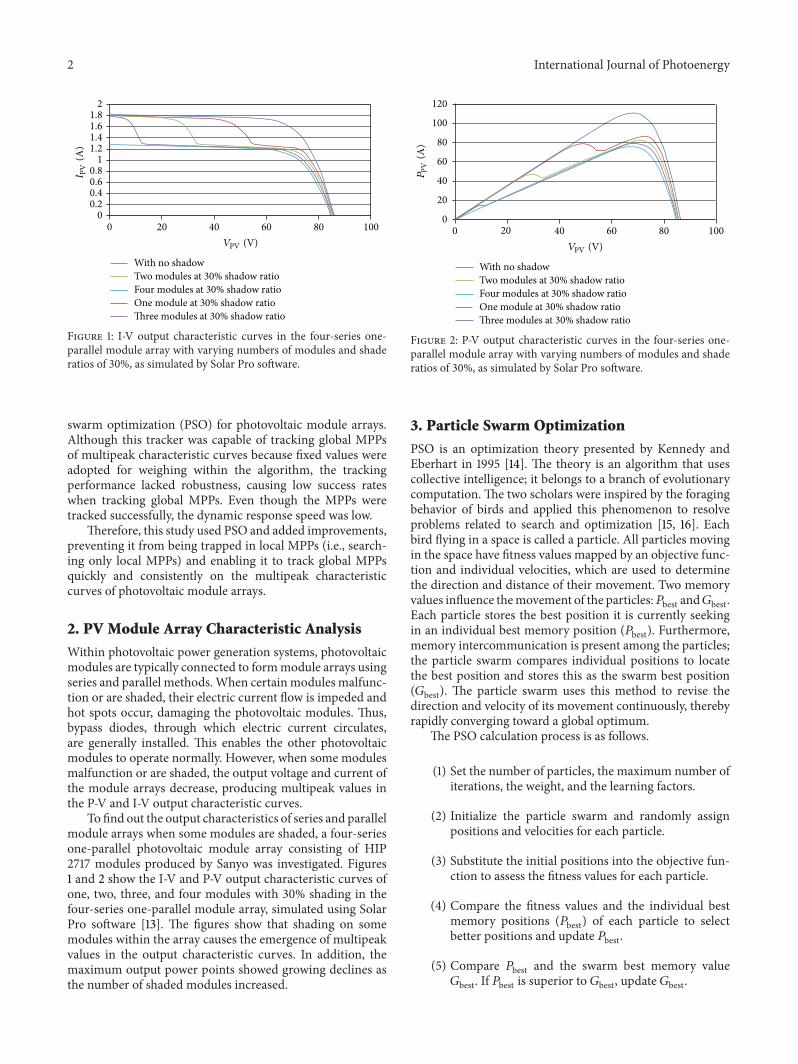
Within photovoltaic power generation systems, photovoltaicmodules are typically connected to formmodule arrays usingseries and parallel methods.When certain modules malfunc-tion or are shaded, their electric current flow is impeded andhot spots occur, damaging the photovoltaic modules. Thus,bypass diodes, through which electric current circulates,are generally installed. This enables the other photovoltaicmodules to operate normally. However, when some modulesmalfunction or are shaded, the output voltage and current ofthe module arrays decrease, producing multipeak values inthe P-V and I-V output characteristic curves.
To find out the output characteristics of series and parallelmodule arrays when some modules are shaded, a four-seriesone-parallel photovoltaic module array consisting of HIP2717 modules produced by Sanyo was investigated. Figures1 and 2 show the I-V and P-V output characteristic curves ofone, two, three, and four modules with 30% shading in thefour-series one-parallel module array, simulated using SolarPro software [13]. The figures show that shading on somemodules within the array causes the emergence of multipeakvalues in the output characteristic curves. In addition, themaximum output power points showed growing declines asthe number of shaded modules increased.
120
20
00 20 40 60 80 100
40
60
100
80
VPV (V)
One module at 30% shadow ratio
With no shadowTwo modules at 30% shadow ratio
Three modules at 30% shadow ratio
Four modules at 30% shadow ratio
PPV
(A)
Figure 2: P-V output characteristic curves in the four-series one-parallel module array with varying numbers of modules and shaderatios of 30%, as simulated by Solar Pro software.
3. Particle Swarm Optimization
PSO is an optimization theory presented by Kennedy andEberhart in 1995 [14]. The theory is an algorithm that usescollective intelligence; it belongs to a branch of evolutionarycomputation. The two scholars were inspired by the foragingbehavior of birds and applied this phenomenon to resolveproblems related to search and optimization [15, 16]. Eachbird flying in a space is called a particle. All particles movingin the space have fitness values mapped by an objective func-tion and individual velocities, which are used to determinethe direction and distance of their movement. Two memoryvalues influence themovement of the particles:𝑃best and𝐺best.Each particle stores the best position it is currently seekingin an individual best memory position (𝑃best). Furthermore,memory intercommunication is present among the particles;the particle swarm compares individual positions to locatethe best position and stores this as the swarm best position(𝐺best). The particle swarm uses this method to revise thedirection and velocity of its movement continuously, therebyrapidly converging toward a global optimum.
The PSO calculation process is as follows.
(1) Set the number of particles, the maximum number ofiterations, the weight, and the learning factors.
(2) Initialize the particle swarm and randomly assignpositions and velocities for each particle.
(3) Substitute the initial positions into the objective fun-ction to assess the fitness values for each particle.
(4) Compare the fitness values and the individual bestmemory positions (𝑃best) of each particle to selectbetter positions and update 𝑃best.
(5) Compare 𝑃best and the swarm best memory value𝐺best. If 𝑃best is superior to 𝐺best, update 𝐺best.
International Journal of Photoenergy 3
Photovoltaic array
MOSFETdriver
Modified PSO-based MPPT
controller
DC/ACinverter Load
PWM control signal
Cin
R1
R2
Cout
V
L
D
PV IPV
Figure 3: System architecture for modified PSO-based MPPT control.
(6) Use the core PSO formulas to update particle veloc-ities and positions. These formulas are shown asfollows:
𝑉𝑗+1
𝑖 = 𝑊 × 𝑉𝑗
𝑖 + 𝐶1 × rand1 (∙) × (𝑃best − 𝑃𝑗
𝑖 )
+ 𝐶2 × rand2 (∙) × (𝐺best − 𝑃𝑗
𝑖 ) ,
(1)
𝑃𝑗+1
𝑖 = 𝑉𝑗+1
𝑖 + 𝑃𝑗
𝑖 .(2)
In (1) and (2), 𝑉𝑗𝑖 and 𝑃𝑗
𝑖 are the velocity and position ofparticle 𝑖 at iteration j, respectively. Variables rand1(∙) andrand2(∙) are random number generators that generate realnumbers between 0 and 1 randomly; these numbers are usedto strengthen the variability of the particle swarm. 𝑊 isthe weight; 𝐶1 and 𝐶2 are the learning factors; 𝑃best𝑖 is theindividual optimum of particle 𝑖; and 𝐺best is the swarm orglobal optimum.
(7) Stop tracking if the stop conditions are met. Other-wise, rerun Steps 4 through 6.The stop conditions areeither locating the global optimum or reaching themaximum number of iterations.
The search efficiency and success rate of PSO are deter-mined primarily by the values assigned for the weights andthe learning factors [17]. When the weight is too high, theparticle search might lack accuracy because the movementstep sizes are too large. However, if the weight is low, par-ticle movement becomes slow, and the local optimum trapmight be unavoidable when facing multipeak values. Thus,weighting is typically based on the objective function.
4. PSO-Based MPPT for PV Systems
Conventional PSO is fast and accurate when searching forthe output characteristic curves of PV module arrays withsingle peak values. However, when somemodules are shaded,weights in conventional PSO must be readjusted appropri-ately based on various multipeak curve characteristics. If thisis not performed, excessively high or low weights result in
tracking failure. Thus, conventional PSO-based MPPT mustbe modified when some of the modules in a photovoltaicmodule array are shaded.
To solve these problems, linear decreases in line withincreasing iteration numbers were adopted in this study forthe weighting of the PSO kernel formulas. The modified wei-ghting formula is as follows:
𝑊 = (𝑊max −𝑊min) ×(𝑛 − 𝑗)
𝑛+𝑊min, (3)
where𝑊max is the maximum weight, 𝑊min is the minimumweight, 𝑛 is the maximum number of iterations, and 𝑗 is thecurrent iteration number.
The physical meaning of this modified weighting formulais that greater step sizes are used to increase the particlesearch velocity during the initial search because the distanceto the global optimum is relatively large. This prevents anexcessively small step size from making local optimum trapsunavoidable. However, 𝑊 decreases gradually as the num-ber of iterations increases. Because the particles are nowapproaching the MPP, these decreases in 𝑊cause the stepsin the particle movements to shrink, enabling the particles totrack the MPP more accurately.
In addition, the output curve of the photovoltaic modulearray appears only in the first quadrant. Therefore, regionswith output power below zero cannot be optimum positions,and the lower limit for particle tracking is set to zero; thatis, particles automatically return to zero when tracking regi-ons with values of less than zero. This greatly reduces thetime wasted by particles tracking in erroneous regions. Thepredicate for these conditions is as shown in (4):
𝑃best𝑖 = {𝑃best𝑖 , 𝑃best𝑖 > 0,
0, 𝑃best𝑖 ≤ 0.(4)
The 𝑃best𝑖value obtained in (4) is the solution of (2):
𝑃best𝑖 = 𝑃𝑗+1
𝑖 .(5)
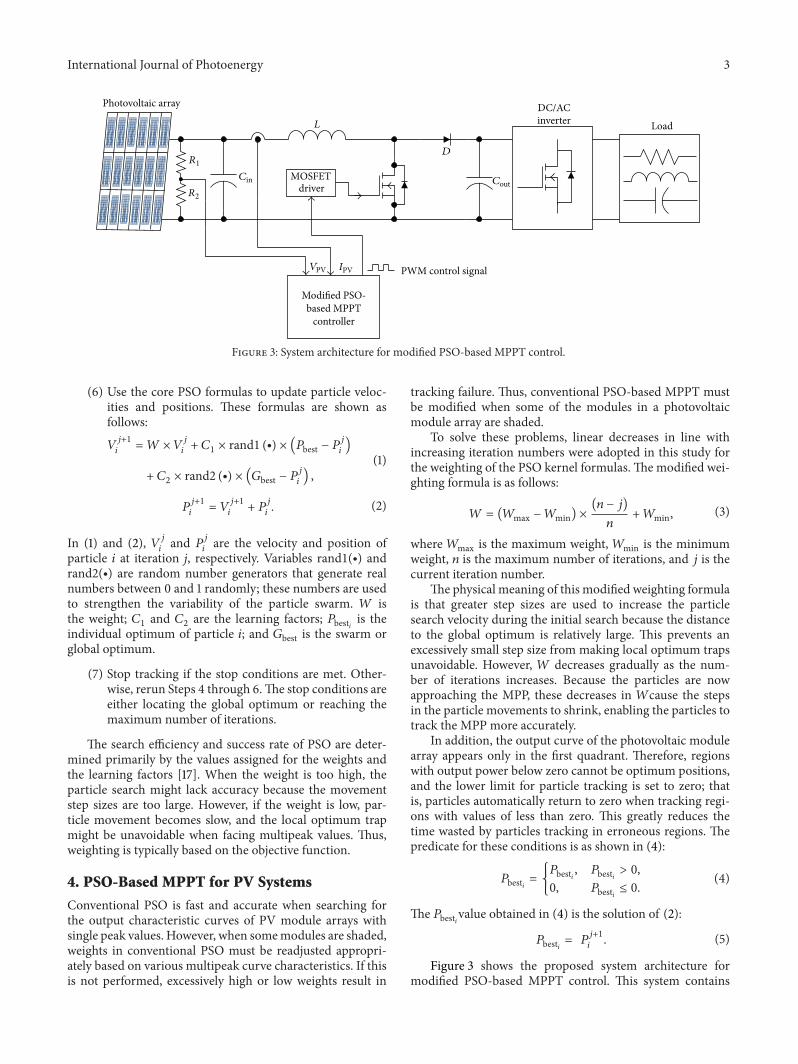
Figure 3 shows the proposed system architecture formodified PSO-based MPPT control. This system contains
4 International Journal of Photoenergy
0 10 20 30 40 50 60 70 80 900
20
40
60
PPV
(W)
VPV (V)
(a)
0 10 20 30 40 50 60 70 80 90 1000
20
40
60
Iterations
Modified PSO
Conventional PSO
Gbe
st(W
)
(b)
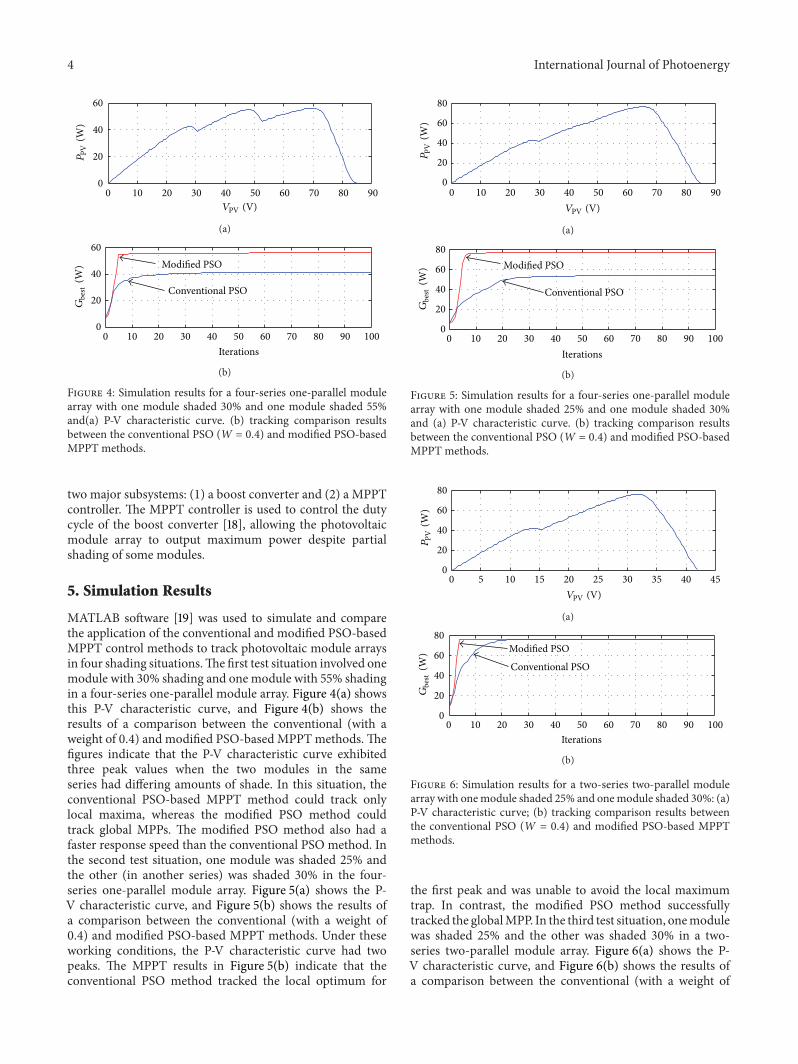
Figure 4: Simulation results for a four-series one-parallel modulearray with one module shaded 30% and one module shaded 55%and(a) P-V characteristic curve. (b) tracking comparison resultsbetween the conventional PSO (W = 0.4) and modified PSO-basedMPPT methods.
two major subsystems: (1) a boost converter and (2) a MPPTcontroller. The MPPT controller is used to control the dutycycle of the boost converter [18], allowing the photovoltaicmodule array to output maximum power despite partialshading of some modules.
5. Simulation Results
MATLAB software [19] was used to simulate and comparethe application of the conventional and modified PSO-basedMPPT control methods to track photovoltaic module arraysin four shading situations.The first test situation involved onemodule with 30% shading and one module with 55% shadingin a four-series one-parallel module array. Figure 4(a) showsthis P-V characteristic curve, and Figure 4(b) shows theresults of a comparison between the conventional (with aweight of 0.4) and modified PSO-based MPPTmethods.Thefigures indicate that the P-V characteristic curve exhibitedthree peak values when the two modules in the sameseries had differing amounts of shade. In this situation, theconventional PSO-based MPPT method could track onlylocal maxima, whereas the modified PSO method couldtrack global MPPs. The modified PSO method also had afaster response speed than the conventional PSO method. Inthe second test situation, one module was shaded 25% andthe other (in another series) was shaded 30% in the four-series one-parallel module array. Figure 5(a) shows the P-V characteristic curve, and Figure 5(b) shows the results ofa comparison between the conventional (with a weight of0.4) and modified PSO-based MPPT methods. Under theseworking conditions, the P-V characteristic curve had twopeaks. The MPPT results in Figure 5(b) indicate that theconventional PSO method tracked the local optimum for
0 10 20 30 40 50 60 70 80 900
20
40
60
80
PPV
(W)
VPV (V)
(a)
0 10 20 30 40 50 60 70 80 90 1000
20
40
60
80
Iterations
Modified PSO
Conventional PSO
Gbe
st(W
)
(b)
Figure 5: Simulation results for a four-series one-parallel modulearray with one module shaded 25% and one module shaded 30%and (a) P-V characteristic curve. (b) tracking comparison resultsbetween the conventional PSO (W = 0.4) and modified PSO-basedMPPT methods.
0 5 10 15 20 25 30 35 40 450
20
40
60
80
PPV
(W)
VPV (V)
(a)
0 10 20 30 40 50 60 70 80 90 1000
20
40
60
80
Iterations
Modified PSO
Conventional PSO
Gbe
st(W
)
(b)
Figure 6: Simulation results for a two-series two-parallel modulearray with onemodule shaded 25% and onemodule shaded 30%: (a)P-V characteristic curve; (b) tracking comparison results betweenthe conventional PSO (W = 0.4) and modified PSO-based MPPTmethods.
the first peak and was unable to avoid the local maximumtrap. In contrast, the modified PSO method successfullytracked the globalMPP. In the third test situation, onemodulewas shaded 25% and the other was shaded 30% in a two-series two-parallel module array. Figure 6(a) shows the P-V characteristic curve, and Figure 6(b) shows the results ofa comparison between the conventional (with a weight of
International Journal of Photoenergy 5
Table 1: Parameter settings for the two PSO methods.
Methods Parameter valuesWeight (𝑊) Learning factors (𝑐1, 𝑐2) Maximum number of iterations
Conventional PSO method (i) 0.4 with module shading (2, 2) 100(ii) 0.7 without module shading
Modified PSO method Linearly decreasing: (2, 2) 100𝑊max: 0.9; 𝑊min: 0.4
0 10 20 30 40 50 60 70 80 900
50
100
150
PPV
(W)
VPV (V)
(a)
0 10 20 30 40 50 60 70 80 90 1000
50
100
150
Iterations
Conventional PSO
Modified PSO
Gbe
st(W
)
(b)
0 10 20 30 40 50 60 70 80 90 1000
50
100
150
Iterations
Modified PSO
Conventional PSO
Gbe
st(W
)
(c)
Figure 7: Simulation results for a four-series one-parallel modulearray without any shading: (a) P-V characteristic curve; (b) trackingcomparison results between the conventional PSO (W = 0.4) andmodified PSO-based MPPT methods; (c) tracking comparisonresults between the conventional PSO (W = 0.7) andmodified PSO-based MPPT methods.
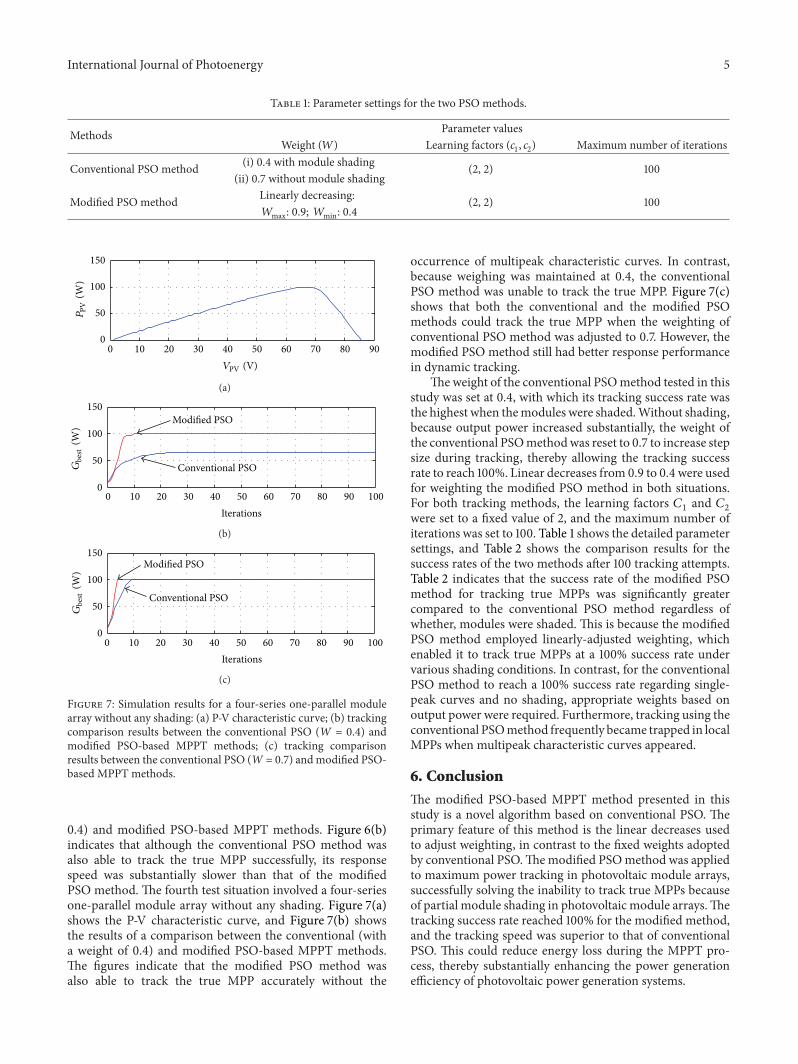
0.4) and modified PSO-based MPPT methods. Figure 6(b)indicates that although the conventional PSO method wasalso able to track the true MPP successfully, its responsespeed was substantially slower than that of the modifiedPSO method. The fourth test situation involved a four-seriesone-parallel module array without any shading. Figure 7(a)shows the P-V characteristic curve, and Figure 7(b) showsthe results of a comparison between the conventional (witha weight of 0.4) and modified PSO-based MPPT methods.The figures indicate that the modified PSO method wasalso able to track the true MPP accurately without the
occurrence of multipeak characteristic curves. In contrast,because weighing was maintained at 0.4, the conventionalPSO method was unable to track the true MPP. Figure 7(c)shows that both the conventional and the modified PSOmethods could track the true MPP when the weighting ofconventional PSO method was adjusted to 0.7. However, themodified PSO method still had better response performancein dynamic tracking.
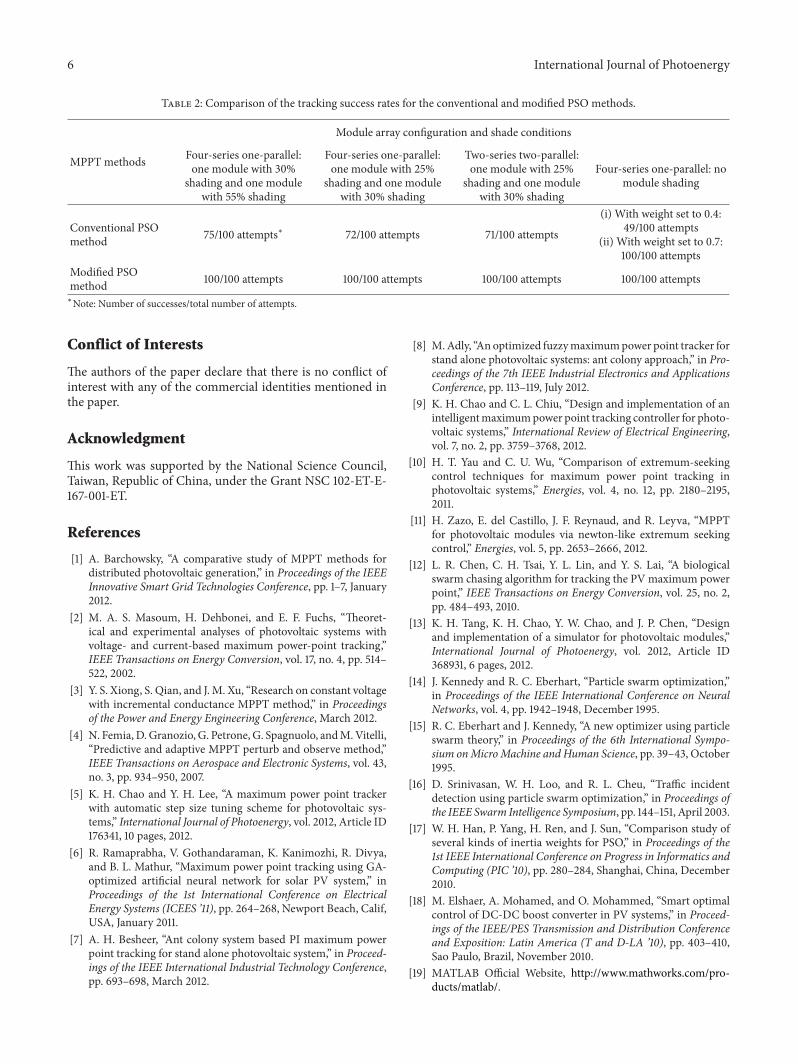
Theweight of the conventional PSOmethod tested in thisstudy was set at 0.4, with which its tracking success rate wasthe highest when themodules were shaded.Without shading,because output power increased substantially, the weight ofthe conventional PSOmethodwas reset to 0.7 to increase stepsize during tracking, thereby allowing the tracking successrate to reach 100%. Linear decreases from 0.9 to 0.4 were usedfor weighting the modified PSO method in both situations.For both tracking methods, the learning factors 𝐶1 and 𝐶2were set to a fixed value of 2, and the maximum number ofiterations was set to 100. Table 1 shows the detailed parametersettings, and Table 2 shows the comparison results for thesuccess rates of the two methods after 100 tracking attempts.Table 2 indicates that the success rate of the modified PSOmethod for tracking true MPPs was significantly greatercompared to the conventional PSO method regardless ofwhether, modules were shaded. This is because the modifiedPSO method employed linearly-adjusted weighting, whichenabled it to track true MPPs at a 100% success rate undervarious shading conditions. In contrast, for the conventionalPSO method to reach a 100% success rate regarding single-peak curves and no shading, appropriate weights based onoutput power were required. Furthermore, tracking using theconventional PSOmethod frequently became trapped in localMPPs when multipeak characteristic curves appeared.
6. Conclusion
The modified PSO-based MPPT method presented in thisstudy is a novel algorithm based on conventional PSO. Theprimary feature of this method is the linear decreases usedto adjust weighting, in contrast to the fixed weights adoptedby conventional PSO.Themodified PSOmethod was appliedto maximum power tracking in photovoltaic module arrays,successfully solving the inability to track true MPPs becauseof partial module shading in photovoltaic module arrays.Thetracking success rate reached 100% for the modified method,and the tracking speed was superior to that of conventionalPSO. This could reduce energy loss during the MPPT pro-cess, thereby substantially enhancing the power generationefficiency of photovoltaic power generation systems.
6 International Journal of Photoenergy
Table 2: Comparison of the tracking success rates for the conventional and modified PSO methods.
MPPT methods
Module array configuration and shade conditions
Four-series one-parallel:one module with 30%
shading and one modulewith 55% shading
Four-series one-parallel:one module with 25%
shading and one modulewith 30% shading
Two-series two-parallel:one module with 25%
shading and one modulewith 30% shading
Four-series one-parallel: nomodule shading
Conventional PSOmethod 75/100 attempts∗ 72/100 attempts 71/100 attempts
(i) With weight set to 0.4:49/100 attempts
(ii) With weight set to 0.7:100/100 attempts
Modified PSOmethod 100/100 attempts 100/100 attempts 100/100 attempts 100/100 attempts∗Note: Number of successes/total number of attempts.
Conflict of Interests
The authors of the paper declare that there is no conflict ofinterest with any of the commercial identities mentioned inthe paper.
Acknowledgment
This work was supported by the National Science Council,Taiwan, Republic of China, under the Grant NSC 102-ET-E-167-001-ET.
References
[1] A. Barchowsky, “A comparative study of MPPT methods fordistributed photovoltaic generation,” in Proceedings of the IEEEInnovative Smart Grid Technologies Conference, pp. 1–7, January2012.
[2] M. A. S. Masoum, H. Dehbonei, and E. F. Fuchs, “Theoret-ical and experimental analyses of photovoltaic systems withvoltage- and current-based maximum power-point tracking,”IEEE Transactions on Energy Conversion, vol. 17, no. 4, pp. 514–522, 2002.
[3] Y. S. Xiong, S. Qian, and J.M. Xu, “Research on constant voltagewith incremental conductance MPPT method,” in Proceedingsof the Power and Energy Engineering Conference, March 2012.
[4] N. Femia,D.Granozio, G. Petrone, G. Spagnuolo, andM.Vitelli,“Predictive and adaptive MPPT perturb and observe method,”IEEE Transactions on Aerospace and Electronic Systems, vol. 43,no. 3, pp. 934–950, 2007.
[5] K. H. Chao and Y. H. Lee, “A maximum power point trackerwith automatic step size tuning scheme for photovoltaic sys-tems,” International Journal of Photoenergy, vol. 2012, Article ID176341, 10 pages, 2012.
[6] R. Ramaprabha, V. Gothandaraman, K. Kanimozhi, R. Divya,and B. L. Mathur, “Maximum power point tracking using GA-optimized artificial neural network for solar PV system,” inProceedings of the 1st International Conference on ElectricalEnergy Systems (ICEES ’11), pp. 264–268, Newport Beach, Calif,USA, January 2011.
[7] A. H. Besheer, “Ant colony system based PI maximum powerpoint tracking for stand alone photovoltaic system,” in Proceed-ings of the IEEE International Industrial Technology Conference,pp. 693–698, March 2012.
[8] M.Adly, “Anoptimized fuzzymaximumpower point tracker forstand alone photovoltaic systems: ant colony approach,” in Pro-ceedings of the 7th IEEE Industrial Electronics and ApplicationsConference, pp. 113–119, July 2012.
[9] K. H. Chao and C. L. Chiu, “Design and implementation of anintelligentmaximumpower point tracking controller for photo-voltaic systems,” International Review of Electrical Engineering,vol. 7, no. 2, pp. 3759–3768, 2012.
[10] H. T. Yau and C. U. Wu, “Comparison of extremum-seekingcontrol techniques for maximum power point tracking inphotovoltaic systems,” Energies, vol. 4, no. 12, pp. 2180–2195,2011.
[11] H. Zazo, E. del Castillo, J. F. Reynaud, and R. Leyva, “MPPTfor photovoltaic modules via newton-like extremum seekingcontrol,” Energies, vol. 5, pp. 2653–2666, 2012.
[12] L. R. Chen, C. H. Tsai, Y. L. Lin, and Y. S. Lai, “A biologicalswarm chasing algorithm for tracking the PVmaximum powerpoint,” IEEE Transactions on Energy Conversion, vol. 25, no. 2,pp. 484–493, 2010.
[13] K. H. Tang, K. H. Chao, Y. W. Chao, and J. P. Chen, “Designand implementation of a simulator for photovoltaic modules,”International Journal of Photoenergy, vol. 2012, Article ID368931, 6 pages, 2012.
[14] J. Kennedy and R. C. Eberhart, “Particle swarm optimization,”in Proceedings of the IEEE International Conference on NeuralNetworks, vol. 4, pp. 1942–1948, December 1995.
[15] R. C. Eberhart and J. Kennedy, “A new optimizer using particleswarm theory,” in Proceedings of the 6th International Sympo-sium onMicroMachine and Human Science, pp. 39–43, October1995.
[16] D. Srinivasan, W. H. Loo, and R. L. Cheu, “Traffic incidentdetection using particle swarm optimization,” in Proceedings ofthe IEEE Swarm Intelligence Symposium, pp. 144–151, April 2003.
[17] W. H. Han, P. Yang, H. Ren, and J. Sun, “Comparison study ofseveral kinds of inertia weights for PSO,” in Proceedings of the1st IEEE International Conference on Progress in Informatics andComputing (PIC ’10), pp. 280–284, Shanghai, China, December2010.
[18] M. Elshaer, A. Mohamed, and O. Mohammed, “Smart optimalcontrol of DC-DC boost converter in PV systems,” in Proceed-ings of the IEEE/PES Transmission and Distribution Conferenceand Exposition: Latin America (T and D-LA ’10), pp. 403–410,Sao Paulo, Brazil, November 2010.
[19] MATLAB Official Website, http://www.mathworks.com/pro-ducts/matlab/.

Submit your manuscripts athttp://www.hindawi.com
Hindawi Publishing Corporationhttp://www.hindawi.com Volume 2014
Inorganic ChemistryInternational Journal of
Hindawi Publishing Corporation http://www.hindawi.com Volume 2014
International Journal ofPhotoenergy
Hindawi Publishing Corporationhttp://www.hindawi.com Volume 2014
Carbohydrate Chemistry
International Journal of
Hindawi Publishing Corporationhttp://www.hindawi.com Volume 2014
Journal of
Chemistry
Hindawi Publishing Corporationhttp://www.hindawi.com Volume 2014
Advances in
Physical Chemistry
Hindawi Publishing Corporationhttp://www.hindawi.com
Analytical Methods in Chemistry
Journal of
Volume 2014
Bioinorganic Chemistry and ApplicationsHindawi Publishing Corporationhttp://www.hindawi.com Volume 2014
SpectroscopyInternational Journal of
Hindawi Publishing Corporationhttp://www.hindawi.com Volume 2014
The Scientific World JournalHindawi Publishing Corporation http://www.hindawi.com Volume 2014
Medicinal ChemistryInternational Journal of
Hindawi Publishing Corporationhttp://www.hindawi.com Volume 2014
Chromatography Research International
Hindawi Publishing Corporationhttp://www.hindawi.com Volume 2014
Applied ChemistryJournal of
Hindawi Publishing Corporationhttp://www.hindawi.com Volume 2014
Hindawi Publishing Corporationhttp://www.hindawi.com Volume 2014
Theoretical ChemistryJournal of
Hindawi Publishing Corporationhttp://www.hindawi.com Volume 2014
Journal of
Spectroscopy
Analytical ChemistryInternational Journal of
Hindawi Publishing Corporationhttp://www.hindawi.com Volume 2014
Journal of
Hindawi Publishing Corporationhttp://www.hindawi.com Volume 2014
Quantum Chemistry
Hindawi Publishing Corporationhttp://www.hindawi.com Volume 2014
Organic Chemistry International
ElectrochemistryInternational Journal of
Hindawi Publishing Corporation http://www.hindawi.com Volume 2014
Hindawi Publishing Corporationhttp://www.hindawi.com Volume 2014
CatalystsJournal of
Recommended