Harry Moser President
Reshoring Initiative
1
IMTS 2016 Press Briefing
Reshoring and FDI: Prove Millions of Manufacturing Jobs Can be
Brought Back with the Right Policies
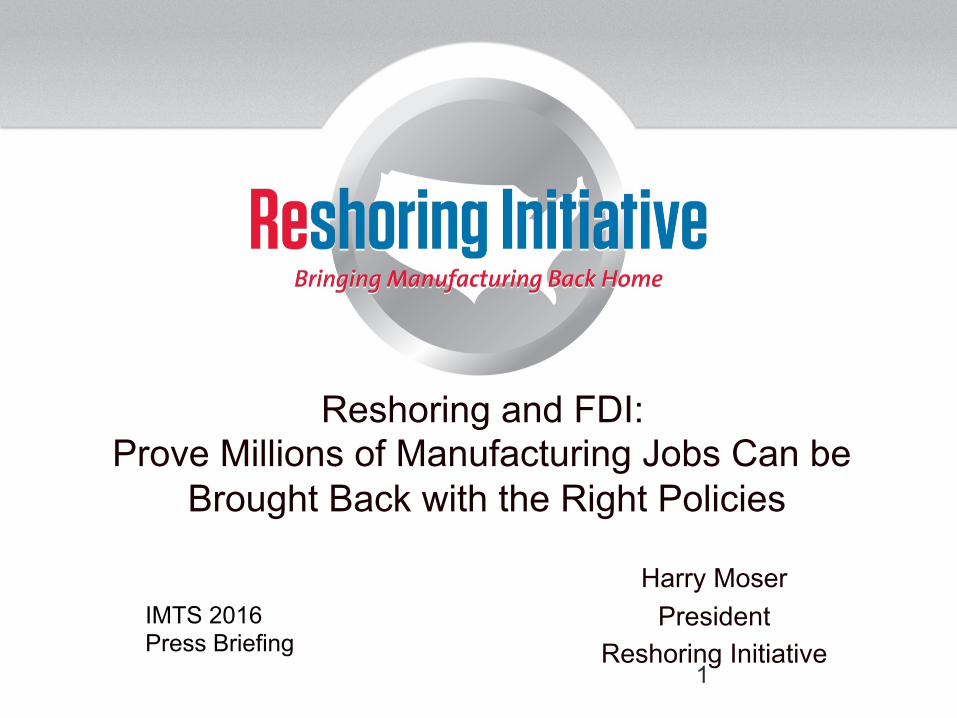
U.S.: Better Place to Produce and Source to Supply the U.S. Market
l Proof: l FDI at record level in 2015, #1 in the world l % FDI into mfg: 70% in 2015 up from 36% historically l Rank in competitiveness: #2 now, #1 in 2020 (Deloitte) l Reshoring and FDI balanced offshoring in ‘14 and ’15 (RI)
l Reasons: l Recognition of the costs of offshoring l Globalization → Localization l Largest market & largest trade deficit l Greatest opportunity for growth
2
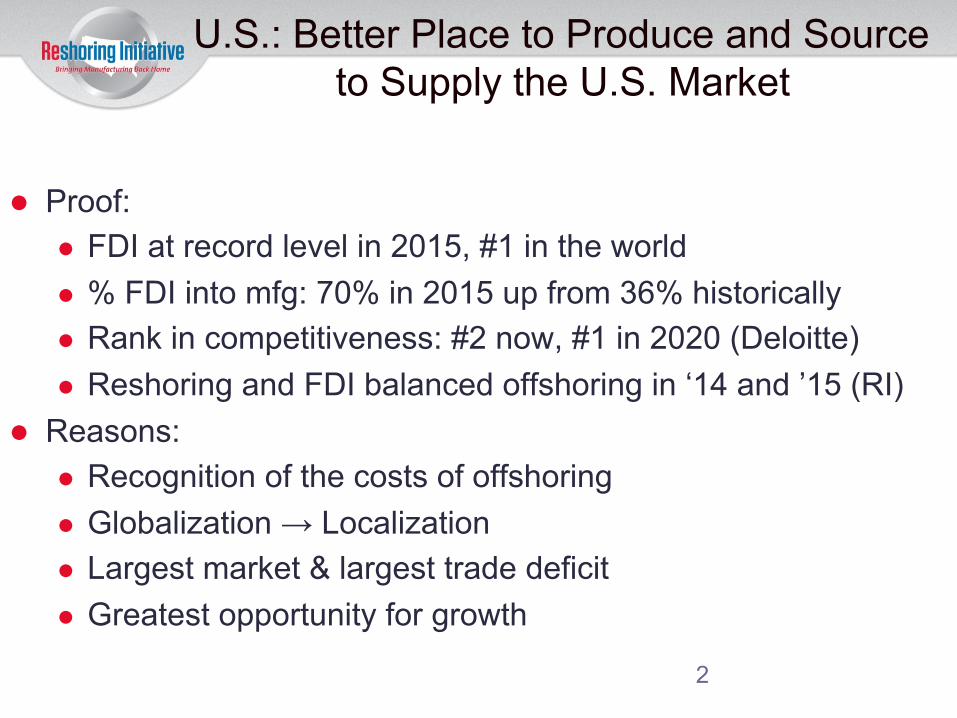
Offshore Bleeding has Stopped
Manufacturing Jobs/Year 2000-‐2003
Annual Average
2015 % Change
New Offshoring
~240,000
~60,000 -‐75%
New Reshoring & FDI
12,000 67,000 + 400%
Net Jobs Gained
~-‐220,000 ~0 N/A
3
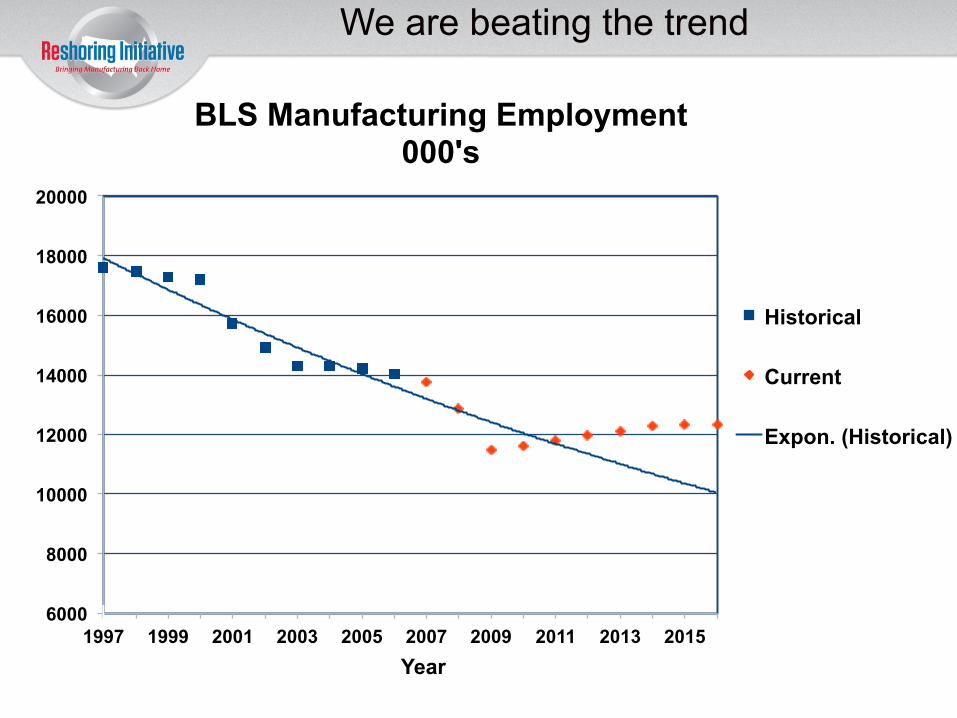
6000
8000
10000
12000
14000
16000
18000
20000
1997 1999 2001 2003 2005 2007 2009 2011 2013 2015 Year
BLS Manufacturing Employment 000's
Historical
Current
Expon. (Historical)
We are beating the trend
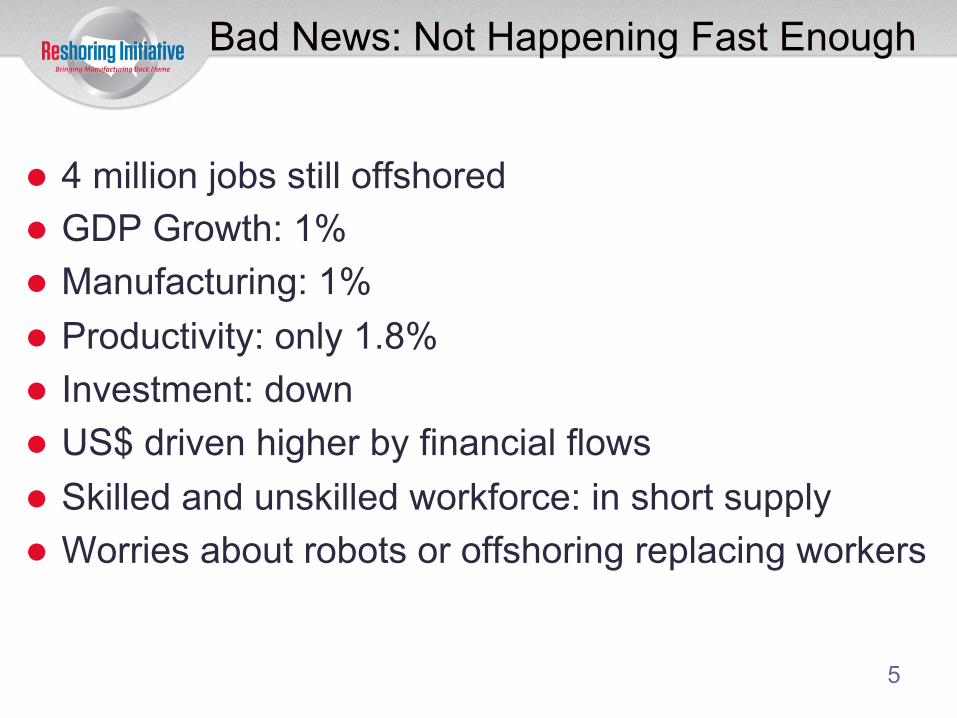
Bad News: Not Happening Fast Enough
l 4 million jobs still offshored l GDP Growth: 1% l Manufacturing: 1% l Productivity: only 1.8% l Investment: down l US$ driven higher by financial flows l Skilled and unskilled workforce: in short supply l Worries about robots or offshoring replacing workers
5
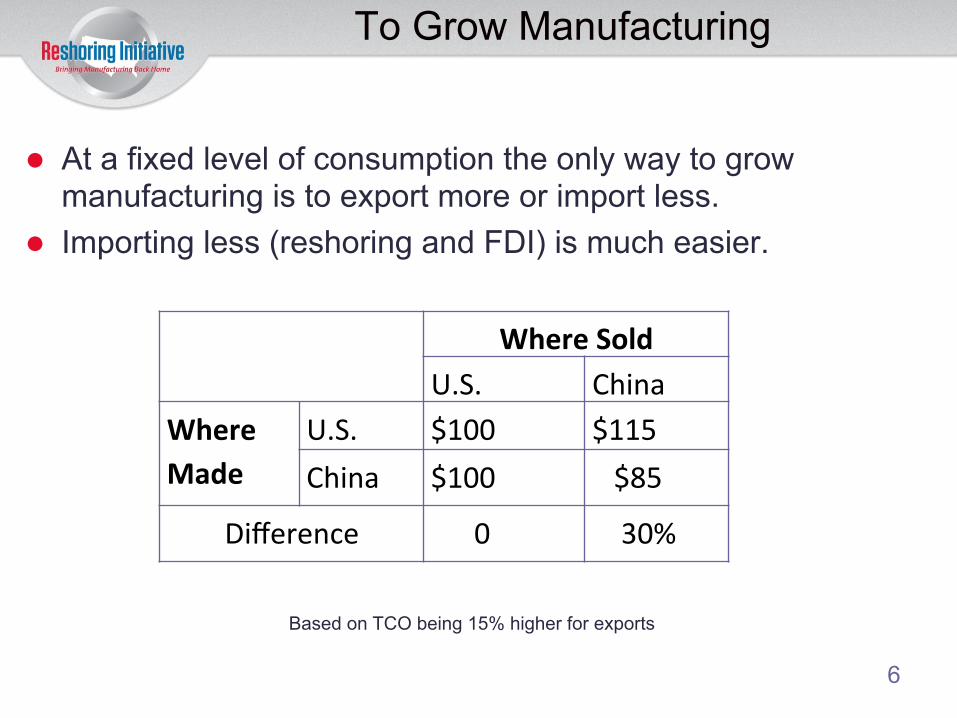
To Grow Manufacturing
l At a fixed level of consumption the only way to grow manufacturing is to export more or import less.
l Importing less (reshoring and FDI) is much easier.
6
Where Sold U.S. China
Where Made
U.S. $100 $115 China $100 $85
Difference 0 30%
Based on TCO being 15% higher for exports
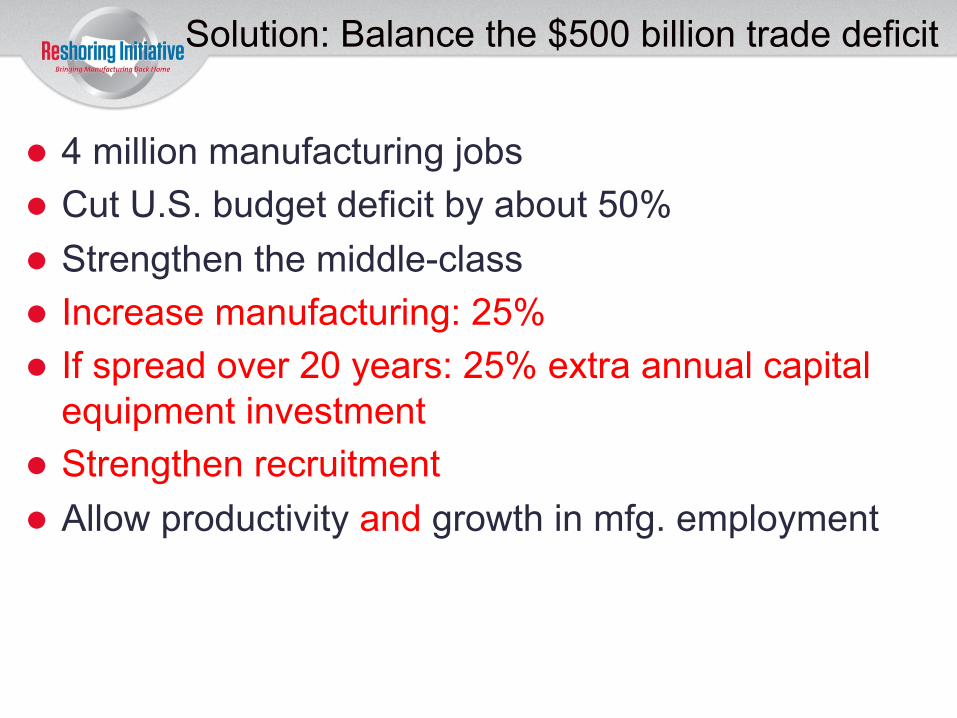
Solution: Balance the $500 billion trade deficit
l 4 million manufacturing jobs l Cut U.S. budget deficit by about 50% l Strengthen the middle-class l Increase manufacturing: 25% l If spread over 20 years: 25% extra annual capital
equipment investment l Strengthen recruitment l Allow productivity and growth in mfg. employment
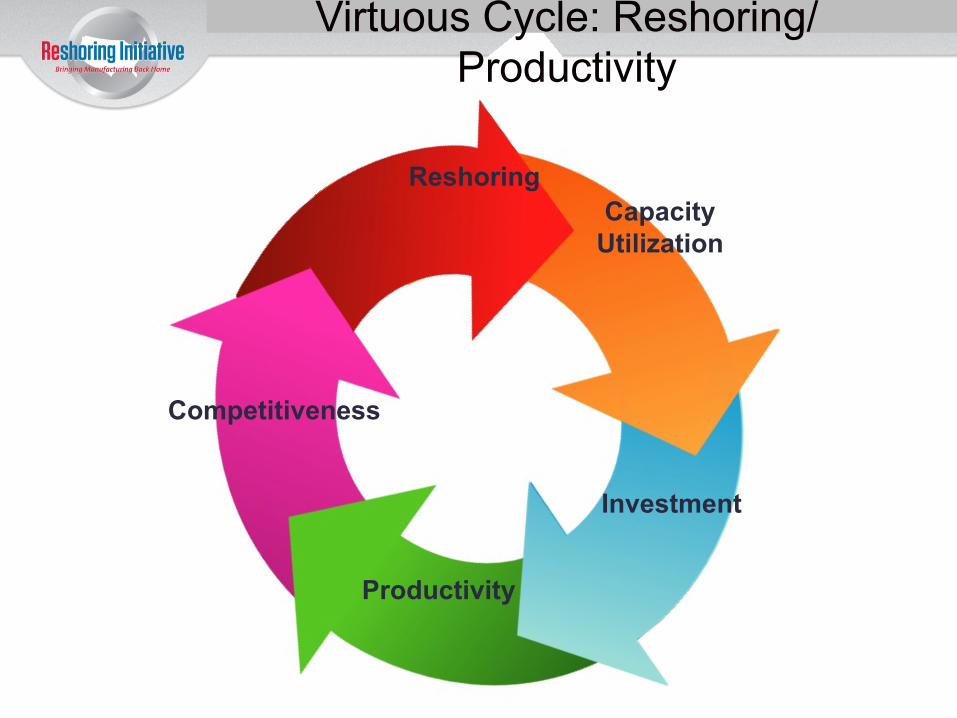
Reshoring Capacity
Utilization
Investment
Productivity
Competitiveness
Virtuous Cycle: Reshoring/Productivity
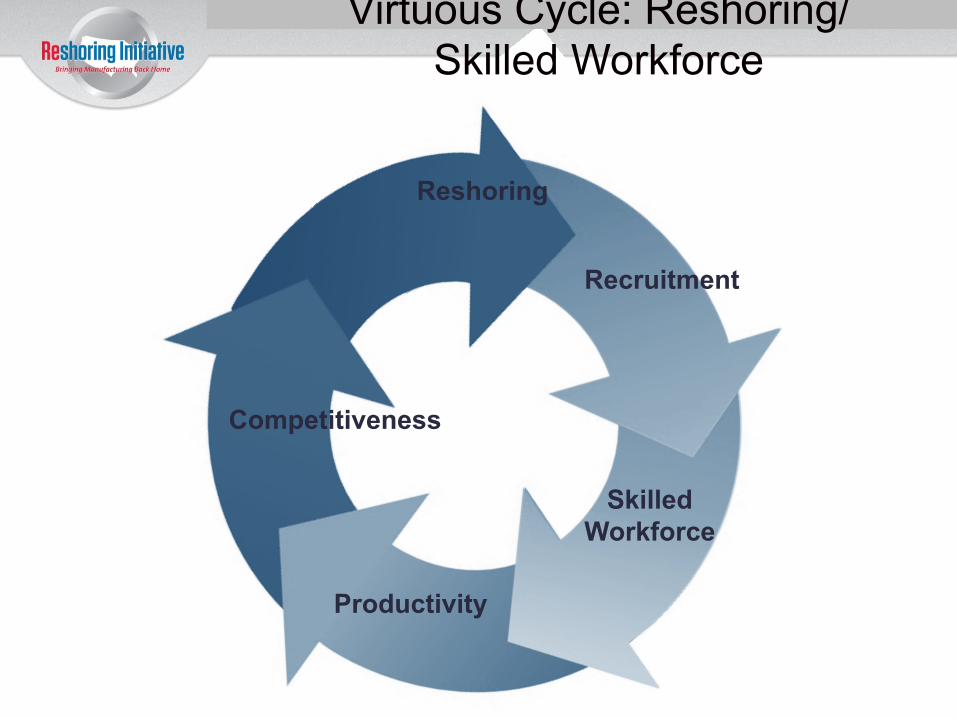
Reshoring
Recruitment
Skilled Workforce
Productivity
Competitiveness
Virtuous Cycle: Reshoring/Skilled Workforce
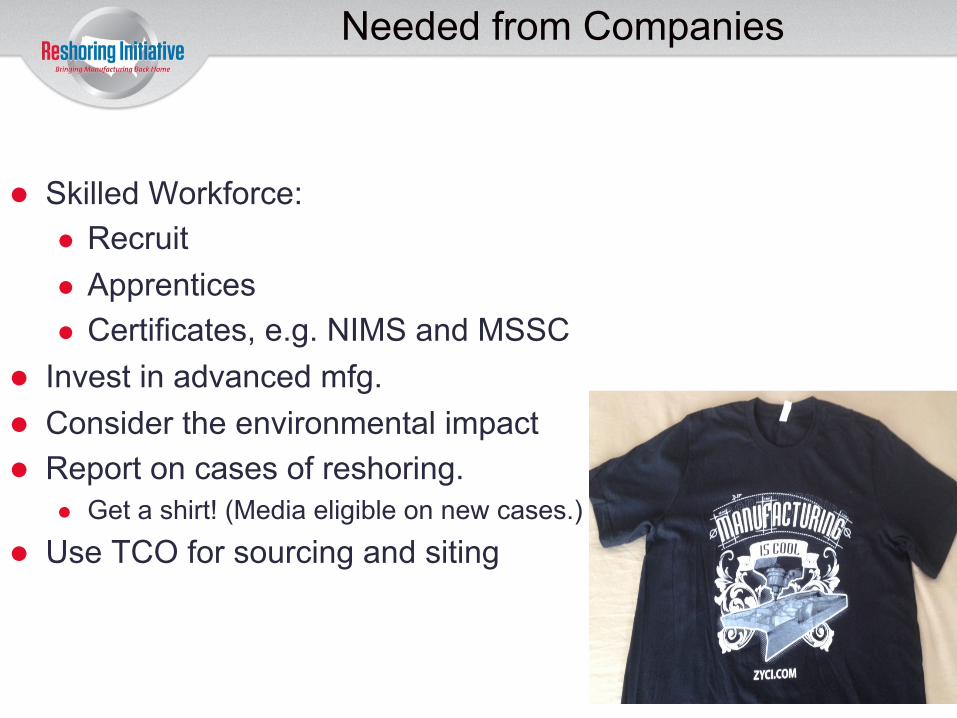
Needed from Companies
l Skilled Workforce: l Recruit l Apprentices l Certificates, e.g. NIMS and MSSC
l Invest in advanced mfg. l Consider the environmental impact l Report on cases of reshoring.
l Get a shirt! (Media eligible on new cases.) l Use TCO for sourcing and siting
10
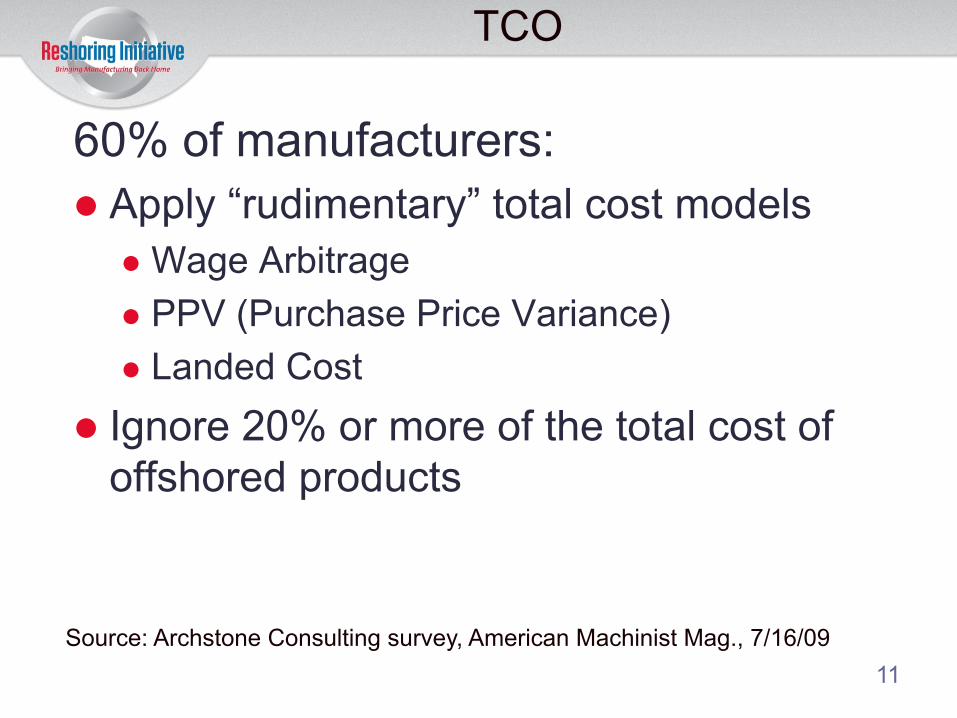
TCO
60% of manufacturers: l Apply “rudimentary” total cost models
l Wage Arbitrage l PPV (Purchase Price Variance) l Landed Cost
l Ignore 20% or more of the total cost of offshored products
Source: Archstone Consulting survey, American Machinist Mag., 7/16/09 11
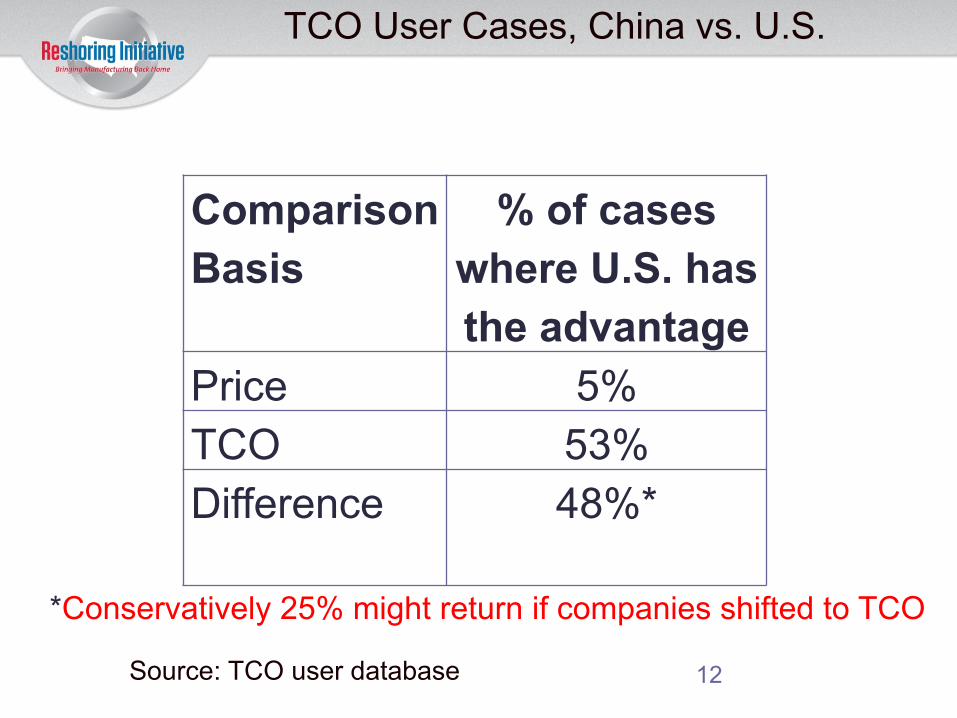
TCO User Cases, China vs. U.S.
Comparison Basis
% of cases where U.S. has the advantage
Price 5% TCO 53% Difference 48%*
*Conservatively 25% might return if companies shifted to TCO
Source: TCO user database 12
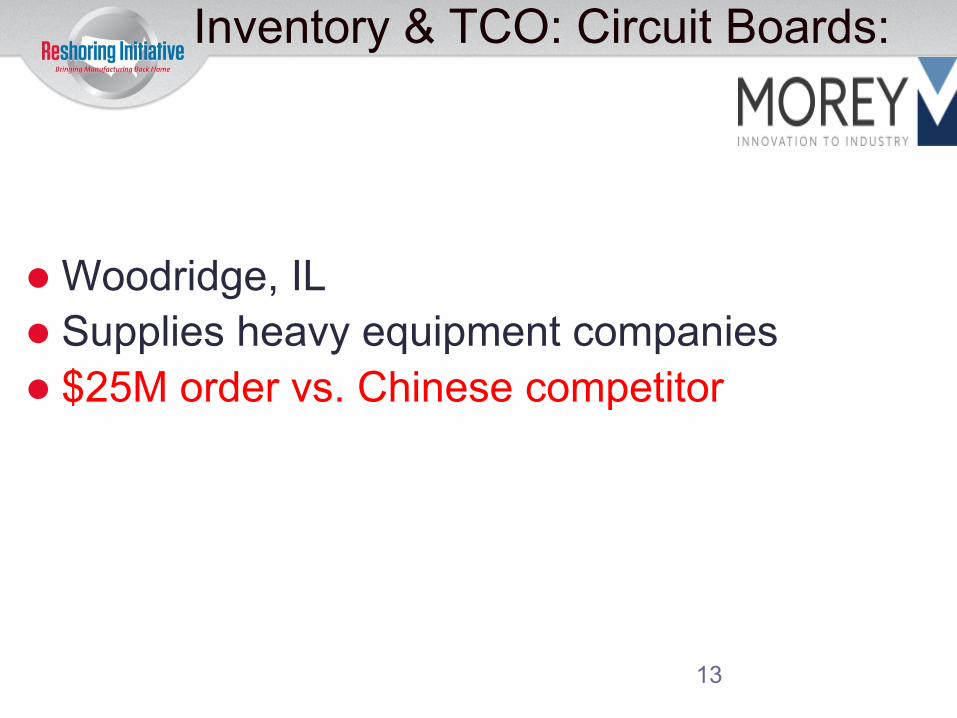
Inventory & TCO: Circuit Boards:
l Woodridge, IL l Supplies heavy equipment companies l $25M order vs. Chinese competitor
13
TCO for Investing
l By understanding: l The advantage of producing near the consumer,
and l The small TCO gap instead of the large price gap
l U.S. companies can: l Justify domestic investment, process improvement,
automation, training, etc. l And do not have to sacrifice quality, delivery, time-to-
market, or employees to be competitive and profitable.
CSR Estimator Will Provide
l For companies: l Standard tool to include externalities in sourcing decisions. l Identification of the products with the best shareholder and
sustainability returns. l Help justifying the marginal opportunities l Recognition for success,
l For advocates: l Tool to advance an economically and environmentally
sustainable economy. .
15
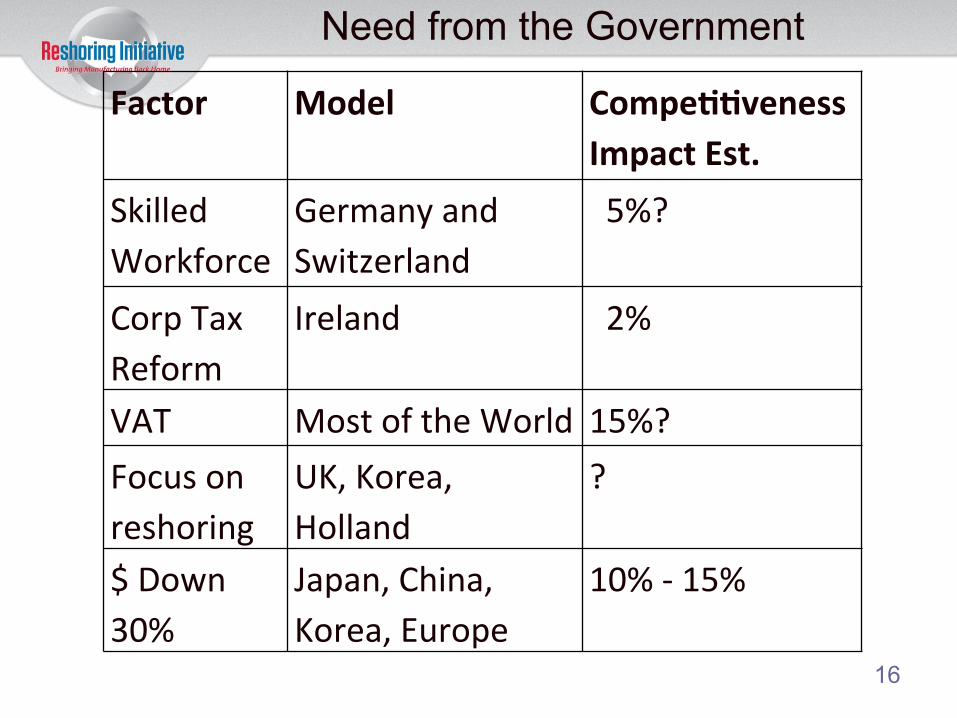
Need from the Government
Factor Model Compe22veness Impact Est.
Skilled Workforce
Germany and Switzerland
5%?
Corp Tax Reform
Ireland 2%
VAT Most of the World 15%? Focus on reshoring
UK, Korea, Holland
?
$ Down 30%
Japan, China, Korea, Europe
10% -‐ 15%
16
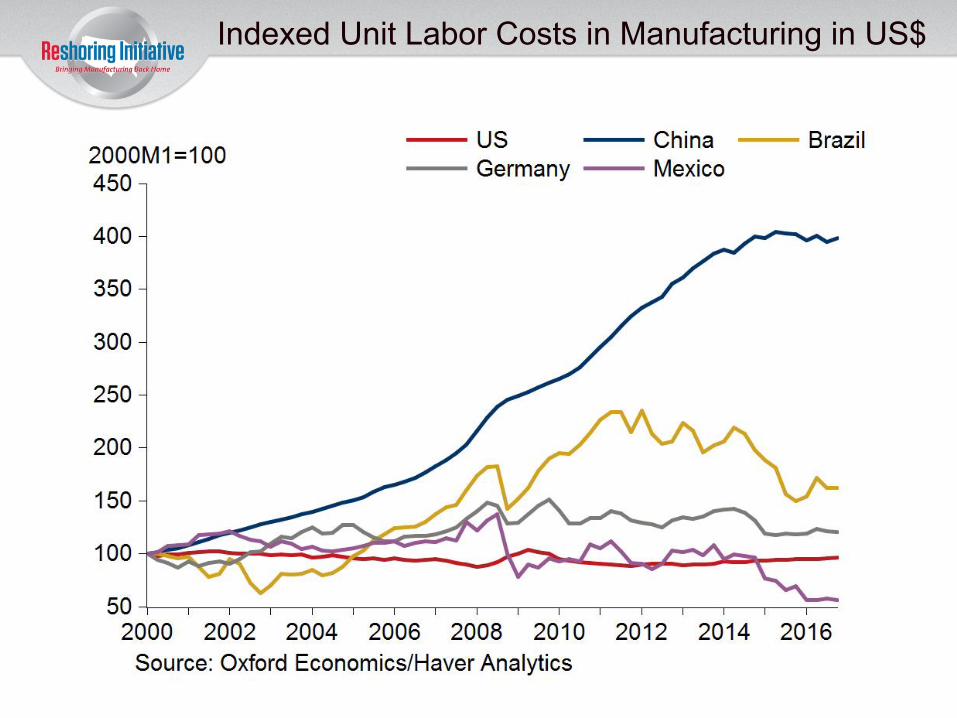
Indexed Unit Labor Costs in Manufacturing in US$
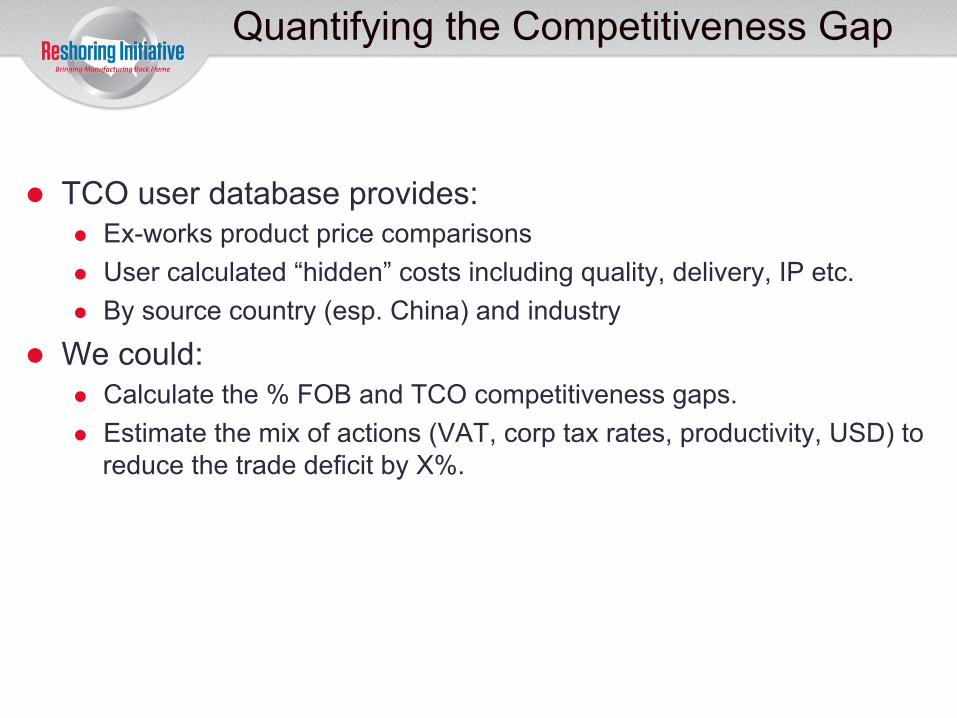
Quantifying the Competitiveness Gap
l TCO user database provides: l Ex-works product price comparisons l User calculated “hidden” costs including quality, delivery, IP etc. l By source country (esp. China) and industry
l We could: l Calculate the % FOB and TCO competitiveness gaps. l Estimate the mix of actions (VAT, corp tax rates, productivity, USD) to
reduce the trade deficit by X%.
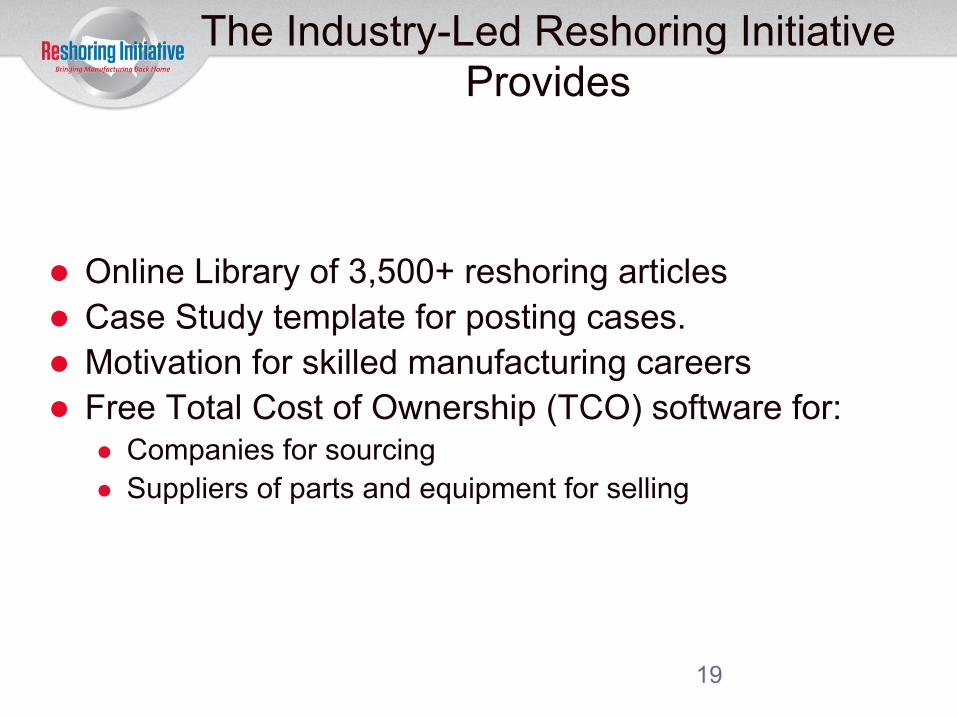
The Industry-Led Reshoring Initiative Provides
l Online Library of 3,500+ reshoring articles l Case Study template for posting cases. l Motivation for skilled manufacturing careers l Free Total Cost of Ownership (TCO) software for:
l Companies for sourcing l Suppliers of parts and equipment for selling
19
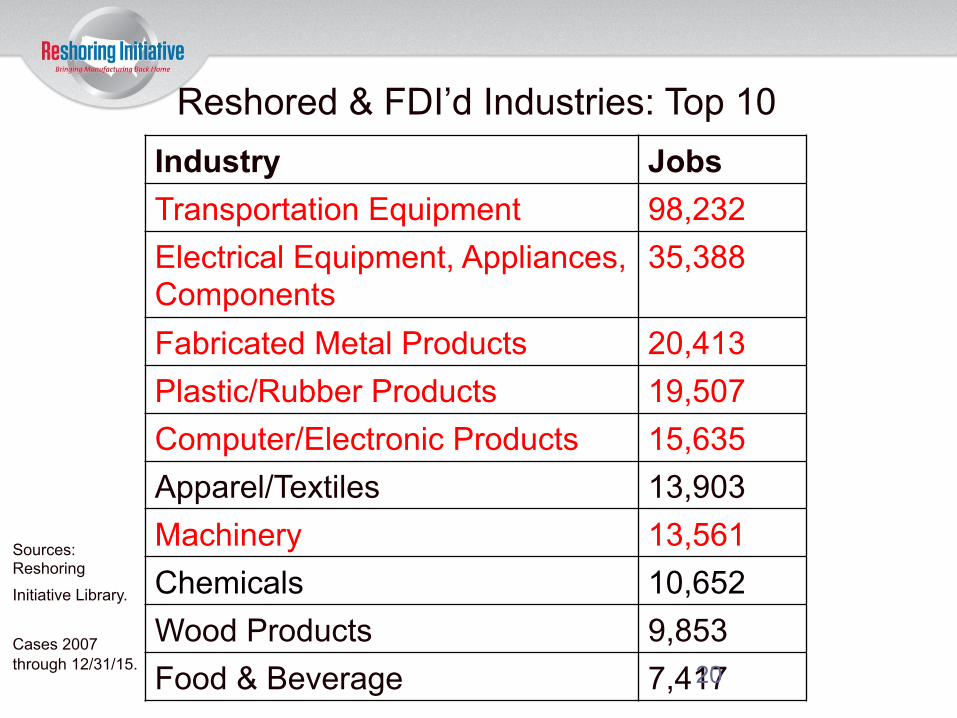
Reshored & FDI’d Industries: Top 10
Sources: Reshoring
Initiative Library. Cases 2007 through 12/31/15.
Industry Jobs Transportation Equipment 98,232 Electrical Equipment, Appliances, Components
35,388
Fabricated Metal Products 20,413 Plastic/Rubber Products 19,507 Computer/Electronic Products 15,635 Apparel/Textiles 13,903 Machinery 13,561 Chemicals 10,652 Wood Products 9,853 Food & Beverage 7,417 20
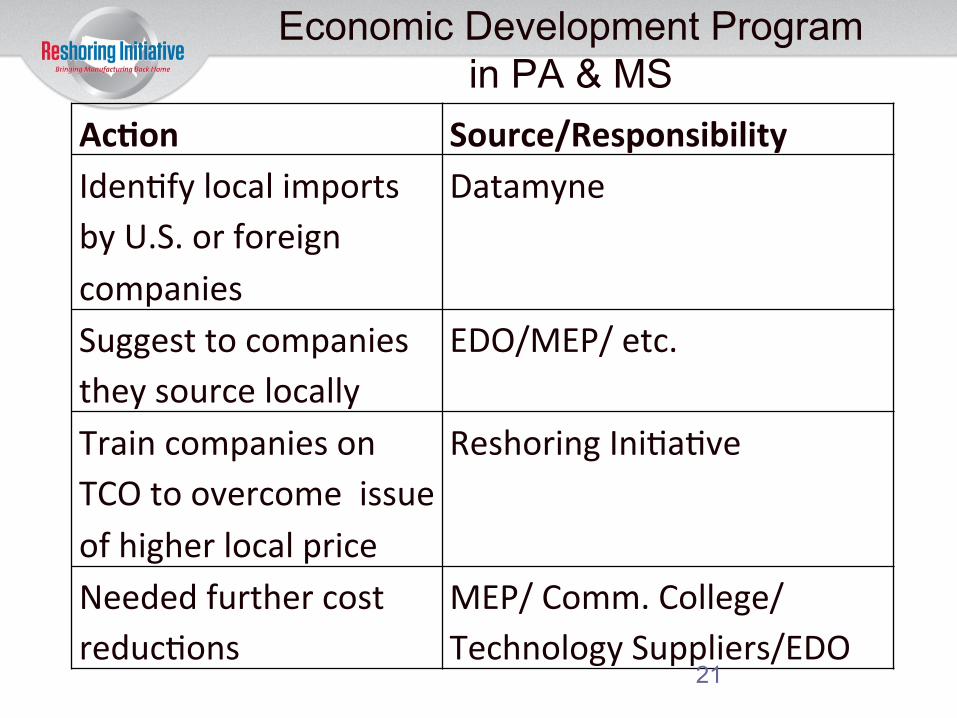
Economic Development Program in PA & MS
Ac2on Source/Responsibility Idenbfy local imports by U.S. or foreign companies
Datamyne
Suggest to companies they source locally
EDO/MEP/ etc.
Train companies on TCO to overcome issue of higher local price
Reshoring Inibabve
Needed further cost reducbons
MEP/ Comm. College/ Technology Suppliers/EDO
21
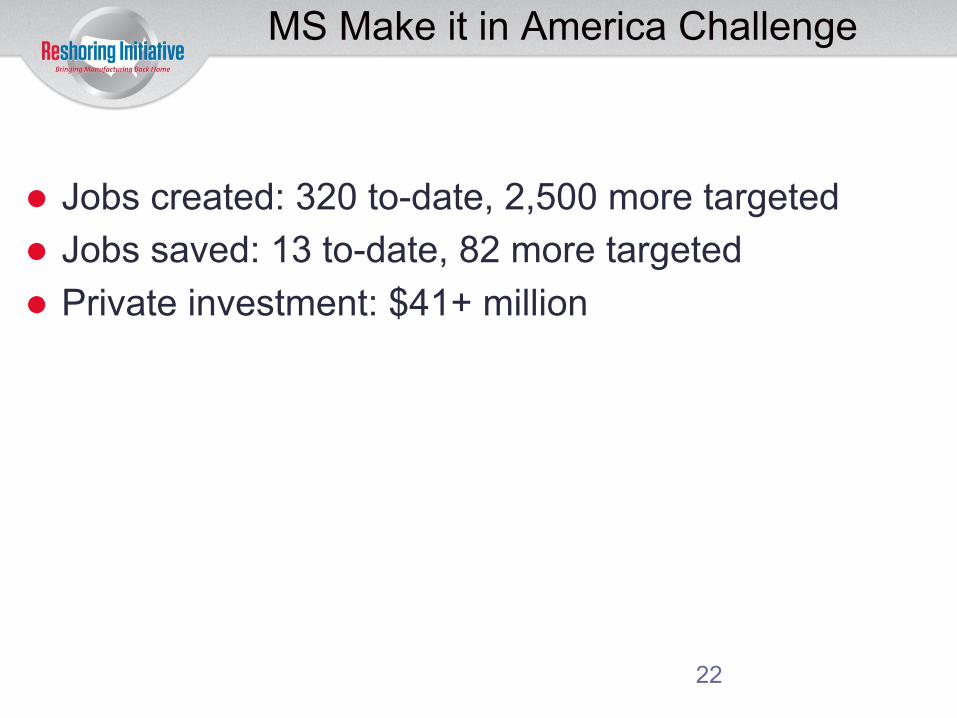
MS Make it in America Challenge
l Jobs created: 320 to-date, 2,500 more targeted l Jobs saved: 13 to-date, 82 more targeted l Private investment: $41+ million
22
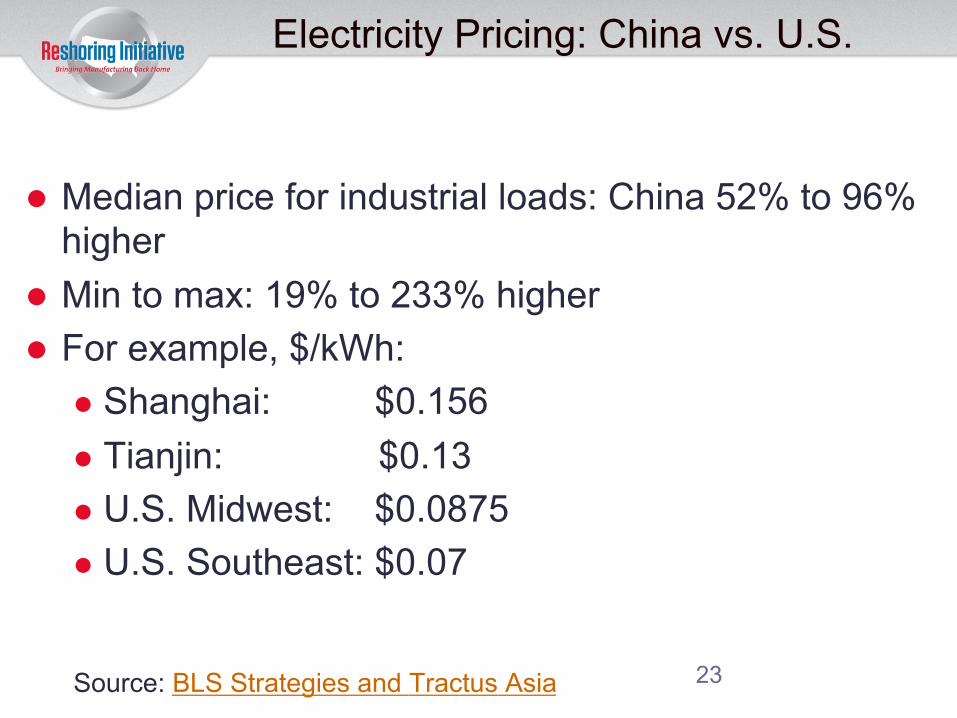
Electricity Pricing: China vs. U.S.
l Median price for industrial loads: China 52% to 96% higher
l Min to max: 19% to 233% higher l For example, $/kWh:
l Shanghai: $0.156 l Tianjin: $0.13 l U.S. Midwest: $0.0875 l U.S. Southeast: $0.07
Source: BLS Strategies and Tractus Asia 23
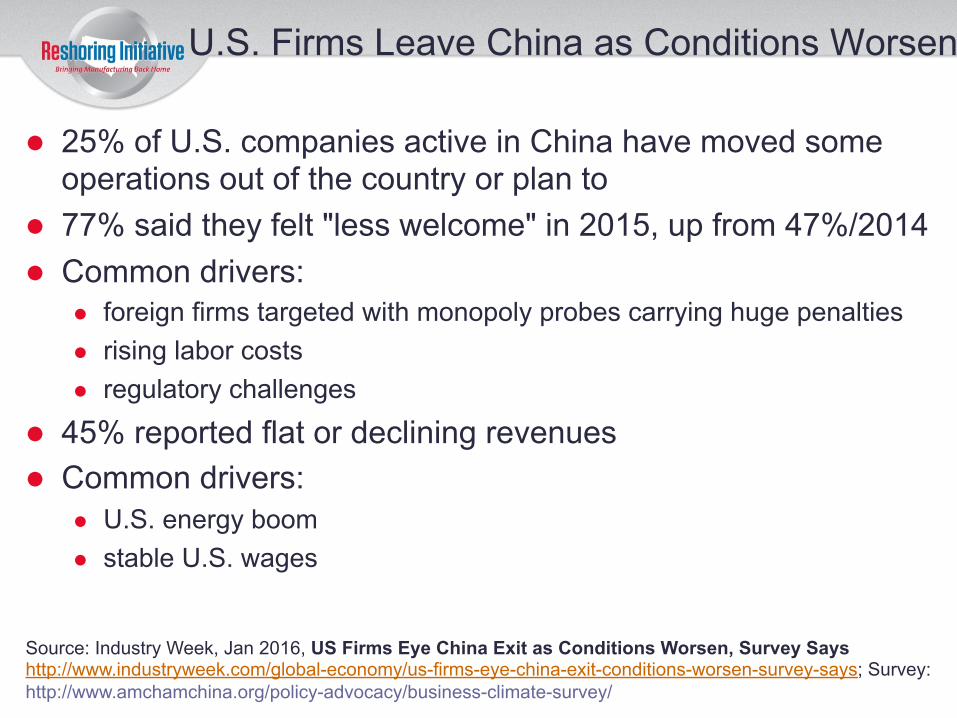
U.S. Firms Leave China as Conditions Worsen
l 25% of U.S. companies active in China have moved some operations out of the country or plan to
l 77% said they felt "less welcome" in 2015, up from 47%/2014 l Common drivers:
l foreign firms targeted with monopoly probes carrying huge penalties
l rising labor costs
l regulatory challenges
l 45% reported flat or declining revenues
l Common drivers: l U.S. energy boom
l stable U.S. wages
Source: Industry Week, Jan 2016, US Firms Eye China Exit as Conditions Worsen, Survey Says http://www.industryweek.com/global-economy/us-firms-eye-china-exit-conditions-worsen-survey-says; Survey: http://www.amchamchina.org/policy-advocacy/business-climate-survey/
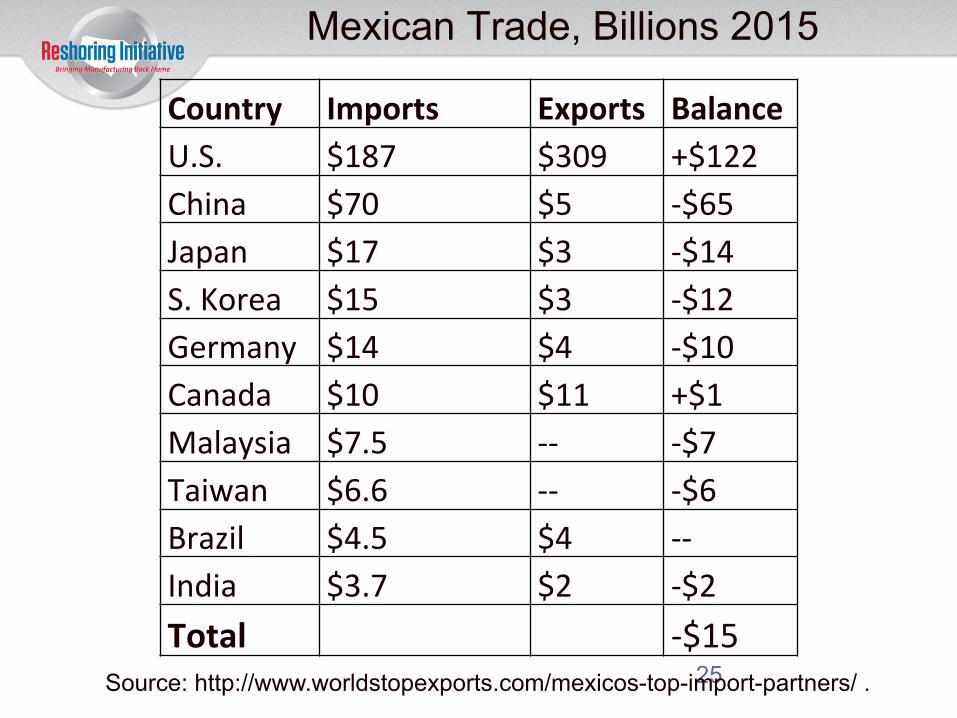
Mexican Trade, Billions 2015
Country Imports Exports Balance
U.S. $187 $309 +$122
China $70 $5 -‐$65
Japan $17 $3 -‐$14
S. Korea $15 $3 -‐$12
Germany $14 $4 -‐$10
Canada $10 $11 +$1
Malaysia $7.5 -‐-‐ -‐$7
Taiwan $6.6 -‐-‐ -‐$6
Brazil $4.5 $4 -‐-‐ India $3.7 $2 -‐$2
Total -‐$15 25 Source: http://www.worldstopexports.com/mexicos-top-import-partners/ .
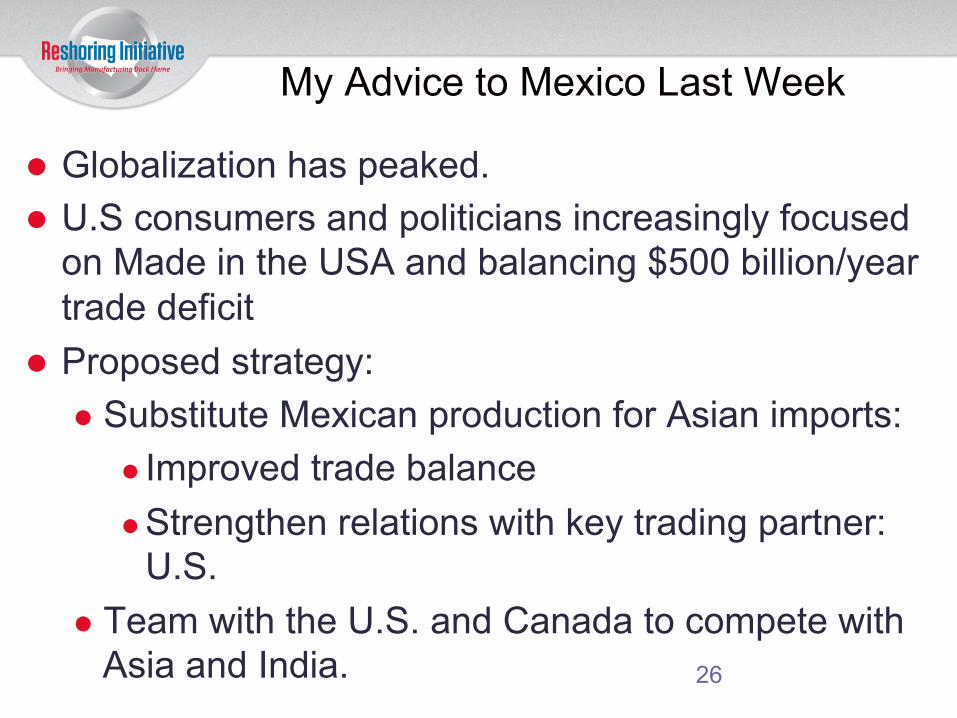
My Advice to Mexico Last Week
l Globalization has peaked. l U.S consumers and politicians increasingly focused
on Made in the USA and balancing $500 billion/year trade deficit
l Proposed strategy: l Substitute Mexican production for Asian imports:
l Improved trade balance l Strengthen relations with key trading partner:
U.S. l Team with the U.S. and Canada to compete with
Asia and India. 26
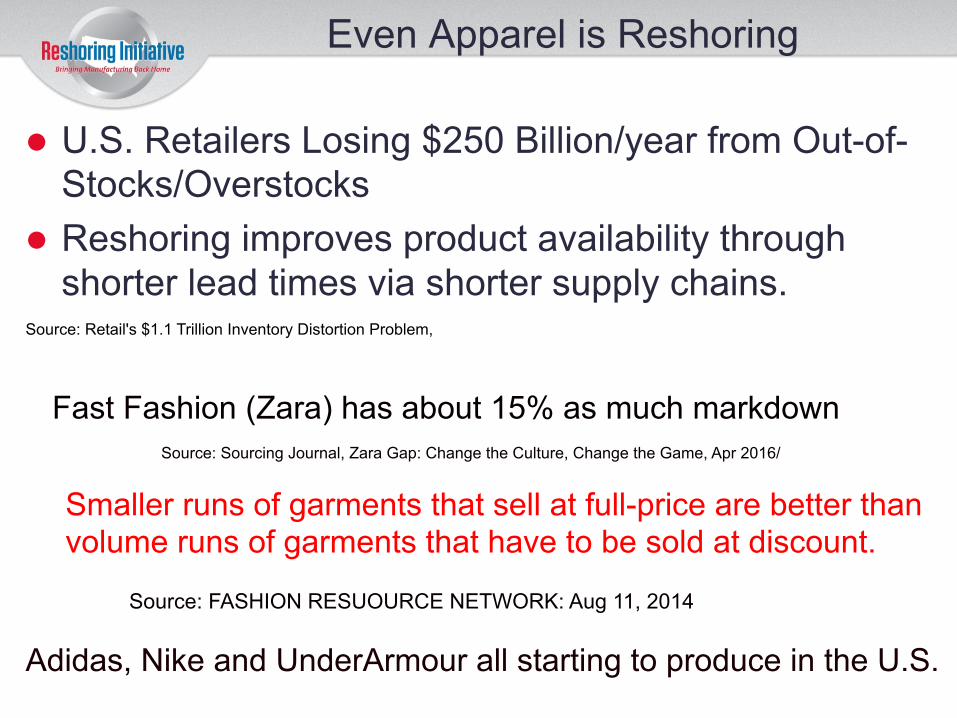
Even Apparel is Reshoring
l U.S. Retailers Losing $250 Billion/year from Out-of-Stocks/Overstocks
l Reshoring improves product availability through shorter lead times via shorter supply chains.
Fast Fashion (Zara) has about 15% as much markdown
Source: Retail's $1.1 Trillion Inventory Distortion Problem,
Source: Sourcing Journal, Zara Gap: Change the Culture, Change the Game, Apr 2016/
Smaller runs of garments that sell at full-price are better than volume runs of garments that have to be sold at discount.
Source: FASHION RESUOURCE NETWORK: Aug 11, 2014
Adidas, Nike and UnderArmour all starting to produce in the U.S.
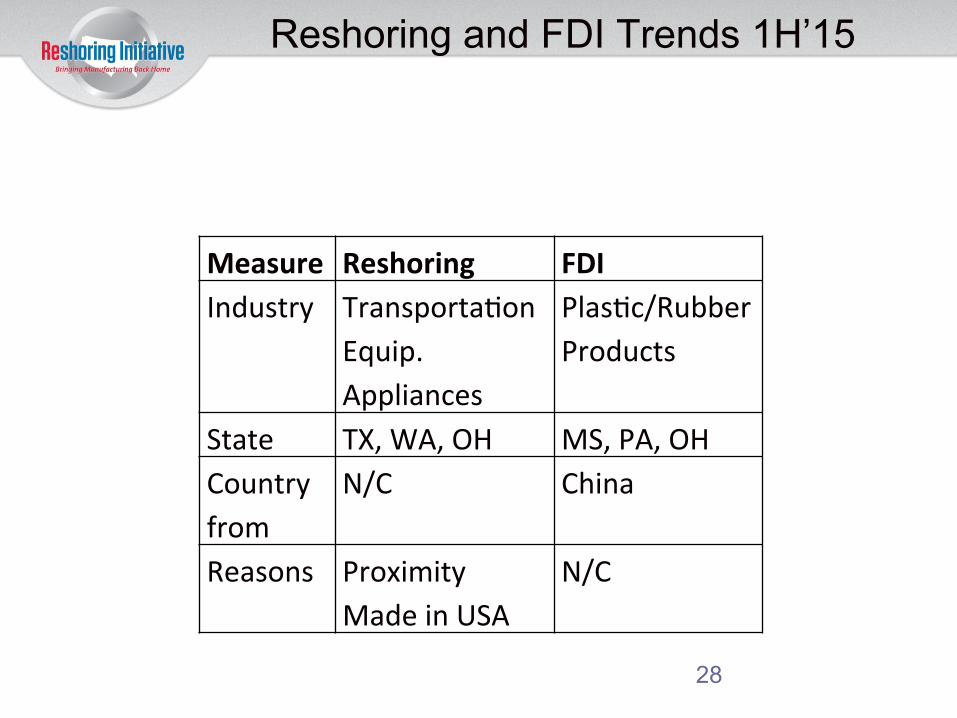
Reshoring and FDI Trends 1H’15
28
Measure Reshoring FDI Industry Transportabon
Equip. Appliances
Plasbc/Rubber Products
State TX, WA, OH MS, PA, OH
Country from
N/C China
Reasons Proximity
Made in USA
N/C
Other New
l 4.0 Will accelerate localization: l Smaller lots/customization l Very quick delivery increases local’s % advantage l Makes wage difference unimportant
l Hanjin Shipping: Delayed shipment l China’s Sentury Tire: 1,000 employee factory in GA
29
A non-profit with 24 sponsors 16 at IMTS
BronzeBronzeBronze
SteeelSStSteeleel
Iron
Iron
Steel
Bronze
30
Platinum
Gold
Silver
Help Reverse the Offshoring Flood Now!
Contact: Harry Moser Founder and President 847-726-2975 [email protected] www.reshorenow.org
31
Recommended