Scania AB (publ) SE-151 87 Södertälje tel. +46 8 553 810 00
Swedish corporate identity number Sweden fax +46 8 553 810 37
556184-8564 www.scania.com
Scania Year-end Report January-December 2010 Operating income rose to SEK 12,746 m. (2,473), and earnings per share rose to SEK 11.38 (1.41)
Net sales increased by 26 percent to SEK 78,168 m. (62,074)
Cash flow amounted to SEK 11,880 m. (5,512) in Vehicles and Services
The Board of Directors proposes a dividend of SEK 5.00 (1.00) per share
Comments by Leif Östling, President and CEO
“Scania’s earnings and cash flow for the full year 2010 were the best ever in the company’s history. Operating
income rose to SEK 12,746 m. Higher vehicle and service volume and significantly higher capacity utilisation
mainly explain the improvements. The global economic recovery led to increased activity in the transport industry
during 2010, with a number of markets outside Europe quickly rebounding after the downturn. The Brazilian
market, which has been strong due to high economic activity as well as tax breaks and interest rate subsidies,
has now stabilised at a high level. Scania has taken advantage of the Group’s common global product range and
production structure, which has enabled the company to meet the strong demand for vehicles and parts in Latin
America. Demand in Europe improved gradually during 2010 and freight prices began to recover. The Russian
truck market recovered strongly during the fourth quarter. Service volume in Europe gained momentum during
the second half of 2010, leading to higher capacity utilisation in workshops. The daily production rate at Scania’s
production units increased continuously during 2010 and Scania has been able to maintain short delivery times.
Scania has increased its workforce, and to ensure flexibility new employees have been hired on temporary
contracts. Since autumn 2010, Scania and MAN have been investigating a possible combination. No decision
has been made, since there are a number of outstanding issues of a commercial and legal nature. There is a
continued risk of bottlenecks among both sub-contractors and bodybuilding companies. Scania expects a level of
demand in early 2011 similar to the level seen in the second half of 2010. The negative effects of the stronger
SEK, which impacted the fourth quarter of 2010, will be more pronounced during the first quarter of 2011.”
Full year Change, % Q4 Change, %
Trucks and buses
Units 2010 2009
2010 2009
– Order bookings 74,210 38,802 91 21,758 13,884 57
– Deliveries 63,712 43,443 47 20,163 13,753 47
Net sales and earnings
SEK m. (unless otherwise stated) EUR m.*
Net sales, Scania Group 8,683 78,168 62,074 26 22,505 18,360 23
Operating income, Vehicles and
Services 1,397 12,575 2,648
-
3,645 1,524
-
Operating income, Financial Services 19 171 -175 - 80 -93 -
Operating income 1,416 12, 746 2,473 - 3,725 1,431 -
Income before taxes 1,393 12,533 1,602 - 3,776 1,236 -
Net income for the period 1,011 9,103 1,129 - 3,000 822 -
Operating margin, percent 16.3 4.0 16.6 7.8
Return on equity, percent 34.7 5.1
Return on capital employed, Vehicles
and Services 39.5 9.4
Earnings per share, SEK 11.38 1.41 3.75 1.03
Cash flow, Vehicles and Services 1,320 11,880 5,512 3,492 2,495
Number of shares: 800 million
* Translated to EUR solely for the convenience of the reader at a closing day rate of SEK 9.00 = EUR 1.00.
Unless otherwise stated, all comparisons refer to the corresponding period of the preceding year. This report has not been reviewed by the company’s auditors. This report is also available on www.scania.com/se
2 February 2011
2
Business overview Vehicles and Services
During 2010, total deliveries increased by 47 percent
to 63,712 (43,443) vehicles, compared to 2009. Net
sales rose by 26 percent to SEK 78,168 m. Currency
rate effects, excluding currency hedges, had a
negative impact of 4 percent.
Order bookings rose by 91 percent to 74,210 (38,802)
vehicles compared to 2009, of which the first part was
characterised by cancellations and great uncertainty
among customers.
During the fourth quarter, deliveries increased by
47 percent to 20,163 vehicles. Net sales rose by
23 percent to SEK 22,505 m. Currency rate effects,
excluding currency hedges, had a negative impact of
5 percent. Order bookings increased by 57 percent
compared to the fourth quarter of 2009.
During 2010, demand recovered in Scania’s markets
and the daily production rate increased gradually.
Scania increased its workforce, mainly at production
units but also in the sales and service network as
well as in research and development during 2010.
Hiring has mainly been in the form of fixed term
temporary contracts to ensure flexibility. Together
with the training programmes carried out at
production units during 2009, the workforce increase
has enabled Scania to maintain short, stable delivery
times and thereby limit the order book.
The recovery was most pronounced in Brazil, and
Scania has taken advantage of the Group’s common
global product range and production structure to
supply Latin America with components from its
European production units.
In April, Scania launched a new range of V8 trucks,
including a new top-of-the-line model that is the most
powerful truck to date in the market. The engine
features an output of 730 horsepower and has a
torque of 3,500 Nm. The truck is mainly intended for
the heaviest, most demanding long-haul segments.
With the introduction of the new V8 range, Scania
has the technical solutions and the engine platform
needed to fulfil the Euro 6 emission standards that
go into effect at the end of 2013.
Since 2010, Scania and MAN have investigated different projects in the industrial area, mainly related to
commercial vehicles, which would make it possible for the two companies to profit from synergies in research
and development, manufacturing and sourcing.
Order bookings, Scania trucks
Full year
2010
Full year
2009
Change,
%
Europe 29,176 14,473 102
Eurasia 3,861 739 -
America* 18,868 11,214 68
Asia 12,295 4,208 192
Africa and Oceania 3,136 2,374 32
Total 67,336 33,008 104
Deliveries, Scania trucks
Full year
2010
Full year
2009
Change,
%
Europe 23,315 18,824 24
Eurasia 2,369 1,084 119
America* 18,056 9,566 89
Asia 10,179 4,843 110
Africa and Oceania 2,918 2,490 17
Total 56,837 36,807 54
Order bookings, Scania buses and coaches
Full year
2010
Full year
2009
Change,
%
Europe 1,720 1,679 2
Eurasia 72 33 118
America* 2,358 1,538 53
Asia 2,110 1,718 23
Africa and Oceania 614 826 -26
Total 6,874 5,794 19
Deliveries, Scania buses and coaches
Full year
2010
Full year
2009 Change,
%
Europe 1,760 1,954 -10
Eurasia 82 130 -37
America* 2,104 1,421 48
Asia 2,120 1,876 13
Africa and Oceania 809 1,255 -36
Total 6,875 6,636 4 *Refers to Latin America. For more information on the new geographic areas, please see www.scania.com, Investor Relations.
3
This process has shown that a full realisation of potential
synergies requires closer cooperation by combining the
two companies, while maintaining the unique brand
values of the respective company. No decision has been
made, since there are a number of outstanding issues of
a commercial and legal nature.
Trucks
The entire European truck market improved during 2010.
The recovery was most pronounced in northern Europe.
The Russian truck market recovered strongly during the
fourth quarter.
In Latin America, demand has been at a high level,
especially in Brazil, where growth has been very strong
due to high economic activity. The market is also being
supported by interest rate subsidies and tax breaks.
In Asia, a recovery has occurred in all segments.
Sales of used trucks increased by 5 percent during 2010.
The inventory of used trucks gradually decreased during
the year and is now at a normal level. The price level
was higher and more stable than in 2009.
Scania noted an upturn in its short-term renting business
in western Europe and expanded capacity during the
year.
Scania’s order bookings during 2010 amounted to
67,336 (33,008) trucks, an increase of 104 percent.
The first half of 2009, in particular, was characterised
by cancellations and great uncertainty among customers,
which resulted in a very low level of orders in several
regions. In Europe, order bookings were up 102 percent
to 29,176 (14,473) units during the full year 2010.
Demand increased in virtually all markets, especially
Germany, France, the Nordic countries, the Netherlands
and Great Britain. In Eurasia, order bookings rose to
3,861 (739) trucks, mainly because of increased demand
in Russia.
In Latin America, order bookings climbed 68 percent during the full year. Order bookings were especially strong
in Brazil, which accounted for the bulk of the upturn. Demand also increased in Argentina.
Order bookings in Asia rose to 12,295 (4,208) units, mainly attributable to the Middle East and Hong Kong. In
Africa and Oceania, order bookings rose to 3,136 (2,374) units, an upturn of 32 percent, mainly attributable to
South Africa.
During the fourth quarter, order bookings increased by 60 percent to 19,705 trucks. Order bookings rose in
Europe, Eurasia and Asia. In particular, the northern portions of western Europe and Russia showed a significant
recovery from a low level during the corresponding period of 2009. In Asia, demand improved primarily in the
Middle East and China. Order bookings fell somewhat in Latin America, mainly attributable to Brazil.
Scania’s truck deliveries increased by 54 percent to a total of 56,837 units during the full year 2010, compared
to 2009. In Europe, deliveries increased by 24 percent, mainly related to Germany and France. In Eurasia,
deliveries rose by 119 percent, due to an increase in Russia.
In Latin America, the delivery upturn was 89 percent, which was explained by very strong growth in Brazil. In Asia
as well as in Africa and Oceania, Scania also noted increased deliveries during the full year 2010.
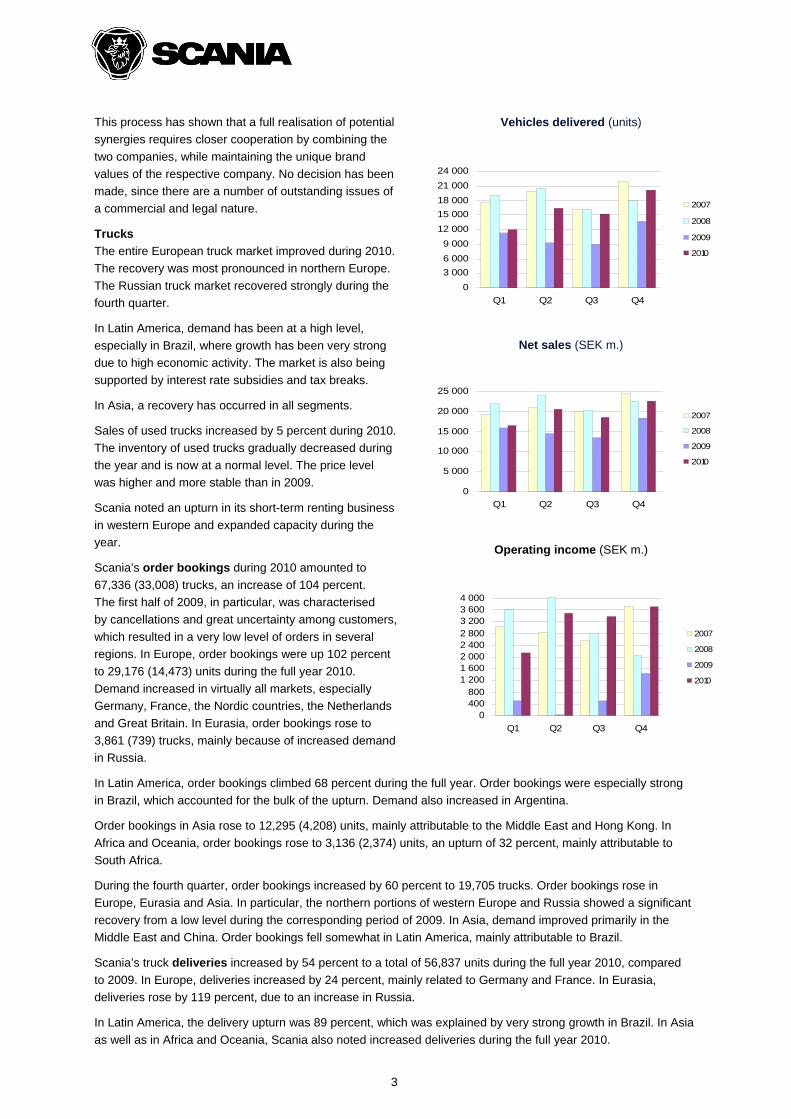
Vehicles delivered (units)
0
3 000
6 000
9 000
12 000
15 000
18 000
21 000
24 000
Q1 Q2 Q3 Q4
2007
2008
2009
2010
Net sales (SEK m.)
0
5 000
10 000
15 000
20 000
25 000
Q1 Q2 Q3 Q4
2007
2008
2009
2010
Operating income (SEK m.)
0400800
1 2001 6002 0002 4002 8003 2003 6004 000
Q1 Q2 Q3 Q4
2007
2008
2009
2010
4
During the fourth quarter, deliveries increased by 58 percent to 18,368 (11,628) units.
Net sales of trucks rose by 45 percent to SEK 47,580 m. (32,832) during the full year 2010.
During the fourth quarter, sales increased by 54 percent to SEK 15,110 m. (9,821).
The total market for heavy trucks in 25 of the European Union member countries (all EU countries except Greece
and Malta) plus Norway and Switzerland rose by 11 percent to about 178,100 units during 2010. Scania truck
registrations amounted to some 24,200 units, equivalent to a market share of about 13.6 (13.5) percent.
Buses and coaches
Scania’s order bookings for buses and coaches rose by 19 percent to 6,874 (5,794) units during the full year.
In Europe, demand increased by 2 percent compared to 2009. In Latin America, order bookings rose by 53
percent during 2010. In Asia, order bookings increased by 23 percent during the year. Demand in the Eurasian
market increased, while it shrank somewhat in Africa and Oceania.
During the fourth quarter, order bookings rose by 31 percent.
Scania’s bus and coach deliveries totalled 6,875 (6,636) units during 2010. In Europe, deliveries decreased by
10 percent in comparison to the previous year. The upturn of 48 percent in Latin America was related to Brazil
and Argentina. In Asia deliveries rose, mainly in the Middle East, while in Eurasia as well as Africa and Oceania
they declined.
Net sales of buses and coaches decreased by 13 percent to SEK 7,713 m. (8,837) during 2010.
Engines
Scania Engines is continuing to expand and strengthen its presence in the North American market. The
expansion of its service network is one element in its efforts to attract major customers in the industrial product
area. In 2010 Scania signed agreements with Terex, a leading US-based manufacturer of construction and
industrial machinery and also with Doosan, based in South Korea, to supply engines for that company’s dumpers
and wheel loaders from the new Scania engine platform. The first deliveries of engines to these customers began
late in 2010.
During the fourth quarter an agreement was signed with Shanghai Boden Engine Ltd concerning distribution of
Scania engines for power generation in the Chinese market.
Scania’s new industrial engine platform meets the legally mandated EU Stage IIIB and US Tier 4i emission
standards, which go into effect in 2011. These engines will also meet the next emission standards, EU Stage IV
and Tier 4, which go into effect in 2014, without forcing customers to make extensive machine installation
changes. The new engine platform is also available to customers for installation in power generation units
(gensets).
Order bookings for engines increased by 54 percent to 6,249 (4,064) units during 2010. The increase was
explained by a general upturn in Europe and Latin America. Engine deliveries rose by 54 percent to 6,526 (4,235)
units during the year, and net sales increased by 40 percent to SEK 1,148 m. (821). During the fourth quarter,
order bookings increased by 22 percent to 1,436 (1,178) units, and deliveries rose 26 percent to 2,041 (1,616)
units. Net sales totalled SEK 348 m. (288).
Services
Service revenue rose by 3 percent to SEK 16,455 m. (15,904) during 2010. Demand increased and aside from
Latin America and Asia, which noted good service demand throughout the year, the increase was more
pronounced in Europe as well during the latter part of the year. Higher volume was partly offset by negative
currency rate effects. During the fourth quarter, service revenue rose by 9 percent to SEK 4,290 m. (3,950). In
local currencies, the upturn was 16 percent. Higher demand in Europe resulted in higher capacity utilisation in
service workshops, compared to the previous year.
Scania is focusing on boosting the efficiency and capacity utilisation of service workshops. Scania is continuing
the expansion of its own service network by means of new and updated service workshops, in order to improve
accessibility and service for customers. To improve the uptime for customers’ vehicles, Scania is also adding
more services by providing repairs, maintenance and parts for trailers, superstructures and bus bodies, as well
as an enhanced service offering for older vehicles.
5
Earnings Vehicles and Services
Operating income in Vehicles and Services totalled SEK 12,575 m. (2,648) during 2010. Higher vehicle
deliveries and substantially increased capacity utilisation had a positive impact on earnings. Measures initiated
in 2009 to lower the cost level and improved earnings for used vehicles also had positive effects. A less
favourable market mix had a somewhat negative impact on margins.
Scania’s research and development expenditures amounted to SEK 3,688 m. (3,234). After adjusting for SEK
351 m. (282) in capitalised expenditures and SEK 168 m. (264) in depreciation of previously capitalised
expenditures, recognised expenses increased to SEK 3,505 m. (3,216).
During 2010, operating income was impacted positively by currency hedges. As of the end of 2010, Scania had
no hedges of future currency flows. Compared to 2009, currency spot rate effects amounted to SEK -365 m.
Currency hedging income totalled SEK 745 m. During 2009, currency hedging income totalled SEK -2,140 m.
The overall currency rate effect was thus SEK 2,520 m.
During the fourth quarter, operating income in Vehicles and Services totalled SEK 3,645 m. (1,524). The increase
in vehicle deliveries, higher capacity utilisation as well as higher prices had a positive impact on earnings.
Margins were somewhat negatively impacted by a less favourable market mix.
Scania’s research and development expenditures amounted to SEK 1,042 m. (827) during the fourth quarter.
After adjusting for SEK 94 m. (66) in capitalised expenditures and SEK 45 m. (41) in depreciation of previously
capitalised expenditures, recognised expenditures increased to SEK 993 m. (802).
Compared to the fourth quarter of 2009, currency spot rate effects amounted to SEK -200 m. Currency hedging
income totalled SEK 195 m. During the fourth quarter of 2009, currency hedging income totalled SEK -120 m.
The overall currency rate effect was thus SEK 115 m. compared to the fourth quarter of 2009.
Financial Services
At the end of 2010, the size of Scania’s customer finance portfolio amounted to SEK 36.1 billion, which
represented a decrease of SEK 4.3 billion since year-end 2009. In local currencies, the portfolio shrank by 2
percent, equivalent to SEK 0.7 billion.
The penetration rate was 39 (42) percent during the full year in those markets where Scania has its own
financing operations. Including Brazil, where such operations recently started, the penetration rate was 27
percent.
Operating income in Financial Services amounted to SEK 171 m. (-175) during 2010. Bad debt expenses
decreased but remained at a relatively high level. These expenses were mainly attributable to eastern Europe
and Eurasia. The year was characterised by recovery and improved capacity utilisation among hauliers as well
as by somewhat higher freight prices towards the end of the year. Operating income amounted to SEK 80 m.
(-93) during the fourth quarter as bad debt expenses decreased.
Scania Group
Scania’s operating income in 2010 amounted to SEK 12,746 m. (2,473). Operating margin increased to 16.3
(4.0) percent. Scania’s net financial items totalled SEK -213 m. (-871). Net interest items amounted to SEK -193
m. (-722). Net interest items were favourably affected by a positive average net cash position, compared to an
average net debt during 2009. Other financial income and expenses amounted to SEK -20 m. (-149).
The Scania Group’s tax expense amounted to SEK 3,430 m. (473) corresponding to 27.4 (29.5) percent of
income before taxes. Tax expenses during the year were to some extent positively influenced by non-recurring
items. Net income for the year amounted to SEK 9,103 m. (1,129), corresponding to a net margin of 11.6 (1.8)
percent. Earnings per share amounted to SEK 11.38 (1.41).
6
Cash flow Vehicles and Services
Scania’s cash flows in Vehicles and Services amounted to SEK 11,880 m. (5,512) during 2010. Tied-up working
capital decreased by SEK 1,708 m., mainly due to higher trade payables and lower inventories of used vehicles.
Net investments amounted to SEK 2,809 m. (3,149), including SEK 351 m. (287) in capitalisation of development
expenses. At the end of 2010, the net cash position in Vehicles and Services amounted to SEK 7,700 m.,
compared to a net debt position of SEK 4,038 m. on the same date in 2009.
Scania Group
Scania’s cash flow in Financial Services amounted to SEK 1,143 m. (5,015) during 2010, due to the reduced
customer finance portfolio. Together with the positive cash flow in Vehicles and Services as well as the effect of
the stronger Swedish krona, this reduced the Group’s net debt by about SEK 16.3 billion, compared to the end of
2009.
Outlook
There is a continued risk of bottlenecks among both sub-contractors and bodybuilding companies. Scania
expects a level of demand in early 2011 similar to the level seen in the second half of 2010. The negative effects
of the stronger SEK, which impacted the fourth quarter of 2010, will be more pronounced during the first quarter
of 2011.
Parent Company
The assets of the Parent Company, Scania AB, consist of shares in Scania CV AB; Scania CV AB is the parent
company of the group that comprises all production and sales and service companies as well as other
companies. Income before taxes of Scania AB totalled SEK 5,016 m. (2,006) during the full year 2010.
Miscellaneous Number of employees At the end of 2010, the number of employees totalled 35,514, compared to 32,330 on the same date in 2009.
Material risks and uncertainty factors
The section entitled “Risks and risk management” in Scania’s Annual Report for 2009 describes Scania’s
strategic, operational, legal and financial risks. Note 2 of the same report provides a detailed account of key
judgements and estimates. Note 30 of the same report describes the financial risks, such as currency risk and
interest rate risk. The risks that have the greatest impact on financial performance and on reporting for the Group
and the Parent Company are summarised as follows:
a) Sales with obligations
About 10 percent of the vehicles Scania sells are delivered with residual value obligations or repurchase
obligations. These are recognised as operating lease contracts, with the consequence that recognition of
revenue and earnings is allocated over the life of the obligation (contract). If there are major changes in the
market value of used vehicles, this increases the risk of future losses when selling returned vehicles. When a
residual value obligation is deemed likely to cause a future loss, a provision is made in cases where the expected
loss exceeds the as-yet-unrecognised profit on the vehicle. At the end of 2010, obligations related to residual
value or repurchases amounted to SEK 6,522 m., compared to SEK 6,306 m. at the end of 2009.
b) Credit risks
In its Financial Service operations, Scania has an exposure in the form of contractual future payments. This
exposure is reduced by the collateral Scania has in the form of the right to repossess the underlying vehicle. In
case the market value of the collateral does not cover the exposure to the customer, Scania runs a credit risk.
Reserves for probable losses in Financial Service operations are set aside in the estimated amounts required.
7
Accounting principles
Scania applies International Financial Reporting Standards (IFRSs) as adopted by the EU. The Year-end Report
of the Scania Group has been prepared in accordance with IAS 34, “Interim Financial Reporting” and the Annual
Accounts Act. New accounting standards being applied starting on 1 January 2010 are as follows:
Revised IFRS 3, “Business Combinations” − the standard deals with reporting of business combinations
(acquisitions of businesses) and includes a number of changes. The main changes concern the definition of a
business combination, two alternative methods for reporting goodwill and the requirement that transaction costs
shall be recognised as expenses when they arise. The standard is applied prospectively to acquisitions
implemented after 1 January 2010. The revised standard did not affect Scania’s financial reports during the year.
Other changes in IFRSs that entered into force on 1 January 2010 have not had any material impact on Scania’s
accounting.
Otherwise, accounting principles and calculation methods are unchanged from those applied in the Annual
Report for 2009.
The Year-end Report for the Parent Company, Scania AB, has been prepared in accordance with the Annual
Accounts Act and recommendation RFR 2, “Accounting for Legal Entities” of the Swedish Financial Accounting
Board.
Dividend
Scania’s Annual General Meeting on 6 May 2010 approved a dividend for 2009 of SEK 1.00 per share. A total of
SEK 800 m. was transferred to the shareholders.
Annual General Meeting and proposed dividend
Scania’s Annual General Meeting will be held on Thursday, 5 May 2011 in Södertälje, Sweden. The Board of
Directors proposes a dividend of SEK 5.00 (1.00) per share for the financial year 2010, with 10 May 2011 as the
record date.
8
The Board of Directors declares that this Year-end Report provides a true and fair overview of the Parent Company’s and Group’s operations, their financial position and performance, and describes the material risks and uncertainties facing the Parent Company and other companies in the Group.
Södertälje, 2 February 2011
Martin Winterkorn
Chairman
Jochem Heizmann Helmut Aurenz Åsa Thunman
Vice Chairman Board member Board member
Börje Ekholm Francisco J. Garcia Sanz Gunnar Larsson
Board member Board member Board member
Hans Dieter Pötsch Peter Wallenberg Jr Johan Järvklo Håkan Thurfjell
Board member Board member Board member Board member
Leif Östling
Board member
President and CEO
9
Financial information from Scania Scania’s Interim Report for the first quarter of 2011 will be published on 27 April 2011. The Annual Report for
2010 will be published on the website www.scania.com during Week 12 (21-27 March), 2011.
This report contains forward-looking statements that reflect management’s current views with respect to certain future
events and potential financial performance. Such forward-looking statements involve risks and uncertainties that could
significantly alter potential results. These statements are based on certain assumptions, including assumptions related
to general economic and financial conditions in the company’s markets and levels of demand for the company’s
products.
This report does not imply that the company has undertaken to revise these forward-looking statements, beyond what
is required by the rule book for issuers at the NASDAQ OMX Stockholm, if and when circumstances arise that will
lead to changes compared to the date when these statements were issued.
The Interim Report for January-September 2010 stated the following:
“The Brazilian truck market is strong as an effect of high economic activity, and demand is also benefiting from tax
breaks and interest rate subsidies. Demand throughout Europe, including Russia, improved during the period from a
very low level last year. The daily production rate has increased continuously during the period and Scania has
focused on maintaining short delivery times. The increase in the production rate has meant that the risk of
bottlenecks has increased among both sub-contractors and bodybuilding companies.”
Contact persons:
Per Hillström Erik Ljungberg
Investor Relations Corporate Relations
Tel. +46 8 553 502 26 tel. +46 8 553 835 57
mobile tel. +46 70 648 30 52 mobile tel. +46 73 988 35 57
The information in this Year-end Report is that which Scania is required to disclose under Sweden’s Securities
Market Act and/or the Financial Instruments Trading Act. It was released for publication at 09.30 CET on 2 February
2011.
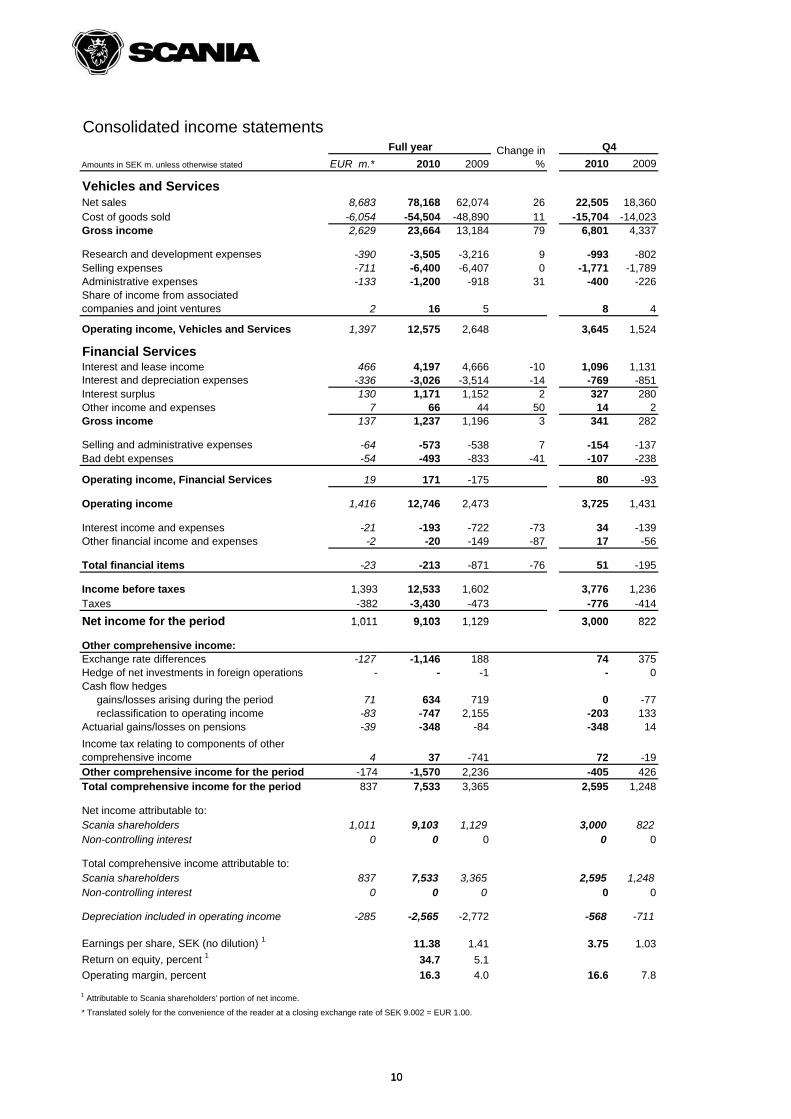
Consolidated income statements
EUR m.* 2010 2009 2010 2009
Vehicles and ServicesNet sales 8,683 78,168 62,074 26 22,505 18,360Cost of goods sold -6,054 -54,504 -48,890 11 -15,704 -14,023Gross income 2,629 23,664 13,184 79 6,801 4,337
Research and development expenses -390 -3,505 -3,216 9 -993 -802Selling expenses -711 -6,400 -6,407 0 -1,771 -1,789Administrative expenses -133 -1,200 -918 31 -400 -226Share of income from associated companies and joint ventures 2 16 5 8 4
Operating income, Vehicles and Services 1,397 12,575 2,648 3,645 1,524
Financial ServicesInterest and lease income 466 4,197 4,666 -10 1,096 1,131Interest and depreciation expenses -336 -3,026 -3,514 -14 -769 -851Interest surplus 130 1,171 1,152 2 327 280Other income and expenses 7 66 44 50 14 2Gross income 137 1,237 1,196 3 341 282
Selling and administrative expenses -64 -573 -538 7 -154 -137Bad debt expenses -54 -493 -833 -41 -107 -238
Operating income, Financial Services 19 171 -175 80 -93
Operating income 1,416 12,746 2,473 3,725 1,431
Interest income and expenses -21 -193 -722 -73 34 -139Other financial income and expenses -2 -20 -149 -87 17 -56
Total financial items -23 -213 -871 -76 51 -195
Income before taxes 1,393 12,533 1,602 3,776 1,236Taxes -382 -3,430 -473 -776 -414
Net income for the period 1 011 9 103 1 129 3 000 822
Amounts in SEK m. unless otherwise stated
Change in %
Q4Full year
10
Net income for the period 1,011 9,103 1,129 3,000 822
Other comprehensive income:Exchange rate differences -127 -1,146 188 74 375Hedge of net investments in foreign operations - - -1 - 0Cash flow hedges gains/losses arising during the period 71 634 719 0 -77 reclassification to operating income -83 -747 2,155 -203 133Actuarial gains/losses on pensions -39 -348 -84 -348 14
Income tax relating to components of other comprehensive income 4 37 -741 72 -19Other comprehensive income for the period -174 -1,570 2,236 -405 426Total comprehensive income for the period 837 7,533 3,365 2,595 1,248
Net income attributable to:Scania shareholders 1,011 9,103 1,129 3,000 822Non-controlling interest 0 0 0 0 0
Total comprehensive income attributable to:Scania shareholders 837 7,533 3,365 2,595 1,248Non-controlling interest 0 0 0 0 0
Depreciation included in operating income -285 -2,565 -2,772 -568 -711
Earnings per share, SEK (no dilution) 1 11.38 1.41 3.75 1.03
Return on equity, percent 1 34.7 5.1
Operating margin, percent 16.3 4.0 16.6 7.8
1 Attributable to Scania shareholders' portion of net income.
* Translated solely for the convenience of the reader at a closing exchange rate of SEK 9.002 = EUR 1.00.
10
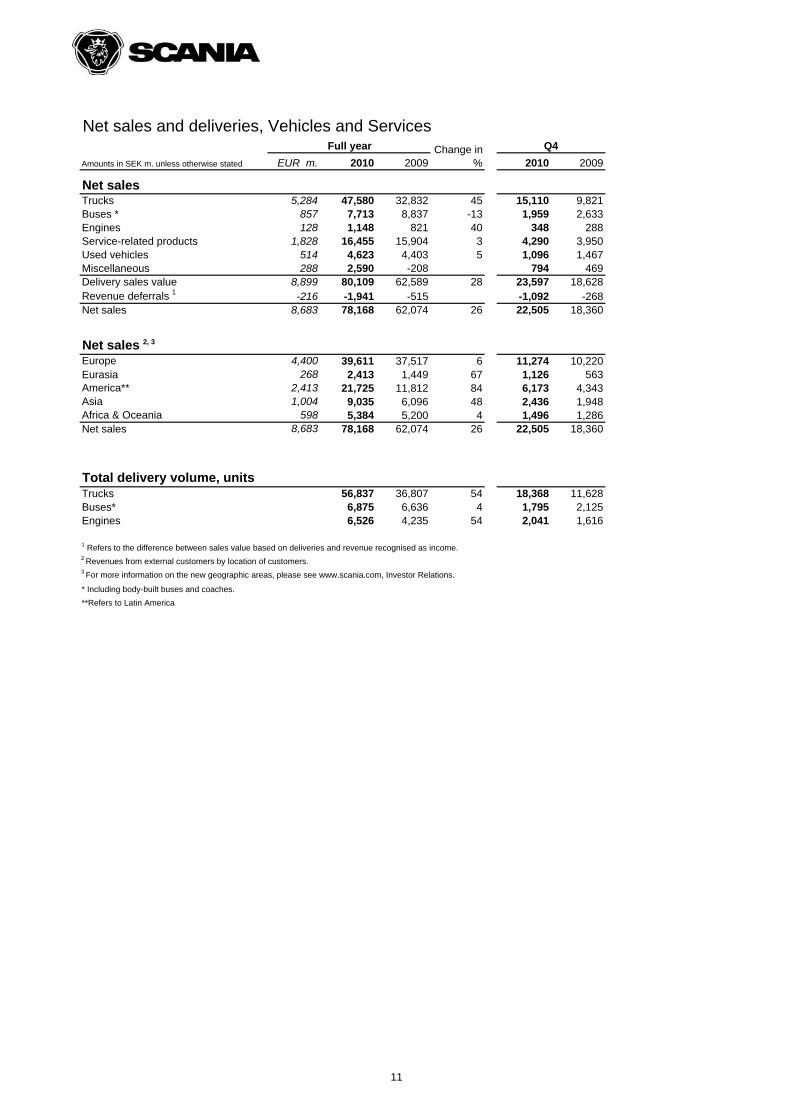
Net sales and deliveries, Vehicles and Services
EUR m. 2010 2009 2010 2009
Net salesTrucks 5,284 47,580 32,832 45 15,110 9,821Buses * 857 7,713 8,837 -13 1,959 2,633Engines 128 1,148 821 40 348 288Service-related products 1,828 16,455 15,904 3 4,290 3,950Used vehicles 514 4,623 4,403 5 1,096 1,467Miscellaneous 288 2,590 -208 794 469Delivery sales value 8,899 80,109 62,589 28 23,597 18,628Revenue deferrals 1 -216 -1,941 -515 -1,092 -268Net sales 8,683 78,168 62,074 26 22,505 18,360
Net sales 2, 3
Europe 4,400 39,611 37,517 6 11,274 10,220Eurasia 268 2,413 1,449 67 1,126 563America** 2,413 21,725 11,812 84 6,173 4,343Asia 1,004 9,035 6,096 48 2,436 1,948Africa & Oceania 598 5,384 5,200 4 1,496 1,286Net sales 8,683 78,168 62,074 26 22,505 18,360
Total delivery volume, unitsTrucks 56,837 36,807 54 18,368 11,628Buses* 6,875 6,636 4 1,795 2,125Engines 6,526 4,235 54 2,041 1,616
1 Refers to the difference between sales value based on deliveries and revenue recognised as income.2 Revenues from external customers by location of customers. 3 For more information on the new geographic areas, please see www.scania.com, Investor Relations.
* Including body-built buses and coaches.
**Refers to Latin America
Amounts in SEK m. unless otherwise stated
Full year Change in %
Q4
11
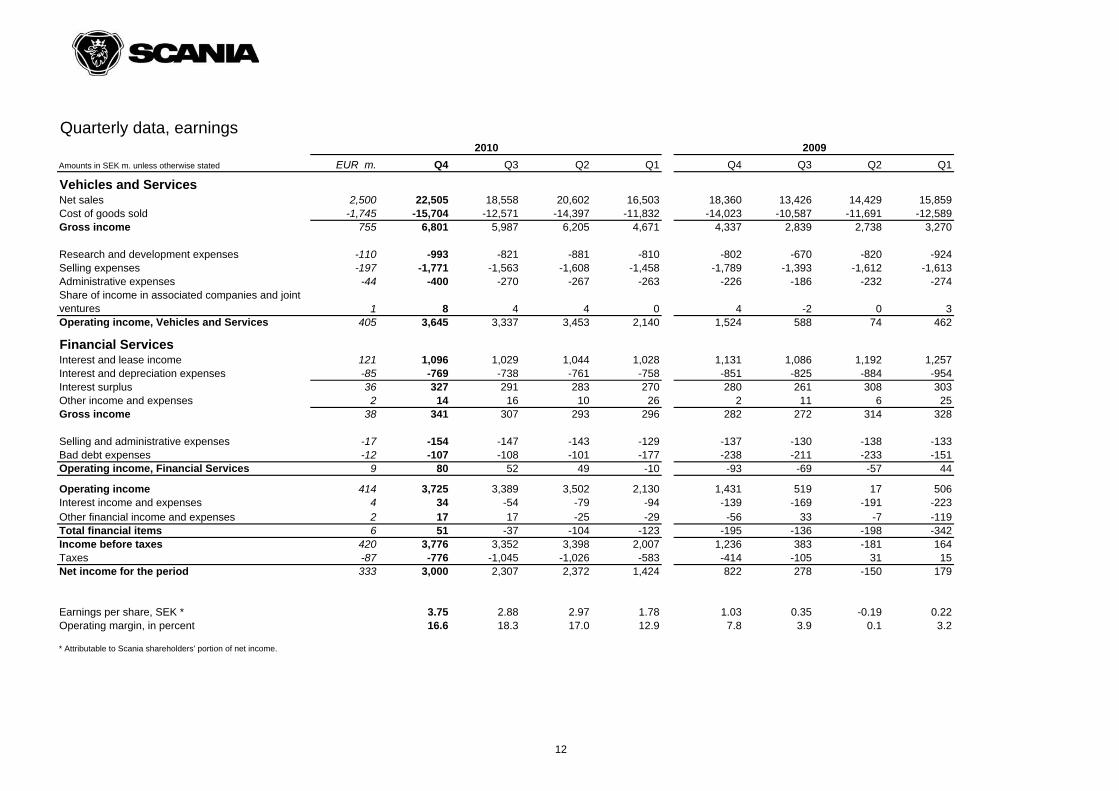
Quarterly data, earnings
EUR m. Q4 Q3 Q2 Q1 Q4 Q3 Q2 Q1
Vehicles and ServicesNet sales 2,500 22,505 18,558 20,602 16,503 18,360 13,426 14,429 15,859Cost of goods sold -1,745 -15,704 -12,571 -14,397 -11,832 -14,023 -10,587 -11,691 -12,589Gross income 755 6,801 5,987 6,205 4,671 4,337 2,839 2,738 3,270
Research and development expenses -110 -993 -821 -881 -810 -802 -670 -820 -924Selling expenses -197 -1,771 -1,563 -1,608 -1,458 -1,789 -1,393 -1,612 -1,613Administrative expenses -44 -400 -270 -267 -263 -226 -186 -232 -274Share of income in associated companies and joint ventures 1 8 4 4 0 4 -2 0 3Operating income, Vehicles and Services 405 3,645 3,337 3,453 2,140 1,524 588 74 462
Financial ServicesInterest and lease income 121 1,096 1,029 1,044 1,028 1,131 1,086 1,192 1,257Interest and depreciation expenses -85 -769 -738 -761 -758 -851 -825 -884 -954Interest surplus 36 327 291 283 270 280 261 308 303Other income and expenses 2 14 16 10 26 2 11 6 25Gross income 38 341 307 293 296 282 272 314 328
Selling and administrative expenses -17 -154 -147 -143 -129 -137 -130 -138 -133Bad debt expenses -12 -107 -108 -101 -177 -238 -211 -233 -151Operating income, Financial Services 9 80 52 49 -10 -93 -69 -57 44
Operating income 414 3,725 3,389 3,502 2,130 1,431 519 17 506Interest income and expenses 4 34 -54 -79 -94 -139 -169 -191 -223Other financial income and expenses 2 17 17 -25 -29 -56 33 -7 -119Total financial items 6 51 -37 -104 -123 -195 -136 -198 -342Income before taxes 420 3,776 3,352 3,398 2,007 1,236 383 -181 164Taxes -87 -776 -1,045 -1,026 -583 -414 -105 31 15Net income for the period 333 3,000 2,307 2,372 1,424 822 278 -150 179
Earnings per share, SEK * 3.75 2.88 2.97 1.78 1.03 0.35 -0.19 0.22Operating margin, in percent 16.6 18.3 17.0 12.9 7.8 3.9 0.1 3.2
* Attributable to Scania shareholders' portion of net income.
20092010
Amounts in SEK m. unless otherwise stated
12
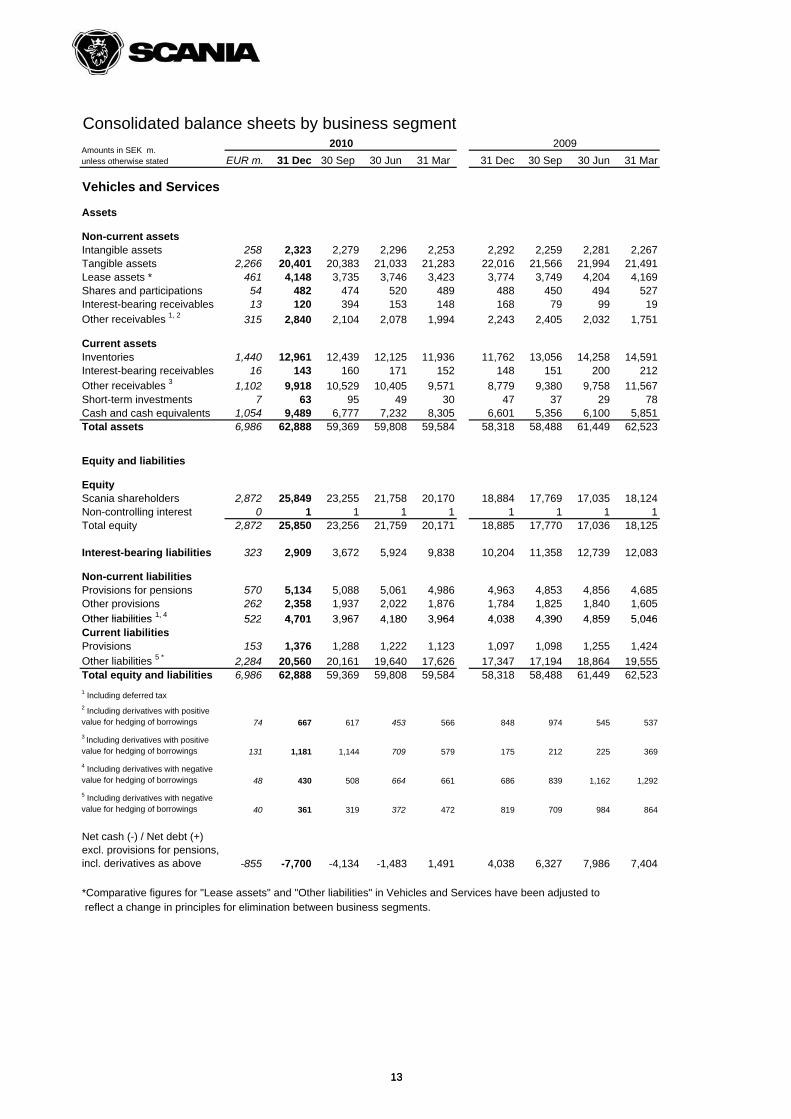
Consolidated balance sheets by business segment
EUR m. 31 Dec 30 Sep 30 Jun 31 Mar 31 Dec 30 Sep 30 Jun 31 Mar
Vehicles and Services
Assets
Non-current assetsIntangible assets 258 2,323 2,279 2,296 2,253 2,292 2,259 2,281 2,267Tangible assets 2,266 20,401 20,383 21,033 21,283 22,016 21,566 21,994 21,491Lease assets * 461 4,148 3,735 3,746 3,423 3,774 3,749 4,204 4,169Shares and participations 54 482 474 520 489 488 450 494 527Interest-bearing receivables 13 120 394 153 148 168 79 99 19
Other receivables 1, 2 315 2,840 2,104 2,078 1,994 2,243 2,405 2,032 1,751
Current assetsInventories 1,440 12,961 12,439 12,125 11,936 11,762 13,056 14,258 14,591Interest-bearing receivables 16 143 160 171 152 148 151 200 212
Other receivables 3 1,102 9,918 10,529 10,405 9,571 8,779 9,380 9,758 11,567Short-term investments 7 63 95 49 30 47 37 29 78Cash and cash equivalents 1,054 9,489 6,777 7,232 8,305 6,601 5,356 6,100 5,851Total assets 6,986 62,888 59,369 59,808 59,584 58,318 58,488 61,449 62,523
Equity and liabilities
EquityScania shareholders 2,872 25,849 23,255 21,758 20,170 18,884 17,769 17,035 18,124Non-controlling interest 0 1 1 1 1 1 1 1 1Total equity 2,872 25,850 23,256 21,759 20,171 18,885 17,770 17,036 18,125
Interest-bearing liabilities 323 2,909 3,672 5,924 9,838 10,204 11,358 12,739 12,083
Non-current liabilitiesProvisions for pensions 570 5,134 5,088 5,061 4,986 4,963 4,853 4,856 4,685Other provisions 262 2,358 1,937 2,022 1,876 1,784 1,825 1,840 1,605
Other liabilities 1, 4 522 4 701 3 967 4 180 3 964 4 038 4 390 4 859 5 046
2009Amounts in SEK m. unless otherwise stated
2010
13
Other liabilities , 522 4,701 3,967 4,180 3,964 4,038 4,390 4,859 5,046Current liabilitiesProvisions 153 1,376 1,288 1,222 1,123 1,097 1,098 1,255 1,424
Other liabilities 5 * 2,284 20,560 20,161 19,640 17,626 17,347 17,194 18,864 19,555Total equity and liabilities 6,986 62,888 59,369 59,808 59,584 58,318 58,488 61,449 62,523
1 Including deferred tax2 Including derivatives with positive value for hedging of borrowings 74 667 617 453 566 848 974 545 537
3 Including derivatives with positive value for hedging of borrowings 131 1,181 1,144 709 579 175 212 225 369
4 Including derivatives with negative value for hedging of borrowings 48 430 508 664 661 686 839 1,162 1,292
5 Including derivatives with negative value for hedging of borrowings 40 361 319 372 472 819 709 984 864
Net cash (-) / Net debt (+) excl. provisions for pensions, incl. derivatives as above -855 -7,700 -4,134 -1,483 1,491 4,038 6,327 7,986 7,404
*Comparative figures for "Lease assets" and "Other liabilities" in Vehicles and Services have been adjusted to reflect a change in principles for elimination between business segments.
13
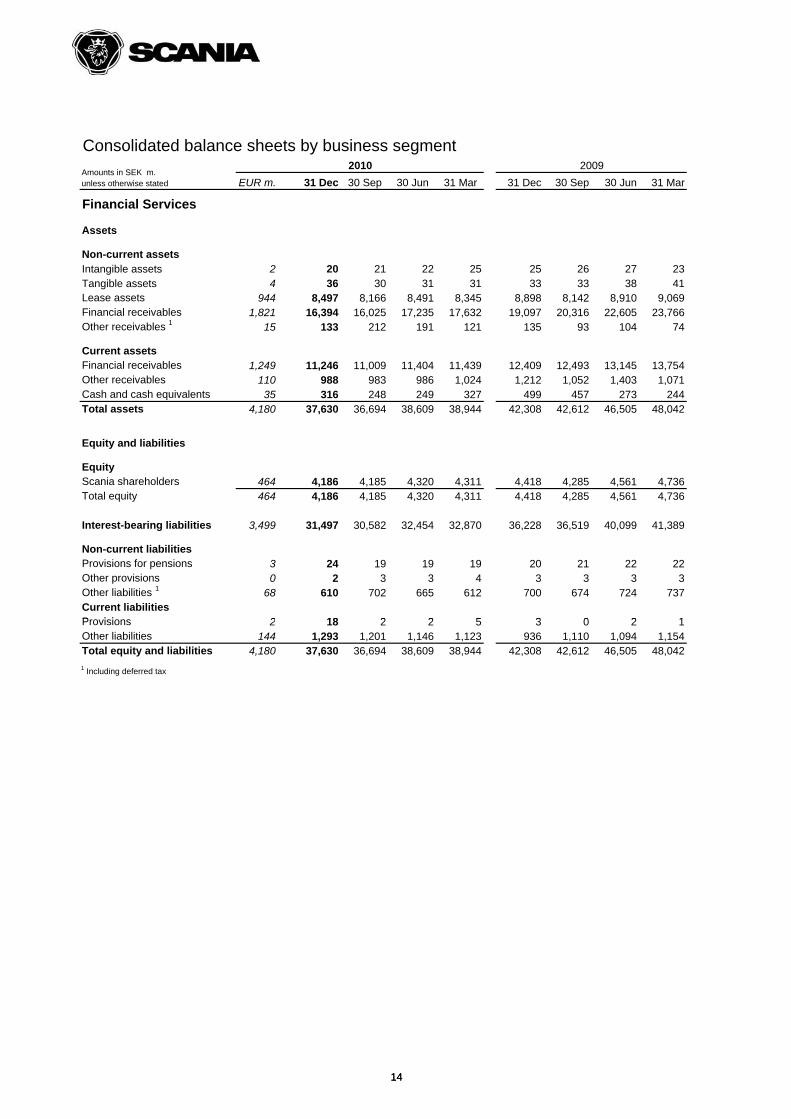
EUR m. 31 Dec 30 Sep 30 Jun 31 Mar 31 Dec 30 Sep 30 Jun 31 Mar
Financial Services
Assets
Non-current assetsIntangible assets 2 20 21 22 25 25 26 27 23Tangible assets 4 36 30 31 31 33 33 38 41Lease assets 944 8,497 8,166 8,491 8,345 8,898 8,142 8,910 9,069Financial receivables 1,821 16,394 16,025 17,235 17,632 19,097 20,316 22,605 23,766Other receivables 1 15 133 212 191 121 135 93 104 74
Current assetsFinancial receivables 1,249 11,246 11,009 11,404 11,439 12,409 12,493 13,145 13,754Other receivables 110 988 983 986 1,024 1,212 1,052 1,403 1,071Cash and cash equivalents 35 316 248 249 327 499 457 273 244Total assets 4,180 37,630 36,694 38,609 38,944 42,308 42,612 46,505 48,042
Equity and liabilities
EquityScania shareholders 464 4,186 4,185 4,320 4,311 4,418 4,285 4,561 4,736Total equity 464 4,186 4,185 4,320 4,311 4,418 4,285 4,561 4,736
Interest-bearing liabilities 3,499 31,497 30,582 32,454 32,870 36,228 36,519 40,099 41,389
Non-current liabilitiesProvisions for pensions 3 24 19 19 19 20 21 22 22Other provisions 0 2 3 3 4 3 3 3 3Other liabilities 1 68 610 702 665 612 700 674 724 737Current liabilitiesPro isions 2 18 2 2 5 3 0 2 1
20092010
Consolidated balance sheets by business segment
Amounts in SEK m. unless otherwise stated
14
Provisions 2 18 2 2 5 3 0 2 1Other liabilities 144 1,293 1,201 1,146 1,123 936 1,110 1,094 1,154Total equity and liabilities 4,180 37,630 36,694 38,609 38,944 42,308 42,612 46,505 48,042
1 Including deferred tax
14
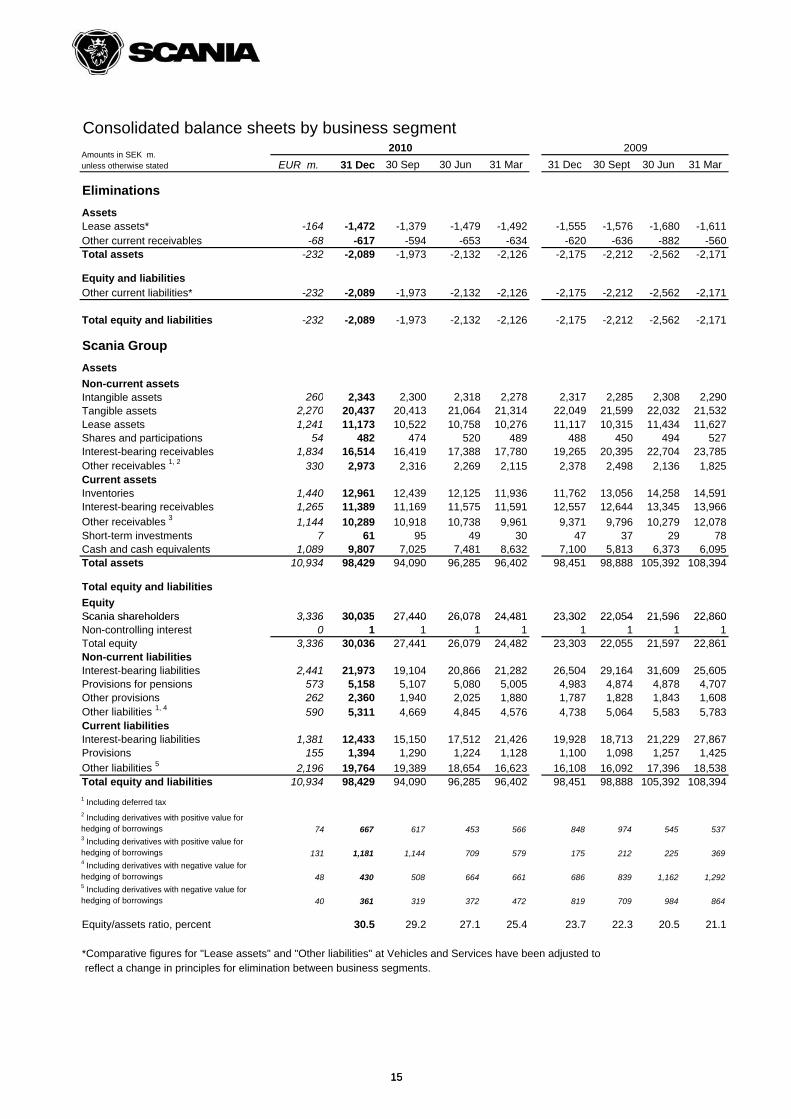
Consolidated balance sheets by business segment
EUR m. 31 Dec 30 Sep 30 Jun 31 Mar 31 Dec 30 Sept 30 Jun 31 Mar
Eliminations
AssetsLease assets* -164 -1,472 -1,379 -1,479 -1,492 -1,555 -1,576 -1,680 -1,611Other current receivables -68 -617 -594 -653 -634 -620 -636 -882 -560Total assets -232 -2,089 -1,973 -2,132 -2,126 -2,175 -2,212 -2,562 -2,171
Equity and liabilitiesOther current liabilities* -232 -2,089 -1,973 -2,132 -2,126 -2,175 -2,212 -2,562 -2,171
Total equity and liabilities -232 -2,089 -1,973 -2,132 -2,126 -2,175 -2,212 -2,562 -2,171
Scania Group
Assets
Non-current assetsIntangible assets 260 2,343 2,300 2,318 2,278 2,317 2,285 2,308 2,290Tangible assets 2,270 20,437 20,413 21,064 21,314 22,049 21,599 22,032 21,532Lease assets 1,241 11,173 10,522 10,758 10,276 11,117 10,315 11,434 11,627Shares and participations 54 482 474 520 489 488 450 494 527Interest-bearing receivables 1,834 16,514 16,419 17,388 17,780 19,265 20,395 22,704 23,785Other receivables 1, 2 330 2,973 2,316 2,269 2,115 2,378 2,498 2,136 1,825Current assetsInventories 1,440 12,961 12,439 12,125 11,936 11,762 13,056 14,258 14,591Interest-bearing receivables 1,265 11,389 11,169 11,575 11,591 12,557 12,644 13,345 13,966
Other receivables 3 1,144 10,289 10,918 10,738 9,961 9,371 9,796 10,279 12,078Short-term investments 7 61 95 49 30 47 37 29 78Cash and cash equivalents 1,089 9,807 7,025 7,481 8,632 7,100 5,813 6,373 6,095Total assets 10,934 98,429 94,090 96,285 96,402 98,451 98,888 105,392 108,394
Total equity and liabilities
EquityScania shareholders 3,336 30,035 27,440 26,078 24,481 23,302 22,054 21,596 22,860
20092010Amounts in SEK m. unless otherwise stated
15
Scania shareholders 3,336 30,035 27,440 26,078 24,481 23,302 22,054 21,596 22,860Non-controlling interest 0 1 1 1 1 1 1 1 1Total equity 3,336 30,036 27,441 26,079 24,482 23,303 22,055 21,597 22,861Non-current liabilitiesInterest-bearing liabilities 2,441 21,973 19,104 20,866 21,282 26,504 29,164 31,609 25,605Provisions for pensions 573 5,158 5,107 5,080 5,005 4,983 4,874 4,878 4,707Other provisions 262 2,360 1,940 2,025 1,880 1,787 1,828 1,843 1,608Other liabilities 1, 4 590 5,311 4,669 4,845 4,576 4,738 5,064 5,583 5,783Current liabilitiesInterest-bearing liabilities 1,381 12,433 15,150 17,512 21,426 19,928 18,713 21,229 27,867Provisions 155 1,394 1,290 1,224 1,128 1,100 1,098 1,257 1,425
Other liabilities 5 2,196 19,764 19,389 18,654 16,623 16,108 16,092 17,396 18,538Total equity and liabilities 10,934 98,429 94,090 96,285 96,402 98,451 98,888 105,392 108,394
1 Including deferred tax2 Including derivatives with positive value for hedging of borrowings 74 667 617 453 566 848 974 545 5373 Including derivatives with positive value for hedging of borrowings 131 1,181 1,144 709 579 175 212 225 3694 Including derivatives with negative value for hedging of borrowings 48 430 508 664 661 686 839 1,162 1,2925 Including derivatives with negative value for hedging of borrowings 40 361 319 372 472 819 709 984 864
Equity/assets ratio, percent 30.5 29.2 27.1 25.4 23.7 22.3 20.5 21.1
*Comparative figures for "Lease assets" and "Other liabilities" at Vehicles and Services have been adjusted to reflect a change in principles for elimination between business segments.
15
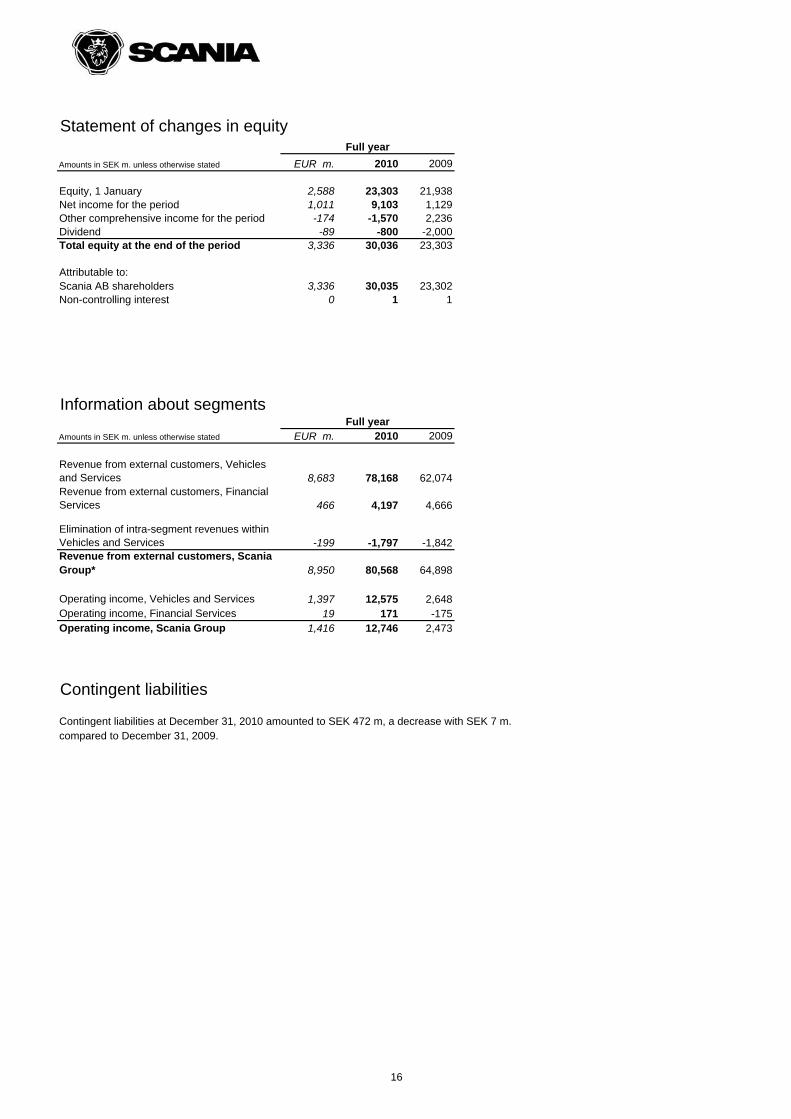
Statement of changes in equity
Amounts in SEK m. unless otherwise stated EUR m. 2010 2009
Equity, 1 January 2,588 23,303 21,938Net income for the period 1,011 9,103 1,129Other comprehensive income for the period -174 -1,570 2,236Dividend -89 -800 -2,000Total equity at the end of the period 3,336 30,036 23,303
Attributable to:Scania AB shareholders 3,336 30,035 23,302Non-controlling interest 0 1 1
Information about segments
Amounts in SEK m. unless otherwise stated EUR m. 2010 2009
Revenue from external customers, Vehicles and Services 8,683 78,168 62,074Revenue from external customers, Financial Services 466 4,197 4,666
Elimination of intra-segment revenues within Vehicles and Services -199 -1,797 -1,842Revenue from external customers, Scania Group* 8,950 80,568 64,898
Operating income, Vehicles and Services 1,397 12,575 2,648Operating income, Financial Services 19 171 -175Operating income, Scania Group 1,416 12,746 2,473
Contingent liabilities
Contingent liabilities at December 31, 2010 amounted to SEK 472 m, a decrease with SEK 7 m.compared to December 31, 2009.
Full year
Full year
16
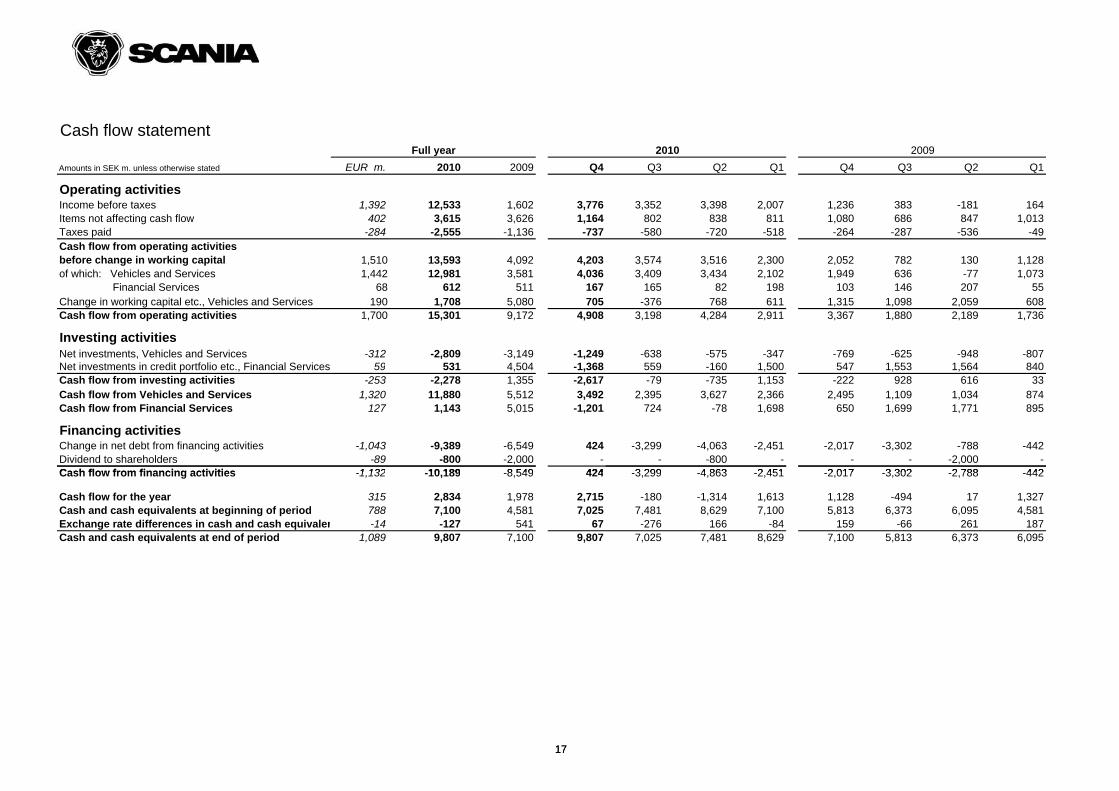
Cash flow statement
EUR m. 2010 2009 Q4 Q3 Q2 Q1 Q4 Q3 Q2 Q1
Operating activitiesIncome before taxes 1,392 12,533 1,602 3,776 3,352 3,398 2,007 1,236 383 -181 164Items not affecting cash flow 402 3,615 3,626 1,164 802 838 811 1,080 686 847 1,013Taxes paid -284 -2,555 -1,136 -737 -580 -720 -518 -264 -287 -536 -49Cash flow from operating activitiesbefore change in working capital 1,510 13,593 4,092 4,203 3,574 3,516 2,300 2,052 782 130 1,128of which: Vehicles and Services 1,442 12,981 3,581 4,036 3,409 3,434 2,102 1,949 636 -77 1,073 Financial Services 68 612 511 167 165 82 198 103 146 207 55Change in working capital etc., Vehicles and Services 190 1,708 5,080 705 -376 768 611 1,315 1,098 2,059 608Cash flow from operating activities 1,700 15,301 9,172 4,908 3,198 4,284 2,911 3,367 1,880 2,189 1,736
Investing activities Net investments, Vehicles and Services -312 -2,809 -3,149 -1,249 -638 -575 -347 -769 -625 -948 -807Net investments in credit portfolio etc., Financial Services 59 531 4,504 -1,368 559 -160 1,500 547 1,553 1,564 840Cash flow from investing activities -253 -2,278 1,355 -2,617 -79 -735 1,153 -222 928 616 33Cash flow from Vehicles and Services 1,320 11,880 5,512 3,492 2,395 3,627 2,366 2,495 1,109 1,034 874Cash flow from Financial Services 127 1,143 5,015 -1,201 724 -78 1,698 650 1,699 1,771 895
Financing activitiesChange in net debt from financing activities -1,043 -9,389 -6,549 424 -3,299 -4,063 -2,451 -2,017 -3,302 -788 -442Dividend to shareholders -89 -800 -2,000 - - -800 - - - -2,000 -Cash flow from financing activities 1 132 10 189 8 549 424 3 299 4 863 2 451 2 017 3 302 2 788 442
20092010
Amounts in SEK m. unless otherwise stated
Full year
17
Cash flow from financing activities -1,132 -10,189 -8,549 424 -3,299 -4,863 -2,451 -2,017 -3,302 -2,788 -442
Cash flow for the year 315 2,834 1,978 2,715 -180 -1,314 1,613 1,128 -494 17 1,327Cash and cash equivalents at beginning of period 788 7,100 4,581 7,025 7,481 8,629 7,100 5,813 6,373 6,095 4,581Exchange rate differences in cash and cash equivalen -14 -127 541 67 -276 166 -84 159 -66 261 187Cash and cash equivalents at end of period 1,089 9,807 7,100 9,807 7,025 7,481 8,629 7,100 5,813 6,373 6,095
17
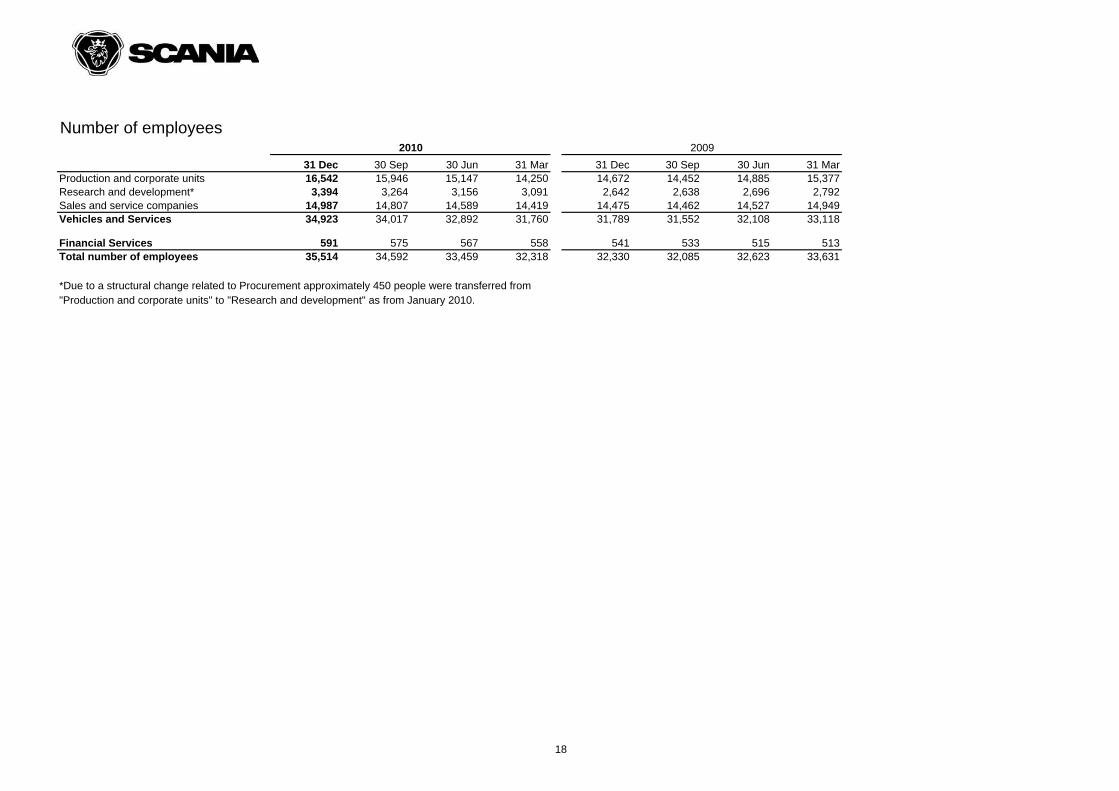
Number of employees
31 Dec 30 Sep 30 Jun 31 Mar 31 Dec 30 Sep 30 Jun 31 MarProduction and corporate units 16,542 15,946 15,147 14,250 14,672 14,452 14,885 15,377Research and development* 3,394 3,264 3,156 3,091 2,642 2,638 2,696 2,792Sales and service companies 14,987 14,807 14,589 14,419 14,475 14,462 14,527 14,949Vehicles and Services 34,923 34,017 32,892 31,760 31,789 31,552 32,108 33,118
Financial Services 591 575 567 558 541 533 515 513Total number of employees 35,514 34,592 33,459 32,318 32,330 32,085 32,623 33,631
*Due to a structural change related to Procurement approximately 450 people were transferred from "Production and corporate units" to "Research and development" as from January 2010.
20092010
18
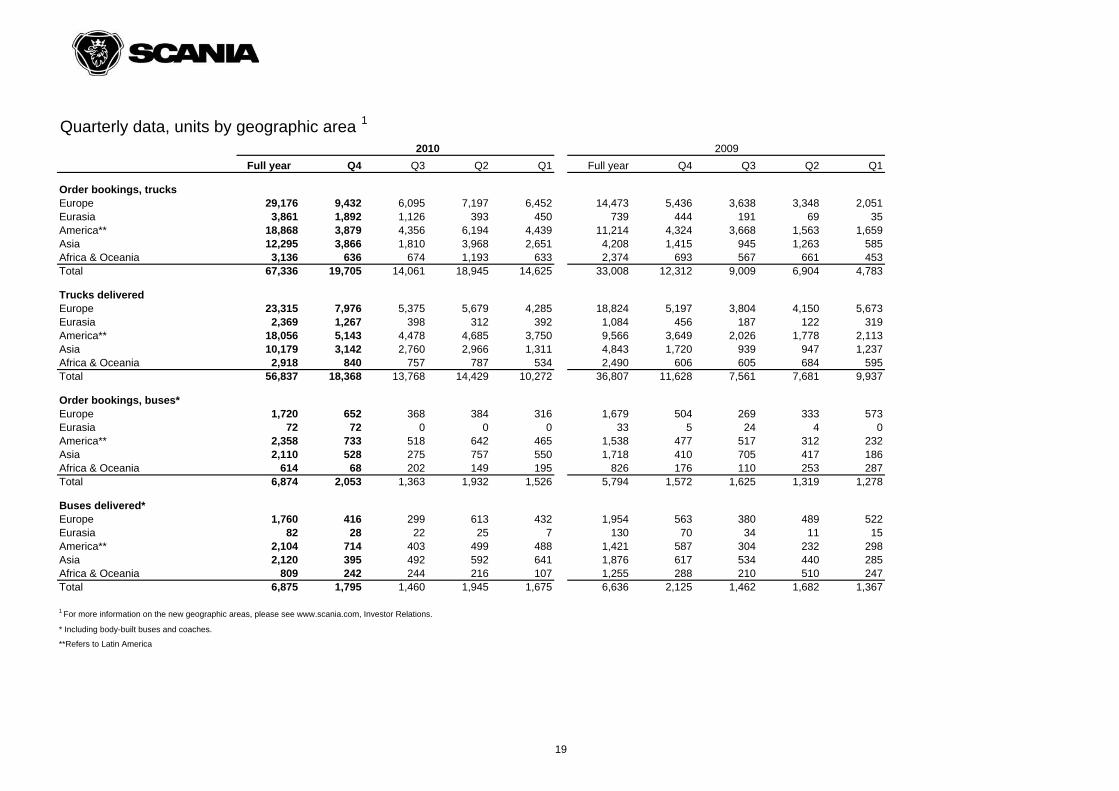
Quarterly data, units by geographic area 1
Full year Q4 Q3 Q2 Q1 Full year Q4 Q3 Q2 Q1
Order bookings, trucksEurope 29,176 9,432 6,095 7,197 6,452 14,473 5,436 3,638 3,348 2,051Eurasia 3,861 1,892 1,126 393 450 739 444 191 69 35America** 18,868 3,879 4,356 6,194 4,439 11,214 4,324 3,668 1,563 1,659Asia 12,295 3,866 1,810 3,968 2,651 4,208 1,415 945 1,263 585Africa & Oceania 3,136 636 674 1,193 633 2,374 693 567 661 453Total 67,336 19,705 14,061 18,945 14,625 33,008 12,312 9,009 6,904 4,783
Trucks deliveredEurope 23,315 7,976 5,375 5,679 4,285 18,824 5,197 3,804 4,150 5,673Eurasia 2,369 1,267 398 312 392 1,084 456 187 122 319America** 18,056 5,143 4,478 4,685 3,750 9,566 3,649 2,026 1,778 2,113Asia 10,179 3,142 2,760 2,966 1,311 4,843 1,720 939 947 1,237Africa & Oceania 2,918 840 757 787 534 2,490 606 605 684 595Total 56,837 18,368 13,768 14,429 10,272 36,807 11,628 7,561 7,681 9,937
Order bookings, buses*Europe 1,720 652 368 384 316 1,679 504 269 333 573Eurasia 72 72 0 0 0 33 5 24 4 0America** 2,358 733 518 642 465 1,538 477 517 312 232Asia 2,110 528 275 757 550 1,718 410 705 417 186Africa & Oceania 614 68 202 149 195 826 176 110 253 287Total 6,874 2,053 1,363 1,932 1,526 5,794 1,572 1,625 1,319 1,278
Buses delivered*Europe 1,760 416 299 613 432 1,954 563 380 489 522Eurasia 82 28 22 25 7 130 70 34 11 15America** 2,104 714 403 499 488 1,421 587 304 232 298Asia 2,120 395 492 592 641 1,876 617 534 440 285Africa & Oceania 809 242 244 216 107 1,255 288 210 510 247Total 6,875 1,795 1,460 1,945 1,675 6,636 2,125 1,462 1,682 1,367
1 For more information on the new geographic areas, please see www.scania.com, Investor Relations.
* Including body-built buses and coaches.
**Refers to Latin America
2010 2009
19
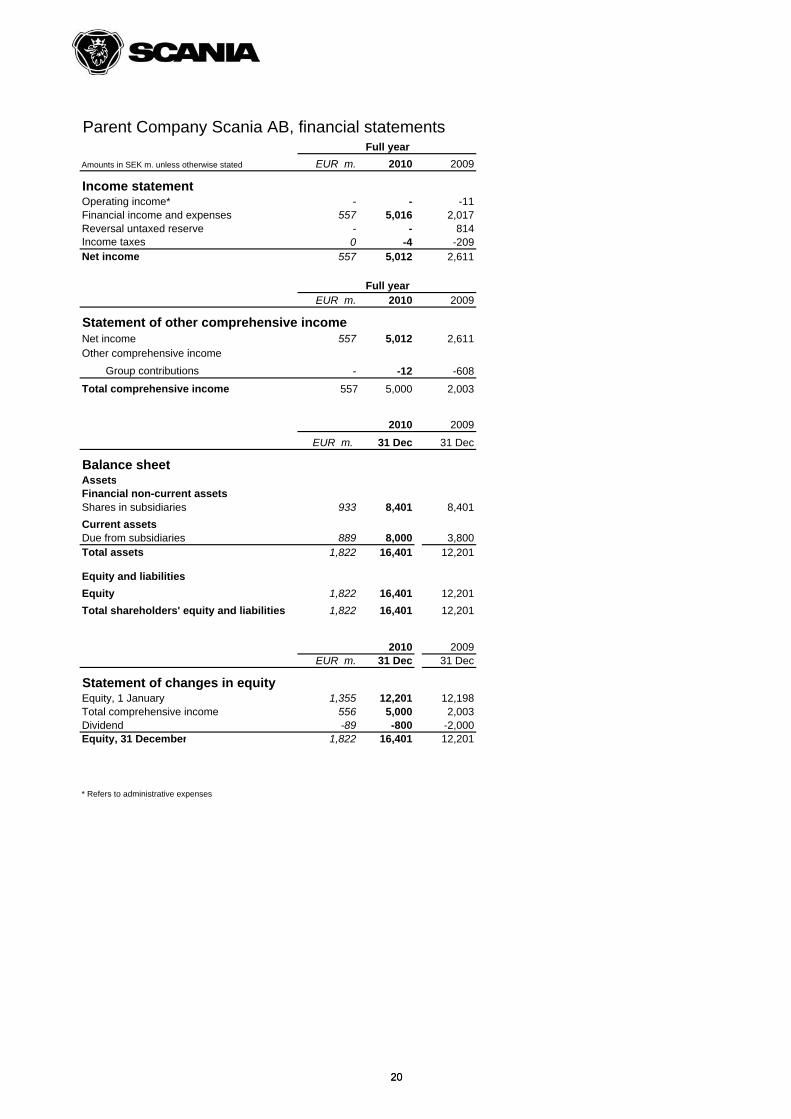
Parent Company Scania AB, financial statements
EUR m. 2010 2009
Income statementOperating income* - - -11Financial income and expenses 557 5,016 2,017Reversal untaxed reserve - - 814Income taxes 0 -4 -209Net income 557 5,012 2,611
EUR m. 2010 2009
Statement of other comprehensive incomeNet income 557 5,012 2,611Other comprehensive income
Group contributions - -12 -608
Total comprehensive income 557 5,000 2,003
2010 2009
EUR m. 31 Dec 31 Dec
Balance sheetAssetsFinancial non-current assetsShares in subsidiaries 933 8,401 8,401
Current assetsDue from subsidiaries 889 8,000 3,800Total assets 1,822 16,401 12,201
Equity and liabilities
Equity 1,822 16,401 12,201
Total shareholders' equity and liabilities 1,822 16,401 12,201
Full year
Amounts in SEK m. unless otherwise stated
Full year
20
2010 2009EUR m. 31 Dec 31 Dec
Statement of changes in equityEquity, 1 January 1,355 12,201 12,198Total comprehensive income 556 5,000 2,003Dividend -89 -800 -2,000Equity, 31 December 1,822 16,401 12,201
* Refers to administrative expenses
20
Recommended