School Accountability Report Card Reported for School Year 2002-2003
Published During 2003-2004
Notes regarding the source and currency of data:Data included in this School Accountability Report Card (SARC) are consistent with State Board ofEducation guidelines, which are available at the California Department of Education Web site athttp://www.cde.ca.gov/ope/sarc/data.htm. Most data presented in this report were collected from the2002-03 school year or from the two preceding years (2000-01 and 2001-02). Due to the certificationtimelines for graduation, dropout, and fiscal information, the data for these sections of the report werecollected in 2001-02. A glossary of terms is available at http://www.cde.ca.gov/demographics/glossary.
School Information District Information
School Name Piedmont Hills High District Name East Side Union High
Principal Carol Blackerby Superintendent Esperanza Zendejas, Ed.D.
Street 1377 Piedmont Road Street 830 N. Capitol Ave.
City, State, Zip San Jose, CA 95132-2497 City, State, Zip San Jose, CA 95133-1316
Phone Number 408.347.3800 Phone Number 408.347.5000
FAX Number 408.347.3805 FAX Number 408.347.5045
Web Site ph.campusgrid.net/home Web Site www.esuhsd.org
E-mail Address [email protected] E-mail Address [email protected]
CDS Code 43-69427-4335907 SARC Contact Art Darin
School Description and Mission Statement
School Description
Steeped in tradition, Piedmont Hills High School challenges students to set high academic and personalstandards and supports them in their pursuit of success. The faculty is strongly committed to providing thehighest quality educational program consistent with the expectation of the community. Many of thestudents enroll in post secondary education. Approximately 42% of the students meet 4-yearcollege/university requirements. 37% attend 4-year universities and 55% attend community colleges.Recent graduates have attended such prestigious colleges as MIT, Harvard, Stanford and all theUniversity of California campuses. The school, located in the northeast foothills of San Jose, is a compactcampus on 48 acres of a park-like setting. The school houses over 1,900 students of richly diversecultural backgrounds.
The school has an active school site council, a parent booster club, and various special program groups,e.g. band, drama, and athletics. In addition, the African American Parent Coalition, the Latino ParentEducation Network, and the Filipino Parents and Student Association, support specific ethnic groups. Arecent parent survey reflects that the school staff deals effectively with cultural diversity and that theschool is a good place to learn and a pleasant place to be.
MissionThe mission of Piedmont Hills High School is to provide all students with a strong educational program,one that develops academic, vocational, thinking, communication, technical, physical, and cooperativeskills. The staff will encourage respect for diversity, inspire an appreciation for the arts, and fosterresponsibility, self-esteem, healthful living, self-direction, tolerance, fairness, honesty, and respect. Thestaff will encourage each student to achieve his or her potential.
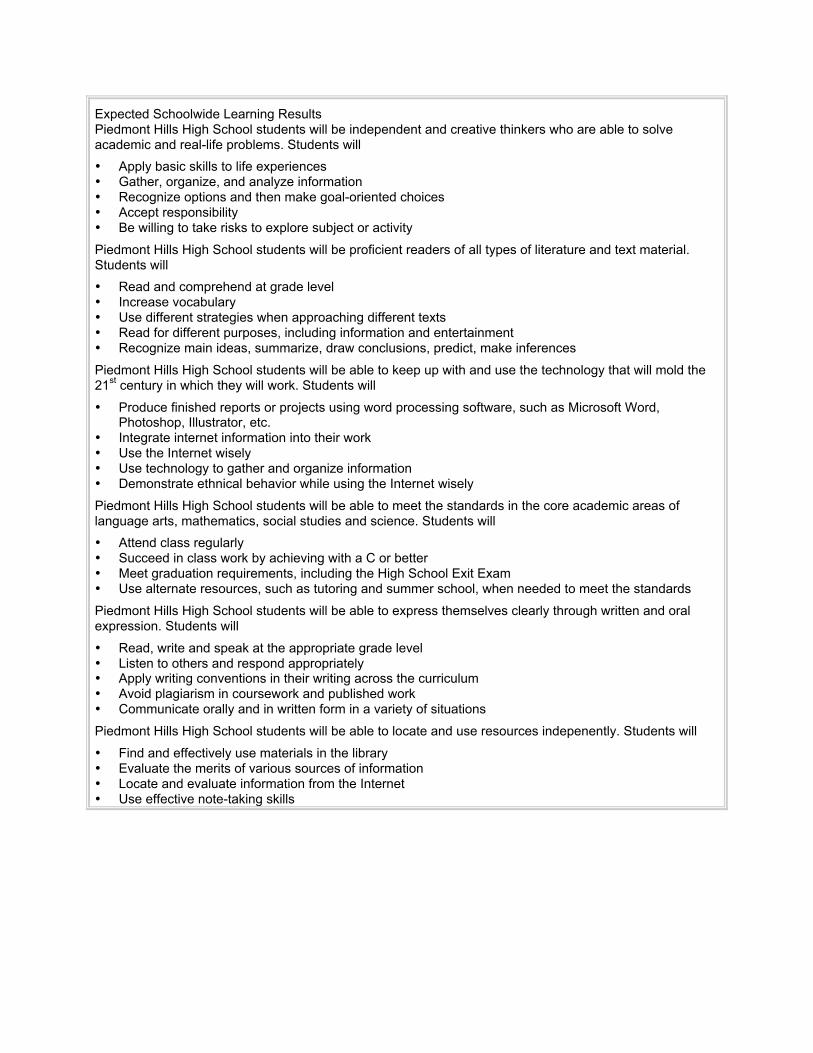
Expected Schoolwide Learning ResultsPiedmont Hills High School students will be independent and creative thinkers who are able to solveacademic and real-life problems. Students will
• Apply basic skills to life experiences• Gather, organize, and analyze information• Recognize options and then make goal-oriented choices• Accept responsibility• Be willing to take risks to explore subject or activity
Piedmont Hills High School students will be proficient readers of all types of literature and text material.Students will
• Read and comprehend at grade level• Increase vocabulary• Use different strategies when approaching different texts• Read for different purposes, including information and entertainment• Recognize main ideas, summarize, draw conclusions, predict, make inferences
Piedmont Hills High School students will be able to keep up with and use the technology that will mold the21
st century in which they will work. Students will
• Produce finished reports or projects using word processing software, such as Microsoft Word,Photoshop, Illustrator, etc.
• Integrate internet information into their work• Use the Internet wisely• Use technology to gather and organize information• Demonstrate ethnical behavior while using the Internet wisely
Piedmont Hills High School students will be able to meet the standards in the core academic areas oflanguage arts, mathematics, social studies and science. Students will
• Attend class regularly• Succeed in class work by achieving with a C or better• Meet graduation requirements, including the High School Exit Exam• Use alternate resources, such as tutoring and summer school, when needed to meet the standards
Piedmont Hills High School students will be able to express themselves clearly through written and oralexpression. Students will
• Read, write and speak at the appropriate grade level• Listen to others and respond appropriately• Apply writing conventions in their writing across the curriculum• Avoid plagiarism in coursework and published work• Communicate orally and in written form in a variety of situations
Piedmont Hills High School students will be able to locate and use resources indepenently. Students will
• Find and effectively use materials in the library• Evaluate the merits of various sources of information• Locate and evaluate information from the Internet• Use effective note-taking skills
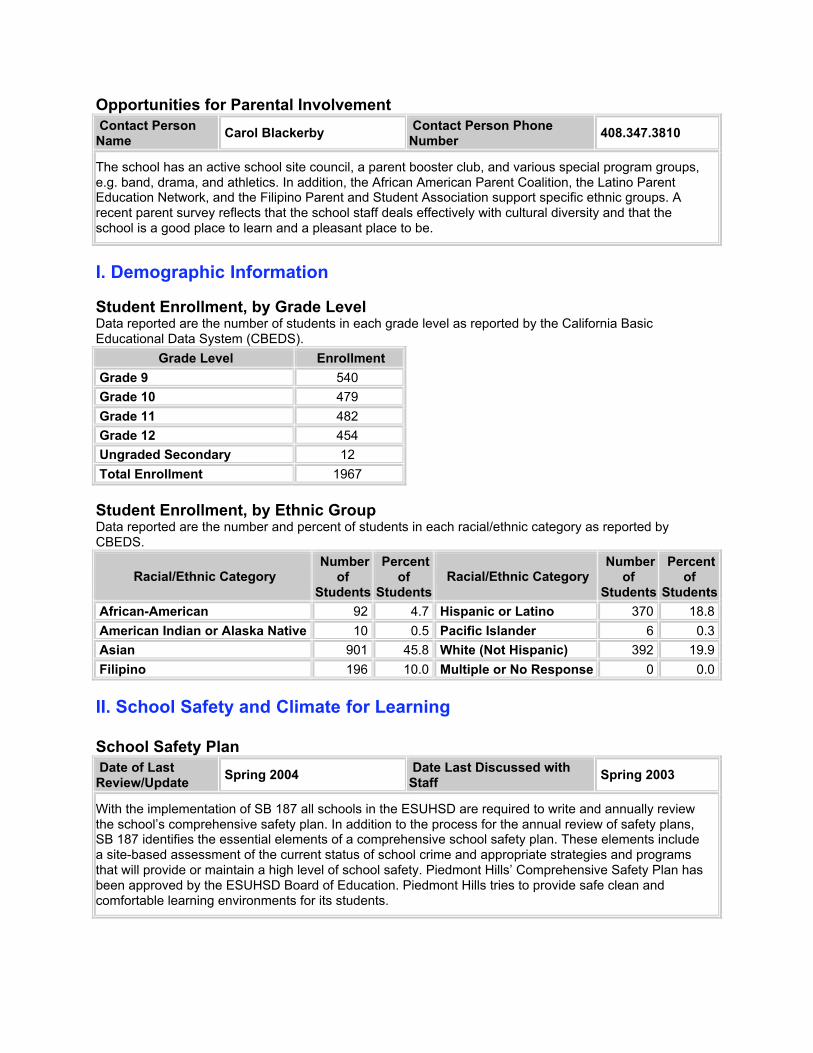
Opportunities for Parental Involvement
Contact PersonName
Carol Blackerby Contact Person PhoneNumber
408.347.3810
The school has an active school site council, a parent booster club, and various special program groups,e.g. band, drama, and athletics. In addition, the African American Parent Coalition, the Latino ParentEducation Network, and the Filipino Parent and Student Association support specific ethnic groups. Arecent parent survey reflects that the school staff deals effectively with cultural diversity and that theschool is a good place to learn and a pleasant place to be.
I. Demographic Information
Student Enrollment, by Grade LevelData reported are the number of students in each grade level as reported by the California BasicEducational Data System (CBEDS).
Grade Level Enrollment
Grade 9 540
Grade 10 479
Grade 11 482
Grade 12 454
Ungraded Secondary 12
Total Enrollment 1967
Student Enrollment, by Ethnic GroupData reported are the number and percent of students in each racial/ethnic category as reported byCBEDS.
Racial/Ethnic Category Number
ofStudents
Percentof
Students
Racial/Ethnic Category Number
ofStudents
Percentof
Students
African-American 92 4.7 Hispanic or Latino 370 18.8
American Indian or Alaska Native 10 0.5 Pacific Islander 6 0.3
Asian 901 45.8 White (Not Hispanic) 392 19.9
Filipino 196 10.0 Multiple or No Response 0 0.0
II. School Safety and Climate for Learning
School Safety Plan
Date of LastReview/Update
Spring 2004 Date Last Discussed withStaff
Spring 2003
With the implementation of SB 187 all schools in the ESUHSD are required to write and annually reviewthe school’s comprehensive safety plan. In addition to the process for the annual review of safety plans,SB 187 identifies the essential elements of a comprehensive school safety plan. These elements includea site-based assessment of the current status of school crime and appropriate strategies and programsthat will provide or maintain a high level of school safety. Piedmont Hills’ Comprehensive Safety Plan hasbeen approved by the ESUHSD Board of Education. Piedmont Hills tries to provide safe clean andcomfortable learning environments for its students.
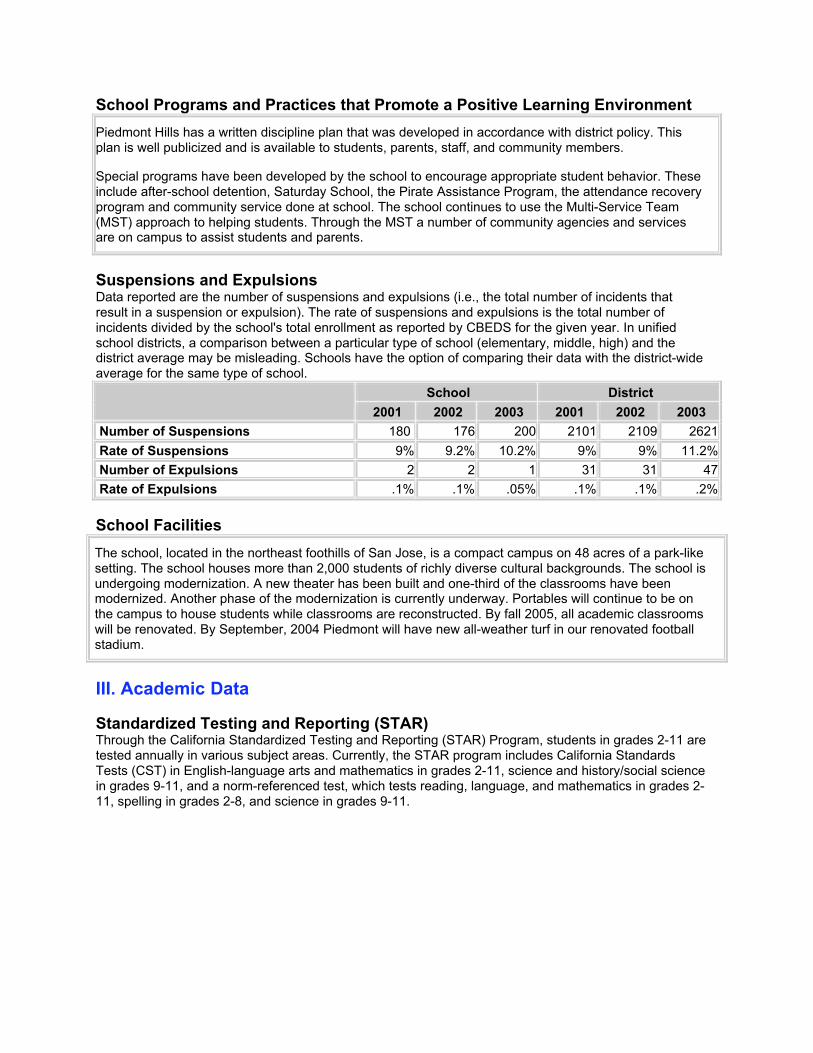
School Programs and Practices that Promote a Positive Learning Environment
Piedmont Hills has a written discipline plan that was developed in accordance with district policy. Thisplan is well publicized and is available to students, parents, staff, and community members.
Special programs have been developed by the school to encourage appropriate student behavior. Theseinclude after-school detention, Saturday School, the Pirate Assistance Program, the attendance recoveryprogram and community service done at school. The school continues to use the Multi-Service Team(MST) approach to helping students. Through the MST a number of community agencies and servicesare on campus to assist students and parents.
Suspensions and ExpulsionsData reported are the number of suspensions and expulsions (i.e., the total number of incidents thatresult in a suspension or expulsion). The rate of suspensions and expulsions is the total number ofincidents divided by the school's total enrollment as reported by CBEDS for the given year. In unifiedschool districts, a comparison between a particular type of school (elementary, middle, high) and thedistrict average may be misleading. Schools have the option of comparing their data with the district-wideaverage for the same type of school.
School District
2001 2002 2003 2001 2002 2003
Number of Suspensions 180 176 200 2101 2109 2621
Rate of Suspensions 9% 9.2% 10.2% 9% 9% 11.2%
Number of Expulsions 2 2 1 31 31 47
Rate of Expulsions .1% .1% .05% .1% .1% .2%
School Facilities
The school, located in the northeast foothills of San Jose, is a compact campus on 48 acres of a park-likesetting. The school houses more than 2,000 students of richly diverse cultural backgrounds. The school isundergoing modernization. A new theater has been built and one-third of the classrooms have beenmodernized. Another phase of the modernization is currently underway. Portables will continue to be onthe campus to house students while classrooms are reconstructed. By fall 2005, all academic classroomswill be renovated. By September, 2004 Piedmont will have new all-weather turf in our renovated footballstadium.
III. Academic Data
Standardized Testing and Reporting (STAR)Through the California Standardized Testing and Reporting (STAR) Program, students in grades 2-11 aretested annually in various subject areas. Currently, the STAR program includes California StandardsTests (CST) in English-language arts and mathematics in grades 2-11, science and history/social sciencein grades 9-11, and a norm-referenced test, which tests reading, language, and mathematics in grades 2-11, spelling in grades 2-8, and science in grades 9-11.
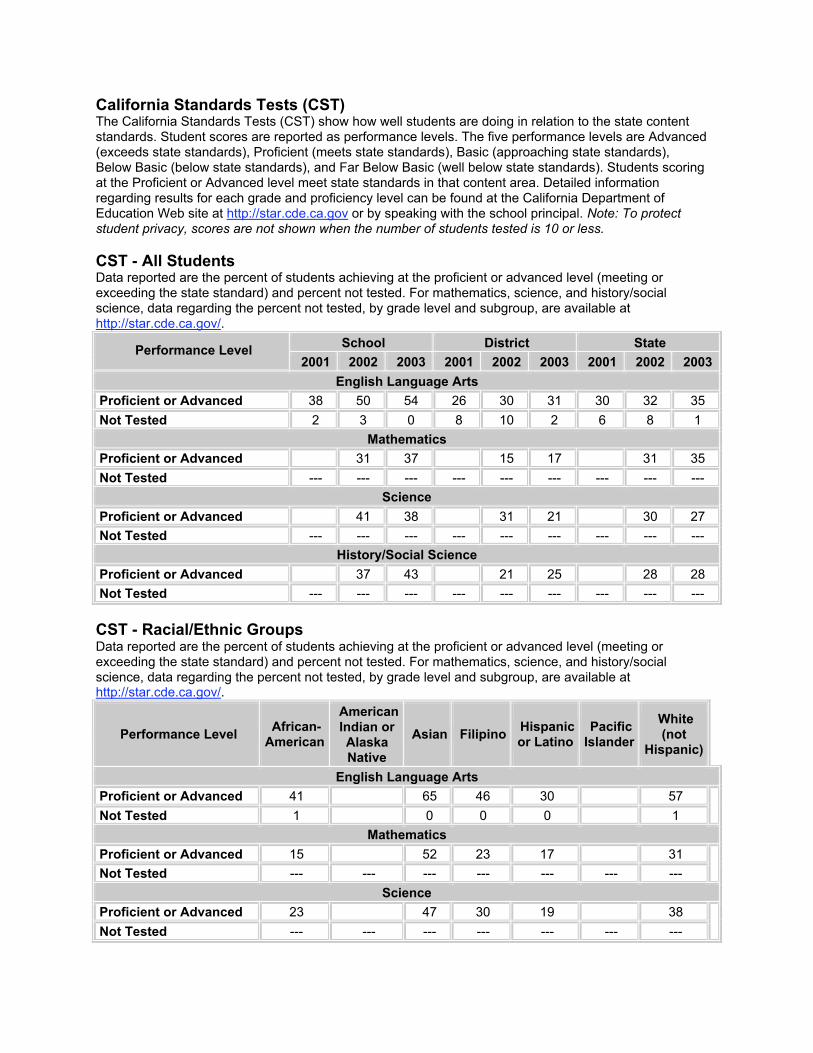
California Standards Tests (CST)The California Standards Tests (CST) show how well students are doing in relation to the state contentstandards. Student scores are reported as performance levels. The five performance levels are Advanced(exceeds state standards), Proficient (meets state standards), Basic (approaching state standards),Below Basic (below state standards), and Far Below Basic (well below state standards). Students scoringat the Proficient or Advanced level meet state standards in that content area. Detailed informationregarding results for each grade and proficiency level can be found at the California Department ofEducation Web site at http://star.cde.ca.gov or by speaking with the school principal. Note: To protectstudent privacy, scores are not shown when the number of students tested is 10 or less.
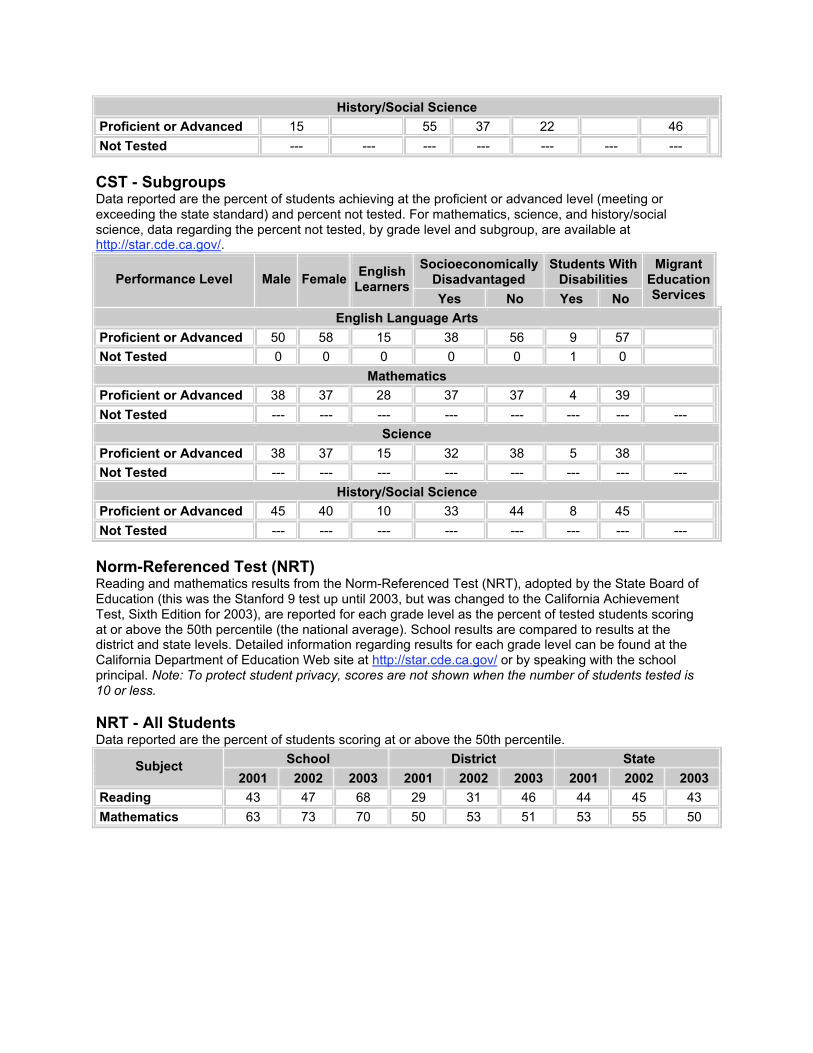
CST - All StudentsData reported are the percent of students achieving at the proficient or advanced level (meeting orexceeding the state standard) and percent not tested. For mathematics, science, and history/socialscience, data regarding the percent not tested, by grade level and subgroup, are available athttp://star.cde.ca.gov/.
School District State Performance Level
2001 2002 2003 2001 2002 2003 2001 2002 2003
English Language Arts
Proficient or Advanced 38 50 54 26 30 31 30 32 35
Not Tested 2 3 0 8 10 2 6 8 1
Mathematics
Proficient or Advanced 31 37 15 17 31 35
Not Tested --- --- --- --- --- --- --- --- ---
Science
Proficient or Advanced 41 38 31 21 30 27
Not Tested --- --- --- --- --- --- --- --- ---
History/Social Science
Proficient or Advanced 37 43 21 25 28 28
Not Tested --- --- --- --- --- --- --- --- ---
CST - Racial/Ethnic GroupsData reported are the percent of students achieving at the proficient or advanced level (meeting orexceeding the state standard) and percent not tested. For mathematics, science, and history/socialscience, data regarding the percent not tested, by grade level and subgroup, are available athttp://star.cde.ca.gov/.
Performance Level African-American
AmericanIndian orAlaskaNative
Asian Filipino Hispanicor Latino
PacificIslander
White(not
Hispanic)
English Language Arts
Proficient or Advanced 41 65 46 30 57
Not Tested 1 0 0 0 1
Mathematics
Proficient or Advanced 15 52 23 17 31
Not Tested --- --- --- --- --- --- ---
Science
Proficient or Advanced 23 47 30 19 38
Not Tested --- --- --- --- --- --- ---
History/Social Science
Proficient or Advanced 15 55 37 22 46
Not Tested --- --- --- --- --- --- ---
CST - SubgroupsData reported are the percent of students achieving at the proficient or advanced level (meeting orexceeding the state standard) and percent not tested. For mathematics, science, and history/socialscience, data regarding the percent not tested, by grade level and subgroup, are available athttp://star.cde.ca.gov/.
SocioeconomicallyDisadvantaged
Students WithDisabilitiesPerformance Level Male Female
EnglishLearners
Yes No Yes No
MigrantEducationServices
English Language Arts
Proficient or Advanced 50 58 15 38 56 9 57
Not Tested 0 0 0 0 0 1 0
Mathematics
Proficient or Advanced 38 37 28 37 37 4 39
Not Tested --- --- --- --- --- --- --- ---
Science
Proficient or Advanced 38 37 15 32 38 5 38
Not Tested --- --- --- --- --- --- --- ---
History/Social Science
Proficient or Advanced 45 40 10 33 44 8 45
Not Tested --- --- --- --- --- --- --- ---
Norm-Referenced Test (NRT)Reading and mathematics results from the Norm-Referenced Test (NRT), adopted by the State Board ofEducation (this was the Stanford 9 test up until 2003, but was changed to the California AchievementTest, Sixth Edition for 2003), are reported for each grade level as the percent of tested students scoringat or above the 50th percentile (the national average). School results are compared to results at thedistrict and state levels. Detailed information regarding results for each grade level can be found at theCalifornia Department of Education Web site at http://star.cde.ca.gov/ or by speaking with the schoolprincipal. Note: To protect student privacy, scores are not shown when the number of students tested is10 or less.
NRT - All StudentsData reported are the percent of students scoring at or above the 50th percentile.
School District StateSubject
2001 2002 2003 2001 2002 2003 2001 2002 2003
Reading 43 47 68 29 31 46 44 45 43
Mathematics 63 73 70 50 53 51 53 55 50
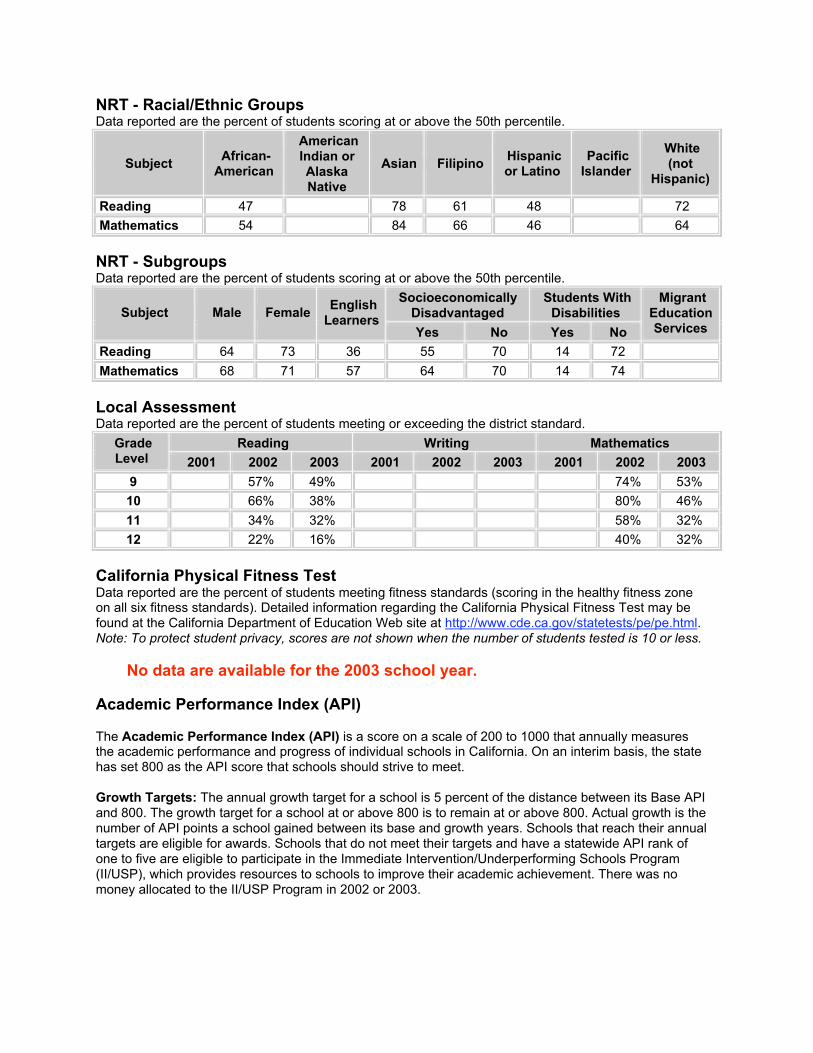
NRT - Racial/Ethnic GroupsData reported are the percent of students scoring at or above the 50th percentile.
Subject African-American
AmericanIndian orAlaskaNative
Asian Filipino Hispanicor Latino
PacificIslander
White(not
Hispanic)
Reading 47 78 61 48 72
Mathematics 54 84 66 46 64
NRT - SubgroupsData reported are the percent of students scoring at or above the 50th percentile.
SocioeconomicallyDisadvantaged
Students WithDisabilitiesSubject Male Female
EnglishLearners
Yes No Yes No
MigrantEducationServices
Reading 64 73 36 55 70 14 72
Mathematics 68 71 57 64 70 14 74
Local AssessmentData reported are the percent of students meeting or exceeding the district standard.
Reading Writing Mathematics GradeLevel 2001 2002 2003 2001 2002 2003 2001 2002 2003
9 57% 49% 74% 53%
10 66% 38% 80% 46%
11 34% 32% 58% 32%
12 22% 16% 40% 32%
California Physical Fitness TestData reported are the percent of students meeting fitness standards (scoring in the healthy fitness zoneon all six fitness standards). Detailed information regarding the California Physical Fitness Test may befound at the California Department of Education Web site at http://www.cde.ca.gov/statetests/pe/pe.html.Note: To protect student privacy, scores are not shown when the number of students tested is 10 or less.
No data are available for the 2003 school year.
Academic Performance Index (API)
The Academic Performance Index (API) is a score on a scale of 200 to 1000 that annually measuresthe academic performance and progress of individual schools in California. On an interim basis, the statehas set 800 as the API score that schools should strive to meet.
Growth Targets: The annual growth target for a school is 5 percent of the distance between its Base APIand 800. The growth target for a school at or above 800 is to remain at or above 800. Actual growth is thenumber of API points a school gained between its base and growth years. Schools that reach their annualtargets are eligible for awards. Schools that do not meet their targets and have a statewide API rank ofone to five are eligible to participate in the Immediate Intervention/Underperforming Schools Program(II/USP), which provides resources to schools to improve their academic achievement. There was nomoney allocated to the II/USP Program in 2002 or 2003.
Subgroup APIs and Targets: In addition to a schoolwide API, schools also receive API scores for eachnumerically significant subgroup in the school (i.e., racial/ethnic subgroups and socioeconomicallydisadvantaged students). Growth targets, equal to 80 percent of the school's target, are also set for eachof the subgroups. Each subgroup must also meet its target for the school to be eligible for awards.
Percent Tested: In order to be eligible for awards, elementary and middle schools must test at least 95percent of their students in grades 2-8 and high schools must test at least 90 percent of their students ingrades 9-11 on STAR.
Statewide Rank: Schools receiving a Base API score are ranked in ten categories of equal size (deciles)from one (lowest) to ten (highest), according to type of school (elementary, middle, or high school).
Similar Schools Rank: Schools also receive a ranking that compares that school to 100 other schoolswith similar demographic characteristics. Each set of 100 schools is ranked by API score from one(lowest) to ten (highest) to indicate how well the school performed compared to schools most like it.
API criteria are subject to change as new legislation is enacted into law. Detailed information about theAPI and the Public Schools Accountability Act (PSAA) can be found at the California Department ofEducation Web site at http://www.cde.ca.gov/psaa/api/ or by speaking with the school principal.
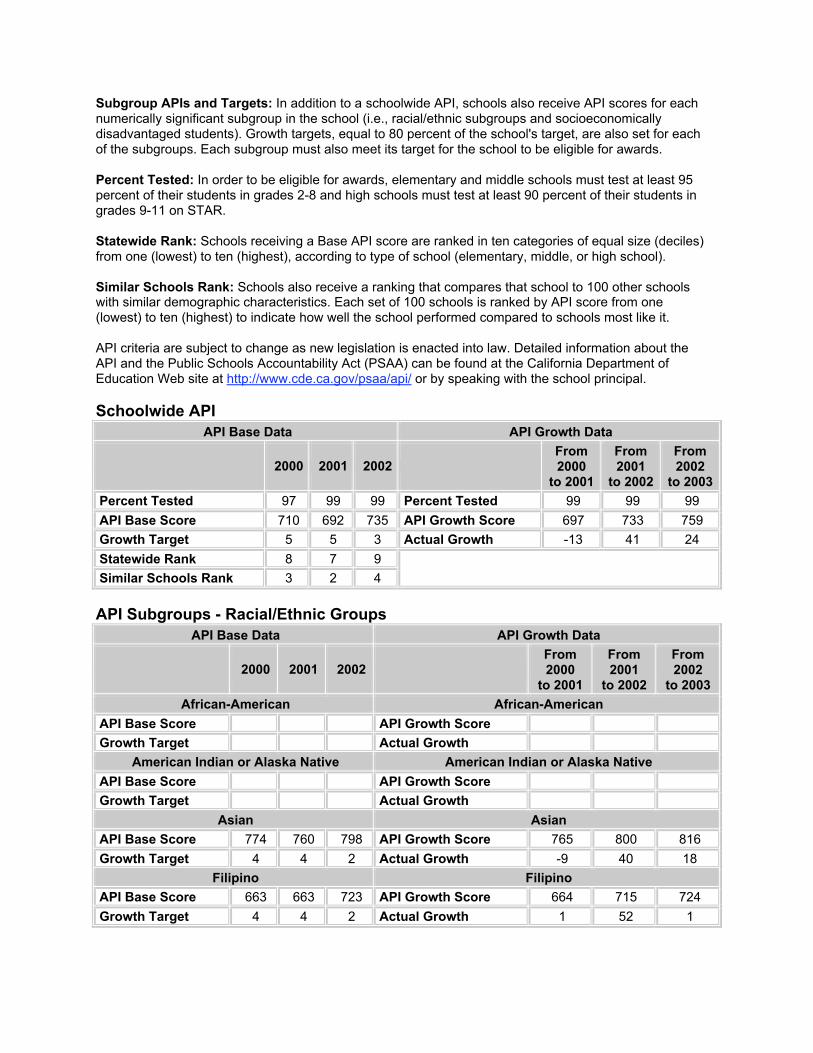
Schoolwide API
API Base Data API Growth Data
2000 2001 2002 From2000
to 2001
From2001
to 2002
From2002
to 2003
Percent Tested 97 99 99 Percent Tested 99 99 99
API Base Score 710 692 735 API Growth Score 697 733 759
Growth Target 5 5 3 Actual Growth -13 41 24
Statewide Rank 8 7 9
Similar Schools Rank 3 2 4
API Subgroups - Racial/Ethnic Groups
API Base Data API Growth Data
2000 2001 2002 From2000
to 2001
From2001
to 2002
From2002
to 2003
African-American African-American
API Base Score API Growth Score
Growth Target Actual Growth
American Indian or Alaska Native American Indian or Alaska Native
API Base Score API Growth Score
Growth Target Actual Growth
Asian Asian
API Base Score 774 760 798 API Growth Score 765 800 816
Growth Target 4 4 2 Actual Growth -9 40 18
Filipino Filipino
API Base Score 663 663 723 API Growth Score 664 715 724
Growth Target 4 4 2 Actual Growth 1 52 1
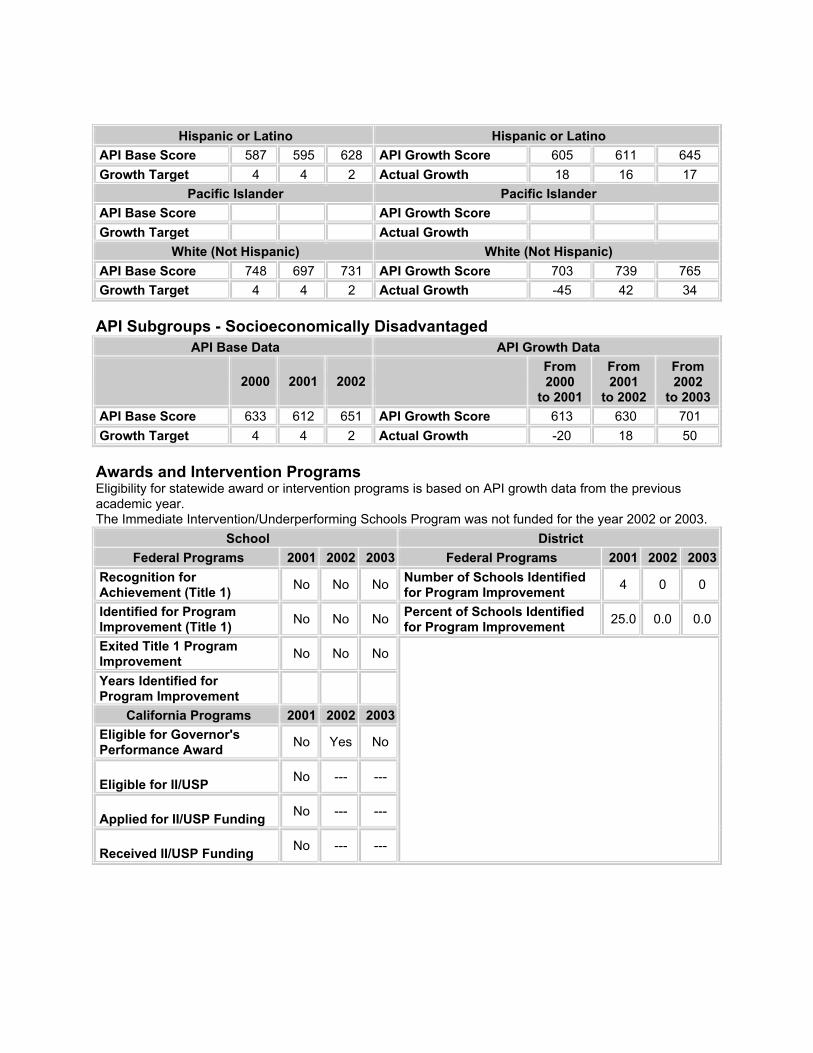
Hispanic or Latino Hispanic or Latino
API Base Score 587 595 628 API Growth Score 605 611 645
Growth Target 4 4 2 Actual Growth 18 16 17
Pacific Islander Pacific Islander
API Base Score API Growth Score
Growth Target Actual Growth
White (Not Hispanic) White (Not Hispanic)
API Base Score 748 697 731 API Growth Score 703 739 765
Growth Target 4 4 2 Actual Growth -45 42 34
API Subgroups - Socioeconomically Disadvantaged
API Base Data API Growth Data
2000 2001 2002 From2000
to 2001
From2001
to 2002
From2002
to 2003
API Base Score 633 612 651 API Growth Score 613 630 701
Growth Target 4 4 2 Actual Growth -20 18 50
Awards and Intervention ProgramsEligibility for statewide award or intervention programs is based on API growth data from the previousacademic year.The Immediate Intervention/Underperforming Schools Program was not funded for the year 2002 or 2003.
School District
Federal Programs 2001 2002 2003 Federal Programs 2001 2002 2003
Recognition for Achievement (Title 1)
No No No Number of Schools Identified for Program Improvement
4 0 0
Identified for Program Improvement (Title 1)
No No No Percent of Schools Identified for Program Improvement
25.0 0.0 0.0
Exited Title 1 Program Improvement
No No No
Years Identified for Program Improvement
California Programs 2001 2002 2003
Eligible for Governor's Performance Award
No Yes No
Eligible for II/USP
No --- ---
Applied for II/USP Funding
No --- ---
Received II/USP Funding
No --- ---
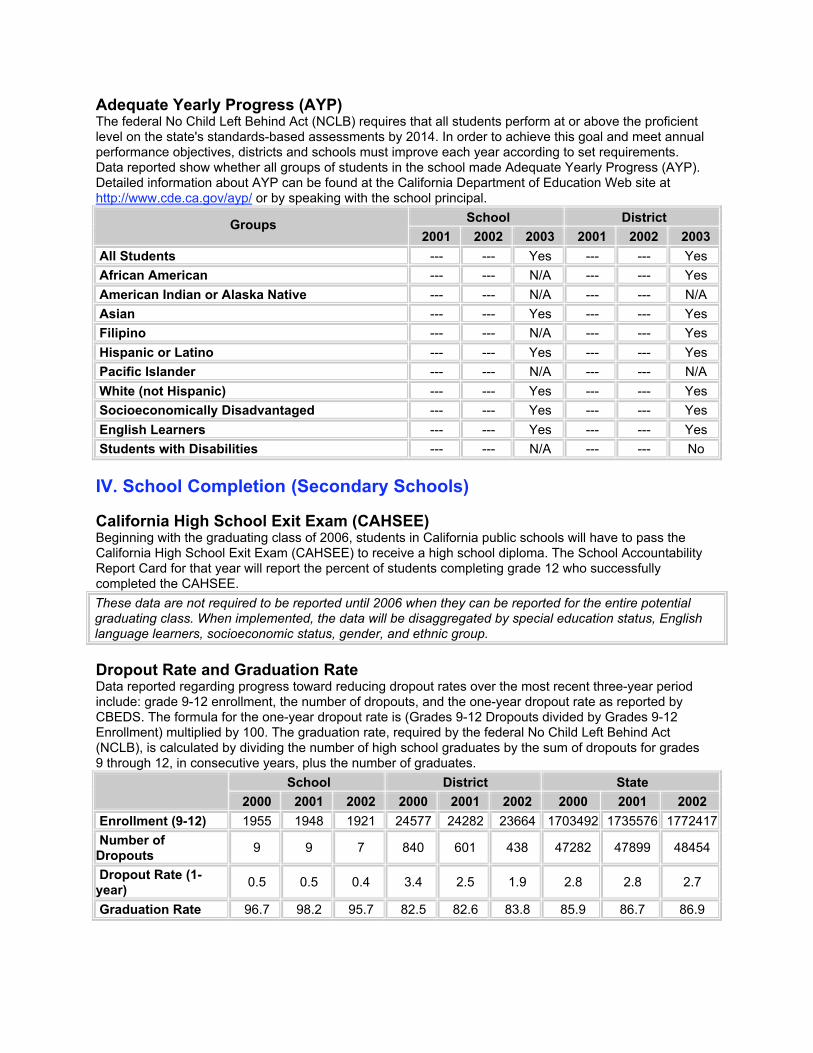
Adequate Yearly Progress (AYP)The federal No Child Left Behind Act (NCLB) requires that all students perform at or above the proficientlevel on the state's standards-based assessments by 2014. In order to achieve this goal and meet annualperformance objectives, districts and schools must improve each year according to set requirements.Data reported show whether all groups of students in the school made Adequate Yearly Progress (AYP).Detailed information about AYP can be found at the California Department of Education Web site athttp://www.cde.ca.gov/ayp/ or by speaking with the school principal.
School District Groups
2001 2002 2003 2001 2002 2003
All Students --- --- Yes --- --- Yes
African American --- --- N/A --- --- Yes
American Indian or Alaska Native --- --- N/A --- --- N/A
Asian --- --- Yes --- --- Yes
Filipino --- --- N/A --- --- Yes
Hispanic or Latino --- --- Yes --- --- Yes
Pacific Islander --- --- N/A --- --- N/A
White (not Hispanic) --- --- Yes --- --- Yes
Socioeconomically Disadvantaged --- --- Yes --- --- Yes
English Learners --- --- Yes --- --- Yes
Students with Disabilities --- --- N/A --- --- No
IV. School Completion (Secondary Schools)
California High School Exit Exam (CAHSEE)Beginning with the graduating class of 2006, students in California public schools will have to pass theCalifornia High School Exit Exam (CAHSEE) to receive a high school diploma. The School AccountabilityReport Card for that year will report the percent of students completing grade 12 who successfullycompleted the CAHSEE.
These data are not required to be reported until 2006 when they can be reported for the entire potentialgraduating class. When implemented, the data will be disaggregated by special education status, Englishlanguage learners, socioeconomic status, gender, and ethnic group.
Dropout Rate and Graduation RateData reported regarding progress toward reducing dropout rates over the most recent three-year periodinclude: grade 9-12 enrollment, the number of dropouts, and the one-year dropout rate as reported byCBEDS. The formula for the one-year dropout rate is (Grades 9-12 Dropouts divided by Grades 9-12Enrollment) multiplied by 100. The graduation rate, required by the federal No Child Left Behind Act(NCLB), is calculated by dividing the number of high school graduates by the sum of dropouts for grades9 through 12, in consecutive years, plus the number of graduates.
School District State
2000 2001 2002 2000 2001 2002 2000 2001 2002
Enrollment (9-12) 1955 1948 1921 24577 24282 23664 1703492 1735576 1772417
Number ofDropouts
9 9 7 840 601 438 47282 47899 48454
Dropout Rate (1-year)
0.5 0.5 0.4 3.4 2.5 1.9 2.8 2.8 2.7
Graduation Rate 96.7 98.2 95.7 82.5 82.6 83.8 85.9 86.7 86.9
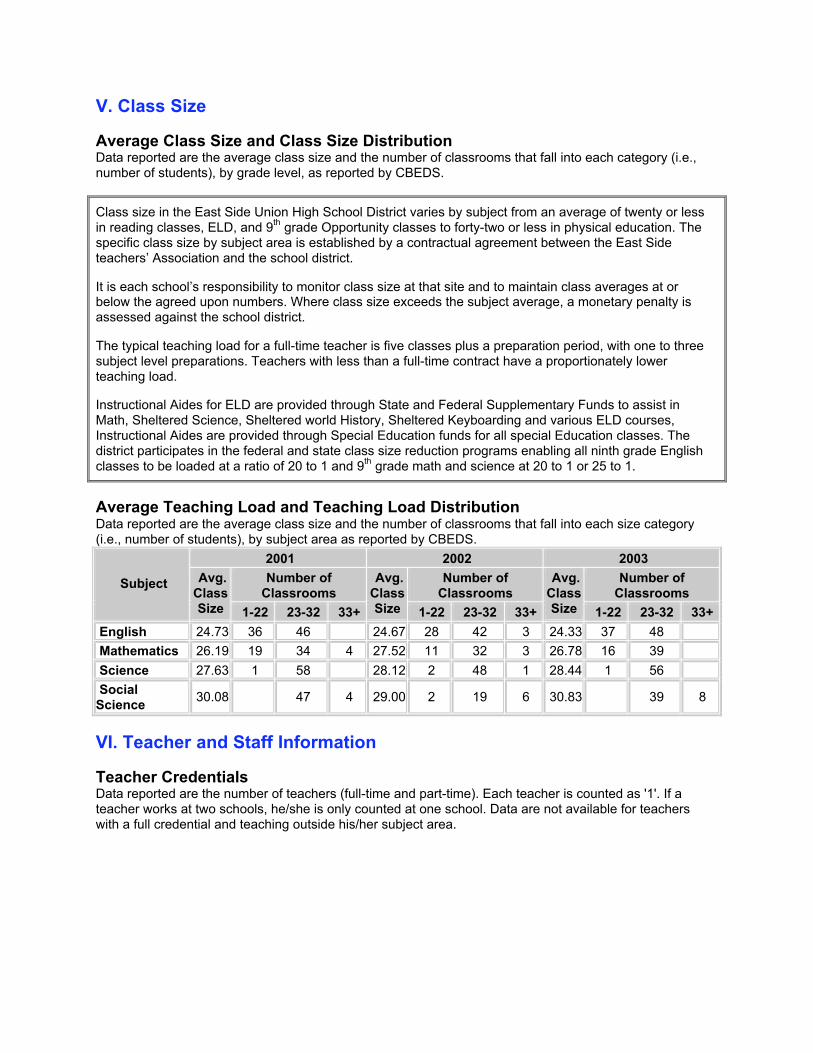
V. Class Size
Average Class Size and Class Size DistributionData reported are the average class size and the number of classrooms that fall into each category (i.e.,number of students), by grade level, as reported by CBEDS.
Class size in the East Side Union High School District varies by subject from an average of twenty or lessin reading classes, ELD, and 9
th grade Opportunity classes to forty-two or less in physical education. The
specific class size by subject area is established by a contractual agreement between the East Sideteachers’ Association and the school district.
It is each school’s responsibility to monitor class size at that site and to maintain class averages at orbelow the agreed upon numbers. Where class size exceeds the subject average, a monetary penalty isassessed against the school district.
The typical teaching load for a full-time teacher is five classes plus a preparation period, with one to threesubject level preparations. Teachers with less than a full-time contract have a proportionately lowerteaching load.
Instructional Aides for ELD are provided through State and Federal Supplementary Funds to assist inMath, Sheltered Science, Sheltered world History, Sheltered Keyboarding and various ELD courses,Instructional Aides are provided through Special Education funds for all special Education classes. Thedistrict participates in the federal and state class size reduction programs enabling all ninth grade Englishclasses to be loaded at a ratio of 20 to 1 and 9
th grade math and science at 20 to 1 or 25 to 1.
Average Teaching Load and Teaching Load DistributionData reported are the average class size and the number of classrooms that fall into each size category(i.e., number of students), by subject area as reported by CBEDS.
2001 2002 2003
Number ofClassrooms
Number ofClassrooms
Number ofClassrooms
Subject Avg.ClassSize 1-22 23-32 33+
Avg.ClassSize 1-22 23-32 33+
Avg.ClassSize 1-22 23-32 33+
English 24.73 36 46 24.67 28 42 3 24.33 37 48
Mathematics 26.19 19 34 4 27.52 11 32 3 26.78 16 39
Science 27.63 1 58 28.12 2 48 1 28.44 1 56
SocialScience
30.08 47 4 29.00 2 19 6 30.83 39 8
VI. Teacher and Staff Information
Teacher CredentialsData reported are the number of teachers (full-time and part-time). Each teacher is counted as '1'. If ateacher works at two schools, he/she is only counted at one school. Data are not available for teacherswith a full credential and teaching outside his/her subject area.
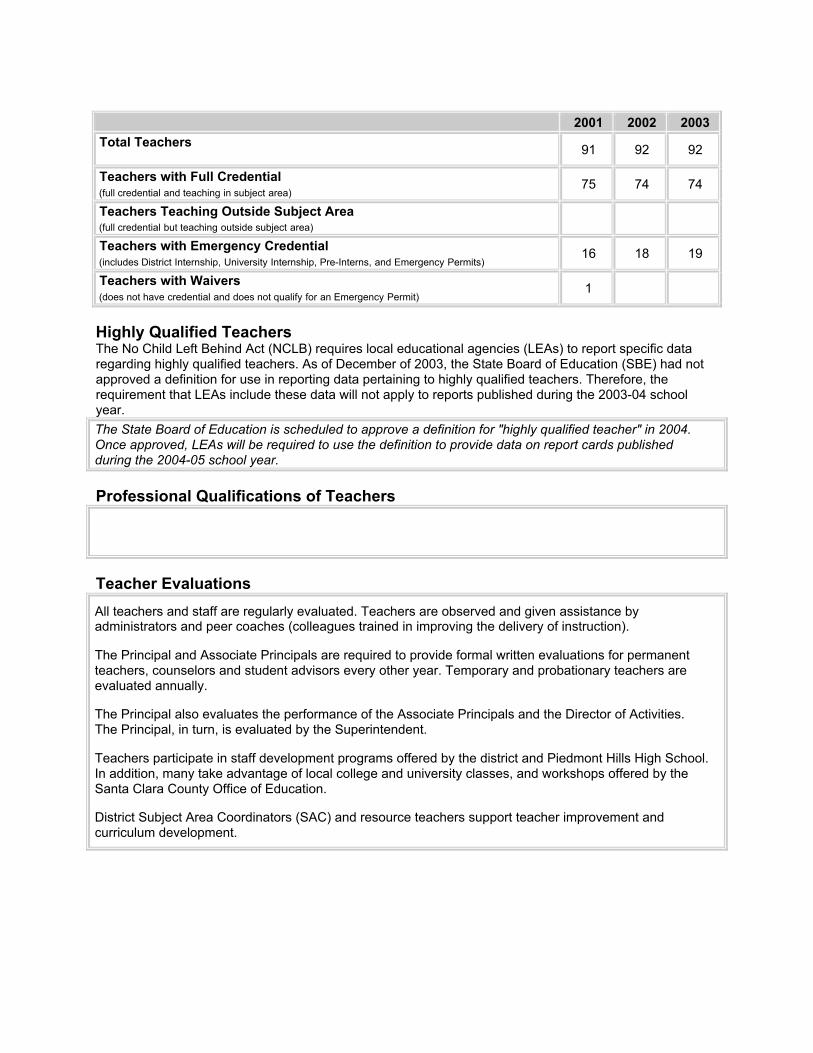
2001 2002 2003
Total Teachers 91 92 92
Teachers with Full Credential(full credential and teaching in subject area)
75 74 74
Teachers Teaching Outside Subject Area(full credential but teaching outside subject area)
Teachers with Emergency Credential(includes District Internship, University Internship, Pre-Interns, and Emergency Permits)
16 18 19
Teachers with Waivers(does not have credential and does not qualify for an Emergency Permit)
1
Highly Qualified TeachersThe No Child Left Behind Act (NCLB) requires local educational agencies (LEAs) to report specific dataregarding highly qualified teachers. As of December of 2003, the State Board of Education (SBE) had notapproved a definition for use in reporting data pertaining to highly qualified teachers. Therefore, therequirement that LEAs include these data will not apply to reports published during the 2003-04 schoolyear.
The State Board of Education is scheduled to approve a definition for "highly qualified teacher" in 2004.Once approved, LEAs will be required to use the definition to provide data on report cards publishedduring the 2004-05 school year.
Professional Qualifications of Teachers
Teacher Evaluations
All teachers and staff are regularly evaluated. Teachers are observed and given assistance byadministrators and peer coaches (colleagues trained in improving the delivery of instruction).
The Principal and Associate Principals are required to provide formal written evaluations for permanentteachers, counselors and student advisors every other year. Temporary and probationary teachers areevaluated annually.
The Principal also evaluates the performance of the Associate Principals and the Director of Activities.The Principal, in turn, is evaluated by the Superintendent.
Teachers participate in staff development programs offered by the district and Piedmont Hills High School.In addition, many take advantage of local college and university classes, and workshops offered by theSanta Clara County Office of Education.
District Subject Area Coordinators (SAC) and resource teachers support teacher improvement andcurriculum development.
Substitute Teachers
The East Side Union High School District has developed a large pool of qualified substitute teachers.When teachers are absent for illness or personal emergencies or need to participate in specialprofessional training activities, substitute teachers are sent to cover classes.
However, to maintain the quality of the instructional program, every effort is made to minimize teacherabsences.
Counselors and Other Support StaffData reported are in units of full-time equivalents (FTE). One FTE is defined as a staff person who isworking 100 percent (i.e., full time). Two staff persons who each work 50 percent of full time also equalsone FTE.
2.4 FTE counselors.
VII. Curriculum and Instruction
School Instruction and Leadership
The staff at Piedmont Hills High School is very knowledgeable, talented and experienced. The staff isextremely well qualified and stable as in past years. Over 42% of the staff have advanced degrees.Piedmont Hills' teachers have an average of 21 years of teaching experience and 16 years at PiedmontHills.
The school leaders and staff have high expectations of all students. Excellence in education isemphasized and academic achievements are recognized. The high quality of instruction and leadershipare reflected in the academic success of the students.
Most Piedmont Hills High School students have a six-period day. Seventy-five percent of our coursesmeet UC/CSU requirements and this number may increase under district direction in the next few years.The vocational classes in the business department and the Auto-CAD classes in Industrial Arts includestate-of-the-art equipment and instruction, appealing to a diverse group of students. The business magnetincludes two paths; one in applications which prepares students for administrative support work, and theother in entrepreneurship, preparing students to manage and work in their own or a small business.
In addition to the appeal of the business magnet program that draws a large number of students to ourschool, Piedmont Hills is addressing technology of the 21
st century through a Digital High School grant.
Piedmont Hills has nine Advanced Placement classes English literature, statistics, Calculus AB, Pysics B,Spanish, French, US History. Next year, we will be adding biology, computer science and world history..Staff and students believe the AP and honors courses are for truly exceptional students; students whotransfer in from other schools often require schedule changes because our AP courses are much moredifficult than they experienced in their previous schools. Since even the general level courses are focusedon college preparation, the majority of classes are rigorous. Returning graduates support this with theirexperiences of being prepared for college courses.
Students are encouraged to strive for excellence not only in the curricular program but also in the co-curricular program. In addition to its academic tradition, Piedmont Hills has a long history of studentinvolvement in co-curricular activities. Our best estimates are that approximately 75% of the student bodyis engaged in one or more of 25 clubs and athletics. The Performing Arts department includesapproximately 20% of the students body. Piedmont Hills also has unusual events, such as Pirate MovieNights, a Lip Sync contest, Jell-O pudding wrestling, a talent show, FANTASTICS, and the InternationalFair. All of these events raise money to help the school discretionary funding and give students theopportunity to participate in good, clean fun.
When students need extra support in order to achieve, they have access to the counselors and to anumber of people involved on the Multiple-Services Team (MST). This year we have paired students whohave specific needs with community counseling groups. We have also had students participate in CampAnytown to help motivate and focus students on responsible behavior and goals. The student leadershipclass has also begun to explore ways to address issues that involve student life outside of the classroomby doing surveys and planning some activities. Link Crew has been a successful support group of peermentors for incoming freshmen for three years now, though recent cuts may mean the end of theprogram. We also have a limited Peer Resources program that trains students to participate in conflictresolution, but funding issues may end that program as well. Formal academic support through tutoring isavailable to students in addition to direct help from the teacher. The City of San Jose provides funds for ahomework center that has recently increased availability from two days a week to four. The Math Masteryprogram enables students who have not met standards to earn credits in Integrated Math 1 after school.Remediation in literacy is provided through a special class after school during the second semester.
Piedmont Hills has one of the lowest dropout rates in the East Side Union High School District. In addition,Piedmont Hills has one of the highest attendance rates in the District. This is an indication of the highquality of instruction and leadership. A variety of programs exists to help students with special needs, andthe staff implements various instructional strategies to help maximize the students’ learning.
The school leaders and staff continue to grow in the profession to keep abreast of the latest trends ineducation. Several members of the staff joined the California School Leadership Academy.
Professional Development
The major areas of focus this year and for the next several years will be shifting from services andprograms to the learning environment: what is happening in the classrooms, how we can improvelearning, and how to evaluate student learning and achievement. Specifically, professional developmenthas been centered around literacy, standards and technology. In eighteen hours of professionaldevelopment throughout the year teachers were trained to incorporate Excel, spreadsheets andPowerPoint into their classroom lessons. Teachers also learned how to incorporate literacy strategiesacross the curriculum. Moreover, teachers aligned lessons to State Standards. The staff at Piedmont HillsHigh School is strongly committed to a broad staff development program which enriches the learningexperiences of the students. The school's new task is a difficult and lengthy one, but the results shouldlead to powerful learning for all of the students. It is to this end that our staff development and school-based coordinated plan have been driven this year and will continue to be driven for the next severalyears. When students become powerful learners and teachers become mentors, the school will haveachieved a major milestone.
The School Based Coordinated Program (SBCP) planning process, particularly the SB 1882 staffdevelopment resources, allow the school to continually review and improve upon its instructionalstrategies; improve upon instructional programs; and make modifications on the curriculum.
Quality and Currency of Textbooks and Other Instructional Materials
All students are provided with textbooks for courses that require them. On the average, a new textbookcosts between $55.00 and $60.00. Students who take five required courses may have as many as 5 textswith a total value in excess of $275.00.
New textbooks were adopted by the Board of Trustees for courses in ELD, Health and Safety Education,Foreign Language, English, and Social Science. These textbooks are being phased in to replace outdatedtextbooks.
One hundred fifty computers are available through the Business Department, and eighteen computers areavailable in the math lab.
Textbook losses continue to be a serious district problem that students, parents and teachers
must address every year
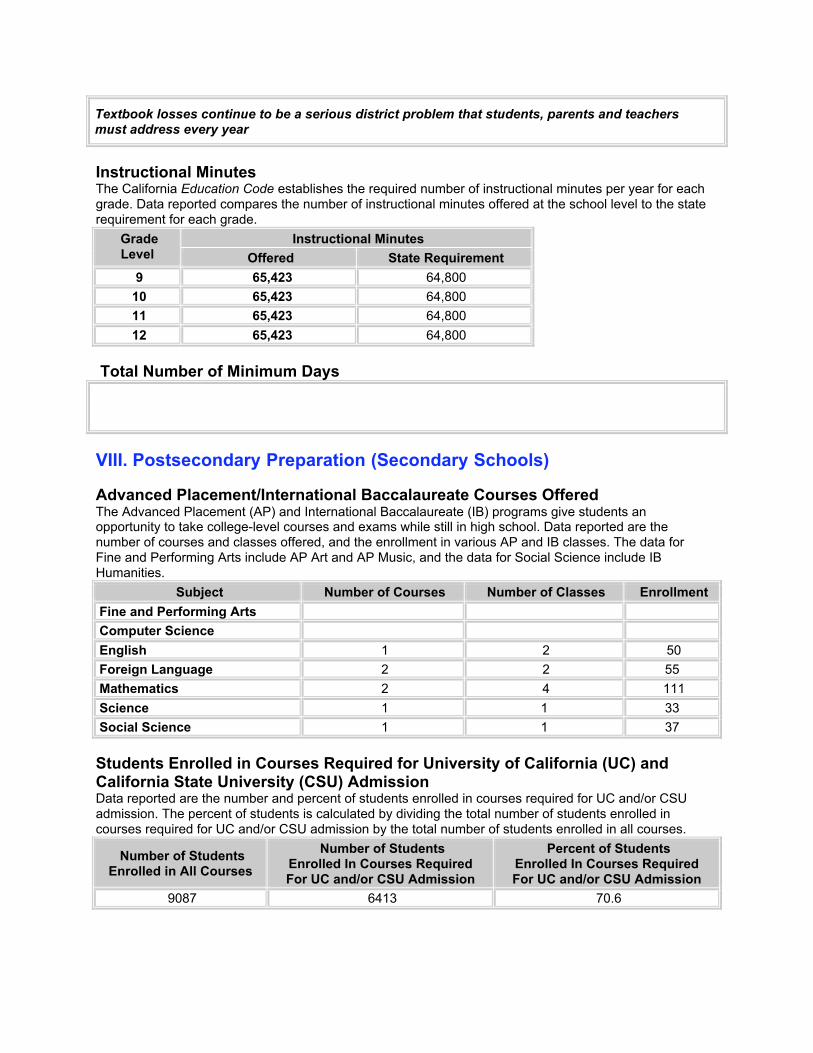
Instructional MinutesThe California Education Code establishes the required number of instructional minutes per year for eachgrade. Data reported compares the number of instructional minutes offered at the school level to the staterequirement for each grade.
Instructional Minutes GradeLevel Offered State Requirement
9 65,423 64,800
10 65,423 64,800
11 65,423 64,800
12 65,423 64,800
Total Number of Minimum Days
VIII. Postsecondary Preparation (Secondary Schools)
Advanced Placement/International Baccalaureate Courses OfferedThe Advanced Placement (AP) and International Baccalaureate (IB) programs give students anopportunity to take college-level courses and exams while still in high school. Data reported are thenumber of courses and classes offered, and the enrollment in various AP and IB classes. The data forFine and Performing Arts include AP Art and AP Music, and the data for Social Science include IBHumanities.
Subject Number of Courses Number of Classes Enrollment
Fine and Performing Arts
Computer Science
English 1 2 50
Foreign Language 2 2 55
Mathematics 2 4 111
Science 1 1 33
Social Science 1 1 37
Students Enrolled in Courses Required for University of California (UC) andCalifornia State University (CSU) AdmissionData reported are the number and percent of students enrolled in courses required for UC and/or CSUadmission. The percent of students is calculated by dividing the total number of students enrolled incourses required for UC and/or CSU admission by the total number of students enrolled in all courses.
Number of StudentsEnrolled in All Courses
Number of StudentsEnrolled In Courses RequiredFor UC and/or CSU Admission
Percent of StudentsEnrolled In Courses RequiredFor UC and/or CSU Admission
9087 6413 70.6
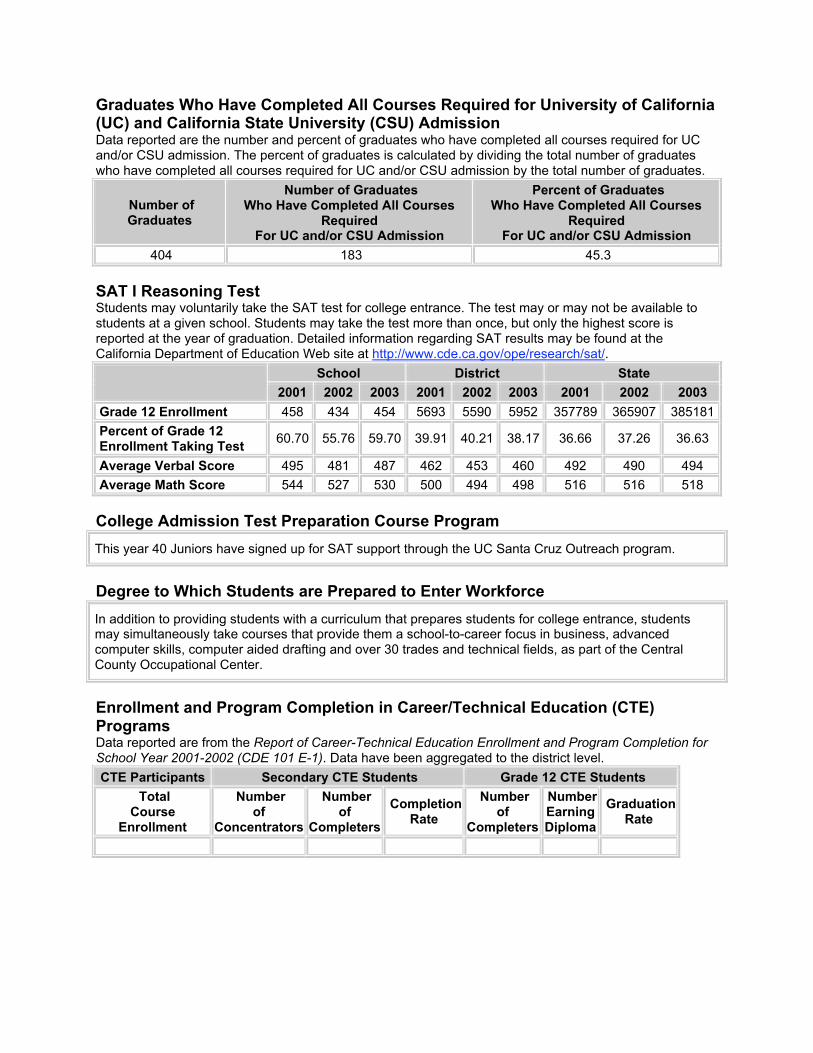
Graduates Who Have Completed All Courses Required for University of California(UC) and California State University (CSU) AdmissionData reported are the number and percent of graduates who have completed all courses required for UCand/or CSU admission. The percent of graduates is calculated by dividing the total number of graduateswho have completed all courses required for UC and/or CSU admission by the total number of graduates.
Number ofGraduates
Number of GraduatesWho Have Completed All Courses
RequiredFor UC and/or CSU Admission
Percent of GraduatesWho Have Completed All Courses
RequiredFor UC and/or CSU Admission
404 183 45.3
SAT I Reasoning TestStudents may voluntarily take the SAT test for college entrance. The test may or may not be available tostudents at a given school. Students may take the test more than once, but only the highest score isreported at the year of graduation. Detailed information regarding SAT results may be found at theCalifornia Department of Education Web site at http://www.cde.ca.gov/ope/research/sat/.
School District State
2001 2002 2003 2001 2002 2003 2001 2002 2003
Grade 12 Enrollment 458 434 454 5693 5590 5952 357789 365907 385181
Percent of Grade 12 Enrollment Taking Test
60.70 55.76 59.70 39.91 40.21 38.17 36.66 37.26 36.63
Average Verbal Score 495 481 487 462 453 460 492 490 494
Average Math Score 544 527 530 500 494 498 516 516 518
College Admission Test Preparation Course Program
This year 40 Juniors have signed up for SAT support through the UC Santa Cruz Outreach program.
Degree to Which Students are Prepared to Enter Workforce
In addition to providing students with a curriculum that prepares students for college entrance, studentsmay simultaneously take courses that provide them a school-to-career focus in business, advancedcomputer skills, computer aided drafting and over 30 trades and technical fields, as part of the CentralCounty Occupational Center.
Enrollment and Program Completion in Career/Technical Education (CTE)ProgramsData reported are from the Report of Career-Technical Education Enrollment and Program Completion forSchool Year 2001-2002 (CDE 101 E-1). Data have been aggregated to the district level.
CTE Participants Secondary CTE Students Grade 12 CTE Students
TotalCourse
Enrollment
Numberof
Concentrators
Numberof
Completers
CompletionRate
Numberof
Completers
NumberEarningDiploma
GraduationRate
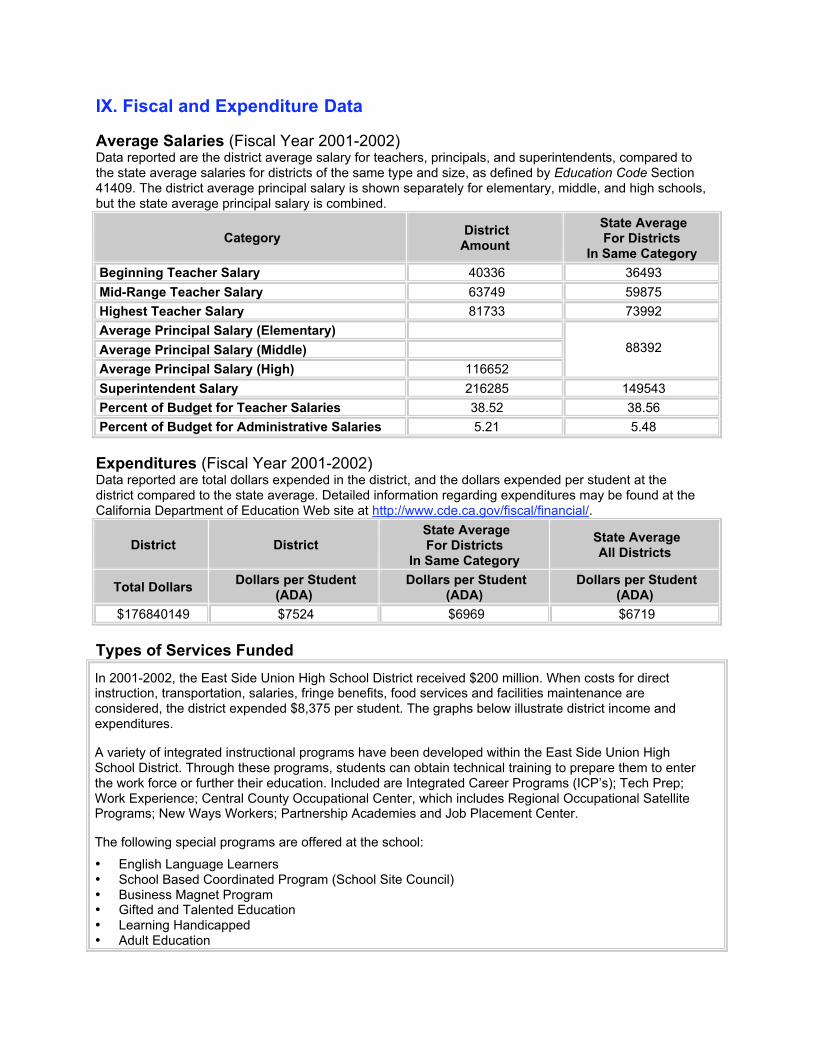
IX. Fiscal and Expenditure Data
Average Salaries (Fiscal Year 2001-2002)Data reported are the district average salary for teachers, principals, and superintendents, compared tothe state average salaries for districts of the same type and size, as defined by Education Code Section41409. The district average principal salary is shown separately for elementary, middle, and high schools,but the state average principal salary is combined.
Category DistrictAmount
State AverageFor Districts
In Same Category
Beginning Teacher Salary 40336 36493
Mid-Range Teacher Salary 63749 59875
Highest Teacher Salary 81733 73992
Average Principal Salary (Elementary)
Average Principal Salary (Middle)
Average Principal Salary (High) 116652
88392
Superintendent Salary 216285 149543
Percent of Budget for Teacher Salaries 38.52 38.56
Percent of Budget for Administrative Salaries 5.21 5.48
Expenditures (Fiscal Year 2001-2002)Data reported are total dollars expended in the district, and the dollars expended per student at thedistrict compared to the state average. Detailed information regarding expenditures may be found at theCalifornia Department of Education Web site at http://www.cde.ca.gov/fiscal/financial/.
District District State AverageFor Districts
In Same Category
State AverageAll Districts
Total Dollars Dollars per Student
(ADA) Dollars per Student
(ADA) Dollars per Student
(ADA)
$176840149 $7524 $6969 $6719
Types of Services Funded
In 2001-2002, the East Side Union High School District received $200 million. When costs for directinstruction, transportation, salaries, fringe benefits, food services and facilities maintenance areconsidered, the district expended $8,375 per student. The graphs below illustrate district income andexpenditures.
A variety of integrated instructional programs have been developed within the East Side Union HighSchool District. Through these programs, students can obtain technical training to prepare them to enterthe work force or further their education. Included are Integrated Career Programs (ICP’s); Tech Prep;Work Experience; Central County Occupational Center, which includes Regional Occupational SatellitePrograms; New Ways Workers; Partnership Academies and Job Placement Center.
The following special programs are offered at the school:
• English Language Learners• School Based Coordinated Program (School Site Council)• Business Magnet Program• Gifted and Talented Education• Learning Handicapped• Adult Education
• Speech Therapy• Adaptive Physical Education• Special Education (SDC, SDC-Low Functioning, RSP, Autistic)• Vocational Education• Evergreen Valley College courses• Upward Bound• Tutorial• Student Assistant Program• Independent Study Program (ISP)• Multi-Service Team• Community College Partnership
Recommended