
Environment
City of Ottawa
Shirley’s Brook & Watt’s Creek Phase 2 Stormwater Management Study
Prepared by:AECOM105 Commerce Valley Drive West, Floor 7Markham, ON, Canada L3T 7W3 www.aecom.com
905 886 7022 tel905 886 9494 fax
Project Number: 60264539
Date: Draft: March, 2013Final: April 27, 2015

Shirley’s Brook & Watt’s Creek Phase 2Stormwater Management Study
3ra_2015-04-27_SBWC Phase 2 SWM Study_Final_60164823 - GAF Rev
Statement of Qualifications and Limitations
The attached Report (the “Report”) has been prepared by AECOM Canada Ltd. (“Consultant”) for the benefit of the client (“Client”) in accordance with the agreement between Consultant and Client, including the scope of work detailed therein (the “Agreement”).
The information, data, recommendations and conclusions contained in the Report (collectively, the “Information”):
is subject to the scope, schedule, and other constraints and limitations in the Agreement and the qualifications contained in the Report (the “Limitations”);
represents Consultant’s professional judgement in light of the Limitations and industry standards for the preparation of similar reports;
may be based on information provided to Consultant which has not been independently verified; has not been updated since the date of issuance of the Report and its accuracy is limited to the time period and
circumstances in which it was collected, processed, made or issued; must be read as a whole and sections thereof should not be read out of such context; was prepared for the specific purposes described in the Report and the Agreement; and in the case of subsurface, environmental or geotechnical conditions, may be based on limited testing and on the
assumption that such conditions are uniform and not variable either geographically or over time.
Consultant shall be entitled to rely upon the accuracy and completeness of information that was provided to it and has no obligation to update such information. Consultant accepts no responsibility for any events or circumstances that may have occurred since the date on which the Report was prepared and, in the case of subsurface, environmental or geotechnical conditions, is not responsible for any variability in such conditions, geographically or over time.
Consultant agrees that the Report represents its professional judgement as described above and that the Information has been prepared for the specific purpose and use described in the Report and the Agreement, but Consultant makes no other representations, or any guarantees or warranties whatsoever, whether express or implied, with respect to the Report, the Information or any part thereof.
Without in any way limiting the generality of the foregoing, any estimates or opinions regarding probable construction costs or construction schedule provided by Consultant represent Consultant’s professional judgement in light of its experience and the knowledge and information available to it at the time of preparation. Since Consultant has no control over market or economic conditions, prices for construction labour, equipment or materials or bidding procedures, Consultant, its directors, officers and employees are not able to, nor do they, make any representations, warranties or guarantees whatsoever, whether express or implied, with respect to such estimates or opinions, or their variance from actual construction costs or schedules, and accept no responsibility for any loss or damage arising therefrom or in any way related thereto. Persons relying on such estimates or opinions do so at their own risk.
Except (1) as agreed to in writing by Consultant and Client; (2) as required by-law; or (3) to the extent used by governmental reviewing agencies for the purpose of obtaining permits or approvals, the Report and the Information may be used and relied upon only by Client.
Consultant accepts no responsibility, and denies any liability whatsoever, to parties other than Client who may obtain access to the Report or the Information for any injury, loss or damage suffered by such parties arising from their use of, reliance upon, or decisions or actions based on the Report or any of the Information (“improper use of the Report”), except to the extent those parties have obtained the prior written consent of Consultant to use and rely upon the Report and the Information. Any injury, loss or damages arising from improper use of the Report shall be borne by the party making such use.
This Statement of Qualifications and Limitations is attached to and forms part of the Report and any use of the Report is subject to the terms hereof.
AECOM: 2012-01-06 © 2009-2012 AECOM Canada Ltd. All Rights Reserved.
(ottawa Shirley's Brook & Watt's Creek Phase 2Stormwater Management Study
AECOM 7rs_2016-04-17_821WS Maw 7 SWM Studyfind .6010003 Ova
AECOM Signatures
Report PreparedBy:
Olivia Chung, P.E g.Environmental Engineer
Report PreparedBy:
Sam Neale, BES, Adv. Dip., CISECEnvironmental Technologist
Report ReviewedBy:
Brian Richert, P.Eng.Senior Water Resources Engineer
Conestoga-Rovers & Associates Limited (CRA)Signatures
Report PreparedBy:
Glenn A. F erSenior Water Resources Specialist

Shirley’s Brook & Watt’s Creek Phase 2Stormwater Management Study
iSBWC Phase 2 SWM Study_Final_60164823 - GAF Rev
Executive Summary
The Study has been prepared to address recommendations contained in the Phase 1 SWM Study (AECOM, October 2011). Accordingly, a detailed hydrologic and hydraulic analyses and fluvial geomorphology assessment of Shirley’s Brook and Watt’s Creek / Kizell Drain was completed to identify existing flooding and erosion sensitivities within the watercourse systems that may be affected by future storm runoff from remaining development lands located within the headwater areas adjacent to the Beaver Pond and Kizell Wetland (primarily KNL Developments).
A number of conceptual stormwater servicing alternatives were also developed to mitigate potential impacts to the Beaver Pond and Kizell Wetland as well as downstream on Shirley’s Brook and Watt’s Creek / Kizell Drain resulting from future urban development within the remaining headwater area. Considerations included:
Surface water resources (quality and quantity); Erosion and deposition; Natural environment (wetland, terrestrial and aquatic resources); Engineering and construction; Costs and maintenance requirements; and Environmental permits and approvals.
The findings of the Phase 2 Study will serve to provide background information to enable the City to make informed decisions regarding the future direction of stormwater management for remaining urban development around the Beaver Pond and Kizell Wetland.
Shirley’s Brook & Watt’s Creek Phase 2Stormwater Management Study
3ra_2015-04-27_SBWC Phase 2 SWM Study_Final_60164823 - GAF Rev
page
Table of Contents
Statement of Qualifications and Limitations Executive Summary
1. Study Background ........................................................................................ 1
1.1 Phase 1 SWM Study Findings & Further Considerations ........................................ 1
1.2 Phase 2 Study Area & Scope of Work ..................................................................... 5
2. Report Organization ..................................................................................... 9
3. Background Data Sources ......................................................................... 11
3.1 Studies and Reports .............................................................................................. 11
3.2 Geographic Information System (GIS) Data .......................................................... 11
3.3 Detailed Engineering Drawings .............................................................................. 11
3.4 Field Data Collection & Surveys ............................................................................ 12
3.4.1 Hydraulic Structure Inventory .................................................................................. 12 3.4.2 Fluvial Geomorphology Site Investigations ............................................................. 12 3.4.3 City of Ottawa Survey Data ..................................................................................... 12 3.4.4 Additional Field Observations Spot Checks & Detailed Surveys ............................. 12 3.4.5 High Water Level Monitoring ................................................................................... 13 3.4.6 Rainfall & Streamflow Monitoring ............................................................................ 13
4. Hydrologic Assessment ............................................................................. 14
4.1 Hydrologic Model Set Up (SWMHYMO) ................................................................ 14
4.1.1 Upper Kizell Drain SWMHYMO Model .................................................................... 14 4.1.2 Watt’s Creek SWMHYMO Model ............................................................................ 15
4.1.2.1 Catchment Areas & Model Discretization ............................................... 15 4.1.2.2 Land Uses and Impervious Cover Assessment (TIMP & XIMP) ............. 16 4.1.2.3 Soil Infiltration and Hydrologic Response (SCS CN, Ia, and Tp) ............ 17 4.1.2.4 Urban Width Parameter (LGP & LGI), Slopes (SLPI, SLPP) &
Roughness Coefficients (MNI, MNP) ...................................................... 17 4.1.2.5 Storage Routing ...................................................................................... 18 4.1.2.6 Channel Routing ..................................................................................... 18
4.1.3 Shirley’s Brook SWMHYMO Model ......................................................................... 18 4.1.3.1 Catchment Areas & Model Discretization ............................................... 18 4.1.3.2 Minor System (Storm Sewer) & Major System (Overland Flow)
Connectivity ............................................................................................ 21 4.1.3.3 Land Uses and Impervious Cover Assessment (TIMP & XIMP) ............. 21 4.1.3.4 Soil Infiltration and Hydrologic Response (SCS CN, Ia, and Tp) ............ 22 4.1.3.5 Urban Width Parameter (LGP & LGI), Slopes (SLPI, SLPP) and
Roughness Coefficients (MNI, MNP) ...................................................... 22 4.1.3.6 Storage Routing ...................................................................................... 22
Shirley’s Brook & Watt’s Creek Phase 2Stormwater Management Study
3ra_2015-04-27_SBWC Phase 2 SWM Study_Final_60164823 - GAF Rev
4.1.3.7 Channel Routing ..................................................................................... 244.2 Initial SWMHYMO Model Calibration and Verification (2011 - 2012) ..................... 24
4.2.1 Storm Event Selection ............................................................................................. 25 4.2.2 Streamflow Data Preparation .................................................................................. 26 4.2.3 Upper Kizell Drain Calibration and Verification ....................................................... 26
4.2.3.1 Upper Kizell Drain SWMHYMO Model Adjustments ............................... 27 4.2.3.2 Upper Kizell Drain Calibrated SWMHYMO Results ................................ 27
4.2.4 Watt’s Creek SWMHYMO Model Calibration and Verification ................................ 28 4.2.4.1 Watt’s Creek SWMHYMO Model Adjustments ....................................... 28 4.2.4.2 Watt’s Creek Calibrated SWMHYMO Results ........................................ 29
4.2.5 Shirley’s Brook SWMHYMO Model Calibration and Verification ............................. 29 4.2.5.1 Shirley’s Brook SWMHYMO Model Adjustments .................................... 29 4.2.5.2 Shirley’s Brook Calibrated SWMHYMO Results ..................................... 30
4.2.6 Comparison of Calibrated Peak Flows vs. High Water Level Monitoring Data ........ 30 4.2.7 SWMHYMO Model Verification using Distributed Rainfall (Radar) Information ...... 31
4.3 Additional Hydrologic Analyses (2013-2014) ......................................................... 32
4.3.1 2013 Hydrologic Model Calibration and Verification Exercise ................................. 32 4.3.1.1 City & AECOM Rain Gauges (Point Rainfall) .......................................... 32 4.3.1.2 Radar Based Storm Event Data .............................................................. 33 4.3.1.3 Assessment of Temporal Patterns .......................................................... 34 4.3.1.4 Comparison of Storm Event Rainfall and Direct Runoff .......................... 34 4.3.1.5 Calibration & Verification Results ............................................................ 35
4.3.2 Beaver Pond Theoretical Storage Assessment ....................................................... 39 4.3.2.1 Revisions Beaver Pond Storage Volume ................................................ 39 4.3.2.2 Results .................................................................................................... 40 4.3.2.3 Findings .................................................................................................. 40
4.3.3 Incorporation of Additional Storage Attenuation within the Upper Kizell Drain Hydrologic Model ..................................................................................................... 41 4.3.3.1 Methodology ........................................................................................... 41 4.3.3.2 Results .................................................................................................... 43 4.3.3.3 Findings .................................................................................................. 44
4.3.4 Upper Kizell Drain Hydrologic Model Verification Assessment for the June 24, 2014 Storm Event .................................................................................................... 44 4.3.4.1 June 24, 2014 Storm Event Details ........................................................ 44 4.3.4.2 Hydrologic & Hydraulic Model Refinements ............................................ 45 4.3.4.3 Results .................................................................................................... 46
4.4 Design Storm Sensitivity Assessment & Selection of Peak Flows ......................... 47
4.5 Beaver Pond & Kizell Cell Performance Assessment ............................................ 49
4.6 Comparison of Updated Design Storm Peak Flows with Previous Studies ............ 50
5. Hydraulic Assessment ............................................................................... 51
5.1 Hydraulic Model Set-up (HEC-RAS) ...................................................................... 51
5.2 Delineation of Updated 100-Year Flood Lines ....................................................... 52
5.3 Hydraulic Structure Capacity Assessment ............................................................. 53
5.4 Identification of Flood Vulnerable Structures (FVS) ............................................... 53
Shirley’s Brook & Watt’s Creek Phase 2Stormwater Management Study
3ra_2015-04-27_SBWC Phase 2 SWM Study_Final_60164823 - GAF Rev
6. Fluvial Geomorphologic Assessment ...................................................... 55
6.1 Reach Delineation ................................................................................................. 55
6.1.1 General Reach Summary ........................................................................................ 55 6.1.2 Detailed Study Reaches .......................................................................................... 55
6.2 Analysis and Interpretation of Existing Conditions ................................................. 58
6.2.1 General Information ................................................................................................. 59 6.2.1.1 Bed, Bank and Channel Characteristics ................................................. 59 6.2.1.2 General Sedimentology .......................................................................... 59 6.2.1.3 Channel Planform and Rapid Assessment ............................................. 59
6.2.2 Detailed Reach Assessment ................................................................................... 60 6.2.3 Streambank Erosion ................................................................................................ 60
6.2.3.1 Risk to Land and Infrastructure on Kizell Drain/Watts Creek & Shirley’s Brook ........................................................................................ 61
7. Conceptual Stormwater Servicing Alternatives ....................................... 62
8. Study Findings ............................................................................................ 63
8.1 Hydrologic Assessment ......................................................................................... 63
8.2 Hydraulic Assessment ........................................................................................... 65
8.3 Fluvial Geomorphology Assessment ..................................................................... 66
List of Figures
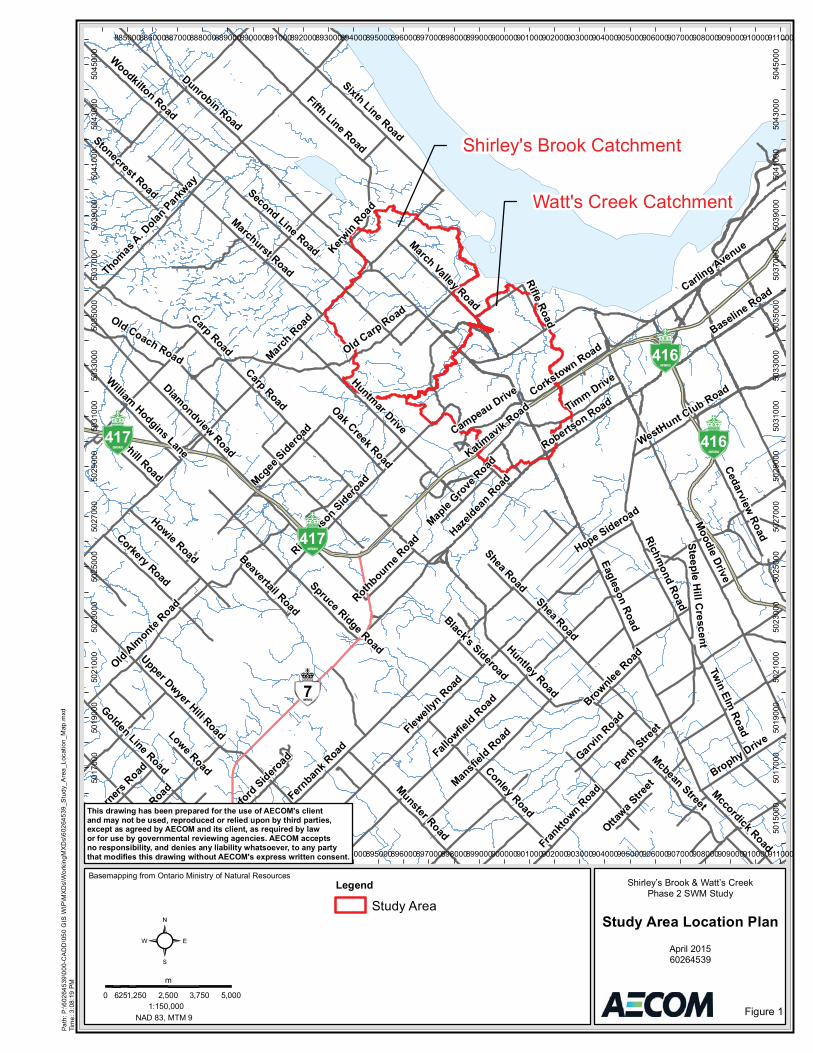
Figure 1. Study Area Location Plan ........................................................................................................... 2
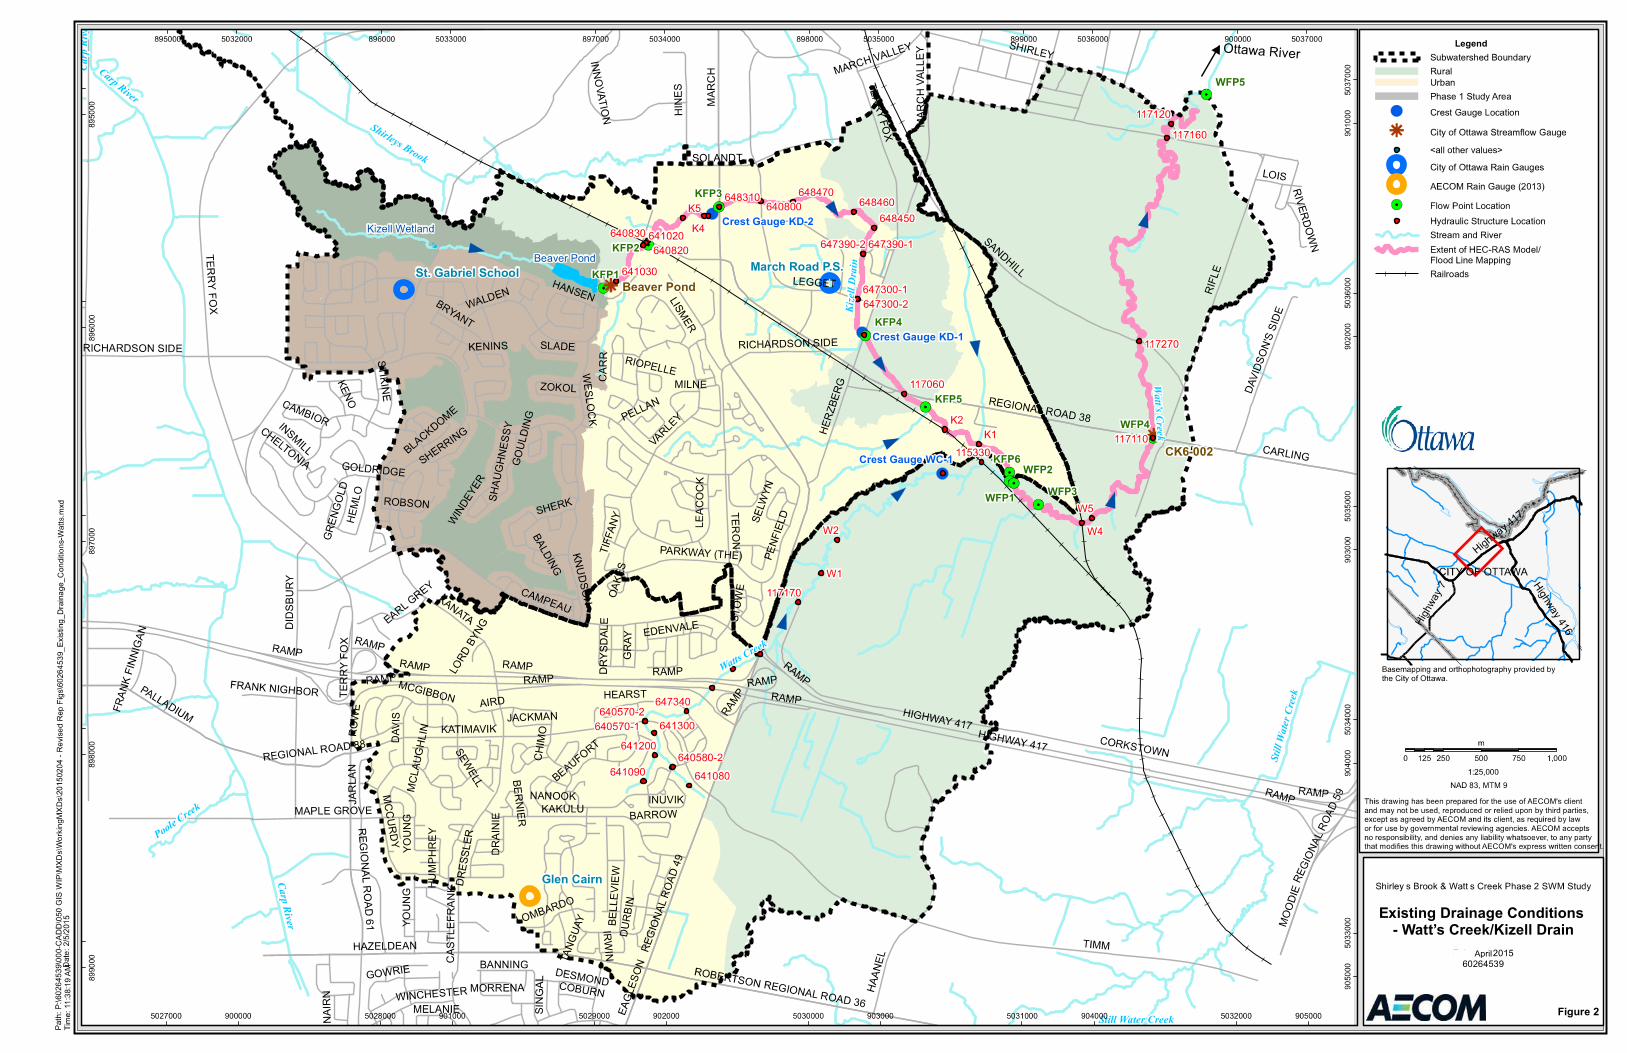
Figure 2. Existing Drainage Conditions-Watt’s Creek / Kizell Drain ........................................................... 6
Figure 3. Existing Drainage Conditions-Shirley’s Brook ............................................................................. 7
Figure 4. Integrated Phase 2 Study Approach ........................................................................................... 8
Figure 5. Fluvial Geomorphologic Assessment Watt’s Creek / Kizell Drain Location Plan ...................... 56
Figure 6. Fluvial Geomorphologic Assessment Watt’s Creek / Kizell Drain Location Plan ...................... 57
List of Tables
Table 1. 2011 & 2012 Calibration and Verification Rainfall Events ......................................................... 25
Table 2. Selection of Calibration and Verification Events at Monitoring Locations ................................. 26
Table 3. Comparison of Point Rainfall vs. Distributed Rainfall using Radar Data ................................... 31
Table 4. Design Storm Peak Flow Estimates for Watt’s Creek / Kizell Drain .......................................... 48
Table 5. Design Storm Peak Flows for Shirley’s Brook Subwatershed ................................................... 48
Table 6. Location of Overall and Detailed Reaches for Geomorphic Assessment ................................. 58
Shirley’s Brook & Watt’s Creek Phase 2Stormwater Management Study
3ra_2015-04-27_SBWC Phase 2 SWM Study_Final_60164823 - GAF Rev
Appendices
Appendix A. Background Data Sources Appendix B. Field Investigations Appendix C Hydrologic Information
C-1. SWMHYMO Model Input & 2011-2012 Calibration and Verification Assessment C-2. Additional 2013 Hydrologic Model Calibration & Verification Assessment C-3. Beaver Pond Theoretical Storage Assessment C-4. Sub-Surface Storage Attenuation Assessment within the Upper Kizell Drain C-5. Upper Kizell Drain Hydrologic Model Verification Assessment - June 24, 2014 Storm
Event C-6. Design Event Peak Flows & Beaver Pond and Kizell Cell Performance Assessment
Appendix D. Hydraulic Modelling Information Appendix E. Fluvial Geomorphology Existing Conditions Report Appendix F Conceptual Stormwater Servicing Alternatives
Shirley’s Brook & Watt’s Creek Phase 2Stormwater Management Study
13ra_2015-04-27_SBWC Phase 2 SWM Study_Final_60164823 - GAF Rev
1. Study Background
The City of Ottawa has identified the need to review and update the stormwater management (SWM) criteria and associated requirements for the remaining development lands within the Shirley’s Brook and Watt’s Creek subwatersheds which are located in the City of Kanata (refer to Figure 1). The Study is an update of existing subwatershed conditions and an identification of conceptual stormwater servicing alternatives for the remaining future urban development in the headwaters of Shirley’s Brook and Watt’s Creek, specifically Phases 7, 8 and 9 of the Kanata Lakes North Plan (KNL).
Concerns have been raised regarding an existing proposal to divert surface drainage from a large area associated with the proposed KLN Development, located within the headwaters of Shirley’s Brook, into the Watt’s Creek system (via the Kizell Drain). The initial drainage diversion concept was proposed as part of the Marchwood Lakeside Master Drainage Plan prepared by Cumming Cockburn Ltd. (CCL) in 1984 and was viewed as a benefit through the use of a large area of natural wetland storage associated with the Beaver Pond SWM facility that discharges into the Kizell Drain. Subsequent to this, the Shirley’s Brook/Watt’s Creek Subwatershed Study (Dillon, 1999) was completed, recommending that natural drainage divides generally be maintained. Also, public and regulatory agency awareness regarding the potential impacts (e.g., increased flooding, accelerated stream erosion, impacts to aquatic habitat, etc.) associated with large-scale drainage diversions has increased considerably. However, the planning for this area has progressed over the years on the assumption of the diversion proceeding and, as such, the draft-approved plan for the remaining phases (7, 8 and 9) has not accounted for a SWM block or blocks that would address stormwater management for the area of the plan naturally draining to Shirley’s Brook.
The general intent of the overall Study was to update existing subwatershed conditions in order to identify flood vulnerable areas and erosion sites within the downstream subwatershed areas.
In order to complete this initiative in a timely and cost effective manner and allow for strategic input and review from the City and other stakeholders, the Study has been undertaken in two separate Phases.
1.1 Phase 1 SWM Study Findings & Further Considerations
The first stage SWM Study was completed by AECOM in October 2011 and included an update of existing storm drainage conditions for the existing and future lands (KNL Phase 9 only) proposed to drain to the Beaver Pond SWM facility. A confirmation of existing SWM pond performance and preliminary assessment of future performance (assuming development of the KNL Phase 9 lands only) was completed to confirm whether there is sufficient capacity within the facility to accommodate existing drainage as well as the proposed development (KNL Phase 9 lands) and continue to meet the prescribed quality and quantity (flood control) targets.
Shirley's Brook Catchment
Watt's Creek Catchment
()7
March Road
Fallowfie
ld Road
Flewell
yn R
oad
Eagleson Road
Fernban
k Road
Moodie Drive
Dunrobin Road
Carling Avenue
Richmond Road
Old Almonte
Road
Carp Road
Thomas A. D
olan Park
way Second Line Road
Huntmar Drive
Conley Road
Diamondview Road
Huntley Road
Cedarview RoadHazeld
ean Road
Mansfi
eld Road
Richard
son Sidero
ad
Marchurst Road
Sixth Line Road
Spruce Ridge Road
Corkery Road
Woodkilton Road
Old Carp Road
Mcgee
Sideroad
Baseline Road
Upper Dwyer Hill Road
Corkstown Road
Howie Road
Munster Road
Timm Drive
Twin Elm Road
WestHunt Club Road
Brophy DriveMcbean Street
Golden Line Road
Frankto
wn Road
Fifth Line RoadStonecrest Road
March Valley Road
Garvin Road
Perth Stre
et
Mccordick Road
Kerwin
Road
Bearhill Road
Old Coach Road
Turners
Road
McArto
n Road
Steeple Hill C
rescent
Rifle Road
Oak Creek RoadCampeau Drive
Beavertail Road
Crawford
Sideroad
Robertson Road
Maple
Grove Road
Brownlee R
oad
William Hodgins Lane Katimavik Road
Rothbourne R
oad
Ottawa S
treet
Shea Road
Hope Sideroad
Lowe RoadBlack's Sideroad
Carp Road
Shea Road
()416
()417
()417
()416
885000
885000
886000
886000
887000
887000
888000
888000
889000
889000
890000
890000
891000
891000
892000
892000
893000
893000
894000
894000
895000
895000
896000
896000
897000
897000
898000
898000
899000
899000
900000
900000
901000
901000
902000
902000
903000
903000
904000
904000
905000
905000
906000
906000
907000
907000
908000
908000
909000
909000
910000
910000
911000
911000
5015
000
5015
000
5017
000
5017
000
5019
000
5019
000
5021
000
5021
000
5023
000
5023
000
5025
000
5025
000
5027
000
5027
000
5029
000
5029
000
5031
000
5031
000
5033
000
5033
000
5035
000
5035
000
5037
000
5037
000
5039
000
5039
000
5041
000
5041
000
5043
000
5043
000
5045
000
5045
000
NAD 83, MTM 9
Basemapping from Ontario Ministry of Natural Resources
Figure 1
60264539
Shirley’s Brook & Watt’s CreekPhase 2 SWM Study
0 1,250 2,500 3,750 5,000625
m
1:150,000
Path
: P:\6
0264
539\
000-
CA
DD
\050
GIS
WIP
\MX
Ds\
Wor
king
MX
Ds\
6026
4539
_Stu
dy_A
rea_
Loca
tion_
Map
.mxd
Tim
e: 3
:08:
19 P
M
Legend
Study Area
This drawing has been prepared for the use of AECOM's client and may not be used, reproduced or relied upon by third parties,except as agreed by AECOM and its client, as required by law or for use by governmental reviewing agencies. AECOM accepts no responsibility, and denies any liability whatsoever, to any partythat modifies this drawing without AECOM's express written consent.
²Study Area Location Plan
April 2015

Shirley’s Brook & Watt’s Creek Phase 2Stormwater Management Study
33ra_2015-04-27_SBWC Phase 2 SWM Study_Final_60164823 - GAF Rev
The major findings of the Phase 1 Study were as follows:
A comparison of updated existing condition SWMHYMO model results completed as part of the Phase 1 Study (using equivalent rainfall volumes) to the previous hydrologic model output contained in the Kanata Lakes North Serviceability Study, KNL Developments (IBI Group, 2007) confirmed similar runoff depths and hydrograph timing with only very minor differences in peak inflows contributing to the Kizell and Beaver Ponds. Making use of the current 100 year rainfall volume as per the City’s IDF curves resulted in peak flows increases in the order of 25 to 30% and runoff volume increases in the order of 25%.
The additional sensitivity analyses completed to evaluate the SWMHYMO urban catchment area width parameter (LGI) and additional temporary storage detention within the Kanata Lakes Golf Course resulted in notable changes to peak inflows to the Beaver Pond. However, minimal impacts were observed to runoff depths and corresponding pond water levels and outflow, which confirmed that the Beaver Pond is less sensitive to changes in peak inflow. Alternatively, maximum water levels and associated discharge to the downstream Kizell Drain are more sensitive to increases in runoff volume from the contributing catchment area.
The updated storage volume calculated for the Kizell Wetland (based on 2011 conditions) resulted in substantially lower storage volumes compared to the previous modelling (IBI, 2007). Updated storage volume calculations completed for the Beaver Pond also produced lower available storage volumes compared to the interim condition values (IBI, 2007).
The hydraulic model update (XPSWMM) completed as part of the Phase 1 Study indicated that increases in Beaver Pond levels and discharges to the downstream Kizell Drain under existing conditions would exceed the controlled flow value identified in the MOE C of A (0.96 m3/s) for the 100-year event under ultimate development conditions as well as the previously defined quantity control peak flow target of 1.2 m3/s for the 100-year design event. The corresponding Beaver Pond water levels also exceeded the 100-year quantity control elevation identified in the MOE C of A and Kanata Lakes North Serviceability Study, KNL Developments (IBI Group, 2006) under ultimate development conditions (92.60 m).
Use of the City’s updated rainfall depth criteria, as specified in the Sewer Design Guidelines (106.7 mm), resulted in further increases in the Beaver Pond water levels and higher discharges to the downstream Kizell Drain than noted above.
The updated hydrologic and hydraulic analysis completed using the July 22nd to 24th, 2009 storm event (centred over the Study Area) demonstrated the potential impacts to Beaver Pond water levels and peak outflows resulting from successive storm events and potential rain/snowmelt events.
The urban water quality assessment completed for the Beaver Pond indicated that the existing facility maintains a sufficient permanent pool volume (98%) and extended detention storage to provide Enhanced (Level 1) protection for existing urban lands currently draining to the pond.
Shirley’s Brook & Watt’s Creek Phase 2Stormwater Management Study
43ra_2015-04-27_SBWC Phase 2 SWM Study_Final_60164823 - GAF Rev
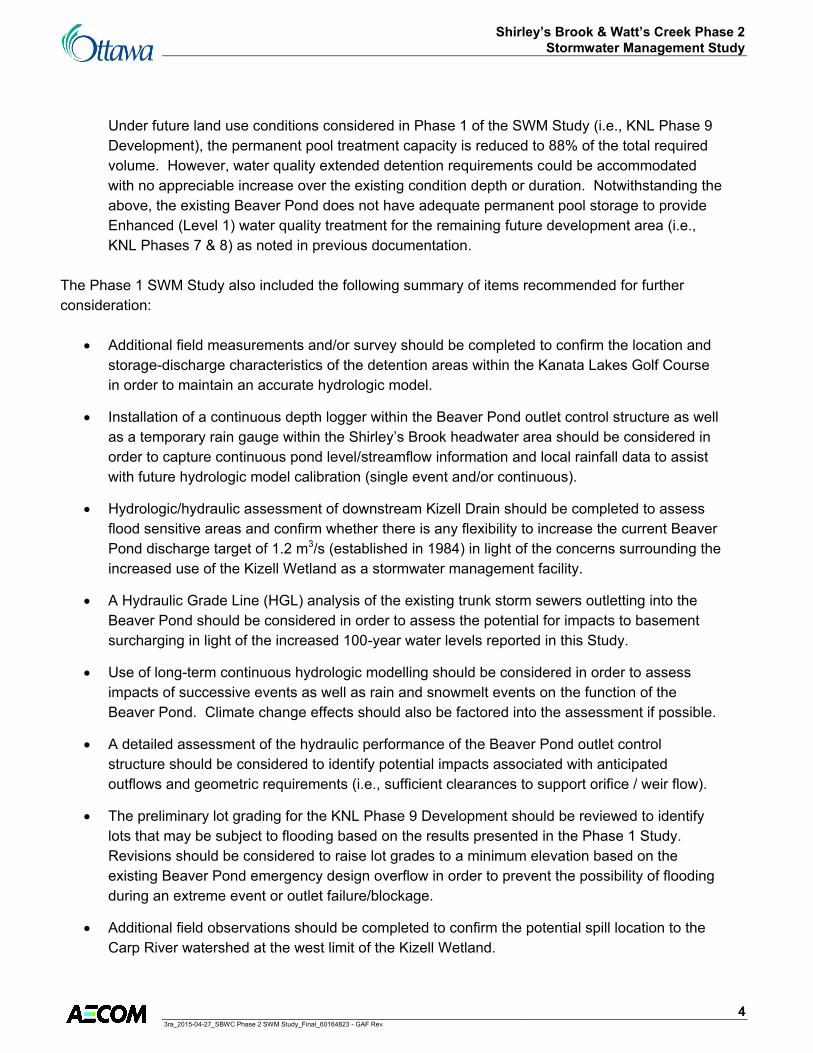
Under future land use conditions considered in Phase 1 of the SWM Study (i.e., KNL Phase 9 Development), the permanent pool treatment capacity is reduced to 88% of the total required volume. However, water quality extended detention requirements could be accommodated with no appreciable increase over the existing condition depth or duration. Notwithstanding the above, the existing Beaver Pond does not have adequate permanent pool storage to provide Enhanced (Level 1) water quality treatment for the remaining future development area (i.e., KNL Phases 7 & 8) as noted in previous documentation.
The Phase 1 SWM Study also included the following summary of items recommended for further consideration:
Additional field measurements and/or survey should be completed to confirm the location and storage-discharge characteristics of the detention areas within the Kanata Lakes Golf Course in order to maintain an accurate hydrologic model.
Installation of a continuous depth logger within the Beaver Pond outlet control structure as well as a temporary rain gauge within the Shirley’s Brook headwater area should be considered in order to capture continuous pond level/streamflow information and local rainfall data to assist with future hydrologic model calibration (single event and/or continuous).
Hydrologic/hydraulic assessment of downstream Kizell Drain should be completed to assess flood sensitive areas and confirm whether there is any flexibility to increase the current Beaver Pond discharge target of 1.2 m3/s (established in 1984) in light of the concerns surrounding the increased use of the Kizell Wetland as a stormwater management facility.
A Hydraulic Grade Line (HGL) analysis of the existing trunk storm sewers outletting into the Beaver Pond should be considered in order to assess the potential for impacts to basement surcharging in light of the increased 100-year water levels reported in this Study.
Use of long-term continuous hydrologic modelling should be considered in order to assess impacts of successive events as well as rain and snowmelt events on the function of the Beaver Pond. Climate change effects should also be factored into the assessment if possible.
A detailed assessment of the hydraulic performance of the Beaver Pond outlet control structure should be considered to identify potential impacts associated with anticipated outflows and geometric requirements (i.e., sufficient clearances to support orifice / weir flow).
The preliminary lot grading for the KNL Phase 9 Development should be reviewed to identify lots that may be subject to flooding based on the results presented in the Phase 1 Study. Revisions should be considered to raise lot grades to a minimum elevation based on the existing Beaver Pond emergency design overflow in order to prevent the possibility of flooding during an extreme event or outlet failure/blockage.
Additional field observations should be completed to confirm the potential spill location to the Carp River watershed at the west limit of the Kizell Wetland.
Shirley’s Brook & Watt’s Creek Phase 2Stormwater Management Study
53ra_2015-04-27_SBWC Phase 2 SWM Study_Final_60164823 - GAF Rev
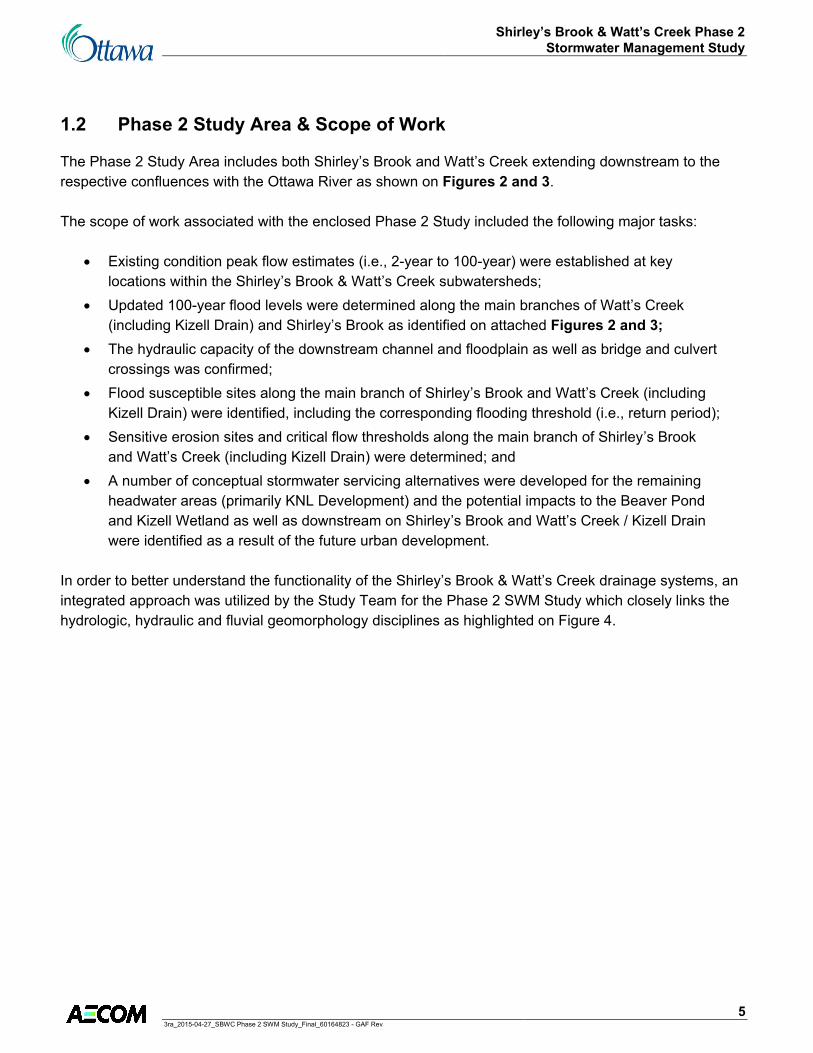
1.2 Phase 2 Study Area & Scope of Work
The Phase 2 Study Area includes both Shirley’s Brook and Watt’s Creek extending downstream to the respective confluences with the Ottawa River as shown on Figures 2 and 3.
The scope of work associated with the enclosed Phase 2 Study included the following major tasks:
Existing condition peak flow estimates (i.e., 2-year to 100-year) were established at key locations within the Shirley’s Brook & Watt’s Creek subwatersheds;
Updated 100-year flood levels were determined along the main branches of Watt’s Creek (including Kizell Drain) and Shirley’s Brook as identified on attached Figures 2 and 3;
The hydraulic capacity of the downstream channel and floodplain as well as bridge and culvert crossings was confirmed;
Flood susceptible sites along the main branch of Shirley’s Brook and Watt’s Creek (including Kizell Drain) were identified, including the corresponding flooding threshold (i.e., return period);
Sensitive erosion sites and critical flow thresholds along the main branch of Shirley’s Brook and Watt’s Creek (including Kizell Drain) were determined; and
A number of conceptual stormwater servicing alternatives were developed for the remaining headwater areas (primarily KNL Development) and the potential impacts to the Beaver Pond and Kizell Wetland as well as downstream on Shirley’s Brook and Watt’s Creek / Kizell Drain were identified as a result of the future urban development.
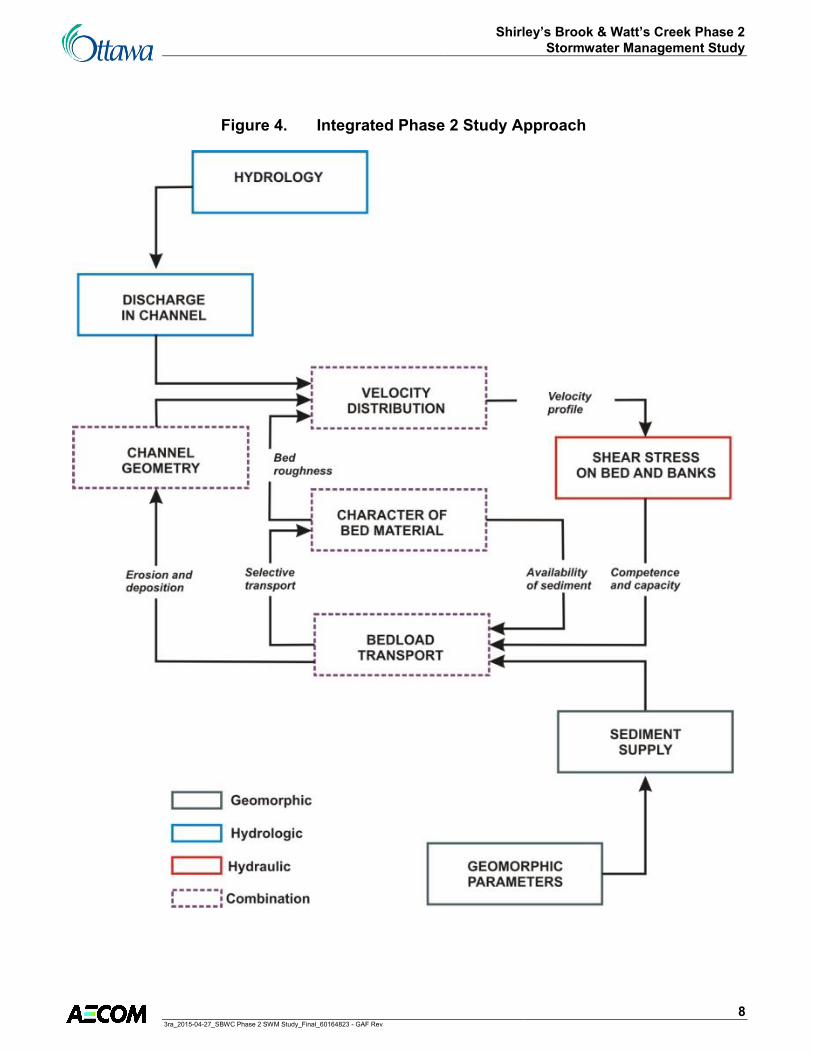
In order to better understand the functionality of the Shirley’s Brook & Watt’s Creek drainage systems, an integrated approach was utilized by the Study Team for the Phase 2 SWM Study which closely links the hydrologic, hydraulic and fluvial geomorphology disciplines as highlighted on Figure 4.
Carp
River
Watts C
reek
Shirleys Brook
Sti
ll W
ate
r C
reek
Poole Cre
ek
Carp River
Kiz
ell
Dra
in
Wa
t t’s Cree
k
Glen Cairn
March Road P.S.St. Gabriel School
WFP5
WFP4
WFP3
WFP2
WFP1
KFP6
KFP5
KFP4
KFP3
KFP2
KFP1
CK6-002
Beaver Pond
Crest Gauge KD-2
Crest Gauge KD-1
Crest Gauge WC-1
Ca
r p R
ive
Still Water Creek
Legend
Figure 2
Existing Drainage Conditions - Watt’s Creek/Kizell Drain
April

Sh
irle
ys
Bro
ok
Watts C
reek
Carp
River
Carp River
Carp R
iver
Shirley’s Brook
Fire Hall
SFP9SFP8
SFP7
SFP6
SFP5
SFP4
SFP3SFP2SFP1
SFP13
SFP12
SFP11
SFP10
CK5-001
SB-3
SB-2
SB-1
Legend
Figure 3
Existing Drainage Conditions - Shirley’s Brook
April
Shirley’s Brook & Watt’s Creek Phase 2Stormwater Management Study
83ra_2015-04-27_SBWC Phase 2 SWM Study_Final_60164823 - GAF Rev
Figure 4. Integrated Phase 2 Study Approach
Shirley’s Brook & Watt’s Creek Phase 2Stormwater Management Study
93ra_2015-04-27_SBWC Phase 2 SWM Study_Final_60164823 - GAF Rev
2. Report Organization
The Phase 2 Study report has been organized into the following sections:
Section 1 Study Background
Provides a summary of the Phase 1 Study scope of work, findings and recommendations. Provides a description of the overall Study goals & objectives and describes the Phase 2 Study
scope of work.
Section 2 Report Organization
Section 3 Background Data Sources
Provides a summary of key studies, GIS data, field activities and survey information used as input to the Phase 2 Study.
Section 4 Hydrologic Assessment
Provides details regarding the hydrologic and hydraulic modelling updates/revisions completed by AECOM to reflect the current conditions within the Study Area, including the previous Phase 1 area.
Details the calibration & verification methodology used to confirm / update peak flow estimates at key points within Shirley’s Brook and Watt’s Creek / Kizell Drain.
Includes assessment of alternative design storm event distributions and durations. Provides comparisons to historic peak flow estimates as well as results from the previous
Phase 1 Study.
Section 5. Hydraulic Assessment
Details the approach used to prepare HEC-RAS hydraulic models for the main branch of Shirley’s Brook and Watt’s Creek / Kizell Drain.
Provides an assessment of the hydraulic capacity at existing watercourse crossings within the Study Area.
Identifies potential Flood Vulnerable Structures (FVS) including the type of use, depth and frequency of anticipated flooding.
Includes details and assumptions used in the preparation of 100-year flood lines along the main branch of Shirley’s Brook & Watt’s Creek / Kizell Drain.
Section 6. Fluvial Geomorphology Assessment
Provides general geomorphic characteristics within the Study Area on a reach basis using various methods including RSAT, RGA and RRAF.
Includes detailed erosion assessment information including the development of erosion thresholds at sensitive locations sites within the Study Area.

Shirley’s Brook & Watt’s Creek Phase 2Stormwater Management Study
103ra_2015-04-27_SBWC Phase 2 SWM Study_Final_60164823 - GAF Rev
Section 7. Conceptual Stormwater Servicing Alternatives
Provides conceptual plans for potential stormwater servicing alternatives (i.e., diversion / no diversion) including the direction of minor and major storm drainage and general location and function of proposed stormwater management components.
Includes a summary description of the items considered for each alternative. Provides summary and detailed tables identifying potential impacts of each alternative.
Section 8. Summary of Findings
Provides a summary of existing condition findings based on the hydrologic, hydraulic and fluvial geomorphology analyses completed as part of the Phase 2 Study.
Provides a summary of findings based on the conceptual stormwater servicing alternatives considered for the remaining development area around the Beaver Pond and Kizell Wetland (primarily KNL Development).

Shirley’s Brook & Watt’s Creek Phase 2Stormwater Management Study
113ra_2015-04-27_SBWC Phase 2 SWM Study_Final_60164823 - GAF Rev
3. Background Data Sources
A considerable number of additional background data sources and reference documents were collected and reviewed as part of the Phase 2 Study. The following provides a summary these documents.
3.1 Studies and Reports
The following reports and studies were previously completed within the Phase 2 Study Area included the following:
Water Management Plan for Shirley’s Brook, Watt’s Creek, Kizell Drain & Harwood Creek Phase 1: Problem Identification (A.J. Robinson & Associates, December 1989);
Kanata Town Centre Master Drainage Plan Watt’s Creek (Cumming Cockburn Limited, December 1992)
Shirley’s Brook & Watt’s Creek Subwatershed Study (Dillon Consulting, September 1999);
Shirley’s Brook Floodplain Analysis & Stormwater Management Report - Klondike Road Development Lands (Novatech Engineering, November 2006); and
Shirley’s Brook & Watt’s Creek Phase 1 Stormwater Management Study (AECOM October, 2011).
A detailed list of reports and studies and additional reference material is included in Tables A-1 and Table A-2.
3.2 Geographic Information System (GIS) Data
Key GIS information provided by the City of Ottawa included the following layer information:
topography; land use and impervious cover data; infrastructure information (i.e., location, pipe size, direction of flow and outlet locations etc.); hydrologic data (i.e., stream networks, floodplain, monitoring locations); geology and surficial soils information; and aerial imagery.
A full list of GIS information layers is included in Table A-3.
3.3 Detailed Engineering Drawings
In addition to the above data, development area storm drainage and grading drawings and road plan and profile drawings were obtained from the City of Ottawa in order to supplement the hydrologic analyses.

Shirley’s Brook & Watt’s Creek Phase 2Stormwater Management Study
123ra_2015-04-27_SBWC Phase 2 SWM Study_Final_60164823 - GAF Rev
3.4 Field Data Collection & Surveys
3.4.1 Hydraulic Structure Inventory
In order to provide input to the Phase 2 hydraulic assessment and preparation of flood line maps, AECOM staff completed a detailed inventory of existing hydraulic structures within the Shirley’s Brook and Watt’s Creek systems. Information including size, type, length, material and general conditions were recorded on inventory sheets along with photo logs. Upstream and downstream low flow and floodplain characteristics (i.e., shape, general dimensions, vegetation conditions, etc.) were also recorded. Completed hydraulic inventory sheets are included in Appendix B and structure locations are identified on Figures 2 and 3.
3.4.2 Fluvial Geomorphology Site Investigations
In order to complete the fluvial geomorphological assessment of Shirley’s Brook and Watt’s Creek / Kizell Drain, staff from JTBES conducted site walks on three separate occasions along both watercourse systems extending from the outlets into the Ottawa River, upstream to the headwater areas. Site observations, detailed measurements and photo logs were recorded at a number of locations and are provided in Appendix E.
3.4.3 City of Ottawa Survey Data
A geodetic survey was completed by the City of Ottawa at hydraulic structure locations where limited or no design or as-built drawing information was available. Detailed survey information including upstream and downstream inverts and minimum top of road elevations are contained in Appendix B.
In addition to the above, City staff conducted a detailed site inspection within the Kanata Lakes Golf Course (KLGC) to confirm existing storage detention areas (DAs) as recommended in the Phase 1 Study (AECOM, 2011). Detailed inventory sheets were recorded at 14 locations and are included in Appendix B. Additional information is discussed further in Section 4.
3.4.4 Additional Field Observations Spot Checks & Detailed Surveys
Additional field spot checks and visual observations were completed by AECOM and JTBES staff throughout the Phase 2 Study to confirm the following drainage characteristics within the Shirley’s Brook and Watt’s Creek subwatershed areas:
Type and extent of existing urban development; Downspout connectivity; Surface drainage boundaries and general direction of surface flow; Trunk storm sewer outlets; SWM pond locations; and Areas utilizing Inlet Control Devices (ICDs).
Shirley’s Brook & Watt’s Creek Phase 2Stormwater Management Study
133ra_2015-04-27_SBWC Phase 2 SWM Study_Final_60164823 - GAF Rev
Further to the above, additional detailed cross-section surveys and hydraulic analyses was completed at streamflow gauge locations on Shirley’s Brook (CK5-01) and Watt’s Creek (CK6-002) in order to extend the City’s depth vs. discharge relationship as part of an additional hydrologic model calibration and verification exercise completed in 2013-2014. Details are included in Tables B-1 and B-2. Further discussion is also included in Section 4.
3.4.5 High Water Level Monitoring
Crest gauges were installed at six locations within the Study Area to record peak water levels at selected hydraulic structures. As shown on Figures 2 and 3, the locations were selected to provide a check on the hydrologic model calibration and verification process. Crest gauge readings were initiated from late May to the end of November 2012 and again from the end of July to late November 2013. Maximum water levels were recorded approximately every two weeks and converted to flow estimates using hydraulic calculations. Additional details are included in Tables B-3 to B-8. Further discussion is also included in Section 4.
3.4.6 Rainfall & Streamflow Monitoring
Rainfall and water level data was collected from mid-July to the end of November 2013 as part of an additional hydrologic model calibration and verification assessment. Monitoring locations are shown on Figures 2 and 3 and included the following:
Installation of depth loggers at six existing crest gauge locations; and Installation of two rain gauges: one within the northern portion of the Shirley’s Brook
subwatershed (Fire Hall), and one located in the southern portion of Watt’s Creek subwatershed (Glen Cairn Reservoir).
Summary plots of the additional rainfall and water level data collected during the 2013 monitoring period are included on Figures B-1 to B-6. Backwater conditions and periodic debris blockages resulted in unreliable depth readings at Location KD-2 (Kizell Drain at March/Station Road) and therefore, the collected data was not plotted or considered further. Also, water levels recorded during periods with air temperatures below 0C (i.e., late November) were removed from the plots due to inconsistent readings produced by the data loggers.
Shirley’s Brook & Watt’s Creek Phase 2Stormwater Management Study
143ra_2015-04-27_SBWC Phase 2 SWM Study_Final_60164823 - GAF Rev
4. Hydrologic Assessment
The following sections describe the major tasks completed as part of the hydrologic assessment carried out for the Phase 2 Study.
4.1 Hydrologic Model Set Up (SWMHYMO)
A detailed review of previous hydrologic modelling information within the Shirley’s Brook and Watt’s Creek subwatersheds was carried out using available studies provided by the City of Ottawa. Key studies reviewed for this task are referenced in Section 3.1 and Appendix A. Background hydrologic modelling information, in conjunction with secondary source data and field observations as described in Section 3 were used to prepare three comprehensive event-based hydrologic models using the SWMHYMO software program. As shown on Figure 2 and Figure 3 the models represent the major watercourse systems within the Phase 2 Study Area:
Upper Kizell Drain to Beaver Pond Outlet (Phase 1 Study Area); Watt’s Creek Subwatershed (including the Lower Kizell Drain downstream of the Beaver
Pond); and Shirley’s Brook Subwatershed.
As part of the initial hydrologic model set up, a thorough review of catchment area boundaries and model connectivity, land uses and impervious values, hydrologic response and abstractions as well as routing elements was completed for each of the SWMHYMO models. Updates and revisions were carried out to reflect current conditions as described in the following sections.
4.1.1 Upper Kizell Drain SWMHYMO Model
The SWMHYMO model, developed as part of the Shirley’s Brook & Watt’s Creek Phase 1 Stormwater Management Study (AECOM, 2011), was used for the current study phase to represent the Kizell Drain to the Beaver Pond outlet. The recent SWMHYMO model required several minor revisions based on additional field investigations completed by the City of Ottawa and described below:
Storage detention information collected by the City at 13 locations within the KLGC was screened based on available details, size of storage volume and contributing drainage area (refer to Table C-1-1). A total of seven of the DAs were subsequently incorporated into the Phase 2 SWMHYMO model. Four of the DAs (DA3, DA4, DA8 and DA9) were previously modelled as part of a sensitivity analysis completed for the Phase 1 Study (Scenario 20) and only required minor revisions to the storage-discharge relationships using newly acquired information. Three additional DAs (DA5A, DA10B and DA11) were also incorporated into the model. Detailed storage – discharge relationships for each DA are included in Table C-1-2 for reference.
Shirley’s Brook & Watt’s Creek Phase 2Stormwater Management Study
153ra_2015-04-27_SBWC Phase 2 SWM Study_Final_60164823 - GAF Rev
Catchment Area 3-A was further discretized into Catchments 3-A1 and 3-A2 to reflect the additional storage detention within the KLGC (DA 5A).
Additional Catchment Areas 12, 13 and 14 were delineated based on DAs identified in the field resulting in a marginal increase (8 ha or 1.9%) in total drainage area outletting to Beaver Pond.
No other changes were made as part of the initial SWMHYMO model set up. A comparison of Phase 1 and Phase 2 SWMHYMO input parameters, reflecting the above revisions, is included in Table C-1-3. Updated catchment area boundaries, storm sewer and overland flow routes and detention storage locations are delineated on Figure C-1-1. A detailed SWMHYMO model schematic, illustrating model connectivity, is included on C-1-2.
Following the above revisions, the SWMHYMO model for the Upper Kizell Drain was executed and checked for errors and warning messages.
4.1.2 Watt’s Creek SWMHYMO Model
4.1.2.1 Catchment Areas & Model Discretization
The QUALHYMO model prepared as part of the Shirley’s Brook and Watt’s Creek Subwatershed Study (Dillon, 1999) was converted to SWMHYMO and used as an initial base for the Phase 2 hydrologic assessment for Watt’s Creek and Kizell Drain downstream of the Beaver Pond (refer to Table C-1-4). As shown on Figures C-1-3 and C-1-4, the model was further discretized and catchment boundaries revised to reflect current conditions using the following background data sources:
City of Ottawa LiDAR data; GIS data (i.e., digital contours, storm sewer layout, storm catchment boundaries, hydraulic
structures and land use); Available detailed storm drainage and grading plans and detailed road plan and profile drawings; Recent digital aerial photographs; Previous stormwater management studies and reports; and Field observations and spot checks.
The following provides a summary of catchment area revisions completed for the Watt’s Creek SWMHYMO model using the above information:
Catchment KD-1 was removed and replaced by a READ HYD command to reflect Beaver Pond discharge hydrographs obtained from XPSWMM model results;
Catchment KD-2 was further discretized into three sub-catchments: KD-2A west of March Road, KD-2B east of March Road and KD-2C downstream of Herzberg Road;
Catchment KD-2A was future discretized into three sub-catchments to separate the rural area (KD-2A-1) from the urban area and to separate the urban area (KD-2A-2) discharging upstream of March Road from the urban area (KD-2A-3) discharging downstream of March Road;
Shirley’s Brook & Watt’s Creek Phase 2Stormwater Management Study
163ra_2015-04-27_SBWC Phase 2 SWM Study_Final_60164823 - GAF Rev
Catchment KD-2B was further discretized into seven sub-catchments to model SWMF (KD-2B-2, KD-2B-3, KD-2B-4, KD-2B-5 and KD-2B-6) and to separate rural area (KD-2B-7) from urban areas (KD-2B-1);
Catchment KD-3 was further discretized into two sub-catchments to model the urban area (KD-3A) west of Herzberg Road and rural area (KD-3B) east of Herzberg Road separately;
Catchment WC-1 was further discretized into two sub-catchments south of Highway 417 (WC-1A) and north of Highway 417 (Kanata Town Centre 1) based on previous study information (Kanata Town Centre Master Drainage Study, 1992);
The southwest portion of catchment WC-1 was removed as the GIS sewer layout and storm catchment boundaries suggest that runoff is routed away from the Watt’s Creek Subwatershed;
A portion of the rural area in WC-1 east of Herzberg Road was relocated to WC-3 based on recent LiDAR data;
Catchment WC-2 was further discretized into two sub-catchments (Kanata Town Centre 2A and Kanata Town Centre 2B) based on previous study information (Kanata Town Centre Master Drainage Study, 1992);
Catchment WC-3 was changed from a STANDHYD to NASHYD based on the current development status on aerial photo;
Catchment WC-4 was further discretized into two sub-catchments (WC-4A and WC-4B) to determine runoff of two of the Watt’s Creek tributaries; and
Catchment WC-5 was further discretized into two sub-catchments (WC-5A and WC-5B) to model the area upstream and downstream of Carling Avenue.
A total of 22 catchments were delineated for the Watt’s Creek model, with only a slight increase in total drainage area from 2128 ha to 2135 ha (i.e., 7 ha or 0.3%). Updated catchment area boundaries, direction of minor and major system flows and storage detention locations are shown on Figure C-1-3 and C-1-4 and a model schematic is provided on Figure C-1-2. A comparison of catchment area input parameters from the previous QUALHYMO model and current Phase 2 SWMHYMO model is also included in Table C-1-4.
4.1.2.2 Land Uses and Impervious Cover Assessment (TIMP & XIMP)
An analysis of existing land uses and impervious cover was undertaken for Watt’s Creek and Kizell Drain downstream of the Beaver Pond using the following primary background data sources:
City of Ottawa GIS data – Impervious cover (2012) and land use (2005); Recent digital aerial photographs; and Field observations.
Shirley’s Brook & Watt’s Creek Phase 2Stormwater Management Study
173ra_2015-04-27_SBWC Phase 2 SWM Study_Final_60164823 - GAF Rev
The impervious cover and land use data was reviewed and minor revisions were carried out to reflect current conditions. Directly connected impervious areas (XIMP) were adjusted to 0.75 of the total residential impervious values (TIMP), which is consistent with the methodology used in the Phase 1 SWM Study as well as the City’s Sewer Design Guidelines. For all other land uses (e.g., commercial, industrial, institutional) the directly connected imperviousness was made equal to the total imperviousness (TIMP). The resulting TIMP and XIMP values within the Watt’s Creek SWMHYMO model ranged between 0.24 to 0.61 and 0.23 to 0.61 respectively. A comparison of the TIMP and XIMP parameters between the previous QUALHYMO model and revised Phase 2 SWMHYMO model are included in Table C-1-4.
4.1.2.3 Soil Infiltration and Hydrologic Response (SCS CN, Ia, and Tp)
A soil – land use overlay analysis was carried out to determine the appropriate SCS Curve Number (CN) for catchment areas within Watt’s Creek and Kizell Drain (downstream of the Beaver Pond) using surficial soil and geology information (Hydrologic Soil Group - HSG) obtained from the Ontario Ministry of Agriculture Food and Rural Affairs (OMAFRA) and detailed land use information from the above noted sources. Resulting CN values ranged from 57 to 83 (AMC II) and were found to be generally consistent with the values contained in previous QUALHYMO model (Dillon, 1999).
Impervious and pervious Initial Abstraction values (Ia) of 0.8 mm and 1.5 mm for urban catchment areas were established for initial model conditions. Rural areas incorporated initial Ia values of 5 mm or 7 mm, similar to the previous QUALHYMO model.
Using the same methodology in the Phase 1 Study, the Time to Peak (Tp) values for rural areas were calculated using both Bransby-Williams and SCS Upland methods with the smallest value incorporated into the revised SWMHYMO model. A comparison of the SCS CN and Tp values between the QUALHYMO model and revised SWMHYMO model are included in Table C-1-4.
4.1.2.4 Urban Width Parameter (LGP & LGI), Slopes (SLPI, SLPP) & Roughness Coefficients (MNI, MNP)
A typical catchment width value of 40 m was assumed for the urban pervious areas (LGP). The catchment width of impervious areas (LGI) was estimated with one of the two methods identified below (City’s SDG), depending on the general shape of the catchment area:
Irregular Shape - LGI was determined using a unit value of 225 m/ha; or Regular Catchment Shape - LGI was determined using 2 x the catchment width.
Typical slopes (2.0% and 0.2% for pervious and impervious areas) and roughness coefficients (0.250 and 0.013 for pervious and impervious areas) values were used for all catchments
Shirley’s Brook & Watt’s Creek Phase 2Stormwater Management Study
183ra_2015-04-27_SBWC Phase 2 SWM Study_Final_60164823 - GAF Rev
4.1.2.5 Storage Routing
A total of 16 stormwater management facilities (SWMF) were identified within the Watt’s Creek / Kizell Drain SWMHYMO modelling area (refer to Figures C-1-3 and C-1-4). Ten of the facilities are recorded in the City’s SWMF GIS database. Four of the recorded facilities are identified as wet ponds and the remaining six are identified as site level bio-filters with no appreciable flood storage. In addition to the ten noted facilities, an additional six ponds were identified from aerial photography and field observations. Three of the additional ponds are located within the Marshes Golf Course while the remaining three ponds service individual site areas within the commercial/industrial area east of March Road.
The SWMF information was screened and the following six SWMFs were included in the SWMHYMO model based on availability of information:
Kanata Town Centre SWF (SWF-1206); Village Green SWF (SWF-1205); Unnamed Pond (KD-05) north of Marsh Sparrow Private; Unnamed Pond (KD-04) within Marshes Golf Course; and Two site-level SWMF (KD-01 and KD-03) within the commercial/industrial area east of March
Road.
Storage-discharge details, modelling methodology and assumptions for each SWM pond are included in Table C-1-5.
4.1.2.6 Channel Routing
All channel routing elements used in the previous QUALHYMO model were updated as part of the Phase 2 SWM Study. Representative channel routing sections were obtained from the hydraulic model (HEC-RAS) prepared for Watt’s Creek and Kizell Drain (refer to Section 5.1). Cross-section geometry, channel length, slope and roughness coefficients were updated in the SWMHYMO model accordingly. Slopes were calculated using the channel invert elevations and the length of channel segments, with a minimum slope set at 0.1%. In areas with no HEC-RAS modelling (i.e., Watt’s Creek upstream of confluence with Kizell Drain), channel routing input formation was obtained from the latest LiDAR data obtained from the City.
Following the above updates and revisions, the Watt’s Creek SWMHYMO model was executed and checked for errors and warning messages.
4.1.3 Shirley’s Brook SWMHYMO Model
4.1.3.1 Catchment Areas & Model Discretization
The SWMHYMO model prepared as part of the Shirley’s Brook Floodplain Analysis and Stormwater Management Report for the Klondike Road Development Lands (Novatech Engineering Consultants,

Shirley’s Brook & Watt’s Creek Phase 2Stormwater Management Study
193ra_2015-04-27_SBWC Phase 2 SWM Study_Final_60164823 - GAF Rev
2006) was used as an initial base for the Phase 2 hydrologic assessment for Shirley’s Brook (refer to Table C-1-6). As shown on Figures C-1-5 and C-1-6, the model was further discretized and catchment boundaries revised to reflect current conditions using background data sources identified in Section 4.1.2.
The following drainage area modifications were carried out in order to more accurately reflect the existing minor and major flow patterns and connectivity confirmed using detailed drawings and LiDAR data.
Morgan’s Grant 10A
Drainage boundary of Catchment 1 was extended westward according to the latest LiDAR information;
Catchments 3 and 3A were further discretized into Catchments 3A, 3B, 3C and 3D, with Catchments 3C and 3D extending into Morgan’s Grant subdivision. This was carried out in order to model major system storage areas identified within the Hydro corridor;
Catchment 5 was further discretized into Catchments 5A, 5B and 5C, with Catchment 5C extending into Morgan’s Grant subdivision. This was carried out in order to model major system storage areas identified within the Hydro corridor;
Drainage boundaries of Catchments 7 and 8 were adjusted slightly to reflect the roadside storage ditches adjacent to Terry Fox Drive; and
Catchment 9 was revised from a STANDHYD to NASHYD command based on the current development status on confirmed on aerial photographs and field observations. The catchment boundary was also adjusted according to the latest LiDAR data.
Northtech Campus
Drainage boundaries associated with rural Catchments 8A, 719 and 726 were adjusted according to the latest LiDAR data;
Catchment 402 was revised from a DESIGN hydrograph command to CALIB hydrograph command to facilitate model calibration;
Catchment 402 was further discretized into two Catchments, 402-1 and 402-2, in order to model site-level SWM controls;
Catchment 862 was further discretized into two Catchments, 862-1 and 862-2, in order to model site-level SWM controls;
Catchment 719 was revised from STANDHYD to NASHYD based on the current development status confirmed through aerial photographs and field observations.
Kanata Research Park
Catchment KRP-1 was further discretized into two Catchments, KRP-1A and KRP-1B, in order to model site-level SWM controls.
Shirley’s Brook & Watt’s Creek Phase 2Stormwater Management Study
203ra_2015-04-27_SBWC Phase 2 SWM Study_Final_60164823 - GAF Rev
South March Community
Redirection of minor system drainage from Morgan’s Grant Catchments 1,2, 3, 4 and 5 from original outlet to the South March Community to a new SWM pond located to the north;
Major system drainage from Morgan’s Grant Catchment 1, 2, 4 and 5 directed through the South March Community;
Morgan’s Grant Catchment 6 was moved to South March Community based on minor system connectivity verified using available drawings. In addition, it was further discretized into two Catchments, 6A and 6B, based on major system flow routes indicated by LiDAR data;
Catchment 850 was further discretized into two Catchments, 850-1 and 850-2, to differentiate areas with and without ICDs respectively; and
Catchment 701 was further discretized into four Catchments, 701A, 701B, 701C and 701D, with the drainage boundaries of 701C and 701D extending into Klondike subdivision. Catchments 701B and 701D were separated from 701A to model site-level SWM controls. Catchment 701C was separated from catchment 701A in order to direct minor and major system flows to different outlet locations.
Northwest Branch
Catchment boundaries were updated according to latest LiDAR data
Morgan’s Grant
Major system drainage from Catchments 1A, 1B, 2, 4, 5 and 6 was redirected to the South March Community;
Removal of DUALHYD command in order to direct minor and major system flows from Catchment 13 to Pond SWF-1236;
Removal of the SHIFT HYD commands in the base model given no appreciable impact to modelling results; and
Catchment 8B was revised from STANDHYD to NASHYD command based on the current development status confirmed from aerial photographs and field observations.
Klondike Road Development Lands
Catchment C-300 was further discretized into two Catchments, C-300A and C-300B, according to LiDAR and sewer layout, to represent area with different flow routes;
Catchment A-500, C-201, C-202, C-203, C-101 and D-302 were revised from STANDHYD to NASHYD based on the current development status confirmed from aerial photographs and field observations; and
All DESIGN hydrographs commands were revised to CALIB hydrographs commands to facilitate model calibration.

Shirley’s Brook & Watt’s Creek Phase 2Stormwater Management Study
213ra_2015-04-27_SBWC Phase 2 SWM Study_Final_60164823 - GAF Rev
Northeast (Downstream of March Valley Road)
Catchment 5 was further discretized into two Catchments, 5A and 5B, to facilitate model calibration and comparison at the existing streamflow gauge; and
Catchment 6 was further discretized into two Catchments to separate urban area (6A) from rural area (6B).
A total of 82 catchments were delineated for the Shirley’s Brook SWMHYMO model, comprising a total area of 3043 ha (refer to model schematics presented on Figures C-1-7 and C-1-8). The updated drainage area is approximately 1384 ha larger than the initial base model (Novatech 2006) which maintained a total area of 1659 ha. The main cause for the increase in drainage area the inclusion of additional area downstream of March Valley Road in the revised SWMHYMO model. A comparison of drainage areas upstream of March Valley Road (1767 ha vs. 1659 ha) indicates an increase of only 108 ha or 7% above the original base model (Novatech 2006). A comparison of base and revised SWMHYMO catchment areas is included in Table C-1-6.
4.1.3.2 Minor System (Storm Sewer) & Major System (Overland Flow) Connectivity
DUALHYD commands were applied to split minor system (storm sewer) and major system (overland) flows for areas with different outlet locations. A detailed review of the available storm drainage and grading plans confirmed that a majority of the urban area within Shirley’s Brook has implemented the use of Inlet Control Devices (ICD) at storm sewer inlets (refer to Figures C-1-5 and C-1-6). The following criteria were used to estimate the flow split between major and minor system at DUALHYD locations:
Areas with ICD’s – maximum minor system capture rate of 85 L/s/ha (City’s SDG); and Areas without ICD’s – maximum minor system capture up to the 5-year design event.
4.1.3.3 Land Uses and Impervious Cover Assessment (TIMP & XIMP)
An analysis of existing land uses and impervious cover was undertaken for the Shirley’s Brook Study Area using background data sources identified in Section 4.1.2. The impervious cover and land use data was reviewed and minor revisions were carried out to reflect current conditions. Directly connected impervious areas (XIMP) were adjusted to 0.75 of the total residential impervious values (TIMP) which is consistent with the methodology used in the Phase 1 SWM Study as well as the City’s SDG. For all other land uses (e.g., commercial, industrial, institutional) the directly connected impervious values (XIMP) were set equal to the total impervious cover values (TIMP).
The resulting TIMP and XIMP values within the Shirley’s Brook SWMHYMO model ranged between 0.25 to 0.91 and 0.23 to 0.91 respectively. A comparison of the TIMP and XIMP parameters between the base model and the revised model can be found in Table C-1-6.
Shirley’s Brook & Watt’s Creek Phase 2Stormwater Management Study
223ra_2015-04-27_SBWC Phase 2 SWM Study_Final_60164823 - GAF Rev
4.1.3.4 Soil Infiltration and Hydrologic Response (SCS CN, Ia, and Tp)
The loss calculation procedure for all catchment areas was revised from Horton’s Infiltration to the SCS approach in order to maintain consistency between SWMHYMO models.
A soil – land use overlay analysis was carried out to determine the appropriate SCS Curve Number for catchment areas within Shirley’s Brook using surficial soil and geology information (Hydrologic Soil Group - HSG) obtained from OMAFARA and detailed land use information from the above noted sources. The resulting CN values range from 39 to 87 (AMC II).
Impervious and pervious Initial Abstraction values (Ia) of 0.8 mm and 1.5 mm for urban catchment areas were established for initial model conditions. Rural areas incorporated initial Ia values of 1.5 mm, similar to the previous SWMHYMO model.
In addition to the above, depressional topographic areas were identified within Northtech Catchment 8A and Northwest Catchment 2B as shown on Figure C-1-5. A GIS sink/fill analysis was performed using LiDAR data in order to estimate the permanent storage volume associated with the depressional areas. This resulted in an additional 19 mm and 4 mm of Ia for Catchments 8A and 2B respectively.
Time to Peak (Tp) values were calculated for all rural catchment areas using the Bransby-Williams and SCS Uplands methods with the smaller estimate incorporated into the revised SWMHYMO model.
4.1.3.5 Urban Width Parameter (LGP & LGI), Slopes (SLPI, SLPP) and Roughness Coefficients (MNI, MNP)
A typical catchment width value of 40 m was assumed for the urban pervious areas (LGP). The catchment width of impervious areas (LGI) was estimated with one of the two methods identified below (City’s SDG), depending on the general shape of the catchment area:
Irregular Shape – LGI was determined using a unit value of 225 m/ha; or Regular Catchment Shape - LGI was determined using two (2) x the catchment width.
Typical slopes (2.0% and 0.2% for pervious and impervious areas) and roughness coefficients (0.250 and 0.013 for pervious and impervious areas) values were used for all catchments
4.1.3.6 Storage Routing
A total of 39 stormwater management facilities (SWMF) were identified within the Shirley’s Brook SWMHYMO model area (refer to Figures C-1-5 and C-1-6), ten of which were identified in the City’s SWMF database. Nine facilities comprise wet ponds while the remaining facility is an interceptor. A total of 29 additional SWMF were visually identified using the recent aerial photographs, available drawings and field observations.
Shirley’s Brook & Watt’s Creek Phase 2Stormwater Management Study
233ra_2015-04-27_SBWC Phase 2 SWM Study_Final_60164823 - GAF Rev
22 storage routing elements representing 39 SWMF within the Shirley’s Brook area were included in the updated SWMHYMO model. Revisions to the SWMHYMO model to reflect the storage routing elements within each of the major drainage areas is described below and additional details included in Table C-1-7:
Morgan’s Grant 10A
The storage routing element servicing Catchments 1, 2 and 3C could not be located and was therefore removed from the SWMHYMO model;
The following storage elements located within the Hydro corridor north of Terry Fox Drive were incorporated into the SWMHYMO model: SB-02 and SB-03 (modelled as one routing element); SWF-1230 and SWF-1229 (modelled as one routing element); and SB-04, SB-05 and SB-06 (modelled as one routing element)
Additional storage routing elements were provided adjacent to Terry Fox Drive for Catchment Areas 7 and 8; and
All ROUTE RESERVOIR commands were modified to include an overflow to avoid excessive routing resulting from SWMHYMO extrapolation of the rating curves.
Northtech Campus
The storage routing element servicing Catchment 719 could not be located and was therefore removed from the SWMHYMO model;
The SWM pond included north of Hines Road could not be located and was therefore removed from the SWMHYMO model;
17 small site-level SWM facilities were identified throughout the industrial development located in catchment 402 and 862 with estimated volumes ranging from approximately 100 m3 to 600 m3. A “lumped” storage element was created to represent site level SWM within Catchment 402 and 862.
Kanata Research Park
A private pond (SB-26) located south of Terry Fox Drive, servicing Catchment 1B, was added to the revised SWMHYMO model using an estimated storage –discharge curve;
The storage-discharge curve for private pond (SB-25), servicing Catchment 1A, was revised using volume and outlet details extracted from available drawings; and
A dry pond (SB-24) located north of Solandt Drive and east of Legget Drive, servicing Catchment 2, was added to revised model using an estimated storage-discharge curve.
South March Community
A review of available drawings indicated that there are multiple SWM facilities in the apartment/townhouse complex at 750 March Road (catchment 701B). In the revised model;
Shirley’s Brook & Watt’s Creek Phase 2Stormwater Management Study
243ra_2015-04-27_SBWC Phase 2 SWM Study_Final_60164823 - GAF Rev
Five dry ponds servicing Catchment 701B were included as a “lumped” storage element using an estimated storage-discharge curve;
An existing dry pond (SB-27) in catchment 701D. Storage-discharge information for dry pond (SB-27), servicing Catchment 701D was updated using available drawings; and
An on-line pond (SWF-1215) was included in the base model. Stage-storage information for an on-line pond (SWF-1215) was updated with available drawings and additional analysis using HEC-RAS.
Northwest Branch
No existing storage elements were identified northwest branch of Shirley’s Brook Subwatershed.
Morgan’s Grant
Existing storage elements contained in the SWMHYMO model were reviewed with available drawings and field observations and no additional revisions were carried out.
Klondike Road Development Lands
The storage-discharge relationships for SWF-1234 and SWF-1235 were updated with the rating curve from reports R-1588 and R-1589 respectively
4.1.3.7 Channel Routing
Representative channel routing sections were obtained from the hydraulic model (HEC-RAS) prepared for Shirley’s Brook (refer to Section 5.1). Cross-section geometry, channel length, slope and roughness coefficients were updated in the SWMHYMO model. Slopes were calculated using the channel invert elevations and the length of channel segments, with a minimum slope set at 0.1%. In areas with no HEC-RAS modelling (i.e., tributaries), channel routing input formation was obtained from the latest LiDAR data obtained from the City.
Following the above updates and revisions, the Shirley’s Brook SWMHYMO model was executed and checked for errors and warning messages.
4.2 Initial SWMHYMO Model Calibration and Verification (2011 - 2012)
Subsequent to the model preparation as described in Section 4.1, an initial calibration and verification exercise was then completed using local rainfall data and streamflow information collected by the City of Ottawa for 2011 and 2012. The purpose of the calibration was to confirm that the hydrologic models developed for Phase 2 reasonably reflect regional and local hydrologic responses to storm events occurring within the Study Area. The following tasks were completed in preparation of the calibration and verification exercise:
Shirley’s Brook & Watt’s Creek Phase 2Stormwater Management Study
253ra_2015-04-27_SBWC Phase 2 SWM Study_Final_60164823 - GAF Rev
4.2.1 Storm Event Selection
In order to carry out the calibration and verification exercise, local rain gauge data and streamflow monitoring information was obtained from the City of Ottawa at the following locations (refer to Figure 2 and Figure 3):
2011 and 2012 streamflow data recorded on Shirley’s Brook downstream of March Valley Road (CK5-01);
2011 and 2012 streamflow data recorded on Watt’s Creek at Carling Avenue (CK6-002) 2011 and 2012 water level data recorded at the Beaver Pond outlet structure; 2011 and 2012 rainfall data recorded at the March Road Pumping Station (P.S.); and 2012 rainfall data recorded at a rain gauge located at St. Gabriel Public School
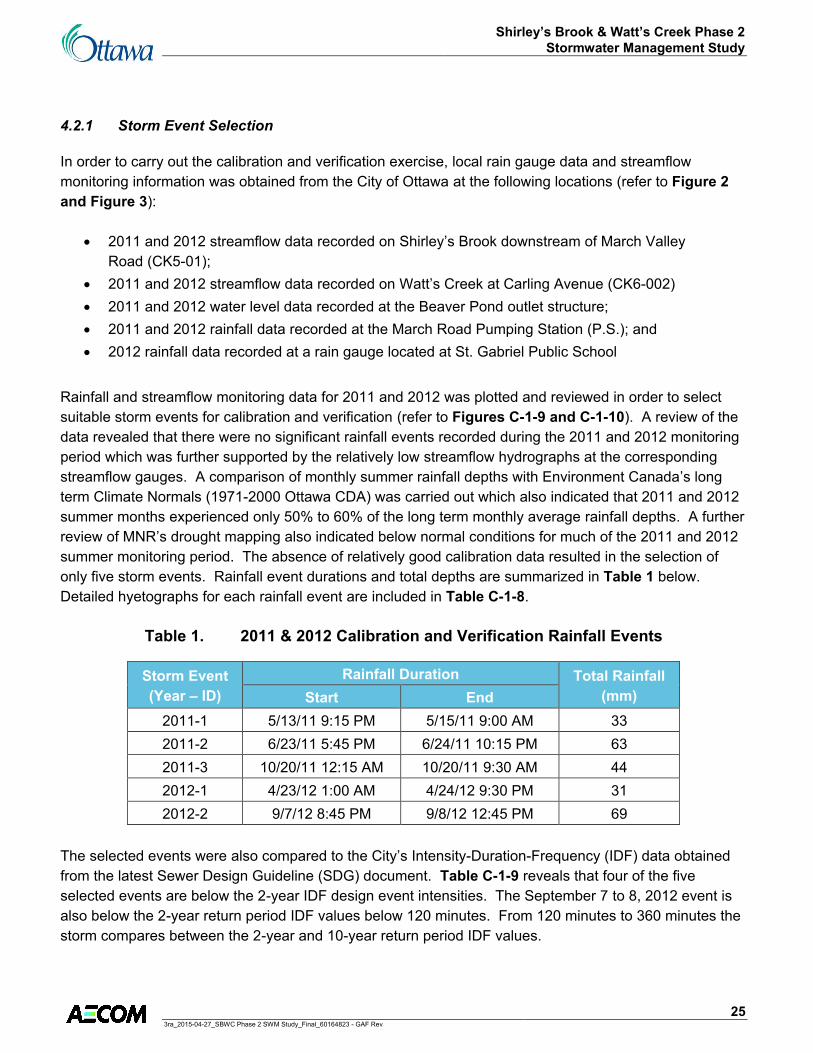
Rainfall and streamflow monitoring data for 2011 and 2012 was plotted and reviewed in order to select suitable storm events for calibration and verification (refer to Figures C-1-9 and C-1-10). A review of the data revealed that there were no significant rainfall events recorded during the 2011 and 2012 monitoring period which was further supported by the relatively low streamflow hydrographs at the corresponding streamflow gauges. A comparison of monthly summer rainfall depths with Environment Canada’s long term Climate Normals (1971-2000 Ottawa CDA) was carried out which also indicated that 2011 and 2012 summer months experienced only 50% to 60% of the long term monthly average rainfall depths. A further review of MNR’s drought mapping also indicated below normal conditions for much of the 2011 and 2012 summer monitoring period. The absence of relatively good calibration data resulted in the selection of only five storm events. Rainfall event durations and total depths are summarized in Table 1 below. Detailed hyetographs for each rainfall event are included in Table C-1-8.
Table 1. 2011 & 2012 Calibration and Verification Rainfall Events
Storm Event (Year – ID)
Rainfall Duration Total Rainfall (mm) Start End
2011-1 5/13/11 9:15 PM 5/15/11 9:00 AM 33 2011-2 6/23/11 5:45 PM 6/24/11 10:15 PM 63 2011-3 10/20/11 12:15 AM 10/20/11 9:30 AM 44 2012-1 4/23/12 1:00 AM 4/24/12 9:30 PM 31 2012-2 9/7/12 8:45 PM 9/8/12 12:45 PM 69
The selected events were also compared to the City’s Intensity-Duration-Frequency (IDF) data obtained from the latest Sewer Design Guideline (SDG) document. Table C-1-9 reveals that four of the five selected events are below the 2-year IDF design event intensities. The September 7 to 8, 2012 event is also below the 2-year return period IDF values below 120 minutes. From 120 minutes to 360 minutes the storm compares between the 2-year and 10-year return period IDF values.

Shirley’s Brook & Watt’s Creek Phase 2Stormwater Management Study
263ra_2015-04-27_SBWC Phase 2 SWM Study_Final_60164823 - GAF Rev
4.2.2 Streamflow Data Preparation
Streamflow data was reviewed at each location over the duration of the selected events. Continuous water level data collected at the outlet of Beaver Pond was converted to a continuous outflow hydrograph using the hydraulic relationship contained in the XPSWMM model. For each storm event, base flows were separated from the streamflow hydrographs in order to isolate surface flows at both the Shirley’s Brook (CK5-01) and Watt’s Creek (CK6-002) gauge locations.
The resultant surface runoff hydrograph data was reviewed for any suspect and / or missing data. Several gaps in monitoring data and rating curve limitations at both stream gauge locations resulted in several periods of suspect or missing data. As a result, a complete data set was not available at all of the monitoring locations for each of the selected storm events. The following table provides a summary of the storm events and how they were applied for calibration and verification at each monitoring location.
Table 2. Selection of Calibration and Verification Events at Monitoring Locations
Storm Event (Year – ID)
SWMHYMO Model to Gauge Location Upper Kizell
(Beaver Pond Outlet) Watt’s Creek
(CK6-002) Shirley’s Brook
(CK5-01) 2011-1 - Calibration Calibration2011-2 Calibration - Verification2011-3 - Verification Calibration2012-1 Calibration Calibration Verification2012-2 Verification Verification -
4.2.3 Upper Kizell Drain Calibration and Verification
Calibration of the Upper Kizell Drain SWMHYMO model was completed first in order that resultant flow hydrographs could be saved as input during the Watt’s Creek calibration process. In order to compare simulated flow hydrographs to observed runoff response at the outlet of the Beaver Pond, SWMHYMO inflow hydrographs to the Kizell Cell and Beaver Pond were imported into the XPSWMM (hydraulic) model prepared as part of the Phase 1 Study to confirm peak outflow and water levels within the facilities. A review of water level information collected for the Beaver Pond was carried out for each of the selected events and initial model conditions adjusted to reflect pre-event water levels observed within the Beaver Pond and Kizell Cell (refer to Table C-1-10).
Initial outflow hydrographs simulated from the Phase 1 SWM Study were compared to the observed hydrographs at the Beaver Pond outlet for Events 2011-1 and 2011-2 (refer to Figures C-1-11 and C-1-12- Phase 1). Simulated hydrographs produced a reasonable correlation between hydrograph shape and timing with recorded data. However, peak flows and runoff volume were significantly higher than the observed values.
Shirley’s Brook & Watt’s Creek Phase 2Stormwater Management Study
273ra_2015-04-27_SBWC Phase 2 SWM Study_Final_60164823 - GAF Rev
4.2.3.1 Upper Kizell Drain SWMHYMO Model Adjustments
In light of the higher runoff volumes associated with the initial simulations, the following adjustments were made to the Upper Kizell Drain SWMHYMO model to obtain a better fit:
Existing SCS Curve Numbers were adjusted based on a surficial soil (HSG) – land use overlay assessment using GIS data provided by the City. Adjusted CN values for the Upper Kizell modelling area ranged from 50 to 78 (AMC II) which were approximately 3% to 28% lower than values used in the previous KNL Serviceability Study (IBI, 2002, 2006 & 2007) and Phase 1 SWM Study (AECOM, 2011);
In light of the dry soil moisture conditions preceding the calibration events i.e., 3-day and 5-day Antecedent Moisture Conditions (AMC), the revised SCS CN values were further reduced from AMC II conditions (normal soil moisture) to AMC I (dry conditions) for each catchment within the Upper Kizell Drain SWMHYMO model;
Initial abstraction (Ia) for all rural catchment areas was increased to an average value of 7 mm based on an assessment of the rainfall-runoff response using recorded observations (refer to Table C-1-11). It should be noted that the Ia value also compared well with the calibrated Ia value established in the Shirley’s Brook & Watt’s Creek Subwatershed Study (SBWCSWS - Dillon, 1999);
Initial abstraction (Ia) for all urban areas was increased from 0.8 mm (impervious) and 1.5 mm (pervious) to 1.57 mm and 4.67 mm to match the values provided in the City’s SDG;
The impervious roughness coefficient (MNI) was adjusted for all urban catchment areas from 0.013 to 0.025; in order to further “flatten” the simulated response; and
Linear reservoir values (n) in the rural catchment areas were lowered from an n = 3.0 to n = 1.1 in order to reflect a “flatter” hydrograph response. This parameter adjustment was also found to be consistent with the calibrated n values determined in the QUALHYMO modelling carried out as part of the SBWCSWS (Dillon, 1999).
A comparison of the revised SWMHYMO input parameters for each catchment area is included in Table C-1-3.
4.2.3.2 Upper Kizell Drain Calibrated SWMHYMO Results
The SWMHYMO model was re-run with the above revisions (refer to Figures C-1-11 and C-1-12 – Calibrated Point Rainfall) and compared to observed hydrographs. Table C-1-11 indicates a reasonable comparison between simulated and observed peak flows for Event 2011-2, however, the simulated peak flow for Event 2012-1 remains higher (+70% to +200%). Hydrograph timing is consistent between simulated and observed for the 2011-2 calibration event (-2.75 hrs) and runoff volume is relatively close for Event 2011-2 and moderately higher for Event 2012-1 (+16% to + 95%).
Shirley’s Brook & Watt’s Creek Phase 2Stormwater Management Study
283ra_2015-04-27_SBWC Phase 2 SWM Study_Final_60164823 - GAF Rev
In order to verify the SWMHYMO model, an additional storm event (Event 2012-2) was simulated and compared to observed data (refer to Table C-1-11 and Figure C-1-13). Results reveal a good match between hydrograph timing (- 1.0 hr), a moderate comparison to peak flow (+267%) and higher runoff volume than observed (+88%).
In light of the limitations associated with the 2011 and 2012 storm event and streamflow data, any further revisions to the calibration parameters would be considered outside the range of reasonable adjustment and would require additional monitoring data to further confirm the Upper Kizell Drain SWMHYMO model calibration and / or support any further changes.
4.2.4 Watt’s Creek SWMHYMO Model Calibration and Verification
Calibration of the Watt’s Creek model was carried out subsequent to the Upper Kizell Drain in order that hydrograph input from XPSWMM model could be imported into the hydrologic model to reflect the calibrated discharge from the Beaver Pond. Initial simulations using the SWMHYMO model created for the Watt’s Creek and Kizell Drain (downstream of the Beaver Pond outlet) were run and compared to observed hydrographs on Watt’s Creek at Carling Avenue (CK6-002) for calibration Events 2011-1 and 2012-1 (refer to Figures C-1-14 and C-1-15 - Initial Model Set up). A comparison with the observed hydrographs indicated a reasonable match for hydrograph shape and timing. However, peak flows and runoff volumes were significantly higher than the observed values.
4.2.4.1 Watt’s Creek SWMHYMO Model Adjustments
In order to reduce the simulated peak flows and runoff volumes, the following adjustments were made to the SWMHYMO model:
In light of the dry soil moisture conditions preceding the calibration events i.e., 3-day and 5-day Antecedent Moisture Conditions (AMC) the revised SCS CN values were further reduced from AMC II conditions (normal soil moisture) to AMC I (dry conditions) for each catchment within the Watt’s Creek SWMHYMO model;
Initial abstraction (Ia) for all urban areas was increased from 0.8 mm (impervious) and 1.5 mm (pervious) to 1.57 mm and 4.67 mm to match the values provided in the City’s SDG;
The impervious roughness coefficient (MNI) was adjusted for all urban catchment areas from 0.013 to 0.025; in order to further flatten the and,
All rural catchment internal reservoirs (n) were reduced from n=3 to a minimum of n=1.1 in order to reflect a flatter hydrograph shape. This parameter adjustment was also found to be consistent with the calibrated n values determined in the QUALHYMO modelling carried out as part of the SBWCSWS (Dillon, 1999).
All catchment area adjustments are summarized in Table C-1-4.
Shirley’s Brook & Watt’s Creek Phase 2Stormwater Management Study
293ra_2015-04-27_SBWC Phase 2 SWM Study_Final_60164823 - GAF Rev
4.2.4.2 Watt’s Creek Calibrated SWMHYMO Results
The SWMHYMO model was re-run with the above model adjustments (refer to Figures C-1-14 and C-1-15 – Calibrated Point Rainfall) and compared to observed hydrographs. A review of the results presented in Table C-1-11 confirms that peak flows and runoff volumes were significantly reduced over uncalibrated conditions but continue to be above observed levels (+350% to +450% and +400% to +700% respectively). Hydrograph timing and shape compare reasonable well with observed data (+1.25 hrs to -9.25 hrs). However, simulated values are still above recorded values at the Carling Avenue streamflow gauge.
Simulated hydrographs were also produced for verification Events 2011-3 and 2012-2 (refer to Figures C-1-16 and C-1-17) which compare well with observed runoff hydrograph shape. However, peak flows, timing and runoff volumes could not be compared given that flow depths exceeded the maximum point on the stream gauge rating curve (i.e., 0.9 m3/s) and could not be extrapolated with a competent level of accuracy.
In light of the limitations associated with the 2011 and 2012 storm event and streamflow data, any further revisions to the calibration parameters would be considered outside the range of reasonable adjustment and would require additional monitoring data to further confirm the Watt’s Creek SWMHYMO model calibration and / or support any further changes.
4.2.5 Shirley’s Brook SWMHYMO Model Calibration and Verification
Initial hydrologic simulations were carried out using both the Novatech 2006 SWMHYMO model and the updated model prepared for the Phase 2 SWM Study as described in the previous report sections. Simulated and observed hydrographs were compared at the stream gauge location downstream of March Valley Road (CK5-01) for calibration Events 2011-1 and 2011-3 (refer to Figures C-1-18 and C-1-19- Novatech 2006 and Initial Model Setup). A comparison with the observed hydrographs indicated a reasonable match for both hydrograph shape and timing. However, peak flows and runoff volumes were significantly higher than observed values.
4.2.5.1 Shirley’s Brook SWMHYMO Model Adjustments
In order to reduce the simulated peak flows and runoff volumes, the following adjustments were made to the SWMHYMO model:
Initial abstraction (Ia) for all rural catchment areas was increased to an average value of 9 mm based on an assessment of the rainfall-runoff response using recorded observations (refer to Table C-1-11). It should be noted that the Ia value also compared well with the calibrated Ia value established in the Shirley’s Brook & Watt’s Creek Subwatershed Study (Dillon, 1999);
In light of the dry soil moisture conditions preceding the calibration events i.e., 3-day and 5-day Antecedent Moisture Conditions (AMC) the revised SCS CN values were further reduced from
Shirley’s Brook & Watt’s Creek Phase 2Stormwater Management Study
303ra_2015-04-27_SBWC Phase 2 SWM Study_Final_60164823 - GAF Rev
AMC II conditions (normal soil moisture) to AMC I (dry conditions) for each catchment within the Shirley’s Brook SWMHYMO model. CN (AMC I) values are included on Table C-1-6 for comparison purposes;
Initial abstraction (Ia) for all urban areas was increased from 0.8 mm (impervious) and 1.5 mm (pervious) to 1.57 mm and 4.67 mm to match the values provided in the City’s SDG;
The impervious roughness coefficient (MNI) was adjusted for all urban catchment areas from 0.013 to 0.025; in order to further flatten the and,
All rural catchment internal reservoirs (n) were reduced from n=3 to a minimum of n=1.1 in order to reflect a flatter hydrograph shape. This parameter adjustment was also found to be consistent with the calibrated n values determined in the QUALHYMO modelling carried out as part of the SBWCSWS (Dillon, 1999).
All catchment area adjustments are summarized in Table C-1-6.
4.2.5.2 Shirley’s Brook Calibrated SWMHYMO Results
The SWMHYMO model was re-run with the above model adjustments (refer to Figures C-1-18 and C-1-19 – Calibrated Point Rainfall) and compared to observed hydrographs. A review of the results presented in Table C-1-11 confirmed that peak flows and runoff volumes were significantly reduced over uncalibrated conditions but still remain above observed values (+100 % to +170% and +85% to +140% respectively). However, hydrograph timing and shape compared well with observed data (-2.5 to -3.0 hrs).
Simulated hydrographs were also produced for verification Events 2011-2 and 2012-1 (refer to Figures C-1-20 and C-1-21) which compare well with observed runoff hydrograph timing and shape. However, peak flows and runoff volumes could not be compared given missing data and observed flow depths which exceeded the maximum point on the stream gauge rating curve (i.e., 1.3 m3/s) and could not be extrapolated with a competent level of accuracy.
In light of the limitations associated with the 2011 and 2012 storm event and streamflow data, any further revisions to the calibration parameters would be considered outside the range of reasonable adjustment and would require additional monitoring data to further confirm the Shirley’s Brook SWMHYMO model calibration and / or support any further changes.
4.2.6 Comparison of Calibrated Peak Flows vs. High Water Level Monitoring Data
An additional comparison was made between calibrated SWMHYMO peak flows with the flow estimates calculated at the crest gauges located along key points on Shirley’s Brook and Watt’s Creek / Kizell Drain. A review of the selected storm event dates in 2012 confirmed that only SWMHYMO Storm Event 2012-2 (September 7 to 8, 2012) coincided with available crest gauge monitoring data. Accordingly, calibrated SWMHYMO peak flows along with flow estimates calculated using recorded high water measurements at the six crest gauge locations were summarized in Table C-1-12. A review of the information indicates a

Shirley’s Brook & Watt’s Creek Phase 2Stormwater Management Study
313ra_2015-04-27_SBWC Phase 2 SWM Study_Final_60164823 - GAF Rev
reasonable comparison at Locations SB-3 and WC-1. However, calibrated SWMHYMO peak flows were found to be significantly higher at Locations SB-2, KD-1 and KD-2 and lower at Location SB-1.
4.2.7 SWMHYMO Model Verification using Distributed Rainfall (Radar) Information
In addition to the above noted hydrologic model calibration and verification process, an additional assessment was carried out to verify model calibration results using distributed rainfall depths determined from radar information available for the Phase 2 Study Area.
Accordingly, total depth radar data (1 km x 1 km grid values) was obtained from the City of Ottawa for the selected calibration and verification events summarized in Table 1. Total rainfall depth surfaces were created for each storm event using an inverse-distance weighted (IDW) method. Figures C-1-22 to C-1-26 were prepared to illustrate the rainfall depth gradations (mm) associated with each storm event over the SWMHYMO model areas. The figures also include the location of the point rainfall gauging stations (March Road P.S. and St. Gabriel Public School) for comparison purposes. Table 3 below includes a comparison of the point rainfall and radar rainfall depth for the corresponding grid over the two rain gauge locations. A weighted average rainfall depth was calculated for each SWMHYMO modelling area using an inverse-distance method and is also summarized in Table 3.
Table 3. Comparison of Point Rainfall vs. Distributed Rainfall using Radar Data
Location Calibration / Verification
Storm Event Rainfall Depth (mm) 2011-1 2011-2 2011-3 2012-1 2012-2
March Road P.S.(point rainfall) 33 63 44 31 69March Road P.S.(radar depth) 31 123 34 21 57St. Gabriel Public School (point rainfall) - - - 35 85St. Gabriel Public School (radar depth) 30 114 26 23 56Upper Kizell SWMHYMO model area 30 125 28 23 55Watt’s Creek SWMHYMO model area 31 113 35 22 58Shirley’s Brook SWMHYMO model area 29 67 29 24 73
A comparison between the point rainfall data and area weighted method highlighted in Table 3 reveals lower radar rainfall event depths calculated over the SWMHYMO modelling areas for four of the five storm events.
In order to assess the impacts of the radar event depths to hydrologic modelling results, a rainfall adjustment factor was applied to each the five selected storm event hyetographs, based on the ratio of the average weighted rainfall distributed over the modelling area to the point rainfall depth recorded at the March Road P.S. rain gauge. It should be noted that no additional revisions were made to the calibrated

Shirley’s Brook & Watt’s Creek Phase 2Stormwater Management Study
323ra_2015-04-27_SBWC Phase 2 SWM Study_Final_60164823 - GAF Rev
SWMHYMO models. The SWMHYMO models were executed and output (e.g., peak flows, timing and runoff volumes) summarized in Table C-1-11 for comparison purposes. Runoff hydrographs at each calibration location were also added to Figures C-1-11 to C-1-21.
A review of the SWMHYMO model output using radar event depths (refer to Table C-1-11) revealed a reduction in peak flows and runoff volumes for Storm Events 2011-1, 2011-3, 2012-1 and 2012-2 of approximately 10% to 50% from results using point rainfall data. Runoff hydrograph plots (Figures C-1-12 to C-1-21) also showed a slight to moderately better comparison to observed surface runoff at all calibration locations.
Storm Event 2011-2 produced an increase in peak flow and runoff volume within the Upper Kizell Drain (refer to Table C-1-11 and Figure C-1-10) and can directly be attributed to the higher radar based rainfall depth (adjustment factor > 1.0) determined within the Upper Kizell Drain modelling area as shown on Figure C-1-23. A review of the corresponding runoff hydrograph plot shown on Figure C-1-11 also reflects this increase compared to observed surface runoff recorded at the Beaver Pond outlet.
The additional verification assessment using distributed rainfall depths determined from radar data confirmed that further revisions to the calibration parameters would be considered outside the range of reasonable adjustment and would require additional monitoring data to further confirm the Upper Kizell Drain, Watt’s Creek and Shirley’s Brook SWMHYMO model calibration and/or support any further changes.
4.3 Additional Hydrologic Analyses (2013-2014)
Given the limitations associated with the initial SWMHYMO model calibration and verification assessment as described in the previous sections, a number of additional hydrologic modelling activities and analyses were completed through 2013 and 2014 in order to confirm the applicability of the hydrologic models prepared for Upper Kizell Drain and Watt’s Creek subwatersheds. The following sections provide a summary of completed work with further details provided in Appendix C-2 through Appendix C-5 respectively.
4.3.1 2013 Hydrologic Model Calibration and Verification Exercise
The following summary provides a description of the analyses carried out in as part of the additional 2013 calibration and verification exercise completed for the Upper Kizell (Beaver Pond) and Watt’s Creek (Kizell Drain) hydrologic models previously prepared as part of the SBWC Phase 2 SWM Study. All supporting tables and figures are included in Appendix C-2.
4.3.1.1 City & AECOM Rain Gauges (Point Rainfall)
2013 rainfall information recorded at City of Ottawa and AECOM gauge locations within the Study Area was screened in order to select applicable calibration and verification storm events as shown in Table C-

Shirley’s Brook & Watt’s Creek Phase 2Stormwater Management Study
333ra_2015-04-27_SBWC Phase 2 SWM Study_Final_60164823 - GAF Rev
2-1. 3-day and 5-day rainfall totals were assessed prior to each storm event in order to determine applicable Antecedent Moisture Conditions (AMC). AMC I is considered dry soil moisture conditions and AMCII is considered normal soil moisture conditions and was assigned as follows:
AMC I Events (Dry Soil Moisture Conditions): 2013-03 2013-07 2013-10 2013-17
AMC II Events (Normal Soil Moisture Conditions): 2013-08 2013-16
The above information was utilized to adjust the starting conditions within the SWMHYMO hydrologic models (CN) for each of the selected storm events
4.3.1.2 Radar Based Storm Event Data
Total rainfall depth values derived from 1 km x 1 km radar grid data was provided by the City of Ottawa for the selected 2013 calibration and verification events. Table C-2-2 provides a comparison between uncalibrated radar grid depth at each rain gauge location for selected storms:
Events 2013-03, 2013-07 and 2013-08 (March Road PS and St. Gabriel School/Beaver Pond) Event 2013-10 (additional AECOM rain gauge at Fire Hall – North Shirley’s Brook
subwatershed) Events 2013-16 & 2013-17 (additional AECOM rain gauge at Glen Cairn Reservoir – south
Watt’s Creek subwatershed)
Uncalibrated radar grid depths were found to be generally lower than rainfall recorded at each rain gauge. The uncalibrated radar grid depths were then processed through GIS to produce total depth surfaces using an inverse distance weighting technique. Overall storm event depths were then calculated for the Upper Kizell (Beaver Pond) and Watt’s Creek (Kizell Drain) subwatershed areas for each storm event using the total depth surfaces noted above (refer to Figures C-2-1 to C-2-6).
Event based calibration factors were determined in GIS using recorded rainfall at each gauge location for individual events. Use of calibrated radar was limited to Events 2013 10, 2013-16 & 2013-17 as there was insufficient point rainfall coverage (i.e., additional AECOM gauges) required to complete the GIS analysis for earlier events. Table C-2-3 shows a good correlation between the calibrated radar values for the Upper Kizell subwatershed and point rainfall (St. Gabriel School). Calibrated radar values for Watt’s Creek varies compared to point rainfall at March Road PS and St. Gabriel School (Beaver Pond) but is consistent with the relative differences observed on the uncalibrated radar based rainfall depth maps (refer to Figures C-2-4, C-2-5 and C-2-6). Rainfall depths recorded at St. Gabriel School (refer to yellow highlight on Table C-2-3) were selected to simulate calibration and verification events for the Upper Kizell (Beaver Pond) SWMHYMO model given the gauge’s location within the contributing area and negligible

Shirley’s Brook & Watt’s Creek Phase 2Stormwater Management Study
343ra_2015-04-27_SBWC Phase 2 SWM Study_Final_60164823 - GAF Rev
difference between calibrated radar data. Rainfall depths recorded at March Road P.S. (refer to green highlight on Table C-2-3) were selected to simulate Events 2013-03, 07 & 08 for the Watt’s Creek SWMHYMO model given the lack of sufficient rain gauge coverage in order to determine appropriate radar calibration factors for these events. Calibrated radar based depths (refer to green highlight on Table C-2-3) were selected to simulate Events 2013-10, 16 & 17 for the Watt’s Creek SWMHYMO model given the additional rain gauge locations (AECOM) which were used to determine event based radar calibration factors.
4.3.1.3 Assessment of Temporal Patterns
Cumulative rainfall depths recorded at each gauge were plotted for the selected storm events in order to confirm any potential temporal differences that could potentially affect hydrograph timing and subsequent peak flows. A review of Figures C-2-7 to C-2-12 showed no significant differences between rain gauges for all events. Given the above, the March Road P.S. rain gauge was selected to distribute the calibrated radar based rainfall depths for Events 2013-10, 16 and 17 for the Watt’s Creek subwatershed.
4.3.1.4 Comparison of Storm Event Rainfall and Direct Runoff
Recorded runoff and rainfall volumes were determined for each of the selected storm events. Observed runoff/rainfall ratios were compared to calculated weighted runoff coefficients(C) determined for the Upper Kizell (Beaver Pond) and Watt’s Creek (Kizell Drain) subwatershed areas using measured data obtained from the Phase 2 Study in order assess initial model results which are described further below.
Upper Kizell (Beaver Pond) Subwatershed
Runoff volumes recorded at the Beaver Pond outlet were compared to rainfall volumes for the selected storms. Due to the extended drawdown time associated with the Beaver Pond outlet (i.e., 600 mm dia. orifice) storm runoff may not completely drain from the pond prior to the next storm event. As a result, water levels become successively higher and individual event runoff becomes combined. In order to extract the runoff volume for individual storm events, the following methodology was utilized:
A minimum daily average baseflow was calculated for the 2013 monitoring period using a moving average technique (0.007 m3/s) and subtracted from the total flow recorded at the outlet of the Beaver Pond
Where required, the recession limb for each individual event was determined using a fitted recession equation derived from measured storm event data and subtracted from the total runoff in order to obtain individual event runoff volume
Plots of each storm event are included on Figures C-2-13 to C-2-16. Calculated rainfall/runoff ratios are summarized in Table C-2-4 and also plotted on Figure C-2-17 with values ranging between 0.22 and 0.46. Table C-2-5 provides a comparison between the average observed runoff coefficient (0.34) and the calculated
Shirley’s Brook & Watt’s Creek Phase 2Stormwater Management Study
353ra_2015-04-27_SBWC Phase 2 SWM Study_Final_60164823 - GAF Rev
runoff coefficient (0.36). Results confirm that observed runoff matches well with the calculated runoff coefficient based on initial input parameters contained within the Upper Kizell (Beaver Pond) hydrologic model.
Watt’s Creek Subwatershed
Runoff volumes recorded at the Watt’s Creek stream gauge (CK6-002) were compared to rainfall volumes for the selected storms. Calculated rainfall/runoff ratios are summarized in Table C-2-4 and also plotted on Figure C-2-18 with values ranging between 0.15 and 0.48. Table C-2-5 provides a comparison between the average observed runoff coefficient (0.28) and the calculated runoff coefficient (C = 0.33). Results confirm that observed runoff is marginally lower than the calculated runoff coefficient based on initial model input parameters contained within the Watt’s Creek hydrologic model with the exception of Event 2013-08 (0.48). A higher observed runoff coefficient noted for Event 2013-08 may be attributed to a difference between the point rainfall used for simulation purposes (March Road P.S.) compared to the actual weighted rainfall depth over the Watt’s Creek subwatershed but cannot be confirmed without additional point rainfall information required to calibrate the radar information.
4.3.1.5 Calibration & Verification Results
Upper Kizell (Beaver Pond) Subwatershed
The Phase 2 SWMHYMO model prepared for the Upper Kizell subwatershed area (outletting to Kizell Wetland and Beaver Pond) was used as the base case scenario for the additional 2013 calibration exercise. CN values were adjusted for each storm event (AMC I or II) based on 5 day antecedent moisture conditions (AMC) as noted previously. Output hydrographs were input to the Phase 2 XPSWMM model (hydraulic mode) prepared for the Kizell Wetland and Beaver Pond. Initial water level for the Beaver Pond was set in XPSWMM for each storm event based on the water level data recorded at the Beaver Pond outlet
SWMHYMO Model Results (No Adjustments)
The Phase 2 SWMHYMO model (unadjusted) was run for all selected 2013 storm events. Table C-2-6 and Figures C-2-19 to C-2-24 provide initial results for all model runs at the Beaver Pond outlet which revealed the following:
Runoff Volume:
Simulated runoff volumes range from maximum of 29% above observed values (Event 2013-10) to 26% below observed values (Event 2013-16) for all selected storm events (calibration & verification). The average difference in simulated volume (calibration & verification) is approximately 6% below the average observed runoff volume (skewed slightly negative). Runoff volumes associated with the calibration events 2013-08, 16 & 17 are skewed below observed runoff volumes ranging from -4% to -29%. Runoff volumes associated with verification events 2013-03, 07 and 10 are skewed an equal amount above observed runoff volumes ranging from -10% to +29%. Additional model refinements to increase runoff volume in order to obtain a better fit for calibration events will result in an increased difference between simulated verification events compared to observed data.

Shirley’s Brook & Watt’s Creek Phase 2Stormwater Management Study
363ra_2015-04-27_SBWC Phase 2 SWM Study_Final_60164823 - GAF Rev
.......................................... ...............................
.................. ................
................. ...............
Peak Flows & Hydrograph Shape/Timing:
As shown in Table C-2-6 and on Figures C-2-19 to C-2-24, simulated peak flows were found to be consistently higher than observed peak flows at the outlet of Beaver Pond. Simulated peak flows were found to be approximately 2 x higher than observed and ranged from 0.40 to 0.55 m3/s compared to observed peak flows which ranged between 0.13 and 0.18 m3/s for all selected 2013 events. Simulated outflow hydrographs from the Beaver Pond were found to peak approximately 7 to 14 hours earlier than observed conditions. Simulated hydrographs maintain a more pronounced rising limb and faster recession limb than observed conditions.
Peak Flow & Hydrograph Timing/Shape Assessment
The following SWMHYMO input parameters were adjusted in order to assess potential reductions to peak flows and changes to hydrograph timing/shape:
Rural Catchments:
Time to Peak (Tp) increased x 2 Number of “n” Reservoirs currently set at minimum (no changes)
Urban Catchments:
Pervious catchment length (LGP) no changes (40 m for pervious) Impervious catchment length (LGI) increased x 2 Pervious catchment slope (SLPP) decreased from 2% to 0.2% Roughness coefficients (MNP/MNI) increased x 2
A summary of the model output for each of the above adjustments is included in Table C-2-7. A review of the results confirms little to no notable reduction to simulated peak flows or notable changes to hydrograph timing for the selected calibration events.
Additional Analyses
Given that the above adjustments to the SWMHYMO model do not notably improve simulated peak flows and hydrograph timing/shape compared to observed conditions at the outlet of the Beaver Pond, additional analyses were carried out as described in the following sub-sections.
Beaver Pond Storage Volume
An additional analysis was completed to test the sensitivity to changes in available storage volume within the Beaver Pond. Detailed LiDAR based contour mapping was used along with outlet survey data to assess the potential for additional storage within vegetated wetland area. For Kizell Wetland, no additional storage volume was added as detailed contour information indicated little additional volume available immediately above the outlet elevation located at Goulbourn Forced Road. For

Shirley’s Brook & Watt’s Creek Phase 2Stormwater Management Study
373ra_2015-04-27_SBWC Phase 2 SWM Study_Final_60164823 - GAF Rev
Beaver Pond, an additional 0.3 m of additional storage, or approx. 6,300 m3 of storage was added to the stage – surface area input data in XPSWMM above elevation 90.5 m (approx. permanent water level) to 90.8 m as shown on Figure C-2-25. Calibration Events 2013-08, 16 & 17 were re-run and output is summarized in Table C-2-7. Hydrographs plots assuming the additional storage are also included on Figures C-2-21, C-2-23 & 24 (green line). Results of the analysis reveal a slight reduction in peak flows and a change in hydrograph shape and recession towards observed values.
In addition to the 2013 calibration events, the 2 to 100-year design storm events (SCS Type II 24 hr) were also simulated with the additional storage volume noted above in order to assess potential reductions to peak flows and associated maximum water levels within Beaver Pond during flood events. Results, included in Table C-2-8, indicate a slight reduction in peak outflows and corresponding maximum water level within the Beaver Pond, however, the reduction diminishes to a negligible amount for the 100-year event (i.e., water level reduction of only 0.08 m). Further, a significant amount of additional storage beyond the 6,300 m3 as noted above would be required to match recorded values.
Sub-Surface Attenuation within Foundation Backfill
Background information relating to sub-surface conditions within the Upper Kizell (Beaver Pond) subwatershed area was provided by the City as part of the additional calibration exercise and included the following:
Ontario Geological Survey information MOE well records Background studies and reports Depth to bedrock data along street centrelines
A review of the information revealed a significant variation in the depth to bedrock across the Study Area with depths ranging from 0 m (exposed outcrops) to greater than 20 m. The construction methodology in areas with bedrock at surface or at shallow depth will often require excavation or “blasting” into the bedrock in order to construct sub-surface foundations. Excavated rock material is stockpiled and used as backfill around structures which creates potential sub-surface storage areas within the permeable backfill. As part of foundation construction, the City’s municipal design criteria require the installation of foundation drainage systems in order to control groundwater water levels and accumulated infiltration around foundations.
The foundation drains within the Upper Kizell (Beaver pond) subwatershed area are connected to the local storm sewer system which outlets to the Kizell Wetland and Beaver Pond. A review of the rainfall -runoff volume comparison completed for the Upper Kizell (Beaver Pond) subwatershed area using the 2013 calibration and verification events (refer to Figure C-2-17) indicates that observed runoff volumes recorded at the outlet of the Beaver Pond are comparable to the calculated runoff coefficient (“C”) for the contributing area which supports the above assumption that a significant portion of infiltrated runoff is returned to the surface water drainage system through foundation drain connections to the local storm sewer. Further to the above, sub-surface storage areas created by
Shirley’s Brook & Watt’s Creek Phase 2Stormwater Management Study
383ra_2015-04-27_SBWC Phase 2 SWM Study_Final_60164823 - GAF Rev
porous rock backfill may provide some temporary attenuation of infiltrated runoff which could extend the duration of discharge into the Kizell Wetland and Beaver Pond resulting in a “flatter” hydrograph response identified in the observed runoff hydrographs at the Beaver Pond outlet. Notwithstanding the above, potential attenuation effects would diminish under less frequent storm events (i.e., 100-year storm) as rainfall depths and intensities would be significantly higher than the 2013 calibration and verification events. This is further supported by the increasing trend identified between observed runoff coefficient and rainfall depth (refer to Table C-2-4 and Figure C-2-17)
Findings – Upper Kizell (Beaver Pond) Subwatershed
Results of the additional hydrologic modelling and sensitivity analyses completed using the selected 2013 storm events (calibration & verification) re-confirms that the Phase 2 SWMHYMO model for the Upper Kizell (Beaver Pond) subwatershed area continues to maintain a reasonable calibration between simulated and observed surface runoff hydrographs and therefore no further parameter adjustments are recommended. Further, the additional sensitivity analysis confirms that model parameters adjustments required in order to achieve a closer match to observed peak flows and hydrograph timing/shape would be considered outside the reasonable range of adjustment.
Watt’s Creek (Kizell Drain) Subwatershed
The Phase 2 SWMHYMO model for the Watt’s Creek (Kizell Drain) subwatershed area was used as the base case scenario for the additional calibration runs. CN values were adjusted for each storm event (AMC I or II) based on 5 day antecedent moisture conditions (AMC) as noted previously and corresponding output hydrographs from the Upper Kizell (Beaver Pond) subwatershed were input to model.
SWMHYMO Model Results (No Adjustments)
The Phase 2 SWMHYMO model (unadjusted) was run for all selected 2013 storm events. Table C-2-9 and Figures C-2-26 to C-2-37 provide initial results for all model runs at the Watt’s Creek streamflow gauge CK6-002 which revealed the following:
Runoff Volume
Simulated runoff volumes range from maximum of 42% above observed values (Event 2013-03) to 31% below observed values (Event 2013-08) for all selected storm events (calibration & verification). The average difference in simulated volume for all selected 2013 events (calibration & verification) is approximately 3% above the average observed runoff volume (skewed slightly positive). Simulated runoff volumes associated with the calibration Events 2013-08, 16 & 17 are -31%, -20% and 6% compared to observed runoff volumes respectively. Simulated runoff volumes associated with verification Events 2013-03, 07 and 10 are 42%, 20% and -2% compared to observed runoff volumes respectively. Simulated runoff volumes determined using calibrated radar based rainfall (Events 2013-10, 16 & 17) match reasonably well to observed values, ranging from -20% to 5% while simulated runoff volumes determined using point rainfall from March Road P.S. (Events 2013-03, 07 and 08) vary from
Shirley’s Brook & Watt’s Creek Phase 2Stormwater Management Study
393ra_2015-04-27_SBWC Phase 2 SWM Study_Final_60164823 - GAF Rev
42% to -31% compared to observed values. The initial model results for all selected 2013 events are equally weighted above and below observed values and therefore no additional adjustments to the Phase 2 SWMHYMO model are recommended to refine simulated runoff volumes.
Peak Flows & Hydrograph Shape/Timing
As shown in Table C-2-9 and on Figures C-2-26, C-2-27, C-2-28, C-2-31, C-2-34 & C-2-37 simulated peak flows at CK6-002 were found to be in good agreement within observed values for all selected 2013 storm events (calibration and verification) with a range between -24% to 17% with the exception of Event 2013-16. As noted on Figures C-2-29, C-2-30, C-2-32, C-2-33, C-2-35 & C-2-36, simulated hydrographs plots at secondary gauge locations, including Kizell Drain at Herzberg Road (KD-1) and Watt’s Creek within the NCC lands (WC-1) compare reasonably well with observed values for the same events which further supports a close agreement at downstream Gauge CK6-002. Simulated peak flows for Event 2013-16 are notably lower than the observed peak flow (-50%) and may be attributed to the low rain gauge reading at March Road P.S. which influences the calibration of the radar data for this event. The timing of simulated outflow hydrographs at CK6-002 were found to closely match observed peak timing and ranged between -1.75 hrs to 2.5 hrs from observed for all events. A visual review of the hydrograph timing and shape for the additional gauge locations (KD-1 and WC-1) also exhibit a close match to observed conditions.
Findings – Watt’s Creek Subwatershed
Results of the additional hydrologic modelling and sensitivity analyses completed using the selected 2013 storm events (calibration & verification) re-confirms that the Phase 2 SWMHYMO model for the Watt’s Creek subwatershed area continues to maintain a reasonable calibration between simulated and observed surface runoff hydrographs and therefore no further parameter adjustments are recommended
4.3.2 Beaver Pond Theoretical Storage Assessment
In response to the request from staff at Mississippi Valley Conservation Authority (MVCA), AECOM completed a theoretical storage assessment for the Beaver Pond to confirm the additional volume that, over and above what currently exists, would be required to match simulated outflow hydrographs with 2013 observed data. The following provides a summary of the methodology and results with detailed figures included in Appendix C-3.
4.3.2.1 Revisions Beaver Pond Storage Volume
Additional storage that resulted from extending the base of the Beaver Pond (above the permanent pool elevation) west to Goulbourn Forced Road at a minimum slope was added to the actual measured Beaver Pond storage volume (refer to green highlighted area on Figure C-3-1). The base of the Beaver Pond at the west limit (Goulbourn Forced Road) was lowered to a minimum 90.6 m (~ 0.1 m above the permanent pool elevation) to reflect a positive gradient towards the outlet located at Walden Drive. The depth-

Shirley’s Brook & Watt’s Creek Phase 2Stormwater Management Study
403ra_2015-04-27_SBWC Phase 2 SWM Study_Final_60164823 - GAF Rev
surface area-storage volume relationship for the additional storage area was recalculated assuming the additional depth noted above and compared to the existing/unadjusted storage volume as shown on Figure C-3-1 (table). The adjusted stage-storage volume relationship includes approximately 115,106 m3 of additional storage, or 65% increase compared to the existing volume at elevation 92.5 m (approximate elevation of internal overflow weir at 92.55 m). Above elevation 92.5 m, the increase in total active storage volume remains unchanged as noted on Figure C-3-1.
4.3.2.2 Results
2013 Calibration & Verification Events
The adjusted stage – surface area relationship was input to XPSWMM for the Beaver Pond, the 2013 calibration and verification events executed and results compared to existing storage volume simulation results. Figure C-3-2 to C-3-7 indicates (not surprisingly, given the 65% increase in storage) a better fit between simulated and observed hydrographs for the 2013 calibration and verification events. This confirms that significant additional storage volume within the Beaver Pond (or combination within Beaver Pond/Kizell Wetland) would be required to match simulated to observed conditions.
100 Year Design Event
The 100 year return period design event was re-run with the adjusted stage-surface area relationship in order to compare the changes in peak outflow and maximum water level to existing storage conditions within Beaver Pond. A review of Figure C-3-8 indicates significant reduction in peak inflow for both existing and adjusted storage volume conditions. An enlargement (Figure C-3-9) shows that the maximum 100 year water level, with the additional storage volume, is approximately 0.9 m lower than the existing storage condition. The 100 year peak outflow is also reduced from 1.5 m3/s to 0.8 m3/s, however, the existing storage peak outflow also includes an overflow north of the control structure which creates the distinct hydrograph shape.
4.3.2.3 Findings
Although simulation results with the additional storage compare well with observed data recorded at the Beaver Pond outlet, an additional 115,106 m3 or 65% more storage (to elevation 92.5 m) would have to currently exist within the Beaver Pond to achieve these results. The additional storage volume is considered orders of magnitude greater than any error inherent within the LiDAR data used to determine the existing storage volume for both Beaver Pond and Kizell Wetland. Results of the theoretical storage assessment demonstrate that the use of additional storage volume within the Beaver Pond cannot be justified in the additional calibration exercise due to the sheer quantity required to match observed conditions
It is recognized that distributed storage within the contributing catchment area, within possibly more pervious backfill areas created as a product of subsurface excavation within bedrock areas may be contributing to the attenuation of inflows to the on-line ponds. The ability to model the effect of subsurface attenuation is beyond the limitations of the current hydrologic model. Sufficient information (e.g., flow

Shirley’s Brook & Watt’s Creek Phase 2Stormwater Management Study
413ra_2015-04-27_SBWC Phase 2 SWM Study_Final_60164823 - GAF Rev
monitoring of storm sewer outfalls) is not available at this time to attempt to reasonably reflect this process within a suitable hydrologic model. Even if sufficient information were available to sufficiently characterize these processes, this storage is effectively on private property and the City would have no ability to ensure it continues to function in perpetuity. Notwithstanding the above considerations, there is no monitored outflow data that demonstrates the watershed response to more significant and intense events under which this “storage” could have much less of an impact on peak outflows and water levels.
4.3.3 Incorporation of Additional Storage Attenuation within the Upper Kizell Drain Hydrologic Model
At the request of the City, AECOM undertook further updates to the latest hydrologic model (SWMHYMO) for the Upper Kizell Subwatershed in order to incorporate potential additional storage routing distributed within permeable sub-surface backfill within the Study Area contributing to the Kizell Wetland and Beaver Pond. The following provides a summary of the methodology, results and key findings of the analysis. Supporting tables and figures are included in Appendix C-4.
4.3.3.1 Methodology
In order to simulate distributed sub-surface storage within the existing Upper Kizell Subwatershed hydrologic model, two additional ROUTE RESERVOIR commands were added to the SWMHYMO model to:
One to attenuate direct inflow to the Kizell Wetland; and One to attenuate direct inflow to the Beaver Pond
The SWMHYMO model was revised to redirect Inflow hydrographs to the Kizell Wetland and Beaver Pond through the two new storage elements in order to reflect potential additional storage available within permeable backfill areas created through excavation of sub-surface foundations within shallow bedrock in the Study Area. A storage-discharge relationship for each ROUTE RESERVOIR command was developed based on available sub-surface condition information obtained from background data, GIS and mapping input provided by the City of Ottawa as noted below:
Surficial geology mapping and MOE historic water well records within, and immediately adjacent to the Study Area was used to confirm the areal extent of bedrock within 2.5 m (or less) of existing ground
The shallow bedrock area was conservatively delineated (i.e., gaps in coverage were filled), on the attached Study Area map (refer to Figure 1) and totals approximately 278 ha or 67% of the total Study Area (415 ha)
All buildings within the shallow bedrock area were extracted from the City’s latest GIS information layer (impervious cover) and overlain on the area of shallow bedrock within the Study Area

Shirley’s Brook & Watt’s Creek Phase 2Stormwater Management Study
42-04-27_SBWC Phase 2 SWM Study_Final_60164823 - GAF Rev
Residential houses were included in the assessment as they maintain sub-surface foundations (i.e., basements), and include perimeter foundation drains which provide a direct connection to the local storm sewer
Institutional and commercial buildings were screened out of the assessment as there are usually no sub-surface foundations associated with these type of structure (i.e., “slab on grade” construction)
Excavation required to install local storm & sanitary sewers and other sub-surface utilities were also screened out of the assessment given a lack of information regarding the lateral movement of sub-surface flow within the bedding and/or backfill material
For all residential houses within the identified area of shallow bedrock an envelope was applied to represent the potential area of over-excavation required to construct sub-surface foundations (i.e., space between foundation wall and undisturbed bedrock)
A total depth of 2.5 m was assumed as a general depth from existing ground to the invert of the basement (i.e., sub-surface foundations)
The first 0.5 m below grade was assumed to comprise grass, topsoil and underlying sub-soil with a lower void ratio and was precluded from the storage calculations
The remaining 2.0 m (from 0.5 m below grade to 2.5 m below grade) was assumed to comprise of a permeable backfill material (i.e., “blast rock”), with an estimated void ratio of approximately 0.4 (equivalent to clean stone)
The total calculated storage volume within permeable backfill areas within the Study Area was then calculated based on the following equation:
Total Storage = A x D x P
Where: Total Storage = The total available sub-surface storage within the identified shallow bedrock area (m3)
A = Total area (assuming a 1 m envelope) around all applicable structures within the identified shallow bedrock area (m2)
D = 2 m - Maximum available depth of sub-surface storage P = Void space within permeable backfill material = 0.4 (no units)
The total available sub-surface storage volume within the Study Area was calculated at 72,190 m3 or 7.219 ha.m which was further proportioned for each ROUTE RESERVOIR command (i.e., Kizell Wetland and Beaver Pond), based on the contributing drainage areas identified on Figure C-4-1 as follows:
Beaver Pond = 53,604 m3 (74%) Kizell Wetland = 18,586 m3 (26%)
3ra_2015
Shirley’s Brook & Watt’s Creek Phase 2Stormwater Management Study
433ra_2015-04-27_SBWC Phase 2 SWM Study_Final_60164823 - GAF Rev
Preparation of ROUTE RESERVOIR Storage-Discharge Input
A three (3) point storage-discharge rating curve was developed for each ROUTE RESERVOIR command at corresponding depths of 0 m, 1.0 m and 2.0 m (max.). Corresponding discharge (Q) was determined using the Orifice Equation (Q orifice = c x A x [2 x g x H]^0.5) for a series of openings and the appropriate size was selected to obtain a “best fit” (i.e., peak flow, timing and hydrograph shape), compared to “observed” Beaver Pond outflow hydrographs as part of the 2013 calibration and verification assessment. Overflows occurring for less frequent events were added internally by the model and combined with the routed outflows from the ROUTE RESERVOIR commands in order to preserve total runoff volume to the Kizell Wetland and Beaver Pond respectively. The combined “routed” inflow hydrographs were then input into the XPSWMM model which was re-run and compared to observed data for the 2013 calibration and verification events.
4.3.3.2 Results
2013 Calibration & Verification Events
Figures C-4-2 to C-4-7 provide a comparison between observed vs. simulated Beaver Pond outflows for the 2013 calibration & verification events. As noted, results using a 300 mm diameter orifice produce the “best fit” with respect to overall peak flow, hydrograph shaping and timing compared to observed conditions. Simulation results (300 mm diam.) compare reasonably well to observed Beaver Pond outflow data for peak flow, runoff volume and hydrograph timing as shown on attached Tables C-4-1, C-4-2 and C-4-3. Table C-4-4 also shows the maximum total storage used (both ROUTE RESERVOIR commands) for each of the 2013 calibration and verification events.
100 Year Design Event
The 100 year design event was re-run in SWMHYMO with the additional routing elements in order to compare the changes in peak flow inflow/outflow and maximum water level within the Beaver Pond. A review of Figure C-4-8 shows a reduction in maximum inflow from 13.8 m3/s to 11.2 m3/s and resultant outflow from 1.5 m3/s to 0.9 m3/s. A review of Figure C-4-9 (100 Year enlarged) shows a maximum 100 year water level of 92.3 m with the additional storage routing, which is approximately 0.4 m lower than previous modelling (Phase 2 draft report – March 2013).
Additional Sensitivity Analysis
Further to the above, an additional sensitivity analysis was carried out to assess the potential range in maximum water level and peak outflow within the Beaver Pond during a 100-year storm event, assuming a 20% decrease/increase in total available storage (i.e., between 57,752 m3 and 86,628 m3 respectively), within the two additional ROUTE RESERVOIR commands. Results indicate relatively minor changes in peak outflow and maximum water level within the Beaver Pond as follows:
0.2 m range in 100-year water level between 92.2 m and 92.4 m 0.06 m3/s range in peak outflow between 0.89 m3/s and 0.93 m3/s

Shirley’s Brook & Watt’s Creek Phase 2Stormwater Management Study
44-04-27_SBWC Phase 2 SWM Study_Final_60164823 - GAF Rev
4.3.3.3 Findings
Although simulation results incorporating the additional “distributed sub-surface system storage” compare reasonably well to observed data recorded at the Beaver Pond outlet, a minimum additional storage of approximately 72,190 m3 (17 mm equivalent depth over the entire Study Area) would have to exist within the Study Area’s permeable sub-surface backfill and be available to attenuate storm runoff in order to achieve these results.
As stated in Section 4.3.2.3, it is recognized that distributed storage within the contributing catchment area, within pervious backfill areas created as a product of subsurface excavation within bedrock areas may be contributing to the attenuation of inflows to the on-line ponds. However, the ability to accurately model the effect of subsurface attenuation is considered beyond the limitations of the current hydrologic model. Sufficient information (e.g., flow monitoring of Beaver Pond outlet and storm sewer inlets) is not available to confirm this process and also to verify the effects under more significant and intense storm events. Further, if sufficient information were available to sufficiently characterize these processes, this storage is effectively on private property and the City would have no ability to ensure it continues to function in perpetuity.
Notwithstanding the above, the City directed AECOM to maintain the ROUTE RESERVOIR commands in the final calibrated SWMHMYO model in order to reflect some additional storage routing distributed within permeable sub-surface backfill within the Study Area contributing to the Kizell Wetland and Beaver Pond. However, the available storage volume was limited to the maximum observed storm event recorded to-date within the Study Area in light of the above noted concerns. Further details are provided in subsequent Section 4.3.4.3.
4.3.4 Upper Kizell Drain Hydrologic Model Verification Assessment for the June 24, 2014 Storm Event
The following sections provide a summary description of the additional analyses carried out as part of the Upper Kizell (Beaver Pond) hydrologic model verification assessment for the storm event which occurred over the Study Area on June 24, 2014 as requested by the City of Ottawa.
4.3.4.1 June 24, 2014 Storm Event Details
City Rain Gauges (Point Rainfall)
Total depth, duration and 3 and 5 day antecedent rainfall information for the June 24, 2014 storm event was collected from the March Road P.S. and St. Gabriel School (Beaver Pond) gauge locations and is summarized as follows:
Total duration just under 19 hours Total rainfall depth approximately 65 mm

Shirley’s Brook & Watt’s Creek Phase 2Stormwater Management Study
453ra_2015-04-27_SBWC Phase 2 SWM Study_Final_60164823 - GAF Rev
No antecedent rainfall (3 day or 5 days prior) Storm event depth is the highest utilized in current calibration/verification assessment for
Upper Kizell subwatershed (2013 – 2014)
Additional storm event details are also included in Table C-5-1. A comparison of the June 24th event to the City’s latest IDF information confirmed the following:
Max. 10 minute intensity / depth less than the 2-year design storm Max. 1 hr intensity / depth between a 2 and 5-year design storm Max. 6 hr intensity / depth between a 2 and 5- year design storm Max. 12 hr intensity / depth between a 5 and 10-year design storm
Additional details are included in Table C-5-2 and on Figure C-5-1 in Appendix C-5.
Radar Based Rainfall Assessment (Spatial Variability)
Total rainfall depth values derived from 1 km x 1 km radar grid data was provided by the City of Ottawa for the June 24, 2014 storm event and a surface was created as shown on Figure C-5-2. Table C-5-3 provides a comparison of point rainfall and radar based rainfall depths as well as average depth comparison over Upper Kizell subwatershed area. A review of these data confirm a good comparison between radar depth and point rainfall over the Upper Kizell Drain subwatershed, therefore the point rainfall information recorded at the St. Gabriel School (Beaver Pond) gauge was utilized for the model verification assessment.
4.3.4.2 Hydrologic & Hydraulic Model Refinements
SWMHYMO
The June 24, 2014 rainfall input hyetograph was prepared using point rainfall from the St. Gabriel School (Beaver Pond) gauge location as noted above. SWMHYMO model input parameters were adjusted as noted above to reflect antecedent conditions (i.e., AMC I for the June 24, 2014 storm event).
XPSWMM
Initial water levels in the Beaver Pond and Kizell Cell were adjusted using the City’s depth gauge to reflect actual conditions prior to the June 24, 2014 storm event
Beaver Pond Observed Outflow Hydrograph
Beaver Pond water level information collected by the City for the June 24, 2014 storm event was converted to total discharge using the previously derived stage –discharge relationship. The June 24, 2014 outflow hydrograph was further processed to derive direct surface runoff using the methodology derived as part of the previous calibration/verification assessment described in Section 4.3.1.4.

Shirley’s Brook & Watt’s Creek Phase 2Stormwater Management Study
463ra_2015-04-27_SBWC Phase 2 SWM Study_Final_60164823 - GAF Rev
DIVERT HYD Sensitivity Assessment
In addition to the above noted SWMHYMO model refinements, a sensitivity assessment was completed to examine the impacts to peak outflows and maximum water levels within the Beaver Pond both with and without the DIVERT HYD command to reflect directly connected impervious areas (not subject to potential sub-surface storage attenuation as noted in Section 4.3.4.3) that would discharge un-attenuated to the Kizell Cell and Beaver Pond. Accordingly, the SWMHYMO model was executed for the June 24, 2014 storm event as well as the 100-year design storm with and without the DIVERT HYD command. A summary of the results is included in Table C-5-4 which confirms that there are no notable differences in either peak outflows or maximum water levels within the Beaver Pond for both the June 24, 2014 storm as well as the 100-year design event. In light of the results, the DIVERT HYD commands were subsequently removed from the SWMHYMO model prior to the model verification assessment documented below.
4.3.4.3 Results
June 24, 2014 Storm Event
Results of the June 24, 2014 storm event verification are summarized in Table C-5-5 in comparison with observed data at the Beaver Pond outlet. Simulated and observed outflow hydrographs for the June 24, 2014 storm event have also been plotted for visual comparison and are included on Figure C-5-3. A review of these data indicates the following:
Simulated peak flow are only slightly higher than observed (i.e., 0.36 m3/s vs. 0.31 m3/s) Simulated runoff volume is within 10% of observed Peak timing (i.e., lag time), is within 1.25 hours of observed Total sub-surface storage volume used (i.e., ROUTE RESERVOIR commands prior to Kizell
Cell and Beaver Pond), was approximately 6.23 ha.m
Initial model results for the June 24, 2014 verification event as presented above confirm a good overall fit between simulated and observed conditions.
100-Year Design Storm
Given the uncertainties surrounding the size and function of potential sub-surface storage attenuation contributing to the Kizell Cell and Beaver Pond, the maximum available storage volume for the ROUTE RESERVOIR commands was limited to the actual maximum storage utilized during the June 24, 2014 storm event (i.e., 6.23 ha.m) and represents the largest observed storm event (depth) recorded during the current calibration / verification exercise. Runoff in excess of the revised sub-surface storage volumes will overflow directly to the Kizell Cell and Beaver Pond un-attenuated. The SWMHYMO model was revised as noted above and executed using the City’s latest 100-year design rainfall. Initial results are summarized in Table C-5-6 and include total peak inflows and Beaver Pond outflows and maximum water levels with and without sub-surface storage (i.e., 6.23 ha.m) for comparison purposes. Plots of 100-year

Shirley’s Brook & Watt’s Creek Phase 2Stormwater Management Study
473ra_2015-04-27_SBWC Phase 2 SWM Study_Final_60164823 - GAF Rev
inflow and outflow hydrographs with and without sub-surface storage are included on Figure C-5-4. An additional enlarged plot illustrating Beaver Pond peak outflows and maximum water level hydrographs is also included on Figure C-5-5. Results of the assessment confirmed the following:
The maximum 100-year peak outflow and water level of 0.91 m3/s and 92.34 m is approximately 0.59 m3/s and 0.36 m lower than the maximum outflow and water level assuming no sub-surface attenuation (1.5 m3/s and 92.70 m) respectively
The resultant maximum water level is 0.16 m below the internal overflow weir elevation of 92.55 m (surveyed)
4.4 Design Storm Sensitivity Assessment & Selection of Peak Flows
Design storm peak flows (i.e., 2-year to 100-year ) were required at key locations within the Shirley’s Brook and Watt’s Creek drainage systems in order to complete the hydraulic assessment for the Phase 2 SWM Study. Accordingly, in order to determine the applicable design peak flow for each flow point location on Shirley’s Brook and Watt’s Creek / Kizell Drain, the final calibrated SWMHYMO models were adjusted to reflect normal soil moisture conditions (CN = AMC II) and executed using the following range of design storm durations and distributions as recommended in the City’s SDG:
6, 12 and 24 hour Chicago IDF curves; 6, 12 and 24 hour SCS Type II distribution; and 12 hour Atmospheric Environment Service (AES) distribution.
In addition to the above, historical storm events identified in the City’s SDG were also included in the assessment:
July 1979; August 1988; and August 1996.
Peak flow locations were identified at key points along the main branch of Watt’s Creek / Kizell Drain and Shirley’s Brook as shown on Figures 2 and 3. Design storm rainfall depths were obtained from the latest IDF information contained in the City’s SDG. The SWMHYMO models were then executed for each of the above distributions and durations noted above. A comparison of peak flows was completed to identify the conservative flow at each flow point for a range of design storms (i.e., 2-100 year). A summary of the selected design event peak flows is included in Tables 4 and 5 and a complete table of all peak flows for each distribution and duration is appended in Tables C-6-1 and C-6-2.

Shirley’s Brook & Watt’s Creek Phase 2Stormwater Management Study
483ra_2015-04-27_SBWC Phase 2 SWM Study_Final_60164823 - GAF Rev
Table 4. Design Storm Peak Flow Estimates for Watt’s Creek / Kizell Drain
Flow Point
Location (refer to Figure 2)
Selected Peak Flow (m3/s) 2
Year5
Year10
Year25
Year50
Year100 Year
KFP1 Kizell Drain @ Outlet of Beaver Pond (XPSWMM) 0.32 0.47 0.61 0.73 0.81 0.91KFP2 Kizell Drain @ CP Rail Line 0.33 0.51 0.66 0.80 0.90 1.02KFP3 Kizell Drain @ March Road/ Station Road 0.64 1.09 1.43 1.92 2.28 2.76KFP4 Kizell Drain @ Herzberg Road 3.09 5.38 6.86 9.02 10.6 12.7KFP5 Kizell Drain @ Carling Ave 2.97 4.80 6.19 8.12 9.70 11.5KFP6 Kizell Drain @ Outlet (Confluence with Watt’s Creek) 5.61 8.56 10.6 13.2 16.0 19.0WFP1 Watt’s Creek @ U/S of Confluence with Kizell Drain 5.55 8.96 11.3 14.9 17.9 18.5WFP2 Watt’s Creek @ U/S of Confluence with Kizell Drain 11.2 17.4 21.2 27.0 32.4 37.5WFP3 Watt’s Creek 11.3 17.7 21.6 27.6 33.1 38.4WFP4 Watt’s Creek @ Carling Ave 11.1 17.5 21.4 27.4 32.7 37.7WFP5 Watt’s Creek @ Outlet 8.06 12.5 15.7 20.4 24.3 28.2
Results of the design storm assessment completed for the Watt’s Creek / Kizell Drain subwatershed as shown in Table 4 and Table C-6-1 confirmed that the 24 hour Chicago IDF curves produced the most conservative peak flows from downstream of the Beaver Pond to the outlet of Watt’s Creek which is characteristic for highly urbanized drainage areas. Peaks flows generated using the 24 hour SCS Type II distribution produced slightly higher peak flows at the Beaver Pond outlet and can be attributed to shape of the storm and its influence on the storage-discharge function within the Kizell Cell and Beaver Pond.
Table 5. Design Storm Peak Flows for Shirley’s Brook Subwatershed
Flow Point
Location (refer to Figure 3)
Selected Peak Flow (m3/s) 2
Year5
Year10
Year 25
Year 50
Year 100 Year
SB1 Goulbourn Forced Road 0.31 1.12 1.91 3.08 4.14 5.38SB2 CN Railway 0.39 1.27 2.11 3.35 4.47 5.76SB3 Hydro Corridor U/S Hines Road 0.37 1.22 2.04 3.30 4.42 5.70SB4 March Road 0.63 1.61 2.51 3.85 5.02 6.38SB5 Terry Fox Drive 1.13 1.88 2.81 4.20 5.43 6.83SB6 D/S Shirley Brook Drive 3.09 4.97 6.28 8.48 9.72 10.9SB7 Klondike Road 4.43 6.06 7.89 10.3 12.5 13.1SB8 U/S Confluence with North Tributary 4.38 6.05 7.85 10.2 12.4 12.5SB9 Marconi Ave 5.90 8.30 10.8 14.1 16.9 18.5
SB10 CN Railway 5.83 8.27 10.7 13.8 16.6 18.2SB11 4th Line Road 5.95 8.57 11.0 14.2 17.1 18.9SB12 D/S 4th Line Road (Stream Gauge Location CK5-001) 5.71 8.38 10.8 14.0 16.7 17.9SB13 Outlet 5.82 8.84 11.4 14.7 17.6 18.6
Shirley’s Brook & Watt’s Creek Phase 2Stormwater Management Study
493ra_2015-04-27_SBWC Phase 2 SWM Study_Final_60164823 - GAF Rev
Results of the design storm assessment for Shirley’s Brook as shown in Table 5 and Table C-6-2 confirm that the 24 hour SCS Type II storm distribution generated the highest peak flow estimates within the rural headwater area, downstream to Flow Point SB5 (Terry Fox Drive). From Flow Point SB5 to the outlet, peak the 24 hour Chicago IDF curves produced slightly higher peak flows as a result of the urban contributions within the mid-and lower reaches of the subwatershed.
4.5 Beaver Pond & Kizell Cell Performance Assessment
In order to assess the impacts of hydrologic model calibration on the performance of the Beaver Pond and Kizell Cell, a summary comparison (refer to Table C-6-3) of peak outflows and maximum water levels was prepared showing the following scenarios:
KNL Serviceability Study (March, 2007); AECOM Phase 1 SWM Study (October, 2011); and AECOM Phase 2 SWM Study (April, 2015).
The following notable observations were identified based on a review of the modelling results between the AECOM Phase 1 SWM Study (Oct, 2011) and the latest Phase 2 results (April, 2015), assuming the City’s updated 100-year design storm rainfall depth (i.e., 106.7 mm):
The maximum 100-year water level in the Kizell Wetland was reduced from 93.53 m to 93.14 m which is below the approximate spill elevation to the Carp River located at the west limit of the Kizell Wetland;
The 100-year peak discharge from the Kizell Wetland to the Beaver Pond was significantly reduced;
The maximum 100-year water level in the Beaver Pond was lowered from 92.85 m to 92.34 m (-0.51 m);
The 100-year discharge from the Beaver Pond control outlet structure was reduced from 1.60 m3/s to 0.91 m3/s as a result of the hydrologic modelling refinements and calibration assessment completed as part of the Phase 2 SWM Study;
The 100-year discharge from the Beaver Pond no longer spills through north overflow; and
The maximum 100-year discharge and water level values are below the target values of 0.96 m3/s and 92.60 m identified in the approved MOE Certificate of Approval for the Beaver Pond.

Shirley’s Brook & Watt’s Creek Phase 2Stormwater Management Study
503ra_2015-04-27_SBWC Phase 2 SWM Study_Final_60164823 - GAF Rev
4.6 Comparison of Updated Design Storm Peak Flows with Previous Studies
Resultant 100-year peak flows summarized in Tables 4 and 5 were also compared to available peak flow information obtained from the following previous studies:
Water Management Plan for Shirley’s Brook, Watt’s Creek, Kizell Drain & Harwood Creek Phase 1: Problem Identification (A.J. Robinson & Associates, December 1989) – OTTHYMO;
Shirley’s Brook & Watt’s Creek Subwatershed Study (SBWCSWS - Dillon Consulting, September 1999) - QUALHYMO;
Shirley’s Brook Floodplain Analysis & Stormwater Management Report - Klondike Road Development Lands (Novatech Engineering, November 2006) - SWMHYMO; and
Tables C-6-4 and Table C-6-5 provide a comparison of 100-year peak flows at various locations within the Watt’s Creek / Kizell Drain and Shirley’s Brook subwatersheds. The large differences noted between the current calibrated design storm peak flows and previous modelling results were attributed to one or more of the following factors:
Updates in design storm criteria including depth, duration, distribution and modelling time step subsequent to the previous studies;
Improved accuracy and level of detail associated with current model input (e.g., drainage areas, impervious cover, connectivity, etc.); and
Changes in current modelling approach and assumptions (e.g., elimination of storage routing behind hydraulic structures, removal of future drainage assumptions regarding diversions and SWM control strategies, etc.).
Shirley’s Brook & Watt’s Creek Phase 2Stormwater Management Study
513ra_2015-04-27_SBWC Phase 2 SWM Study_Final_60164823 - GAF Rev
5. Hydraulic Assessment
The following sections describe the major tasks undertaken as part of the hydraulic assessment completed to identify existing flooding sensitivities within the reaches of Shirley’s Brook and Watt’s Creek / Kizell Drain. The assessment extends along the main branches of both watercourse systems as highlighted on Figures 2 and 3 that could potentially receive additional drainage from future urban development (i.e., KNL Phases 7, 8 and 9).
5.1 Hydraulic Model Set-up (HEC-RAS)
Hydraulic models for Shirley’s Brook and Watt’s Creek were developed using the U.S. Army Corps of Engineers HEC-RAS software program. The following primary sources of data were utilized in the preparation of the hydraulic models and 100-year flood line maps:
LiDAR data and digital orthophotography provided by the City of Ottawa; Hydraulic structure inventory sheets; Available design and as-built drawings for culvert and bridge crossings; Geodetic survey data collected by the City of Ottawa (i.e., invert elevations, top of road etc.); Low flow measurements and field observations; Previous hydraulic studies and original MVCA flood risk mapping; MNR Technical Guide – River and Stream Systems: Flooding Hazard Limit (MNR, 2002); and Design event peak flow output prepared as part of the current Study (refer to Table 4 and 5).
Separate HEC-RAS models were developed for Shirley’s Brook and Watt’s Creek / Kizell Drain using the approach and associated details as described below:
Detailed contour information (0.5 m interval) was generated along the watercourse and floodplain reaches using the latest LiDAR available from the City. Resultant contours were overlain onto digital orthophotography in order to produce suitable base maps required to carry out the hydraulic assessment and delineation of 100-year flood lines;
The HEC-GeoRAS extension in GIS (ArcMAP) was used to digitize cross-section locations on the digital base mapping and base model input information including x,y co-ordinates, reach lengths, location of bank stations, ineffective flow areas, roughness coefficient boundaries, and block obstructions, etc. was extracted and imported into HEC-RAS;
Areas where channel and floodplain modifications were completed subsequent to acquisition of the LiDAR data were identified through a review of background data and field observations (i.e., Shirley’s Brook through the Klondike development, Shirley’s Brook and Kizell Drain downstream of Legget Drive - Kanata Research Park). Updated information was inserted into the HEC-RAS models for these reaches to reflect the recent changes;
Shirley’s Brook & Watt’s Creek Phase 2Stormwater Management Study
523ra_2015-04-27_SBWC Phase 2 SWM Study_Final_60164823 - GAF Rev
A low flow channel was incorporated into the HEC-RAS model using field observations and measurements;
Hydraulic structures were coded into HEC-RAS as either culverts or bridges using background data sources described above. Effective flow areas were reviewed and refined to ensure proper flow conditions upstream and downstream of each crossing;
Standard Manning’s roughness coefficients (“n” values) were developed based on field observations and input into the model to reflect existing channel and floodplain conditions;
Expansion and contraction coefficients were set at 0.1 and 0.3 and 0.3 and 0.5 for natural sections and hydraulic structure locations respectively;
A starting water level of 59.51 m was obtained from MVCA for the Ottawa River and used for all profile runs;
Peak flows generated from the latest calibrated SWMHYMO models, prepared as part of the hydrologic assessment, were input into the HEC-RAS model at key points as noted in Tables 4 and 5
Additional intermediate flow change locations were incorporated into the HEC-RAS models to ensure flow changes did not exceed 20% between any cross-section except at confluences. Values were calculated using a linear interpolation method based on centreline chainages (m). Detailed calculations are appended in Tables D-1 and D-2.
The completed HEC-RAS models for Shirley’s Brook and Watt’s Creek / Kizell Drain were executed for all design storm events (i.e., 2-year to 100-year profiles) and checked for errors and warning messages. Summary output for the Shirley’s Brook and Watt’s Creek / Kizell Drain HEC-RAS models is included in Appendix D.
5.2 Delineation of Updated 100-Year Flood Lines
In order to determine existing flooding sensitivities along the main branches of Watt’s Creek / Kizell Drain and Shirley’s Brook, 100-year HEC-RAS output was exported into GIS (ArcMAP) and plotted on 1:2000 scale digital base mapping. For Watt’s Creek / Kizell Drain, a total of 18 map sheets were prepared covering over 12 km of watercourse length, extending from the outlet at the Ottawa River upstream to the Beaver Pond. An additional 18 map sheets were compiled for the main branch of Shirley’s Brook covering over 10 km of watercourse length, extending from the outlet located downstream of March Valley Road to upstream of Goulbourn Forced Road.
The 100-year flood lines were reviewed and adjusted where required using detailed HEC-RAS model output in conjunction with available background data sources and original MVCA flood risk mapping. Additional information including hydraulic structure locations, spill locations, locations of Flood Vulnerable Structures (FVS) are also identified on the maps which are included in Appendix D.

Shirley’s Brook & Watt’s Creek Phase 2Stormwater Management Study
533ra_2015-04-27_SBWC Phase 2 SWM Study_Final_60164823 - GAF Rev
5.3 Hydraulic Structure Capacity Assessment
A detailed hydraulic assessment was carried out to assess the existing capacity of existing culvert and bridge crossings located along the main branches of Watt’s Creek / Kizell Drain and Shirley’s Brook. Detailed HEC-RAS modelling output was used to compare structure performance to the City of Ottawa’s overtopping criteria detailed in Table 6.4 of the Sewer Design Guidelines (November, 2004) based on road classification. Minimum clearance, freeboard and allowable headwater/depth (HW/D) data was also compared to the criteria contained in the Ministry of Transportation’s (MTO) Highway Design Standards (January, 2008).
A total of 17 crossings were assessed along Watt’s Creek / Kizell Drain as shown on Figure 2 as well as map sheets located in Appendix D. Results, included on Table D-3, confirmed that only the Legget Drive road crossing (647300) fails to meet the City’s overtopping criteria (25-year). Alternatively, only seven crossings were found to be compliant with the MTO design standards:
Carling Avenue (117110); CN Rail (W4); Marsh Sparrow Private (647390); March Road (640830);
Nordion (K4); Station Road (640820); and CN Rail (640830).
A total of 14 crossings were assessed along Shirley’s Brook as shown on Figure 3 as well as map sheets located in Appendix D. Results, included on Table D-4, confirmed that three crossings do not meet the City’s overtopping criteria including:
Goulbourn Forced Road (648680); March Valley Road (648620); and A DND driveway entrance culvert (SB7).
Only four crossings were found to be compliant with the MTO Highway Design Standards and included:
Hines Road (640810); March Road (647310);
Legget Drive (640550); and an abandoned farm crossing (SB6).
5.4 Identification of Flood Vulnerable Structures (FVS)
Updated 100-year flood lines were reviewed in conjunction with the HEC-RAS modelling output to identify structures that are subject to flooding under existing conditions (i.e., Flood Vulnerable Structures – FVS). Each FVS location has been identified on the map sheets contained in Appendix D. The following additional information is also recorded on Table D-5:
Watercourse; Nearest major intersection;
Shirley’s Brook & Watt’s Creek Phase 2Stormwater Management Study
54 3ra_2015-04-27_SBWC Phase 2 SWM Study_Final_60164823 - GAF Rev
Type of land use; Closest HEC-RAS cross-section; 100-year flood level (m); Minimum ground elevation (m) at structure (from LiDAR data); Maximum flood depth (m); Flooding threshold (return period at which flooding will start – yr); and Approximate flood flow at threshold (m3/s)
Results of the assessment for Watt’s Creek / Kizell Drain identified five FVS locations. Three locations (FVS1, FVS2 and FVS3) were identified between Herzberg Road and Legget Drive and include two industrial buildings as well the March Road Pumping Station (refer to Watt’s Creek / Kizell Drain Map Sheet 12 in Appendix D). A review of the original MVCA flood risk mapping indicates that all three locations were located within, or immediately adjacent to the historic 100-year floodplain. Additional FVS details are included in Table D-5.
Two additional locations (FVS4 and FVS5) were identified upstream of March Road on the Nordion property (refer to Watt’s Creek / Kizell Drain Map Sheet 16 in Appendix D). A review of the original MVCA flood risk mapping confirms that these structures (formerly Atomic Energy Canada Limited - AECL) were also located within the historic 100-year flood line. Additional FVS details are included in Table D-5.
Given the flooding sensitivity associated with locations FVS4 and FVS5, an additional flood routing assessment was carried out to confirm whether the existing floodplain storage located upstream of March Road would attenuate storm runoff, resulting in a reduction in the 100-year flood level and frequency of flooding through the property. Accordingly, stage-storage information was determined using LiDAR data and stage-discharge data, obtained from the HEC-RAS model for the crossing at March Road/Station Road, was input into the SWMHYMO hydrologic model as a ROUTE RESERVOIR command. The resultant design storm peak outflows from the hydrologic model (i.e., the “routed” flows) were then input into the HEC-RAS model immediately downstream of March Road and corresponding flood levels calculated through the upstream property using the attenuated flows. Note that, in accordance with MNR floodplain policy, “routed” flows were not used downstream of March Road to plot 100-year flood lines.
As shown on Map Sheet 16 – Appendix D, the 100-year flood level is reduced from approximately 80.5 m to 80.0 m (-0.5 m). Notwithstanding the decrease in flood level, the reduction in overall floodplain area is relatively limited and the frequency at which flooding begins at FVS4 and FVS5 will remain unchanged in light of the negligible storage routing available at lower elevations (i.e., flood flows within the channel area). Additional routing information is included in Table D-6.
No FVS locations were identified along the main branch of Shirley’s Brook. However, 100-year flood lines plotted between Terry Fox Drive and Shirley’s Brook Drive (refer to Shirley’s Brook Map Sheet 10 & 11 in Appendix D) extend beyond the top of bank along the north side of the channel. Any additional increases in peak flows or flood levels through this reach may result in a spill and flooding to the north due to existing subdivision grades and low point located on Shirley’s Brook Drive.
Shirley’s Brook & Watt’s Creek Phase 2Stormwater Management Study
553ra_2015-04-27_SBWC Phase 2 SWM Study_Final_60164823 - GAF Rev
6. Fluvial Geomorphologic Assessment
The assessment was completed by JTBES and included a review of background information, creek walks, detailed measurement of channel parameters within representative reaches, determination of channel stability (through use of high-level metrics such as the RGA, RSAT as well as through direct assessment), and determination of preliminary thresholds for erosion.
The following sections provide additional details regarding the fluvial geomorphologic activities completed as part of the Phase 2 SWM Study.
6.1 Reach Delineation
The watercourse systems were divided into two types of reaches for analysis. The overall reach represents a longer watercourse distance and generally has boundaries at road crossings. These reaches are used to determine general conditions in the watercourse as it crosses the landscape. The detailed reaches are where specific data was collected and analyzed; these reaches are located in sensitive areas of the overall reach.
Reach locations for Watt’s / Kizell Drain and Shirley’s Brook are identified on Figures 5 and 6 with additional details including upstream and downstream limits and reach identifiers included in Table 6.
6.1.1 General Reach Summary
Summary reach descriptions are provided in Appendix E which includes general characteristics including overall slope, direction of flow, adjacent land uses and existing vegetation, observations of past alterations and signs of erosion and / or deposition.
6.1.2 Detailed Study Reaches
Detailed study reaches were identified to be a combination of unstable sections of the watercourses (where either active erosion or deposition was occurring) and relatively stable sections which were on the cusp of tipping into an instability condition. In total, six reaches were identified on Shirley’s Brook, five on Kizell Drain, and four on Watts Creek. Two of the sections on Watts Creek were upstream of the connection with the Kizell Drain and were selected for comparison purposes. Summary sheets included in Appendix E include the reach Identifier, location of the reach (GPS co-ordinates), general condition of the reach, and a series of photos.
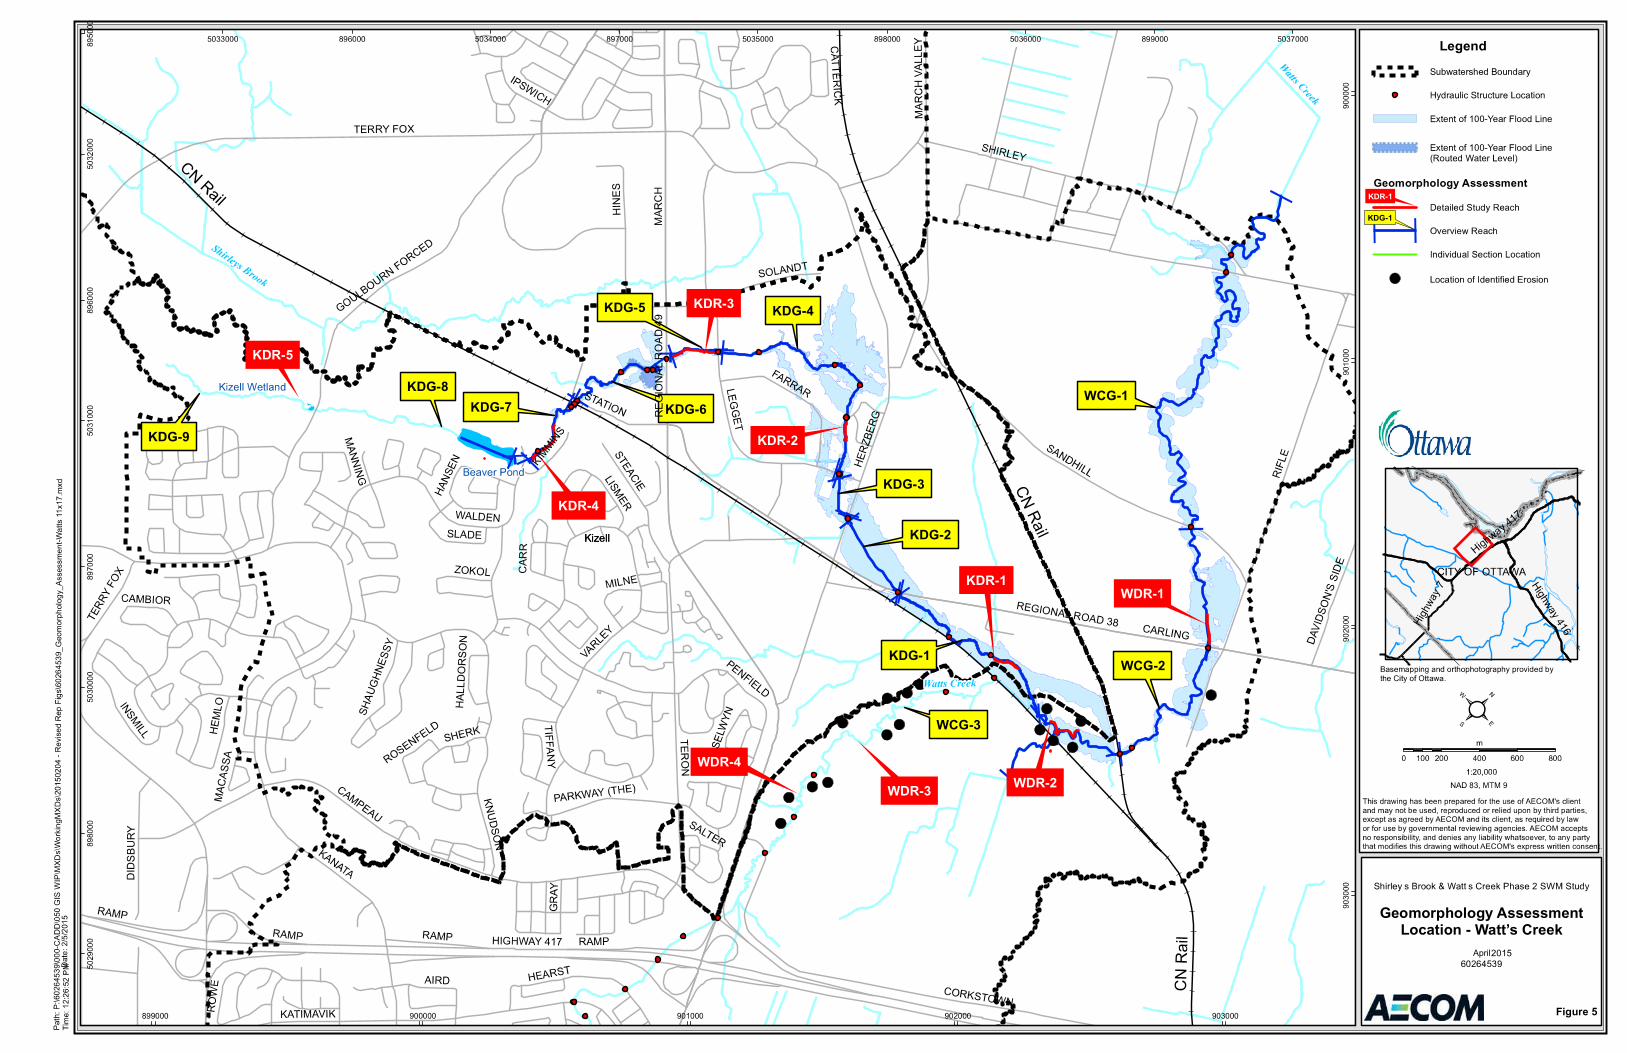
WCG-1
WDR-1
WCG-2
WCG-3
WDR-2
KDR-1
KDG-1
KDG-2
KDG-4
KDG-3
KDR-2
KDG-5
KDG-7
KDR-4
KDG-8
KDR-5
KDG-9
KDG-6
KDR-3
WDR-4
WDR-3
Watts Creek
Shirleys Brook
Watts C
reek
Legend
Geomorphology Assessment
Figure 5
Geomorphology AssessmentLocation - Watt’s Creek
KDR-1
KDG-1
April
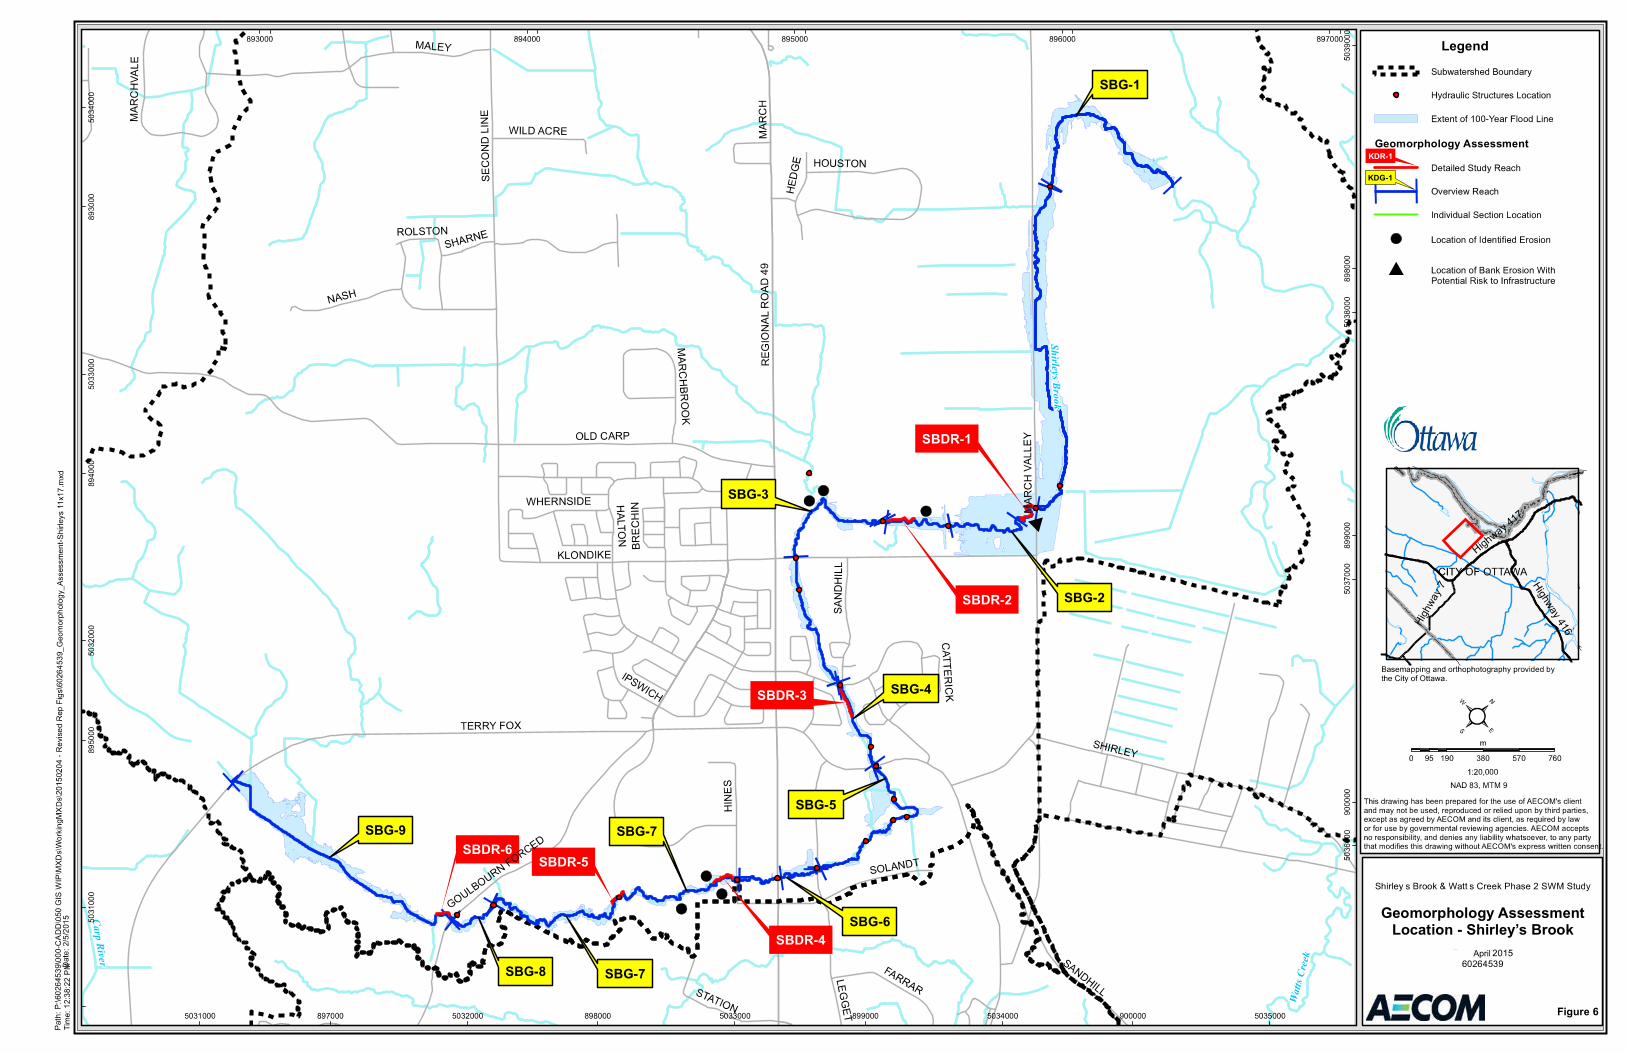
SBG-1
SBDR-1
SBG-2SBDR-2
SBG-3
SBDR-3 SBG-4
SBG-5
SBG-6SBDR-4
SBG-7
SBDR-5SBDR-6
SBG-9
SBG-8 SBG-7
Sh
ir leys B
roo
k
Watt
s C
reek
Carp
Rive
r
Legend
Geomorphology Assessment
Figure 6
Geomorphology AssessmentLocation - Shirley’s Brook
KDR-1
KDG-1
April
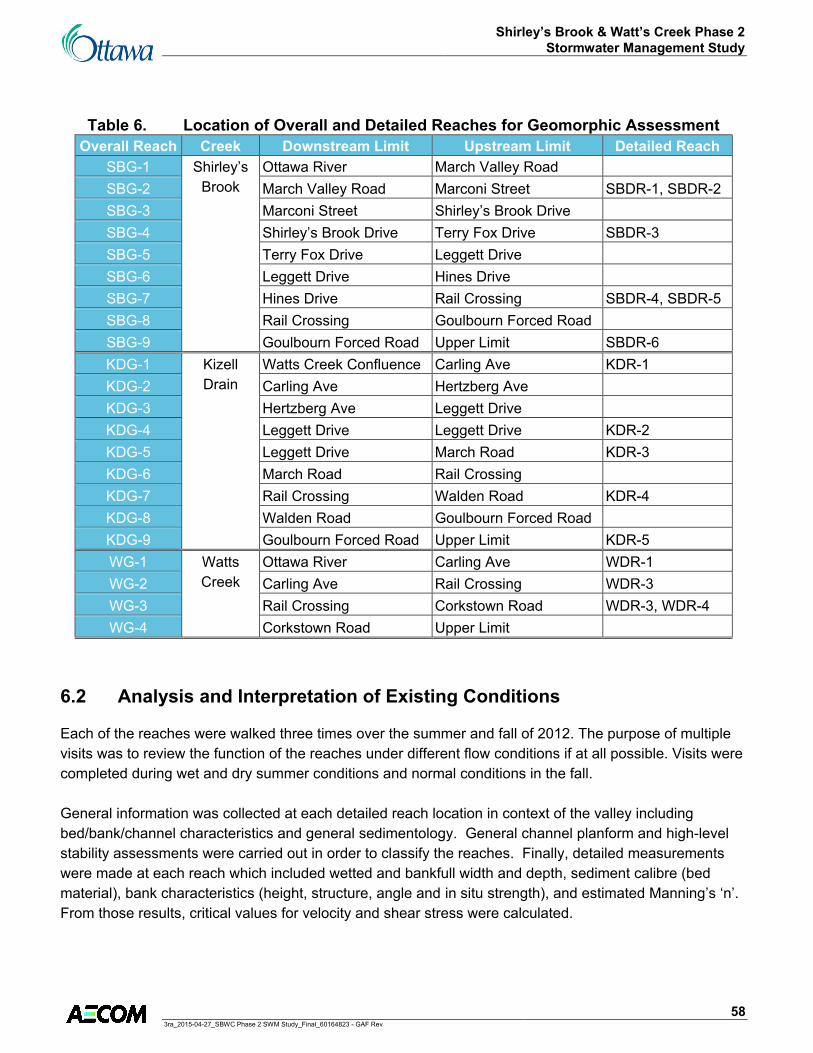
Shirley’s Brook & Watt’s Creek Phase 2Stormwater Management Study
583ra_2015-04-27_SBWC Phase 2 SWM Study_Final_60164823 - GAF Rev
Table 6. Location of Overall and Detailed Reaches for Geomorphic Assessment
Overall Reach Creek Downstream Limit Upstream Limit Detailed Reach SBG-1 Shirley’s
Brook Ottawa River March Valley Road
SBG-2 March Valley Road Marconi Street SBDR-1, SBDR-2 SBG-3 Marconi Street Shirley’s Brook Drive SBG-4 Shirley’s Brook Drive Terry Fox Drive SBDR-3 SBG-5 Terry Fox Drive Leggett Drive SBG-6 Leggett Drive Hines DriveSBG-7 Hines Drive Rail Crossing SBDR-4, SBDR-5 SBG-8 Rail Crossing Goulbourn Forced Road SBG-9 Goulbourn Forced Road Upper Limit SBDR-6 KDG-1 Kizell
Drain Watts Creek Confluence Carling Ave KDR-1
KDG-2 Carling Ave Hertzberg Ave KDG-3 Hertzberg Ave Leggett Drive KDG-4 Leggett Drive Leggett Drive KDR-2 KDG-5 Leggett Drive March Road KDR-3 KDG-6 March Road Rail Crossing KDG-7 Rail Crossing Walden Road KDR-4 KDG-8 Walden Road Goulbourn Forced Road KDG-9 Goulbourn Forced Road Upper Limit KDR-5 WG-1 Watts
Creek Ottawa River Carling Ave WDR-1
WG-2 Carling Ave Rail Crossing WDR-3 WG-3 Rail Crossing Corkstown Road WDR-3, WDR-4 WG-4 Corkstown Road Upper Limit
6.2 Analysis and Interpretation of Existing Conditions
Each of the reaches were walked three times over the summer and fall of 2012. The purpose of multiple visits was to review the function of the reaches under different flow conditions if at all possible. Visits were completed during wet and dry summer conditions and normal conditions in the fall.
General information was collected at each detailed reach location in context of the valley including bed/bank/channel characteristics and general sedimentology. General channel planform and high-level stability assessments were carried out in order to classify the reaches. Finally, detailed measurements were made at each reach which included wetted and bankfull width and depth, sediment calibre (bed material), bank characteristics (height, structure, angle and in situ strength), and estimated Manning’s ‘n’. From those results, critical values for velocity and shear stress were calculated.
Shirley’s Brook & Watt’s Creek Phase 2Stormwater Management Study
593ra_2015-04-27_SBWC Phase 2 SWM Study_Final_60164823 - GAF Rev
..................
................................
........
6.2.1 General Information
The general characteristics associated with each detailed reach were classified using the following criteria:
Conservation Status susceptibility to disturbance and ability to accept disruption;
Reach Class identifies sediment dynamics through the entire reach (i.e., source, transfer, exchange, sink or winterbourne); and
Valley Form and Land Use verification of adjacent land uses in order to confirm possible system inputs.
6.2.1.1 Bed, Bank and Channel Characteristics
Bed and bank materials, flow types and in-channel vegetation were recorded for each detailed reach as shown on Figure 5 and 6. Results of the assessment show that a majority of the bed material is comprised of clays with some silts and “smooth” flow conditions (i.e., lack of in-channel diversity). In channel vegetation included section with either algae or submerged vegetation. A majority of the banks are moderately steep with some undercutting. Adjacent bank vegetation comprised primarily of grassesand sedges.
6.2.1.2 General Sedimentology
An assessment of potential sources of sediment confirmed that in-channel sinks are predominant throughout the Study Area. In light of the size of the deposits, it was concluded that the flow regime is not functioning sufficiently to transport the sediment through the systems.
6.2.1.3 Channel Planform and Rapid Assessment
Channel and reach lengths were measured in order to calculate channel sinuosity. Results confirm low sinuosity values throughout the watercourse systems. For the most part the maximum belt can be considered to be narrow, particularly in the lower reaches of Shirley’s Brook and Watts Creek, where the channel flows in the flatter Ottawa River floodplain. Not unexpectedly, areas along Kizell Drain where the drain flows within the urban area the meander belt is very narrow (KDR-2, KDR-3).
A number of assessment tools were used including the Rapid Geomorphic Assessment (RGA), Rapid Stream Assessment Tool (RSAT) and Rapid Reach Assessment Forms (RRAF) in order to confirm whether the reaches within the Watt’s Creek / Kizell Drain and Shirley’s Brook as considered “in regime” (i.e., stable) “transitional” or “adjusting”. Results show that for the most part these systems are unstable, with the exception of the upper reaches of both Shirley’s Brook and Kizell Drain. The greatest instability is in the Kizell Drain (KDR-2, KDR-3) and lower Shirley’s Brook (SBDR-1), and almost all of Watts Creek.
Shirley’s Brook & Watt’s Creek Phase 2Stormwater Management Study
603ra_2015-04-27_SBWC Phase 2 SWM Study_Final_60164823 - GAF Rev
6.2.2 Detailed Reach Assessment
Detailed information for each reach was collected including measurements of bankfull and wetted channel width(W), depth (D) and W/D ratios and confirmed typical patterns with an increase in width and depth as the distance from the headwaters increase. In situ bank strength measurements were completed and Manning’s roughness (‘n’ values) were determined at each detailed site location as shown on Figure 5 and 6. Calculated bank shear strengths were considerably higher than channel shear stresses indicating that bank erosion is not only caused by flowing water and excess energy in the flow, but is a combination of factors including weakening by freeze-thaw, presence of weaker lenses, and other factors. Under existing flow conditions bank erosion is occurring even though the bank shear strength is orders of magnitude greater than shear stresses acting on the bank.
Average low flow and bankfull velocities were also calculated and compared to corresponding shear stress at each detailed reach using in situ measurements. Results, contained in Appendix E, indicate that sediment on the bed of the watercourses should be in transport even under low flow conditions as the critical velocity is exceeded; however there was little or no evidence of transporting sediment at the time of the low flow measurements. The reason for this is found in the size of the material comprising the bed: smaller grains in the silt and clay fraction can be attracted to one another by electro-static and/or chemical processes, which makes the individual grains act as clumps (formally referred to as ‘flocs’ in the literature) which have significantly greater strength until those electric or chemical bonds are broken. These bonds are fragile and are generally broken by turbulent flow so under higher flow regimes transport is initiated.
6.2.3 Streambank Erosion
Numerous locations along both Kizell Drain/Watts Creek and Shirley’s Brook exhibit evidence of natural bank erosion. Attempting to limit this erosion is problematic in that doing so limits the watercourses ability to respond to turbulent energy. By slowly picking up and transporting small quantities of eroded bed and bank material the watercourse is able to balance the forces acting on it and allows the watercourse to function properly. When no erosion occurs, a system is considered “stable” for the flows incident upon it (meaning the channel is able to resist the flow energy that water exerts on its boundaries). Conversely, when natural erosion occurs, the watercourse is trying to modify its cross-section, albeit slowly and in a controlled manner, to the natural range of flows that it experiences. When an area within a subwatershed is developed and the flow regime is altered (i.e., increased impervious cover), additional runoff volume is generated during rainfall and snowmelt events requiring a watercourse to adjust its cross-section to meet the additional energy. However, if proper stormwater management is implemented to treat and control runoff, the watercourse will only require small adjustments and erosion will not be considered problematic.
Notwithstanding the above, there are a number of locations on Shirley’s Brook and Watt’s Creek where accelerated erosion is occurring. In these areas the watercourses are adjusting rapidly to changes in flow regime and this erosion results in overloading of the system with sediment the watercourse must now deal with through transport and re-deposition downstream. This series of factors results in an “unstable” channel which will continue to change over time; the time frame required to equilibrate to these new

Shirley’s Brook & Watt’s Creek Phase 2Stormwater Management Study
613ra_2015-04-27_SBWC Phase 2 SWM Study_Final_60164823 - GAF Rev
conditions depends on whether additional changes to flow regimes (through development) are occurring and the magnitude of change that the watercourse needs to overcome.
6.2.3.1 Risk to Land and Infrastructure on Kizell Drain/Watts Creek & Shirley’s Brook
Based on the field assessment, a total of sixteen(16) sites were identified along the Kizell Drain/Watt’s Creek system (10 upstream of the confluence with Kizell Drain and six downstream of the confluence) where accelerated erosion is occurring based on existing flows (refer to Figure 5). At each location, the watercourse is attempting to find a new path in response to stresses and while there is no direct risk to infrastructure, loss of land is occurring.
As shown on Figure 6, a total of six (6) existing sites along Shirley’s Brook were identified as having accelerated erosion where loss of adjacent land is occurring. One (1) additional erosion site was also identified immediately upstream of March Valley Road (within the lower reaches and located at SBDR-1). At this location, a large bank on the outside bend of the watercourse is eroding towards the existing right-of-way.
The observed loss of property at the above noted locations, as a result of continued erosion processes, may require some intervention in the future. Accordingly, it would be prudent to implement a monitoring program to establish baseline conditions and record changes in cross-sectional area and watercourse position at each of the identified sites.

Shirley’s Brook & Watt’s Creek Phase 2Stormwater Management Study
623ra_2015-04-27_SBWC Phase 2 SWM Study_Final_60164823 - GAF Rev
7. Conceptual Stormwater Servicing Alternatives
A set of conceptual stormwater servicing alternatives were developed for the remaining urban development located in the headwaters of the Shirley’s Brook and Watt’s Creek (Kizell Drain) subwatersheds and were subject to a qualitative, planning level evaluation in order to enable the City to make informed decisions regarding the future direction of stormwater management within the Study Area.
The alternatives were developed in consultation with the City and included a range of minor system (sewer), major system (overland flow) and stormwater management strategies ranging from complete diversion, frequent flow diversion and no diversion of surface drainage between Shirley’s Brook and the Watt’s Creek (Kizell Drain) subwatersheds. Potential effects and additional required studies / analyses associated with each alternative were considered under the following categories:
Water quality and quantity (flood control); Fluvial geomorphology (erosion & deposition); Natural environment (wetland, terrestrial and aquatic habitat); Engineering & cost considerations; and Regulatory approval & permitting requirements
Detailed results of the conceptual stormwater servicing evaluation are presented in a set of summary tables contained in Appendix F along with associated servicing concepts.

Shirley’s Brook & Watt’s Creek Phase 2Stormwater Management Study
633ra_2015-04-27_SBWC Phase 2 SWM Study_Final_60164823 - GAF Rev
8. Study Findings
The following provides a summary of the major Study findings based on the completion of the Phase 2 SWM Study tasks.
8.1 Hydrologic Assessment
No significant storm events were recorded during the 2011 and 2012 monitoring seasons for use in calibration and verification of the hydrologic model. Storm events selected as part of Phase 2 were less than a 2-year storm compared to City’s IDF design storms;
The City’s streamflow rating curves for flow monitoring stations CK5-001 and CK6-002 are limited to only several points during relatively low flows (i.e., less than 2-year) and could therefore not be used to accurately estimate peak flows for several of the 2011-2012 storm events selected for the calibration and verification of the hydrologic models;
The results of the initial 2011-2012 hydrologic model calibration and verification confirm that a reasonable calibration between simulated and observed surface runoff hydrographs at all the three (3) monitoring locations has been achieved;
Further, the calibration parameters are within an acceptable range of adjustment and any further revisions would require additional monitoring data to justify further adjustments;
Additional verification of the initial 2011-2012 calibrated SWMHYMO models using distributed rainfall depths determined from radar data resulted in a further 10% to 50% reduction in peak flows and runoff volumes below the point rainfall results for four of the five selected storm events further justifying the calibrated model parameters;
Given the limitations associated with the initial 2011-2012 hydrologic model calibration and verification assessment, a number of subsequent hydrologic analyses were undertaken between 2013 and 2014 which included the following activities:
Implementation of continuous water level recording at six previously established high water level monitoring sites and the installation of two additional rain gauges within the Study Area (Fire Hall and Glen Cairn) during 2013;
Cross-sectional survey and subsequent hydraulic analysis undertaken at the City’s existing stream gauging locations (CK5-01 and CK6-002) in order to extrapolate the current depth vs. streamflow rating curves;
An additional model calibration & verification exercise completed for the Upper Kizell Drain and Watt’s Creek subwatershed using six storm events recorded over the 2013 monitoring period;
A theoretical storage assessment carried out for the Beaver Pond to determine what additional volume, over and above what currently exists, would be required to match simulated outflow hydrographs with observed 2013 data;

Shirley’s Brook & Watt’s Creek Phase 2Stormwater Management Study
643ra_2015-04-27_SBWC Phase 2 SWM Study_Final_60164823 - GAF Rev
Incorporation of additional storage attenuation within the Upper Kizell Drain hydrologic model to reflect potential storage routing distributed within permeable sub-surface backfill within the Study Area contributing to the Kizell Wetland and Beaver Pond; and,
A further hydrologic model verification assessment completed for the Upper Kizell Drain hydrologic model using a more recent storm event recorded on June 24, 2014
Results of the additional 2013–2014 analyses confirmed the following:
Simulated runoff volumes for the 2013 storm events matched well to observed data recorded at the outlet of the Beaver Pond however peak flows as well as hydrograph shape and timing were notably different and a further input parameter sensitivity assessment did not produce any notable improvements to the model calibration;
Simulated runoff volumes, peak flows and hydrograph shape and timing for the 2013 storm events compared well to observed data recorded within the Watt’s Creek subwatershed and no further adjustments to the previous Phase 2 SWMHYMO model are recommended;
An additional 65%, or 115,106 m3 of storage volume (to elevation 92.5 m) would be required within the Beaver Pond in order match simulated peak flows and timing to observed data at the outlet which is considered orders of magnitude greater than any error inherent within the LiDAR data used to determine the existing storage volume for the existing stormwater management facility;
Simulated peak flows and hydrograph shape and timing for the 2013 storm events and June 24, 2014 storm event match well with observed data recorded at the outlet of the Beaver Pond with the incorporation of additional storage routing to reflect potential distributed sub-surface storage within the permeable backfill; and
The additional storage attenuation noted above was limited to the actual maximum storage utilized during the June 24, 2014 storm event, which represents the largest observed storm (depth) recorded during the calibration / verification exercise.
Resultant design storm peak flows (calibrated) for Shirley’s Brook and Watt’s Creek / Kizell Drain are considered representative of existing conditions for the Phase 2 Study Area and reasonably reflect the hydrologic response of the system;
Revised peak flows and runoff volumes draining to the Kizell Wetland and Beaver Pond are lower than uncalibrated values reported in the Phase 1 SWM Study (AECOM, 2011);
An updated performance assessment of the Kizell Wetland and Beaver Pond indicates that:
The maximum 100-year water level in the Kizell Wetland was reduced from 93.53 m to 93.14 m which is below the approximate spill elevation to the Carp River located at the west limit of the Kizell Wetland;
The 100-year peak discharge from the Kizell Wetland to the Beaver Pond was significantly reduced;
Shirley’s Brook & Watt’s Creek Phase 2Stormwater Management Study
653ra_2015-04-27_SBWC Phase 2 SWM Study_Final_60164823 - GAF Rev
The maximum 100-year water level in the Beaver Pond was lowered from 92.85 m to 92.34 m (-0.51 m);
The 100-year discharge from the Beaver Pond control outlet structure was reduced from 1.60 m3/s to 0.91 m3/s as a result of the hydrologic modelling refinements and calibration assessment completed as part of the Phase 2 SWM Study;
The 100-year discharge from the Beaver Pond no longer spills through north overflow; and
The maximum 100-year discharge and water level values are below the target values of 0.96 m3/s and 92.60 m identified in the approved MOE Certificate of Approval for the Beaver Pond.
8.2 Hydraulic Assessment
Watt’s Creek / Kizell Drain
The updated 100-year (draft) flood lines delineated as part of the Phase 2 SWM Study for Watt’s Creek / Kizell Drain were compared to previous MVCA flood risk mapping and found to be generally consistent for areas that have not been modified through subsequent flood studies (i.e., outlet upstream of Legget Drive);
Three Flood Vulnerable Structures (FVS) were identified between Herzberg Road and Legget Drive including the March Road pumping station which is generally consistent with previous MVCA flood risk mapping;
The updated 100-year (draft) flood lines delineated for the Kizell Drain through realigned sections downstream of Legget Road are reasonably consistent with flood study design information prepared for the previous channel realignment;
The updated 100-year (draft) flood lines delineated for the Kizell Drain through Marshes Golf Course extend beyond the flooding limits shown in the previous flood study completed for the Kizell Drain realignment but do not impact any existing structures;
The updated 100-year (draft) flood lines delineated for the Kizell Drain upstream of March Road are generally consistent with previous MVCA flood risk mapping;
Two flood vulnerable structures (FVS) were identified upstream of March Road within the MDS Nordion property (formerly AECL). These structures were identified as subject to flooding in the previous MCVA flood risk mapping;
The FVSs located upstream of March Road are subject to flooding starting at approximately a 25-year flood level;
A subsequent flood storage routing assessment was completed upstream of the March Road crossing which results in a 0.5 m reduction in the 100-year flood depth at the FVS locations, however, the areal extent of flooding as well as the frequency at which flooding occurs is not improved; and
Shirley’s Brook & Watt’s Creek Phase 2Stormwater Management Study
663ra_2015-04-27_SBWC Phase 2 SWM Study_Final_60164823 - GAF Rev
The hydraulic capacity of the Legget Drive culvert crossing does not meet the City’s Sewer Design Guideline criterion for roadway overtopping.
Shirley’s Brook
The updated 100-year flood lines delineated as part of the Phase 2 SWM Study for Shirley’s Brook were compared to previous MVCA flood risk mapping and found to be generally consistent for areas that have not been modified through subsequent flood studies;
The spill area identified on Shirley’s Brook at March Valley Road and within the downstream DND lands is generally consistent with previous MVCA flood risk mapping;
A wide floodplain is identified between March Valley Road and the upstream railway crossing but the area is expected to be filled and developed in the future according to previous studies;
A flood sensitive reach is identified on Shirley’s Brook between Shirley’s Brook Drive and Terry Fox Drive. Any further increases to peak flows may result in a spill and flooding to the north due to subdivision grading and low point located on Shirley’s Brook Drive;
The updated 100-year flood lines delineated for Shirley’s Brook through the realigned section downstream of Legget Drive compared well with the flood study design information prepared for the previous channel realignment; and
The hydraulic capacity of the existing Goulbourn Forced Road, recent March Valley Road culvert replacement and DND crossing downstream of March Valley road do not meet the City’s Sewer Design Guideline criterion for roadway overtopping.
8.3 Fluvial Geomorphology Assessment
Recognizing that Watts Creek, Kizell Drain and Shirley’s Brook are separate systems, results of the analysis clearly shows that similar existing pressures are currently exerted on each system and that they are responding in a similar manner. Therefore, the following summary findings can apply to the entire Phase 2 Study Area:
Erosion of banks along the watercourses is occurring at rates which reflect current flow conditions and is generally not excessive at this point in time when considering these systems as a whole; however there is a total of twenty three (23) site-specific areas within the Kizell Drain/Watt’s Creek & Shirley’s Brook systems where accelerated erosion is resulting in loss of property. One of these identified sites is also threatening infrastructure (i.e., Shirley’s Brook at March Valley Road) which should be monitored in order to determine possible intervention;
The fact that the reaches are entrenching is resulting in downcutting in all reaches except one (SBDR-3), which is leading to floodplain disconnection and an increase in energy during less-frequent storm events;

Shirley’s Brook & Watt’s Creek Phase 2Stormwater Management Study
673ra_2015-04-27_SBWC Phase 2 SWM Study_Final_60164823 - GAF Rev
The sediment load in the watercourses appears to exceed the natural rate of delivery of sediment from banks, therefore leading to the conclusion that flow energy during storm events and spring freshet is not sufficient to flush the systems;
Over time if flows become lower than the current condition in any of the systems the aggradation problem is anticipated to worsen, potentially to the point where flushing of sediment under higher flows may not occur;
None of the systems are currently functioning well as there is an apparent lack of synchronization between the sediment regime and the flow regime under current conditions;
Under existing conditions, it is anticipated that overall functioning of all systems will continue to degrade and that those reaches currently identified as stable will destabilize. This process (ongoing under existing conditions) represents a lengthy evolution to a new form in response to land use changes that have occurred to-date;
Shirley’s Brook and Kizell Drain/ Watts Creek systems are in a relatively fragile state and trying to equilibrate to changes induced by past land use changes which over time have altered the flow and sediment regimes. Further alteration of flow regimes will interrupt this ongoing process with the potential to further impair the systems’ ability to synchronize the relationship between flow and sediment transport. This has the potential to further affect fluvial functioning of the watercourses and by association may have an effect on infrastructure, floodlines, and aquatic biota; and
Additional development in these watersheds has the potential to exacerbate existing rates and locations of erosion, sedimentation and remobilization of existing silt deposits.
Recommended