State of Vermont Agency of Human Services Department of Vermont Health Access [Phone] 802-879-5900 280 State Drive, NOB 1 South Waterbury, VT 05671-1010 http://dvha.vermont.gov
Access to Care Plan Department of Vermont Health Access
Introduction Vermont’s Medicaid program is delivered through the Global Commitment to Health Waiver (an 1115 Waiver). The Vermont Agency of Human Services (AHS) serves as the lead Medicaid entity for the State and delegates responsibility for the delivery of most Medicaid services to the Department of Vermont Health Access (DVHA). In accordance with the Global Commitment to Health Waiver, DVHA uses a managed care model for the delivery of Medicaid services across the State of Vermont and must comply with most of the provisions of 42 CFR § 438. With the creation of this report, Vermont is also aligning with fee-for service access requirements at 42 CFR § 447.203. The Department’s activities regarding access to care are designed to ensure that the Medicaid provider network has a sufficient range and quantity of providers, is easily accessible to members, and complies with federal network access requirements.
In addition to the development of this Access to Care Plan, which will be updated every three years and posted on its public website, DVHA conducts the following monitoring and network-building activities:
• Twice per year, DVHA generates GIS maps and charts that show the actual distances members are traveling to seek care. These maps are reviewed with the Provider and Member Relations (PMR) Director, the Compliance Director, and the Managed Care Compliance Committee to determine any needed actions.
• DVHA receives weekly reports from its fiscal agent detailing newly enrolling providers as well as providers leaving the network (including the reason they are leaving the network). DVHA approves all new enrollments and disenrollment’s from the provider network.
• On a bi-weekly basis, DVHA receives a report of the inventory of unprocessed provider enrollments and provider changes.
• DVHA requires 90-days’ notice when a provider decides to leave the network. Upon such notice, DVHA works with the provider and affected members to ensure that members are aware of the change and have an opportunity to find a new provider.
• Annually, DVHA’s provider network is subject to an External Quality Review Organization (EQRO) review. These reviews include timeliness and availability of services, travel distance standards, enrollment processes, and strategies for providing access to services in a culturally-competent way with regard for the preferred languages of Vermont Medicaid’s members.
DRAFT
2
• DVHA works with the Vermont Dental Society, Vermont Association of Hospitals and Health Systems, Vermont Medical Society & Area Health Education Centers, and other groups to encourage the recruitment and retention of medical providers.
• The PMR unit and the provider call center routinely field calls from providers who have special issues to resolve. Prompt resolution of provider concerns has proven to be an effective tool for keeping providers enrolled and engaged with the Medicaid program.
• The Member Services call center assists with access issues by providing contact information for providers, including primary care providers who are accepting new patients.
• The Member Services call center logs complaints received from consumers, including access issues. These complaints are reviewed on a quarterly basis by the PMR unit. A report summarizing these complaints is compiled each quarter, and any systemic issues are identified and addressed.
When evaluating the time and distance thresholds listed below, the following factors are taken into account:
• The general demographic makeup of the State of Vermont, including rural versus urban communities.
• Changes (or anticipated changes) in covered members caused by changes in state population, changes in eligibility rules and/or any other changes that could have a significant impact on the total number of members served by the network.
• The characteristics and specific healthcare needs of the population of members served by this network.
• Some members may voluntarily choose to travel to a more distant provider. This practice does not necessarily indicate that the network is inadequate.
For the purpose of this Access to Care Plan, the following definitions apply: • Emergency care is care for a medical problem that could result in serious health
problems if it is not treated immediately. • Urgent care is care for any problem that might endanger a member's health if it is not
treated within 24 hours. • Preventative Care is defined as ongoing care designed to evaluate and maintain a
member’s overall health, rather than treating a specific medical problem. • Primary care includes gynecologists, Federally Qualified Health Centers and Rural Health
Centers, as well as specialty care providers who might also serve as a member's primary care provider.
• When the term medical problem is used in this document, the term is meant to include physical, mental and behavioral health problems.
DRAFT
3
Access to Care Emergency Care Vermont Medicaid's network includes 15 hospital emergency departments which are open and available 24 hours per day, 7 days per week and every day of the year. This network includes two verified level One Trauma Centers. These emergency departments are geographically spread across population centers in our state in such a manner as to ensure that a member will generally not have to travel more than 30 miles to reach an emergency department. A statewide network of enrolled ambulance services is available to provide emergency transportation when necessary. Vermont Medicaid also maintains a process through which payments can be made to non-enrolled providers when medically necessary, covered services cannot be provided within the existing network or when a member must seek emergency services (and post-emergency stabilization services) outside the network. Primary Care
Urgent Care: When a member requests an appointment for urgent care, that member should generally be seen at a primary care provider's (PCP) office within 24 hours.
Travel distance for a member to access urgent care from a PCP shall generally not exceed 30 miles.
Care for Non-Urgent Medical Problems: When a member requests an appointment for a minor medical problem, that member should generally be seen at a primary care provider's (PCP) office within 14 days.
Travel distance for a member to access care for a minor medical problem from a PCP shall generally not exceed 30 miles.
Preventative Care: When a member requests an appointment for preventative care, that member should generally be seen at a primary care provider's (PCP) office within 90 days.
Travel distance for a member to access preventative care from a PCP shall generally not exceed 30 miles.
Specialty Care
Specialty care includes the following specialties: • Cardiology • Urology • Behavioral health specialists • Mental health specialists
DRAFT
4
• Substance abuse specialists • Obstetrics • Home health services
Urgent Care: When a member requests an appointment for urgent specialty care, that member should generally be seen at a specialist’s office within 24 hours.
Travel distance for a member to access urgent care from a specialist should generally not exceed 60 miles.
Care for Non-Urgent Medical Problems: When a member requests an appointment for a minor medical problem, that member should generally be seen at a specialist’s office within 14 days.
Travel distance for a member to access care for a minor medical problem from a specialist should generally not exceed 60 miles.
Preventative Care: When a member requests an appointment for preventative care, that member should generally be seen at a specialist’s office within 90 days.
Travel distance for a member to access preventative care from a specialist should generally not exceed 60 miles.
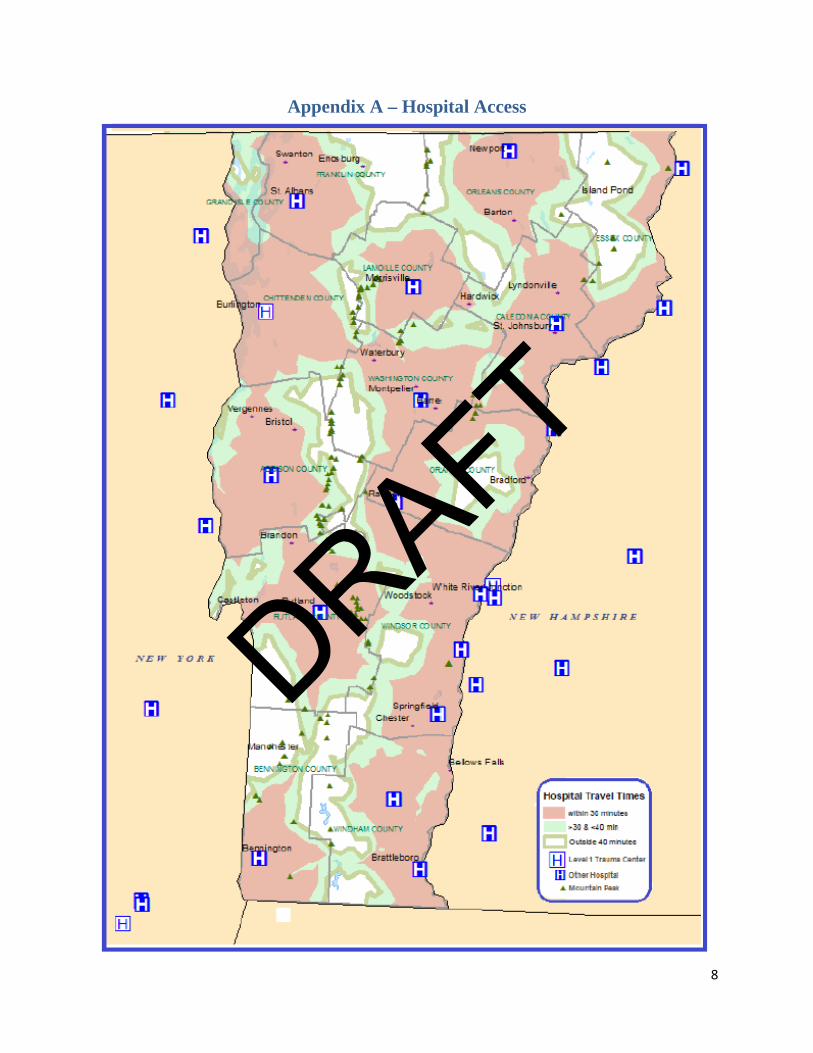
Hospital Care All of Vermont’s hospitals (including Dartmouth Hitchcock in New Hampshire) participate in Vermont Medicaid. Hospitals are located throughout the state such that a hospital may generally be accessed with not more than a 30-minute trip from any location in the state.
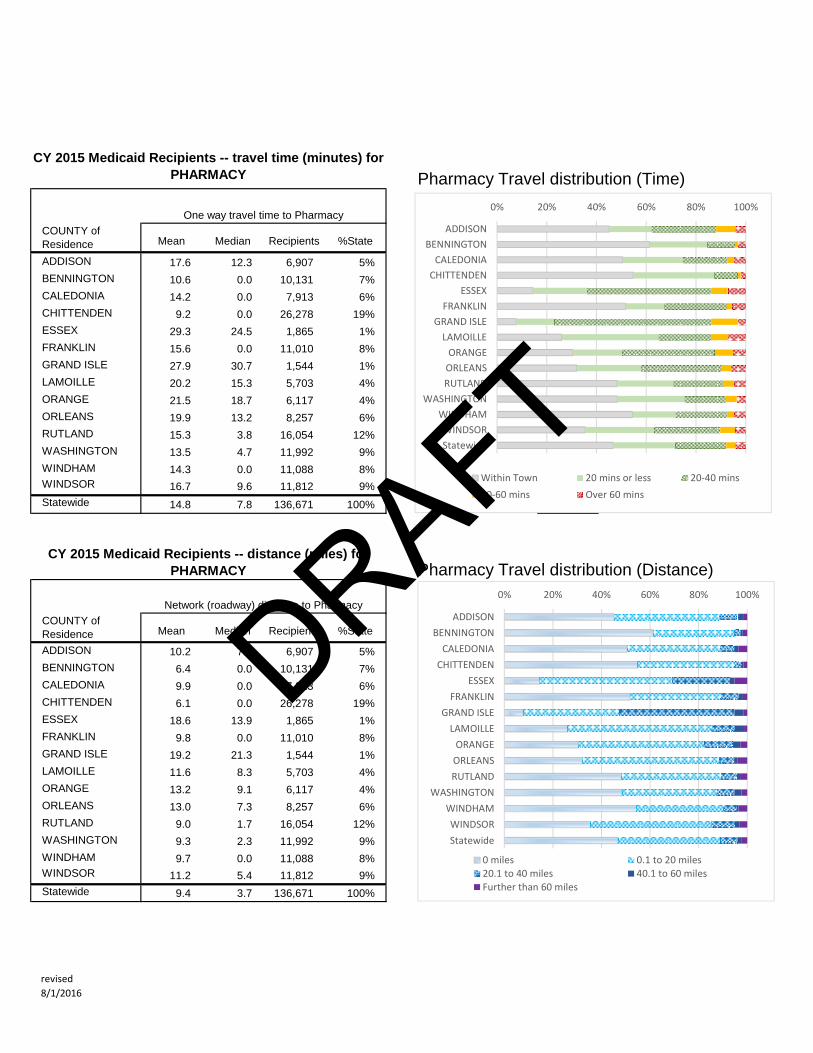
Pharmacy, Laboratory, Dental, Ophthalmology/Optometry and Advanced Imaging services These providers/facilities should be located so that members do not generally need to travel more than 60 miles to access their services
Home Health Vermont Medicaid’s network includes 26 Home Health Agencies, and their service areas cover the entire state of Vermont without any gaps in coverage. Home Health Agencies deliver services in the member’s home, everywhere in the State. Network monitoring activities for this provider type focus on statewide coverage rather than the typical distance standards used for other provider types.
DRAFT
5
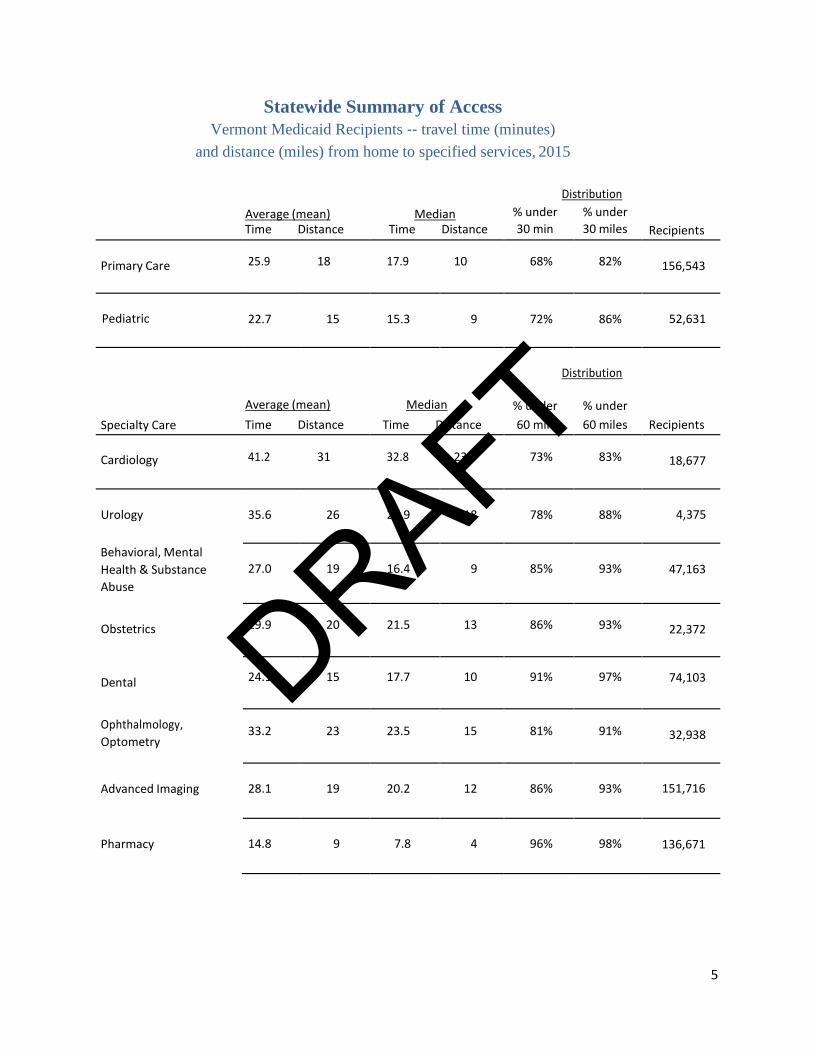
Statewide Summary of Access Vermont Medicaid Recipients ‐‐ travel time (minutes)
and distance (miles) from home to specified services, 2015
Distribution
Average (mean) Time Distance
Median Time Distance
% under 30 min
% under 30 miles
Recipients
Primary Care 25.9 18 17.9 10 68% 82%
156,543
Pediatric
22.7
15
15.3
9
72%
86%
52,631
Distribution
Average (mean) Median % under % under
Specialty Care Time Distance Time Distance 60 min 60 miles Recipients Cardiology 41.2 31 32.8 23 73% 83%
18,677
Urology
35.6
26
27.9
18
78%
88%
4,375
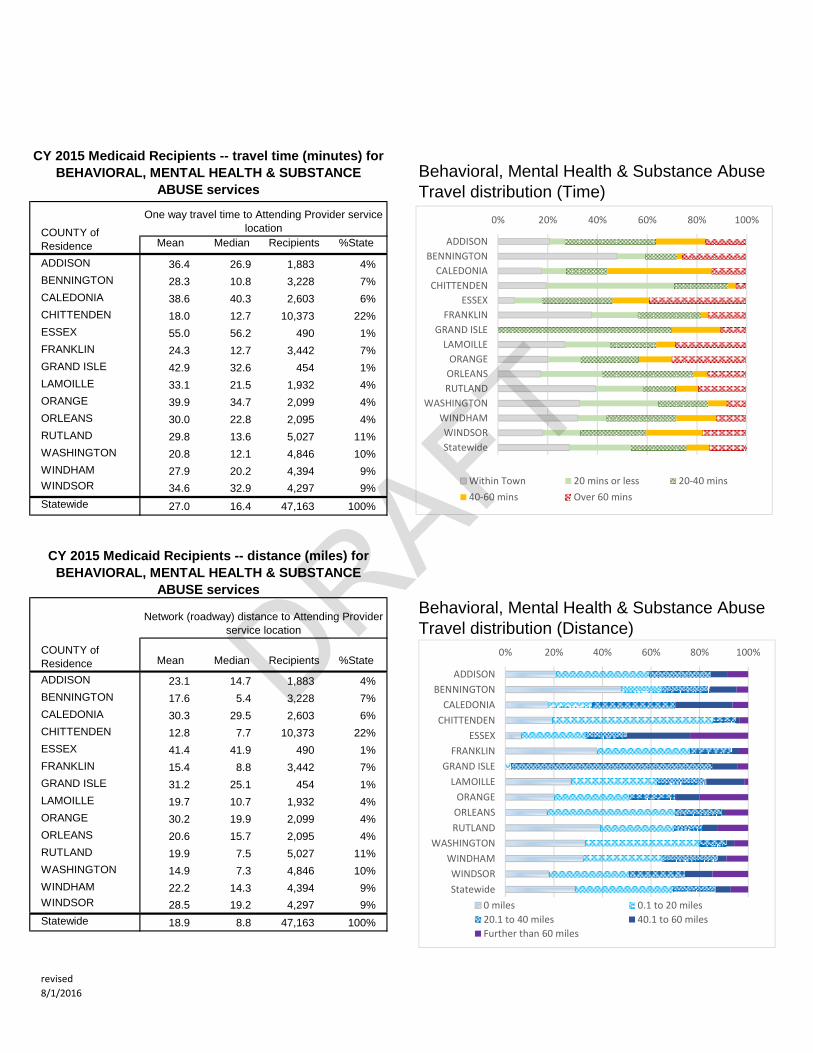
Behavioral, Mental Health & Substance Abuse
27.0
19
16.4
9
85%
93%
47,163
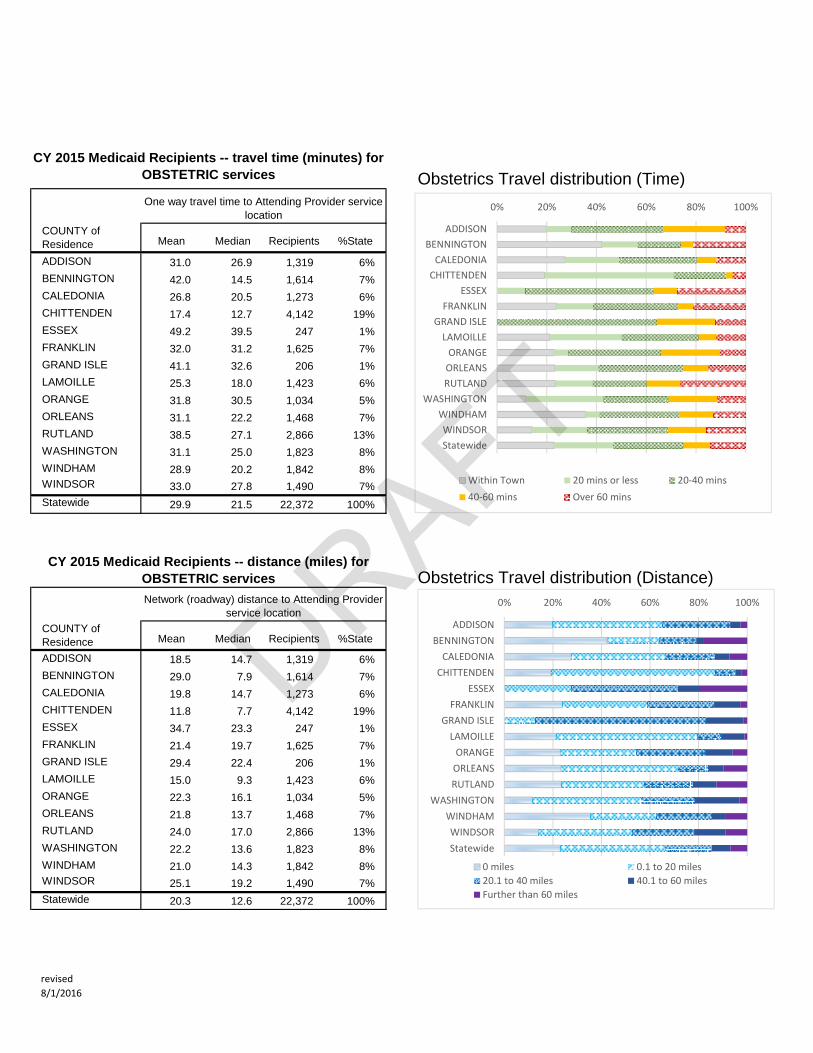
Obstetrics 29.9 20 21.5 13 86% 93%
22,372
Dental 24.1 15 17.7 10 91% 97% 74,103
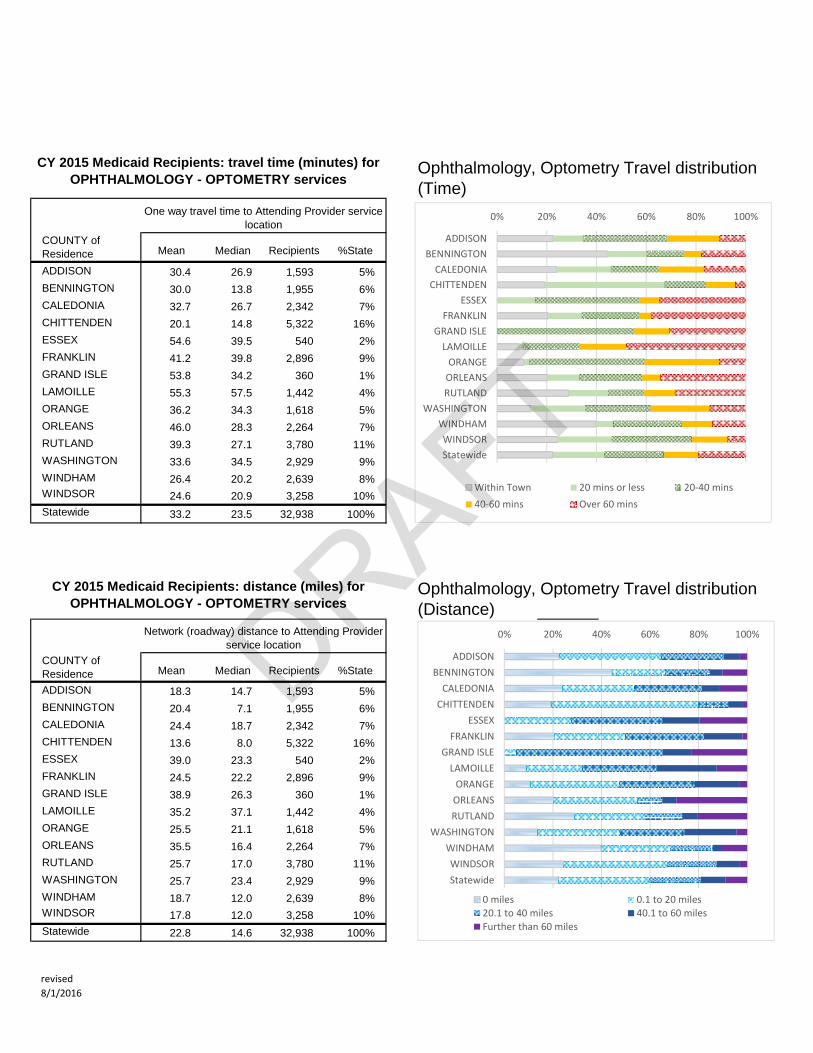
Ophthalmology, Optometry
33.2 23 23.5 15 81% 91%
32,938
Advanced Imaging
28.1
19
20.2
12
86%
93%
151,716
Pharmacy
14.8
9
7.8
4
96%
98%
136,671
DRAFT
6
Travel Distance and Travel Time Methods Travel distance and travel time between Medicaid recipients’ homes and their medical, dental and pharmacy providers is estimated by the following process:
1. Select relevant claims based on a provider’s specialty;
2. Choose valid location data; and
3. Assign a travel route between representative origin and destination points.
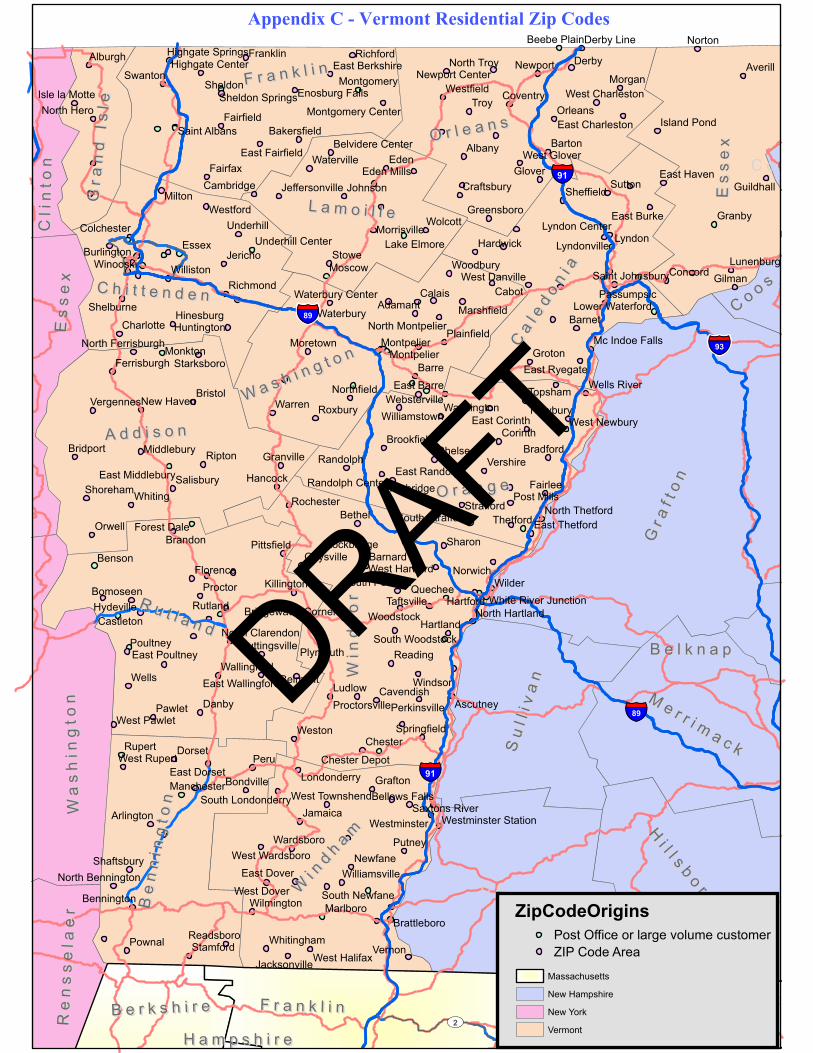
All Vermont Medicaid claims with service provided during calendar year 2015 were available for the analysis. Claims for specific analyses were selected by provider specialty, and address information for recipient and attending provider were obtained with each query. These addresses were abridged down to the postal code represented by a single point inside a town. This “address point” approach based on zip code reduces the spatial analysis from 100,000s of addresses down to 300 zip codes and a few thousand provider locations. See the map of Vermont’s residential Zip Codes in Appendix C. A claim can be thought of as a one-way trip, and the summary statistics for each county then is based on the all the claims, or trips, made during the year by the county or state’s residents 1. The spatial analysis was conducted using Geographic Information Systems ArcGIS 10.4 with the goal of connecting the origin points to the destination points along the highway network. The ArcGIS Network Analyst tool was used to find the ‘least cost’ route based on roadway time for each origin-destination pair. Any address with an invalid zip code was eliminated from the analysis unless location could otherwise be determined. Both average (mean) and median statistics are present for each county’s travel time and distance in Appendix B. The mean is often skewed as several long trips to reach a far-away hospital mathematically nudges the mean upward. These travel distributions are generally clustered around the low end and tail off with some very long trips. The median–the middle value in rank–is a good alternate measure of central tendency. ArcGIS Network Analyst is able to use a complex road network data layer, which accounts for intersections, roadway curvature and posted speed limits. Travel time and distance estimates are realistically represented2. ArcGIS Network Analyst uses this same representation to determine the maximum spatial distance from each of Vermont’s hospitals where one can still be able to reach the facility within 30 or 40 minutes. In the map of Hospital Travel Times, the white areas indicate it may be very difficult to reach a Vermont hospital or nearby non-Vermont hospital in under 40 minutes. 1 Unlike medical and dental, only the most recent trip to a particular pharmacy is counted. 2 There are several limitations to this method. First, not all trips for medical care or pharmacy originate from a patient’s home location, though this is always assumed to be the case. Second, the “address point” or postal centroid is made to represent an entire area served by that post office, introducing some error for nearly all locations. Third, trips whose origin and destination are the same cannot be assigned to the network, and are assigned zero (0) distance and time.
DRAFT
7
Access Review The Department of Vermont Health Access (DVHA) has reviewed the data gathered for this report and finds that the average level of access to the specific types of services in this report are adequate given the characteristics of the State of Vermont. Vermont is a rural, mountainous state where it is not uncommon that residents of certain communities must travel longer distances for things like work, school, groceries, and as evidenced in this report, medical care. In the breakdown by county in Appendix B, there are some counties where the average mileage one would have to travel to certain services is above the thresholds outlined in the report above. This is an expected result given the rural and mountainous geography of the counties in question. However, on a statewide basis, all services identified in this report can, on average, be accessed within the identified mileage threshold, with the exception of cardiology services, which on average is accessible within 31 miles. DVHA does not find this additional mile above the threshold to be significant to the point where corrective action is warranted, particularly because access to cardiology services is driven by primarily by one’s proximity to hospitals in the Vermont Medicaid network. Every effort is made to enroll all licensed cardiologists in the State. Access to hospital services is determined to be adequate in that hospitals are accessible by a 30-minute drive for the majority of Vermont, which is shown in the hospital map in Appendix A. The areas shaded in green and white, where travel is longer than 30 minutes, is expected due to how rural those areas of the state are. As can be seen in the map, these white areas are primarily where there are mountain peaks as well as state and national parks. Access to home health services is also determined in a manner that is different than primary or other specialty care categories since Home Health Agencies deliver services in the member’s home throughout the State of Vermont. It is therefore expected that Medicaid members are received the care they need from the Home Health Agency in their region. Systemic access issues for home health services are determined by complaints receive from members. No systemic issues have been identified at this time.
DRAFT
8
Appendix A – Hospital Access
DRAFT
Primary Care Travel distribution (Time)
Mean Median Recipients %State
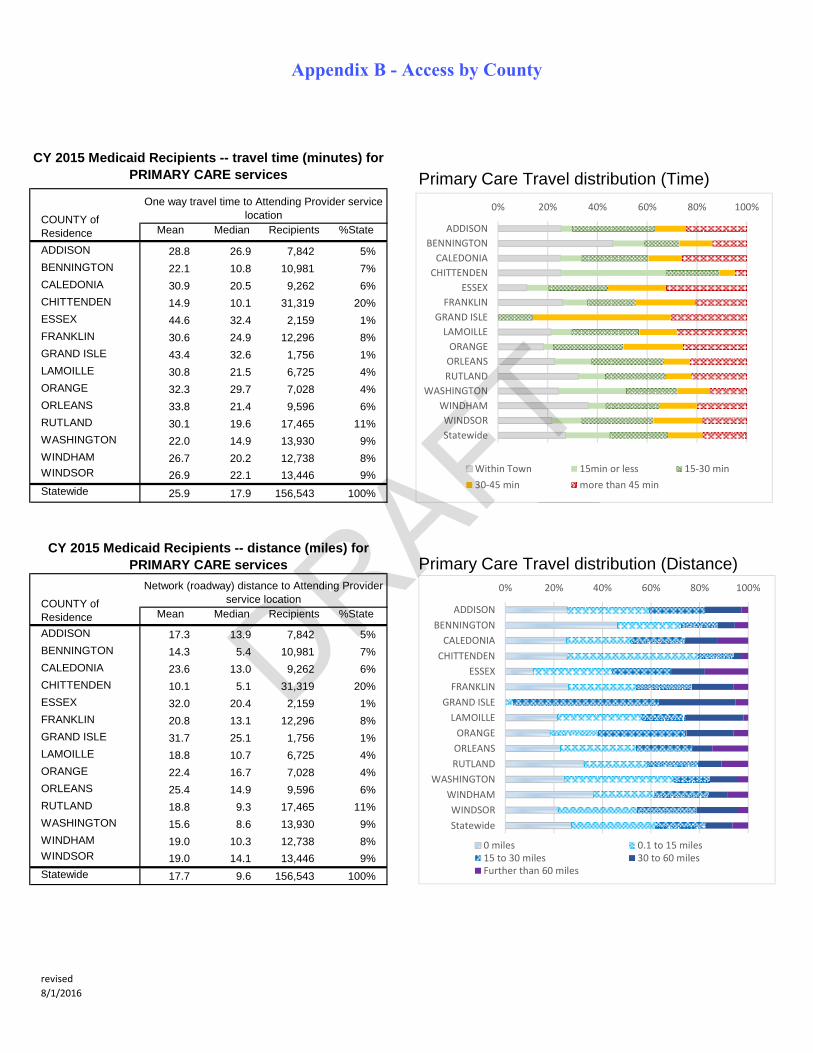
ADDISON 28.8 26.9 7,842 5%BENNINGTON 22.1 10.8 10,981 7%CALEDONIA 30.9 20.5 9,262 6%CHITTENDEN 14.9 10.1 31,319 20%ESSEX 44.6 32.4 2,159 1%FRANKLIN 30.6 24.9 12,296 8%GRAND ISLE 43.4 32.6 1,756 1%LAMOILLE 30.8 21.5 6,725 4%ORANGE 32.3 29.7 7,028 4%ORLEANS 33.8 21.4 9,596 6%RUTLAND 30.1 19.6 17,465 11%WASHINGTON 22.0 14.9 13,930 9%WINDHAM 26.7 20.2 12,738 8%WINDSOR 26.9 22.1 13,446 9%Statewide 25.9 17.9 156,543 100%
Primary Care Travel distribution (Distance)
Mean Median Recipients %State
ADDISON 17.3 13.9 7,842 5%BENNINGTON 14.3 5.4 10,981 7%CALEDONIA 23.6 13.0 9,262 6%CHITTENDEN 10.1 5.1 31,319 20%ESSEX 32.0 20.4 2,159 1%FRANKLIN 20.8 13.1 12,296 8%GRAND ISLE 31.7 25.1 1,756 1%LAMOILLE 18.8 10.7 6,725 4%ORANGE 22.4 16.7 7,028 4%ORLEANS 25.4 14.9 9,596 6%RUTLAND 18.8 9.3 17,465 11%WASHINGTON 15.6 8.6 13,930 9%WINDHAM 19.0 10.3 12,738 8%WINDSOR 19.0 14.1 13,446 9%Statewide 17.7 9.6 156,543 100%
COUNTY of Residence
Network (roadway) distance to Attending Provider service location
CY 2015 Medicaid Recipients -- travel time (minutes) for PRIMARY CARE services
COUNTY of Residence
One way travel time to Attending Provider service location
CY 2015 Medicaid Recipients -- distance (miles) for PRIMARY CARE services
0% 20% 40% 60% 80% 100%
ADDISON
BENNINGTON
CALEDONIA
CHITTENDEN
ESSEX
FRANKLIN
GRAND ISLE
LAMOILLE
ORANGE
ORLEANS
RUTLAND
WASHINGTON
WINDHAM
WINDSOR
Statewide
Within Town 15min or less 15‐30 min
30‐45 min more than 45 min
0% 20% 40% 60% 80% 100%
ADDISON
BENNINGTON
CALEDONIA
CHITTENDEN
ESSEX
FRANKLIN
GRAND ISLE
LAMOILLE
ORANGE
ORLEANS
RUTLAND
WASHINGTON
WINDHAM
WINDSOR
Statewide
0 miles 0.1 to 15 miles15 to 30 miles 30 to 60 milesFurther than 60 miles
revised
8/1/2016
Appendix B - Access by County
DRAFT
Pediatric Travel distribution (Time)
Mean Median Recipients %State
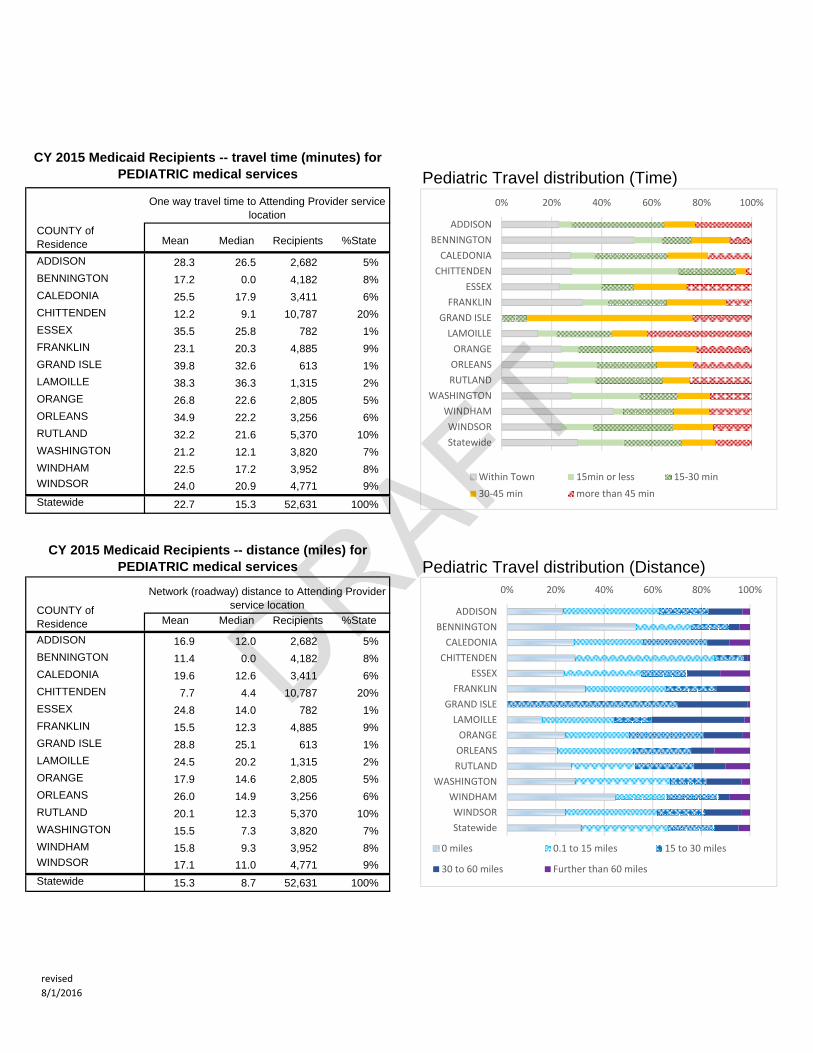
ADDISON 28.3 26.5 2,682 5%BENNINGTON 17.2 0.0 4,182 8%CALEDONIA 25.5 17.9 3,411 6%CHITTENDEN 12.2 9.1 10,787 20%ESSEX 35.5 25.8 782 1%FRANKLIN 23.1 20.3 4,885 9%GRAND ISLE 39.8 32.6 613 1%LAMOILLE 38.3 36.3 1,315 2%ORANGE 26.8 22.6 2,805 5%ORLEANS 34.9 22.2 3,256 6%RUTLAND 32.2 21.6 5,370 10%WASHINGTON 21.2 12.1 3,820 7%WINDHAM 22.5 17.2 3,952 8%WINDSOR 24.0 20.9 4,771 9%Statewide 22.7 15.3 52,631 100%
Pediatric Travel distribution (Distance)
Mean Median Recipients %State
ADDISON 16.9 12.0 2,682 5%BENNINGTON 11.4 0.0 4,182 8%CALEDONIA 19.6 12.6 3,411 6%CHITTENDEN 7.7 4.4 10,787 20%ESSEX 24.8 14.0 782 1%FRANKLIN 15.5 12.3 4,885 9%GRAND ISLE 28.8 25.1 613 1%LAMOILLE 24.5 20.2 1,315 2%ORANGE 17.9 14.6 2,805 5%ORLEANS 26.0 14.9 3,256 6%RUTLAND 20.1 12.3 5,370 10%WASHINGTON 15.5 7.3 3,820 7%WINDHAM 15.8 9.3 3,952 8%WINDSOR 17.1 11.0 4,771 9%Statewide 15.3 8.7 52,631 100%
CY 2015 Medicaid Recipients -- travel time (minutes) for PEDIATRIC medical services
COUNTY of Residence
One way travel time to Attending Provider service location
CY 2015 Medicaid Recipients -- distance (miles) for PEDIATRIC medical services
COUNTY of Residence
Network (roadway) distance to Attending Provider service location
0% 20% 40% 60% 80% 100%
ADDISON
BENNINGTON
CALEDONIA
CHITTENDEN
ESSEX
FRANKLIN
GRAND ISLE
LAMOILLE
ORANGE
ORLEANS
RUTLAND
WASHINGTON
WINDHAM
WINDSOR
Statewide
Within Town 15min or less 15‐30 min
30‐45 min more than 45 min
0% 20% 40% 60% 80% 100%
ADDISON
BENNINGTON
CALEDONIA
CHITTENDEN
ESSEX
FRANKLIN
GRAND ISLE
LAMOILLE
ORANGE
ORLEANS
RUTLAND
WASHINGTON
WINDHAM
WINDSOR
Statewide
0 miles 0.1 to 15 miles 15 to 30 miles
30 to 60 miles Further than 60 miles
revised
8/1/2016
DRAFT
Cardiology Travel distribution (Time)
Mean Median Recipients %State
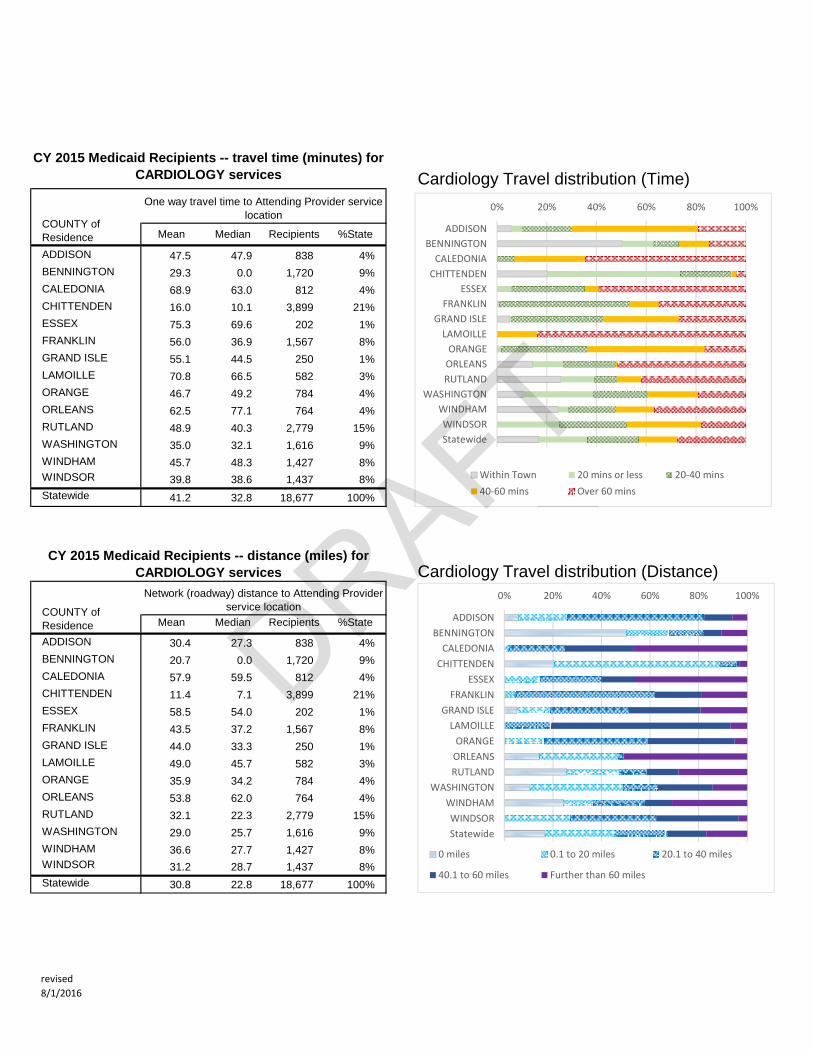
ADDISON 47.5 47.9 838 4%BENNINGTON 29.3 0.0 1,720 9%CALEDONIA 68.9 63.0 812 4%CHITTENDEN 16.0 10.1 3,899 21%ESSEX 75.3 69.6 202 1%FRANKLIN 56.0 36.9 1,567 8%GRAND ISLE 55.1 44.5 250 1%LAMOILLE 70.8 66.5 582 3%ORANGE 46.7 49.2 784 4%ORLEANS 62.5 77.1 764 4%RUTLAND 48.9 40.3 2,779 15%WASHINGTON 35.0 32.1 1,616 9%WINDHAM 45.7 48.3 1,427 8%WINDSOR 39.8 38.6 1,437 8%Statewide 41.2 32.8 18,677 100%
Cardiology Travel distribution (Distance)
Mean Median Recipients %State
ADDISON 30.4 27.3 838 4%BENNINGTON 20.7 0.0 1,720 9%CALEDONIA 57.9 59.5 812 4%CHITTENDEN 11.4 7.1 3,899 21%ESSEX 58.5 54.0 202 1%FRANKLIN 43.5 37.2 1,567 8%GRAND ISLE 44.0 33.3 250 1%LAMOILLE 49.0 45.7 582 3%ORANGE 35.9 34.2 784 4%ORLEANS 53.8 62.0 764 4%RUTLAND 32.1 22.3 2,779 15%WASHINGTON 29.0 25.7 1,616 9%WINDHAM 36.6 27.7 1,427 8%WINDSOR 31.2 28.7 1,437 8%Statewide 30.8 22.8 18,677 100%
CY 2015 Medicaid Recipients -- travel time (minutes) for CARDIOLOGY services
COUNTY of Residence
One way travel time to Attending Provider service location
CY 2015 Medicaid Recipients -- distance (miles) for CARDIOLOGY services
COUNTY of Residence
Network (roadway) distance to Attending Provider service location
0% 20% 40% 60% 80% 100%
ADDISON
BENNINGTON
CALEDONIA
CHITTENDEN
ESSEX
FRANKLIN
GRAND ISLE
LAMOILLE
ORANGE
ORLEANS
RUTLAND
WASHINGTON
WINDHAM
WINDSOR
Statewide
Within Town 20 mins or less 20‐40 mins
40‐60 mins Over 60 mins
0% 20% 40% 60% 80% 100%
ADDISON
BENNINGTON
CALEDONIA
CHITTENDEN
ESSEX
FRANKLIN
GRAND ISLE
LAMOILLE
ORANGE
ORLEANS
RUTLAND
WASHINGTON
WINDHAM
WINDSOR
Statewide
0 miles 0.1 to 20 miles 20.1 to 40 miles
40.1 to 60 miles Further than 60 miles
revised
8/1/2016
DRAFT
Urology Travel distribution (Time)
Mean Median Recipients %State
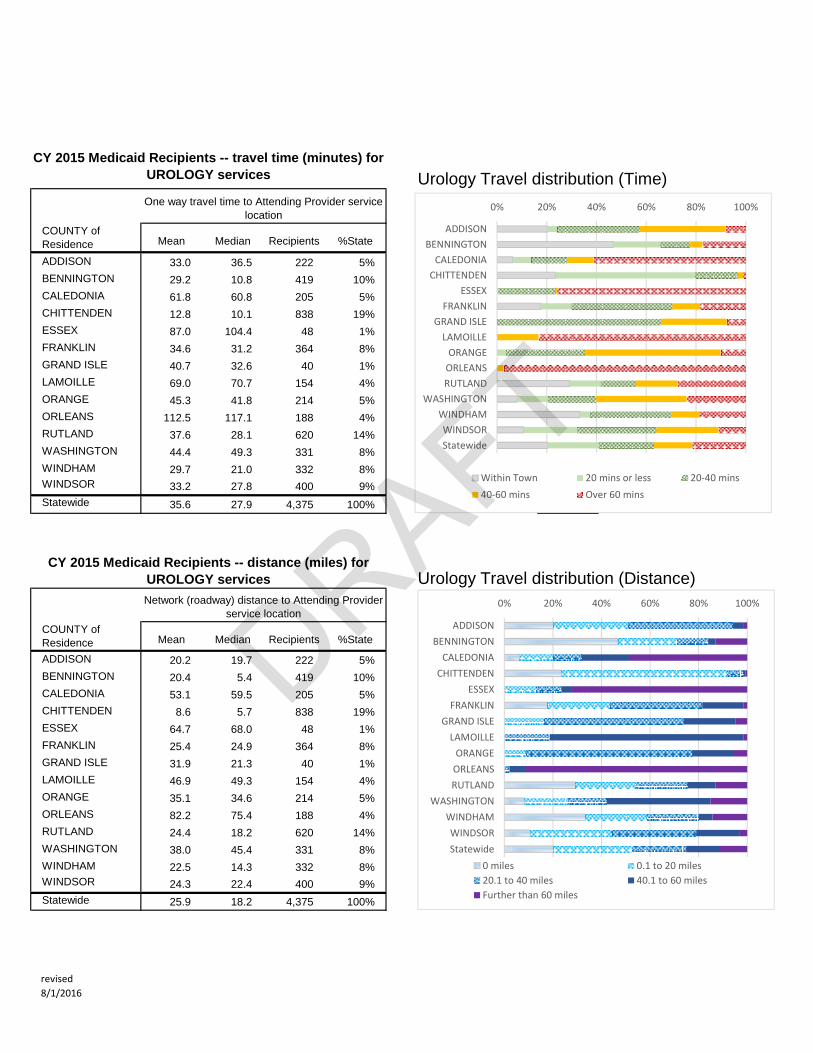
ADDISON 33.0 36.5 222 5%BENNINGTON 29.2 10.8 419 10%CALEDONIA 61.8 60.8 205 5%CHITTENDEN 12.8 10.1 838 19%ESSEX 87.0 104.4 48 1%FRANKLIN 34.6 31.2 364 8%GRAND ISLE 40.7 32.6 40 1%LAMOILLE 69.0 70.7 154 4%ORANGE 45.3 41.8 214 5%ORLEANS 112.5 117.1 188 4%RUTLAND 37.6 28.1 620 14%WASHINGTON 44.4 49.3 331 8%WINDHAM 29.7 21.0 332 8%WINDSOR 33.2 27.8 400 9%Statewide 35.6 27.9 4,375 100%
Urology Travel distribution (Distance)
Mean Median Recipients %State
ADDISON 20.2 19.7 222 5%BENNINGTON 20.4 5.4 419 10%CALEDONIA 53.1 59.5 205 5%CHITTENDEN 8.6 5.7 838 19%ESSEX 64.7 68.0 48 1%FRANKLIN 25.4 24.9 364 8%GRAND ISLE 31.9 21.3 40 1%LAMOILLE 46.9 49.3 154 4%ORANGE 35.1 34.6 214 5%ORLEANS 82.2 75.4 188 4%RUTLAND 24.4 18.2 620 14%WASHINGTON 38.0 45.4 331 8%WINDHAM 22.5 14.3 332 8%WINDSOR 24.3 22.4 400 9%Statewide 25.9 18.2 4,375 100%
CY 2015 Medicaid Recipients -- travel time (minutes) for UROLOGY services
COUNTY of Residence
One way travel time to Attending Provider service location
CY 2015 Medicaid Recipients -- distance (miles) for UROLOGY services
COUNTY of Residence
Network (roadway) distance to Attending Provider service location
0% 20% 40% 60% 80% 100%
ADDISON
BENNINGTON
CALEDONIA
CHITTENDEN
ESSEX
FRANKLIN
GRAND ISLE
LAMOILLE
ORANGE
ORLEANS
RUTLAND
WASHINGTON
WINDHAM
WINDSOR
Statewide
Within Town 20 mins or less 20‐40 mins
40‐60 mins Over 60 mins
0% 20% 40% 60% 80% 100%
ADDISON
BENNINGTON
CALEDONIA
CHITTENDEN
ESSEX
FRANKLIN
GRAND ISLE
LAMOILLE
ORANGE
ORLEANS
RUTLAND
WASHINGTON
WINDHAM
WINDSOR
Statewide
0 miles 0.1 to 20 miles
20.1 to 40 miles 40.1 to 60 miles
Further than 60 miles
revised
8/1/2016
DRAFT
Mean Median Recipients %State
ADDISON 36.4 26.9 1,883 4%BENNINGTON 28.3 10.8 3,228 7%CALEDONIA 38.6 40.3 2,603 6%CHITTENDEN 18.0 12.7 10,373 22%ESSEX 55.0 56.2 490 1%FRANKLIN 24.3 12.7 3,442 7%GRAND ISLE 42.9 32.6 454 1%LAMOILLE 33.1 21.5 1,932 4%ORANGE 39.9 34.7 2,099 4%ORLEANS 30.0 22.8 2,095 4%RUTLAND 29.8 13.6 5,027 11%WASHINGTON 20.8 12.1 4,846 10%WINDHAM 27.9 20.2 4,394 9%WINDSOR 34.6 32.9 4,297 9%Statewide 27.0 16.4 47,163 100%
Mean Median Recipients %State
ADDISON 23.1 14.7 1,883 4%BENNINGTON 17.6 5.4 3,228 7%CALEDONIA 30.3 29.5 2,603 6%CHITTENDEN 12.8 7.7 10,373 22%ESSEX 41.4 41.9 490 1%FRANKLIN 15.4 8.8 3,442 7%GRAND ISLE 31.2 25.1 454 1%LAMOILLE 19.7 10.7 1,932 4%ORANGE 30.2 19.9 2,099 4%ORLEANS 20.6 15.7 2,095 4%RUTLAND 19.9 7.5 5,027 11%WASHINGTON 14.9 7.3 4,846 10%WINDHAM 22.2 14.3 4,394 9%WINDSOR 28.5 19.2 4,297 9%Statewide 18.9 8.8 47,163 100%
CY 2015 Medicaid Recipients -- travel time (minutes) for BEHAVIORAL, MENTAL HEALTH & SUBSTANCE
ABUSE services
COUNTY of Residence
One way travel time to Attending Provider service location
CY 2015 Medicaid Recipients -- distance (miles) for BEHAVIORAL, MENTAL HEALTH & SUBSTANCE
ABUSE services
COUNTY of Residence
Network (roadway) distance to Attending Provider service location
Behavioral, Mental Health & Substance Abuse Travel distribution (Time)
Behavioral, Mental Health & Substance Abuse Travel distribution (Distance)
0% 20% 40% 60% 80% 100%
ADDISON
BENNINGTON
CALEDONIA
CHITTENDEN
ESSEX
FRANKLIN
GRAND ISLE
LAMOILLE
ORANGE
ORLEANS
RUTLAND
WASHINGTON
WINDHAM
WINDSOR
Statewide
Within Town 20 mins or less 20‐40 mins
40‐60 mins Over 60 mins
0% 20% 40% 60% 80% 100%
ADDISON
BENNINGTON
CALEDONIA
CHITTENDEN
ESSEX
FRANKLIN
GRAND ISLE
LAMOILLE
ORANGE
ORLEANS
RUTLAND
WASHINGTON
WINDHAM
WINDSOR
Statewide
0 miles 0.1 to 20 miles
20.1 to 40 miles 40.1 to 60 miles
Further than 60 miles
revised
8/1/2016
DRAFT
Obstetrics Travel distribution (Time)
Mean Median Recipients %State
ADDISON 31.0 26.9 1,319 6%BENNINGTON 42.0 14.5 1,614 7%CALEDONIA 26.8 20.5 1,273 6%CHITTENDEN 17.4 12.7 4,142 19%ESSEX 49.2 39.5 247 1%FRANKLIN 32.0 31.2 1,625 7%GRAND ISLE 41.1 32.6 206 1%LAMOILLE 25.3 18.0 1,423 6%ORANGE 31.8 30.5 1,034 5%ORLEANS 31.1 22.2 1,468 7%RUTLAND 38.5 27.1 2,866 13%WASHINGTON 31.1 25.0 1,823 8%WINDHAM 28.9 20.2 1,842 8%WINDSOR 33.0 27.8 1,490 7%Statewide 29.9 21.5 22,372 100%
Obstetrics Travel distribution (Distance)
Mean Median Recipients %State
ADDISON 18.5 14.7 1,319 6%BENNINGTON 29.0 7.9 1,614 7%CALEDONIA 19.8 14.7 1,273 6%CHITTENDEN 11.8 7.7 4,142 19%ESSEX 34.7 23.3 247 1%FRANKLIN 21.4 19.7 1,625 7%GRAND ISLE 29.4 22.4 206 1%LAMOILLE 15.0 9.3 1,423 6%ORANGE 22.3 16.1 1,034 5%ORLEANS 21.8 13.7 1,468 7%RUTLAND 24.0 17.0 2,866 13%WASHINGTON 22.2 13.6 1,823 8%WINDHAM 21.0 14.3 1,842 8%WINDSOR 25.1 19.2 1,490 7%Statewide 20.3 12.6 22,372 100%
CY 2015 Medicaid Recipients -- travel time (minutes) for OBSTETRIC services
CY 2015 Medicaid Recipients -- distance (miles) for OBSTETRIC services
COUNTY of Residence
One way travel time to Attending Provider service location
COUNTY of Residence
Network (roadway) distance to Attending Provider service location
0% 20% 40% 60% 80% 100%
ADDISON
BENNINGTON
CALEDONIA
CHITTENDEN
ESSEX
FRANKLIN
GRAND ISLE
LAMOILLE
ORANGE
ORLEANS
RUTLAND
WASHINGTON
WINDHAM
WINDSOR
Statewide
Within Town 20 mins or less 20‐40 mins
40‐60 mins Over 60 mins
0% 20% 40% 60% 80% 100%
ADDISON
BENNINGTON
CALEDONIA
CHITTENDEN
ESSEX
FRANKLIN
GRAND ISLE
LAMOILLE
ORANGE
ORLEANS
RUTLAND
WASHINGTON
WINDHAM
WINDSOR
Statewide
0 miles 0.1 to 20 miles
20.1 to 40 miles 40.1 to 60 miles
Further than 60 miles
revised
8/1/2016
DRAFT

Dental Travel distribution (Time)
Mean Median Recipients %State
ADDISON 27.4 26.9 4,008 5%BENNINGTON 17.8 14.0 4,908 7%CALEDONIA 25.6 17.9 4,976 7%CHITTENDEN 13.4 9.7 15,607 21%ESSEX 37.9 30.2 1,082 1%FRANKLIN 27.2 24.8 5,691 8%GRAND ISLE 34.6 27.4 866 1%LAMOILLE 31.3 21.5 3,587 5%ORANGE 37.3 34.9 3,129 4%ORLEANS 27.8 22.2 5,215 7%RUTLAND 23.1 18.9 8,190 11%WASHINGTON 24.7 15.3 6,797 9%WINDHAM 29.6 27.7 4,985 7%WINDSOR 31.1 26.7 5,062 7%Statewide 24.1 17.7 74,103 100%
Dental Travel distribution (Distance)
Mean Median Recipients %State
ADDISON 15.8 14.7 4,008 5%BENNINGTON 10.5 7.3 4,908 7%CALEDONIA 18.4 12.6 4,976 7%CHITTENDEN 8.3 5.0 15,607 21%ESSEX 25.1 20.4 1,082 1%FRANKLIN 17.4 11.9 5,691 8%GRAND ISLE 25.2 20.1 866 1%LAMOILLE 18.5 10.7 3,587 5%ORANGE 25.2 21.9 3,129 4%ORLEANS 18.1 14.1 5,215 7%RUTLAND 13.8 9.1 8,190 11%WASHINGTON 17.2 10.4 6,797 9%WINDHAM 18.3 16.5 4,985 7%WINDSOR 21.2 16.8 5,062 7%Statewide 15.5 9.6 74,103 100%
CY 2015 Medicaid Recipients -- travel time (minutes) for DENTAL services
COUNTY of Residence
One way travel time to Attending Provider service location
CY 2015 Medicaid Recipients -- distance (miles) for DENTAL services
COUNTY of Residence
Network (roadway) distance to Attending Provider service location
0% 20% 40% 60% 80% 100%
ADDISON
BENNINGTON
CALEDONIA
CHITTENDEN
ESSEX
FRANKLIN
GRAND ISLE
LAMOILLE
ORANGE
ORLEANS
RUTLAND
WASHINGTON
WINDHAM
WINDSOR
Statewide
Within Town 20 mins or less 20‐40 mins
40‐60 mins Over 60 mins
0% 20% 40% 60% 80% 100%
ADDISON
BENNINGTON
CALEDONIA
CHITTENDEN
ESSEX
FRANKLIN
GRAND ISLE
LAMOILLE
ORANGE
ORLEANS
RUTLAND
WASHINGTON
WINDHAM
WINDSOR
Statewide
0 miles 0.1 to 20 miles20.1 to 40 miles 40.1 to 60 milesFurther than 60 miles
revised
8/1/2016
DRAFT
Mean Median Recipients %State
ADDISON 30.4 26.9 1,593 5%BENNINGTON 30.0 13.8 1,955 6%CALEDONIA 32.7 26.7 2,342 7%CHITTENDEN 20.1 14.8 5,322 16%ESSEX 54.6 39.5 540 2%FRANKLIN 41.2 39.8 2,896 9%GRAND ISLE 53.8 34.2 360 1%LAMOILLE 55.3 57.5 1,442 4%ORANGE 36.2 34.3 1,618 5%ORLEANS 46.0 28.3 2,264 7%RUTLAND 39.3 27.1 3,780 11%WASHINGTON 33.6 34.5 2,929 9%WINDHAM 26.4 20.2 2,639 8%WINDSOR 24.6 20.9 3,258 10%Statewide 33.2 23.5 32,938 100%
Mean Median Recipients %State
ADDISON 18.3 14.7 1,593 5%BENNINGTON 20.4 7.1 1,955 6%CALEDONIA 24.4 18.7 2,342 7%CHITTENDEN 13.6 8.0 5,322 16%ESSEX 39.0 23.3 540 2%FRANKLIN 24.5 22.2 2,896 9%GRAND ISLE 38.9 26.3 360 1%LAMOILLE 35.2 37.1 1,442 4%ORANGE 25.5 21.1 1,618 5%ORLEANS 35.5 16.4 2,264 7%RUTLAND 25.7 17.0 3,780 11%WASHINGTON 25.7 23.4 2,929 9%WINDHAM 18.7 12.0 2,639 8%WINDSOR 17.8 12.0 3,258 10%Statewide 22.8 14.6 32,938 100%
COUNTY of Residence
Network (roadway) distance to Attending Provider service location
Ophthalmology, Optometry Travel distribution (Time)
Ophthalmology, Optometry Travel distribution (Distance)
CY 2015 Medicaid Recipients: travel time (minutes) for OPHTHALMOLOGY - OPTOMETRY services
COUNTY of Residence
One way travel time to Attending Provider service location
CY 2015 Medicaid Recipients: distance (miles) for OPHTHALMOLOGY - OPTOMETRY services
0% 20% 40% 60% 80% 100%
ADDISON
BENNINGTON
CALEDONIA
CHITTENDEN
ESSEX
FRANKLIN
GRAND ISLE
LAMOILLE
ORANGE
ORLEANS
RUTLAND
WASHINGTON
WINDHAM
WINDSOR
Statewide
Within Town 20 mins or less 20‐40 mins
40‐60 mins Over 60 mins
0% 20% 40% 60% 80% 100%
ADDISON
BENNINGTON
CALEDONIA
CHITTENDEN
ESSEX
FRANKLIN
GRAND ISLE
LAMOILLE
ORANGE
ORLEANS
RUTLAND
WASHINGTON
WINDHAM
WINDSOR
Statewide
0 miles 0.1 to 20 miles
20.1 to 40 miles 40.1 to 60 milesFurther than 60 miles
revised
8/1/2016
DRAFT
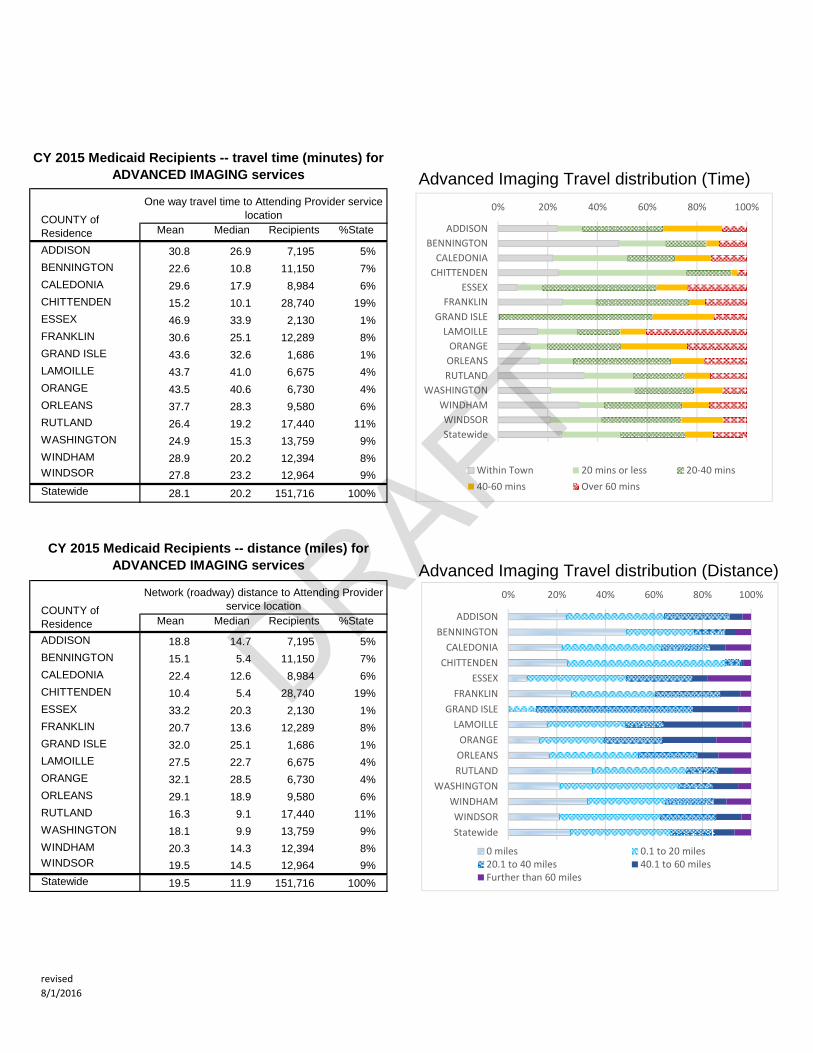
Advanced Imaging Travel distribution (Time)
Mean Median Recipients %State
ADDISON 30.8 26.9 7,195 5%BENNINGTON 22.6 10.8 11,150 7%CALEDONIA 29.6 17.9 8,984 6%CHITTENDEN 15.2 10.1 28,740 19%ESSEX 46.9 33.9 2,130 1%FRANKLIN 30.6 25.1 12,289 8%GRAND ISLE 43.6 32.6 1,686 1%LAMOILLE 43.7 41.0 6,675 4%ORANGE 43.5 40.6 6,730 4%ORLEANS 37.7 28.3 9,580 6%RUTLAND 26.4 19.2 17,440 11%WASHINGTON 24.9 15.3 13,759 9%WINDHAM 28.9 20.2 12,394 8%WINDSOR 27.8 23.2 12,964 9%Statewide 28.1 20.2 151,716 100%
Mean Median Recipients %State
ADDISON 18.8 14.7 7,195 5%BENNINGTON 15.1 5.4 11,150 7%CALEDONIA 22.4 12.6 8,984 6%CHITTENDEN 10.4 5.4 28,740 19%ESSEX 33.2 20.3 2,130 1%FRANKLIN 20.7 13.6 12,289 8%GRAND ISLE 32.0 25.1 1,686 1%LAMOILLE 27.5 22.7 6,675 4%ORANGE 32.1 28.5 6,730 4%ORLEANS 29.1 18.9 9,580 6%RUTLAND 16.3 9.1 17,440 11%WASHINGTON 18.1 9.9 13,759 9%WINDHAM 20.3 14.3 12,394 8%WINDSOR 19.5 14.5 12,964 9%Statewide 19.5 11.9 151,716 100%
Advanced Imaging Travel distribution (Distance)
CY 2015 Medicaid Recipients -- travel time (minutes) for ADVANCED IMAGING services
COUNTY of Residence
One way travel time to Attending Provider service location
CY 2015 Medicaid Recipients -- distance (miles) for ADVANCED IMAGING services
COUNTY of Residence
Network (roadway) distance to Attending Provider service location
0% 20% 40% 60% 80% 100%
ADDISON
BENNINGTON
CALEDONIA
CHITTENDEN
ESSEX
FRANKLIN
GRAND ISLE
LAMOILLE
ORANGE
ORLEANS
RUTLAND
WASHINGTON
WINDHAM
WINDSOR
Statewide
Within Town 20 mins or less 20‐40 mins
40‐60 mins Over 60 mins
0% 20% 40% 60% 80% 100%
ADDISON
BENNINGTON
CALEDONIA
CHITTENDEN
ESSEX
FRANKLIN
GRAND ISLE
LAMOILLE
ORANGE
ORLEANS
RUTLAND
WASHINGTON
WINDHAM
WINDSOR
Statewide
0 miles 0.1 to 20 miles20.1 to 40 miles 40.1 to 60 milesFurther than 60 miles
revised
8/1/2016
DRAFT
Pharmacy Travel distribution (Time)
Mean Median Recipients %State
ADDISON 17.6 12.3 6,907 5%BENNINGTON 10.6 0.0 10,131 7%CALEDONIA 14.2 0.0 7,913 6%CHITTENDEN 9.2 0.0 26,278 19%ESSEX 29.3 24.5 1,865 1%FRANKLIN 15.6 0.0 11,010 8%GRAND ISLE 27.9 30.7 1,544 1%LAMOILLE 20.2 15.3 5,703 4%ORANGE 21.5 18.7 6,117 4%ORLEANS 19.9 13.2 8,257 6%RUTLAND 15.3 3.8 16,054 12%WASHINGTON 13.5 4.7 11,992 9%WINDHAM 14.3 0.0 11,088 8%WINDSOR 16.7 9.6 11,812 9%Statewide 14.8 7.8 136,671 100%
Pharmacy Travel distribution (Distance)
Mean Median Recipients %State
ADDISON 10.2 7.5 6,907 5%BENNINGTON 6.4 0.0 10,131 7%CALEDONIA 9.9 0.0 7,913 6%CHITTENDEN 6.1 0.0 26,278 19%ESSEX 18.6 13.9 1,865 1%FRANKLIN 9.8 0.0 11,010 8%GRAND ISLE 19.2 21.3 1,544 1%LAMOILLE 11.6 8.3 5,703 4%ORANGE 13.2 9.1 6,117 4%ORLEANS 13.0 7.3 8,257 6%RUTLAND 9.0 1.7 16,054 12%WASHINGTON 9.3 2.3 11,992 9%WINDHAM 9.7 0.0 11,088 8%WINDSOR 11.2 5.4 11,812 9%Statewide 9.4 3.7 136,671 100%
CY 2015 Medicaid Recipients -- travel time (minutes) for PHARMACY
COUNTY of Residence
One way travel time to Pharmacy
CY 2015 Medicaid Recipients -- distance (miles) for PHARMACY
COUNTY of Residence
Network (roadway) distance to Pharmacy
0% 20% 40% 60% 80% 100%
ADDISON
BENNINGTON
CALEDONIA
CHITTENDEN
ESSEX
FRANKLIN
GRAND ISLE
LAMOILLE
ORANGE
ORLEANS
RUTLAND
WASHINGTON
WINDHAM
WINDSOR
Statewide
Within Town 20 mins or less 20‐40 mins
40‐60 mins Over 60 mins
0% 20% 40% 60% 80% 100%
ADDISON
BENNINGTON
CALEDONIA
CHITTENDEN
ESSEX
FRANKLIN
GRAND ISLE
LAMOILLE
ORANGE
ORLEANS
RUTLAND
WASHINGTON
WINDHAM
WINDSOR
Statewide
0 miles 0.1 to 20 miles
20.1 to 40 miles 40.1 to 60 milesFurther than 60 miles
revised
8/1/2016
DRAFT
Gr a
f to
n
Gr a
f to
n
R u t l a n dR u t l a n d
Win
ds
or
Win
ds
or
Es
se
xE
ss
ex
A d d i s o nA d d i s o n
O r a n g eO r a n g e
O r l e a n sO r l e a n s
Wi n
d h a m
Wi n
d h a m
F r a n k l i nF r a n k l i n
C h e s h i r es h i r e
Ca l e
d o n i a
Ca l e
d o n i a
Su
l li v
an
Su
l li v
an
W a s h i n g t o n
W a s h i n g t o n
Be
nn
i ng
t on
Be
nn
i ng
t on
M e r r i m a c k
M e r r i m a c k
F r a n k l i nF r a n k l i n
C h i t t e n d e nC h i t t e n d e n
L a m o i l l eL a m o i l l e
Hi l l s b o r o u g h
Hi l l s b o r o u g h
Wa
sh
ing
ton
Wa
sh
ing
ton
Es
se
xE
ss
ex
W o r c e s t e rW o r c e s t e rB e r k s h i r eB e r k s h i r e
Gra
nd
Is
l eG
r an
d I
sl e
Re
ns
se
l ae
rR
en
ss
el a
er
Cl i
nt o
nC
l in
t on
C o o sC o o s
M i d d l e s e xM i d d l e s e x
B e l k n a pB e l k n a p
H a m p s h i r eH a m p s h i r e
§̈¦89
Troy
Eden
Peru
Derby
EssexStowe
Cabot
Barre
Wells
Danby
Barton
Granby
Morgan
Norton
Gilman
Sutton
Lyndon
Glover
Barnet
Groton
Ripton
Milton
Moscow
Calais
Albany
Warren
Pawlet
Rupert
Benson
Orwell
Pownal
Putney
Ludlow
Dorset
Weston
Vernon
Wilder
Sharon
Bethel
Concord
Orleans
Newport Averill
Newbury
Fairlee
Jericho
Alburgh
Hancock
Sheldon
Fairfax
Monkton
Swanton
Wolcott
Johnson
Bristol
Adamant
Roxbury
Topsham
Chelsea
Corinth
Whiting
Brandon
Proctor
Belmont
Jamaica
Newfane
Rutland
Windsor
Reading
Chester
Quechee
Norwich
Grafton
Barnard
Bradford
Shoreham
Bridport
Hardwick
Coventry
Woodbury
Moretown
Westford
Richmond
RichfordFranklin
Winooski
VershireRandolph
Bomoseen
Poultney
Florence
Marlboro
Stamford
Thetford
Hartland
Ascutney
Hartford
Plymouth
Sheffield Guildhall
Lunenburg
Westfield
Salisbury
Cambridge
Waterbury
New Haven
HinesburgShelburne
Granville
Underhill
Williston
Charlotte
Vergennes
Fairfield
TunbridgeRochester
Castleton
Bondville
Wardsboro
Hydeville
Readsboro
Arlington
Woodstock
Gaysville
Strafford
Cavendish
East Burke
East Haven
Passumpsic
Derby Line
Craftsbury
North Troy
Greensboro
Middlebury
Northfield
Washington
MontpelierMontpelier
Burlington
Huntington
Starksboro
Montgomery
North Hero
Colchester
Marshfield
Waterville
Plainfield
Eden Mills
East Barre
Brookfield
Pittsfield
Wilmington
East Dover
Whitingham
Killington
BenningtonWest Dover
Shaftsbury
Manchester
Taftsville
Post Mills
Lyndonville
Beebe Plain
Island Pond
Wells River
West Glover
Bakersfield
Lake ElmoreMorrisville
Ferrisburgh
Wallingford
Stockbridge
West Pawlet
West RupertEast Dorset
Forest Dale
Westminster
Brattleboro
Springfield
Londonderry
West Newbury
East Ryegate
Websterville
Saint Albans
Williamstown East Corinth
Perkinsville
West HalifaxJacksonville
East Thetford
Lyndon Center
West Danville
Isle la Motte
East Randolph
Williamsville
Cuttingsville
Bellows Falls
South Newfane
East Poultney
Proctorsville
Saxtons River
South PomfretWest Hartford
Chester Depot
North Thetford
Mc Indoe Falls
Newport Center
Enosburg Falls
Jeffersonville
East Fairfield
East Berkshire
West Townshend
West Wardsboro
North Hartland
East Charleston
Lower Waterford
West Charleston
Saint Johnsbury
East Middlebury
Sheldon Springs
Highgate Center
Randolph Center
North Clarendon South Woodstock
South Strafford
Belvidere Center
Underhill Center
Waterbury Center
Highgate Springs
North Montpelier
East Wallingford
North Bennington
Montgomery Center
North Ferrisburgh
South Londonderry
Westminster Station
Bridgewater CornersWhite River Junction
£¤202UV2
C o oo
ZipCodeOriginsPost Office or large volume customerZIP Code Area
Massachusetts
New Hampshire
New York
Vermont
§̈¦93
§̈¦91
§̈¦91
§̈¦89
Appendix C - Vermont Residential Zip Codes
DRAFT
Recommended


![State of Vermont blueprintforhealth.vermont · Vermont Blueprint for Health [Phone] 802-241-0231 NOB 1 South, 280 State Dr. [Fax] 802-241-0269 Waterbury VT 05671-1010 blueprintforhealth.vermont.gov](https://img.pdfslide.net/doc/110x75/5ec654ec0568cd01557f6753/state-of-vermont-vermont-blueprint-for-health-phone-802-241-0231-nob-1-south.jpg)