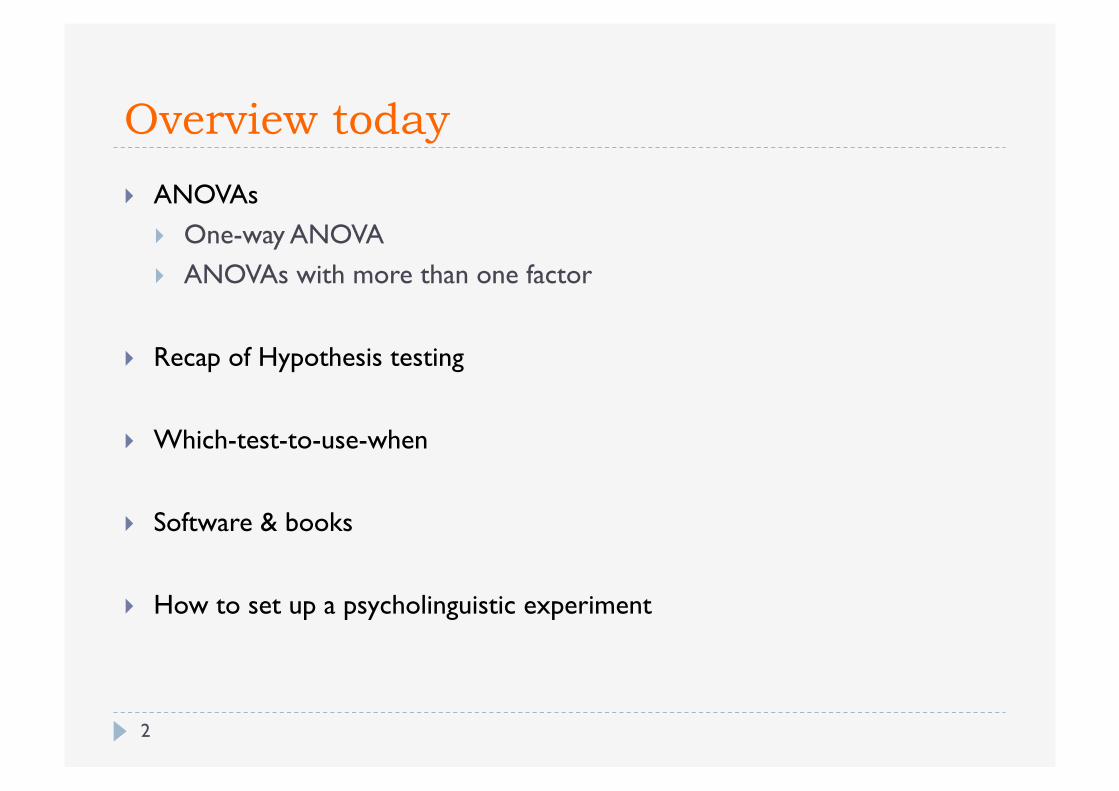
Overview today
ANOVAs One-way ANOVA ANOVAs with more than one factor
Recap of Hypothesis testing
Which-test-to-use-when
Software & books
How to set up a psycholinguistic experiment
2
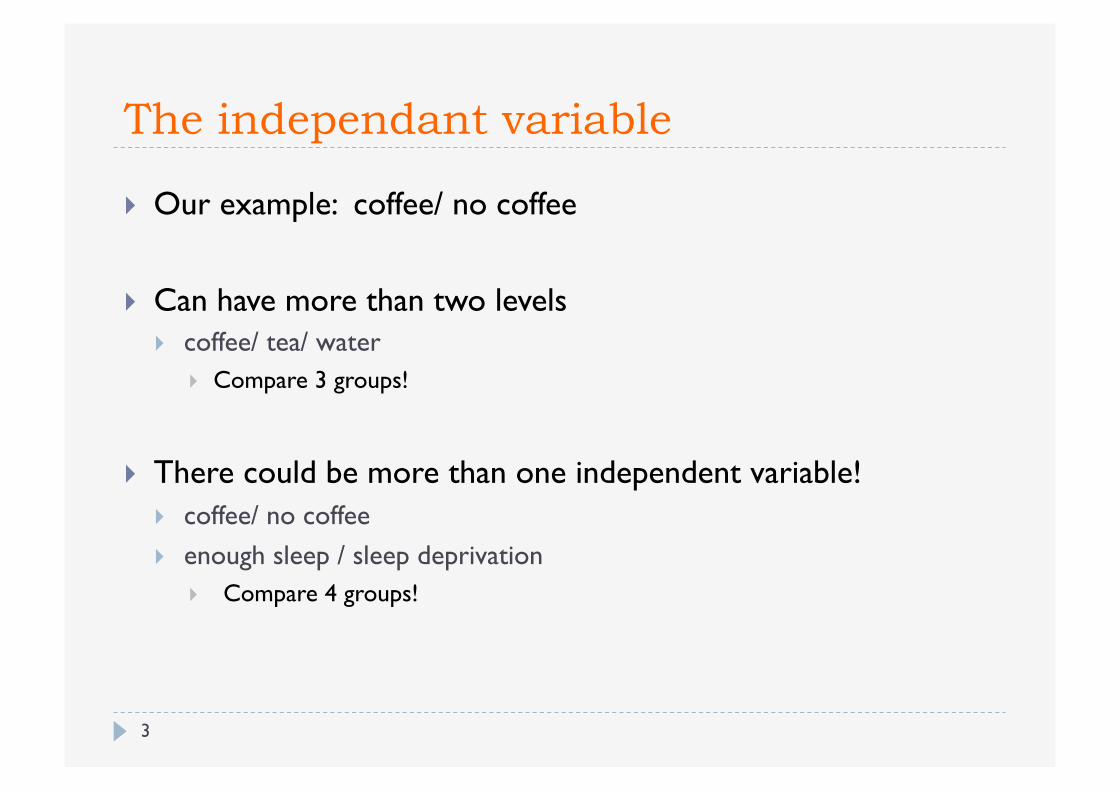
The independant variable
Our example: coffee/ no coffee
Can have more than two levels coffee/ tea/ water
Compare 3 groups!
There could be more than one independent variable! coffee/ no coffee enough sleep / sleep deprivation
Compare 4 groups!
3
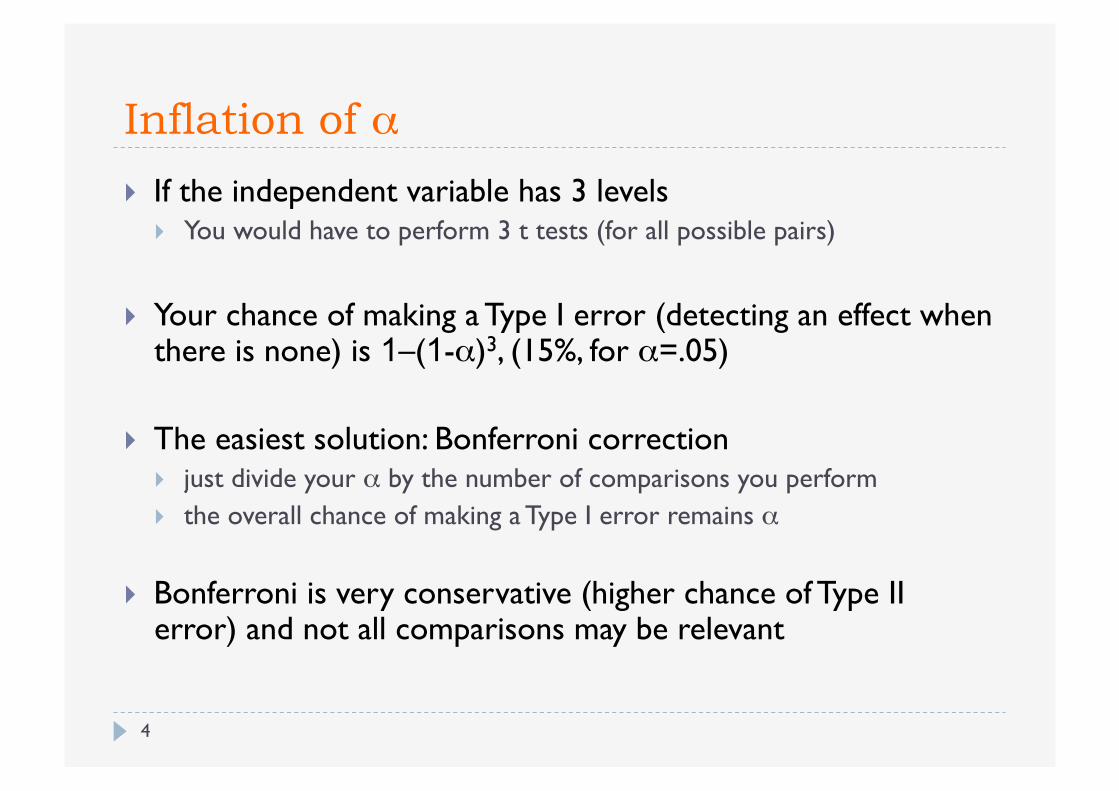
Inflation of α
If the independent variable has 3 levels You would have to perform 3 t tests (for all possible pairs)
Your chance of making a Type I error (detecting an effect when there is none) is 1–(1-α)3, (15%, for α=.05)
The easiest solution: Bonferroni correction just divide your α by the number of comparisons you perform the overall chance of making a Type I error remains α
Bonferroni is very conservative (higher chance of Type II error) and not all comparisons may be relevant
4
One-way ANOVA
Alternative strategy First test for an overall effect of the variable Only test the relevant pairs
Use analysis of variance (ANOVA)
5
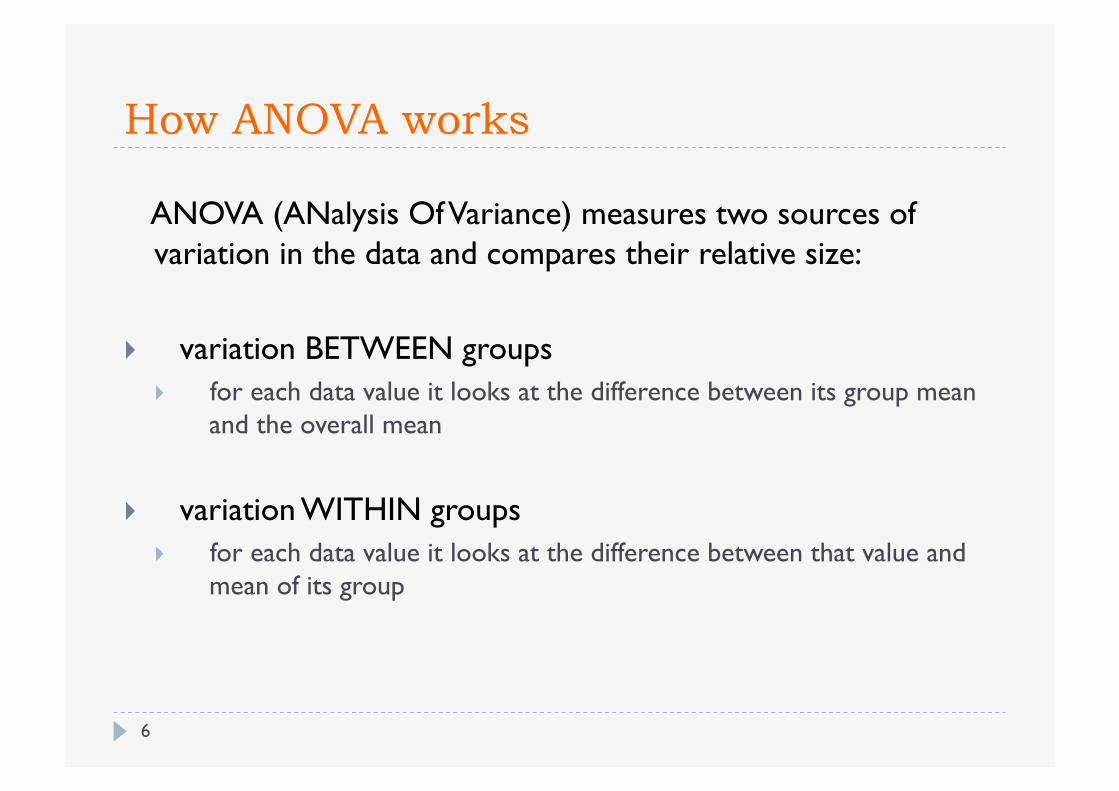
How ANOVA works
6
ANOVA (ANalysis Of Variance) measures two sources of variation in the data and compares their relative size:
variation BETWEEN groups for each data value it looks at the difference between its group mean
and the overall mean
variation WITHIN groups for each data value it looks at the difference between that value and
mean of its group
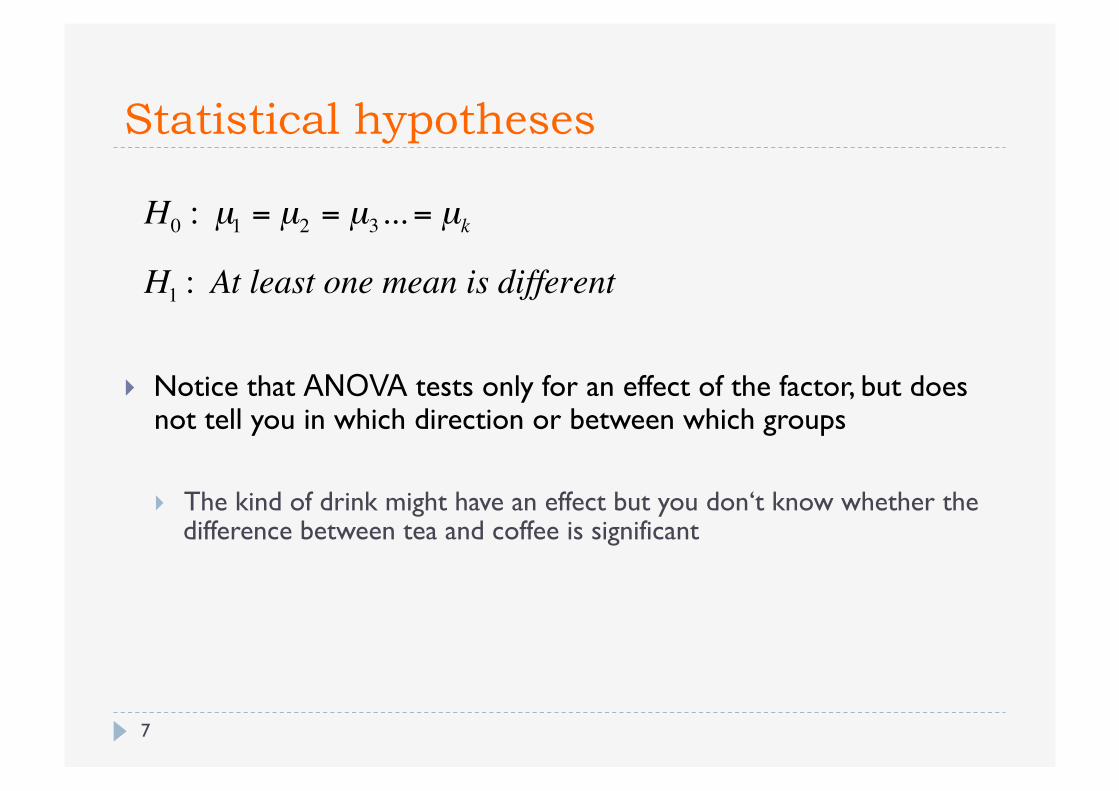
Statistical hypotheses
7
Notice that ANOVA tests only for an effect of the factor, but does not tell you in which direction or between which groups
The kind of drink might have an effect but you don‘t know whether the difference between tea and coffee is significant
€
H0 : µ1 = µ2 = µ3... = µk H1 : At least one mean is different
Statistical hypotheses
8
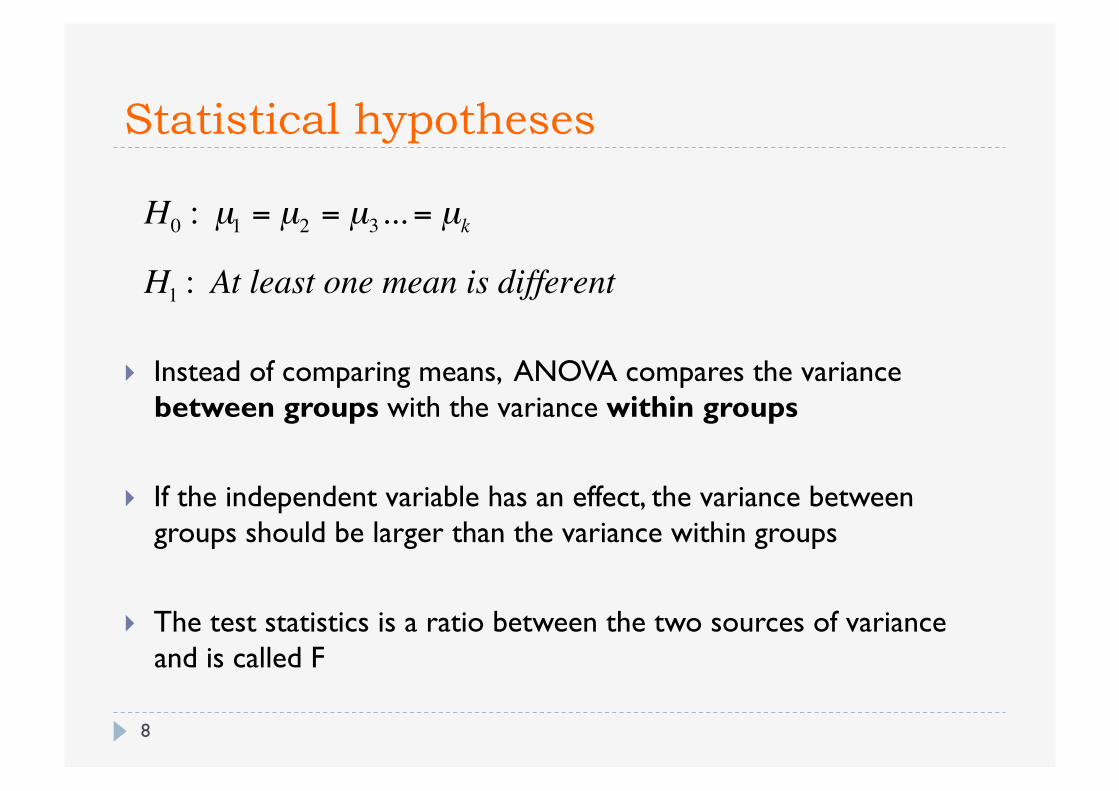
Instead of comparing means, ANOVA compares the variance between groups with the variance within groups
If the independent variable has an effect, the variance between groups should be larger than the variance within groups
The test statistics is a ratio between the two sources of variance and is called F
€
H0 : µ1 = µ2 = µ3... = µk H1 : At least one mean is different
How ANOVA works
9
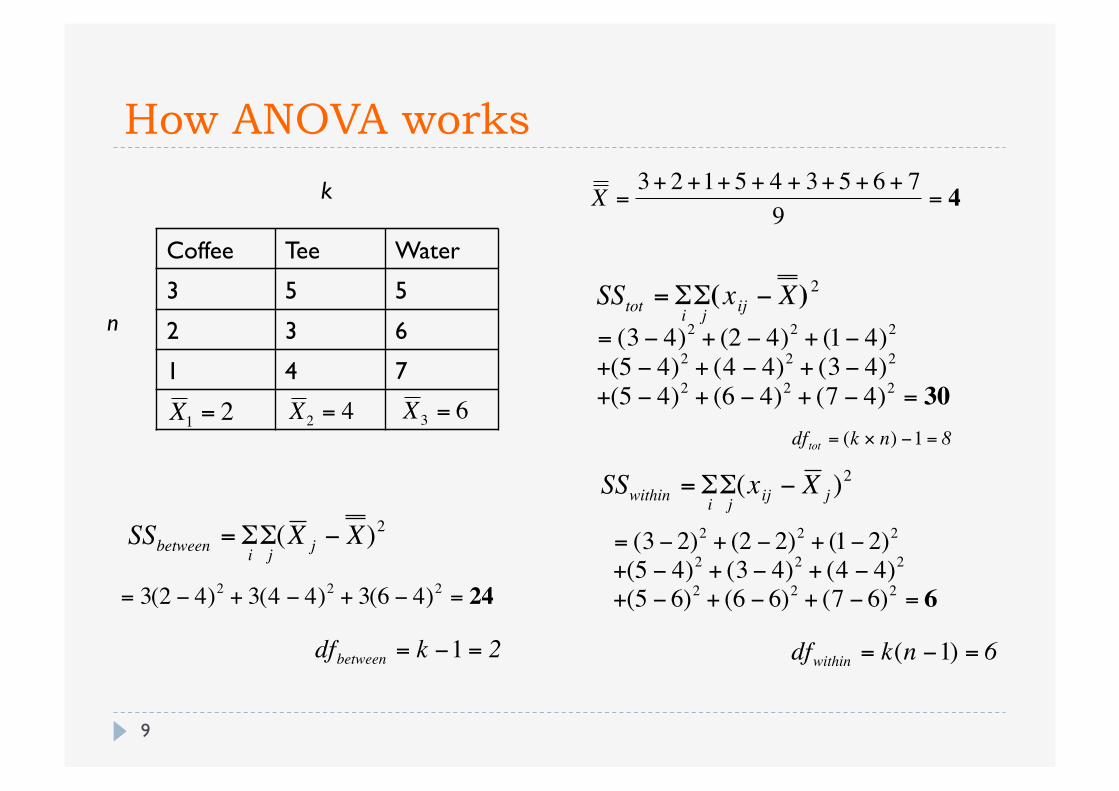
Coffee Tee Water
3 5 5
2 3 6
1 4 7
€
X 1 = 2
€
X 2 = 4
€
X 3 = 6
€
X = 3+ 2 +1+ 5 + 4 + 3+ 5 + 6 + 79
= 4
€
= (3 − 4)2 + (2 − 4)2 + (1− 4)2+(5 − 4)2 + (4 − 4)2 + (3 − 4)2+(5 − 4)2 + (6 − 4)2 + (7 − 4)2 = 30
€
dftot = (k × n) −1 = 8
€
= (3 − 2)2 + (2 − 2)2 + (1− 2)2+(5 − 4)2 + (3 − 4)2 + (4 − 4)2+(5 − 6)2 + (6 − 6)2 + (7 − 6)2 = 6
€
dfwithin = k(n −1) = 6
€
= 3(2 − 4)2 + 3(4 − 4)2 + 3(6 − 4)2 = 24
€
dfbetween = k −1 = 2
€
SStot = ΣiΣj(xij − X)
2
€
SSwithin = ΣiΣj(xij − X j )
2
k
n
€
SSbetween = ΣiΣj(X j − X)2
How ANOVA works
10
€
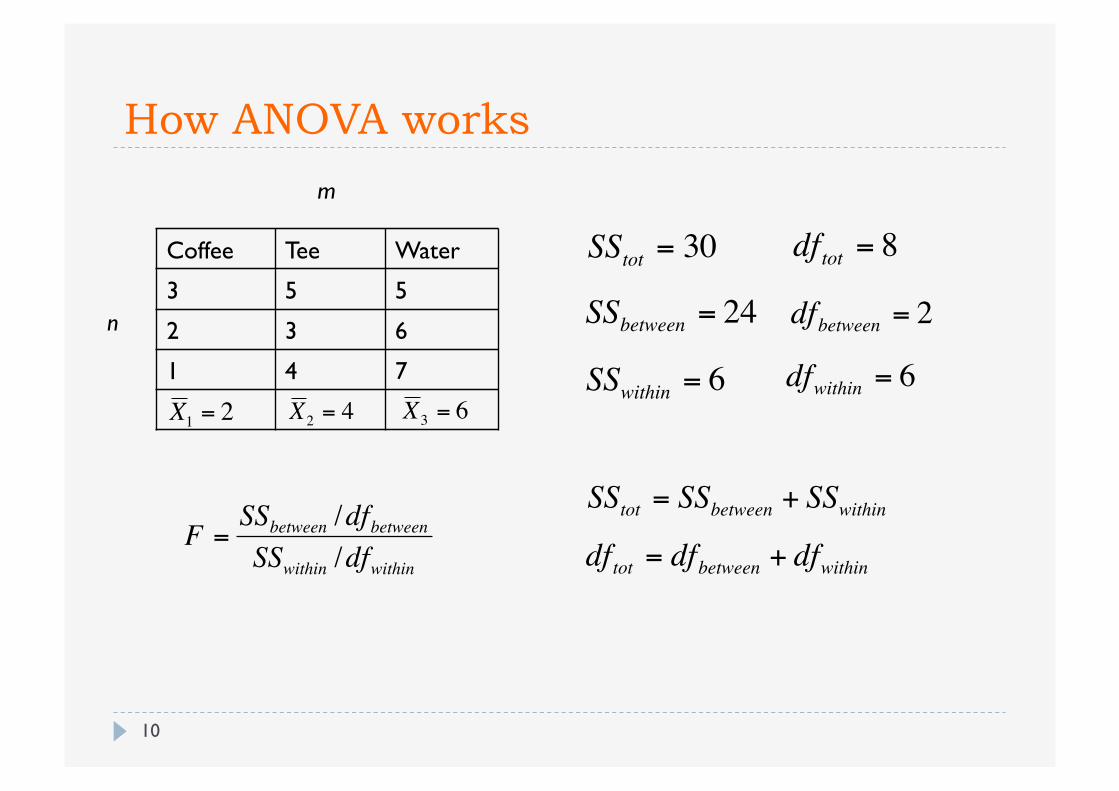
SStot = SSbetween + SSwithin
Coffee Tee Water
3 5 5
2 3 6
1 4 7
m
n
€
SStot = 30
€
dftot = 8
€
SSwithin = 6
€
dfwithin = 6
€
SSbetween = 24
€
dfbetween = 2
€
X 1 = 2
€
X 2 = 4
€
X 3 = 6
€
dftot = dfbetween + dfwithin
€
F =SSbetween /dfbetweenSSwithin /dfwithin
F ratio
11
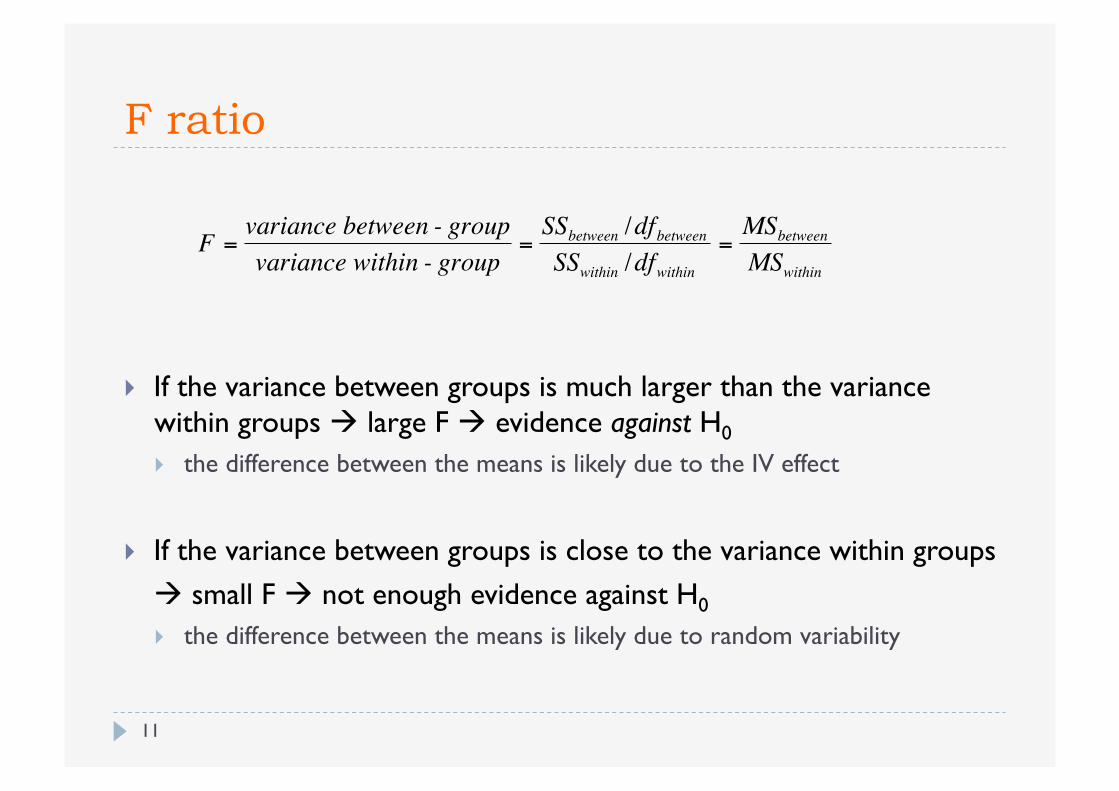
If the variance between groups is much larger than the variance within groups large F evidence against H0 the difference between the means is likely due to the IV effect
If the variance between groups is close to the variance within groups small F not enough evidence against H0 the difference between the means is likely due to random variability
€
F =variance between - groupvariance within - group
=SSbetween /dfbetween
SSwithin /dfwithin
=MSbetween
MSwithin
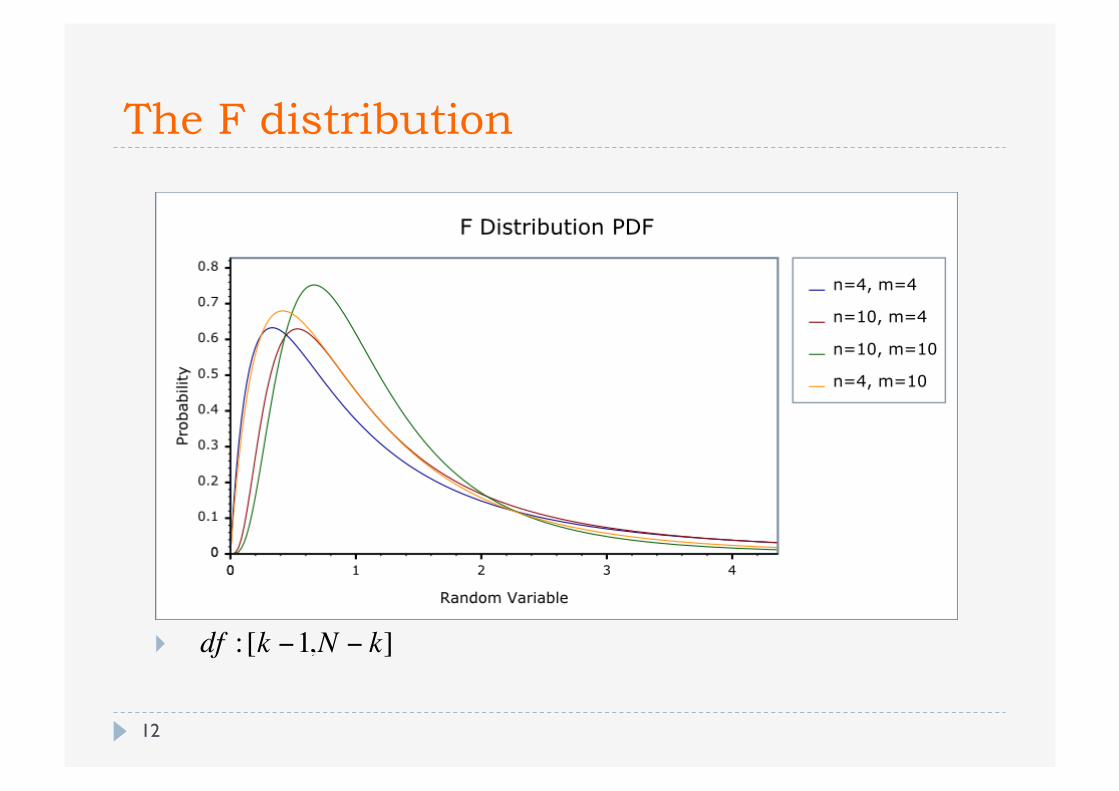
The F distribution
12
€
df : [k −1,N − k]
Back to the example
13
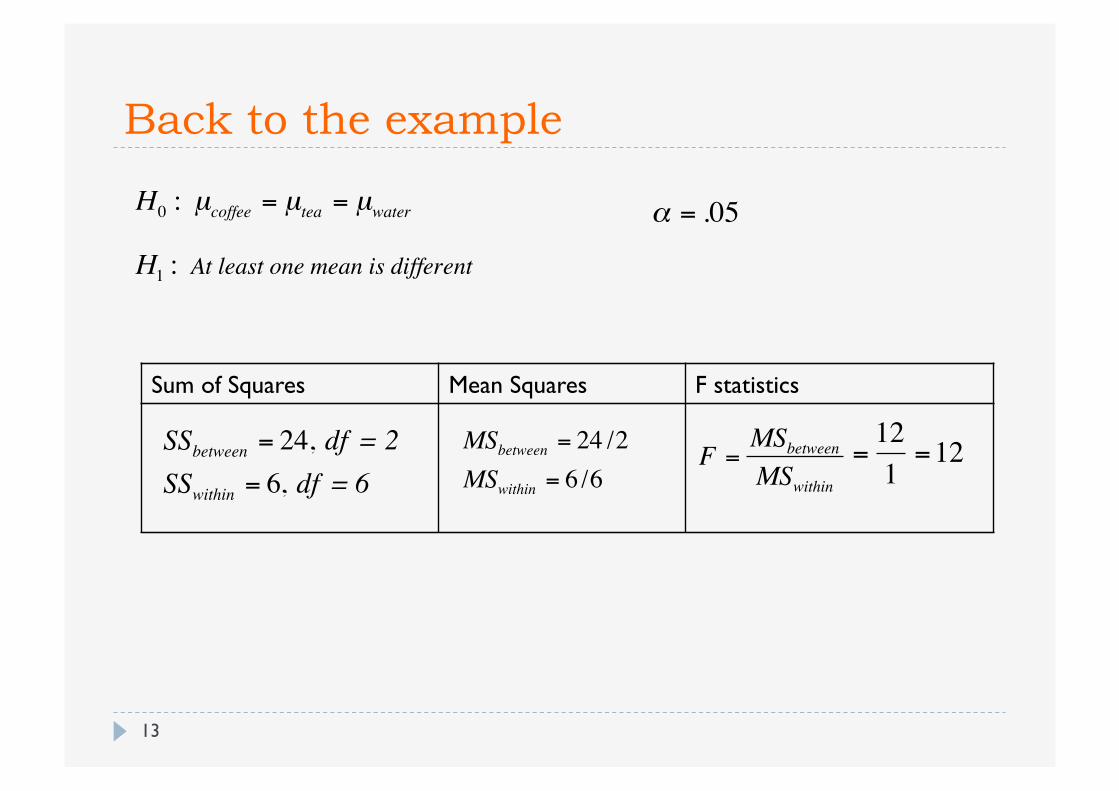
Sum of Squares Mean Squares F statistics
€
SSbetween = 24, df = 2SSwithin = 6, df = 6
€
MSbetween = 24 /2 MSwithin = 6 /6
€
F =MSbetweenMSwithin
€
=121
=12
€
H1 : At least one mean is different
€
H0 : µcoffee = µtea = µwater
€
α = .05
14
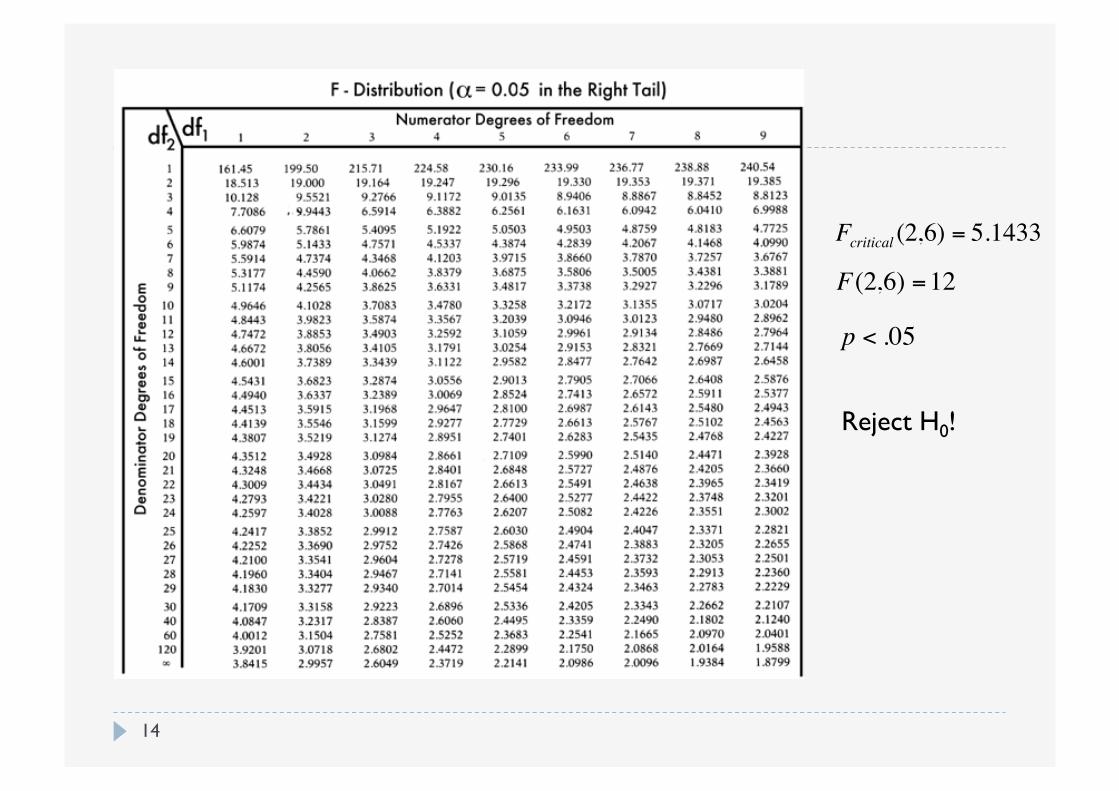
Reject H0!
€
Fcritical (2,6) = 5.1433
€
F(2,6) =12
€
p < .05
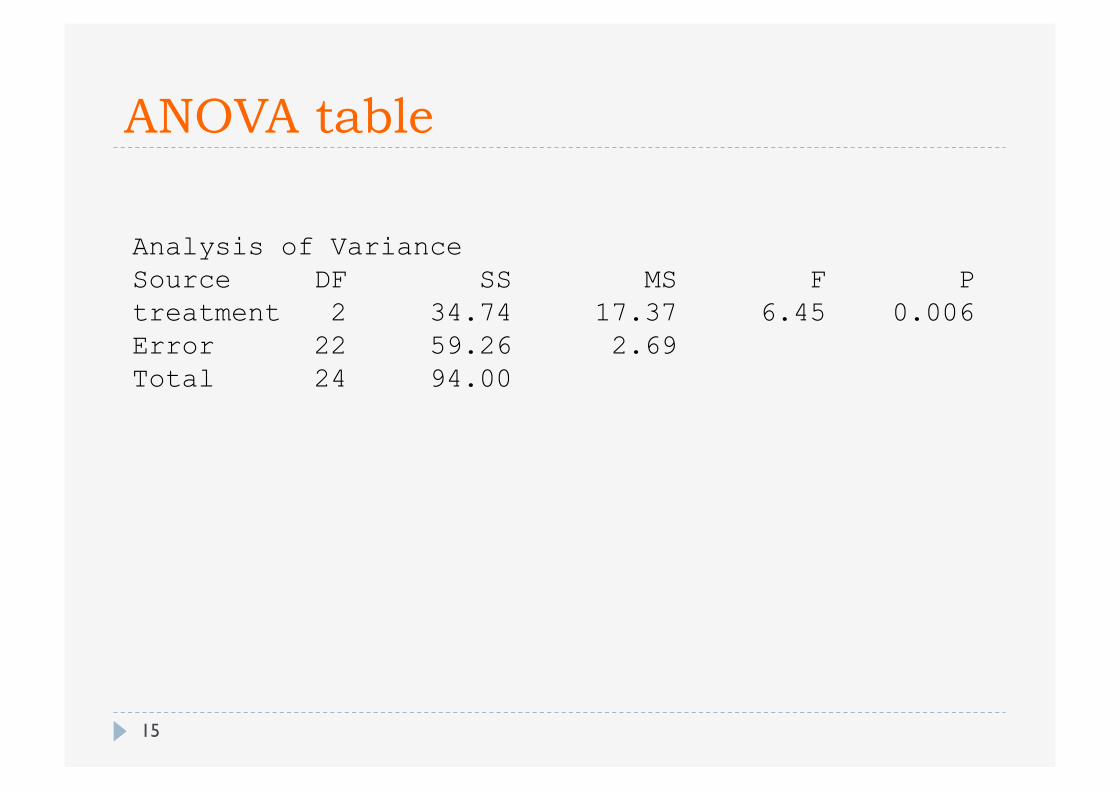
ANOVA table
Analysis of Variance Source DF SS MS F P treatment 2 34.74 17.37 6.45 0.006 Error 22 59.26 2.69 Total 24 94.00
15
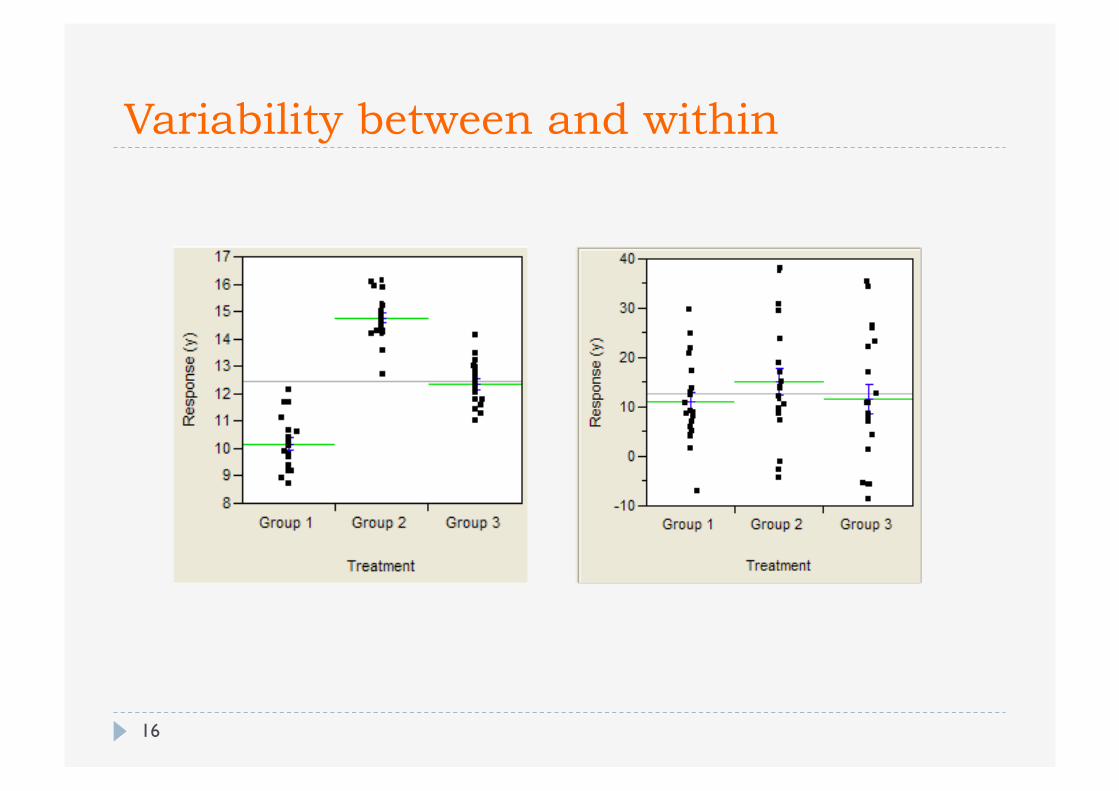
Variability between and within
16
The independant variable
Our example: coffee/ no coffee
Can have more levels (coffee, tea, water) Compare 3 groups!
There can be more than one independent variable Coffee/ no coffee Enough sleep / sleep deprivation
Compare 4 groups!
17
Why test more than 1 independent variable?
18
Why not to test variables separately – in two different experiments?
Because we expect an interaction! The factors coffee and sleep influence each other
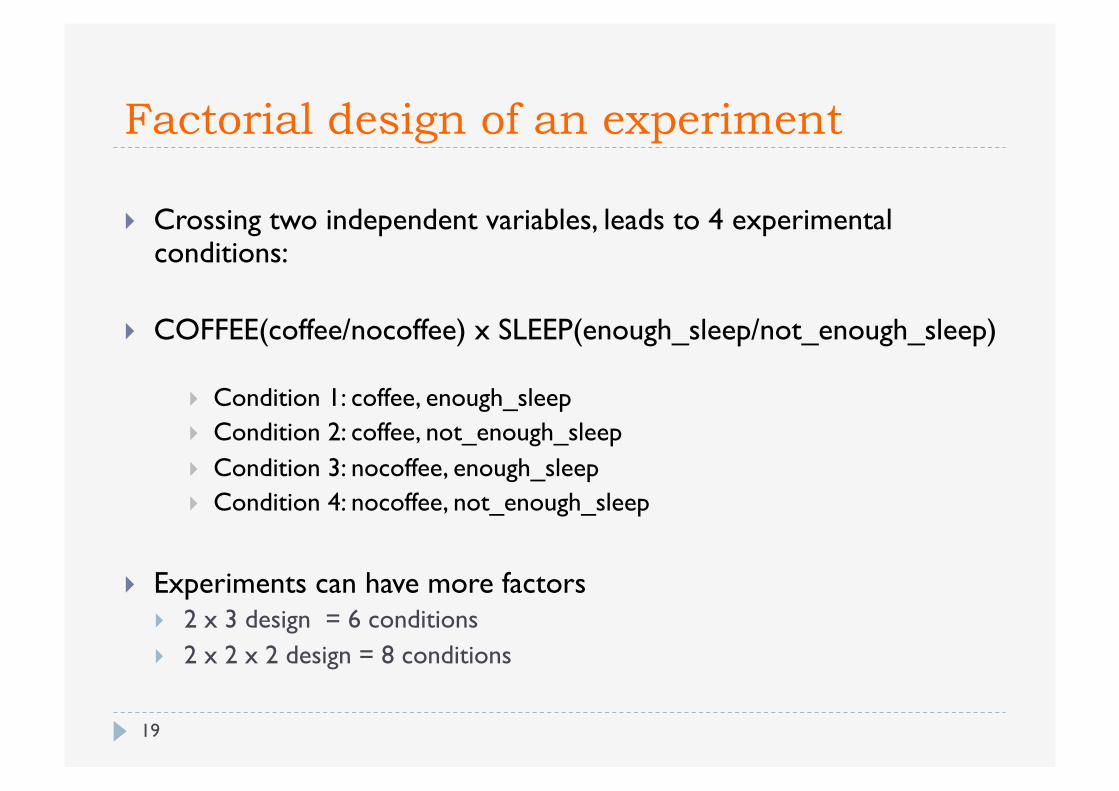
Factorial design of an experiment
19
Crossing two independent variables, leads to 4 experimental conditions:
COFFEE(coffee/nocoffee) x SLEEP(enough_sleep/not_enough_sleep)
Condition 1: coffee, enough_sleep Condition 2: coffee, not_enough_sleep Condition 3: nocoffee, enough_sleep Condition 4: nocoffee, not_enough_sleep
Experiments can have more factors 2 x 3 design = 6 conditions 2 x 2 x 2 design = 8 conditions
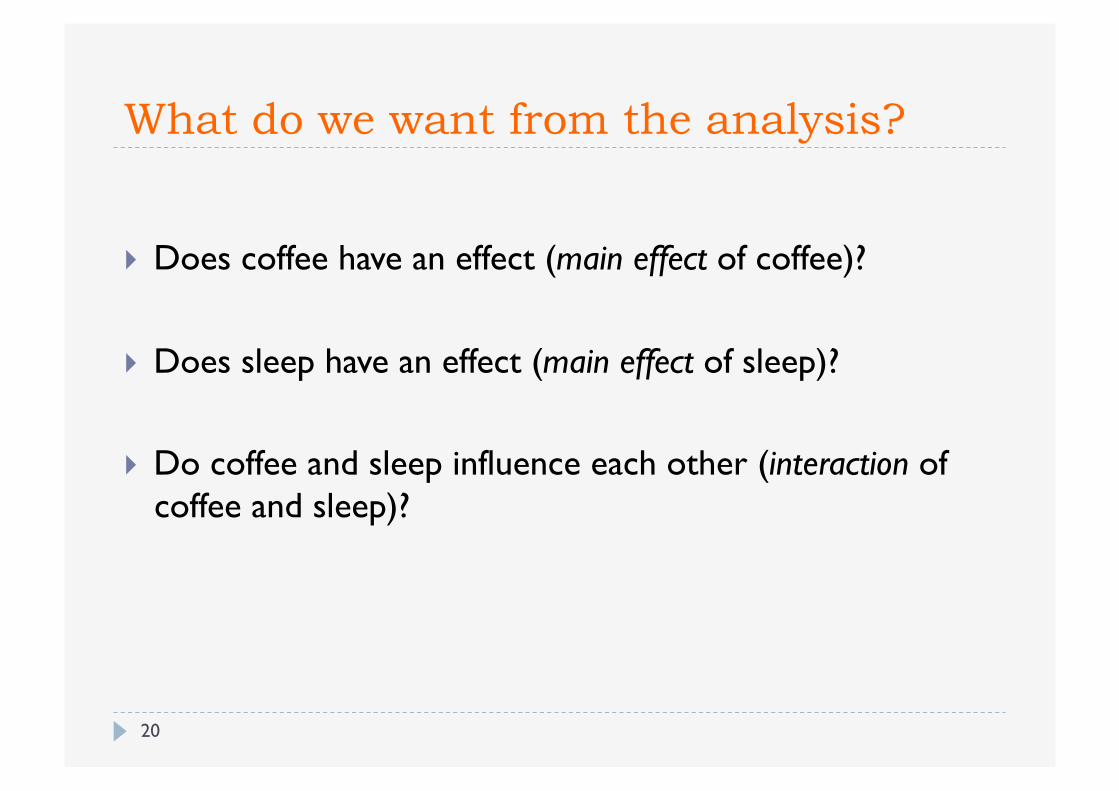
What do we want from the analysis?
20
Does coffee have an effect (main effect of coffee)?
Does sleep have an effect (main effect of sleep)?
Do coffee and sleep influence each other (interaction of coffee and sleep)?
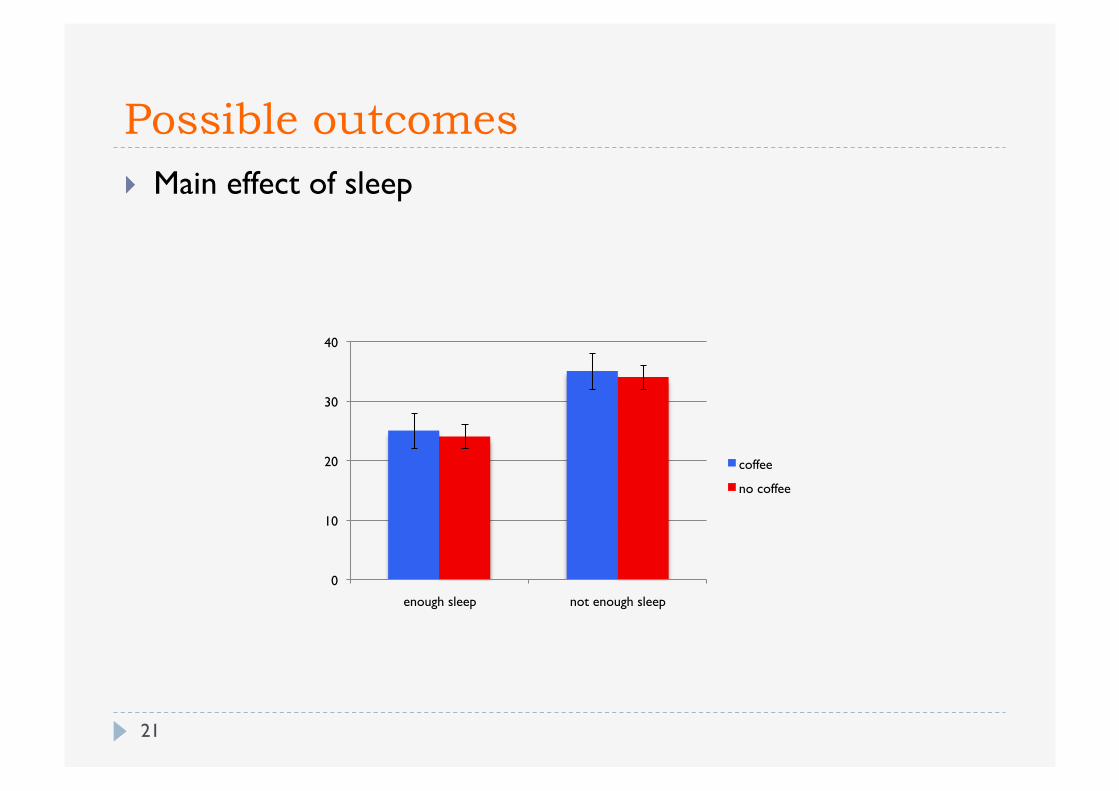
Possible outcomes
21
Main effect of sleep
0
10
20
30
40
enough sleep not enough sleep
coffee
no coffee
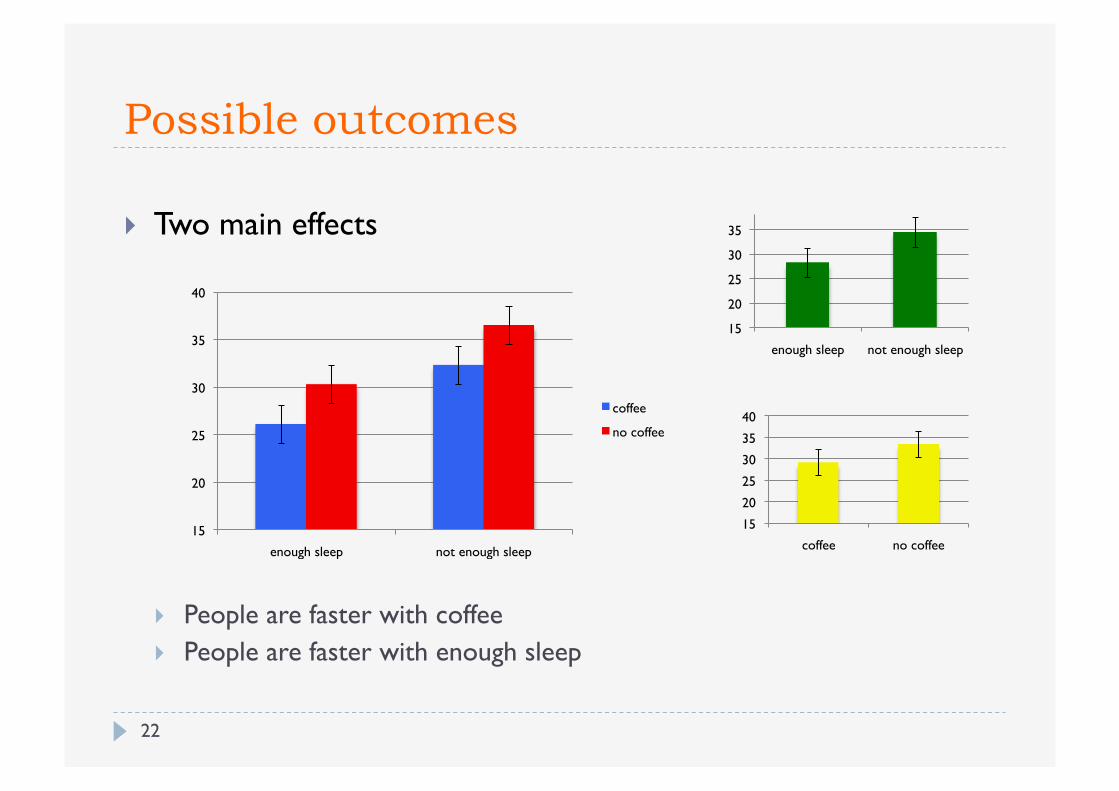
Possible outcomes
22
Two main effects
People are faster with coffee People are faster with enough sleep
15
20
25
30
35
40
enough sleep not enough sleep
coffee
no coffee
15
20
25
30
35
enough sleep not enough sleep
15
20
25
30
35
40
coffee no coffee
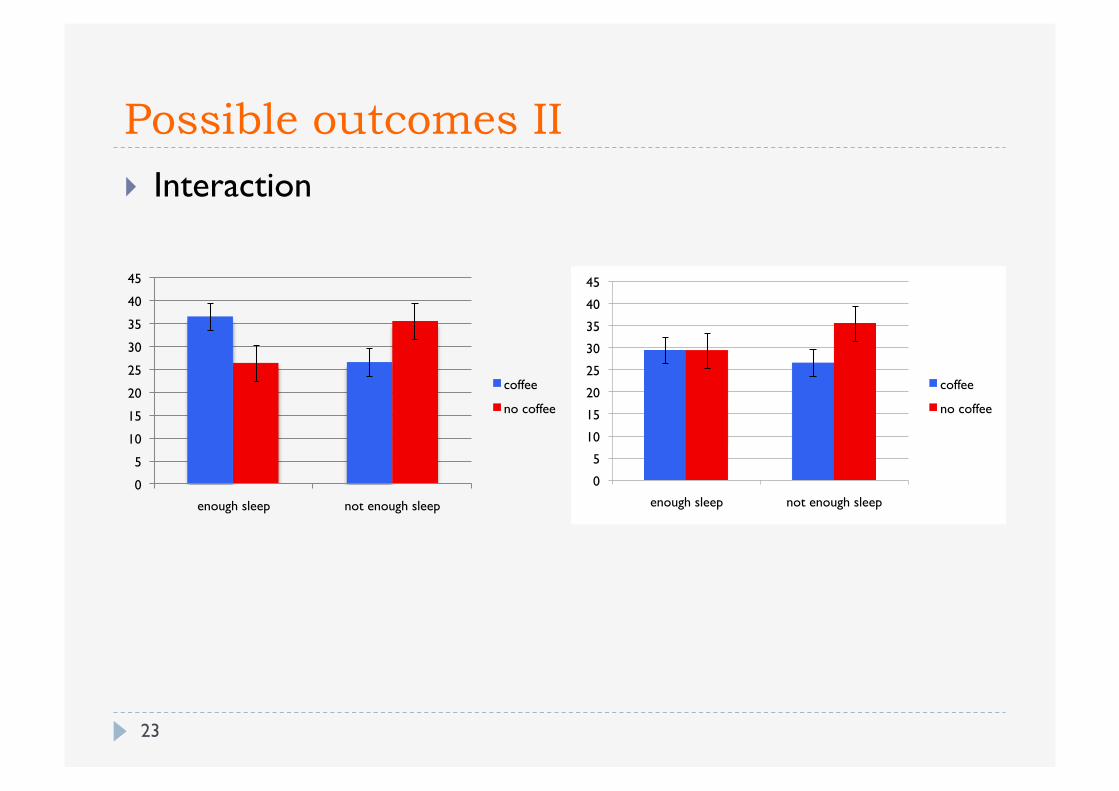
Possible outcomes II
23
Interaction
0
5
10
15
20
25
30
35
40
45
enough sleep not enough sleep
coffee
no coffee
0
5
10
15
20
25
30
35
40
45
enough sleep not enough sleep
coffee
no coffee
Possible outcomes III
24
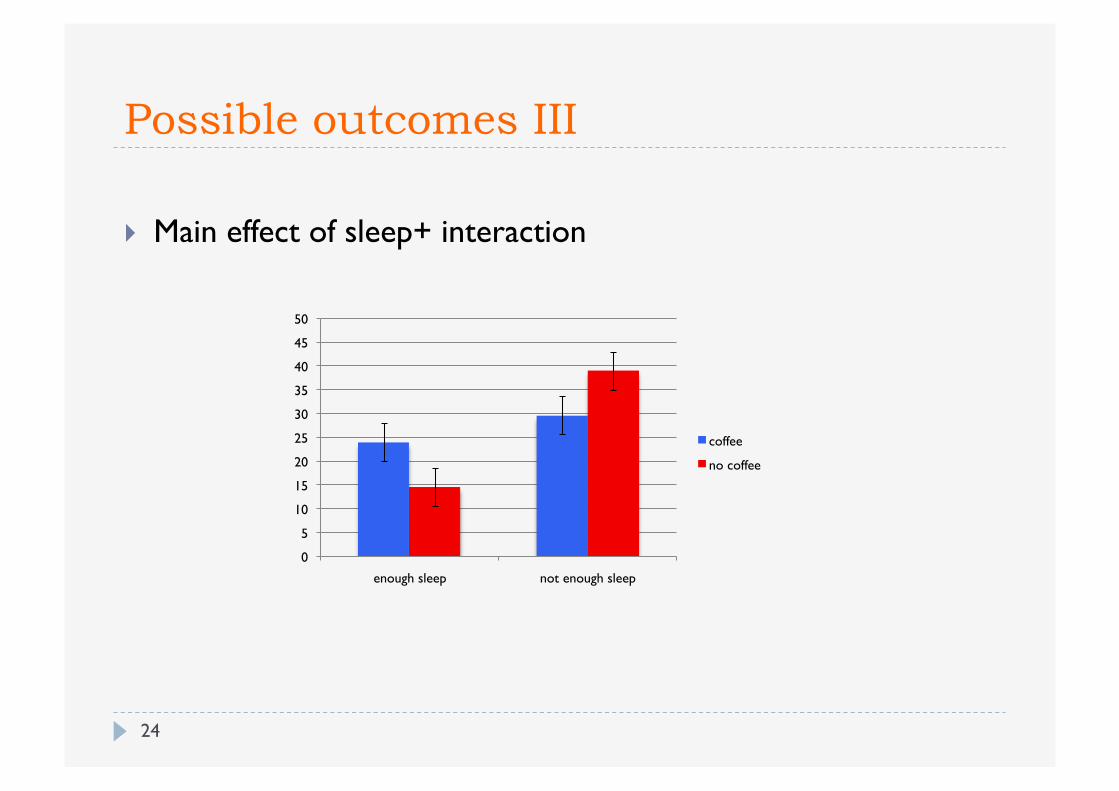
Main effect of sleep+ interaction
0
5
10
15
20
25
30
35
40
45
50
enough sleep not enough sleep
coffee
no coffee
How do we interpret an interaction?
25
The information we get from the ANOVA is that there is an interaction, not what kind of interaction
At least we know that the two factors influence each other (are not independent)
We don’t know which differences between individual conditions are significant
Pairwise comparisons!
Planned vs post hoc
26
Planned comparisons: Your hypothesis predicts a particular data pattern, e.g. Coffee makes students faster, but only if they are tired before
Difference between the conditions: coffee, not_enough_sleep nocoffee, not_enough_sleep
No Difference between the conditions: coffee, enough_sleep nocoffee, enough_sleep
Perform two t tests with Bonferroni correction
Planned vs post hoc
27
Post hoc tests:
Your hypothesis didn’t state particular differences
possibly because you did not expect an interaction
Test all possible pairs! Have to use a more conservative correction here Tukey’s Test
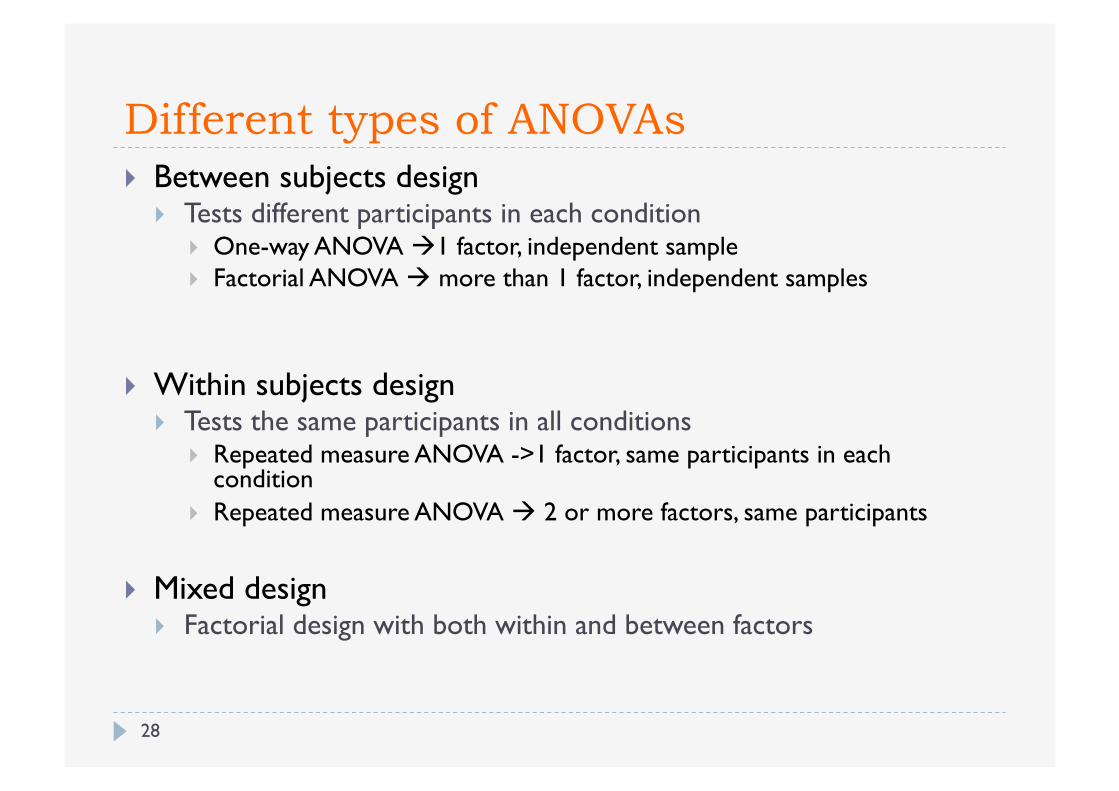
Different types of ANOVAs
28
Between subjects design Tests different participants in each condition
One-way ANOVA 1 factor, independent sample Factorial ANOVA more than 1 factor, independent samples
Within subjects design Tests the same participants in all conditions
Repeated measure ANOVA ->1 factor, same participants in each condition
Repeated measure ANOVA 2 or more factors, same participants
Mixed design Factorial design with both within and between factors
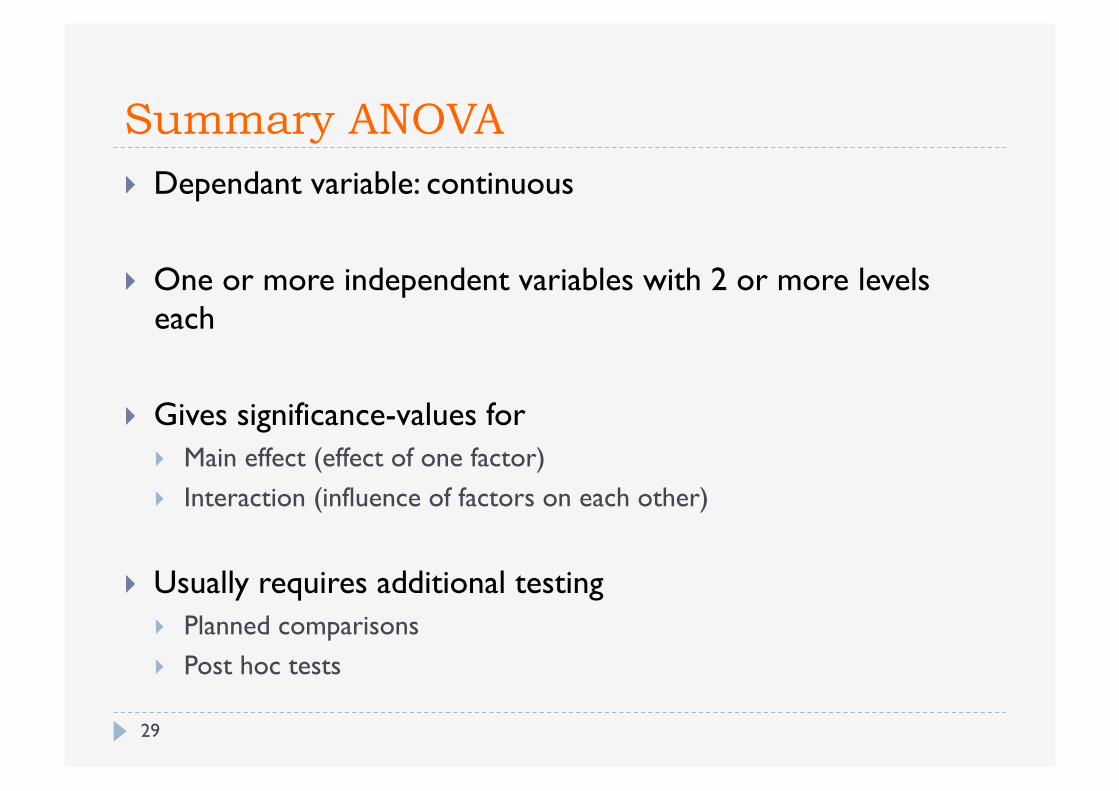
Summary ANOVA
29
Dependant variable: continuous
One or more independent variables with 2 or more levels each
Gives significance-values for Main effect (effect of one factor) Interaction (influence of factors on each other)
Usually requires additional testing Planned comparisons Post hoc tests
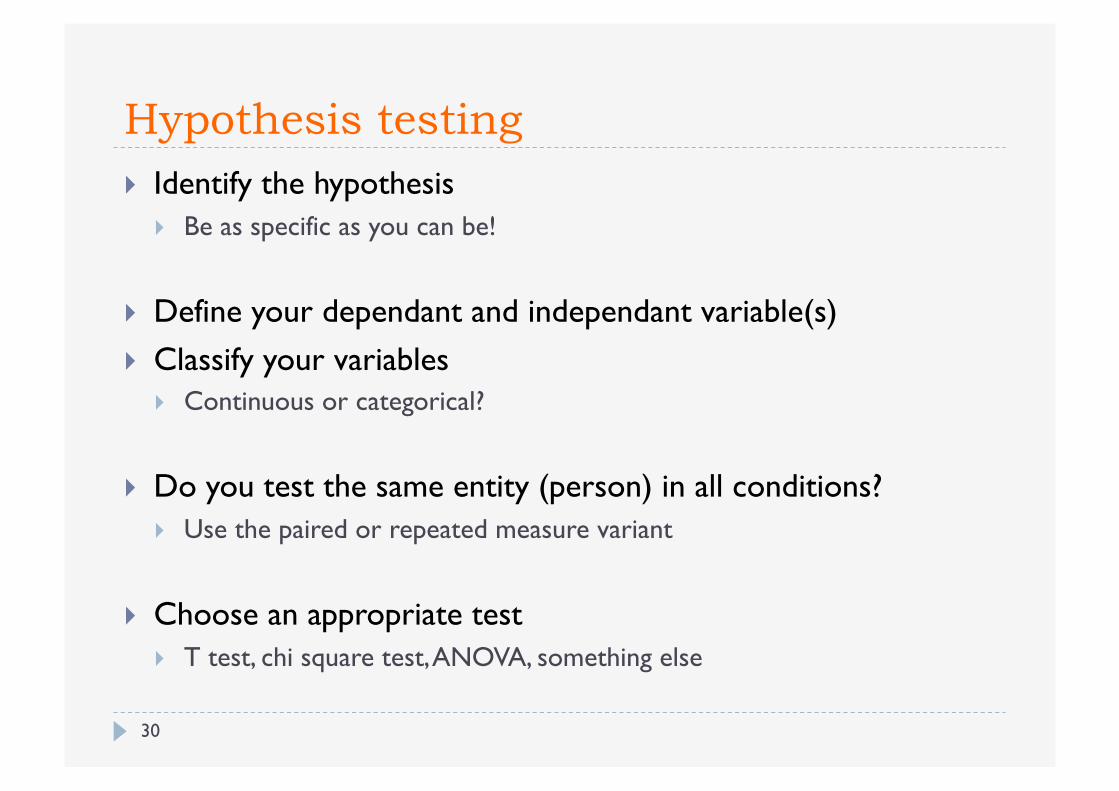
Hypothesis testing Identify the hypothesis
Be as specific as you can be!
Define your dependant and independant variable(s) Classify your variables
Continuous or categorical?
Do you test the same entity (person) in all conditions? Use the paired or repeated measure variant
Choose an appropriate test T test, chi square test, ANOVA, something else
30
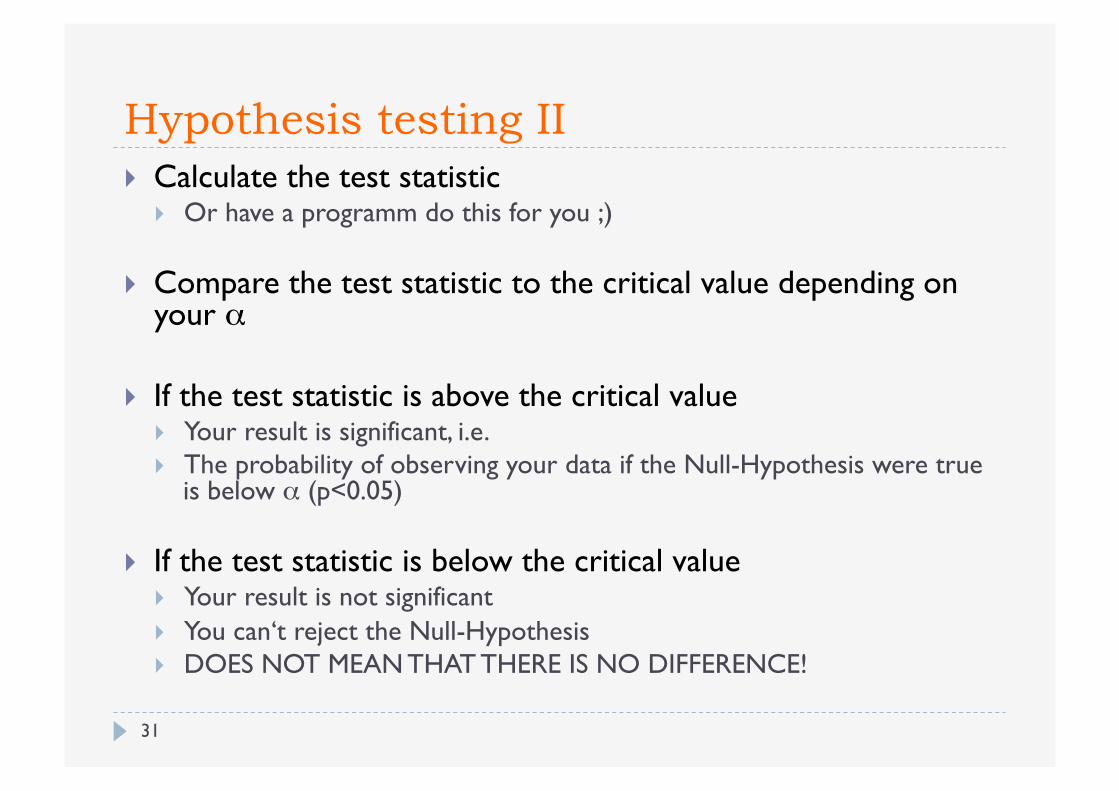
Hypothesis testing II Calculate the test statistic
Or have a programm do this for you ;)
Compare the test statistic to the critical value depending on your α
If the test statistic is above the critical value Your result is significant, i.e. The probability of observing your data if the Null-Hypothesis were true
is below α (p<0.05)
If the test statistic is below the critical value Your result is not significant You can‘t reject the Null-Hypothesis DOES NOT MEAN THAT THERE IS NO DIFFERENCE!
31
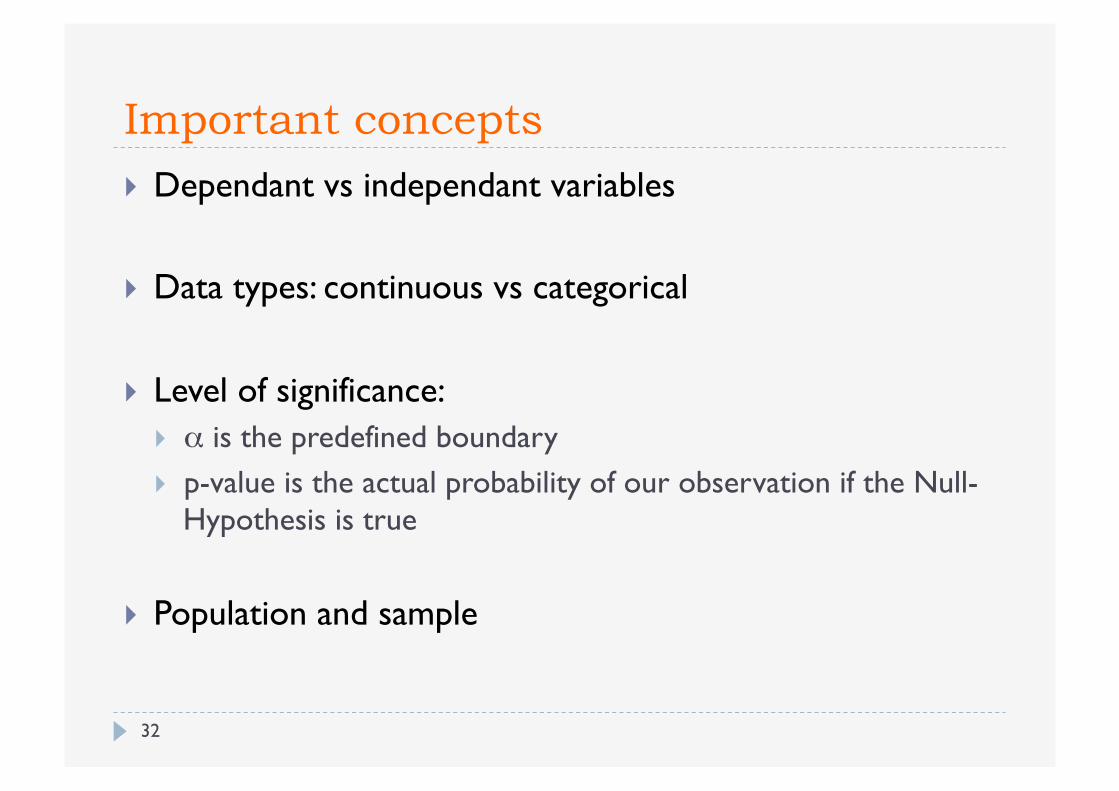
Important concepts Dependant vs independant variables
Data types: continuous vs categorical
Level of significance: α is the predefined boundary p-value is the actual probability of our observation if the Null-
Hypothesis is true
Population and sample
32
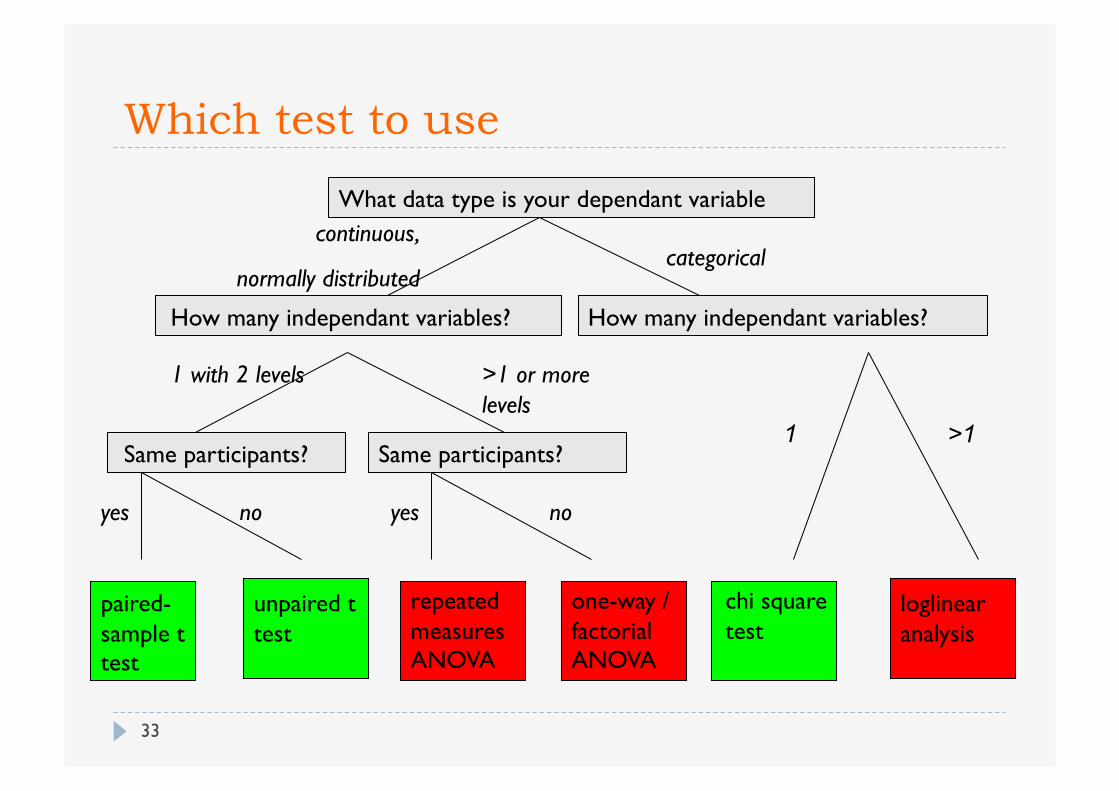
Which test to use
What data type is your dependant variable
How many independant variables?
continuous,
normally distributed categorical
How many independant variables?
1 with 2 levels
Same participants?
yes
paired-sample t test
no
unpaired t test
>1 or more levels
Same participants?
yes
repeated measures ANOVA
one-way / factorial ANOVA
1
chi square test
loglinear analysis
no
>1
33
Questions? What is α?
What does it mean for a difference to be statistically significant?
When do we use the t test?
What is a continuous/categorical variable?
What is a dependant/independent variable?
Where do we get our hypotheses from?
Why do statistical tests assume the Null Hypothesis (H0)?
What is an interaction?
What kinds of errors can we make in hypothesis testing?
34
Software for statistical analysis
35
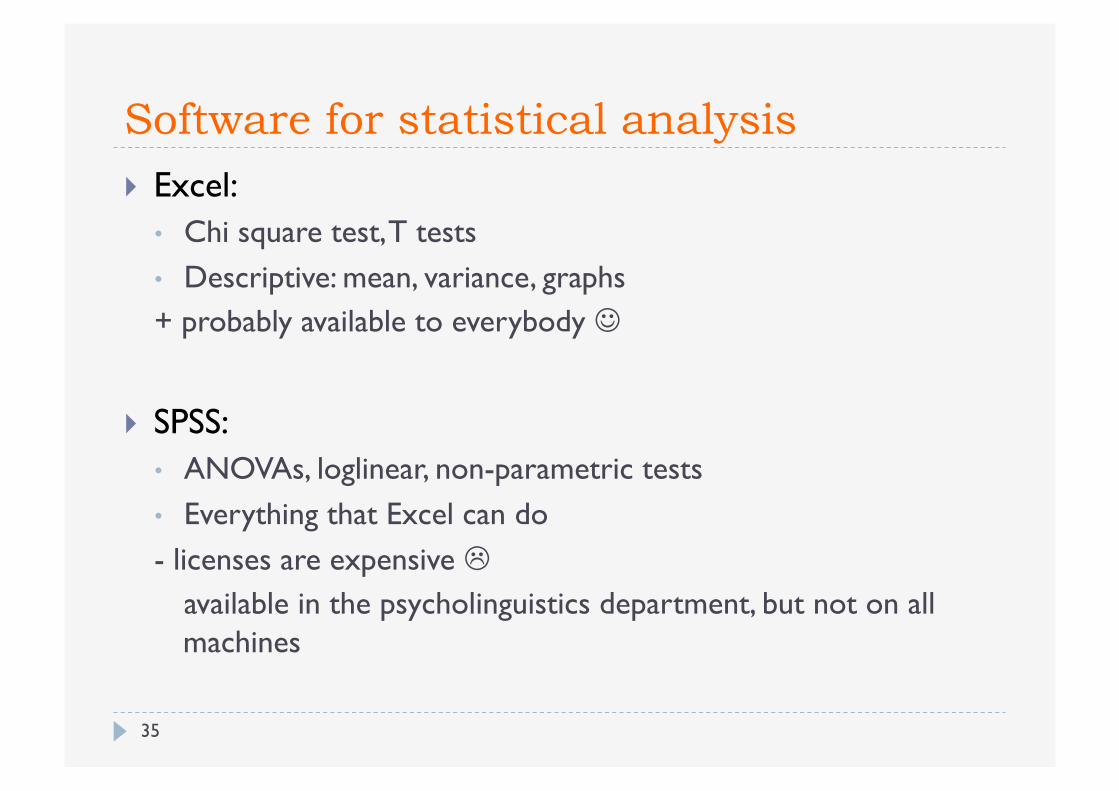
Excel: • Chi square test, T tests • Descriptive: mean, variance, graphs + probably available to everybody
SPSS: • ANOVAs, loglinear, non-parametric tests • Everything that Excel can do - licenses are expensive
available in the psycholinguistics department, but not on all machines
Software for statistical analysis
36
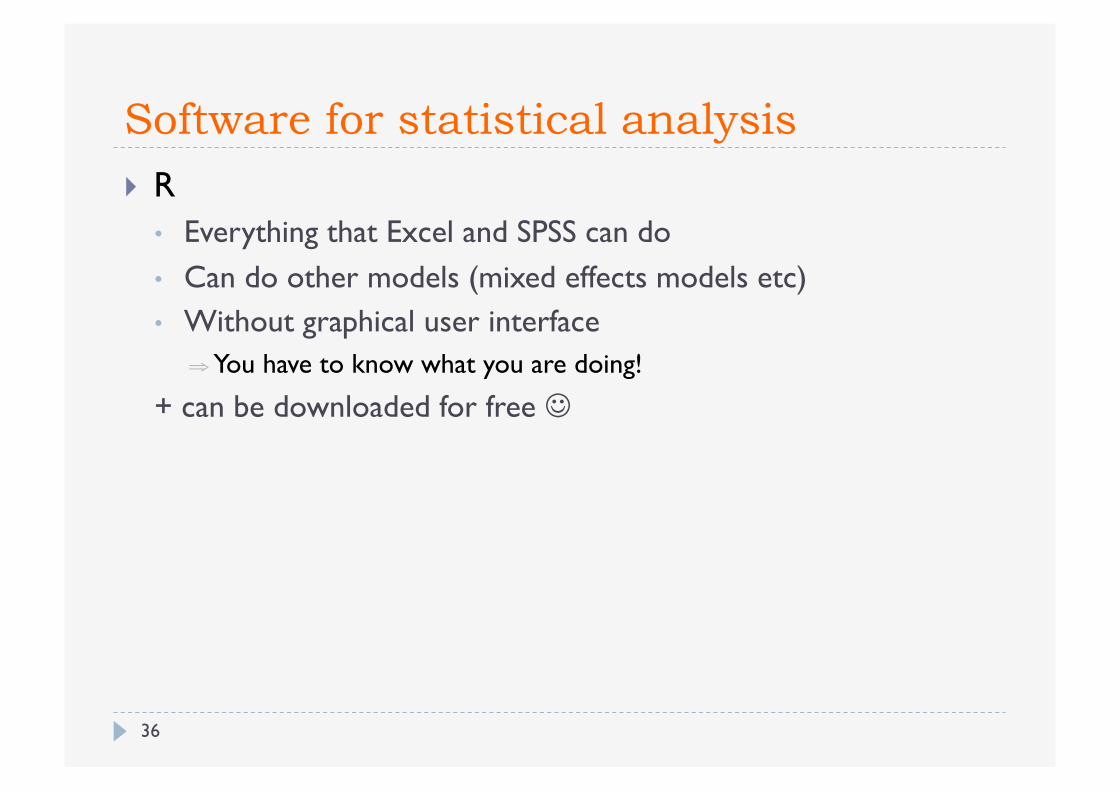
R • Everything that Excel and SPSS can do • Can do other models (mixed effects models etc) • Without graphical user interface
⇒ You have to know what you are doing!
+ can be downloaded for free
Helpful readings
37
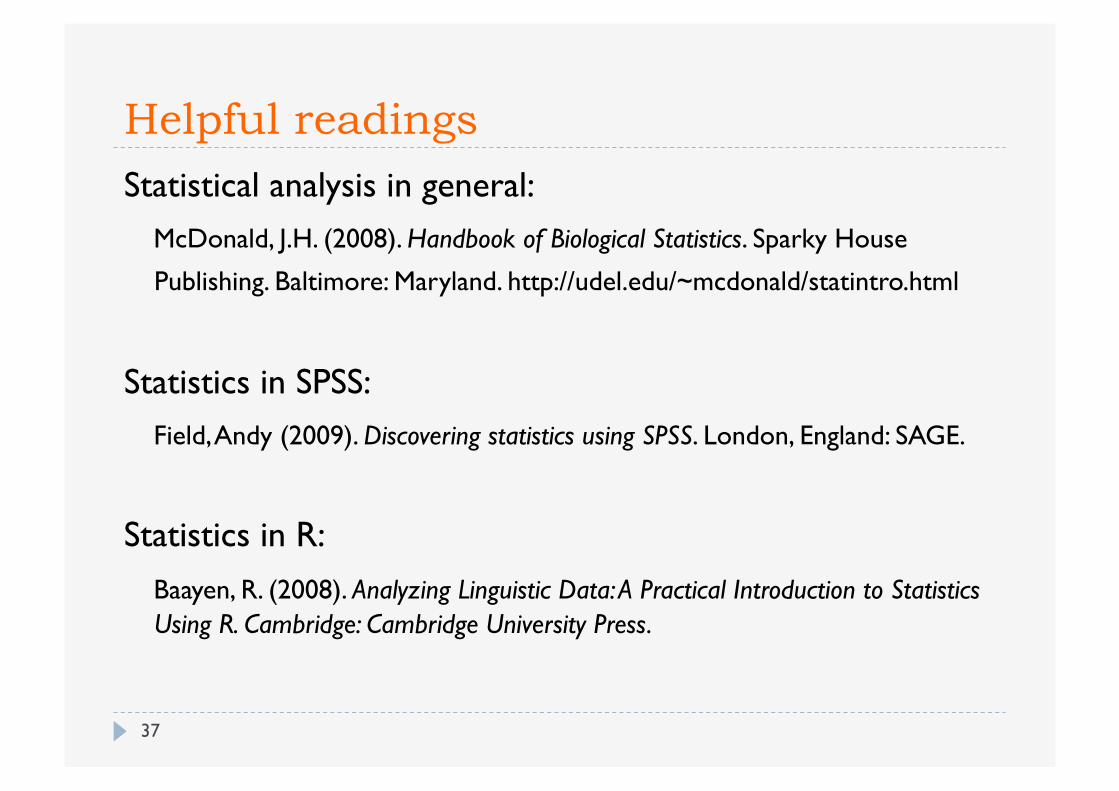
Statistical analysis in general: McDonald, J.H. (2008). Handbook of Biological Statistics. Sparky House
Publishing. Baltimore: Maryland. http://udel.edu/~mcdonald/statintro.html
Statistics in SPSS: Field, Andy (2009). Discovering statistics using SPSS. London, England: SAGE.
Statistics in R: Baayen, R. (2008). Analyzing Linguistic Data: A Practical Introduction to Statistics Using R. Cambridge: Cambridge University Press.
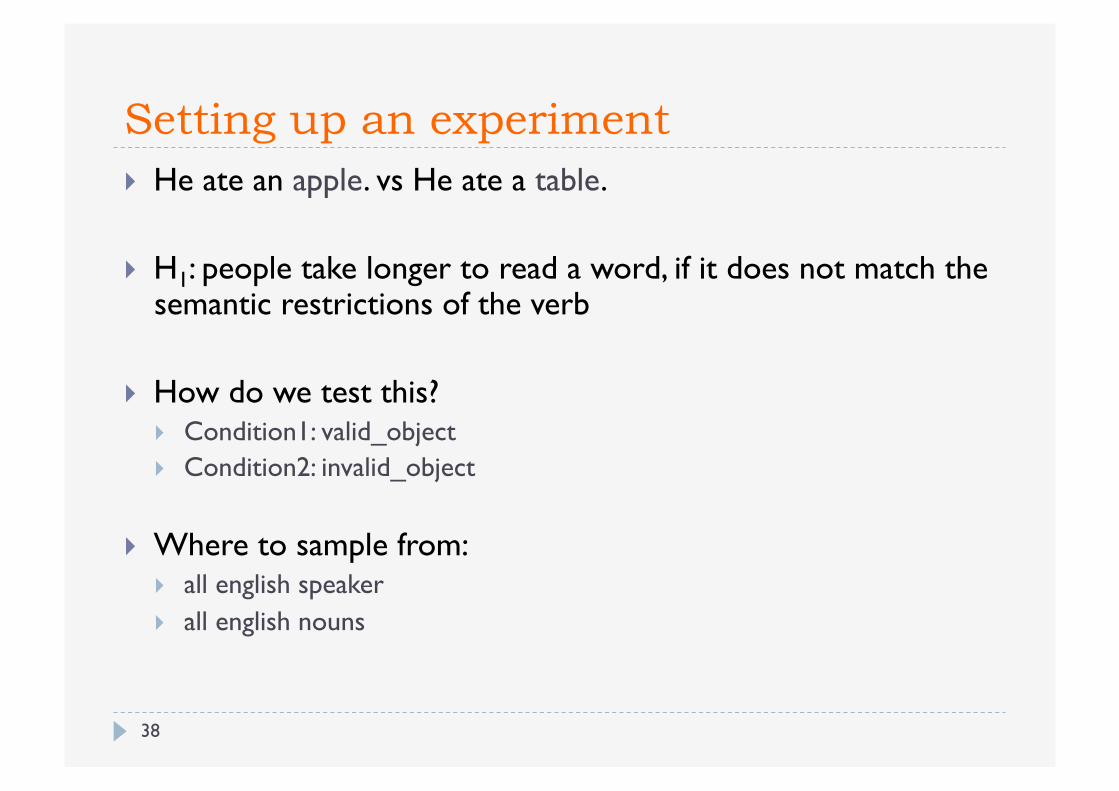
Setting up an experiment He ate an apple. vs He ate a table.
H1: people take longer to read a word, if it does not match the semantic restrictions of the verb
How do we test this? Condition1: valid_object Condition2: invalid_object
Where to sample from: all english speaker all english nouns
38
Sampling from two populations Participants:
A random sample of English speakers
Items: A constructed sample of English sentences containing a
selective verb and a noun
39
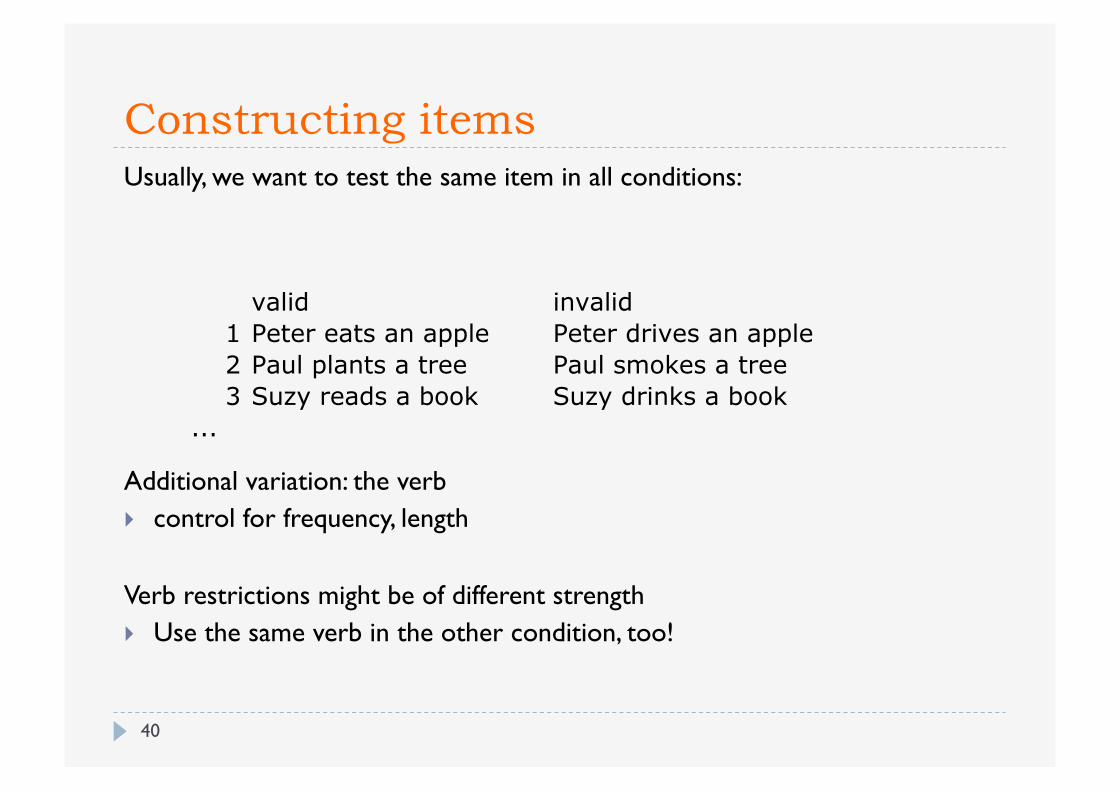
Constructing items Usually, we want to test the same item in all conditions:
Additional variation: the verb control for frequency, length
Verb restrictions might be of different strength Use the same verb in the other condition, too!
valid invalid1 Peter eats an apple Peter drives an apple2 Paul plants a tree Paul smokes a tree3 Suzy reads a book Suzy drinks a book
...
40
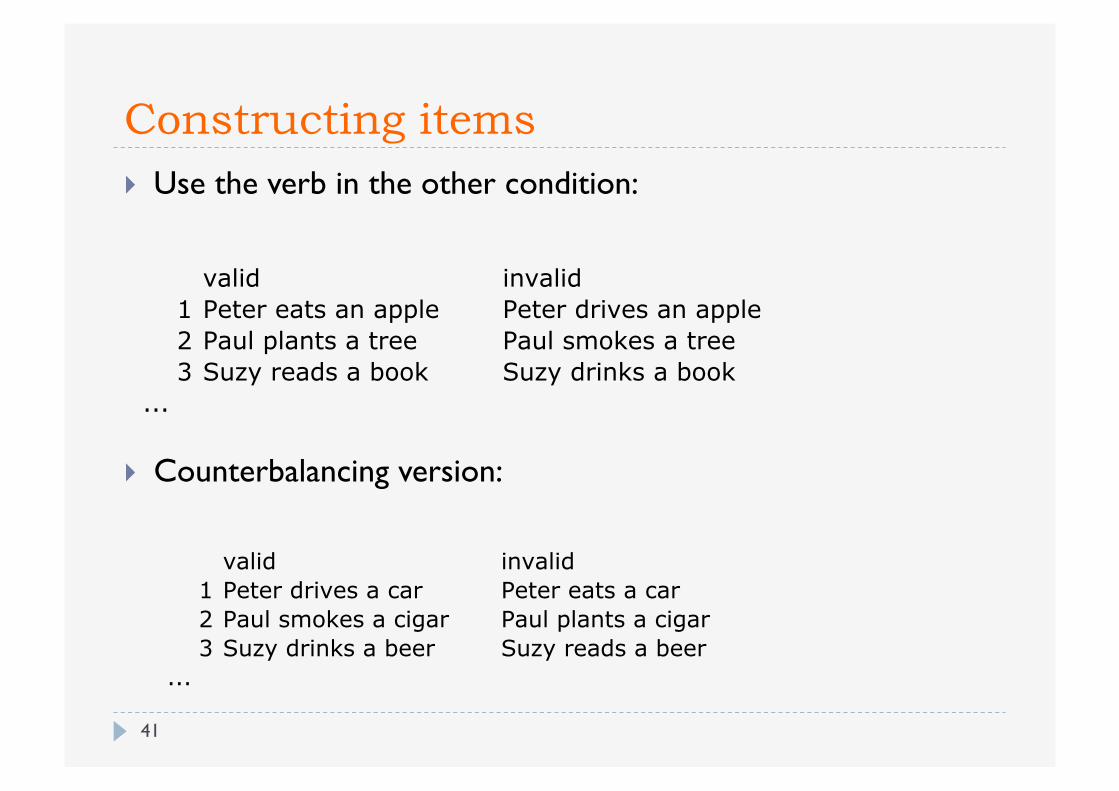
Constructing items Use the verb in the other condition:
Counterbalancing version:
valid invalid1 Peter eats an apple Peter drives an apple2 Paul plants a tree Paul smokes a tree3 Suzy reads a book Suzy drinks a book
...
valid invalid1 Peter drives a car Peter eats a car2 Paul smokes a cigar Paul plants a cigar3 Suzy drinks a beer Suzy reads a beer
...
41
Constructing lists
Usually, we show each participant each item in only one condition
They might react differently when reading the same word again 2 conditions and a counterbalancing version for the item
4 experimental lists • Each should be tested an equal number of times
Make sure that every condition appears equally often Randomize the list!
42
Validity If your participants can guess the goal of your experiment, they
might behave differently!
Don‘t tell them the purpose
Try to distract them from the purpose e.g. put in more sentences, that don‘t have anything to do with the
experiment (filler items)
43
Summary You sample from two populations:
Participants Items
Try to eliminate as much variation in your materials as you can! Controll for factors Counterbalance your materials
Try to prevent your participant from behaving strategically Introduce filler items to distract from the real purpose
44
Recommended