Fishery Manuscript Series No. 17-05
Summary of Pacific Salmon Escapement Goals in Alaska with a Review of Escapements from 2008 to 2016
by
Andrew R. Munro
and
Eric C. Volk
December 2017
Alaska Department of Fish and Game Divisions of Sport Fish and Commercial Fisheries
Symbols and Abbreviations The following symbols and abbreviations, and others approved for the Système International d'Unités (SI), are used without definition in the following reports by the Divisions of Sport Fish and of Commercial Fisheries: Fishery Manuscripts, Fishery Data Series Reports, Fishery Management Reports, and Special Publications. All others, including deviations from definitions listed below, are noted in the text at first mention, as well as in the titles or footnotes of tables, and in figure or figure captions. Weights and measures (metric) centimeter cm deciliter dL gram g hectare ha kilogram kg kilometer km liter L meter m milliliter mL millimeter mm Weights and measures (English) cubic feet per second ft3/s foot ft gallon gal inch in mile mi nautical mile nmi ounce oz pound lb quart qt yard yd Time and temperature day d degrees Celsius °C degrees Fahrenheit °F degrees kelvin K hour h minute min second s Physics and chemistry all atomic symbols alternating current AC ampere A calorie cal direct current DC hertz Hz horsepower hp hydrogen ion activity pH (negative log of) parts per million ppm parts per thousand ppt, ‰ volts V watts W
General Alaska Administrative Code AAC all commonly accepted abbreviations e.g., Mr., Mrs.,
AM, PM, etc. all commonly accepted professional titles e.g., Dr., Ph.D., R.N., etc. at @ compass directions:
east E north N south S west W
copyright corporate suffixes:
Company Co. Corporation Corp. Incorporated Inc. Limited Ltd.
District of Columbia D.C. et alii (and others) et al. et cetera (and so forth) etc. exempli gratia (for example) e.g. Federal Information Code FIC id est (that is) i.e. latitude or longitude lat or long monetary symbols (U.S.) $, ¢ months (tables and figures): first three letters Jan,...,Dec registered trademark trademark United States (adjective) U.S. United States of America (noun) USA U.S.C. United States
Code U.S. state use two-letter
abbreviations (e.g., AK, WA)
Mathematics, statistics all standard mathematical signs, symbols and abbreviations alternate hypothesis HA base of natural logarithm e catch per unit effort CPUE coefficient of variation CV common test statistics (F, t, χ2, etc.) confidence interval CI correlation coefficient (multiple) R correlation coefficient (simple) r covariance cov degree (angular ) ° degrees of freedom df expected value E greater than > greater than or equal to ≥ harvest per unit effort HPUE less than < less than or equal to ≤ logarithm (natural) ln logarithm (base 10) log logarithm (specify base) log2, etc. minute (angular) ' not significant NS null hypothesis HO percent % probability P probability of a type I error (rejection of the null hypothesis when true) α probability of a type II error (acceptance of the null hypothesis when false) β second (angular) " standard deviation SD standard error SE variance population Var sample var
FISHERY MANUSCRIPT SERIES NO. 17-05
SUMMARY OF PACIFIC SALMON ESCAPEMENT GOALS IN ALASKA WITH A REVIEW OF ESCAPEMENTS FROM 2008 TO 2016
by Andrew R. Munro
and Eric C. Volk
Alaska Department of Fish and Game, Division of Commercial Fisheries, Anchorage
Alaska Department of Fish and Game Division of Sport Fish, Research and Technical Services 333 Raspberry Road, Anchorage, Alaska, 99518-1565
December 2017
The Fishery Manuscript Series was established in 1987 by the Division of Sport Fish for the publication of technically-oriented results of several years' work undertaken on a project to address common objectives, provide an overview of work undertaken through multiple projects to address specific research or management goal(s), or new and/or highly technical methods, and became a joint divisional series in 2004 with the Division of Commercial Fisheries. Fishery Manuscripts are intended for fishery and other technical professionals. Fishery Manuscripts are available through the Alaska State Library and on the Internet: http://www.adfg.alaska.gov/sf/publications/. This publication has undergone editorial and peer review.
Andrew R. Munro Alaska Department of Fish and Game, Division of Commercial Fisheries,
333 Raspberry Road, Anchorage, Alaska 99518, USA
and
Eric C. Volk Alaska Department of Fish and Game, Division of Commercial Fisheries,
333 Raspberry Road, Anchorage, Alaska 99518, USA
This document should be cited as follows: Munro, A. R., and E. C. Volk. 2017. Summary of Pacific salmon escapement goals in Alaska with a review of
escapements from 2008 to 2016. Alaska Department of Fish and Game, Fishery Manuscript Series No. 17-05, Anchorage.
The Alaska Department of Fish and Game (ADF&G) administers all programs and activities free from discrimination based on race, color, national origin, age, sex, religion, marital status, pregnancy, parenthood, or disability. The department administers all programs and activities in compliance with Title VI of the Civil Rights Act of 1964, Section 504 of the Rehabilitation Act of 1973, Title II of the Americans with Disabilities Act (ADA) of 1990, the Age Discrimination Act of 1975, and Title IX of the Education Amendments of 1972.
If you believe you have been discriminated against in any program, activity, or facility please write: ADF&G ADA Coordinator, P.O. Box 115526, Juneau, AK 99811-5526
U.S. Fish and Wildlife Service, 4401 N. Fairfax Drive, MS 2042, Arlington, VA 22203 Office of Equal Opportunity, U.S. Department of the Interior, 1849 C Street NW MS 5230, Washington DC 20240
The department’s ADA Coordinator can be reached via phone at the following numbers: (VOICE) 907-465-6077, (Statewide Telecommunication Device for the Deaf) 1-800-478-3648,
(Juneau TDD) 907-465-3646, or (FAX) 907-465-6078 For information on alternative formats and questions on this publication, please contact:
ADF&G Division of Sport Fish, Research and Technical Services, 333 Raspberry Road, Anchorage AK 99518 (907) 267-2375
i
TABLE OF CONTENTS Page
LIST OF TABLES.......................................................................................................................................................... i
LIST OF FIGURES ....................................................................................................................................................... ii
LIST OF APPENDICES ............................................................................................................................................... ii
ABSTRACT .................................................................................................................................................................. 1
INTRODUCTION ......................................................................................................................................................... 1
METHODS .................................................................................................................................................................... 2
RESULTS AND DISCUSSION .................................................................................................................................... 3
ACKNOWLEDGEMENTS ........................................................................................................................................... 5
REFERENCES CITED ................................................................................................................................................. 6
TABLES ...................................................................................................................................................................... 15
FIGURES .................................................................................................................................................................... 67
APPENDIX A. ESCAPEMENT GOAL MEMO FOR 2015/2016 BOARD OF FISHERIES MEETING CYCLE ... 75
LIST OF TABLES
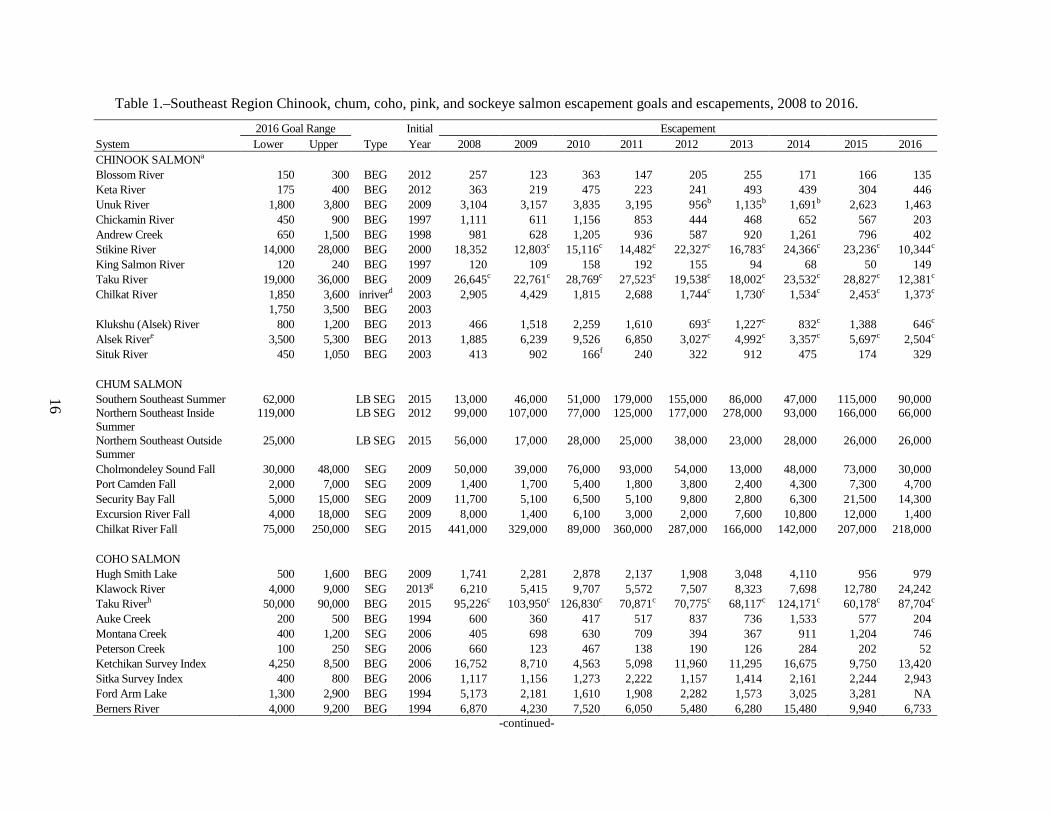
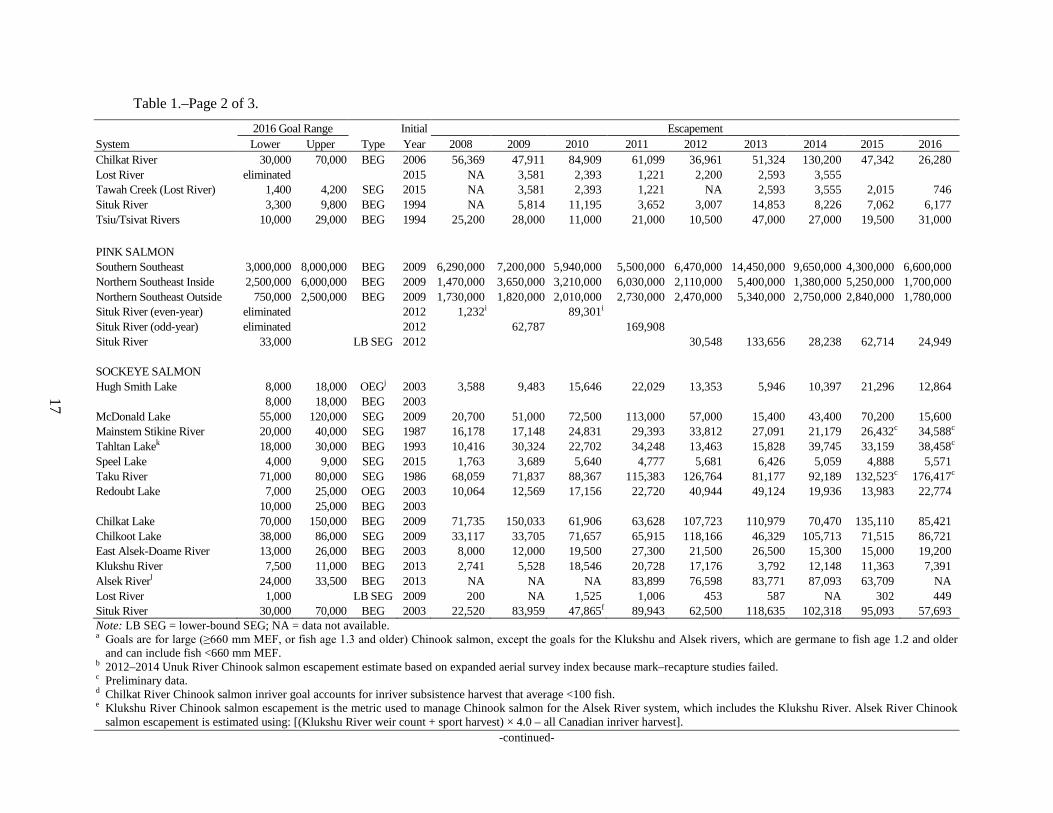
Table Page 1. Southeast Region Chinook, chum, coho, pink, and sockeye salmon escapement goals and escapements,
2008 to 2016. ................................................................................................................................................. 16 2. Central Region (Bristol Bay, Cook Inlet, and Prince William Sound/Copper River) Chinook, chum,
coho, pink, and sockeye salmon escapement goals and escapements, 2008 to 2016. ................................... 19 3. Arctic-Yukon-Kuskokwim Region Chinook, chum, coho, pink, and sockeye salmon escapement goals
and escapements, 2008 to 2016. .................................................................................................................... 25 4. Westward Region (Alaska Peninsula/Aleutian Islands, Kodiak, and Chignik areas) Chinook, chum,
coho, pink, and sockeye salmon escapement goals and escapements, 2008 to 2016. ................................... 29 5. Summary of salmon escapement goal changes in Bristol Bay, Arctic-Yukon-Kuskokwim, Alaska
Peninsula and Aleutian Islands, and Chignik management areas, 2016. ....................................................... 32 6. Assessment of whether escapements met, exceeded, or did not meet the escapement goal in place at the
time of enumeration for salmon stocks in Southeast Region......................................................................... 33 7. Assessment of whether escapements met, exceeded, or did not meet the escapement goal in place at the
time of enumeration for salmon stocks in Central Region ............................................................................ 35 8. Assessment of whether escapements met, exceeded, or did not meet the escapement goal in place at the
time of enumeration for salmon stocks in Arctic-Yukon-Kuskokwim Region. ............................................ 40 9. Assessment of whether escapements met, exceeded, or did not meet the escapement goal in place at the
time of enumeration for salmon stocks in Westward Region ........................................................................ 43 10. Southeast Region Chinook, chum, coho, pink, and sockeye salmon escapements compared to
escapement goals for the years 2008 to 2016. ............................................................................................... 46 11. Central Region (Bristol Bay, Cook Inlet, Prince William Sound/Copper River) Chinook, chum, coho,
pink, and sockeye salmon escapements compared to escapement goals for the years 2008 to 2016. ........... 47 12. Arctic-Yukon-Kuskokwim Region Chinook, chum, coho, pink, and sockeye salmon escapements
compared to escapement goals for the years 2008 to 2016. .......................................................................... 48 13. Westward Region Chinook, chum, coho, pink, and sockeye salmon escapements compared to
escapement goals for the years 2008 to 2016. ............................................................................................... 50 14. Summary of Southeast Region salmon escapements compared against escapement goals for the years
2008 to 2016. ................................................................................................................................................. 51
ii
LIST OF TABLES (Continued) Table Page 15. Summary of Central Region (Bristol Bay, Cook Inlet, Prince William Sound/Copper River) salmon
escapements compared against escapement goals for the years 2008 to 2016. ............................................. 51 16. Summary of Arctic-Yukon-Kuskokwim Region salmon escapements compared against escapement
goals for the years 2008 to 2016.................................................................................................................... 51 17. Summary of Westward Region (Alaska Peninsula/Aleutian Islands, Kodiak, and Chignik areas) salmon
escapements compared against escapement goals for the years 2008 to 2016. ............................................. 52 18. Statewide summary of salmon stocks of concern in Alaska. ......................................................................... 52 19. Methods used to enumerate and develop escapement goals for Southeast Region Chinook, chum, coho,
pink, and sockeye salmon stocks. .................................................................................................................. 53 20. Methods used to enumerate and develop escapement goals for Central Region (Bristol Bay, Cook Inlet,
and Prince William Sound/Copper River) Chinook, chum, coho, pink, and sockeye salmon stocks. ........... 55 21. Methods used to enumerate and develop escapement goals for Arctic-Yukon-Kuskokwim Region
Chinook, chum, coho, pink, and sockeye salmon stocks. .............................................................................. 60 22. Methods used to enumerate and develop escapement goals for Westward Region Chinook, chum, coho,
pink, and sockeye salmon stocks. .................................................................................................................. 63
LIST OF FIGURES
Figure Page 1. Statewide summary of the 287 escapement goals in effect during the 2016 spawning season for the 4
Division of Commercial Fisheries regions and by species. ........................................................................... 68 2. Proportion of escapement goal types by species for the 52 escapement goals in Southeast Region. ............ 69 3. Proportion of escapement goal types by species for the 119 escapement goals in Central Region ............... 69 4. Proportion of escapement goal types by species for the 63 escapement goals in Arctic-Yukon-
Kuskokwim Region. ...................................................................................................................................... 70 5. Proportion of escapement goal types by species for the 53 escapement goals in Westward Region ............ 70 6. Southeast Region salmon escapements compared against escapement goals for the years 2008 to 2016. .... 71 7. Central Region salmon escapements compared against escapement goals for the years 2008 to 2016......... 71 8. Arctic-Yukon-Kuskokwim Region salmon escapements compared against escapement goals for the
years 2008 to 2016. ....................................................................................................................................... 72 9. Westward Region salmon escapements compared against escapement goals for the years 2008 to 2016. ... 72 10. Statewide summary by year of percentage of escapements that a) met the escapement goal, b) were
below lower bound of goal, or c) exceeded upper bound of goal range for the years 2008 to 2016. ............ 73
LIST OF APPENDICES Appendix Page A. ESCAPEMENT GOAL MEMO FOR 2015/2016 BOARD OF FISHERIES MEETING CYCLE ............... 75
1
ABSTRACT This report summarizes statewide Pacific salmon escapement goals in effect in 2016 and documents escapements for all species and stocks with goals from 2008 through 2016. Annual escapements are compared against escapement goals in place at the time to assess outcomes, with summaries by the Division of Commercial Fisheries regions. We list methods used to enumerate escapements and to develop current escapement goals (with brief descriptions) for each monitored stock. Escapement goals were reviewed for Bristol Bay, Arctic-Yukon-Kuskokwim, Alaska Peninsula/Aleutian Islands, and Chignik management areas leading up to the 2015/2016 Board of Fisheries meeting cycle. As a result of these reviews, there were 25 escapement goal changes in 2016, including the elimination of 12 goals and the establishment of 3 new goals. In 2016, 72% of the escapement goals were met or exceeded, and 28% of the stocks did not meet minimum escapement goals.
Key words: escapement, escapement goals, Chinook salmon, sockeye salmon, coho salmon, pink salmon, chum salmon, Alaska Board of Fisheries, BOF, statewide, Alaska
INTRODUCTION Scientifically defensible Pacific salmon escapement goals are a central tenet of fisheries management in Alaska. Escapement goals are founded in the sustained yield principle highlighted in the State of Alaska Constitution (Article VIII, section 4) and in state statute (AS 16.05.020). Several policies in Alaska Administrative Code also provide guidance for establishing escapement goals including the policy for the management of sustainable salmon fisheries (5 AAC 39.222), the policy for statewide salmon escapement goals (5 AAC 39.223) and the policy for the management of mixed stock fisheries (5 AAC 39.220). These policies provide detailed definitions of specific escapement goal types, outline the responsibilities of the Alaska Department of Fish and Game (ADF&G) and the Alaska Board of Fisheries (BOF) in establishing goals, and provide general direction for development and application of escapement goals in Alaska. Currently, there are 287 active salmon stock escapement goals throughout the state of Alaska (Figure 1).
It is the responsibility of ADF&G to document, establish, and review escapement goals; prepare scientific analyses in support of escapement goals; notify the public when escapement goals are established or modified; and notify the BOF of allocative implications associated with escapement goals. The foundation for this effort is the regional or area escapement goal review teams that are assembled every 3 years to review goals, recommend changes, establish new goals, or eliminate goals. The teams have broad expertise in biological characteristics of salmon stocks and technical approaches for establishing goals. Scientific staff from headquarters may assist regional teams to address issues of general importance for escapement goal development and application in Alaska. A detailed regional report of escapement goal recommendations is presented to the BOF and the public at tri-annual BOF meetings for that region or area. Following the BOF meeting, recommended goals are presented to the directors of the Divisions of Commercial Fisheries and Sport Fish for approval.
Although development of regional escapement goals is exhaustively detailed in regional reports and supporting documents, this statewide summary report allows readers to examine the goals and escapements for salmon stocks in a single document. It provides an overview of salmon stocks with escapement goals, a numerical description of the escapement goal, type of escapement goal, year the current escapement goal was first implemented, and recent years’ escapement data for each stock. In addition, statistics documenting work done to achieve escapement goals is summarized and presented, and a statewide summary of stocks with yield or management concerns is included, as recommended by the ADF&G and established by the BOF.
2
Data presented in this document are the most recently available at the time of publication and supersede data in previous annual statewide escapement reports. This report will be a useful resource for ADF&G staff, stakeholders, and the public.
METHODS We reviewed ADF&G escapement goal reports and supporting documents to catalog current escapement goals in each region for all 5 species of Pacific salmon, including information on stock name, type of goal, numerical description of the goal, and the year it was implemented (i.e., the first season that the goal was used to manage escapements). Regional and area staff from the Divisions of Commercial Fisheries and Sport Fish provided the most current escapement estimates from 2008 through 2016 for each stock with an established escapement goal. The escapement goals listed are those in effect during the 2016 spawning season, including escapement goals that were established or updated during the 2015/2016 BOF meeting cycle (Appendix A).
Escapements from 2008 through 2016 were compared against escapement goals in place at the time of enumeration to assess outcomes in achieving goals. Escapements for a particular stock were classed as Under if escapement for a given year was less than the lower bound of the escapement goal. If escapement fell within the escapement goal range or was greater than a lower-bound goal, we considered the goal Met. Where escapement exceeded the upper bound of an escapement goal range, it was classed as Over. Where escapement goals or enumeration methods changed between 2008 and 2016 for a stock, we assessed outcomes by comparing escapement estimates with the goals and methods in place at the time of the fishery. Information on previous escapement goals and methods came from a detailed review of regional escapement goal reports, supporting documents, and conversations with regional and area biologists.
A variety of methods are used to develop escapement goals in Alaska and brief descriptions of each are summarized below. The most commonly used methods are listed first, followed by the less common methods.
Percentile Method: A method for establishing sustainable escapement goals (SEG) was originally developed by Bue and Hasbrouck1 and recently evaluated by Clark et al. (2014). Contrast of the observed annual escapements (largest escapement divided by smallest escapement), measurement error in escapements, and exploitation rate of the stock are used to select percentiles of observed escapements for estimating lower and upper bounds of the escapement goal.
Spawner–Recruit Analysis (SRA): Analysis of the relationship between escapement (number of spawners) and subsequent production of recruits (i.e., adults) in the next generation. There are several SRA models, but the Ricker production model (Ricker 1954) is almost exclusively used for salmon populations in Alaska.
Risk Analysis: Risks of management error, an unneeded management action, or mistaken inaction in future years are estimated based on a precautionary reference point established using past observations of escapement (Bernard et al. 2009). This method is primarily used to guide establishment of a lower-bound SEG for nontargeted stocks of salmon.
1 Bue, B. G., and J. J. Hasbrouck. Escapement goal review of salmon stocks of Upper Cook Inlet. Alaska Department of Fish and Game, Report
to the Alaska Board of Fisheries, November 2001 (and February 2002), Anchorage, unpublished document.
3
Yield Analysis: Graphical or tabular examination of yields produced from observed escapement indices from which the escapement range with the greatest yields is identified in Hilborn and Walters (1992).
Theoretical Spawner–Recruit Analysis (Theoretical SRA): Used in situations where there are few or no stock-specific harvest estimates and/or age data. Information from nearby stocks, or generalizations about the species, are used in a spawner–recruit production model to estimate the number of spawners needed to achieve maximum sustained yield, e.g., Clark (2005).
Empirical Observation: Goal development methods classified as Empirical Observation are generally ad hoc methods for stocks with limited or sparse data. Goals are based on observed escapements over time and may be calculated as the average escapement or the value of a low escapement for which there is evidence that the stock is able to recover, e.g., Norton Sound pink salmon escapement goals (ADF&G 2004).
Zooplankton Model: This model estimates the number of sockeye salmon Oncorhynchus nerka smolts of a threshold or optimal size that a lake can support based upon measures of zooplankton biomass and surface area of the lake (Koenings and Kyle 1997). Adult production is then estimated from predicted smolt production by applying marine survival rates for a range of smolt sizes. Spawning Habitat Model: Estimates of spawning capacity or number of spawners that produce maximum sustained yield are based on the relationship with the watershed area, available spawning habitat in a drainage, or stream length. Spawning habitat models have been developed for sockeye salmon (Burgner et al. 1969), coho salmon O. kisutch (Bradford et al. 1999; Bradford et al. 1997), and Chinook salmon O. tshawytscha (Parken et al. 2004).
Euphotic Volume (EV) Model: Measurement of the volume of a lake where enough light penetrates to support primary production (i.e., euphotic volume) is used to estimate sockeye salmon smolt biomass (Koenings and Burkett 1987) from which adult escapement is then estimated using marine survival rates.
Lake Surface Area: Similar to spawning habitat models, the relationship between the lake surface area and escapement are used to estimate adult sockeye salmon production (Honnold et al. 1996; Nelson et al. 2006).
Conditional Sustained Yield Analysis: Observed escapement indices and harvest are used to estimate if, on average, surplus production (yield) results from a particular goal range (Nelson et al. 2005). Estimated expected yields are conditioned on extreme values of measurement error in the escapement indices.
Brood Interaction Simulation Model: This model simulates production using a spawner–recruit relationship that modifies the simulated production for the year of return using an age-structured submodel, and estimates resulting catches and escapements under user-specified harvest strategies (Carlson et al. 1999). This is a hybrid of a theoretical SRA and yield analysis that has only been used to develop the escapement goal for Kenai River sockeye salmon.
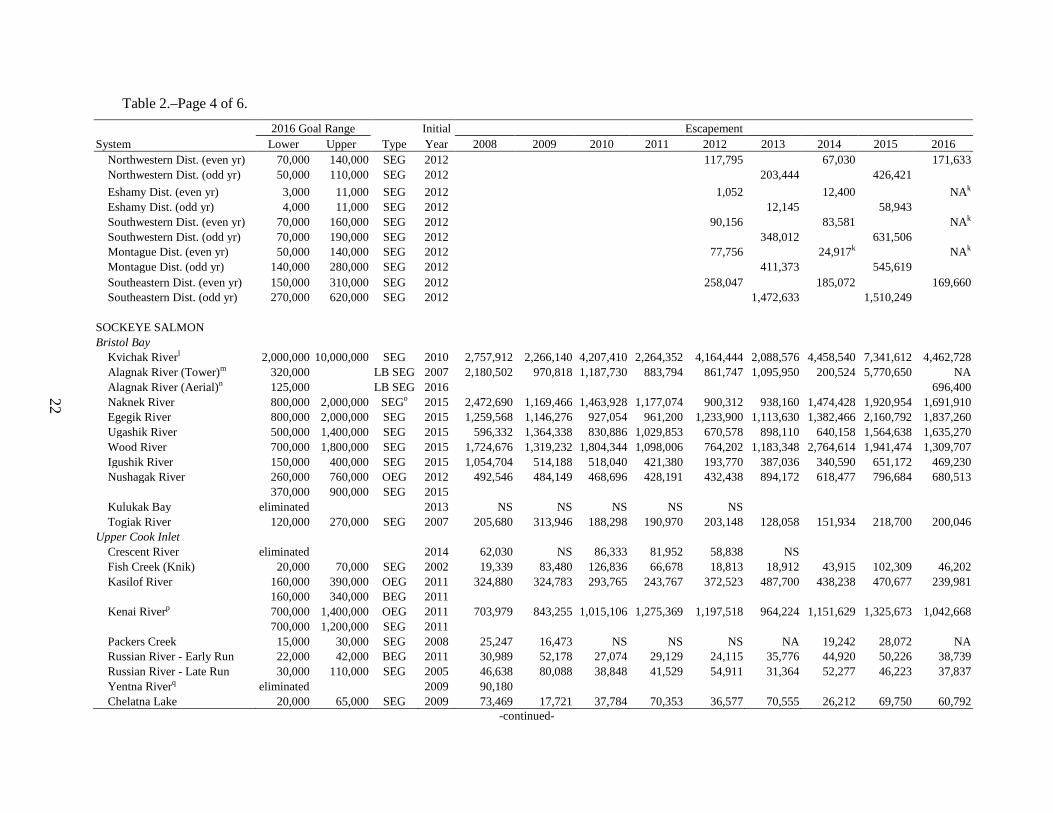
RESULTS AND DISCUSSION Summaries of estimated escapements and escapement goals for each monitored salmon stock from 2008 to 2016 are presented by region and species in Tables 1–4. Although most information was available through regional escapement goal reports, 2016 data were primarily
4
obtained directly from area and regional biologists. Data for 2016 are often preliminary estimates because complete data regarding subsistence and sport harvests are often not available immediately following the season.
During the 2015/2016 BOF meeting cycle, Bristol Bay, Arctic-Yukon-Kuskokwim, Alaska Peninsula/Aleutian Islands, and Chignik management areas reviewed their escapement goals (Conitz et al. 2015; Erickson et al. 2015; Schaberg et al. 2015a, 2015b). There were 25 escapement goal changes (Table 5), which included the elimination of 12 goals (Bristol Bay, 1; Arctic-Yukon-Kuskokwim, 9; Alaska Peninsula/Aleutian Islands, 2). Three of the eliminated goals were replaced with new goals: Niukluk River coho salmon tower-based goal was replaced with an aerial survey-based goal for Niukluk River/Ophir Creek, and the South Peninsula odd- and even-year pink salmon goals were replaced with a single goal.
A summary of escapement goal types for all species by region indicate that the majority of goals in Central, Westward, and Arctic-Yukon-Kuskokwim regions are SEGs, including lower-bound SEGs, with biological escapement goals (BEGs) making up a smaller proportion of goals (Figure 1a). The reverse is true for Southeast Region, where most goals are BEGs. Escapement goals for sockeye and Chinook salmon make up about 50% of all escapement goals statewide, with the majority of goals for each species being SEGs (Figure 1b). Optimal escapement goals (OEG) and inriver goals imposed by the BOF, and goals based upon international agreements, collectively represent a small proportion of escapement goals in Alaska.
Use of different escapement goal types for each salmon species is summarized by Division of Commercial Fisheries regions (Figures 2–5). Among the 4 regions, there are some distinct differences in the distribution of goal types by salmon species. In Southeast Region, the majority of goals are BEGs, which include all but 1 pink salmon O. gorbuscha goal, and all but 1 Chinook salmon goal, as well as 71% of the coho salmon goals, and 43% of the sockeye salmon goals (Figure 2). This is sharply contrasted with Central Region, where the majority of all goals are SEGs, with 2 sockeye salmon stocks representing the only BEGs (Figure 3). Arctic-Yukon-Kuskokwim Region has the only BEGs for chum salmon in the state, with additional BEGs for 3 Chinook and 1 sockeye salmon stock (Figure 4). All Chinook salmon stocks in Westward Region are BEGs, but compared to Southeast, a much smaller proportion of coho and sockeye salmon goals are BEGs (Figure 5). These are broad generalizations that are immediately apparent, but there are many reasons why the distribution of goal types would be different between regions, including fishery structure, stock assessment capacity, and technical approaches.
Summary comparisons of actual estimated escapements with escapement goals in place at the time are shown in Tables 6–9, highlighting whether the goal was exceeded, met, or not met. Numerous footnotes in Tables 1–4 and 6–9 contain important information about changes in stock assessment methods or goal ranges during that time, and are essential for a thorough understanding of the escapement estimates and evaluations of outcomes against goals. Summaries of outcomes in achieving goals are presented by species (Tables 10–13) and region (Tables 14–17; Figures 6–9). Patterns in achieving escapement goals from year to year have varied within each region (Tables 14–17; Figures 6–9). In 2016, 48% of the stocks assessed had escapements that were within the goal range (or above the lower bound if a lower-bound SEG), which is the same as 2015 and within the observed range for recent years (48–59%; Figure 10a). The percentage of goals where minimum escapement was not achieved in 2016 was 28%—an increase from 12% in 2015, but within the range of recent years (12–31%; Figure 10b). The
5
remaining 24% of the goals were exceeded in 2016, which was a decrease from 40% in 2015 but within the recent range (13–40%; Figure 10c).
It is important to document outcomes for meeting these goals because meeting escapement goals is fundamental to ADF&G efforts to manage for sustainable salmon stock productivity. Where escapements chronically (4–5 years) fail to meet expectations for harvestable yield or spawning escapements, ADF&G may recommendand the BOF may adopta stock of concern designation for those underperforming salmon stocks. The policy for the management of sustainable salmon fisheries (5 AAC 39.222) provides specific definitions for stocks of concern. Yield concerns arise from a chronic inability to maintain expected yields or harvestable surpluses above escapement needs. Management concerns are precipitated by a chronic failure to maintain escapements within the bounds, or above the lower bound of the established goal. A conservation concern may arise from a failure to maintain escapements above a sustained escapement threshold (SET). Methods to develop stock-specific SETs, as defined in the sustainable salmon fisheries policy, are not well developed for Pacific salmon, and no SETs or stocks of conservation concern exist in Alaska. In 2016, there were 13 stocks of concern in the state with the only change being the delisting of Norton Sound Subdistrict 1 chum salmon as a stock of concern (Table 18).
The array of methods used to enumerate salmon for each of the stocks with escapement goals, as well as methods used to assist ADF&G staff in developing the escapement goal for a given stock, are summarized by region in Tables 19–22.
ACKNOWLEDGEMENTS The authors thank the many staff members from the Divisions of Commercial Fisheries and Sport Fish who assisted with providing updates to the escapement numbers and for reviewing earlier drafts of the tables for accuracy and completeness. From Southeast Region we thank Steve Heinl. From Central Region we thank Jack Erickson, Steve Moffitt, Ted Otis, and Tim McKinley. From Arctic-Yukon-Kuskokwim Region we thank Jan Conitz, Katie Howard, and Matt Evenson, and from Westward Region we thank Kevin Schaberg, Donn Tracy, and Tyler Polum. Thank you also to Bill Templin and Rich Brenner for reviewing a draft of this report.
6
REFERENCES CITED ADF&G (Alaska Department of Fish and Game). 2004. Escapement goal review of select AYK Region salmon
stocks. Alaska Department of Fish and Game, Division of Commercial Fisheries, Regional Information Report 3A04-01, Anchorage. http://www.sf.adfg.state.ak.us/FedAidpdfs/RIR.3A.2004.01.pdf
Baker, T. T., L. F. Fair, R. A. Clark, and J. J. Hasbrouck. 2006. Review of salmon escapement goals in Bristol Bay, Alaska, 2006. Alaska Department of Fish and Game, Fishery Manuscript Series No. 06-05, Anchorage. http://www.sf.adfg.state.ak.us/FedAidPDFs/fms06-05.pdf
Baker, T. T., L. F. Fair, F. W. West, G. B. Buck, X. Zhang, S. Fleischman, and J. Erickson. 2009. Review of salmon escapement goals in Bristol Bay, Alaska, 2009. Alaska Department of Fish and Game, Fishery Manuscript Series No. 09-05, Anchorage. http://www.sf.adfg.state.ak.us/FedAidPDFs/FMS09-05.pdf
Bernard, D. R., J. J. Hasbrouck, B. G. Bue, and R. A. Clark. 2009. Estimating risk of management error from precautionary reference points (PRPs) for non-targeted salmon stocks. Alaska Department of Fish and Game, Special Publication No. 09-09, Anchorage. http://www.sf.adfg.state.ak.us/FedAidPDFs/SP09-09.pdf
Bernard, D. R., and E. L. Jones III. 2010. Optimum escapement goals for Chinook salmon in the transboundary Alsek River. Alaska Department of Fish and Game, Fishery Manuscript Series No. 10-02, Anchorage.
Bernard, D. R., S. A. McPherson, K. A. Pahlke, and P. Etherton. 2000. Optimal production of Chinook salmon from the Stikine River. Alaska Department of Fish and Game, Fishery Manuscript Series No. 00-01, Anchorage. http://www.sf.adfg.state.ak.us/FedAidPDFs/fms00-01.pdf
Bradford, M. J., R. A. Myers, and J. R. Irvine. 1999. Reference points for coho salmon (Oncorhynchus kisutch) harvest rates and escapement goals based on freshwater production. Canadian Journal of Fish and Aquatic Science 57:677–686.
Bradford, M. J., G. C. Taylor, and J. A. Allan. 1997. Empirical review of coho salmon smolt abundance and the prediction of smolt production at the region level. Transactions of the American Fisheries Society 126:49–64.
Brannian, L. K., M. J. Evenson, and J. R. Hilsinger. 2006. Escapement goal recommendations for select Arctic-Yukon-Kuskokwim region salmon stocks, 2007. Alaska Department of Fish and Game, Fishery Manuscript Series No. 06-07, Anchorage. http://www.sf.adfg.state.ak.us/FedAidPDFs/fms06-07.pdf
Bue, B. G., J. J. Hasbrouck, and M. J. Evenson. 2002. Escapement goal review of Copper River and Bering Rivers, and Prince William Sound Pacific salmon stocks. Alaska Department of Fish and Game, Division of Commercial Fisheries, Regional Information Report 2A02-35, Anchorage. http://www.sf.adfg.state.ak.us/ FedAidpdfs/RIR.2A.2002.35.PDF
Bue, B. G., K. L. Schaberg, Z. W. Liller, and D. B. Molyneaux. 2012. Estimates of the historic run and escapement for the Chinook salmon stock returning to the Kuskokwim River, 1976-2011. Alaska Department of Fish and Game, Fishery Data Series No. 12-49, Anchorage.
Burgner, R. L., C. J. D. Costanzo, R. J. Ellis, G. Y. Harry, Jr., W. L. Hartman, O. E. Kerns, Jr., O. A. Mathison, and W. F. Royce. 1969. Biological studies and estimates of optimum escapements of sockeye salmon in the major river systems of Southwestern Alaska. Fishery Bulletin 67:405–459.
Carlson, S. R., K. E. Tarbox, and B. G. Bue. 1999. The Kenai sockeye salmon simulation model: A tool for evaluating escapement and harvest levels. Alaska Department of Fish and Game, Division of Commercial Fisheries, Regional Information Report 2A99-08, Anchorage. http://www.sf.adfg.state.ak.us/ FedAidPDFs/RIR.2A.1999.08.pdf
Clark, J. E., J. H. Clark, and L. D. Shaul. 1994. Escapement goals for coho salmon stocks returning to Berners River, Auke Creek, Ford Arm Lake, and Hugh Smith Lake in Southeast Alaska. Alaska Department of Fish and Game, Division of Commercial Fisheries Management and Development, Regional Information Report 1J94-26, Douglas. http://www.sf.adfg.state.ak.us/FedAidPDFs/RIR.1J.1994.26.pdf
Clark, J. H. 2001a. Biological escapement goals for chum salmon in Subdistrict One of Norton Sound. Alaska Department of Fish and Game, Division of Commercial Fisheries, Regional Information Report 3A01-09, Anchorage. http://www.sf.adfg.state.ak.us/FedAidpdfs/RIR.3A.2001.09.pdf
7
REFERENCES CITED (Continued) Clark, J. H. 2001b. Biological escapement goals for Kwiniuk and Tubutulik chum salmon. Alaska Department of
Fish and Game, Division of Commercial Fisheries, Regional Information Report 3A01-08, Anchorage. http://www.sf.adfg.state.ak.us/FedAidpdfs/RIR.3A.2001.08.pdf
Clark, J. H., and J. E. Clark. 1994. Escapement goals for Yakutat area coho salmon stocks. Alaska Department of Fish and Game, Division of Commercial Fisheries, Regional Information Report 1J94-14, Douglas. http://www.sf.adfg.state.ak.us/FedAidPDFs/RIR.1J.1994.14.pdf
Clark, J. H., D. M. Eggers, and J. A. Edmundson. 2007. Escapement goal review for Kenai River late-run sockeye salmon: Report to the Alaska Board of Fisheries, January 2005. Alaska Department of Fish and Game, Special Publication No. 07-12, Anchorage. http://www.sf.adfg.state.ak.us/FedAidPDFs/sp07-12.pdf
Clark, J. H., S. A. McPherson, and D. M. Gaudet. 1998. Biological escapement goal for Andrew Creek Chinook salmon. Alaska Department of Fish and Game, Division of Commercial Fisheries, Regional Information Report 5J98-08, Juneau. http://www.sf.adfg.state.ak.us/FedAidPDFs/RIR.5J.1998.08.pdf
Clark, J. H., S. A. McPherson, and G. F. Woods. 2002. Biological escapement goal for sockeye salmon in the Situk River, Yakutat, Alaska. Alaska Department of Fish and Game, Special Publication No. 02-03, Anchorage. http://www.sf.adfg.state.ak.us/FedAidPDFs/sp02-03.pdf
Clark, J. H., G. F. Woods, and S. Fleischman. 2003. Revised biological escapement goal for the sockeye salmon stock returning to the East Alsek-Doame river system of Yakutat, Alaska. Alaska Department of Fish and Game, Special Publication No. 03-04, Anchorage. http://www.sf.adfg.state.ak.us/FedAidPDFs/sp03-04.pdf
Clark, R. A. 2005. Stock status and recommended escapement goals for coho salmon in selected waters along the Juneau road system, 1981-2004. Alaska Department of Fish and Game, Special Publication No. 05-21, Anchorage. http://www.sf.adfg.state.ak.us/FedAidPDFs/sp05-21.pdf
Clark, R. A., D. M. Eggers, A. R. Munro, S. J. Fleischman, B. G. Bue, and J. J. Hasbrouck. 2014. An evaluation of the percentile approach for establishing Sustainable Escapement Goals in lieu of stock productivity information. Alaska Department of Fish and Game, Fishery Manuscript Series No. 14-06, Anchorage. http://www.adfg.alaska.gov/FedAidPDFs/FMS14-06.pdf
Conitz, J. M., K. G. Howard, and M. J. Evenson. 2015. Escapement goal recommendations for select Arctic-Yukon-Kuskokwim Region salmon stocks, 2016. Alaska Department of Fish and Game, Fishery Manuscript Series No. 15-08, Anchorage. http://www.adfg.alaska.gov/FedAidPDFs/FMS15-08.pdf
Der Hovanisian, J. 2013. Escapement goal for Klawock River coho salmon. Alaska Department of Fish and Game, Fishery Manuscript Series No. 13-09, Anchorage. http://www.adfg.alaska.gov/FedAidPDFs/FMS13-09.pdf
Eggers, D. M. 2001. Biological escapement goals for Yukon River Fall chum salmon. Alaska Department of Fish and Game, Division of Commercial Fisheries, Regional Information Report 3A01-10, Anchorage. http://www.sf.adfg.state.ak.us/FedAidpdfs/RIR.3A.2001.10.pdf
Eggers, D. M., R. L. Bachman, and J. Stahl. 2010. Stock status and escapement goals for Chilkat Lake sockeye salmon in Southeast Alaska. Alaska Department of Fish and Game, Fishery Manuscript Series No. 10-05, Anchorage. http://www.sf.adfg.state.ak.us/FedAidpdfs/Fms10-05.pdf
Eggers, D. M., and D. R. Bernard. 2011. Run reconstruction and escapement goals for Alsek River sockeye salmon. Alaska Department of Fish and Game, Fishery Manuscript Series No. 11-01, Anchorage.
Eggers, D. M., and J. H. Clark. 2006. Assessment of historical runs and escapement goals for Kotzebue area chum salmon. Alaska Department of Fish and Game, Fishery Manuscript Series No. 06-01, Anchorage. http://www.sf.adfg.state.ak.us/FedAidPDFs/fms06-01.pdf
Eggers, D. M., J. H. Clark, R. L. Bachman, and S. C. Heinl. 2008. Sockeye salmon stock status and escapement goals in Southeast Alaska. Alaska Department of Fish and Game, Special Publication No. 08-17, Anchorage. http://www.sf.adfg.state.ak.us/FedAidPDFs/sp08-17.pdf
8
REFERENCES CITED (Continued) Eggers, D. M., and S. C. Heinl. 2008. Chum salmon stock status and escapement goals in Southeast Alaska. Alaska
Department of Fish and Game, Special Publication No. 08-19, Anchorage. http://www.sf.adfg.state.ak.us/FedAidpdfs/sp08-19.pdf
Eggers, D. M., S. C. Heinl, and A. W. Piston. 2009a. McDonald Lake sockeye salmon stock status and escapement goal recommendations, 2008. Alaska Department of Fish and Game, Fishery Data Series No. 09-31, Anchorage. http://www.sf.adfg.state.ak.us/FedAidPDFs/FDS09-31.pdf
Eggers, D. M., X. Zhang, R. L. Bachman, and M. M. Sogge. 2009b. Sockeye salmon stock status and escapement goals for Chilkoot Lake in Southeast Alaska. Alaska Department of Fish and Game, Fishery Data Series No. 09-63, Anchorage. http://www.sf.adfg.state.ak.us/FedAidPDFs/FDS09-63.pdf
Erickson, J. W., C. E. Brazil, X. Zhang, T. R. McKinley, and R. A. Clark. 2015. Review of salmon escapement goals in Bristol Bay, Alaska, 2015. Alaska Department of Fish and Game, Fishery Manuscript Series No. 15-06, Anchorage. http://www.adfg.alaska.gov/FedAidPDFs/FMS15-06.pdf
Ericksen, R. P., and S. J. Fleischman. 2006. Optimal production of coho salmon from the Chilkat River. Alaska Department of Fish and Game, Fishery Manuscript Series No. 06-06, Anchorage. http://www.sf.adfg.state.ak.us/FedAidPDFs/fms06-06.pdf
Ericksen, R. P., and S. A. McPherson. 2004. Optimal production of Chinook salmon from the Chilkat River. Alaska Department of Fish and Game, Fishery Manuscript Series No. 04-01, Anchorage. http://www.sf.adfg.state.ak.us/FedAidPDFs/fms04-01.pdf
Evenson, M. J. 2002. Optimal production of Chinook salmon from the Chena and Salcha rivers. Alaska Department of Fish and Game, Fishery Manuscript Series No. 02-1, Anchorage. http://www.sf.adfg.state.ak.us/FedAidPDFs/fms02-01.pdf
Evenson, M. J., J. J. Hasbrouck, S. D. Moffitt, and L. Fair. 2008. Escapement goal review for Copper River, Bering River, and Prince William Sound salmon stocks. Alaska Department of Fish and Game, Fishery Manuscript Series No. 08-01, Anchorage. http://www.sf.adfg.state.ak.us/FedAidpdfs/fms08-01.pdf
Fair, L. F., B. G. Bue, R. A. Clark, and J. J. Hasbrouck. 2004. Spawning escapement goal review of Bristol Bay salmon stocks. Alaska Department of Fish and Game, Division of Commercial Fisheries, Regional Information Report 2A04-17, Anchorage. http://www.sf.adfg.state.ak.us/FedAidpdfs/RIR.2A.2004.17.pdf
Fair, L. F., C. E. Brazil, X. Zhang, R. A. Clark, and J. W. Erickson. 2012. Review of salmon escapement goals in Bristol Bay, Alaska, 2012. Alaska Department of Fish and Game, Fishery Manuscript Series No. 12-04, Anchorage. http://www.adfg.alaska.gov/FedAidPDFs/FMS12-04.pdf
Fair, L. F., R. A. Clark, and J. J. Hasbrouck. 2007. Review of salmon escapement goals in Upper Cook Inlet, Alaska, 2007. Alaska Department of Fish and Game, Fishery Manuscript Series No. 07-06, Anchorage. http://www.sf.adfg.state.ak.us/FedAidPDFs/fms07-06.pdf
Fair, L. F., S. D. Moffitt, M. J. Evenson, and J. Erickson. 2008. Escapement goal review of Copper and Bering rivers, and Prince William Sound Pacific salmon stocks, 2008. Alaska Department of Fish and Game, Fishery Manuscript Series No. 08–02, Anchorage. http://www.sf.adfg.state.ak.us/FedAidPDFs/fms08-02.pdf
Fair, L. F., S. D. Moffitt, M. J. Evenson, and J. W. Erickson. 2011. Escapement goal review of Copper and Bering rivers, and Prince William Sound Pacific salmon stocks, 2011. Alaska Department of Fish and Game, Fishery Manuscript Series No. 11–07, Anchorage. http://www.adfg.alaska.gov/FedAidPDFs/FMS11-07.pdf
Fair, L. F., T. M. Willette, and J. Erickson. 2009. Escapement goal review for Susitna River sockeye salmon, 2009. Alaska Department of Fish and Game, Fishery Manuscript Series No. 09-01, Anchorage. http://www.sf.adfg.state.ak.us/FedAidPDFs/fms09-01.pdf
Fair, L. F., T. M. Willette, and J. W. Erickson. 2013. Review of salmon escapement goals in Upper Cook Inlet, Alaska, 2013. Alaska Department of Fish and Game, Fishery Manuscript Series No. 13-13, Anchorage. http://www.adfg.alaska.gov/FedAidPDFs/FMS13-13.pdf
9
REFERENCES CITED (Continued) Fair, L. F., T. M. Willette, J. W. Erickson, R. J. Yanusz, and T. R. McKinley. 2010. Review of salmon escapement
goals in Upper Cook Inlet, Alaska, 2011. Alaska Department of Fish and Game, Fishery Manuscript Series No. 10-06, Anchorage. http://www.sf.adfg.state.ak.us/FedAidpdfs/FMS10-06.pdf
Fleischman, S. J., and B. M. Borba. 2009. Escapement estimation, spawner-recruit analysis, and escapement goal recommendation for fall chum salmon in the Yukon River drainage. Alaska Department of Fish and Game, Fishery Manuscript Series No. 09-08, Anchorage. http://www.sf.adfg.state.ak.us/FedAidpdfs/FMS09-08.pdf
Fleischman, S. J., and D. Evenson. 2010. Run reconstruction, spawner-recruit analysis, and escapement goal recommendation for summer chum salmon in the East Fork of the Andreafsky River. Alaska Department of Fish and Game, Fishery Manuscript Series No. 10-04, Anchorage. http://www.sf.adfg.state.ak.us/FedAidpdfs/FMS10-04.pdf
Fleischman, S. J., J. A. Der Hovanisian, and S. A. McPherson. 2011. Escapement goals for Chinook salmon in the Blossom and Keta rivers. Alaska Department of Fish and Game, Fishery Manuscript Series No. 11-05, Anchorage. http://www.adfg.alaska.gov/FedAidpdfs/FMS11-05.pdf
Fleischman, S. J., and T. R. McKinley. 2013. Run reconstruction, spawner–recruit analysis, and escapement goal recommendation for late-run Chinook salmon in the Kenai River. Alaska Department of Fish and Game, Fishery Manuscript Series No. 13-02, Anchorage. http://www.adfg.alaska.gov/FedAidPDFs/FMS13-02.pdf
Geiger, H. J. 2003. Sockeye salmon stock status and escapement goal for Redoubt Lake in Southeast Alaska. Alaska Department of Fish and Game, Division of Commercial Fisheries, Regional Information Report 1J03-01, Juneau. http://www.sf.adfg.state.ak.us/FedAidPDfs/RIR.1J.2003.01.pdf
Geiger, H. J., T. P. Zadina, and S. C. Heinl. 2003. Sockeye salmon stock status and escapement goal for Hugh Smith Lake in Southeast Alaska. Alaska Department of Fish and Game, Division of Commercial Fisheries, Regional Information Report 1J03-05, Juneau. http://www.sf.adfg.state.ak.us/FedAidPDfs/RIR.1J.2003.05.pdf
Hamazaki, T., and J. M. Conitz. 2015. Yukon River summer chum salmon run reconstruction, spawner-recruitment analysis, and escapement goal recommendation. Alaska Department of Fish and Game, Fishery Manuscript Series No. 15-07, Anchorage. http://www.adfg.alaska.gov/FedAidPDFs/FMS15-07.pdf
Hamazaki, T., M. J. Evenson, S. J. Fleischman, and K. L. Schaberg. 2012. Spawner-recruit analysis and escapement goal recommendation for Chinook salmon in the Kuskokwim River Drainage. Alaska Department of Fish and Game, Fishery Manuscript Series No. 12-08, Anchorage.
Hasbrouck, J. J., and J. A. Edmundson. 2007. Escapement goals for salmon stocks in Upper Cook Inlet, Alaska: report to the Alaska Board of Fisheries, January 2005. Alaska Department of Fish and Game, Special Publication No. 07-10, Anchorage. http://www.sf.adfg.state.ak.us/FedAidPDFs/sp07-10.pdf
Heinl, S. C., D. M. Eggers, and A. W. Piston. 2008. Pink salmon stock status and escapement goals in Southeast Alaska and Yakutat. Alaska Department of Fish and Game, Special Publication No. 08-16, Anchorage. http://www.sf.adfg.state.ak.us/FedAidPDFs/sp08-16.pdf
Heinl, S. C., E. L. Jones III, A. W. Piston, P. J. Richards, and L. D. Shaul. 2014a. Review of salmon escapement goals in Southeast Alaska, 2014. Alaska Department of Fish and Game, Fishery Manuscript Series No. 14-07, Anchorage. http://www.adfg.alaska.gov/FedAidPDFs/FMS14-07.pdf
Heinl, S. C., S. Miller, and J. A. Bednarski. 2014b. Speel Lake sockeye salmon stock status and escapement goal review. Alaska Department of Fish and Game, Fishery Manuscript Series No. 14-04, Anchorage. http://www.adfg.alaska.gov/FedAidPDFs/FMS14-04.pdf
Hendrich, C. F., J. L. Weller, S. A. McPherson, and D. R. Bernard. 2008. Optimal production of Chinook salmon from the Unuk River. Alaska Department of Fish and Game, Fishery Manuscript Series No. 08-03, Anchorage. http://www.sf.adfg.state.ak.us/FedAidPDFs/fms08-03.pdf
Hilborn, R., and C. J. Walters. 1992. Quantitative fisheries stock assessment: Choice, dynamics and uncertainty. Chapman and Hall, New York.
10
REFERENCES CITED (Continued) Honnold, S. G., J. A. Edmundson, and S. Schrof. 1996. Limnological and fishery assessment of 23 Alaska Peninsula
and Aleutian area lakes, 1993–1995: An evaluation of potential sockeye and coho salmon production. Alaska Department of Fish and Game, Commercial Fisheries Management and Development Division, Regional Information Report 4K96-52, Kodiak. http://www.sf.adfg.state.ak.us/FedAidPDFs/rir.4k.1996.52.pdf
Honnold, S. G., M. J. Witteveen, M. B. Foster, I. Vining, and J. J. Hasbrouck. 2007a. Review of escapement goals for salmon stocks in the Kodiak Management Area, Alaska. Alaska Department of Fish and Game, Fishery Manuscript Series No. 07-10, Anchorage. http://www.sf.adfg.state.ak.us/FedAidpdfs/fms07-10.pdf
Honnold, S. G., M. J. Witteveen, I. Vining, H. Finkle, M. B. Foster, and J. J. Hasbrouck. 2007b. Review of salmon escapement goals in the Alaska Peninsula Aleutian Islands Management Areas, 2006. Alaska Department of Fish and Game, Fishery Manuscript Series No. 07-02, Anchorage. http://www.sf.adfg.state.ak.us/FedAidPDFs/fms07-02.pdf
Humphreys, R. D., S. M. McKinnel, D. Welch, M. Stocker, B. Turris, F. Dickson, and D. Ware, editors. 1994. Pacific Stock Assessment Review Committee (PSARC) Annual Report for 1993. Canadian Manuscript, Report of Fisheries and Aquatic Sciences, Number 2227.
JTC (Joint Technical Committee of the Yukon River US/Canada Panel). 2008. Yukon River salmon 2007 season summary and 2008 season outlook. Alaska Department of Fish and Game, Division of Commercial Fisheries, Regional Information Report 3A08-01, Anchorage. http://www.sf.adfg.state.ak.us/ FedAidPDfs/RIR.3A.2008.01.pdf
JTC (Joint Technical Committee of the Yukon River US/Canada Panel). 2010. Yukon River salmon 2009 season summary and 2010 season outlook. Alaska Department of Fish and Game, Division of Commercial Fisheries, Regional Information Report 3A10-01, Anchorage. http://www.sf.adfg.state.ak.us/FedAidpdfs/RIR.3A.2010.01
JTC (Joint Technical Committee of the Yukon River US/Canada Panel). 2013. Yukon River salmon 2012 season summary and 2013 season outlook. Alaska Department of Fish and Game, Division of Commercial Fisheries, Regional Information Report 3A13-02, Anchorage.
JTC (Joint Technical Committee of the Yukon River US/Canada Panel). 2015. Yukon River salmon 2014 season summary and 2015 season outlook. Alaska Department of Fish and Game, Division of Commercial Fisheries, Regional Information Report 3A15-01, Anchorage.
Koenings, J. P., and R. D. Burkett. 1987. Population characteristics of sockeye salmon (Oncorhynchus nerka) smolts relative to temperature regimes, euphotic volume, fry density, and forage base within Alaskan lakes. Pages 216–234 [In] H. D. Smith, L. Margolis, and C. C. Wood, editors. Sockeye salmon (Oncorhynchus nerka) population biology and future management. Canadian Journal of Fisheries and Aquatic Sciences Special Publication No. 96, Canada.
Koenings, J. P., and G. B. Kyle. 1997. Consequences to juvenile sockeye salmon and the zooplankton community resulting from intense predation. Alaska Fishery Research Bulletin 4(2):120–135.
McKinley, T. R., and S. J. Fleischman. 2013. Run reconstruction, spawner–recruit analysis, and escapement goal recommendation for early-run Chinook salmon in the Kenai River. Alaska Department of Fish and Game, Fishery Manuscript Series No. 13-03, Anchorage. http://www.adfg.alaska.gov/FedAidPDFs/FMS13-03.pdf
McPherson, S. A., and J. Carlile. 1997. Spawner-recruit analysis of Behm Canal Chinook salmon stocks. Alaska Department of Fish and Game, Division of Commercial Fisheries, Regional Information Report 1J97-06, Juneau. http://www.sf.adfg.state.ak.us/FedAidpdfs/RIR.1J.1997.06.pdf
McPherson, S., and J. H. Clark. 2001. Biologcial escapement goal for King Salmon River Chinook salmon. Alaska Department of Fish and Game, Division of Commercial Fisheries, Regional Information Report 1J01-40, Juneau.
McPherson, S. A., R. E. Johnson, and G. F. Woods. 2005. Optimal production of Chinook salmon from the Situk River. Alaska Department of Fish and Game, Fishery Manuscript Series No. 05-04, Anchorage. http://www.sf.adfg.state.ak.us/FedAidPDFs/Fms05-04.pdf
11
REFERENCES CITED (Continued) McPherson, S. A., E. L. Jones III, S. J. Fleischman, and I. M. Boyce. 2010. Optimal production of Chinook salmon
from the Taku River through the 2001 year class. Alaska Department of Fish and Game, Fishery Manuscript Series No. 10-03, Anchorage. http://www.sf.adfg.state.ak.us/FedAidpdfs/Fms10-03.pdf
Molyneaux, D. B., and L. K. Brannian. 2006. Review of escapement and abundance information for Kuskokwim area salmon stocks. Alaska Department of Fish and Game, Fishery Manuscript Series No. 06-08, Anchorage. http://www.sf.adfg.state.ak.us/FedAidpdfs/fms06-08.pdf
Nelson, P. A., J. J. Hasbrouck, M. J. Witteveen, K. A. Bouwens, and I. Vining. 2006. Review of salmon escapement goals in the Alaska Peninsula and Aleutian Islands Management Areas. Report to the Alaska Board of Fisheries, 2004. Alaska Department of Fish and Game, Fishery Manuscript Series No. 06-03, Anchorage. http://www.sf.adfg.state.ak.us/FedAidPDFs/fms06-03.pdf
Nelson, P. A., and D. S. Lloyd. 2001. Escapement goals for Pacific salmon in the Kodiak, Chignik, and Alaska Peninsula/Aleutian Islands Areas of Alaska. Alaska Department of Fish and Game, Division of Commercial Fisheries, Regional Information Report 4K01-66, Kodiak. http://www.adfg.alaska.gov/FedAidPDFs/RIR.4K.2001.66.pdf
Nelson, P. A., M. J. Witteveen, S. G. Honnold, I. Vining, and J. J. Hasbrouck. 2005. Review of salmon escapement goals in the Kodiak Management Area. Alaska Department of Fish and Game, Fishery Manuscript Series No. 05-05, Anchorage. http://www.sf.adfg.state.ak.us/FedAidPDFs/fms05-05.pdf
Nemeth, M. J., M. J. Witteveen, M. B. Foster, H. Finkle, J. W. Erickson, J. S. Schmidt, S. J. Fleischman, and D. Tracy. 2010. Review of escapement goals in 2010 for salmon stocks in the Kodiak Management Area, Alaska. Alaska Department of Fish and Game, Fishery Manuscript Series No. 10-09, Anchorage. http://www.sf.adfg.state.ak.us/FedAidpdfs/FMS10-09.pdf
Otis, E. O., L. F. Fair, and J. W. Erickson. 2013. A review of escapement goals for salmon stocks in Lower Cook Inlet, Alaska, 2013. Alaska Department of Fish and Game, Fishery Manuscript Series No. 13-08, Anchorage. http://www.adfg.alaska.gov/FedAidPDFs/FMS13-08.pdf
Otis, E. O., and N. J. Szarzi. 2007. A review of escapement goals for salmon stocks in Lower Cook Inlet, Alaska, 2007. Alaska Department of Fish and Game, Fishery Manuscript Series No. 07-04, Anchorage. http://www.sf.adfg.state.ak.us/FedAidpdfs/fms07-04.pdf
Otis, E. O., N. J. Szarzi, L. F. Fair, and J. W. Erickson. 2010. A review of escapement goals for salmon stocks in Lower Cook Inlet, Alaska, 2010. Alaska Department of Fish and Game, Fishery Manuscript Series No. 10-07, Anchorage. http://www.sf.adfg.state.ak.us/FedAidpdfs/Fms10-07.pdf
Otis, T. 2001. Report to the Alaska Board of Fisheries on sustainable escapement goals for chum, pink, and sockeye salmon in lower Cook Inlet. Alaska Department of Fish and Game, Division of Commercial Fisheries, Regional Information Report 2A01-21, Anchorage. http://www.sf.adfg.state.ak.us/FedAidPDFs/RIR.2A.2001.21.pdf
Parken, C., R. E. McNicol, and J. R. Irvine. 2004. Habitat-based methods to estimate escapement goals for Chinook salmon stocks in British Columbia. PSARC Working Papers, British Columbia, Canada.
Pestal, G., and S. Johnston. 2015. Estimates of a biologically-based spawning goal and biological benchmarks for the Canadian-origin Taku River coho stock aggregate. Fisheries and Oceans Canada, Canadian Science Advisory Secretariat 2015/048. http://www.dfo-mpo.gc.ca/csas-sccs/publications/resdocs-docrech/2015/2015_048-eng.pdf
Piston, A. W., and S. C. Heinl. 2011a. Chum salmon stock status and escapement goals in Southeast Alaska. Alaska Department of Fish and Game, Special Publication No. 11-21 Anchorage. http://www.adfg.alaska.gov/FedAidPDFs/SP11-21.pdf
Piston, A. W., and S. C. Heinl. 2011b. Pink salmon stock status and escapement goals in Southeast Alaska. Alaska Department of Fish and Game, Special Publication No. 11-18, Anchorage. http://www.adfg.alaska.gov/FedAidPDFs/SP11-18.pdf
12
REFERENCES CITED (Continued) Piston, A. W., and S. C. Heinl. 2014. Chum salmon stock status and escapement goals in Southeast Alaska. Alaska
Department of Fish and Game, Special Publication No. 14-13. http://www.adfg.alaska.gov/FedAidPDFs/SP14-13.pdf
Ricker, W. E. 1954. Stock and recruitment. Journal of Fisheries and Research Board of Canada 11:559–623.
Sagalkin, N. H., B. Foster, M. B. Loewen, and J. W. Erickson. 2013a. Review of salmon escapement goals in the Kodiak Management Area, 2013. Alaska Department of Fish and Game, Fishery Manuscript Series No. 13-11, Anchorage. http://www.adfg.alaska.gov/FedAidPDFs/FMS13-11.pdf
Sagalkin, N. H., A. St. Saviour, J. W. Erickson, and H. Finkle. 2013b. Review of salmon escapement goals in the Chignik Management Area, 2013. Alaska Department of Fish and Game, Fishery Manuscript Series No. 13-06, Anchorage.
Savereide, J. W. 2001. An age structured model for assessment and management of Copper River Chinook salmon. Masters thesis, University of Alaska Fairbanks.
Schaberg, K. L., H. Finkle, M. B. Foster, D. L. Tracy, and M. L. Wattum. 2015a. Review of salmon escapement goals in the Alaska Peninsula and Aleutian Islands Management Areas, 2015. Alaska Department of Fish and Game, Fishery Manuscript Series No. 15-03, Anchorage. http://www.adfg.alaska.gov/FedAidPDFs/FMS15-03.pdf
Schaberg, K. L., D. A. Tracy, M. B. Foster, and M. Loewen. 2015b. Review of salmon escapement goals in the Chignik Management Area, 2015. Alaska Department of Fish and Game, Fishery Manuscript Series No. 15-02, Anchorage. http://www.adfg.alaska.gov/FedAidPDFs/FMS15-02.pdf
Schmidt, J., T. Polum, and D. Evans. 2014. Stock assessment of Buskin River coho salmon, 2008-2010. Alaska Department of Fish and Game, Fishery Data Series No. 14-41, Anchorage. http://www.adfg.alaska.gov/FedAidPDFs/FDS14-41.pdf
Shaul, L. D., K. F. Crabtree, M. Kemp, and N. Olmsted. 2009. Coho salmon studies at Hugh Smith Lake, 1982–2007. Alaska Department of Fish and Game, Fishery Manuscript Series No. 09-04, Anchorage. http://www.sf.adfg.state.ak.us/FedAidPDFs/FMS09-04.pdf
Shaul, L. D., and T. A. Tydingco. 2006. Escapement goals for coho salmon counted in aggregate surveys in the Ketchikan and Sitka areas. Alaska Department of Fish and Game, Special Publication No. 06-11, Anchorage. http://www.sf.adfg.state.ak.us/FedAidPDFs/sp06-11.pdf
Szarzi, N. J., S. J. Fleischman, R. A. Clark, and C. M. Kerkvliet. 2007. Stock status and recommended escapement goal for Anchor River Chinook salmon. Alaska Department of Fish and Game, Fishery Manuscript Series No. 07-05, Anchorage. http://www.sf.adfg.state.ak.us/FedAidpdfs/fms07-05
TTC (Transboundary Technical Committee). 1986. Report of the Canada/United States Transboundary Technical Committee, Final Report. TCTR (86).
TTC (Transboundary Technical Committee). 1987. Stikine River sockeye salmon management plan, 1987. Pacific Salmon Commission Report TCTR (87)-1, Vancouver.
TTC (Transboundary Technical Committee). 1990. Long-term research plans for the transboundary rivers. Pacific Salmon Commission Report TCTR (90)-3.
TTC (Transboundary Technical Committee). 1993. Salmon management and enhancement plans for the Stikine, Taku, and Alsek rivers, 1993. Pacific Salmon Commission Report TCTR (93)-2, Vancouver.
TTC (Transboundary Technical Committee). 2014. Salmon management and enhancement plans for the Stikine, Taku and Alsek rivers, 2013. Pacific Salmon Commission Report TCTR 14-1. http://www.psc.org/pubs/TCTR14-1.pdf
TTC (Transboundary Technical Committee). 2015. Salmon management and enhancement plans for the Stikine, Taku and Alsek rivers, 2015. http://www.psc.org/pubs/TCTR15-1.pdf
13
REFERENCES CITED (Continued) Volk, E., M. J. Evenson, and R. A. Clark. 2009. Escapement goal recommendations for select Arctic-Yukon-
Kuskokwim Region salmon stocks, 2010. Alaska Department of Fish and Game, Fishery Manuscript Series No. 09-07, Anchorage. http://www.sf.adfg.state.ak.us/FedAidpdfs/FMS09-07.pdf
Witteveen, M. J., H. Finkle, J. J. Hasbrouck, and I. Vining. 2007. Review of salmon escapement goals in the Chignik Management Area, 2007. Alaska Department of Fish and Game, Fishery Manuscript Series No. 07-09, Anchorage. http://www.sf.adfg.state.ak.us/FedAidpdfs/fms07-09.pdf
Witteveen, M. J., H. Finkle, M. Loewen, M. B. Foster, and J. W. Erickson. 2009. Review of salmon escapement goals in the Alaska Peninsula and Aleutian Islands Management Areas; a report to the Alaska Board of Fisheries, 2010. Alaska Department of Fish and Game, Fishery Manuscript Series No. 09-09, Anchorage. http://www.sf.adfg.state.ak.us/FedAidpdfs/FMS09-09.pdf
Witteveen, M. J., H. Finkle, P. A. Nelson, J. J. Hasbrouck, and I. Vining. 2005. Review of salmon escapement goals in the Chignik Management Area. Alaska Department of Fish and Game, Fishery Manuscript Series No. 05-06, Anchorage. http://www.sf.adfg.state.ak.us/FedAidPDFs/fms05-06.pdf

14

15
TABLES
16
Table 1.–Southeast Region Chinook, chum, coho, pink, and sockeye salmon escapement goals and escapements, 2008 to 2016.
2016 Goal Range Initial Escapement System Lower Upper Type Year 2008 2009 2010 2011 2012 2013 2014 2015 2016 CHINOOK SALMONa
Blossom River 150 300 BEG 2012 257 123 363 147 205 255 171 166 135 Keta River 175 400 BEG 2012 363 219 475 223 241 493 439 304 446 Unuk River 1,800 3,800 BEG 2009 3,104 3,157 3,835 3,195 956b 1,135b 1,691b 2,623 1,463 Chickamin River 450 900 BEG 1997 1,111 611 1,156 853 444 468 652 567 203 Andrew Creek 650 1,500 BEG 1998 981 628 1,205 936 587 920 1,261 796 402 Stikine River 14,000 28,000 BEG 2000 18,352 12,803c 15,116c 14,482c 22,327c 16,783c 24,366c 23,236c 10,344c King Salmon River 120 240 BEG 1997 120 109 158 192 155 94 68 50 149 Taku River 19,000 36,000 BEG 2009 26,645c 22,761c 28,769c 27,523c 19,538c 18,002c 23,532c 28,827c 12,381c Chilkat River 1,850 3,600 inriverd 2003 2,905 4,429 1,815 2,688 1,744c 1,730c 1,534c 2,453c 1,373c
1,750 3,500 BEG 2003
Klukshu (Alsek) River 800 1,200 BEG 2013 466 1,518 2,259 1,610 693c 1,227c 832c 1,388 646c Alsek Rivere 3,500 5,300 BEG 2013 1,885 6,239 9,526 6,850 3,027c 4,992c 3,357c 5,697c 2,504c Situk River 450 1,050 BEG 2003 413 902 166f 240 322 912 475 174 329
CHUM SALMON Southern Southeast Summer 62,000
LB SEG 2015 13,000 46,000 51,000 179,000 155,000 86,000 47,000 115,000 90,000
Northern Southeast Inside Summer
119,000
LB SEG 2012 99,000 107,000 77,000 125,000 177,000 278,000 93,000 166,000 66,000
Northern Southeast Outside Summer
25,000
LB SEG 2015 56,000 17,000 28,000 25,000 38,000 23,000 28,000 26,000 26,000
Cholmondeley Sound Fall 30,000 48,000 SEG 2009 50,000 39,000 76,000 93,000 54,000 13,000 48,000 73,000 30,000 Port Camden Fall 2,000 7,000 SEG 2009 1,400 1,700 5,400 1,800 3,800 2,400 4,300 7,300 4,700 Security Bay Fall 5,000 15,000 SEG 2009 11,700 5,100 6,500 5,100 9,800 2,800 6,300 21,500 14,300 Excursion River Fall 4,000 18,000 SEG 2009 8,000 1,400 6,100 3,000 2,000 7,600 10,800 12,000 1,400 Chilkat River Fall 75,000 250,000 SEG 2015 441,000 329,000 89,000 360,000 287,000 166,000 142,000 207,000 218,000
COHO SALMON Hugh Smith Lake 500 1,600 BEG 2009 1,741 2,281 2,878 2,137 1,908 3,048 4,110 956 979
Klawock River 4,000 9,000 SEG 2013g 6,210 5,415 9,707 5,572 7,507 8,323 7,698 12,780 24,242 Taku Riverh 50,000 90,000 BEG 2015 95,226c 103,950c 126,830c 70,871c 70,775c 68,117c 124,171c 60,178c 87,704c Auke Creek 200 500 BEG 1994 600 360 417 517 837 736 1,533 577 204 Montana Creek 400 1,200 SEG 2006 405 698 630 709 394 367 911 1,204 746 Peterson Creek 100 250 SEG 2006 660 123 467 138 190 126 284 202 52 Ketchikan Survey Index 4,250 8,500 BEG 2006 16,752 8,710 4,563 5,098 11,960 11,295 16,675 9,750 13,420 Sitka Survey Index 400 800 BEG 2006 1,117 1,156 1,273 2,222 1,157 1,414 2,161 2,244 2,943 Ford Arm Lake 1,300 2,900 BEG 1994 5,173 2,181 1,610 1,908 2,282 1,573 3,025 3,281 NA Berners River 4,000 9,200 BEG 1994 6,870 4,230 7,520 6,050 5,480 6,280 15,480 9,940 6,733
-continued-
17
Table 1.–Page 2 of 3.
2016 Goal Range Initial Escapement System Lower Upper Type Year 2008 2009 2010 2011 2012 2013 2014 2015 2016 Chilkat River 30,000 70,000 BEG 2006 56,369 47,911 84,909 61,099 36,961 51,324 130,200 47,342 26,280 Lost River eliminated
2015 NA 3,581 2,393 1,221 2,200 2,593 3,555
Tawah Creek (Lost River) 1,400 4,200 SEG 2015 NA 3,581 2,393 1,221 NA 2,593 3,555 2,015 746 Situk River 3,300 9,800 BEG 1994 NA 5,814 11,195 3,652 3,007 14,853 8,226 7,062 6,177 Tsiu/Tsivat Rivers 10,000 29,000 BEG 1994 25,200 28,000 11,000 21,000 10,500 47,000 27,000 19,500 31,000
PINK SALMON Southern Southeast 3,000,000 8,000,000 BEG 2009 6,290,000 7,200,000 5,940,000 5,500,000 6,470,000 14,450,000 9,650,000 4,300,000 6,600,000
Northern Southeast Inside 2,500,000 6,000,000 BEG 2009 1,470,000 3,650,000 3,210,000 6,030,000 2,110,000 5,400,000 1,380,000 5,250,000 1,700,000 Northern Southeast Outside 750,000 2,500,000 BEG 2009 1,730,000 1,820,000 2,010,000 2,730,000 2,470,000 5,340,000 2,750,000 2,840,000 1,780,000 Situk River (even-year) eliminated
2012 1,232i 89,301i
Situk River (odd-year) eliminated
2012 62,787 169,908 Situk River 33,000
LB SEG 2012 30,548 133,656 28,238 62,714 24,949
SOCKEYE SALMON Hugh Smith Lake 8,000 18,000 OEGj 2003 3,588 9,483 15,646 22,029 13,353 5,946 10,397 21,296 12,864
8,000 18,000 BEG 2003
McDonald Lake 55,000 120,000 SEG 2009 20,700 51,000 72,500 113,000 57,000 15,400 43,400 70,200 15,600 Mainstem Stikine River 20,000 40,000 SEG 1987 16,178 17,148 24,831 29,393 33,812 27,091 21,179 26,432c 34,588c Tahltan Lakek 18,000 30,000 BEG 1993 10,416 30,324 22,702 34,248 13,463 15,828 39,745 33,159 38,458c Speel Lake 4,000 9,000 SEG 2015 1,763 3,689 5,640 4,777 5,681 6,426 5,059 4,888 5,571 Taku River 71,000 80,000 SEG 1986 68,059 71,837 88,367 115,383 126,764 81,177 92,189 132,523c 176,417c Redoubt Lake 7,000 25,000 OEG 2003 10,064 12,569 17,156 22,720 40,944 49,124 19,936 13,983 22,774
10,000 25,000 BEG 2003
Chilkat Lake 70,000 150,000 BEG 2009 71,735 150,033 61,906 63,628 107,723 110,979 70,470 135,110 85,421 Chilkoot Lake 38,000 86,000 SEG 2009 33,117 33,705 71,657 65,915 118,166 46,329 105,713 71,515 86,721 East Alsek-Doame River 13,000 26,000 BEG 2003 8,000 12,000 19,500 27,300 21,500 26,500 15,300 15,000 19,200 Klukshu River 7,500 11,000 BEG 2013 2,741 5,528 18,546 20,728 17,176 3,792 12,148 11,363 7,391 Alsek Riverl 24,000 33,500 BEG 2013 NA NA NA 83,899 76,598 83,771 87,093 63,709 NA Lost River 1,000
LB SEG 2009 200 NA 1,525 1,006 453 587 NA 302 449
Situk River 30,000 70,000 BEG 2003 22,520 83,959 47,865f 89,943 62,500 118,635 102,318 95,093 57,693 Note: LB SEG = lower-bound SEG; NA = data not available. a Goals are for large (≥660 mm MEF, or fish age 1.3 and older) Chinook salmon, except the goals for the Klukshu and Alsek rivers, which are germane to fish age 1.2 and older
and can include fish <660 mm MEF. b 2012–2014 Unuk River Chinook salmon escapement estimate based on expanded aerial survey index because mark–recapture studies failed. c Preliminary data. d Chilkat River Chinook salmon inriver goal accounts for inriver subsistence harvest that average <100 fish. e Klukshu River Chinook salmon escapement is the metric used to manage Chinook salmon for the Alsek River system, which includes the Klukshu River. Alsek River Chinook
salmon escapement is estimated using: [(Klukshu River weir count + sport harvest) × 4.0 – all Canadian inriver harvest]. -continued-
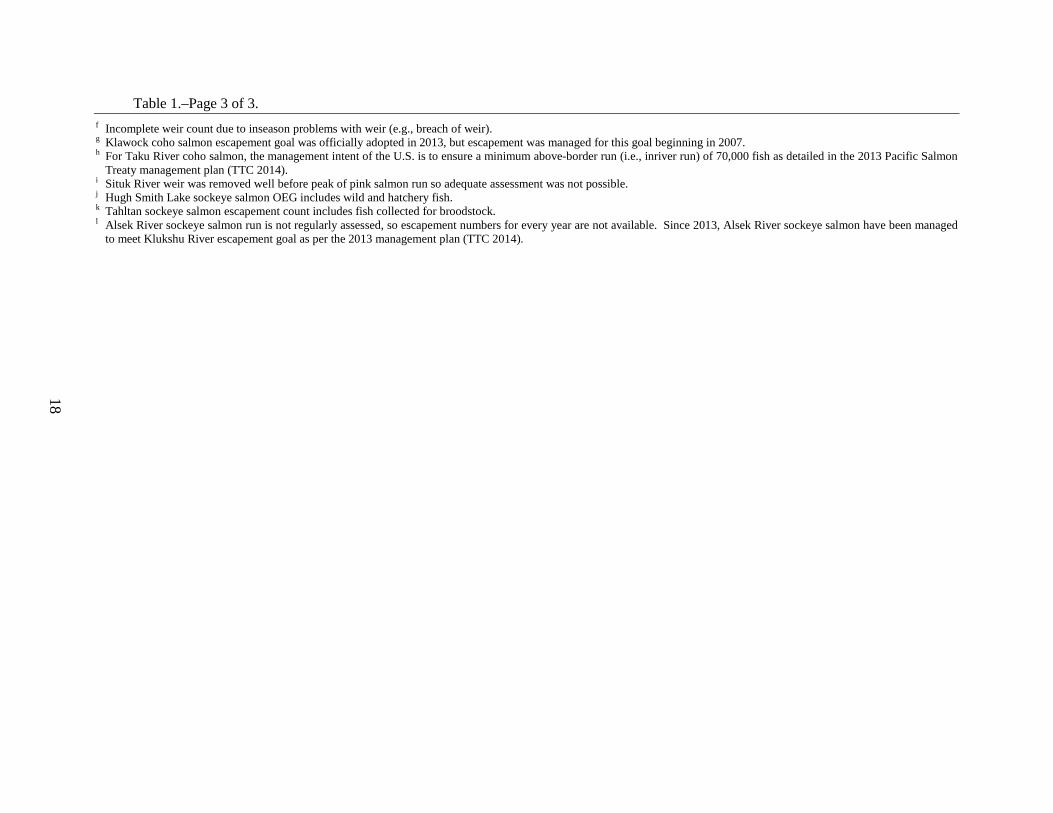
18
Table 1.–Page 3 of 3. f Incomplete weir count due to inseason problems with weir (e.g., breach of weir). g Klawock coho salmon escapement goal was officially adopted in 2013, but escapement was managed for this goal beginning in 2007. h For Taku River coho salmon, the management intent of the U.S. is to ensure a minimum above-border run (i.e., inriver run) of 70,000 fish as detailed in the 2013 Pacific Salmon
Treaty management plan (TTC 2014). i Situk River weir was removed well before peak of pink salmon run so adequate assessment was not possible. j Hugh Smith Lake sockeye salmon OEG includes wild and hatchery fish. k Tahltan sockeye salmon escapement count includes fish collected for broodstock. l Alsek River sockeye salmon run is not regularly assessed, so escapement numbers for every year are not available. Since 2013, Alsek River sockeye salmon have been managed
to meet Klukshu River escapement goal as per the 2013 management plan (TTC 2014).
19
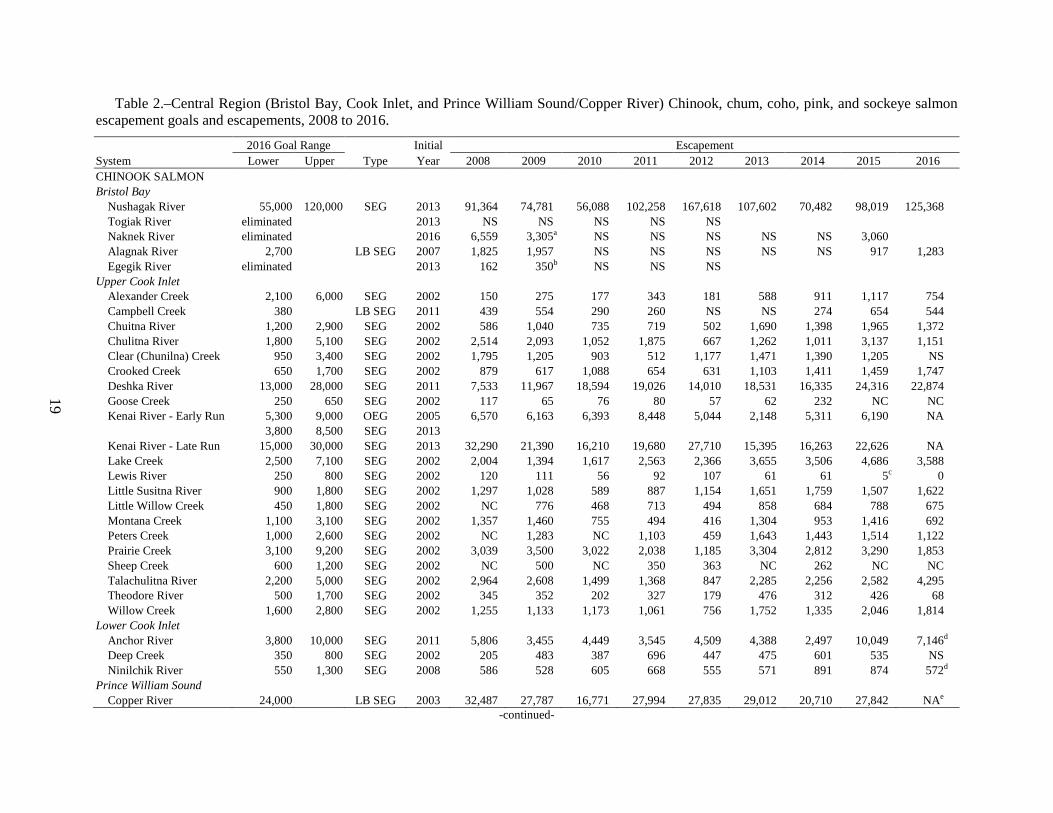
Table 2.–Central Region (Bristol Bay, Cook Inlet, and Prince William Sound/Copper River) Chinook, chum, coho, pink, and sockeye salmon escapement goals and escapements, 2008 to 2016.
2016 Goal Range Initial Escapement System Lower Upper Type Year 2008 2009 2010 2011 2012 2013 2014 2015 2016 CHINOOK SALMON
Bristol Bay Nushagak River 55,000 120,000 SEG 2013 91,364 74,781 56,088 102,258 167,618 107,602 70,482 98,019 125,368
Togiak River eliminated
2013 NS NS NS NS NS Naknek River eliminated
2016 6,559 3,305a NS NS NS NS NS 3,060
Alagnak River 2,700
LB SEG 2007 1,825 1,957 NS NS NS NS NS 917 1,283 Egegik River eliminated
2013 162 350b NS NS NS
Upper Cook Inlet Alexander Creek 2,100 6,000 SEG 2002 150 275 177 343 181 588 911 1,117 754
Campbell Creek 380
LB SEG 2011 439 554 290 260 NS NS 274 654 544 Chuitna River 1,200 2,900 SEG 2002 586 1,040 735 719 502 1,690 1,398 1,965 1,372 Chulitna River 1,800 5,100 SEG 2002 2,514 2,093 1,052 1,875 667 1,262 1,011 3,137 1,151 Clear (Chunilna) Creek 950 3,400 SEG 2002 1,795 1,205 903 512 1,177 1,471 1,390 1,205 NS Crooked Creek 650 1,700 SEG 2002 879 617 1,088 654 631 1,103 1,411 1,459 1,747 Deshka River 13,000 28,000 SEG 2011 7,533 11,967 18,594 19,026 14,010 18,531 16,335 24,316 22,874 Goose Creek 250 650 SEG 2002 117 65 76 80 57 62 232 NC NC Kenai River - Early Run 5,300 9,000 OEG 2005 6,570 6,163 6,393 8,448 5,044 2,148 5,311 6,190 NA
3,800 8,500 SEG 2013
Kenai River - Late Run 15,000 30,000 SEG 2013 32,290 21,390 16,210 19,680 27,710 15,395 16,263 22,626 NA Lake Creek 2,500 7,100 SEG 2002 2,004 1,394 1,617 2,563 2,366 3,655 3,506 4,686 3,588 Lewis River 250 800 SEG 2002 120 111 56 92 107 61 61 5c 0 Little Susitna River 900 1,800 SEG 2002 1,297 1,028 589 887 1,154 1,651 1,759 1,507 1,622 Little Willow Creek 450 1,800 SEG 2002 NC 776 468 713 494 858 684 788 675 Montana Creek 1,100 3,100 SEG 2002 1,357 1,460 755 494 416 1,304 953 1,416 692 Peters Creek 1,000 2,600 SEG 2002 NC 1,283 NC 1,103 459 1,643 1,443 1,514 1,122 Prairie Creek 3,100 9,200 SEG 2002 3,039 3,500 3,022 2,038 1,185 3,304 2,812 3,290 1,853 Sheep Creek 600 1,200 SEG 2002 NC 500 NC 350 363 NC 262 NC NC Talachulitna River 2,200 5,000 SEG 2002 2,964 2,608 1,499 1,368 847 2,285 2,256 2,582 4,295 Theodore River 500 1,700 SEG 2002 345 352 202 327 179 476 312 426 68 Willow Creek 1,600 2,800 SEG 2002 1,255 1,133 1,173 1,061 756 1,752 1,335 2,046 1,814
Lower Cook Inlet Anchor River 3,800 10,000 SEG 2011 5,806 3,455 4,449 3,545 4,509 4,388 2,497 10,049 7,146d
Deep Creek 350 800 SEG 2002 205 483 387 696 447 475 601 535 NS Ninilchik River 550 1,300 SEG 2008 586 528 605 668 555 571 891 874 572d
Prince William Sound Copper River 24,000
LB SEG 2003 32,487 27,787 16,771 27,994 27,835 29,012 20,710 27,842 NAe
-continued-
20
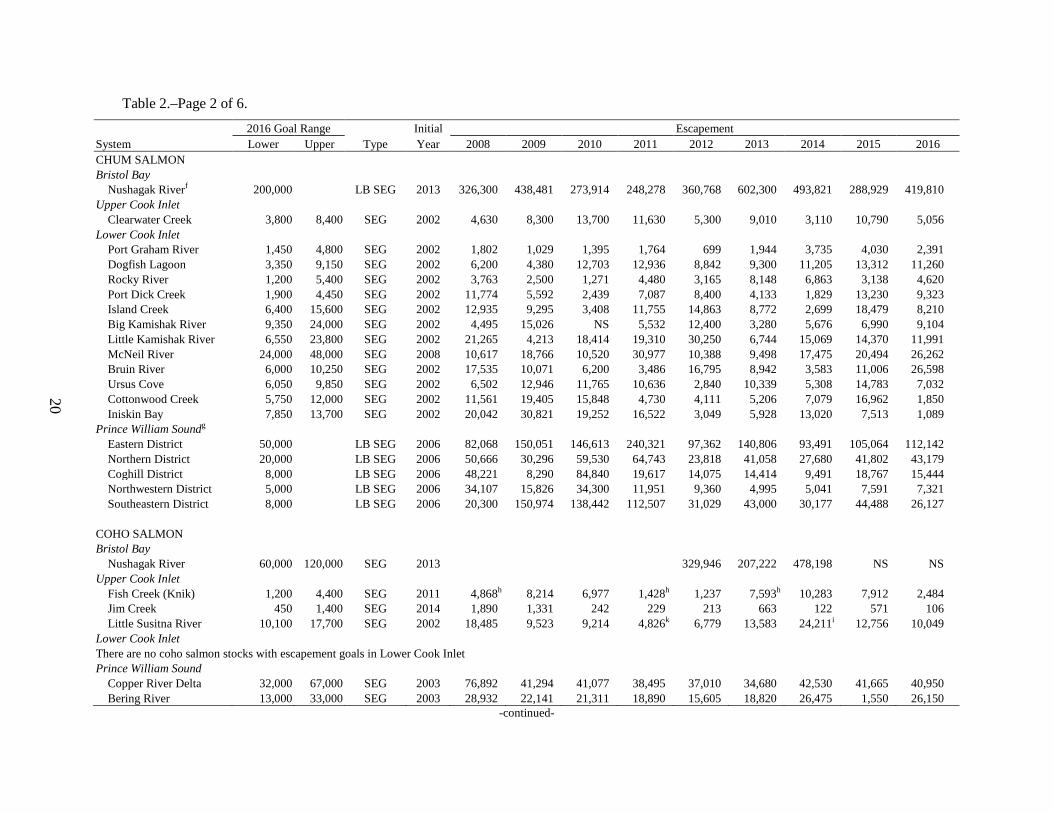
Table 2.–Page 2 of 6.
2016 Goal Range Initial Escapement System Lower Upper Type Year 2008 2009 2010 2011 2012 2013 2014 2015 2016 CHUM SALMON
Bristol Bay Nushagak Riverf 200,000
LB SEG 2013 326,300 438,481 273,914 248,278 360,768 602,300 493,821 288,929 419,810
Upper Cook Inlet
Clearwater Creek 3,800 8,400 SEG 2002 4,630 8,300 13,700 11,630 5,300 9,010 3,110 10,790 5,056
Lower Cook Inlet Port Graham River 1,450 4,800 SEG 2002 1,802 1,029 1,395 1,764 699 1,944 3,735 4,030 2,391
Dogfish Lagoon 3,350 9,150 SEG 2002 6,200 4,380 12,703 12,936 8,842 9,300 11,205 13,312 11,260 Rocky River 1,200 5,400 SEG 2002 3,763 2,500 1,271 4,480 3,165 8,148 6,863 3,138 4,620 Port Dick Creek 1,900 4,450 SEG 2002 11,774 5,592 2,439 7,087 8,400 4,133 1,829 13,230 9,323 Island Creek 6,400 15,600 SEG 2002 12,935 9,295 3,408 11,755 14,863 8,772 2,699 18,479 8,210 Big Kamishak River 9,350 24,000 SEG 2002 4,495 15,026 NS 5,532 12,400 3,280 5,676 6,990 9,104 Little Kamishak River 6,550 23,800 SEG 2002 21,265 4,213 18,414 19,310 30,250 6,744 15,069 14,370 11,991 McNeil River 24,000 48,000 SEG 2008 10,617 18,766 10,520 30,977 10,388 9,498 17,475 20,494 26,262 Bruin River 6,000 10,250 SEG 2002 17,535 10,071 6,200 3,486 16,795 8,942 3,583 11,006 26,598 Ursus Cove 6,050 9,850 SEG 2002 6,502 12,946 11,765 10,636 2,840 10,339 5,308 14,783 7,032 Cottonwood Creek 5,750 12,000 SEG 2002 11,561 19,405 15,848 4,730 4,111 5,206 7,079 16,962 1,850 Iniskin Bay 7,850 13,700 SEG 2002 20,042 30,821 19,252 16,522 3,049 5,928 13,020 7,513 1,089
Prince William Soundg Eastern District 50,000
LB SEG 2006 82,068 150,051 146,613 240,321 97,362 140,806 93,491 105,064 112,142
Northern District 20,000
LB SEG 2006 50,666 30,296 59,530 64,743 23,818 41,058 27,680 41,802 43,179 Coghill District 8,000
LB SEG 2006 48,221 8,290 84,840 19,617 14,075 14,414 9,491 18,767 15,444
Northwestern District 5,000
LB SEG 2006 34,107 15,826 34,300 11,951 9,360 4,995 5,041 7,591 7,321 Southeastern District 8,000
LB SEG 2006 20,300 150,974 138,442 112,507 31,029 43,000 30,177 44,488 26,127
COHO SALMON Bristol Bay Nushagak River 60,000 120,000 SEG 2013
329,946 207,222 478,198 NS NS
Upper Cook Inlet Fish Creek (Knik) 1,200 4,400 SEG 2011 4,868h 8,214 6,977 1,428h 1,237 7,593h 10,283 7,912 2,484
Jim Creek 450 1,400 SEG 2014 1,890 1,331 242 229 213 663 122 571 106 Little Susitna River 10,100 17,700 SEG 2002 18,485 9,523 9,214 4,826k 6,779 13,583 24,211i 12,756 10,049
Lower Cook Inlet There are no coho salmon stocks with escapement goals in Lower Cook Inlet
Prince William Sound Copper River Delta 32,000 67,000 SEG 2003 76,892 41,294 41,077 38,495 37,010 34,680 42,530 41,665 40,950
Bering River 13,000 33,000 SEG 2003 28,932 22,141 21,311 18,890 15,605 18,820 26,475 1,550 26,150 -continued-
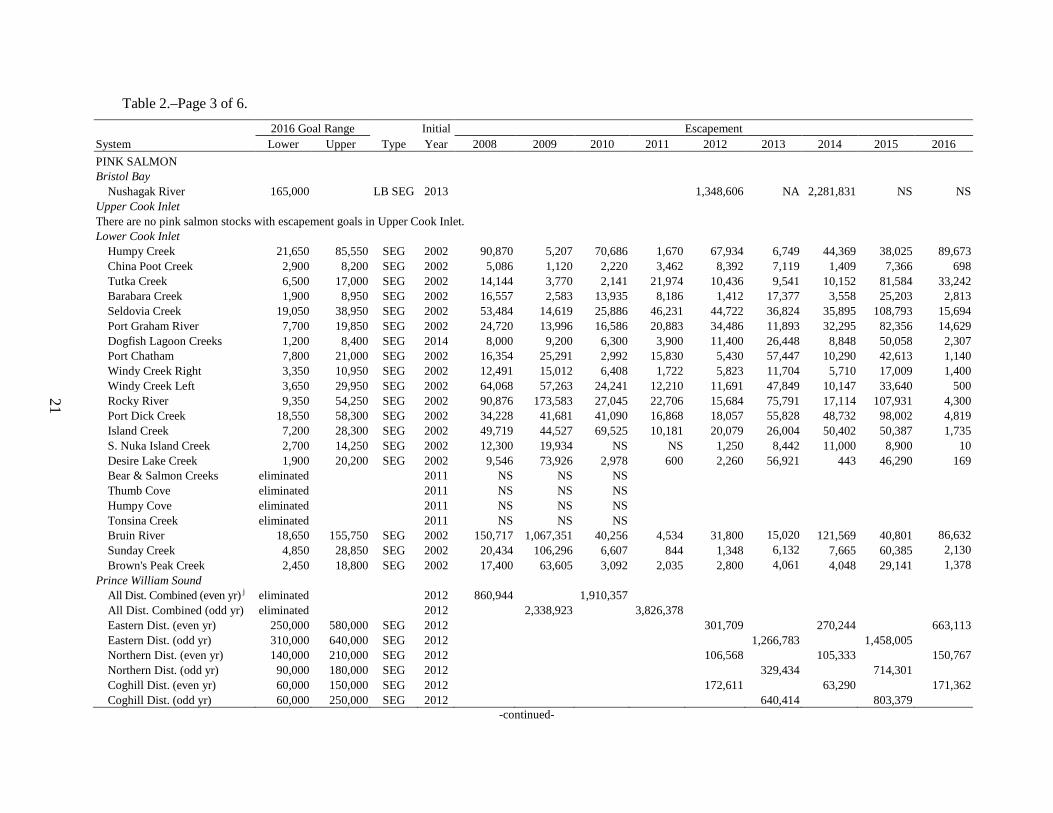
21
Table 2.–Page 3 of 6.
2016 Goal Range Initial Escapement System Lower Upper Type Year 2008 2009 2010 2011 2012 2013 2014 2015 2016 PINK SALMON
Bristol Bay Nushagak River 165,000
LB SEG 2013
1,348,606 NA 2,281,831 NS NS
Upper Cook Inlet There are no pink salmon stocks with escapement goals in Upper Cook Inlet.
Lower Cook Inlet Humpy Creek 21,650 85,550 SEG 2002 90,870 5,207 70,686 1,670 67,934 6,749 44,369 38,025 89,673
China Poot Creek 2,900 8,200 SEG 2002 5,086 1,120 2,220 3,462 8,392 7,119 1,409 7,366 698 Tutka Creek 6,500 17,000 SEG 2002 14,144 3,770 2,141 21,974 10,436 9,541 10,152 81,584 33,242 Barabara Creek 1,900 8,950 SEG 2002 16,557 2,583 13,935 8,186 1,412 17,377 3,558 25,203 2,813 Seldovia Creek 19,050 38,950 SEG 2002 53,484 14,619 25,886 46,231 44,722 36,824 35,895 108,793 15,694 Port Graham River 7,700 19,850 SEG 2002 24,720 13,996 16,586 20,883 34,486 11,893 32,295 82,356 14,629 Dogfish Lagoon Creeks 1,200 8,400 SEG 2014 8,000 9,200 6,300 3,900 11,400 26,448 8,848 50,058 2,307 Port Chatham 7,800 21,000 SEG 2002 16,354 25,291 2,992 15,830 5,430 57,447 10,290 42,613 1,140 Windy Creek Right 3,350 10,950 SEG 2002 12,491 15,012 6,408 1,722 5,823 11,704 5,710 17,009 1,400 Windy Creek Left 3,650 29,950 SEG 2002 64,068 57,263 24,241 12,210 11,691 47,849 10,147 33,640 500 Rocky River 9,350 54,250 SEG 2002 90,876 173,583 27,045 22,706 15,684 75,791 17,114 107,931 4,300 Port Dick Creek 18,550 58,300 SEG 2002 34,228 41,681 41,090 16,868 18,057 55,828 48,732 98,002 4,819 Island Creek 7,200 28,300 SEG 2002 49,719 44,527 69,525 10,181 20,079 26,004 50,402 50,387 1,735 S. Nuka Island Creek 2,700 14,250 SEG 2002 12,300 19,934 NS NS 1,250 8,442 11,000 8,900 10 Desire Lake Creek 1,900 20,200 SEG 2002 9,546 73,926 2,978 600 2,260 56,921 443 46,290 169 Bear & Salmon Creeks eliminated
2011 NS NS NS
Thumb Cove eliminated
2011 NS NS NS Humpy Cove eliminated
2011 NS NS NS
Tonsina Creek eliminated
2011 NS NS NS Bruin River 18,650 155,750 SEG 2002 150,717 1,067,351 40,256 4,534 31,800 15,020 121,569 40,801 86,632 Sunday Creek 4,850 28,850 SEG 2002 20,434 106,296 6,607 844 1,348 6,132 7,665 60,385 2,130 Brown's Peak Creek 2,450 18,800 SEG 2002 17,400 63,605 3,092 2,035 2,800 4,061 4,048 29,141 1,378
Prince William Sound All Dist. Combined (even yr) j eliminated
2012 860,944 1,910,357
All Dist. Combined (odd yr) eliminated
2012 2,338,923 3,826,378 Eastern Dist. (even yr) 250,000 580,000 SEG 2012 301,709 270,244 663,113 Eastern Dist. (odd yr) 310,000 640,000 SEG 2012 1,266,783 1,458,005 Northern Dist. (even yr) 140,000 210,000 SEG 2012 106,568 105,333 150,767 Northern Dist. (odd yr) 90,000 180,000 SEG 2012 329,434 714,301 Coghill Dist. (even yr) 60,000 150,000 SEG 2012 172,611 63,290 171,362 Coghill Dist. (odd yr) 60,000 250,000 SEG 2012 640,414 803,379
-continued-
22
Table 2.–Page 4 of 6.
2016 Goal Range Initial Escapement System Lower Upper Type Year 2008 2009 2010 2011 2012 2013 2014 2015 2016
Northwestern Dist. (even yr) 70,000 140,000 SEG 2012 117,795 67,030 171,633 Northwestern Dist. (odd yr) 50,000 110,000 SEG 2012 203,444 426,421 Eshamy Dist. (even yr) 3,000 11,000 SEG 2012 1,052 12,400 NAk Eshamy Dist. (odd yr) 4,000 11,000 SEG 2012 12,145 58,943 Southwestern Dist. (even yr) 70,000 160,000 SEG 2012 90,156 83,581 NAk Southwestern Dist. (odd yr) 70,000 190,000 SEG 2012 348,012 631,506 Montague Dist. (even yr) 50,000 140,000 SEG 2012 77,756 24,917k NAk Montague Dist. (odd yr) 140,000 280,000 SEG 2012 411,373 545,619 Southeastern Dist. (even yr) 150,000 310,000 SEG 2012 258,047 185,072 169,660 Southeastern Dist. (odd yr) 270,000 620,000 SEG 2012 1,472,633 1,510,249
SOCKEYE SALMON Bristol Bay Kvichak Riverl 2,000,000 10,000,000 SEG 2010 2,757,912 2,266,140 4,207,410 2,264,352 4,164,444 2,088,576 4,458,540 7,341,612 4,462,728
Alagnak River (Tower)m 320,000 LB SEG 2007 2,180,502 970,818 1,187,730 883,794 861,747 1,095,950 200,524 5,770,650 NA
Alagnak River (Aerial)n 125,000 LB SEG 2016 696,400 Naknek River 800,000 2,000,000 SEGo 2015 2,472,690 1,169,466 1,463,928 1,177,074 900,312 938,160 1,474,428 1,920,954 1,691,910 Egegik River 800,000 2,000,000 SEG 2015 1,259,568 1,146,276 927,054 961,200 1,233,900 1,113,630 1,382,466 2,160,792 1,837,260 Ugashik River 500,000 1,400,000 SEG 2015 596,332 1,364,338 830,886 1,029,853 670,578 898,110 640,158 1,564,638 1,635,270 Wood River 700,000 1,800,000 SEG 2015 1,724,676 1,319,232 1,804,344 1,098,006 764,202 1,183,348 2,764,614 1,941,474 1,309,707 Igushik River 150,000 400,000 SEG 2015 1,054,704 514,188 518,040 421,380 193,770 387,036 340,590 651,172 469,230 Nushagak River 260,000 760,000 OEG 2012 492,546 484,149 468,696 428,191 432,438 894,172 618,477 796,684 680,513
370,000 900,000 SEG 2015
Kulukak Bay eliminated
2013 NS NS NS NS NS Togiak River 120,000 270,000 SEG 2007 205,680 313,946 188,298 190,970 203,148 128,058 151,934 218,700 200,046
Upper Cook Inlet Crescent River eliminated
2014 62,030 NS 86,333 81,952 58,838 NS
Fish Creek (Knik) 20,000 70,000 SEG 2002 19,339 83,480 126,836 66,678 18,813 18,912 43,915 102,309 46,202 Kasilof River 160,000 390,000 OEG 2011 324,880 324,783 293,765 243,767 372,523 487,700 438,238 470,677 239,981
160,000 340,000 BEG 2011
Kenai Riverp 700,000 1,400,000 OEG 2011 703,979 843,255 1,015,106 1,275,369 1,197,518 964,224 1,151,629 1,325,673 1,042,668
700,000 1,200,000 SEG 2011
Packers Creek 15,000 30,000 SEG 2008 25,247 16,473 NS NS NS NA 19,242 28,072 NA Russian River - Early Run 22,000 42,000 BEG 2011 30,989 52,178 27,074 29,129 24,115 35,776 44,920 50,226 38,739 Russian River - Late Run 30,000 110,000 SEG 2005 46,638 80,088 38,848 41,529 54,911 31,364 52,277 46,223 37,837 Yentna Riverq eliminated
2009 90,180
Chelatna Lake 20,000 65,000 SEG 2009 73,469 17,721 37,784 70,353 36,577 70,555 26,212 69,750 60,792 -continued-
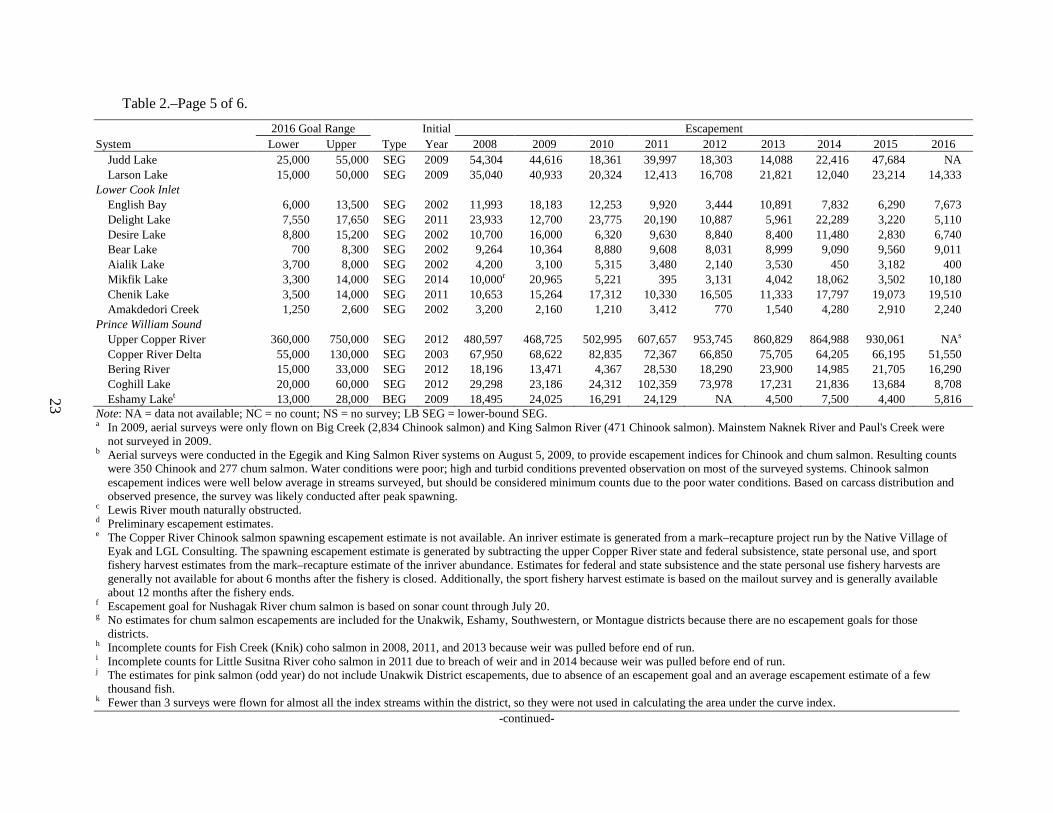
23
Table 2.–Page 5 of 6.
2016 Goal Range Initial Escapement System Lower Upper Type Year 2008 2009 2010 2011 2012 2013 2014 2015 2016
Judd Lake 25,000 55,000 SEG 2009 54,304 44,616 18,361 39,997 18,303 14,088 22,416 47,684 NA Larson Lake 15,000 50,000 SEG 2009 35,040 40,933 20,324 12,413 16,708 21,821 12,040 23,214 14,333
Lower Cook Inlet English Bay 6,000 13,500 SEG 2002 11,993 18,183 12,253 9,920 3,444 10,891 7,832 6,290 7,673
Delight Lake 7,550 17,650 SEG 2011 23,933 12,700 23,775 20,190 10,887 5,961 22,289 3,220 5,110 Desire Lake 8,800 15,200 SEG 2002 10,700 16,000 6,320 9,630 8,840 8,400 11,480 2,830 6,740 Bear Lake 700 8,300 SEG 2002 9,264 10,364 8,880 9,608 8,031 8,999 9,090 9,560 9,011 Aialik Lake 3,700 8,000 SEG 2002 4,200 3,100 5,315 3,480 2,140 3,530 450 3,182 400 Mikfik Lake 3,300 14,000 SEG 2014 10,000r 20,965 5,221 395 3,131 4,042 18,062 3,502 10,180 Chenik Lake 3,500 14,000 SEG 2011 10,653 15,264 17,312 10,330 16,505 11,333 17,797 19,073 19,510 Amakdedori Creek 1,250 2,600 SEG 2002 3,200 2,160 1,210 3,412 770 1,540 4,280 2,910 2,240
Prince William Sound Upper Copper River 360,000 750,000 SEG 2012 480,597 468,725 502,995 607,657 953,745 860,829 864,988 930,061 NAs
Copper River Delta 55,000 130,000 SEG 2003 67,950 68,622 82,835 72,367 66,850 75,705 64,205 66,195 51,550 Bering River 15,000 33,000 SEG 2012 18,196 13,471 4,367 28,530 18,290 23,900 14,985 21,705 16,290 Coghill Lake 20,000 60,000 SEG 2012 29,298 23,186 24,312 102,359 73,978 17,231 21,836 13,684 8,708 Eshamy Laket 13,000 28,000 BEG 2009 18,495 24,025 16,291 24,129 NA 4,500 7,500 4,400 5,816
Note: NA = data not available; NC = no count; NS = no survey; LB SEG = lower-bound SEG. a In 2009, aerial surveys were only flown on Big Creek (2,834 Chinook salmon) and King Salmon River (471 Chinook salmon). Mainstem Naknek River and Paul's Creek were
not surveyed in 2009. b Aerial surveys were conducted in the Egegik and King Salmon River systems on August 5, 2009, to provide escapement indices for Chinook and chum salmon. Resulting counts
were 350 Chinook and 277 chum salmon. Water conditions were poor; high and turbid conditions prevented observation on most of the surveyed systems. Chinook salmon escapement indices were well below average in streams surveyed, but should be considered minimum counts due to the poor water conditions. Based on carcass distribution and observed presence, the survey was likely conducted after peak spawning.
c Lewis River mouth naturally obstructed. d Preliminary escapement estimates. e The Copper River Chinook salmon spawning escapement estimate is not available. An inriver estimate is generated from a mark–recapture project run by the Native Village of
Eyak and LGL Consulting. The spawning escapement estimate is generated by subtracting the upper Copper River state and federal subsistence, state personal use, and sport fishery harvest estimates from the mark–recapture estimate of the inriver abundance. Estimates for federal and state subsistence and the state personal use fishery harvests are generally not available for about 6 months after the fishery is closed. Additionally, the sport fishery harvest estimate is based on the mailout survey and is generally available about 12 months after the fishery ends.
f Escapement goal for Nushagak River chum salmon is based on sonar count through July 20. g No estimates for chum salmon escapements are included for the Unakwik, Eshamy, Southwestern, or Montague districts because there are no escapement goals for those
districts. h Incomplete counts for Fish Creek (Knik) coho salmon in 2008, 2011, and 2013 because weir was pulled before end of run. i Incomplete counts for Little Susitna River coho salmon in 2011 due to breach of weir and in 2014 because weir was pulled before end of run. j The estimates for pink salmon (odd year) do not include Unakwik District escapements, due to absence of an escapement goal and an average escapement estimate of a few
thousand fish. k Fewer than 3 surveys were flown for almost all the index streams within the district, so they were not used in calculating the area under the curve index.
-continued-
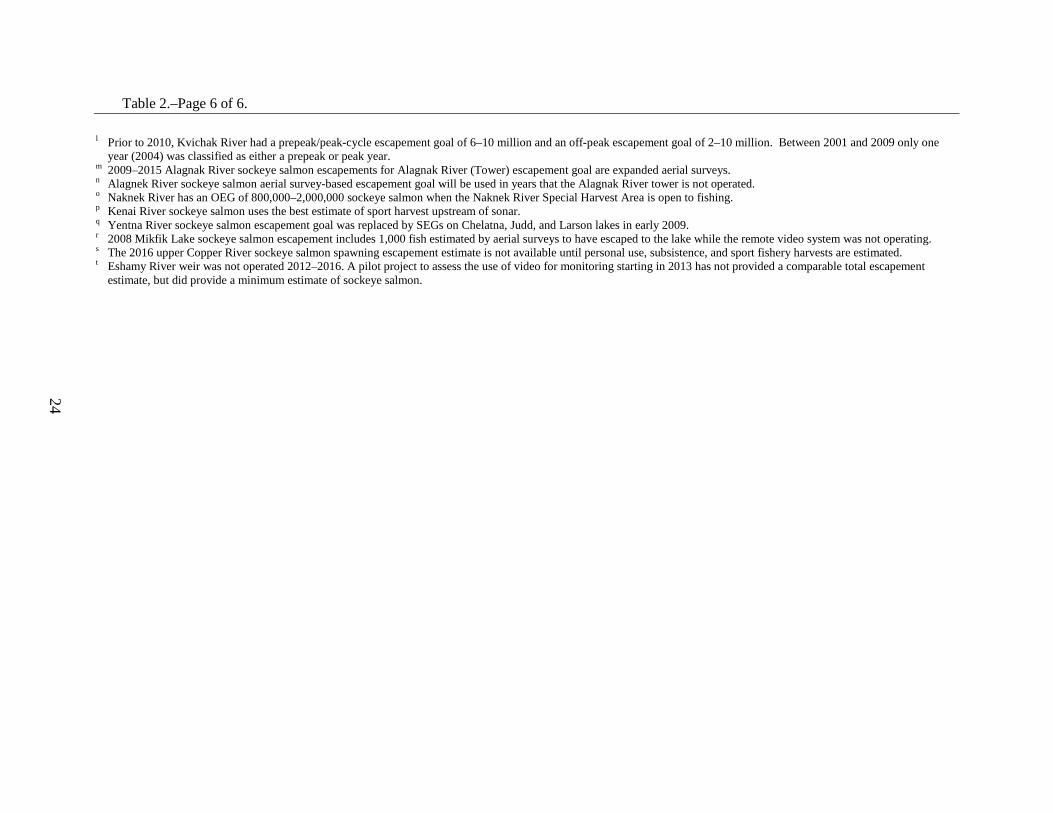
24
Table 2.–Page 6 of 6.
l Prior to 2010, Kvichak River had a prepeak/peak-cycle escapement goal of 6–10 million and an off-peak escapement goal of 2–10 million. Between 2001 and 2009 only one year (2004) was classified as either a prepeak or peak year.
m 2009–2015 Alagnak River sockeye salmon escapements for Alagnak River (Tower) escapement goal are expanded aerial surveys. n Alagnek River sockeye salmon aerial survey-based escapement goal will be used in years that the Alagnak River tower is not operated. o Naknek River has an OEG of 800,000–2,000,000 sockeye salmon when the Naknek River Special Harvest Area is open to fishing. p Kenai River sockeye salmon uses the best estimate of sport harvest upstream of sonar. q Yentna River sockeye salmon escapement goal was replaced by SEGs on Chelatna, Judd, and Larson lakes in early 2009. r 2008 Mikfik Lake sockeye salmon escapement includes 1,000 fish estimated by aerial surveys to have escaped to the lake while the remote video system was not operating. s The 2016 upper Copper River sockeye salmon spawning escapement estimate is not available until personal use, subsistence, and sport fishery harvests are estimated. t Eshamy River weir was not operated 2012–2016. A pilot project to assess the use of video for monitoring starting in 2013 has not provided a comparable total escapement
estimate, but did provide a minimum estimate of sockeye salmon.
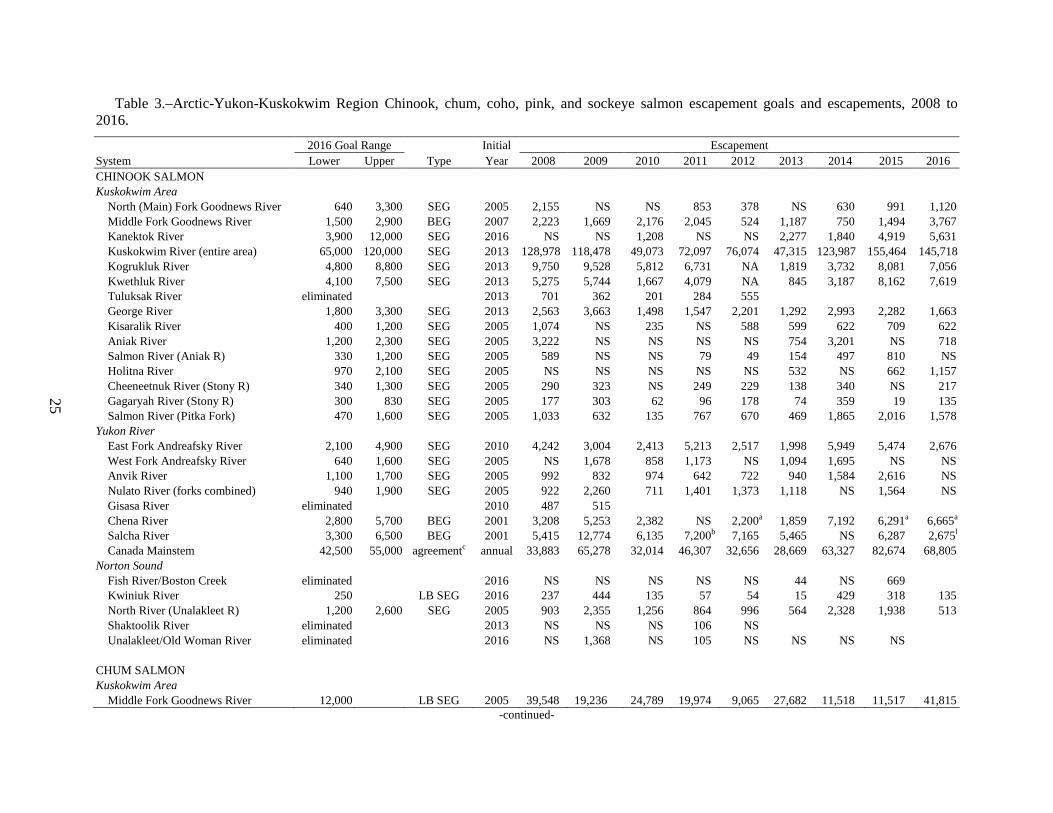
25
Table 3.–Arctic-Yukon-Kuskokwim Region Chinook, chum, coho, pink, and sockeye salmon escapement goals and escapements, 2008 to 2016.
2016 Goal Range Initial Escapement System Lower Upper Type Year 2008 2009 2010 2011 2012 2013 2014 2015 2016 CHINOOK SALMON
Kuskokwim Area North (Main) Fork Goodnews River 640 3,300 SEG 2005 2,155 NS NS 853 378 NS 630 991 1,120
Middle Fork Goodnews River 1,500 2,900 BEG 2007 2,223 1,669 2,176 2,045 524 1,187 750 1,494 3,767 Kanektok River 3,900 12,000 SEG 2016 NS NS 1,208 NS NS 2,277 1,840 4,919 5,631 Kuskokwim River (entire area) 65,000 120,000 SEG 2013 128,978 118,478 49,073 72,097 76,074 47,315 123,987 155,464 145,718 Kogrukluk River 4,800 8,800 SEG 2013 9,750 9,528 5,812 6,731 NA 1,819 3,732 8,081 7,056 Kwethluk River 4,100 7,500 SEG 2013 5,275 5,744 1,667 4,079 NA 845 3,187 8,162 7,619 Tuluksak River eliminated
2013 701 362 201 284 555
George River 1,800 3,300 SEG 2013 2,563 3,663 1,498 1,547 2,201 1,292 2,993 2,282 1,663 Kisaralik River 400 1,200 SEG 2005 1,074 NS 235 NS 588 599 622 709 622 Aniak River 1,200 2,300 SEG 2005 3,222 NS NS NS NS 754 3,201 NS 718 Salmon River (Aniak R) 330 1,200 SEG 2005 589 NS NS 79 49 154 497 810 NS Holitna River 970 2,100 SEG 2005 NS NS NS NS NS 532 NS 662 1,157 Cheeneetnuk River (Stony R) 340 1,300 SEG 2005 290 323 NS 249 229 138 340 NS 217 Gagaryah River (Stony R) 300 830 SEG 2005 177 303 62 96 178 74 359 19 135 Salmon River (Pitka Fork) 470 1,600 SEG 2005 1,033 632 135 767 670 469 1,865 2,016 1,578
Yukon River East Fork Andreafsky River 2,100 4,900 SEG 2010 4,242 3,004 2,413 5,213 2,517 1,998 5,949 5,474 2,676
West Fork Andreafsky River 640 1,600 SEG 2005 NS 1,678 858 1,173 NS 1,094 1,695 NS NS Anvik River 1,100 1,700 SEG 2005 992 832 974 642 722 940 1,584 2,616 NS Nulato River (forks combined) 940 1,900 SEG 2005 922 2,260 711 1,401 1,373 1,118 NS 1,564 NS Gisasa River eliminated
2010 487 515
Chena River 2,800 5,700 BEG 2001 3,208 5,253 2,382 NS 2,200a 1,859 7,192 6,291a 6,665a Salcha River 3,300 6,500 BEG 2001 5,415 12,774 6,135 7,200b 7,165 5,465 NS 6,287 2,675l Canada Mainstem 42,500 55,000 agreementc annual 33,883 65,278 32,014 46,307 32,656 28,669 63,327 82,674 68,805
Norton Sound Fish River/Boston Creek eliminated
2016 NS NS NS NS NS 44 NS 669
Kwiniuk River 250
LB SEG 2016 237 444 135 57 54 15 429 318 135 North River (Unalakleet R) 1,200 2,600 SEG 2005 903 2,355 1,256 864 996 564 2,328 1,938 513 Shaktoolik River eliminated
2013 NS NS NS 106 NS
Unalakleet/Old Woman River eliminated
2016 NS 1,368 NS 105 NS NS NS NS
CHUM SALMON Kuskokwim Area Middle Fork Goodnews River 12,000
LB SEG 2005 39,548 19,236 24,789 19,974 9,065 27,682 11,518 11,517 41,815
-continued-
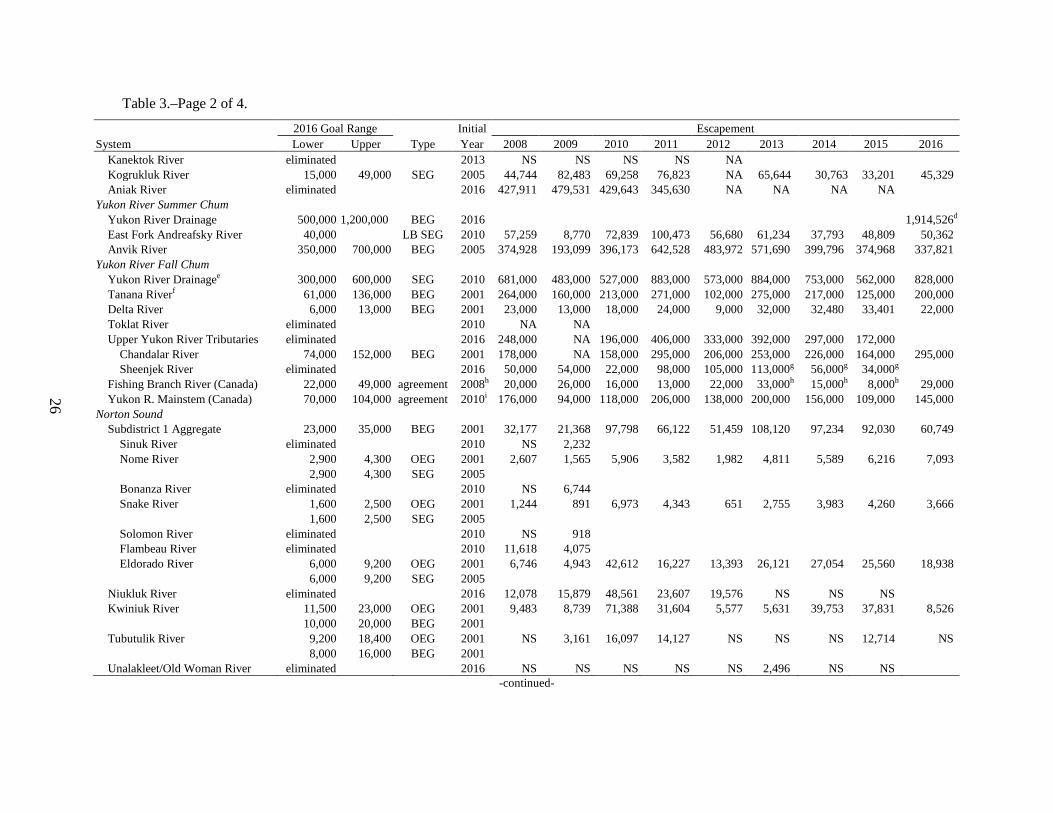
26
Table 3.–Page 2 of 4.
2016 Goal Range Initial Escapement System Lower Upper Type Year 2008 2009 2010 2011 2012 2013 2014 2015 2016
Kanektok River eliminated
2013 NS NS NS NS NA Kogrukluk River 15,000 49,000 SEG 2005 44,744 82,483 69,258 76,823 NA 65,644 30,763 33,201 45,329 Aniak River eliminated 2016 427,911 479,531 429,643 345,630 NA NA NA NA
Yukon River Summer Chum Yukon River Drainage 500,000 1,200,000 BEG 2016 1,914,526d
East Fork Andreafsky River 40,000
LB SEG 2010 57,259 8,770 72,839 100,473 56,680 61,234 37,793 48,809 50,362 Anvik River 350,000 700,000 BEG 2005 374,928 193,099 396,173 642,528 483,972 571,690 399,796 374,968 337,821
Yukon River Fall Chum Yukon River Drainagee 300,000 600,000 SEG 2010 681,000 483,000 527,000 883,000 573,000 884,000 753,000 562,000 828,000
Tanana Riverf 61,000 136,000 BEG 2001 264,000 160,000 213,000 271,000 102,000 275,000 217,000 125,000 200,000 Delta River 6,000 13,000 BEG 2001 23,000 13,000 18,000 24,000 9,000 32,000 32,480 33,401 22,000 Toklat River eliminated
2010 NA NA
Upper Yukon River Tributaries eliminated 2016 248,000 NA 196,000 406,000 333,000 392,000 297,000 172,000 Chandalar River 74,000 152,000 BEG 2001 178,000 NA 158,000 295,000 206,000 253,000 226,000 164,000 295,000 Sheenjek River eliminated 2016 50,000 54,000 22,000 98,000 105,000 113,000g 56,000g 34,000g
Fishing Branch River (Canada) 22,000 49,000 agreement 2008h 20,000 26,000 16,000 13,000 22,000 33,000h 15,000h 8,000h 29,000 Yukon R. Mainstem (Canada) 70,000 104,000 agreement 2010i 176,000 94,000 118,000 206,000 138,000 200,000 156,000 109,000 145,000
Norton Sound Subdistrict 1 Aggregate 23,000 35,000 BEG 2001 32,177 21,368 97,798 66,122 51,459 108,120 97,234 92,030 60,749
Sinuk River eliminated
2010 NS 2,232 Nome River 2,900 4,300 OEG 2001 2,607 1,565 5,906 3,582 1,982 4,811 5,589 6,216 7,093
2,900 4,300 SEG 2005
Bonanza River eliminated
2010 NS 6,744 Snake River 1,600 2,500 OEG 2001 1,244 891 6,973 4,343 651 2,755 3,983 4,260 3,666
1,600 2,500 SEG 2005
Solomon River eliminated
2010 NS 918 Flambeau River eliminated
2010 11,618 4,075
Eldorado River 6,000 9,200 OEG 2001 6,746 4,943 42,612 16,227 13,393 26,121 27,054 25,560 18,938
6,000 9,200 SEG 2005
Niukluk River eliminated
2016 12,078 15,879 48,561 23,607 19,576 NS NS NS Kwiniuk River 11,500 23,000 OEG 2001 9,483 8,739 71,388 31,604 5,577 5,631 39,753 37,831 8,526
10,000 20,000 BEG 2001
Tubutulik River 9,200 18,400 OEG 2001 NS 3,161 16,097 14,127 NS NS NS 12,714 NS
8,000 16,000 BEG 2001
Unalakleet/Old Woman River eliminated 2016 NS NS NS NS NS 2,496 NS NS -continued-
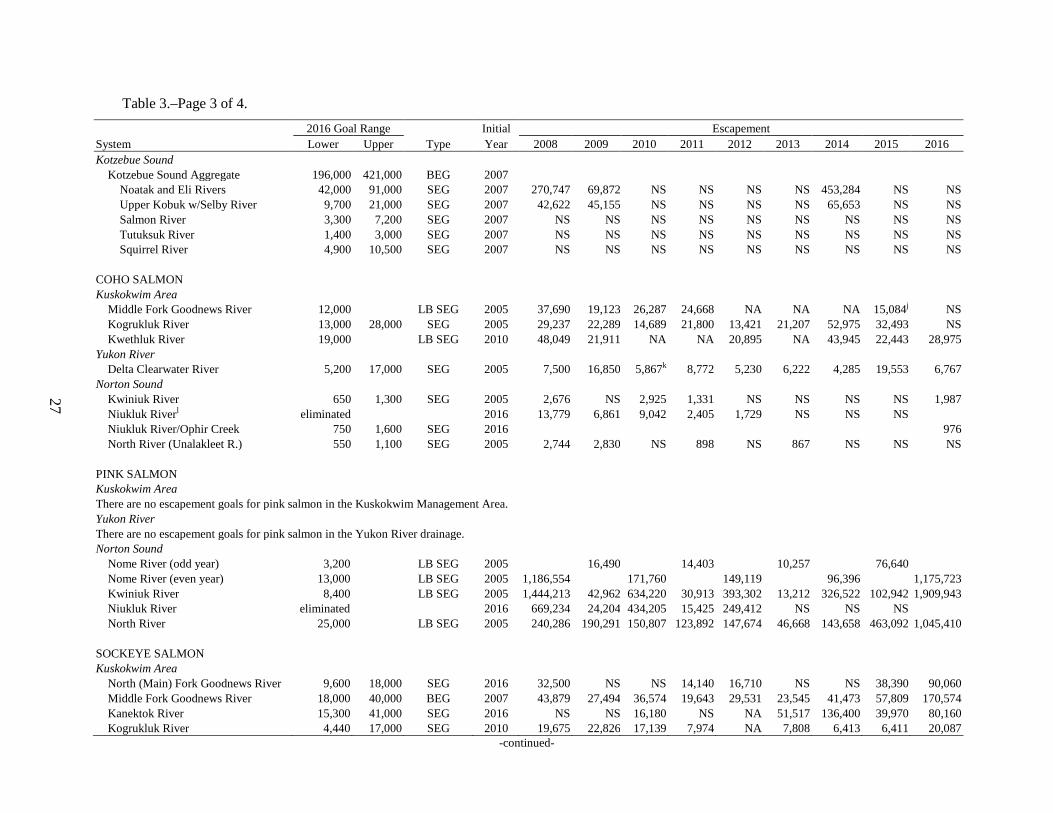
27
Table 3.–Page 3 of 4.
2016 Goal Range Initial Escapement System Lower Upper Type Year 2008 2009 2010 2011 2012 2013 2014 2015 2016 Kotzebue Sound
Kotzebue Sound Aggregate 196,000 421,000 BEG 2007 Noatak and Eli Rivers 42,000 91,000 SEG 2007 270,747 69,872 NS NS NS NS 453,284 NS NS Upper Kobuk w/Selby River 9,700 21,000 SEG 2007 42,622 45,155 NS NS NS NS 65,653 NS NS Salmon River 3,300 7,200 SEG 2007 NS NS NS NS NS NS NS NS NS Tutuksuk River 1,400 3,000 SEG 2007 NS NS NS NS NS NS NS NS NS Squirrel River 4,900 10,500 SEG 2007 NS NS NS NS NS NS NS NS NS
COHO SALMON Kuskokwim Area Middle Fork Goodnews River 12,000
LB SEG 2005 37,690 19,123 26,287 24,668 NA NA NA 15,084j NS
Kogrukluk River 13,000 28,000 SEG 2005 29,237 22,289 14,689 21,800 13,421 21,207 52,975 32,493 NS Kwethluk River 19,000
LB SEG 2010 48,049 21,911 NA NA 20,895 NA 43,945 22,443 28,975
Yukon River
Delta Clearwater River 5,200 17,000 SEG 2005 7,500 16,850 5,867k 8,772 5,230 6,222 4,285 19,553 6,767
Norton Sound
Kwiniuk River 650 1,300 SEG 2005 2,676 NS 2,925 1,331 NS NS NS NS 1,987 Niukluk Riverl eliminated 2016 13,779 6,861 9,042 2,405 1,729 NS NS NS Niukluk River/Ophir Creek 750 1,600 SEG 2016 976 North River (Unalakleet R.) 550 1,100 SEG 2005 2,744 2,830 NS 898 NS 867 NS NS NS
PINK SALMON Kuskokwim Area There are no escapement goals for pink salmon in the Kuskokwim Management Area.
Yukon River There are no escapement goals for pink salmon in the Yukon River drainage.
Norton Sound Nome River (odd year) 3,200
LB SEG 2005 16,490 14,403 10,257 76,640
Nome River (even year) 13,000
LB SEG 2005 1,186,554 171,760 149,119 96,396 1,175,723 Kwiniuk River 8,400
LB SEG 2005 1,444,213 42,962 634,220 30,913 393,302 13,212 326,522 102,942 1,909,943
Niukluk River eliminated
2016 669,234 24,204 434,205 15,425 249,412 NS NS NS North River 25,000
LB SEG 2005 240,286 190,291 150,807 123,892 147,674 46,668 143,658 463,092 1,045,410
SOCKEYE SALMON Kuskokwim Area North (Main) Fork Goodnews River 9,600 18,000 SEG 2016 32,500 NS NS 14,140 16,710 NS NS 38,390 90,060
Middle Fork Goodnews River 18,000 40,000 BEG 2007 43,879 27,494 36,574 19,643 29,531 23,545 41,473 57,809 170,574 Kanektok River 15,300 41,000 SEG 2016 NS NS 16,180 NS NA 51,517 136,400 39,970 80,160 Kogrukluk River 4,440 17,000 SEG 2010 19,675 22,826 17,139 7,974 NA 7,808 6,413 6,411 20,087
-continued-
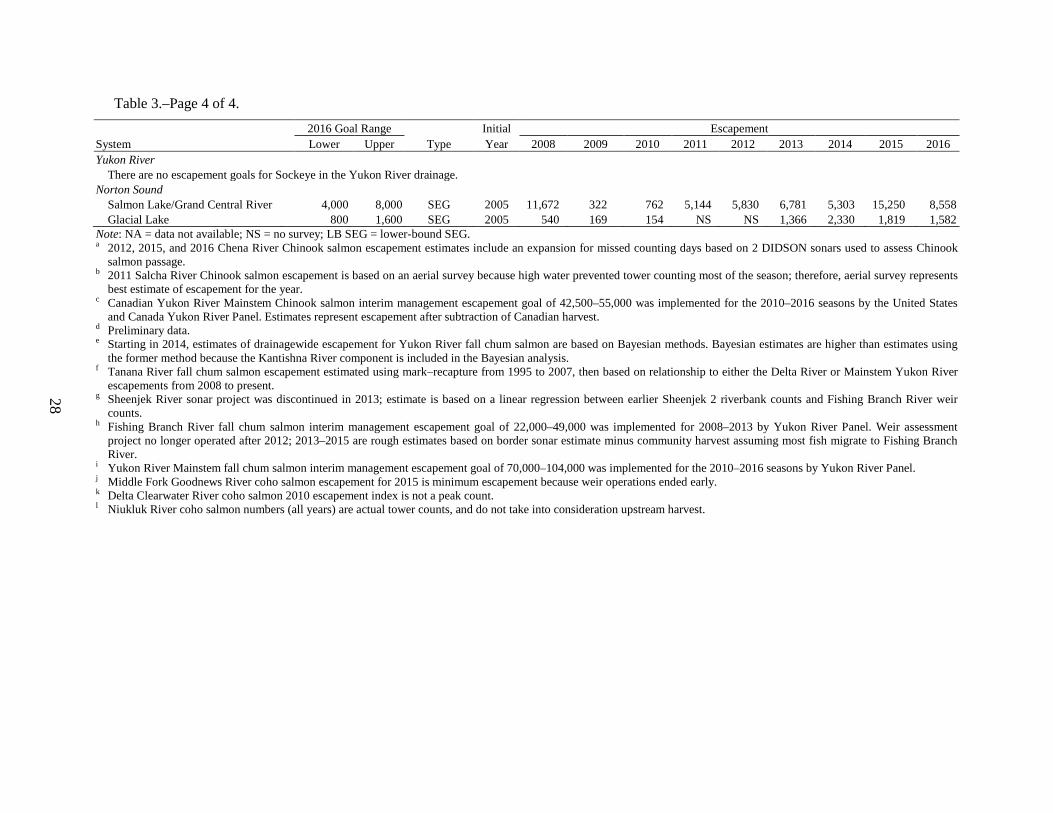
28
Table 3.–Page 4 of 4.
2016 Goal Range Initial Escapement System Lower Upper Type Year 2008 2009 2010 2011 2012 2013 2014 2015 2016 Yukon River
There are no escapement goals for Sockeye in the Yukon River drainage. Norton Sound
Salmon Lake/Grand Central River 4,000 8,000 SEG 2005 11,672 322 762 5,144 5,830 6,781 5,303 15,250 8,558 Glacial Lake 800 1,600 SEG 2005 540 169 154 NS NS 1,366 2,330 1,819 1,582
Note: NA = data not available; NS = no survey; LB SEG = lower-bound SEG. a 2012, 2015, and 2016 Chena River Chinook salmon escapement estimates include an expansion for missed counting days based on 2 DIDSON sonars used to assess Chinook
salmon passage. b 2011 Salcha River Chinook salmon escapement is based on an aerial survey because high water prevented tower counting most of the season; therefore, aerial survey represents
best estimate of escapement for the year. c Canadian Yukon River Mainstem Chinook salmon interim management escapement goal of 42,500–55,000 was implemented for the 2010–2016 seasons by the United States
and Canada Yukon River Panel. Estimates represent escapement after subtraction of Canadian harvest. d Preliminary data. e Starting in 2014, estimates of drainagewide escapement for Yukon River fall chum salmon are based on Bayesian methods. Bayesian estimates are higher than estimates using
the former method because the Kantishna River component is included in the Bayesian analysis. f Tanana River fall chum salmon escapement estimated using mark–recapture from 1995 to 2007, then based on relationship to either the Delta River or Mainstem Yukon River
escapements from 2008 to present. g Sheenjek River sonar project was discontinued in 2013; estimate is based on a linear regression between earlier Sheenjek 2 riverbank counts and Fishing Branch River weir
counts. h Fishing Branch River fall chum salmon interim management escapement goal of 22,000–49,000 was implemented for 2008–2013 by Yukon River Panel. Weir assessment
project no longer operated after 2012; 2013–2015 are rough estimates based on border sonar estimate minus community harvest assuming most fish migrate to Fishing Branch River.
i Yukon River Mainstem fall chum salmon interim management escapement goal of 70,000–104,000 was implemented for the 2010–2016 seasons by Yukon River Panel. j Middle Fork Goodnews River coho salmon escapement for 2015 is minimum escapement because weir operations ended early. k Delta Clearwater River coho salmon 2010 escapement index is not a peak count. l Niukluk River coho salmon numbers (all years) are actual tower counts, and do not take into consideration upstream harvest.
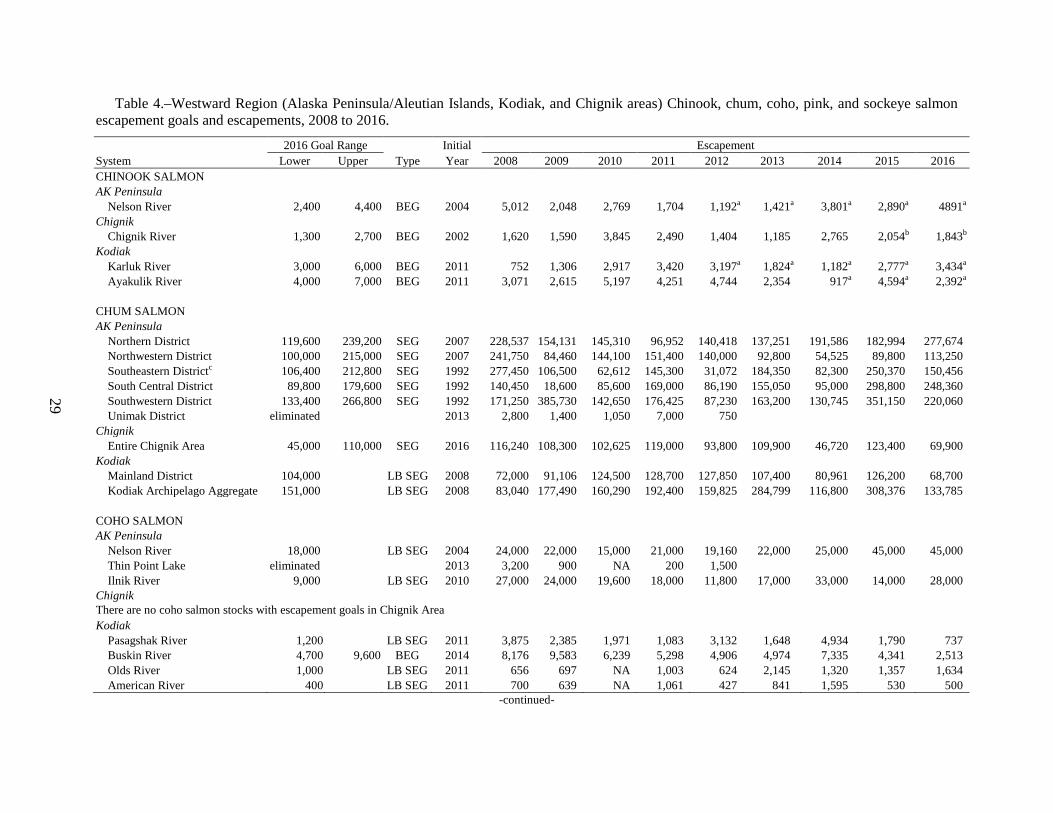
29
Table 4.–Westward Region (Alaska Peninsula/Aleutian Islands, Kodiak, and Chignik areas) Chinook, chum, coho, pink, and sockeye salmon escapement goals and escapements, 2008 to 2016.
2016 Goal Range Initial Escapement System Lower Upper Type Year 2008 2009 2010 2011 2012 2013 2014 2015 2016 CHINOOK SALMON
AK Peninsula Nelson River 2,400 4,400 BEG 2004 5,012 2,048 2,769 1,704 1,192a 1,421a 3,801a 2,890a 4891a
Chignik
Chignik River 1,300 2,700 BEG 2002 1,620 1,590 3,845 2,490 1,404 1,185 2,765 2,054b 1,843b
Kodiak
Karluk River 3,000 6,000 BEG 2011 752 1,306 2,917 3,420 3,197a 1,824a 1,182a 2,777a 3,434a Ayakulik River 4,000 7,000 BEG 2011 3,071 2,615 5,197 4,251 4,744 2,354 917a 4,594a 2,392a
CHUM SALMON AK Peninsula Northern District 119,600 239,200 SEG 2007 228,537 154,131 145,310 96,952 140,418 137,251 191,586 182,994 277,674
Northwestern District 100,000 215,000 SEG 2007 241,750 84,460 144,100 151,400 140,000 92,800 54,525 89,800 113,250 Southeastern Districtc 106,400 212,800 SEG 1992 277,450 106,500 62,612 145,300 31,072 184,350 82,300 250,370 150,456 South Central District 89,800 179,600 SEG 1992 140,450 18,600 85,600 169,000 86,190 155,050 95,000 298,800 248,360 Southwestern District 133,400 266,800 SEG 1992 171,250 385,730 142,650 176,425 87,230 163,200 130,745 351,150 220,060 Unimak District eliminated
2013 2,800 1,400 1,050 7,000 750
Chignik Entire Chignik Area 45,000 110,000 SEG 2016 116,240 108,300 102,625 119,000 93,800 109,900 46,720 123,400 69,900
Kodiak Mainland District 104,000
LB SEG 2008 72,000 91,106 124,500 128,700 127,850 107,400 80,961 126,200 68,700
Kodiak Archipelago Aggregate 151,000
LB SEG 2008 83,040 177,490 160,290 192,400 159,825 284,799 116,800 308,376 133,785
COHO SALMON AK Peninsula Nelson River 18,000
LB SEG 2004 24,000 22,000 15,000 21,000 19,160 22,000 25,000 45,000 45,000
Thin Point Lake eliminated
2013 3,200 900 NA 200 1,500 Ilnik River 9,000
LB SEG 2010 27,000 24,000 19,600 18,000 11,800 17,000 33,000 14,000 28,000
Chignik There are no coho salmon stocks with escapement goals in Chignik Area
Kodiak Pasagshak River 1,200
LB SEG 2011 3,875 2,385 1,971 1,083 3,132 1,648 4,934 1,790 737
Buskin River 4,700 9,600 BEG 2014 8,176 9,583 6,239 5,298 4,906 4,974 7,335 4,341 2,513 Olds River 1,000
LB SEG 2011 656 697 NA 1,003 624 2,145 1,320 1,357 1,634
American River 400
LB SEG 2011 700 639 NA 1,061 427 841 1,595 530 500 -continued-
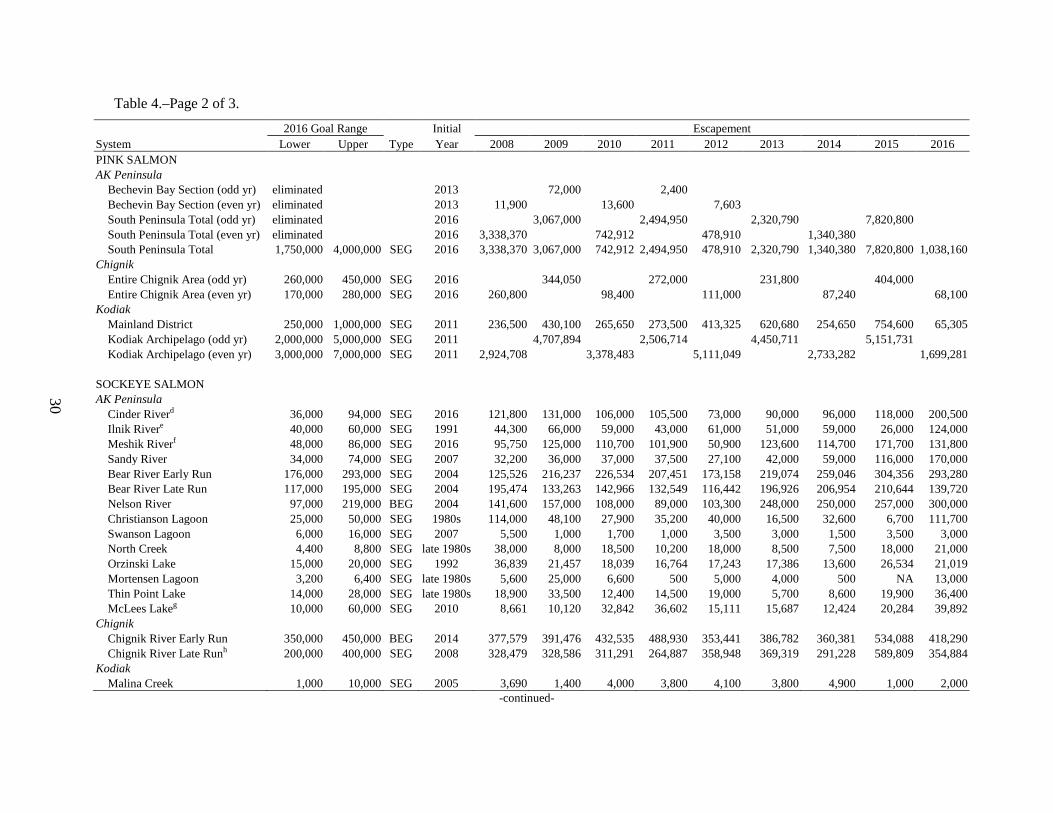
30
Table 4.–Page 2 of 3.
2016 Goal Range Initial Escapement System Lower Upper Type Year 2008 2009 2010 2011 2012 2013 2014 2015 2016 PINK SALMON
AK Peninsula Bechevin Bay Section (odd yr) eliminated
2013 72,000 2,400
Bechevin Bay Section (even yr) eliminated
2013 11,900 13,600 7,603 South Peninsula Total (odd yr) eliminated 2016 3,067,000 2,494,950 2,320,790 7,820,800 South Peninsula Total (even yr) eliminated 2016 3,338,370 742,912 478,910 1,340,380 South Peninsula Total 1,750,000 4,000,000 SEG 2016 3,338,370 3,067,000 742,912 2,494,950 478,910 2,320,790 1,340,380 7,820,800 1,038,160
Chignik
Entire Chignik Area (odd yr) 260,000 450,000 SEG 2016 344,050 272,000 231,800 404,000 Entire Chignik Area (even yr) 170,000 280,000 SEG 2016 260,800 98,400 111,000 87,240 68,100
Kodiak
Mainland District 250,000 1,000,000 SEG 2011 236,500 430,100 265,650 273,500 413,325 620,680 254,650 754,600 65,305 Kodiak Archipelago (odd yr) 2,000,000 5,000,000 SEG 2011 4,707,894 2,506,714 4,450,711 5,151,731 Kodiak Archipelago (even yr) 3,000,000 7,000,000 SEG 2011 2,924,708 3,378,483 5,111,049 2,733,282 1,699,281
SOCKEYE SALMON AK Peninsula Cinder Riverd 36,000 94,000 SEG 2016 121,800 131,000 106,000 105,500 73,000 90,000 96,000 118,000 200,500
Ilnik Rivere 40,000 60,000 SEG 1991 44,300 66,000 59,000 43,000 61,000 51,000 59,000 26,000 124,000 Meshik Riverf 48,000 86,000 SEG 2016 95,750 125,000 110,700 101,900 50,900 123,600 114,700 171,700 131,800 Sandy River 34,000 74,000 SEG 2007 32,200 36,000 37,000 37,500 27,100 42,000 59,000 116,000 170,000 Bear River Early Run 176,000 293,000 SEG 2004 125,526 216,237 226,534 207,451 173,158 219,074 259,046 304,356 293,280 Bear River Late Run 117,000 195,000 SEG 2004 195,474 133,263 142,966 132,549 116,442 196,926 206,954 210,644 139,720 Nelson River 97,000 219,000 BEG 2004 141,600 157,000 108,000 89,000 103,300 248,000 250,000 257,000 300,000 Christianson Lagoon 25,000 50,000 SEG 1980s 114,000 48,100 27,900 35,200 40,000 16,500 32,600 6,700 111,700 Swanson Lagoon 6,000 16,000 SEG 2007 5,500 1,000 1,700 1,000 3,500 3,000 1,500 3,500 3,000 North Creek 4,400 8,800 SEG late 1980s 38,000 8,000 18,500 10,200 18,000 8,500 7,500 18,000 21,000 Orzinski Lake 15,000 20,000 SEG 1992 36,839 21,457 18,039 16,764 17,243 17,386 13,600 26,534 21,019 Mortensen Lagoon 3,200 6,400 SEG late 1980s 5,600 25,000 6,600 500 5,000 4,000 500 NA 13,000 Thin Point Lake 14,000 28,000 SEG late 1980s 18,900 33,500 12,400 14,500 19,000 5,700 8,600 19,900 36,400 McLees Lakeg 10,000 60,000 SEG 2010 8,661 10,120 32,842 36,602 15,111 15,687 12,424 20,284 39,892
Chignik
Chignik River Early Run 350,000 450,000 BEG 2014 377,579 391,476 432,535 488,930 353,441 386,782 360,381 534,088 418,290 Chignik River Late Runh 200,000 400,000 SEG 2008 328,479 328,586 311,291 264,887 358,948 369,319 291,228 589,809 354,884
Kodiak Malina Creek 1,000 10,000 SEG 2005 3,690 1,400 4,000 3,800 4,100 3,800 4,900 1,000 2,000
-continued-
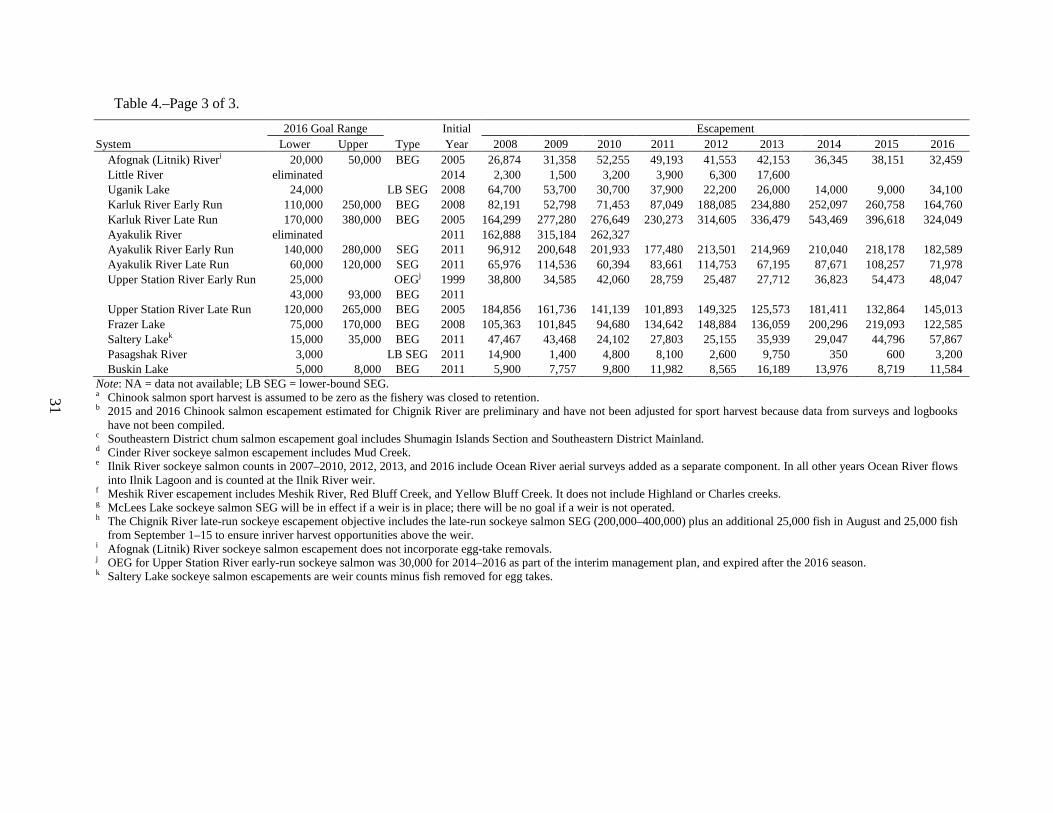
31
Table 4.–Page 3 of 3.
2016 Goal Range Initial Escapement System Lower Upper Type Year 2008 2009 2010 2011 2012 2013 2014 2015 2016
Afognak (Litnik) Riveri 20,000 50,000 BEG 2005 26,874 31,358 52,255 49,193 41,553 42,153 36,345 38,151 32,459 Little River eliminated
2014 2,300 1,500 3,200 3,900 6,300 17,600
Uganik Lake 24,000
LB SEG 2008 64,700 53,700 30,700 37,900 22,200 26,000 14,000 9,000 34,100 Karluk River Early Run 110,000 250,000 BEG 2008 82,191 52,798 71,453 87,049 188,085 234,880 252,097 260,758 164,760 Karluk River Late Run 170,000 380,000 BEG 2005 164,299 277,280 276,649 230,273 314,605 336,479 543,469 396,618 324,049 Ayakulik River eliminated
2011 162,888 315,184 262,327
Ayakulik River Early Run 140,000 280,000 SEG 2011 96,912 200,648 201,933 177,480 213,501 214,969 210,040 218,178 182,589 Ayakulik River Late Run 60,000 120,000 SEG 2011 65,976 114,536 60,394 83,661 114,753 67,195 87,671 108,257 71,978 Upper Station River Early Run 25,000
OEGj 1999 38,800 34,585 42,060 28,759 25,487 27,712 36,823 54,473 48,047
43,000 93,000 BEG 2011
Upper Station River Late Run 120,000 265,000 BEG 2005 184,856 161,736 141,139 101,893 149,325 125,573 181,411 132,864 145,013 Frazer Lake 75,000 170,000 BEG 2008 105,363 101,845 94,680 134,642 148,884 136,059 200,296 219,093 122,585 Saltery Lakek 15,000 35,000 BEG 2011 47,467 43,468 24,102 27,803 25,155 35,939 29,047 44,796 57,867 Pasagshak River 3,000
LB SEG 2011 14,900 1,400 4,800 8,100 2,600 9,750 350 600 3,200
Buskin Lake 5,000 8,000 BEG 2011 5,900 7,757 9,800 11,982 8,565 16,189 13,976 8,719 11,584 Note: NA = data not available; LB SEG = lower-bound SEG. a Chinook salmon sport harvest is assumed to be zero as the fishery was closed to retention. b 2015 and 2016 Chinook salmon escapement estimated for Chignik River are preliminary and have not been adjusted for sport harvest because data from surveys and logbooks
have not been compiled. c Southeastern District chum salmon escapement goal includes Shumagin Islands Section and Southeastern District Mainland. d Cinder River sockeye salmon escapement includes Mud Creek. e Ilnik River sockeye salmon counts in 2007–2010, 2012, 2013, and 2016 include Ocean River aerial surveys added as a separate component. In all other years Ocean River flows
into Ilnik Lagoon and is counted at the Ilnik River weir. f Meshik River escapement includes Meshik River, Red Bluff Creek, and Yellow Bluff Creek. It does not include Highland or Charles creeks. g McLees Lake sockeye salmon SEG will be in effect if a weir is in place; there will be no goal if a weir is not operated. h The Chignik River late-run sockeye escapement objective includes the late-run sockeye salmon SEG (200,000–400,000) plus an additional 25,000 fish in August and 25,000 fish
from September 1–15 to ensure inriver harvest opportunities above the weir. i Afognak (Litnik) River sockeye salmon escapement does not incorporate egg-take removals. j OEG for Upper Station River early-run sockeye salmon was 30,000 for 2014–2016 as part of the interim management plan, and expired after the 2016 season. k Saltery Lake sockeye salmon escapements are weir counts minus fish removed for egg takes.
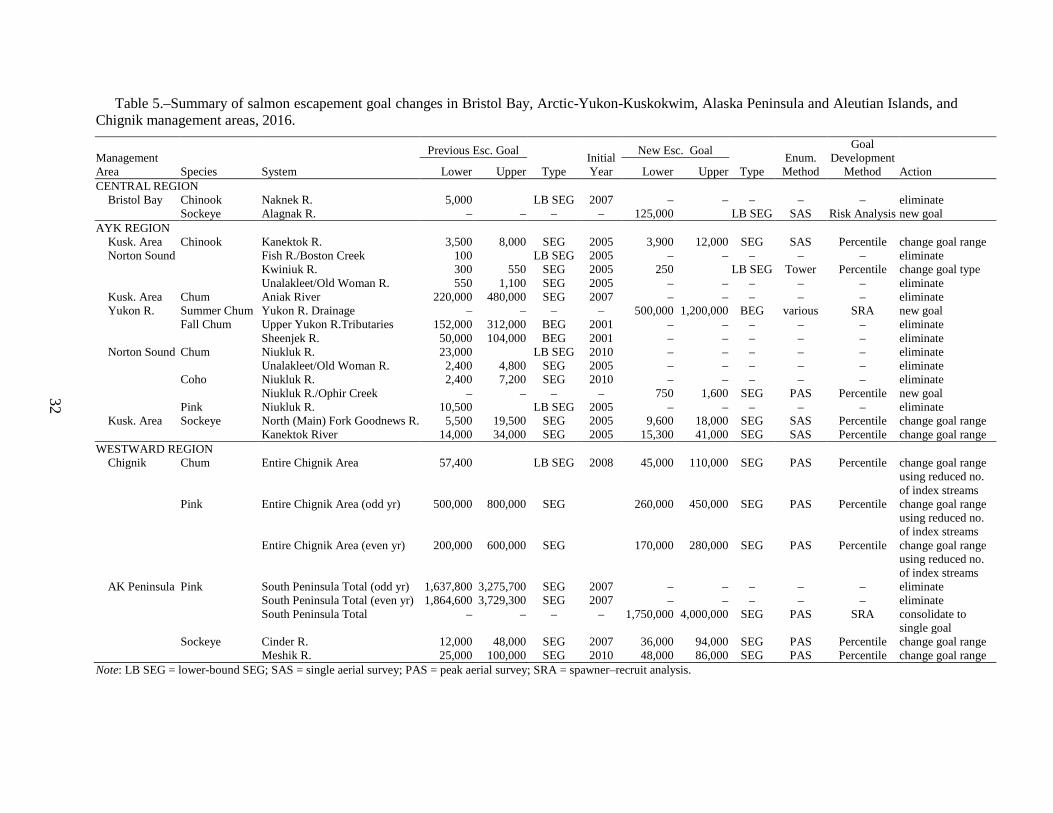
32
Table 5.–Summary of salmon escapement goal changes in Bristol Bay, Arctic-Yukon-Kuskokwim, Alaska Peninsula and Aleutian Islands, and Chignik management areas, 2016.
Management Area
Previous Esc. Goal Initial
Year
New Esc. Goal Enum.
Method
Goal Development
Method Species System Lower Upper Type Lower Upper Type Action CENTRAL REGION
Bristol Bay Chinook Naknek R. 5,000 LB SEG 2007 – – – – – eliminate Sockeye Alagnak R. – – – – 125,000 LB SEG SAS Risk Analysis new goal AYK REGION
Kusk. Area Chinook Kanektok R. 3,500 8,000 SEG 2005 3,900 12,000 SEG SAS Percentile change goal range Norton Sound
Fish R./Boston Creek 100
LB SEG 2005 – – – – – eliminate
Kwiniuk R. 300 550 SEG 2005 250
LB SEG Tower Percentile change goal type
Unalakleet/Old Woman R. 550 1,100 SEG 2005 – – – – – eliminate Kusk. Area Chum Aniak River 220,000 480,000 SEG 2007 – – – – – eliminate Yukon R. Summer Chum Yukon R. Drainage – – – – 500,000 1,200,000 BEG various SRA new goal
Fall Chum Upper Yukon R.Tributaries 152,000 312,000 BEG 2001 – – – – – eliminate
Sheenjek R. 50,000 104,000 BEG 2001 – – – – – eliminate
Norton Sound Chum Niukluk R. 23,000
LB SEG 2010 – – – – – eliminate Unalakleet/Old Woman R. 2,400 4,800 SEG 2005 – – – – – eliminate
Coho Niukluk R. 2,400 7,200 SEG 2010 – – – – – eliminate
Niukluk R./Ophir Creek – – – – 750 1,600 SEG PAS Percentile new goal
Pink Niukluk R. 10,500
LB SEG 2005 – – – – – eliminate
Kusk. Area Sockeye North (Main) Fork Goodnews R. 5,500 19,500 SEG 2005 9,600 18,000 SEG SAS Percentile change goal range Kanektok River 14,000 34,000 SEG 2005 15,300 41,000 SEG SAS Percentile change goal range WESTWARD REGION
Chignik Chum Entire Chignik Area 57,400 LB SEG 2008 45,000 110,000 SEG PAS Percentile change goal range using reduced no. of index streams
Pink Entire Chignik Area (odd yr) 500,000 800,000 SEG 260,000 450,000 SEG PAS Percentile change goal range using reduced no. of index streams
Entire Chignik Area (even yr) 200,000 600,000 SEG 170,000 280,000 SEG PAS Percentile change goal range using reduced no. of index streams
AK Peninsula Pink South Peninsula Total (odd yr) 1,637,800 3,275,700 SEG 2007 – – – – – eliminate South Peninsula Total (even yr) 1,864,600 3,729,300 SEG 2007 – – – – – eliminate South Peninsula Total – – – – 1,750,000 4,000,000 SEG PAS SRA consolidate to
single goal Sockeye Cinder R. 12,000 48,000 SEG 2007 36,000 94,000 SEG PAS Percentile change goal range Meshik R. 25,000 100,000 SEG 2010 48,000 86,000 SEG PAS Percentile change goal range Note: LB SEG = lower-bound SEG; SAS = single aerial survey; PAS = peak aerial survey; SRA = spawner–recruit analysis.
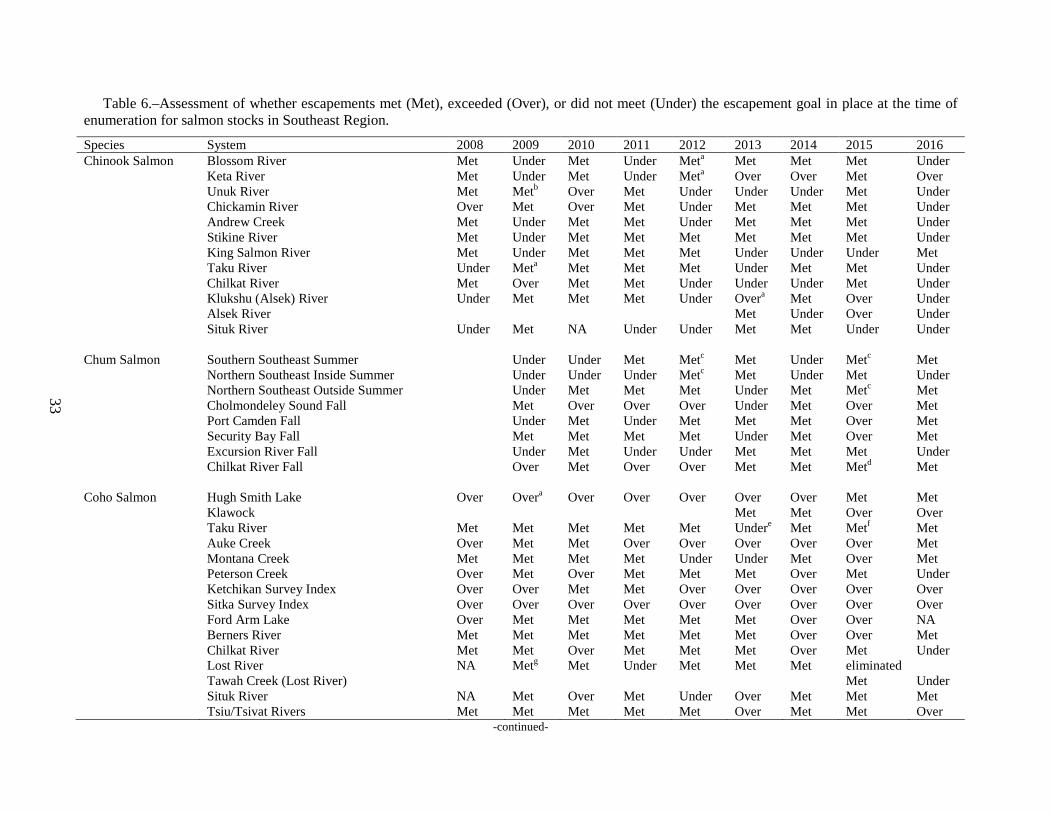
33
Table 6.–Assessment of whether escapements met (Met), exceeded (Over), or did not meet (Under) the escapement goal in place at the time of enumeration for salmon stocks in Southeast Region.
Species System 2008 2009 2010 2011 2012 2013 2014 2015 2016 Chinook Salmon Blossom River Met Under Met Under Meta Met Met Met Under
Keta River Met Under Met Under Meta Over Over Met Over
Unuk River Met Metb Over Met Under Under Under Met Under
Chickamin River Over Met Over Met Under Met Met Met Under
Andrew Creek Met Under Met Met Under Met Met Met Under
Stikine River Met Under Met Met Met Met Met Met Under
King Salmon River Met Under Met Met Met Under Under Under Met
Taku River Under Meta Met Met Met Under Met Met Under
Chilkat River Met Over Met Met Under Under Under Met Under
Klukshu (Alsek) River Under Met Met Met Under Overa Met Over Under
Alsek River Met Under Over Under
Situk River Under Met NA Under Under Met Met Under Under
Chum Salmon Southern Southeast Summer
Under Under Met Metc Met Under Metc Met
Northern Southeast Inside Summer
Under Under Under Metc Met Under Met Under
Northern Southeast Outside Summer
Under Met Met Met Under Met Metc Met
Cholmondeley Sound Fall
Met Over Over Over Under Met Over Met
Port Camden Fall
Under Met Under Met Met Met Over Met
Security Bay Fall
Met Met Met Met Under Met Over Met
Excursion River Fall
Under Met Under Under Met Met Met Under
Chilkat River Fall
Over Met Over Over Met Met Metd Met
Coho Salmon Hugh Smith Lake Over Overa Over Over Over Over Over Met Met
Klawock Met Met Over Over
Taku River Met Met Met Met Met Undere Met Metf Met
Auke Creek Over Met Met Over Over Over Over Over Met
Montana Creek Met Met Met Met Under Under Met Over Met
Peterson Creek Over Met Over Met Met Met Over Met Under
Ketchikan Survey Index Over Over Met Met Over Over Over Over Over
Sitka Survey Index Over Over Over Over Over Over Over Over Over
Ford Arm Lake Over Met Met Met Met Met Over Over NA
Berners River Met Met Met Met Met Met Over Over Met
Chilkat River Met Met Over Met Met Met Over Met Under
Lost River NA Metg Met Under Met Met Met eliminated
Tawah Creek (Lost River) Met Under
Situk River NA Met Over Met Under Over Met Met Met
Tsiu/Tsivat Rivers Met Met Met Met Met Over Met Met Over
-continued-
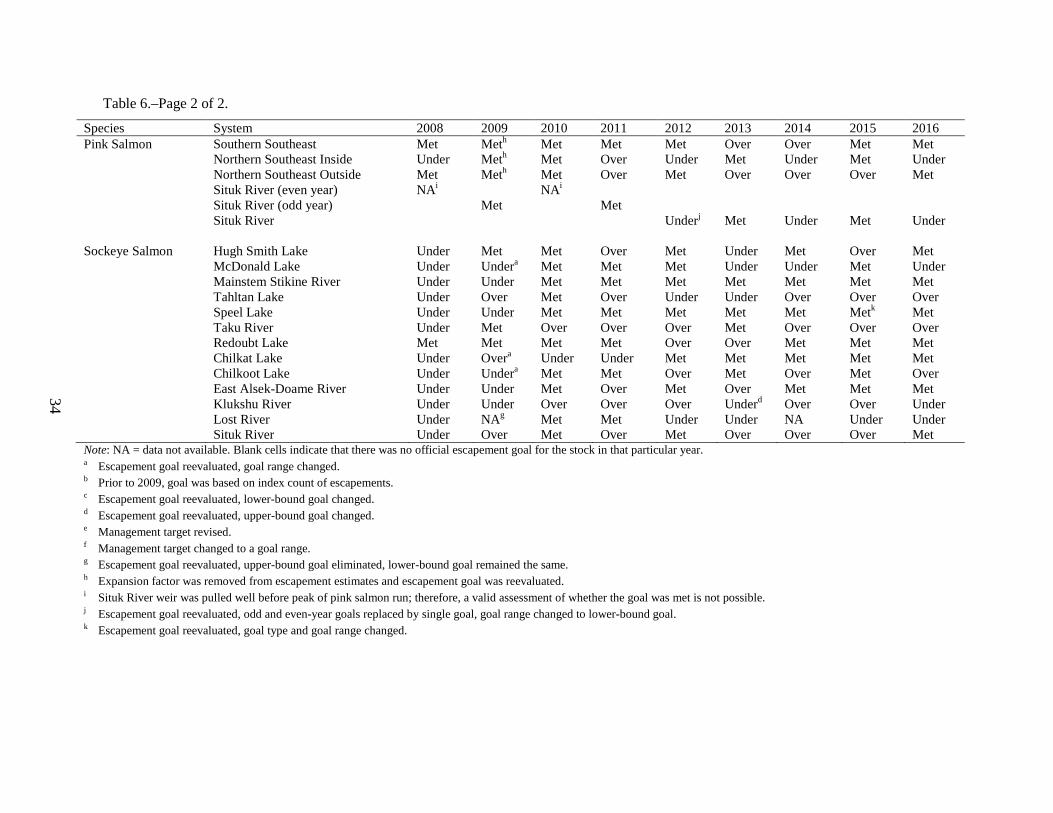
34
Table 6.–Page 2 of 2.
Species System 2008 2009 2010 2011 2012 2013 2014 2015 2016 Pink Salmon Southern Southeast Met Meth Met Met Met Over Over Met Met
Northern Southeast Inside Under Meth Met Over Under Met Under Met Under
Northern Southeast Outside Met Meth Met Over Met Over Over Over Met
Situk River (even year) NAi NAi
Situk River (odd year) Met Met
Situk River Underj Met Under Met Under
Sockeye Salmon Hugh Smith Lake Under Met Met Over Met Under Met Over Met
McDonald Lake Under Undera Met Met Met Under Under Met Under
Mainstem Stikine River Under Under Met Met Met Met Met Met Met
Tahltan Lake Under Over Met Over Under Under Over Over Over
Speel Lake Under Under Met Met Met Met Met Metk Met
Taku River Under Met Over Over Over Met Over Over Over
Redoubt Lake Met Met Met Met Over Over Met Met Met
Chilkat Lake Under Overa Under Under Met Met Met Met Met
Chilkoot Lake Under Undera Met Met Over Met Over Met Over
East Alsek-Doame River Under Under Met Over Met Over Met Met Met
Klukshu River Under Under Over Over Over Underd Over Over Under
Lost River Under NAg Met Met Under Under NA Under Under
Situk River Under Over Met Over Met Over Over Over Met
Note: NA = data not available. Blank cells indicate that there was no official escapement goal for the stock in that particular year. a Escapement goal reevaluated, goal range changed. b Prior to 2009, goal was based on index count of escapements. c Escapement goal reevaluated, lower-bound goal changed. d Escapement goal reevaluated, upper-bound goal changed. e Management target revised. f Management target changed to a goal range. g Escapement goal reevaluated, upper-bound goal eliminated, lower-bound goal remained the same. h Expansion factor was removed from escapement estimates and escapement goal was reevaluated. i Situk River weir was pulled well before peak of pink salmon run; therefore, a valid assessment of whether the goal was met is not possible. j Escapement goal reevaluated, odd and even-year goals replaced by single goal, goal range changed to lower-bound goal. k Escapement goal reevaluated, goal type and goal range changed.
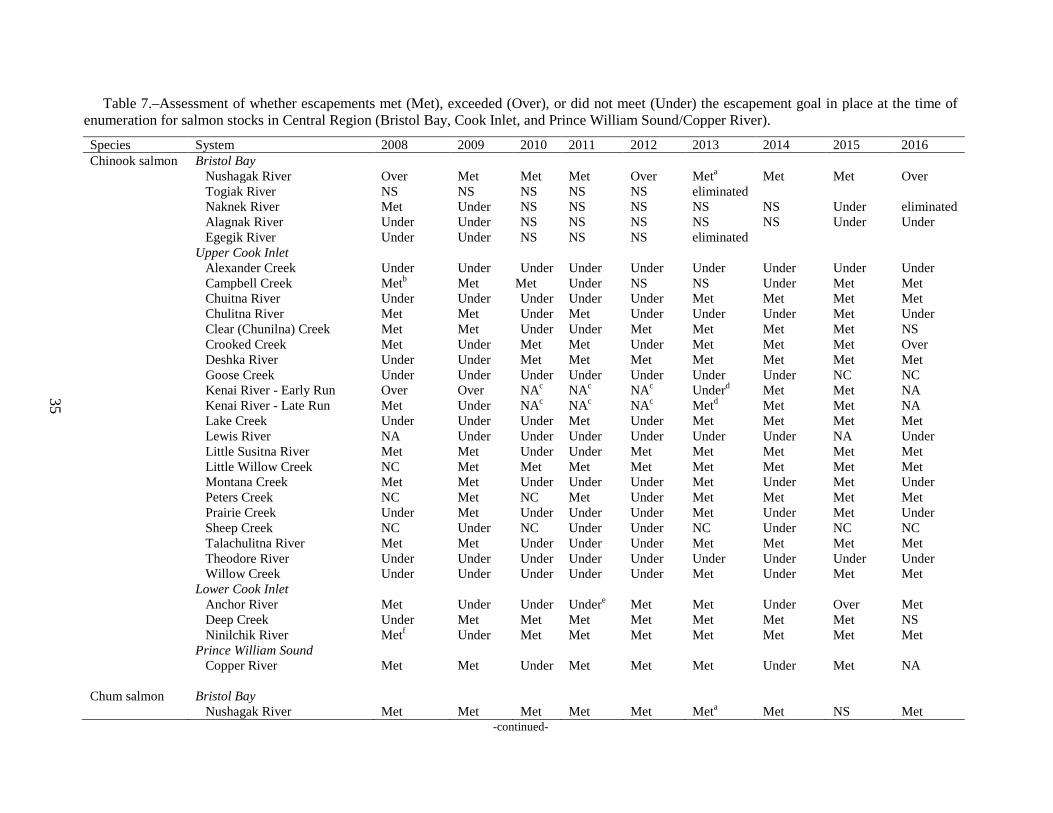
35
Table 7.–Assessment of whether escapements met (Met), exceeded (Over), or did not meet (Under) the escapement goal in place at the time of enumeration for salmon stocks in Central Region (Bristol Bay, Cook Inlet, and Prince William Sound/Copper River).
Species System 2008 2009 2010 2011 2012 2013 2014 2015 2016 Chinook salmon Bristol Bay
Nushagak River Over Met Met Met Over Meta Met Met Over
Togiak River NS NS NS NS NS eliminated
Naknek River Met Under NS NS NS NS NS Under eliminated
Alagnak River Under Under NS NS NS NS NS Under Under
Egegik River Under Under NS NS NS eliminated
Upper Cook Inlet
Alexander Creek Under Under Under Under Under Under Under Under Under
Campbell Creek Metb Met Met Under NS NS Under Met Met
Chuitna River Under Under Under Under Under Met Met Met Met
Chulitna River Met Met Under Met Under Under Under Met Under
Clear (Chunilna) Creek Met Met Under Under Met Met Met Met NS
Crooked Creek Met Under Met Met Under Met Met Met Over
Deshka River Under Under Met Met Met Met Met Met Met
Goose Creek Under Under Under Under Under Under Under NC NC
Kenai River - Early Run Over Over NAc NAc NAc Underd Met Met NA
Kenai River - Late Run Met Under NAc NAc NAc Metd Met Met NA
Lake Creek Under Under Under Met Under Met Met Met Met
Lewis River NA Under Under Under Under Under Under NA Under
Little Susitna River Met Met Under Under Met Met Met Met Met
Little Willow Creek NC Met Met Met Met Met Met Met Met
Montana Creek Met Met Under Under Under Met Under Met Under
Peters Creek NC Met NC Met Under Met Met Met Met
Prairie Creek Under Met Under Under Under Met Under Met Under
Sheep Creek NC Under NC Under Under NC Under NC NC
Talachulitna River Met Met Under Under Under Met Met Met Met
Theodore River Under Under Under Under Under Under Under Under Under
Willow Creek Under Under Under Under Under Met Under Met Met
Lower Cook Inlet
Anchor River Met Under Under Undere Met Met Under Over Met
Deep Creek Under Met Met Met Met Met Met Met NS
Ninilchik River Metf Under Met Met Met Met Met Met Met
Prince William Sound
Copper River Met Met Under Met Met Met Under Met NA
Chum salmon Bristol Bay
Nushagak River Met Met Met Met Met Meta Met NS Met
-continued-
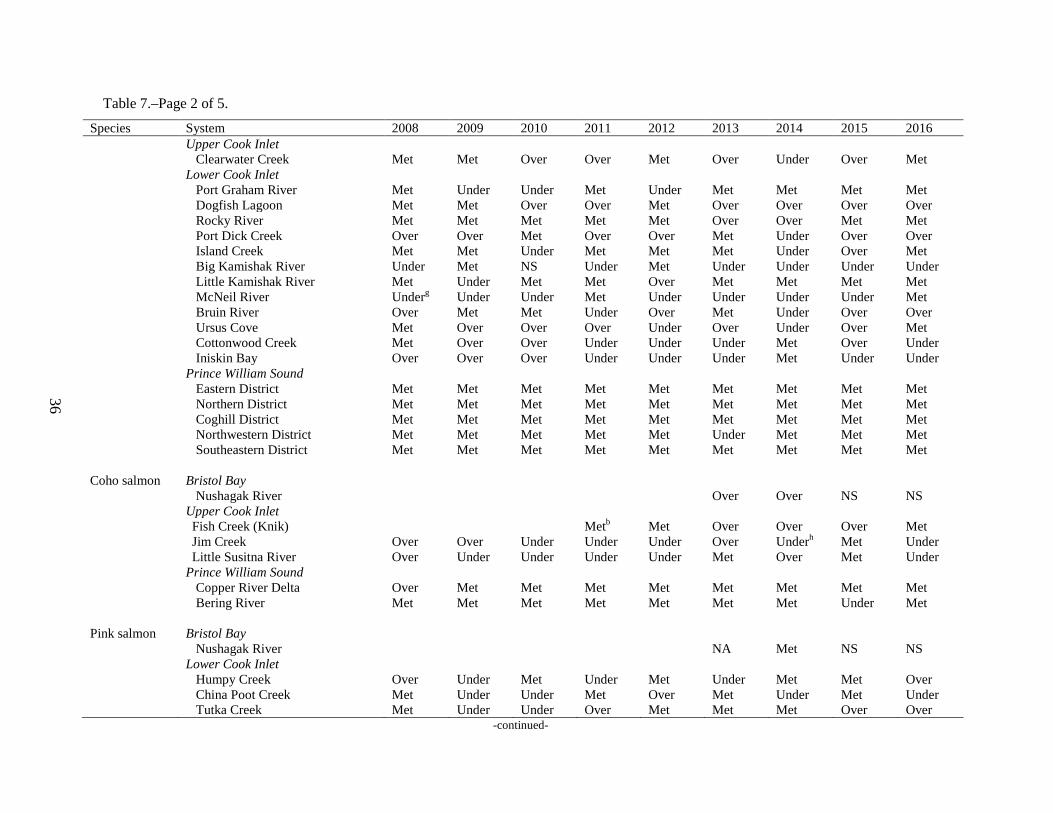
36
Table 7.–Page 2 of 5.
Species System 2008 2009 2010 2011 2012 2013 2014 2015 2016
Upper Cook Inlet
Clearwater Creek Met Met Over Over Met Over Under Over Met
Lower Cook Inlet
Port Graham River Met Under Under Met Under Met Met Met Met
Dogfish Lagoon Met Met Over Over Met Over Over Over Over
Rocky River Met Met Met Met Met Over Over Met Met
Port Dick Creek Over Over Met Over Over Met Under Over Over
Island Creek Met Met Under Met Met Met Under Over Met
Big Kamishak River Under Met NS Under Met Under Under Under Under
Little Kamishak River Met Under Met Met Over Met Met Met Met
McNeil River Underg Under Under Met Under Under Under Under Met
Bruin River Over Met Met Under Over Met Under Over Over
Ursus Cove Met Over Over Over Under Over Under Over Met
Cottonwood Creek Met Over Over Under Under Under Met Over Under
Iniskin Bay Over Over Over Under Under Under Met Under Under
Prince William Sound
Eastern District Met Met Met Met Met Met Met Met Met
Northern District Met Met Met Met Met Met Met Met Met
Coghill District Met Met Met Met Met Met Met Met Met
Northwestern District Met Met Met Met Met Under Met Met Met
Southeastern District Met Met Met Met Met Met Met Met Met
Coho salmon Bristol Bay
Nushagak River Over Over NS NS
Upper Cook Inlet
Fish Creek (Knik) Metb Met Over Over Over Met
Jim Creek Over Over Under Under Under Over Underh Met Under
Little Susitna River Over Under Under Under Under Met Over Met Under
Prince William Sound
Copper River Delta Over Met Met Met Met Met Met Met Met
Bering River Met Met Met Met Met Met Met Under Met
Pink salmon Bristol Bay
Nushagak River
NA Met NS NS
Lower Cook Inlet
Humpy Creek Over Under Met Under Met Under Met Met Over
China Poot Creek Met Under Under Met Over Met Under Met Under
Tutka Creek Met Under Under Over Met Met Met Over Over -continued-
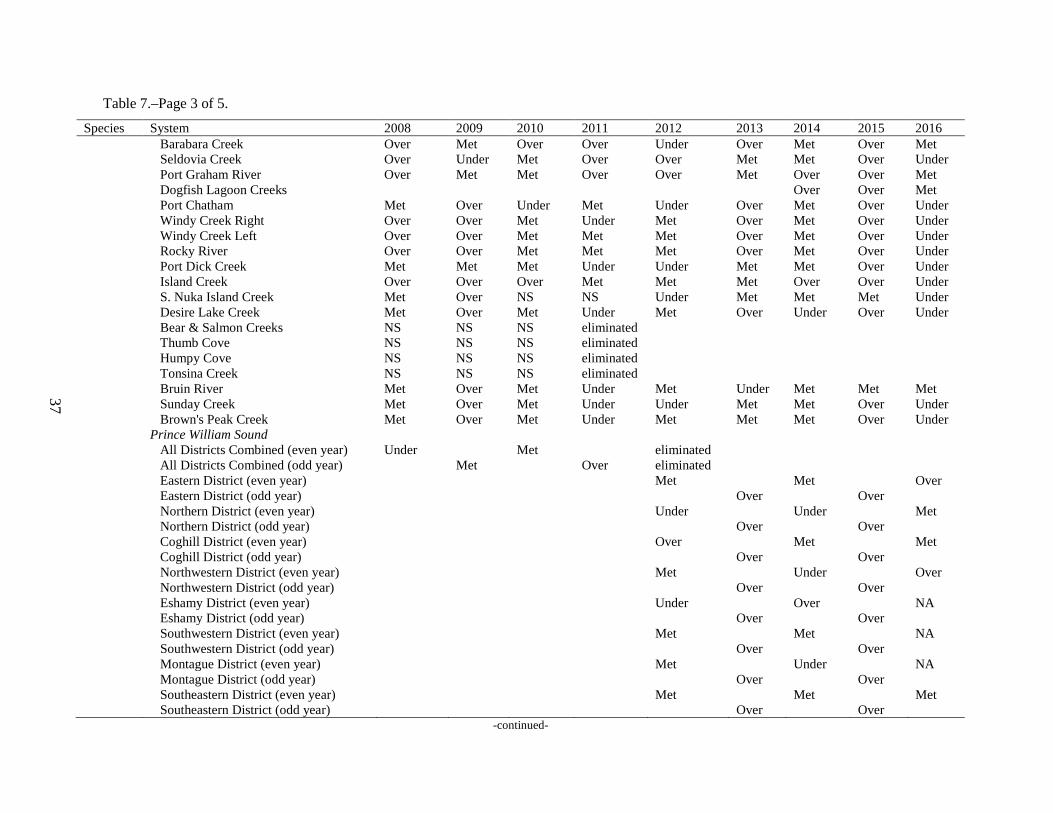
37
Table 7.–Page 3 of 5.
Species System 2008 2009 2010 2011 2012 2013 2014 2015 2016
Barabara Creek Over Met Over Over Under Over Met Over Met
Seldovia Creek Over Under Met Over Over Met Met Over Under
Port Graham River Over Met Met Over Over Met Over Over Met
Dogfish Lagoon Creeks Over Over Met
Port Chatham Met Over Under Met Under Over Met Over Under
Windy Creek Right Over Over Met Under Met Over Met Over Under
Windy Creek Left Over Over Met Met Met Over Met Over Under
Rocky River Over Over Met Met Met Over Met Over Under
Port Dick Creek Met Met Met Under Under Met Met Over Under
Island Creek Over Over Over Met Met Met Over Over Under
S. Nuka Island Creek Met Over NS NS Under Met Met Met Under
Desire Lake Creek Met Over Met Under Met Over Under Over Under
Bear & Salmon Creeks NS NS NS eliminated
Thumb Cove NS NS NS eliminated
Humpy Cove NS NS NS eliminated
Tonsina Creek NS NS NS eliminated
Bruin River Met Over Met Under Met Under Met Met Met
Sunday Creek Met Over Met Under Under Met Met Over Under
Brown's Peak Creek Met Over Met Under Met Met Met Over Under
Prince William Sound
All Districts Combined (even year) Under Met eliminated
All Districts Combined (odd year) Met Over eliminated
Eastern District (even year) Met Met Over
Eastern District (odd year) Over Over
Northern District (even year) Under Under Met
Northern District (odd year) Over Over
Coghill District (even year) Over Met Met
Coghill District (odd year) Over Over
Northwestern District (even year) Met Under Over
Northwestern District (odd year) Over Over
Eshamy District (even year) Under Over NA
Eshamy District (odd year) Over Over
Southwestern District (even year) Met Met NA
Southwestern District (odd year) Over Over
Montague District (even year) Met Under NA
Montague District (odd year) Over Over
Southeastern District (even year) Met Met Met
Southeastern District (odd year) Over Over
-continued-
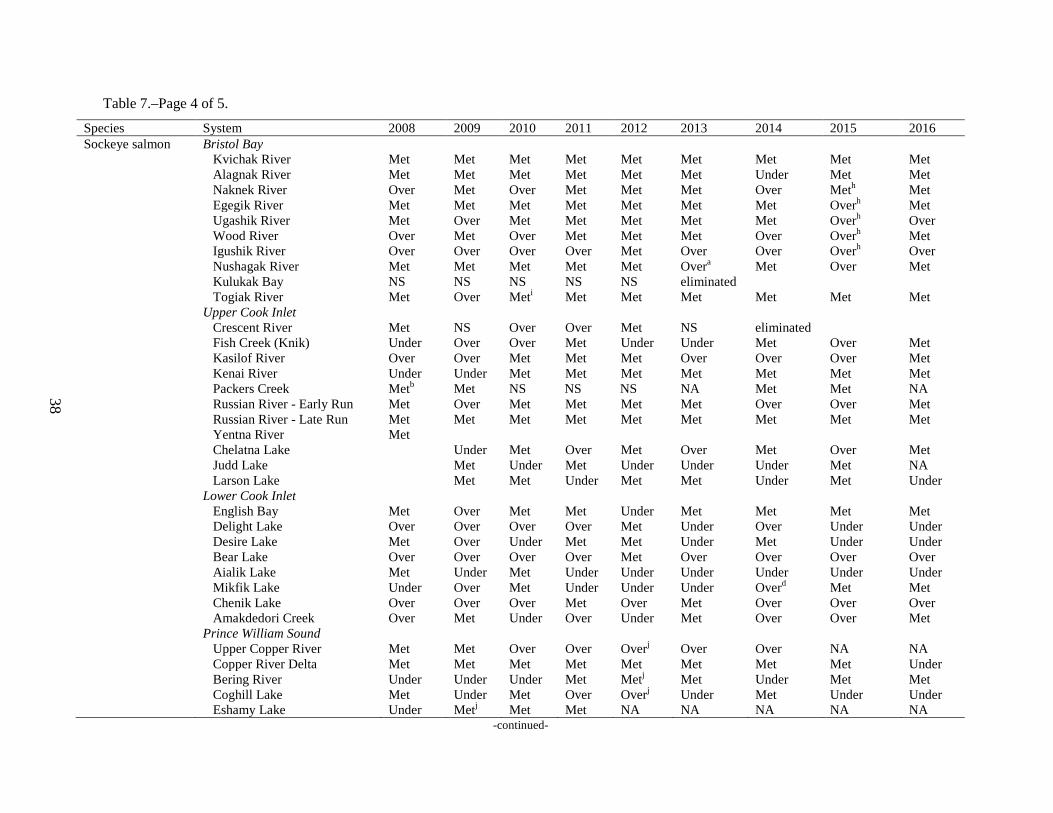
38
Table 7.–Page 4 of 5.
Species System 2008 2009 2010 2011 2012 2013 2014 2015 2016 Sockeye salmon Bristol Bay
Kvichak River Met Met Met Met Met Met Met Met Met
Alagnak River Met Met Met Met Met Met Under Met Met
Naknek River Over Met Over Met Met Met Over Meth Met
Egegik River Met Met Met Met Met Met Met Overh Met
Ugashik River Met Over Met Met Met Met Met Overh Over
Wood River Over Met Over Met Met Met Over Overh Met
Igushik River Over Over Over Over Met Over Over Overh Over
Nushagak River Met Met Met Met Met Overa Met Over Met
Kulukak Bay NS NS NS NS NS eliminated
Togiak River Met Over Meti Met Met Met Met Met Met
Upper Cook Inlet
Crescent River Met NS Over Over Met NS eliminated
Fish Creek (Knik) Under Over Over Met Under Under Met Over Met
Kasilof River Over Over Met Met Met Over Over Over Met
Kenai River Under Under Met Met Met Met Met Met Met
Packers Creek Metb Met NS NS NS NA Met Met NA
Russian River - Early Run Met Over Met Met Met Met Over Over Met
Russian River - Late Run Met Met Met Met Met Met Met Met Met
Yentna River Met
Chelatna Lake Under Met Over Met Over Met Over Met
Judd Lake Met Under Met Under Under Under Met NA
Larson Lake Met Met Under Met Met Under Met Under
Lower Cook Inlet
English Bay Met Over Met Met Under Met Met Met Met
Delight Lake Over Over Over Over Met Under Over Under Under
Desire Lake Met Over Under Met Met Under Met Under Under
Bear Lake Over Over Over Over Met Over Over Over Over
Aialik Lake Met Under Met Under Under Under Under Under Under
Mikfik Lake Under Over Met Under Under Under Overd Met Met
Chenik Lake Over Over Over Met Over Met Over Over Over
Amakdedori Creek Over Met Under Over Under Met Over Over Met
Prince William Sound
Upper Copper River Met Met Over Over Overj Over Over NA NA
Copper River Delta Met Met Met Met Met Met Met Met Under
Bering River Under Under Under Met Metj Met Under Met Met Coghill Lake Met Under Met Over Overj Under Met Under Under Eshamy Lake Under Metj Met Met NA NA NA NA NA
-continued-
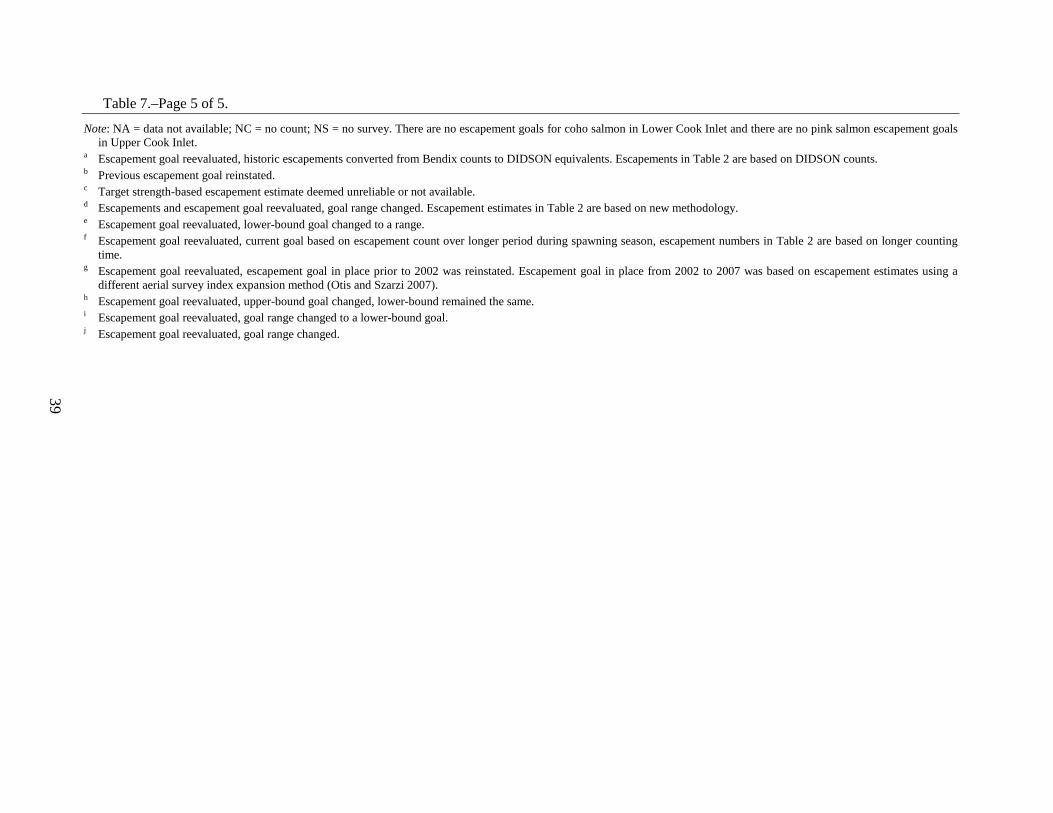
39
Table 7.–Page 5 of 5.
Note: NA = data not available; NC = no count; NS = no survey. There are no escapement goals for coho salmon in Lower Cook Inlet and there are no pink salmon escapement goals in Upper Cook Inlet.
a Escapement goal reevaluated, historic escapements converted from Bendix counts to DIDSON equivalents. Escapements in Table 2 are based on DIDSON counts. b Previous escapement goal reinstated. c Target strength-based escapement estimate deemed unreliable or not available. d Escapements and escapement goal reevaluated, goal range changed. Escapement estimates in Table 2 are based on new methodology. e Escapement goal reevaluated, lower-bound goal changed to a range. f Escapement goal reevaluated, current goal based on escapement count over longer period during spawning season, escapement numbers in Table 2 are based on longer counting
time. g Escapement goal reevaluated, escapement goal in place prior to 2002 was reinstated. Escapement goal in place from 2002 to 2007 was based on escapement estimates using a
different aerial survey index expansion method (Otis and Szarzi 2007). h Escapement goal reevaluated, upper-bound goal changed, lower-bound remained the same. i Escapement goal reevaluated, goal range changed to a lower-bound goal. j Escapement goal reevaluated, goal range changed.
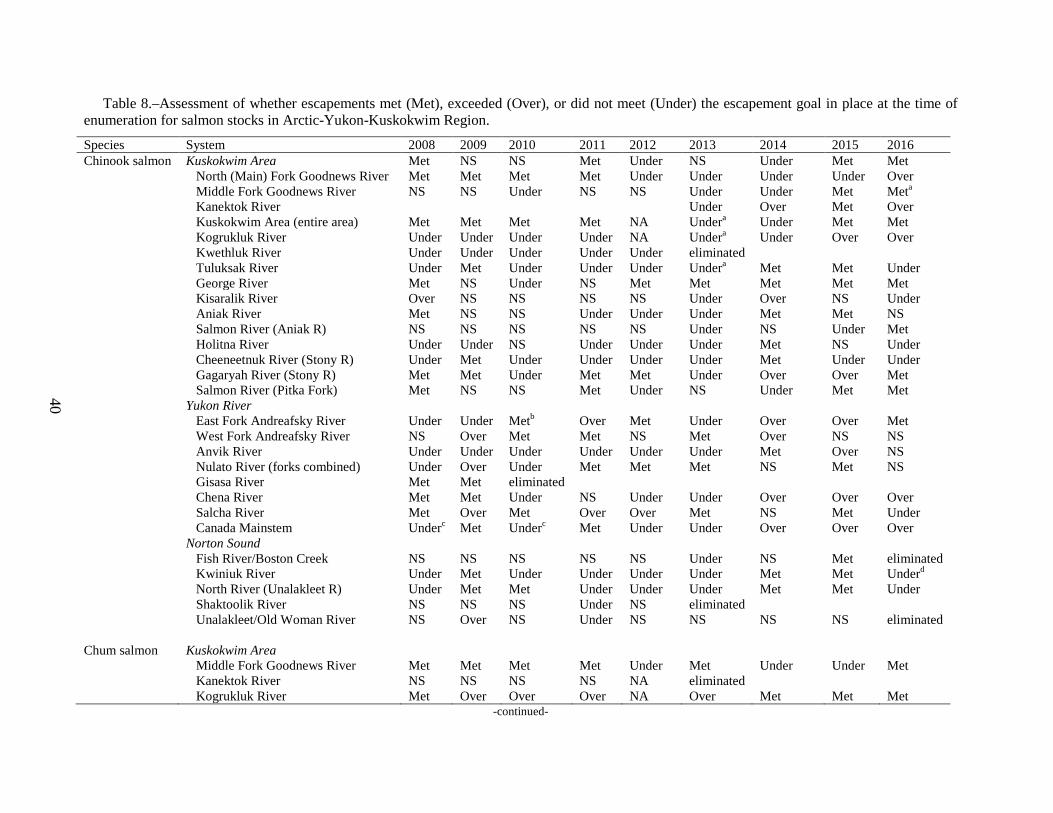
40
Table 8.–Assessment of whether escapements met (Met), exceeded (Over), or did not meet (Under) the escapement goal in place at the time of enumeration for salmon stocks in Arctic-Yukon-Kuskokwim Region.
Species System 2008 2009 2010 2011 2012 2013 2014 2015 2016 Chinook salmon Kuskokwim Area Met NS NS Met Under NS Under Met Met
North (Main) Fork Goodnews River Met Met Met Met Under Under Under Under Over
Middle Fork Goodnews River NS NS Under NS NS Under Under Met Meta
Kanektok River Under Over Met Over
Kuskokwim Area (entire area) Met Met Met Met NA Undera Under Met Met
Kogrukluk River Under Under Under Under NA Undera Under Over Over
Kwethluk River Under Under Under Under Under eliminated
Tuluksak River Under Met Under Under Under Undera Met Met Under
George River Met NS Under NS Met Met Met Met Met
Kisaralik River Over NS NS NS NS Under Over NS Under
Aniak River Met NS NS Under Under Under Met Met NS
Salmon River (Aniak R) NS NS NS NS NS Under NS Under Met
Holitna River Under Under NS Under Under Under Met NS Under
Cheeneetnuk River (Stony R) Under Met Under Under Under Under Met Under Under
Gagaryah River (Stony R) Met Met Under Met Met Under Over Over Met
Salmon River (Pitka Fork) Met NS NS Met Under NS Under Met Met
Yukon River
East Fork Andreafsky River Under Under Metb Over Met Under Over Over Met
West Fork Andreafsky River NS Over Met Met NS Met Over NS NS
Anvik River Under Under Under Under Under Under Met Over NS
Nulato River (forks combined) Under Over Under Met Met Met NS Met NS
Gisasa River Met Met eliminated
Chena River Met Met Under NS Under Under Over Over Over
Salcha River Met Over Met Over Over Met NS Met Under
Canada Mainstem Underc Met Underc Met Under Under Over Over Over
Norton Sound
Fish River/Boston Creek NS NS NS NS NS Under NS Met eliminated
Kwiniuk River Under Met Under Under Under Under Met Met Underd
North River (Unalakleet R) Under Met Met Under Under Under Met Met Under
Shaktoolik River NS NS NS Under NS eliminated
Unalakleet/Old Woman River NS Over NS Under NS NS NS NS eliminated
Chum salmon Kuskokwim Area
Middle Fork Goodnews River Met Met Met Met Under Met Under Under Met
Kanektok River NS NS NS NS NA eliminated
Kogrukluk River Met Over Over Over NA Over Met Met Met -continued-
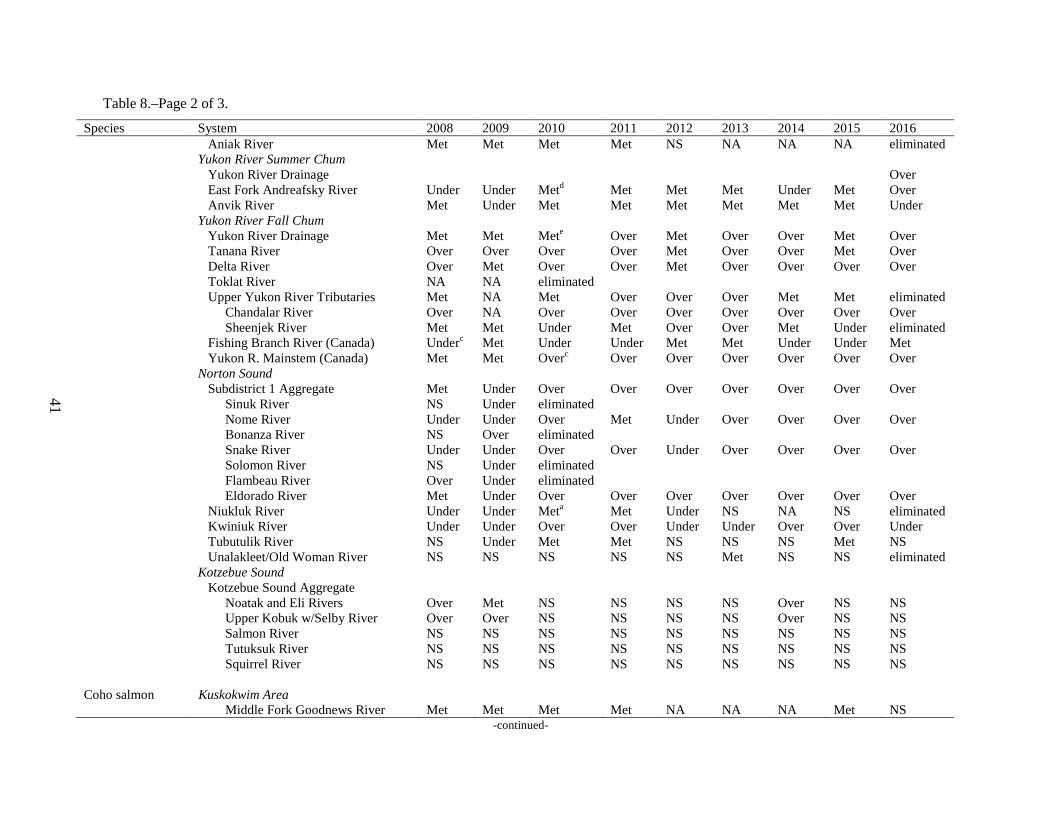
41
Table 8.–Page 2 of 3.
Species System 2008 2009 2010 2011 2012 2013 2014 2015 2016
Aniak River Met Met Met Met NS NA NA NA eliminated
Yukon River Summer Chum
Yukon River Drainage Over
East Fork Andreafsky River Under Under Metd Met Met Met Under Met Over
Anvik River Met Under Met Met Met Met Met Met Under
Yukon River Fall Chum
Yukon River Drainage Met Met Mete Over Met Over Over Met Over
Tanana River Over Over Over Over Met Over Over Met Over
Delta River Over Met Over Over Met Over Over Over Over
Toklat River NA NA eliminated
Upper Yukon River Tributaries Met NA Met Over Over Over Met Met eliminated
Chandalar River Over NA Over Over Over Over Over Over Over
Sheenjek River Met Met Under Met Over Over Met Under eliminated
Fishing Branch River (Canada) Underc Met Under Under Met Met Under Under Met
Yukon R. Mainstem (Canada) Met Met Overc Over Over Over Over Over Over
Norton Sound
Subdistrict 1 Aggregate Met Under Over Over Over Over Over Over Over
Sinuk River NS Under eliminated
Nome River Under Under Over Met Under Over Over Over Over
Bonanza River NS Over eliminated
Snake River Under Under Over Over Under Over Over Over Over
Solomon River NS Under eliminated
Flambeau River Over Under eliminated
Eldorado River Met Under Over Over Over Over Over Over Over
Niukluk River Under Under Meta Met Under NS NA NS eliminated
Kwiniuk River Under Under Over Over Under Under Over Over Under
Tubutulik River NS Under Met Met NS NS NS Met NS
Unalakleet/Old Woman River NS NS NS NS NS Met NS NS eliminated
Kotzebue Sound
Kotzebue Sound Aggregate
Noatak and Eli Rivers Over Met NS NS NS NS Over NS NS
Upper Kobuk w/Selby River Over Over NS NS NS NS Over NS NS
Salmon River NS NS NS NS NS NS NS NS NS
Tutuksuk River NS NS NS NS NS NS NS NS NS
Squirrel River NS NS NS NS NS NS NS NS NS
Coho salmon Kuskokwim Area Middle Fork Goodnews River Met Met Met Met NA NA NA Met NS
-continued-
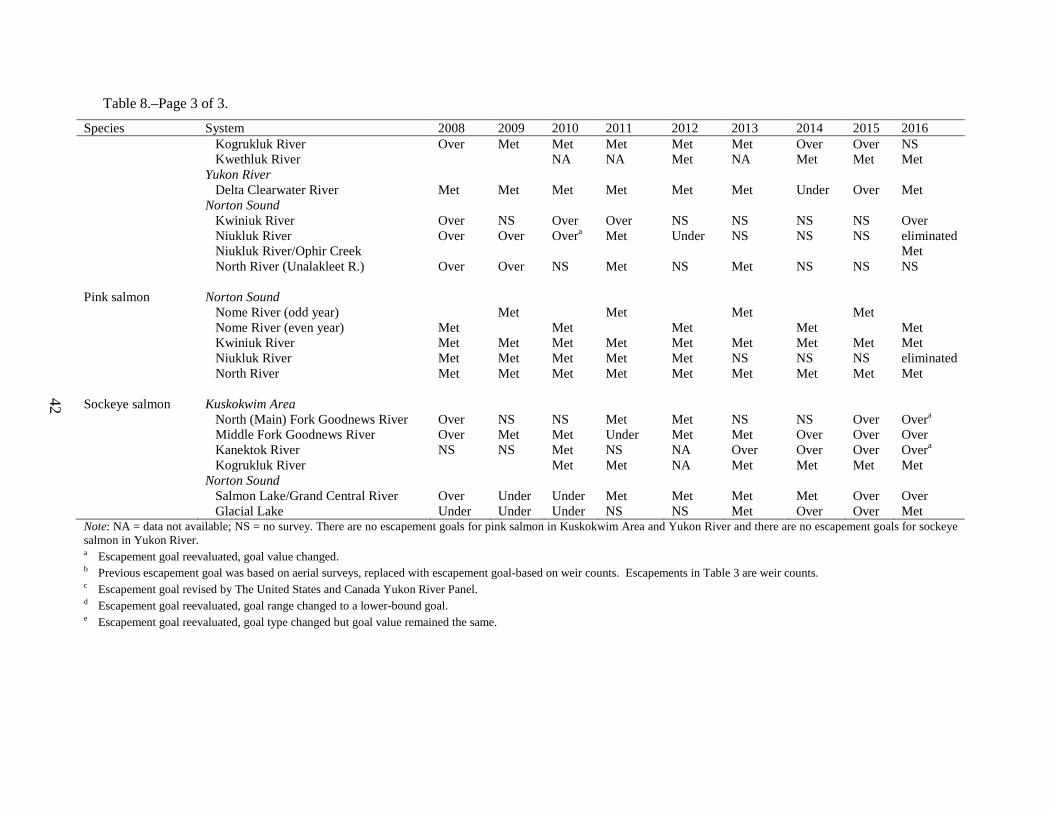
42
Table 8.–Page 3 of 3.
Species System 2008 2009 2010 2011 2012 2013 2014 2015 2016 Kogrukluk River Over Met Met Met Met Met Over Over NS
Kwethluk River NA NA Met NA Met Met Met
Yukon River
Delta Clearwater River Met Met Met Met Met Met Under Over Met
Norton Sound
Kwiniuk River Over NS Over Over NS NS NS NS Over
Niukluk River Over Over Overa Met Under NS NS NS eliminated
Niukluk River/Ophir Creek Met
North River (Unalakleet R.) Over Over NS Met NS Met NS NS NS
Pink salmon Norton Sound
Nome River (odd year) Met Met Met Met
Nome River (even year) Met Met Met Met Met
Kwiniuk River Met Met Met Met Met Met Met Met Met
Niukluk River Met Met Met Met Met NS NS NS eliminated
North River Met Met Met Met Met Met Met Met Met
Sockeye salmon Kuskokwim Area
North (Main) Fork Goodnews River Over NS NS Met Met NS NS Over Overa
Middle Fork Goodnews River Over Met Met Under Met Met Over Over Over
Kanektok River NS NS Met NS NA Over Over Over Overa
Kogrukluk River Met Met NA Met Met Met Met
Norton Sound
Salmon Lake/Grand Central River Over Under Under Met Met Met Met Over Over
Glacial Lake Under Under Under NS NS Met Over Over Met
Note: NA = data not available; NS = no survey. There are no escapement goals for pink salmon in Kuskokwim Area and Yukon River and there are no escapement goals for sockeye salmon in Yukon River. a Escapement goal reevaluated, goal value changed. b Previous escapement goal was based on aerial surveys, replaced with escapement goal-based on weir counts. Escapements in Table 3 are weir counts. c Escapement goal revised by The United States and Canada Yukon River Panel. d Escapement goal reevaluated, goal range changed to a lower-bound goal. e Escapement goal reevaluated, goal type changed but goal value remained the same.
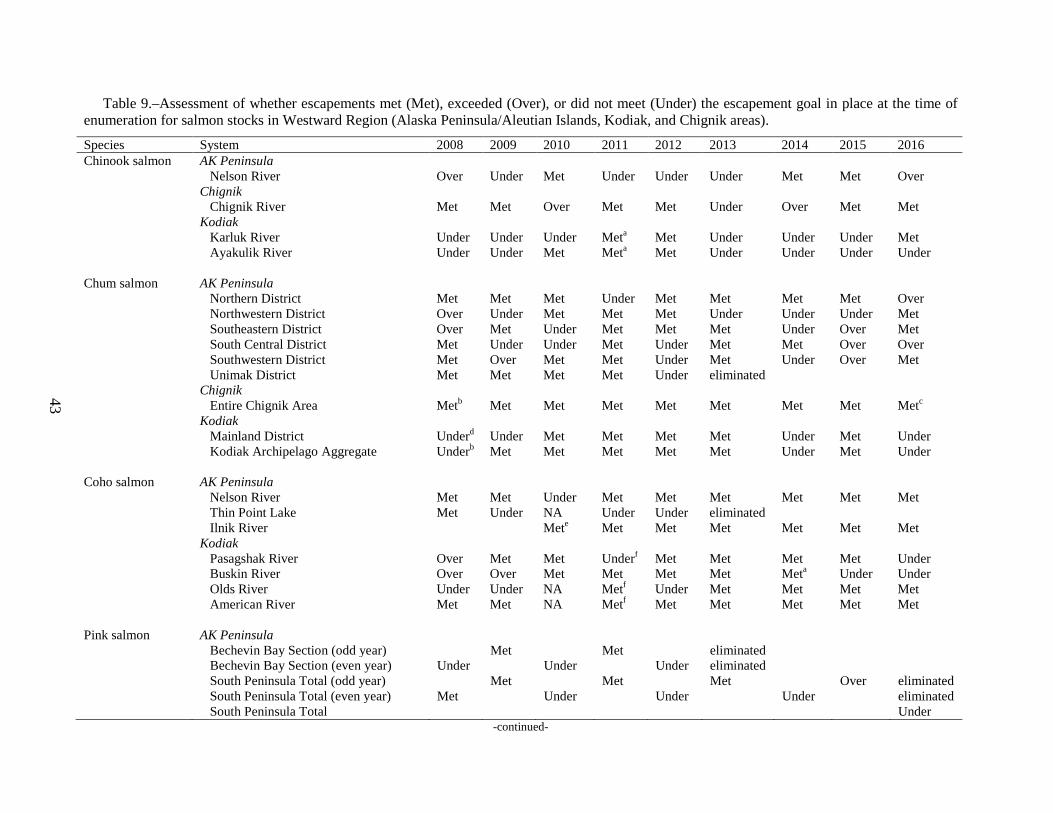
43
Table 9.–Assessment of whether escapements met (Met), exceeded (Over), or did not meet (Under) the escapement goal in place at the time of enumeration for salmon stocks in Westward Region (Alaska Peninsula/Aleutian Islands, Kodiak, and Chignik areas).
Species System 2008 2009 2010 2011 2012 2013 2014 2015 2016 Chinook salmon AK Peninsula
Nelson River Over Under Met Under Under Under Met Met Over
Chignik
Chignik River Met Met Over Met Met Under Over Met Met
Kodiak
Karluk River Under Under Under Meta Met Under Under Under Met
Ayakulik River Under Under Met Meta Met Under Under Under Under
Chum salmon AK Peninsula
Northern District Met Met Met Under Met Met Met Met Over
Northwestern District Over Under Met Met Met Under Under Under Met
Southeastern District Over Met Under Met Met Met Under Over Met
South Central District Met Under Under Met Under Met Met Over Over
Southwestern District Met Over Met Met Under Met Under Over Met
Unimak District Met Met Met Met Under eliminated
Chignik
Entire Chignik Area Metb Met Met Met Met Met Met Met Metc
Kodiak
Mainland District Underd Under Met Met Met Met Under Met Under
Kodiak Archipelago Aggregate Underb Met Met Met Met Met Under Met Under
Coho salmon AK Peninsula
Nelson River Met Met Under Met Met Met Met Met Met
Thin Point Lake Met Under NA Under Under eliminated
Ilnik River Mete Met Met Met Met Met Met
Kodiak
Pasagshak River Over Met Met Underf Met Met Met Met Under
Buskin River Over Over Met Met Met Met Meta Under Under
Olds River Under Under NA Metf Under Met Met Met Met
American River Met Met NA Metf Met Met Met Met Met
Pink salmon AK Peninsula
Bechevin Bay Section (odd year) Met Met eliminated
Bechevin Bay Section (even year) Under Under Under eliminated
South Peninsula Total (odd year) Met Met Met Over eliminated South Peninsula Total (even year) Met Under Under Under eliminated South Peninsula Total Under
-continued-
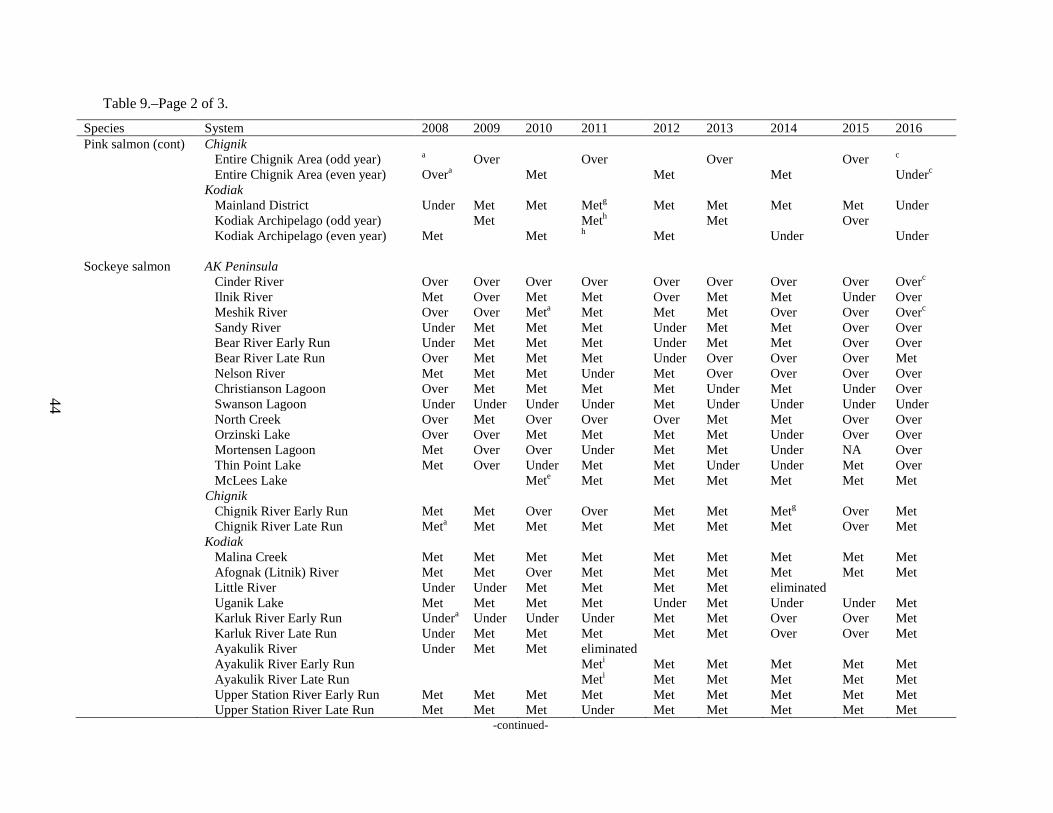
44
Table 9.–Page 2 of 3.
Species System 2008 2009 2010 2011 2012 2013 2014 2015 2016 Pink salmon (cont) Chignik
Entire Chignik Area (odd year) a Over Over Over Over c
Entire Chignik Area (even year) Overa Met Met Met Underc
Kodiak
Mainland District Under Met Met Metg Met Met Met Met Under
Kodiak Archipelago (odd year) Met Meth Met Over
Kodiak Archipelago (even year) Met Met h Met Under Under
Sockeye salmon AK Peninsula
Cinder River Over Over Over Over Over Over Over Over Overc
Ilnik River Met Over Met Met Over Met Met Under Over
Meshik River Over Over Meta Met Met Met Over Over Overc
Sandy River Under Met Met Met Under Met Met Over Over
Bear River Early Run Under Met Met Met Under Met Met Over Over
Bear River Late Run Over Met Met Met Under Over Over Over Met
Nelson River Met Met Met Under Met Over Over Over Over
Christianson Lagoon Over Met Met Met Met Under Met Under Over
Swanson Lagoon Under Under Under Under Met Under Under Under Under
North Creek Over Met Over Over Over Met Met Over Over
Orzinski Lake Over Over Met Met Met Met Under Over Over
Mortensen Lagoon Met Over Over Under Met Met Under NA Over
Thin Point Lake Met Over Under Met Met Under Under Met Over
McLees Lake Mete Met Met Met Met Met Met
Chignik
Chignik River Early Run Met Met Over Over Met Met Metg Over Met
Chignik River Late Run Meta Met Met Met Met Met Met Over Met
Kodiak
Malina Creek Met Met Met Met Met Met Met Met Met
Afognak (Litnik) River Met Met Over Met Met Met Met Met Met
Little River Under Under Met Met Met Met eliminated
Uganik Lake Met Met Met Met Under Met Under Under Met
Karluk River Early Run Undera Under Under Under Met Met Over Over Met
Karluk River Late Run Under Met Met Met Met Met Over Over Met
Ayakulik River Under Met Met eliminated Ayakulik River Early Run Meti Met Met Met Met Met Ayakulik River Late Run Meti Met Met Met Met Met Upper Station River Early Run Met Met Met Met Met Met Met Met Met Upper Station River Late Run Met Met Met Under Met Met Met Met Met
-continued-
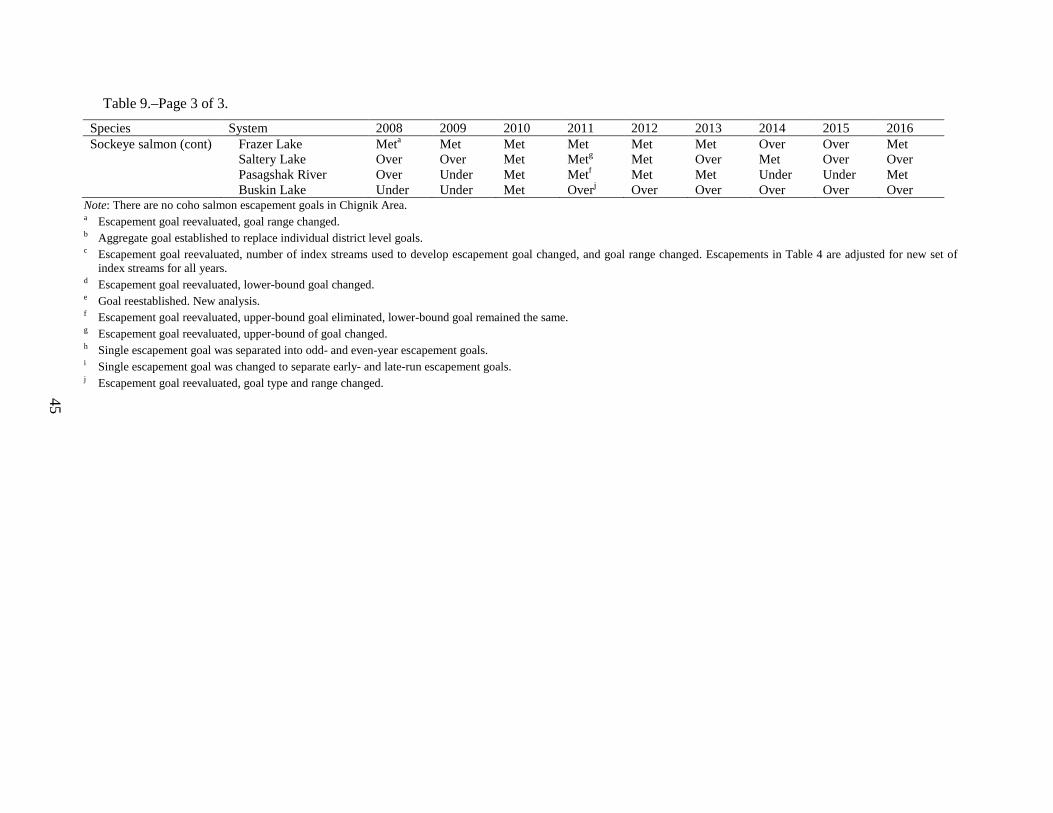
45
Table 9.–Page 3 of 3.
Species System 2008 2009 2010 2011 2012 2013 2014 2015 2016 Sockeye salmon (cont) Frazer Lake Meta Met Met Met Met Met Over Over Met
Saltery Lake Over Over Met Metg Met Over Met Over Over
Pasagshak River Over Under Met Metf Met Met Under Under Met
Buskin Lake Under Under Met Overj Over Over Over Over Over
Note: There are no coho salmon escapement goals in Chignik Area. a Escapement goal reevaluated, goal range changed. b Aggregate goal established to replace individual district level goals. c Escapement goal reevaluated, number of index streams used to develop escapement goal changed, and goal range changed. Escapements in Table 4 are adjusted for new set of
index streams for all years. d Escapement goal reevaluated, lower-bound goal changed. e Goal reestablished. New analysis. f Escapement goal reevaluated, upper-bound goal eliminated, lower-bound goal remained the same. g Escapement goal reevaluated, upper-bound of goal changed. h Single escapement goal was separated into odd- and even-year escapement goals. i Single escapement goal was changed to separate early- and late-run escapement goals. j Escapement goal reevaluated, goal type and range changed.
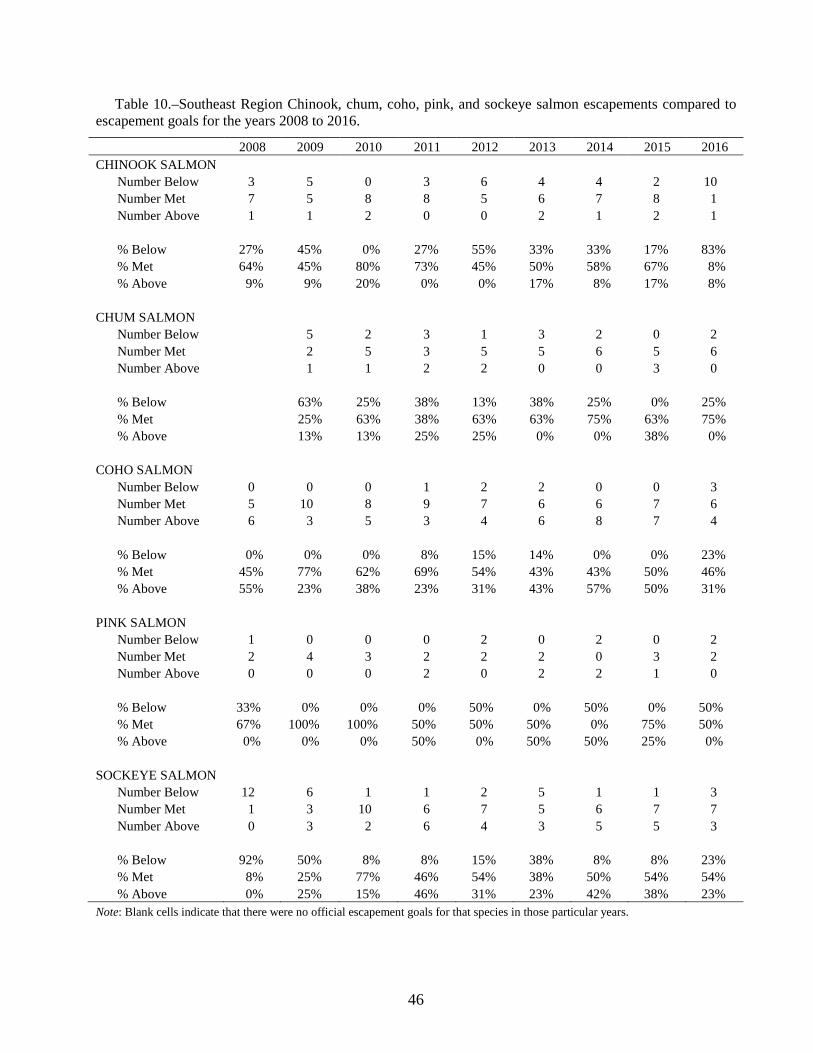
46
Table 10.–Southeast Region Chinook, chum, coho, pink, and sockeye salmon escapements compared to escapement goals for the years 2008 to 2016.
2008 2009 2010 2011 2012 2013 2014 2015 2016
CHINOOK SALMON Number Below 3 5 0 3 6 4 4 2 10
Number Met 7 5 8 8 5 6 7 8 1 Number Above 1 1 2 0 0 2 1 2 1
% Below 27% 45% 0% 27% 55% 33% 33% 17% 83% % Met 64% 45% 80% 73% 45% 50% 58% 67% 8% % Above 9% 9% 20% 0% 0% 17% 8% 17% 8%
CHUM SALMON Number Below
5 2 3 1 3 2 0 2 Number Met
2 5 3 5 5 6 5 6
Number Above
1 1 2 2 0 0 3 0
% Below
63% 25% 38% 13% 38% 25% 0% 25% % Met
25% 63% 38% 63% 63% 75% 63% 75%
% Above
13% 13% 25% 25% 0% 0% 38% 0%
COHO SALMON Number Below 0 0 0 1 2 2 0 0 3
Number Met 5 10 8 9 7 6 6 7 6 Number Above 6 3 5 3 4 6 8 7 4
% Below 0% 0% 0% 8% 15% 14% 0% 0% 23% % Met 45% 77% 62% 69% 54% 43% 43% 50% 46% % Above 55% 23% 38% 23% 31% 43% 57% 50% 31%
PINK SALMON Number Below 1 0 0 0 2 0 2 0 2
Number Met 2 4 3 2 2 2 0 3 2 Number Above 0 0 0 2 0 2 2 1 0
% Below 33% 0% 0% 0% 50% 0% 50% 0% 50% % Met 67% 100% 100% 50% 50% 50% 0% 75% 50% % Above 0% 0% 0% 50% 0% 50% 50% 25% 0%
SOCKEYE SALMON Number Below 12 6 1 1 2 5 1 1 3
Number Met 1 3 10 6 7 5 6 7 7 Number Above 0 3 2 6 4 3 5 5 3
% Below 92% 50% 8% 8% 15% 38% 8% 8% 23% % Met 8% 25% 77% 46% 54% 38% 50% 54% 54% % Above 0% 25% 15% 46% 31% 23% 42% 38% 23%
Note: Blank cells indicate that there were no official escapement goals for that species in those particular years.
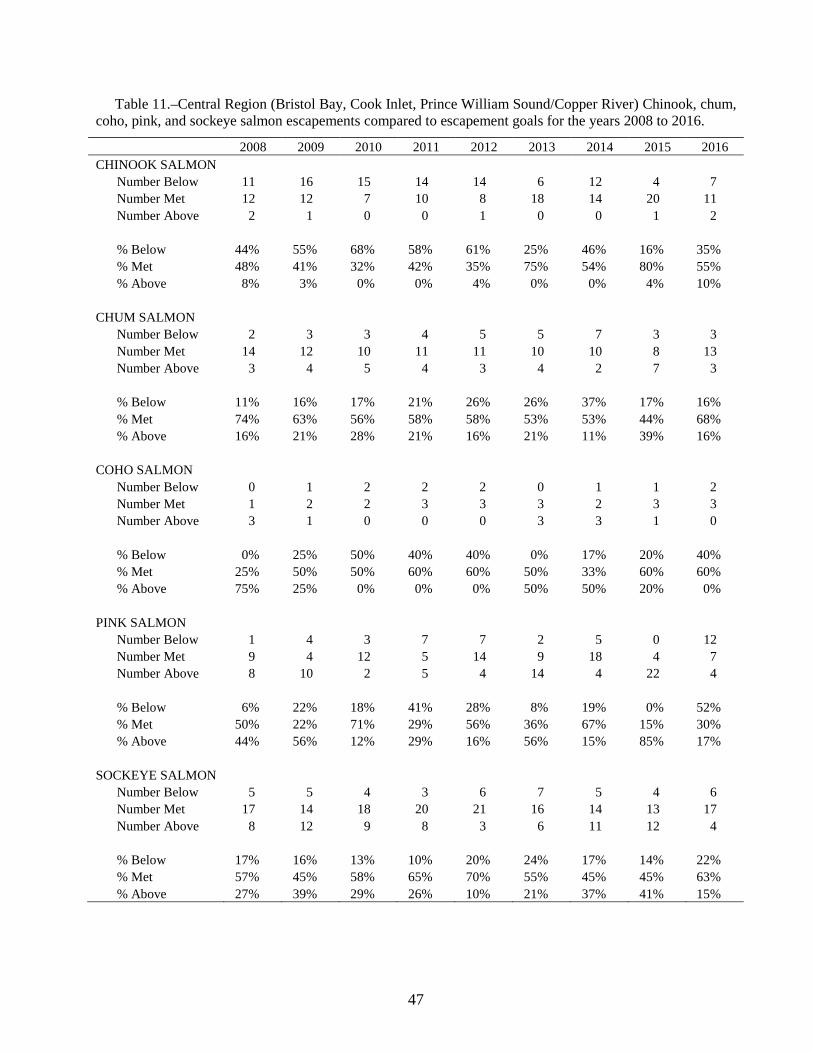
47
Table 11.–Central Region (Bristol Bay, Cook Inlet, Prince William Sound/Copper River) Chinook, chum, coho, pink, and sockeye salmon escapements compared to escapement goals for the years 2008 to 2016.
2008 2009 2010 2011 2012 2013 2014 2015 2016 CHINOOK SALMON
Number Below 11 16 15 14 14 6 12 4 7 Number Met 12 12 7 10 8 18 14 20 11 Number Above 2 1 0 0 1 0 0 1 2
% Below 44% 55% 68% 58% 61% 25% 46% 16% 35% % Met 48% 41% 32% 42% 35% 75% 54% 80% 55% % Above 8% 3% 0% 0% 4% 0% 0% 4% 10%
CHUM SALMON Number Below 2 3 3 4 5 5 7 3 3 Number Met 14 12 10 11 11 10 10 8 13 Number Above 3 4 5 4 3 4 2 7 3
% Below 11% 16% 17% 21% 26% 26% 37% 17% 16% % Met 74% 63% 56% 58% 58% 53% 53% 44% 68% % Above 16% 21% 28% 21% 16% 21% 11% 39% 16%
COHO SALMON Number Below 0 1 2 2 2 0 1 1 2 Number Met 1 2 2 3 3 3 2 3 3 Number Above 3 1 0 0 0 3 3 1 0
% Below 0% 25% 50% 40% 40% 0% 17% 20% 40% % Met 25% 50% 50% 60% 60% 50% 33% 60% 60% % Above 75% 25% 0% 0% 0% 50% 50% 20% 0%
PINK SALMON Number Below 1 4 3 7 7 2 5 0 12 Number Met 9 4 12 5 14 9 18 4 7 Number Above 8 10 2 5 4 14 4 22 4
% Below 6% 22% 18% 41% 28% 8% 19% 0% 52% % Met 50% 22% 71% 29% 56% 36% 67% 15% 30% % Above 44% 56% 12% 29% 16% 56% 15% 85% 17%
SOCKEYE SALMON Number Below 5 5 4 3 6 7 5 4 6 Number Met 17 14 18 20 21 16 14 13 17 Number Above 8 12 9 8 3 6 11 12 4
% Below 17% 16% 13% 10% 20% 24% 17% 14% 22% % Met 57% 45% 58% 65% 70% 55% 45% 45% 63% % Above 27% 39% 29% 26% 10% 21% 37% 41% 15%
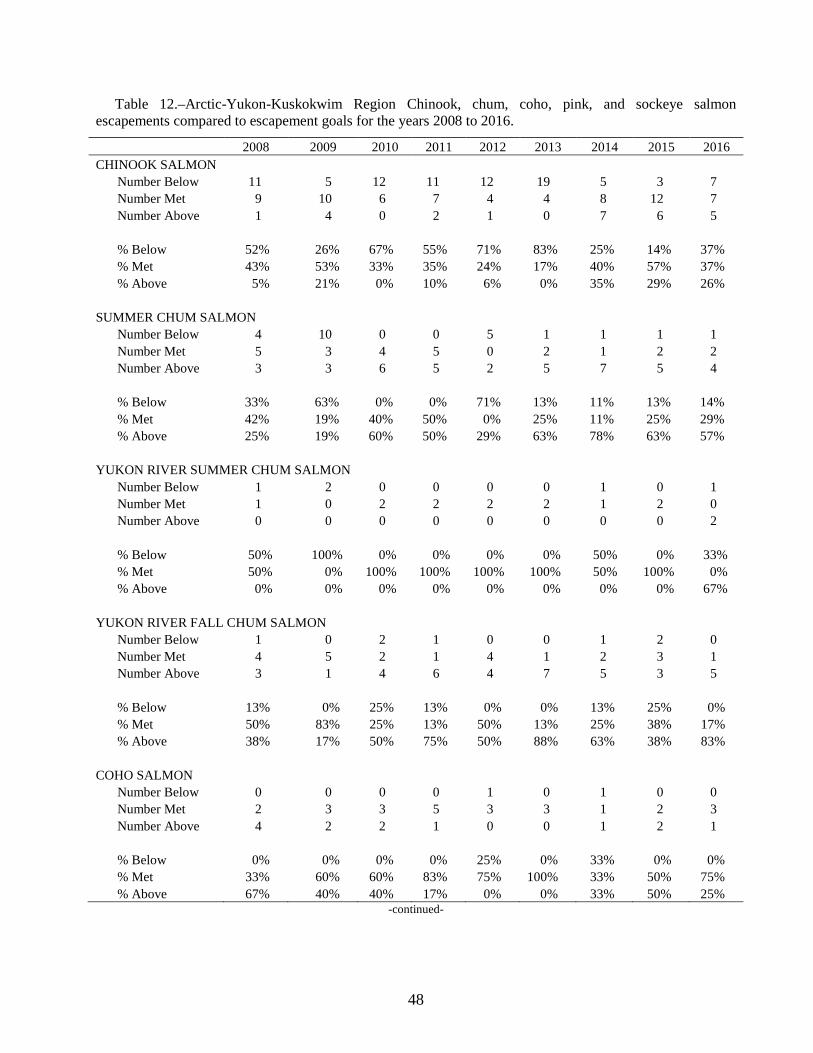
48
Table 12.–Arctic-Yukon-Kuskokwim Region Chinook, chum, coho, pink, and sockeye salmon escapements compared to escapement goals for the years 2008 to 2016.
2008 2009 2010 2011 2012 2013 2014 2015 2016 CHINOOK SALMON
Number Below 11 5 12 11 12 19 5 3 7 Number Met 9 10 6 7 4 4 8 12 7 Number Above 1 4 0 2 1 0 7 6 5
% Below 52% 26% 67% 55% 71% 83% 25% 14% 37% % Met 43% 53% 33% 35% 24% 17% 40% 57% 37% % Above 5% 21% 0% 10% 6% 0% 35% 29% 26%
SUMMER CHUM SALMON Number Below 4 10 0 0 5 1 1 1 1
Number Met 5 3 4 5 0 2 1 2 2 Number Above 3 3 6 5 2 5 7 5 4
% Below 33% 63% 0% 0% 71% 13% 11% 13% 14% % Met 42% 19% 40% 50% 0% 25% 11% 25% 29% % Above 25% 19% 60% 50% 29% 63% 78% 63% 57%
YUKON RIVER SUMMER CHUM SALMON Number Below 1 2 0 0 0 0 1 0 1
Number Met 1 0 2 2 2 2 1 2 0 Number Above 0 0 0 0 0 0 0 0 2
% Below 50% 100% 0% 0% 0% 0% 50% 0% 33% % Met 50% 0% 100% 100% 100% 100% 50% 100% 0% % Above 0% 0% 0% 0% 0% 0% 0% 0% 67%
YUKON RIVER FALL CHUM SALMON Number Below 1 0 2 1 0 0 1 2 0
Number Met 4 5 2 1 4 1 2 3 1 Number Above 3 1 4 6 4 7 5 3 5
% Below 13% 0% 25% 13% 0% 0% 13% 25% 0% % Met 50% 83% 25% 13% 50% 13% 25% 38% 17% % Above 38% 17% 50% 75% 50% 88% 63% 38% 83%
COHO SALMON Number Below 0 0 0 0 1 0 1 0 0
Number Met 2 3 3 5 3 3 1 2 3 Number Above 4 2 2 1 0 0 1 2 1
% Below 0% 0% 0% 0% 25% 0% 33% 0% 0% % Met 33% 60% 60% 83% 75% 100% 33% 50% 75% % Above 67% 40% 40% 17% 0% 0% 33% 50% 25%
-continued-
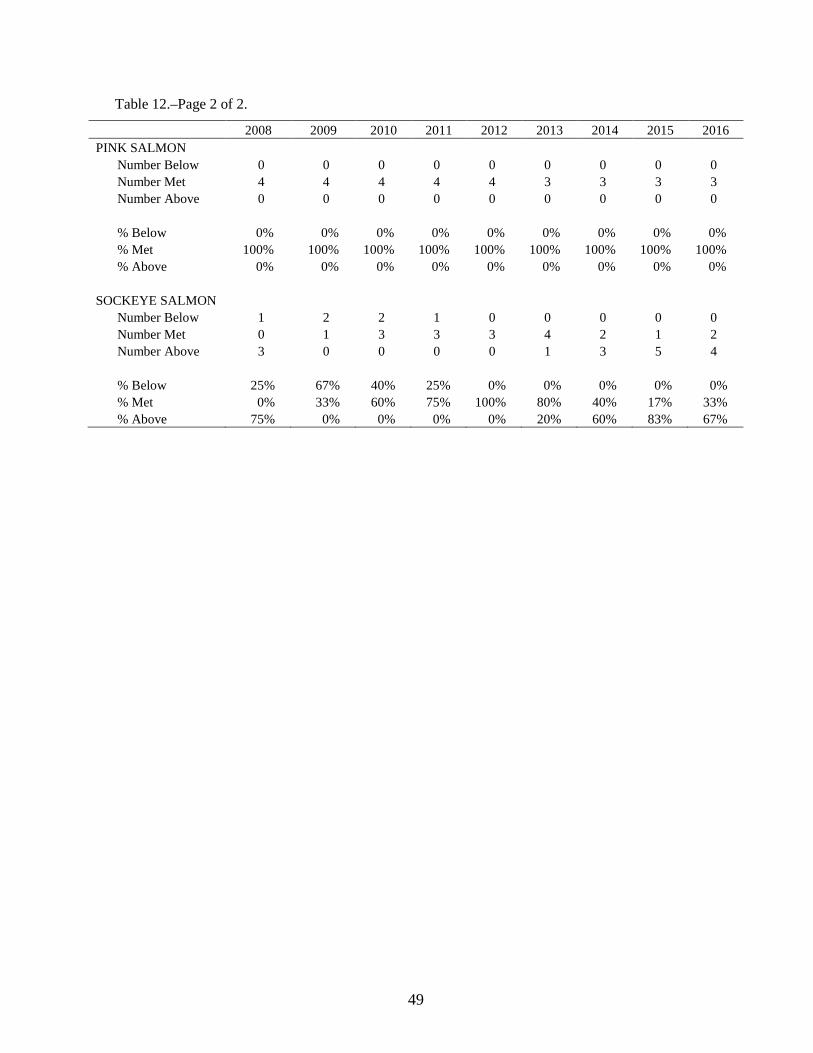
49
Table 12.–Page 2 of 2.
2008 2009 2010 2011 2012 2013 2014 2015 2016 PINK SALMON
Number Below 0 0 0 0 0 0 0 0 0 Number Met 4 4 4 4 4 3 3 3 3 Number Above 0 0 0 0 0 0 0 0 0
% Below 0% 0% 0% 0% 0% 0% 0% 0% 0% % Met 100% 100% 100% 100% 100% 100% 100% 100% 100% % Above 0% 0% 0% 0% 0% 0% 0% 0% 0%
SOCKEYE SALMON Number Below 1 2 2 1 0 0 0 0 0 Number Met 0 1 3 3 3 4 2 1 2 Number Above 3 0 0 0 0 1 3 5 4
% Below 25% 67% 40% 25% 0% 0% 0% 0% 0% % Met 0% 33% 60% 75% 100% 80% 40% 17% 33% % Above 75% 0% 0% 0% 0% 20% 60% 83% 67%
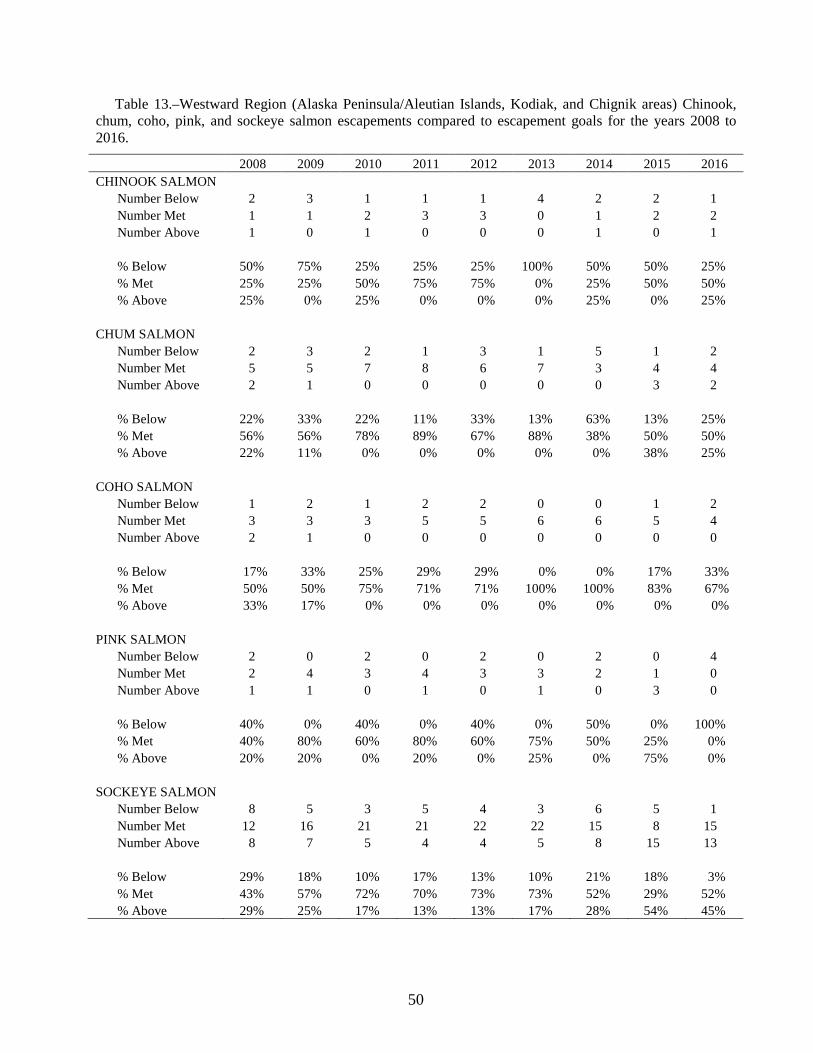
50
Table 13.–Westward Region (Alaska Peninsula/Aleutian Islands, Kodiak, and Chignik areas) Chinook, chum, coho, pink, and sockeye salmon escapements compared to escapement goals for the years 2008 to 2016.
2008 2009 2010 2011 2012 2013 2014 2015 2016
CHINOOK SALMON Number Below 2 3 1 1 1 4 2 2 1
Number Met 1 1 2 3 3 0 1 2 2 Number Above 1 0 1 0 0 0 1 0 1
% Below 50% 75% 25% 25% 25% 100% 50% 50% 25% % Met 25% 25% 50% 75% 75% 0% 25% 50% 50% % Above 25% 0% 25% 0% 0% 0% 25% 0% 25%
CHUM SALMON
Number Below 2 3 2 1 3 1 5 1 2 Number Met 5 5 7 8 6 7 3 4 4 Number Above 2 1 0 0 0 0 0 3 2
% Below 22% 33% 22% 11% 33% 13% 63% 13% 25% % Met 56% 56% 78% 89% 67% 88% 38% 50% 50% % Above 22% 11% 0% 0% 0% 0% 0% 38% 25%
COHO SALMON
Number Below 1 2 1 2 2 0 0 1 2 Number Met 3 3 3 5 5 6 6 5 4 Number Above 2 1 0 0 0 0 0 0 0
% Below 17% 33% 25% 29% 29% 0% 0% 17% 33% % Met 50% 50% 75% 71% 71% 100% 100% 83% 67% % Above 33% 17% 0% 0% 0% 0% 0% 0% 0%
PINK SALMON
Number Below 2 0 2 0 2 0 2 0 4 Number Met 2 4 3 4 3 3 2 1 0 Number Above 1 1 0 1 0 1 0 3 0
% Below 40% 0% 40% 0% 40% 0% 50% 0% 100% % Met 40% 80% 60% 80% 60% 75% 50% 25% 0% % Above 20% 20% 0% 20% 0% 25% 0% 75% 0%
SOCKEYE SALMON
Number Below 8 5 3 5 4 3 6 5 1 Number Met 12 16 21 21 22 22 15 8 15 Number Above 8 7 5 4 4 5 8 15 13
% Below 29% 18% 10% 17% 13% 10% 21% 18% 3% % Met 43% 57% 72% 70% 73% 73% 52% 29% 52% % Above 29% 25% 17% 13% 13% 17% 28% 54% 45%
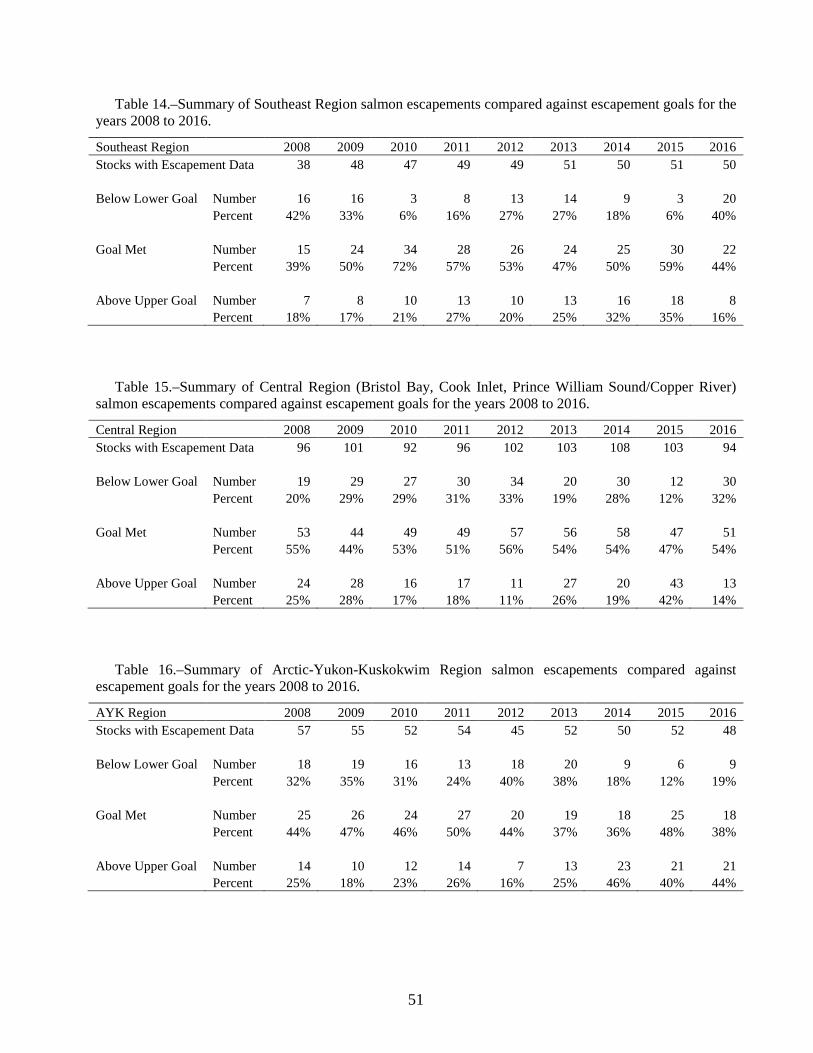
51
Table 14.–Summary of Southeast Region salmon escapements compared against escapement goals for the years 2008 to 2016.
Southeast Region 2008 2009 2010 2011 2012 2013 2014 2015 2016 Stocks with Escapement Data 38 48 47 49 49 51 50 51 50 Below Lower Goal Number 16 16 3 8 13 14 9 3 20
Percent 42% 33% 6% 16% 27% 27% 18% 6% 40%
Goal Met Number 15 24 34 28 26 24 25 30 22
Percent 39% 50% 72% 57% 53% 47% 50% 59% 44%
Above Upper Goal Number 7 8 10 13 10 13 16 18 8
Percent 18% 17% 21% 27% 20% 25% 32% 35% 16%
Table 15.–Summary of Central Region (Bristol Bay, Cook Inlet, Prince William Sound/Copper River)
salmon escapements compared against escapement goals for the years 2008 to 2016.
Central Region
2008 2009 2010 2011 2012 2013 2014 2015 2016 Stocks with Escapement Data 96 101 92 96 102 103 108 103 94
Below Lower Goal Number 19 29 27 30 34 20 30 12 30
Percent 20% 29% 29% 31% 33% 19% 28% 12% 32%
Goal Met Number 53 44 49 49 57 56 58 47 51
Percent 55% 44% 53% 51% 56% 54% 54% 47% 54%
Above Upper Goal Number 24 28 16 17 11 27 20 43 13
Percent 25% 28% 17% 18% 11% 26% 19% 42% 14%
Table 16.–Summary of Arctic-Yukon-Kuskokwim Region salmon escapements compared against
escapement goals for the years 2008 to 2016.
AYK Region
2008 2009 2010 2011 2012 2013 2014 2015 2016 Stocks with Escapement Data 57 55 52 54 45 52 50 52 48
Below Lower Goal Number 18 19 16 13 18 20 9 6 9
Percent 32% 35% 31% 24% 40% 38% 18% 12% 19%
Goal Met Number 25 26 24 27 20 19 18 25 18
Percent 44% 47% 46% 50% 44% 37% 36% 48% 38%
Above Upper Goal Number 14 10 12 14 7 13 23 21 21
Percent 25% 18% 23% 26% 16% 25% 46% 40% 44%
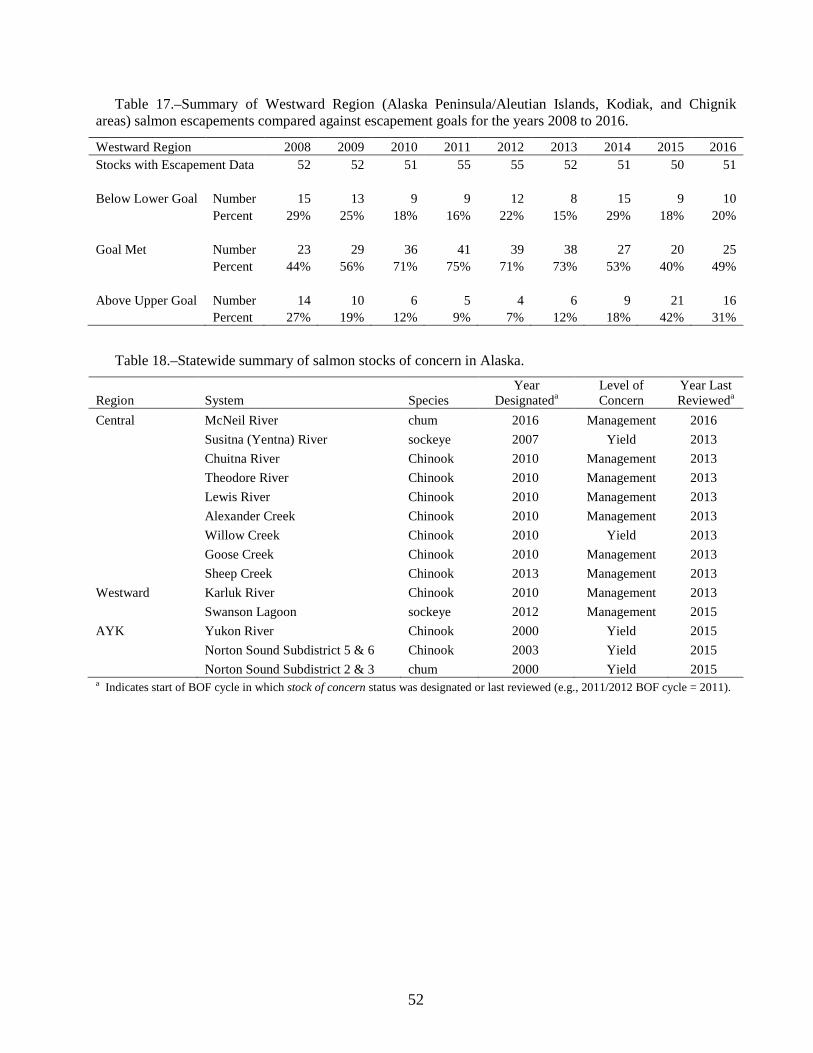
52
Table 17.–Summary of Westward Region (Alaska Peninsula/Aleutian Islands, Kodiak, and Chignik areas) salmon escapements compared against escapement goals for the years 2008 to 2016.
Westward Region
2008 2009 2010 2011 2012 2013 2014 2015 2016 Stocks with Escapement Data 52 52 51 55 55 52 51 50 51
Below Lower Goal Number 15 13 9 9 12 8 15 9 10
Percent 29% 25% 18% 16% 22% 15% 29% 18% 20%
Goal Met Number 23 29 36 41 39 38 27 20 25
Percent 44% 56% 71% 75% 71% 73% 53% 40% 49%
Above Upper Goal Number 14 10 6 5 4 6 9 21 16
Percent 27% 19% 12% 9% 7% 12% 18% 42% 31%
Table 18.–Statewide summary of salmon stocks of concern in Alaska.
Region System Species Year
Designateda Level of Concern
Year Last Revieweda
Central McNeil River chum 2016 Management 2016 Susitna (Yentna) River sockeye 2007 Yield 2013
Chuitna River Chinook 2010 Management 2013
Theodore River Chinook 2010 Management 2013
Lewis River Chinook 2010 Management 2013
Alexander Creek Chinook 2010 Management 2013
Willow Creek Chinook 2010 Yield 2013
Goose Creek Chinook 2010 Management 2013
Sheep Creek Chinook 2013 Management 2013 Westward Karluk River Chinook 2010 Management 2013 Swanson Lagoon sockeye 2012 Management 2015 AYK Yukon River Chinook 2000 Yield 2015
Norton Sound Subdistrict 5 & 6 Chinook 2003 Yield 2015
Norton Sound Subdistrict 2 & 3 chum 2000 Yield 2015 a Indicates start of BOF cycle in which stock of concern status was designated or last reviewed (e.g., 2011/2012 BOF cycle = 2011).
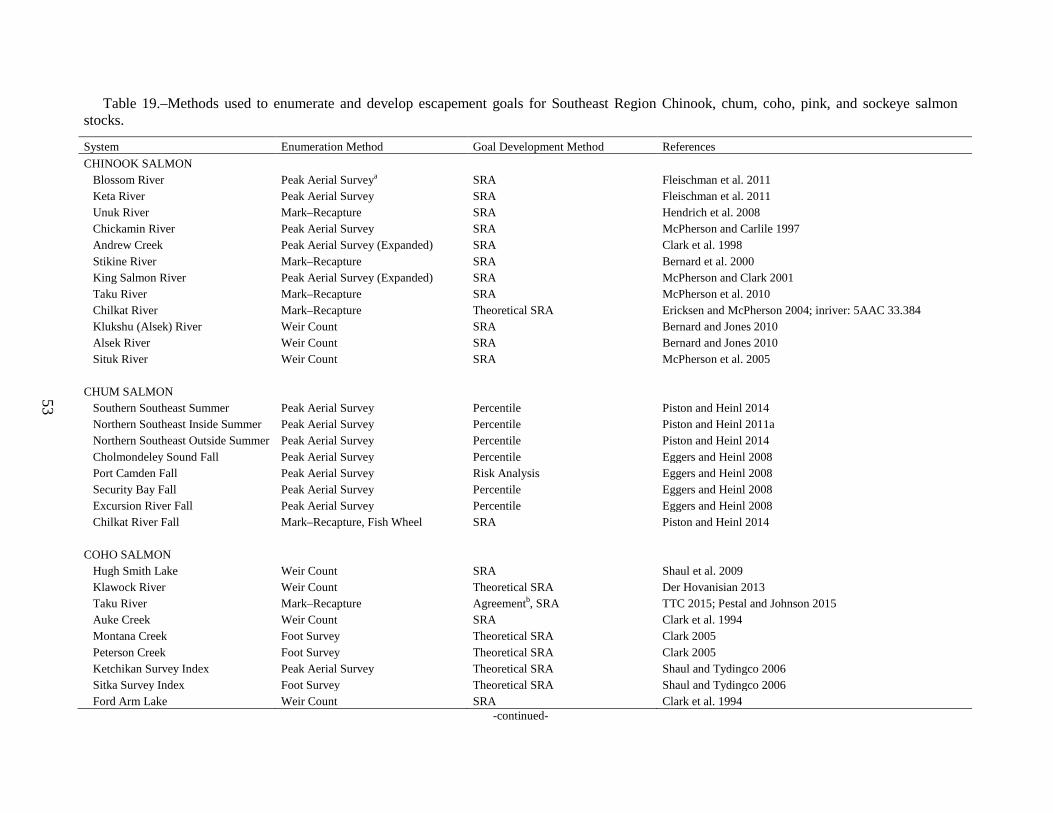
53
Table 19.–Methods used to enumerate and develop escapement goals for Southeast Region Chinook, chum, coho, pink, and sockeye salmon stocks.
System Enumeration Method Goal Development Method References CHINOOK SALMON
Blossom River Peak Aerial Surveya SRA Fleischman et al. 2011
Keta River Peak Aerial Survey SRA Fleischman et al. 2011
Unuk River Mark–Recapture SRA Hendrich et al. 2008
Chickamin River Peak Aerial Survey SRA McPherson and Carlile 1997
Andrew Creek Peak Aerial Survey (Expanded) SRA Clark et al. 1998
Stikine River Mark–Recapture SRA Bernard et al. 2000
King Salmon River Peak Aerial Survey (Expanded) SRA McPherson and Clark 2001
Taku River Mark–Recapture SRA McPherson et al. 2010
Chilkat River Mark–Recapture Theoretical SRA Ericksen and McPherson 2004; inriver: 5AAC 33.384 Klukshu (Alsek) River Weir Count SRA Bernard and Jones 2010 Alsek River Weir Count SRA Bernard and Jones 2010 Situk River Weir Count SRA McPherson et al. 2005
CHUM SALMON Southern Southeast Summer Peak Aerial Survey Percentile Piston and Heinl 2014
Northern Southeast Inside Summer Peak Aerial Survey Percentile Piston and Heinl 2011a Northern Southeast Outside Summer Peak Aerial Survey Percentile Piston and Heinl 2014 Cholmondeley Sound Fall Peak Aerial Survey Percentile Eggers and Heinl 2008
Port Camden Fall Peak Aerial Survey Risk Analysis Eggers and Heinl 2008
Security Bay Fall Peak Aerial Survey Percentile Eggers and Heinl 2008
Excursion River Fall Peak Aerial Survey Percentile Eggers and Heinl 2008
Chilkat River Fall Mark–Recapture, Fish Wheel SRA Piston and Heinl 2014
COHO SALMON Hugh Smith Lake Weir Count SRA Shaul et al. 2009
Klawock River Weir Count Theoretical SRA Der Hovanisian 2013 Taku River Mark–Recapture Agreementb, SRA TTC 2015; Pestal and Johnson 2015 Auke Creek Weir Count SRA Clark et al. 1994
Montana Creek Foot Survey Theoretical SRA Clark 2005
Peterson Creek Foot Survey Theoretical SRA Clark 2005
Ketchikan Survey Index Peak Aerial Survey Theoretical SRA Shaul and Tydingco 2006
Sitka Survey Index Foot Survey Theoretical SRA Shaul and Tydingco 2006
Ford Arm Lake Weir Count SRA Clark et al. 1994
-continued-
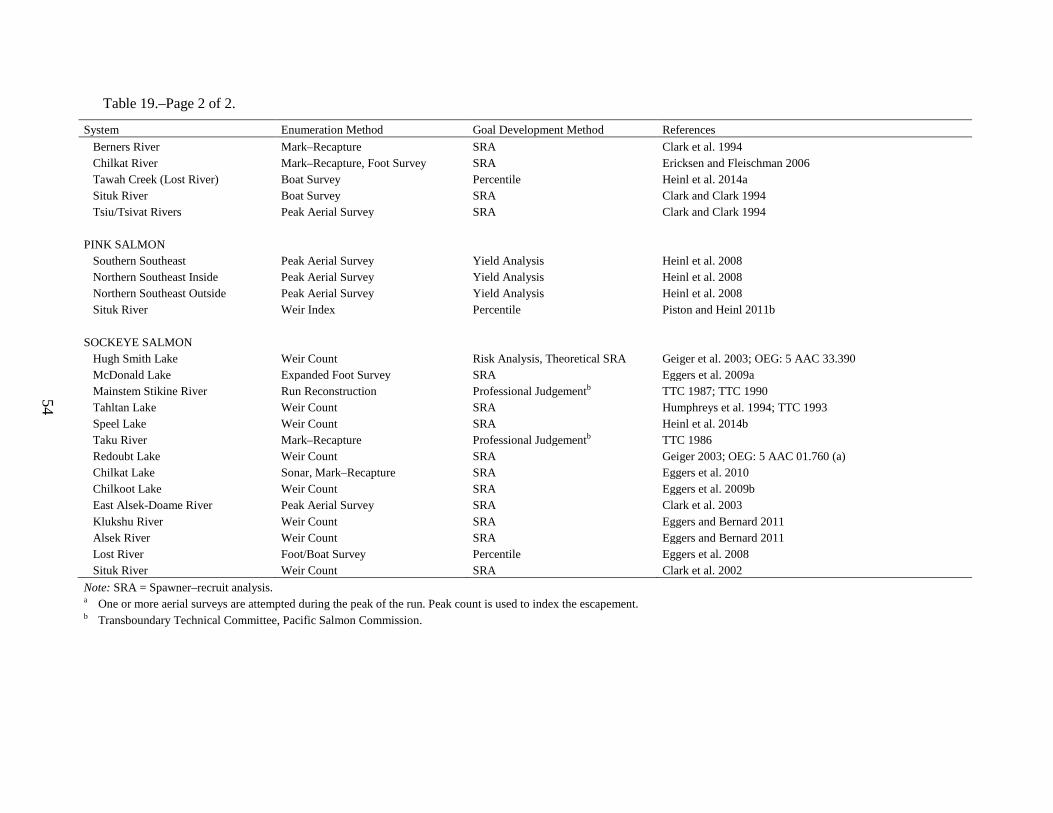
54
Table 19.–Page 2 of 2.
System Enumeration Method Goal Development Method References Berners River Mark–Recapture SRA Clark et al. 1994 Chilkat River Mark–Recapture, Foot Survey SRA Ericksen and Fleischman 2006
Tawah Creek (Lost River) Boat Survey Percentile Heinl et al. 2014a Situk River Boat Survey SRA Clark and Clark 1994
Tsiu/Tsivat Rivers Peak Aerial Survey SRA Clark and Clark 1994
PINK SALMON Southern Southeast Peak Aerial Survey Yield Analysis Heinl et al. 2008
Northern Southeast Inside Peak Aerial Survey Yield Analysis Heinl et al. 2008
Northern Southeast Outside Peak Aerial Survey Yield Analysis Heinl et al. 2008
Situk River Weir Index Percentile Piston and Heinl 2011b SOCKEYE SALMON
Hugh Smith Lake Weir Count Risk Analysis, Theoretical SRA Geiger et al. 2003; OEG: 5 AAC 33.390 McDonald Lake Expanded Foot Survey SRA Eggers et al. 2009a
Mainstem Stikine River Run Reconstruction Professional Judgementb TTC 1987; TTC 1990 Tahltan Lake Weir Count SRA Humphreys et al. 1994; TTC 1993 Speel Lake Weir Count SRA Heinl et al. 2014b Taku River Mark–Recapture Professional Judgementb TTC 1986
Redoubt Lake Weir Count SRA Geiger 2003; OEG: 5 AAC 01.760 (a) Chilkat Lake Sonar, Mark–Recapture SRA Eggers et al. 2010
Chilkoot Lake Weir Count SRA Eggers et al. 2009b
East Alsek-Doame River Peak Aerial Survey SRA Clark et al. 2003
Klukshu River Weir Count SRA Eggers and Bernard 2011 Alsek River Weir Count SRA Eggers and Bernard 2011 Lost River Foot/Boat Survey Percentile Eggers et al. 2008
Situk River Weir Count SRA Clark et al. 2002
Note: SRA = Spawner–recruit analysis. a One or more aerial surveys are attempted during the peak of the run. Peak count is used to index the escapement. b Transboundary Technical Committee, Pacific Salmon Commission.
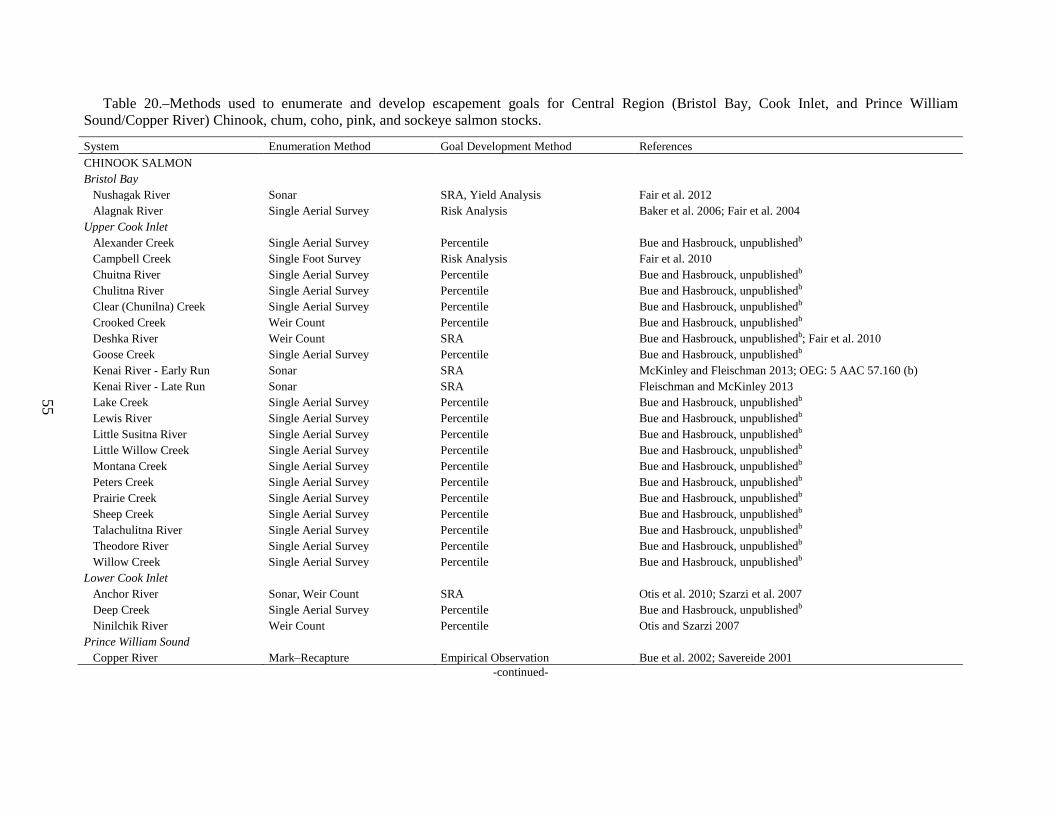
55
Table 20.–Methods used to enumerate and develop escapement goals for Central Region (Bristol Bay, Cook Inlet, and Prince William Sound/Copper River) Chinook, chum, coho, pink, and sockeye salmon stocks.
System Enumeration Method Goal Development Method References CHINOOK SALMON
Bristol Bay Nushagak River Sonar SRA, Yield Analysis Fair et al. 2012
Alagnak River Single Aerial Survey Risk Analysis Baker et al. 2006; Fair et al. 2004 Upper Cook Inlet
Alexander Creek Single Aerial Survey Percentile Bue and Hasbrouck, unpublishedb Campbell Creek Single Foot Survey Risk Analysis Fair et al. 2010
Chuitna River Single Aerial Survey Percentile Bue and Hasbrouck, unpublishedb Chulitna River Single Aerial Survey Percentile Bue and Hasbrouck, unpublishedb Clear (Chunilna) Creek Single Aerial Survey Percentile Bue and Hasbrouck, unpublishedb Crooked Creek Weir Count Percentile Bue and Hasbrouck, unpublishedb Deshka River Weir Count SRA Bue and Hasbrouck, unpublishedb; Fair et al. 2010 Goose Creek Single Aerial Survey Percentile Bue and Hasbrouck, unpublishedb Kenai River - Early Run Sonar SRA McKinley and Fleischman 2013; OEG: 5 AAC 57.160 (b) Kenai River - Late Run Sonar SRA Fleischman and McKinley 2013 Lake Creek Single Aerial Survey Percentile Bue and Hasbrouck, unpublishedb Lewis River Single Aerial Survey Percentile Bue and Hasbrouck, unpublishedb Little Susitna River Single Aerial Survey Percentile Bue and Hasbrouck, unpublishedb Little Willow Creek Single Aerial Survey Percentile Bue and Hasbrouck, unpublishedb Montana Creek Single Aerial Survey Percentile Bue and Hasbrouck, unpublishedb Peters Creek Single Aerial Survey Percentile Bue and Hasbrouck, unpublishedb Prairie Creek Single Aerial Survey Percentile Bue and Hasbrouck, unpublishedb Sheep Creek Single Aerial Survey Percentile Bue and Hasbrouck, unpublishedb Talachulitna River Single Aerial Survey Percentile Bue and Hasbrouck, unpublishedb Theodore River Single Aerial Survey Percentile Bue and Hasbrouck, unpublishedb Willow Creek Single Aerial Survey Percentile Bue and Hasbrouck, unpublishedb
Lower Cook Inlet Anchor River Sonar, Weir Count SRA Otis et al. 2010; Szarzi et al. 2007
Deep Creek Single Aerial Survey Percentile Bue and Hasbrouck, unpublishedb Ninilchik River Weir Count Percentile Otis and Szarzi 2007
Prince William Sound Copper River Mark–Recapture Empirical Observation Bue et al. 2002; Savereide 2001
-continued-
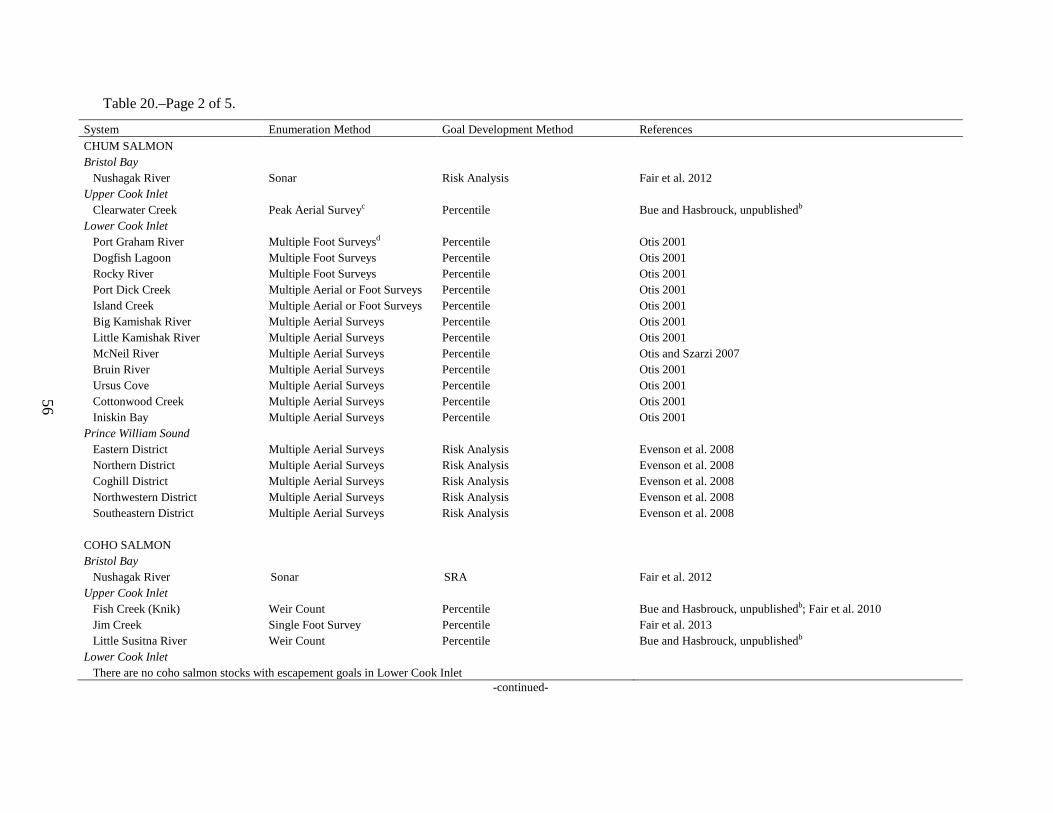
56
Table 20.–Page 2 of 5. System Enumeration Method Goal Development Method References CHUM SALMON
Bristol Bay Nushagak River Sonar Risk Analysis Fair et al. 2012
Upper Cook Inlet Clearwater Creek Peak Aerial Surveyc Percentile Bue and Hasbrouck, unpublishedb
Lower Cook Inlet Port Graham River Multiple Foot Surveysd Percentile Otis 2001
Dogfish Lagoon Multiple Foot Surveys Percentile Otis 2001
Rocky River Multiple Foot Surveys Percentile Otis 2001
Port Dick Creek Multiple Aerial or Foot Surveys Percentile Otis 2001
Island Creek Multiple Aerial or Foot Surveys Percentile Otis 2001
Big Kamishak River Multiple Aerial Surveys Percentile Otis 2001
Little Kamishak River Multiple Aerial Surveys Percentile Otis 2001
McNeil River Multiple Aerial Surveys Percentile Otis and Szarzi 2007 Bruin River Multiple Aerial Surveys Percentile Otis 2001 Ursus Cove Multiple Aerial Surveys Percentile Otis 2001
Cottonwood Creek Multiple Aerial Surveys Percentile Otis 2001
Iniskin Bay Multiple Aerial Surveys Percentile Otis 2001
Prince William Sound Eastern District Multiple Aerial Surveys Risk Analysis Evenson et al. 2008
Northern District Multiple Aerial Surveys Risk Analysis Evenson et al. 2008
Coghill District Multiple Aerial Surveys Risk Analysis Evenson et al. 2008
Northwestern District Multiple Aerial Surveys Risk Analysis Evenson et al. 2008
Southeastern District Multiple Aerial Surveys Risk Analysis Evenson et al. 2008
COHO SALMON Bristol Bay Nushagak River Sonar SRA Fair et al. 2012
Upper Cook Inlet Fish Creek (Knik) Weir Count Percentile Bue and Hasbrouck, unpublishedb; Fair et al. 2010
Jim Creek Single Foot Survey Percentile Fair et al. 2013
Little Susitna River Weir Count Percentile Bue and Hasbrouck, unpublishedb Lower Cook Inlet
There are no coho salmon stocks with escapement goals in Lower Cook Inlet -continued-
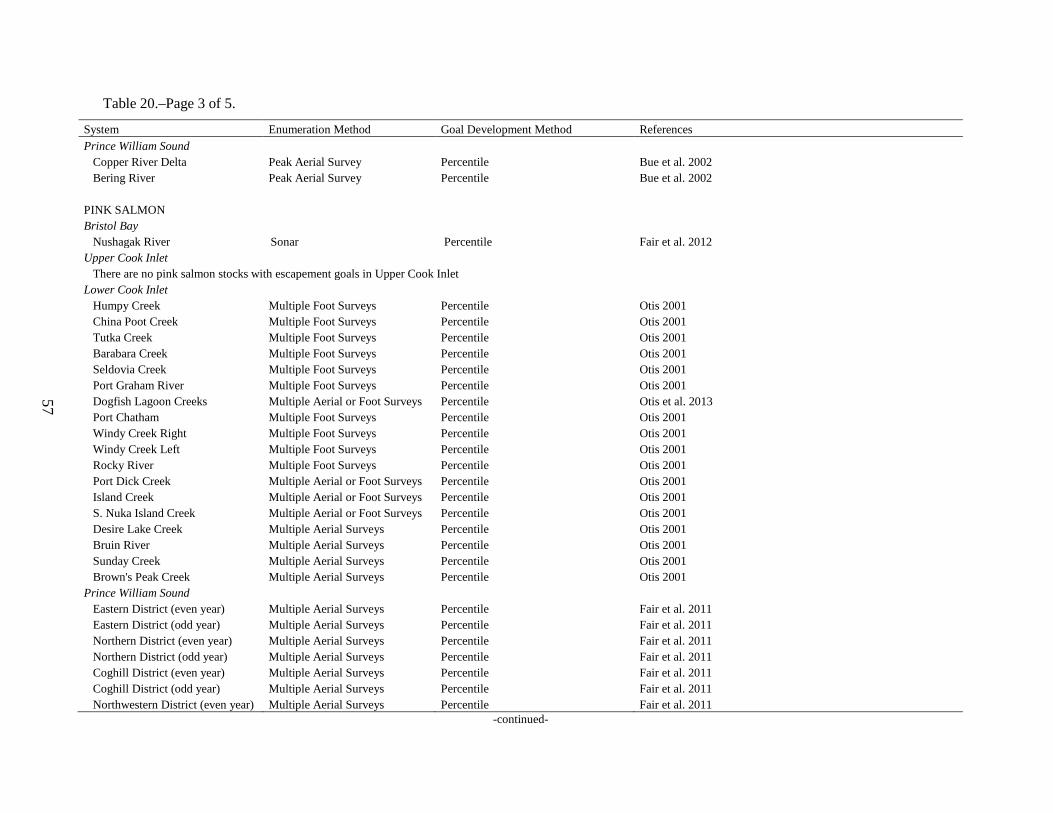
57
Table 20.–Page 3 of 5. System Enumeration Method Goal Development Method References Prince William Sound
Copper River Delta Peak Aerial Survey Percentile Bue et al. 2002
Bering River Peak Aerial Survey Percentile Bue et al. 2002
PINK SALMON Bristol Bay Nushagak River Sonar Percentile Fair et al. 2012
Upper Cook Inlet There are no pink salmon stocks with escapement goals in Upper Cook Inlet
Lower Cook Inlet Humpy Creek Multiple Foot Surveys Percentile Otis 2001
China Poot Creek Multiple Foot Surveys Percentile Otis 2001
Tutka Creek Multiple Foot Surveys Percentile Otis 2001
Barabara Creek Multiple Foot Surveys Percentile Otis 2001
Seldovia Creek Multiple Foot Surveys Percentile Otis 2001
Port Graham River Multiple Foot Surveys Percentile Otis 2001
Dogfish Lagoon Creeks Multiple Aerial or Foot Surveys Percentile Otis et al. 2013 Port Chatham Multiple Foot Surveys Percentile Otis 2001
Windy Creek Right Multiple Foot Surveys Percentile Otis 2001
Windy Creek Left Multiple Foot Surveys Percentile Otis 2001
Rocky River Multiple Foot Surveys Percentile Otis 2001
Port Dick Creek Multiple Aerial or Foot Surveys Percentile Otis 2001
Island Creek Multiple Aerial or Foot Surveys Percentile Otis 2001
S. Nuka Island Creek Multiple Aerial or Foot Surveys Percentile Otis 2001
Desire Lake Creek Multiple Aerial Surveys Percentile Otis 2001
Bruin River Multiple Aerial Surveys Percentile Otis 2001
Sunday Creek Multiple Aerial Surveys Percentile Otis 2001
Brown's Peak Creek Multiple Aerial Surveys Percentile Otis 2001
Prince William Sound Eastern District (even year) Multiple Aerial Surveys Percentile Fair et al. 2011
Eastern District (odd year) Multiple Aerial Surveys Percentile Fair et al. 2011 Northern District (even year) Multiple Aerial Surveys Percentile Fair et al. 2011 Northern District (odd year) Multiple Aerial Surveys Percentile Fair et al. 2011 Coghill District (even year) Multiple Aerial Surveys Percentile Fair et al. 2011 Coghill District (odd year) Multiple Aerial Surveys Percentile Fair et al. 2011 Northwestern District (even year) Multiple Aerial Surveys Percentile Fair et al. 2011
-continued-
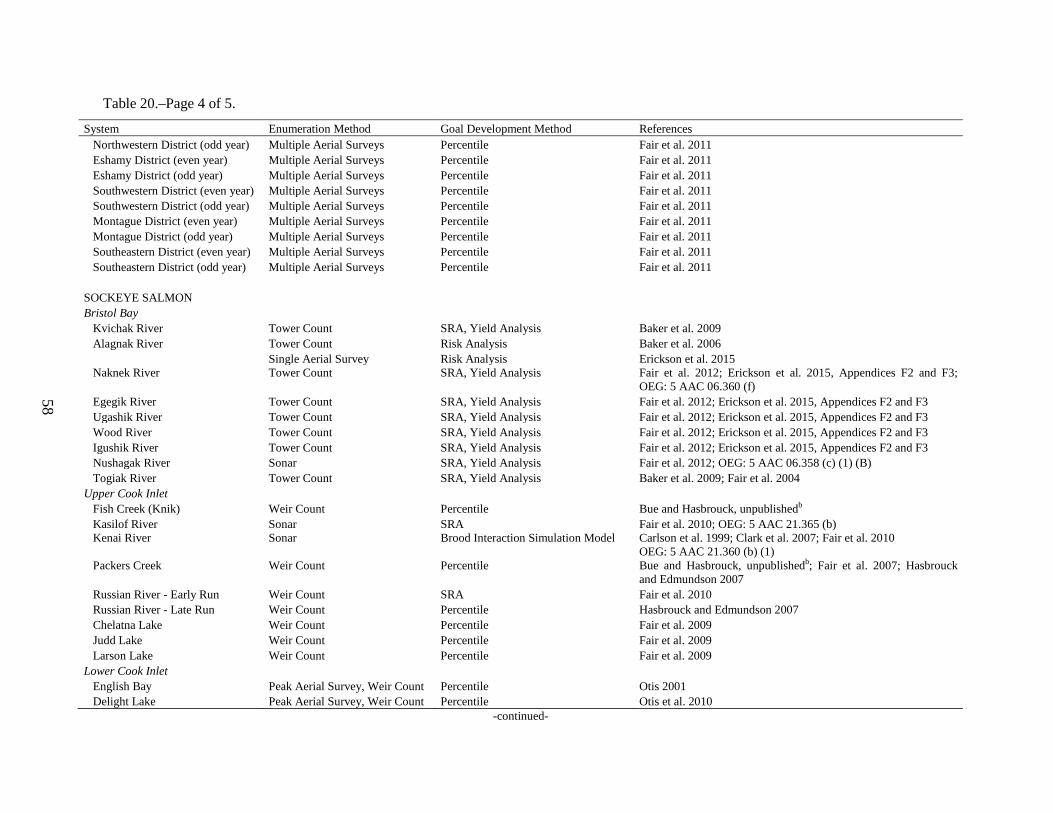
58
Table 20.–Page 4 of 5.
System Enumeration Method Goal Development Method References Northwestern District (odd year) Multiple Aerial Surveys Percentile Fair et al. 2011 Eshamy District (even year) Multiple Aerial Surveys Percentile Fair et al. 2011 Eshamy District (odd year) Multiple Aerial Surveys Percentile Fair et al. 2011 Southwestern District (even year) Multiple Aerial Surveys Percentile Fair et al. 2011 Southwestern District (odd year) Multiple Aerial Surveys Percentile Fair et al. 2011 Montague District (even year) Multiple Aerial Surveys Percentile Fair et al. 2011 Montague District (odd year) Multiple Aerial Surveys Percentile Fair et al. 2011 Southeastern District (even year) Multiple Aerial Surveys Percentile Fair et al. 2011 Southeastern District (odd year) Multiple Aerial Surveys Percentile Fair et al. 2011
SOCKEYE SALMON Bristol Bay Kvichak River Tower Count SRA, Yield Analysis Baker et al. 2009
Alagnak River Tower Count Risk Analysis Baker et al. 2006
Single Aerial Survey Risk Analysis Erickson et al. 2015 Naknek River Tower Count SRA, Yield Analysis Fair et al. 2012; Erickson et al. 2015, Appendices F2 and F3;
OEG: 5 AAC 06.360 (f) Egegik River Tower Count SRA, Yield Analysis Fair et al. 2012; Erickson et al. 2015, Appendices F2 and F3 Ugashik River Tower Count SRA, Yield Analysis Fair et al. 2012; Erickson et al. 2015, Appendices F2 and F3 Wood River Tower Count SRA, Yield Analysis Fair et al. 2012; Erickson et al. 2015, Appendices F2 and F3 Igushik River Tower Count SRA, Yield Analysis Fair et al. 2012; Erickson et al. 2015, Appendices F2 and F3 Nushagak River Sonar SRA, Yield Analysis Fair et al. 2012; OEG: 5 AAC 06.358 (c) (1) (B) Togiak River Tower Count SRA, Yield Analysis Baker et al. 2009; Fair et al. 2004
Upper Cook Inlet Fish Creek (Knik) Weir Count Percentile Bue and Hasbrouck, unpublishedb
Kasilof River Sonar SRA Fair et al. 2010; OEG: 5 AAC 21.365 (b) Kenai River Sonar Brood Interaction Simulation Model Carlson et al. 1999; Clark et al. 2007; Fair et al. 2010
OEG: 5 AAC 21.360 (b) (1) Packers Creek Weir Count Percentile Bue and Hasbrouck, unpublishedb; Fair et al. 2007; Hasbrouck
and Edmundson 2007 Russian River - Early Run Weir Count SRA Fair et al. 2010
Russian River - Late Run Weir Count Percentile Hasbrouck and Edmundson 2007
Chelatna Lake Weir Count Percentile Fair et al. 2009
Judd Lake Weir Count Percentile Fair et al. 2009
Larson Lake Weir Count Percentile Fair et al. 2009
Lower Cook Inlet English Bay Peak Aerial Survey, Weir Count Percentile Otis 2001 Delight Lake Peak Aerial Survey, Weir Count Percentile Otis et al. 2010
-continued-
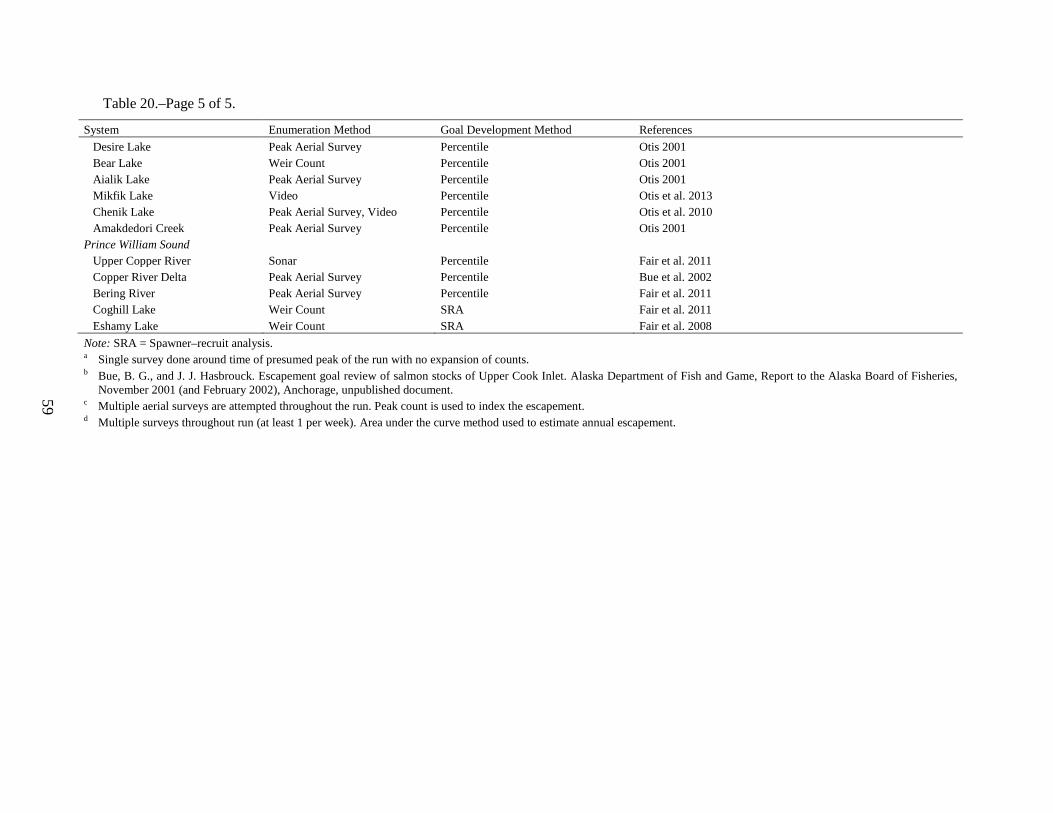
59
Table 20.–Page 5 of 5. System Enumeration Method Goal Development Method References
Desire Lake Peak Aerial Survey Percentile Otis 2001 Bear Lake Weir Count Percentile Otis 2001
Aialik Lake Peak Aerial Survey Percentile Otis 2001
Mikfik Lake Video Percentile Otis et al. 2013
Chenik Lake Peak Aerial Survey, Video Percentile Otis et al. 2010
Amakdedori Creek Peak Aerial Survey Percentile Otis 2001
Prince William Sound Upper Copper River Sonar Percentile Fair et al. 2011
Copper River Delta Peak Aerial Survey Percentile Bue et al. 2002
Bering River Peak Aerial Survey Percentile Fair et al. 2011 Coghill Lake Weir Count SRA Fair et al. 2011 Eshamy Lake Weir Count SRA Fair et al. 2008
Note: SRA = Spawner–recruit analysis. a Single survey done around time of presumed peak of the run with no expansion of counts. b Bue, B. G., and J. J. Hasbrouck. Escapement goal review of salmon stocks of Upper Cook Inlet. Alaska Department of Fish and Game, Report to the Alaska Board of Fisheries,
November 2001 (and February 2002), Anchorage, unpublished document. c Multiple aerial surveys are attempted throughout the run. Peak count is used to index the escapement. d Multiple surveys throughout run (at least 1 per week). Area under the curve method used to estimate annual escapement.
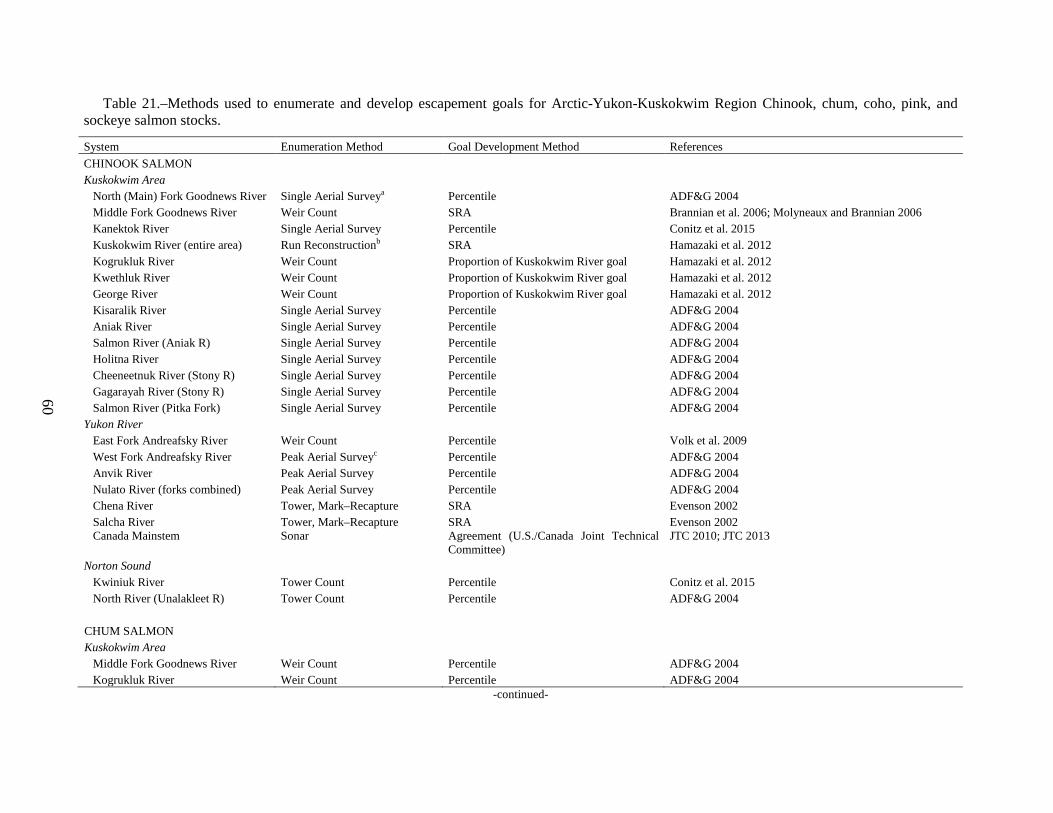
60
Table 21.–Methods used to enumerate and develop escapement goals for Arctic-Yukon-Kuskokwim Region Chinook, chum, coho, pink, and sockeye salmon stocks.
System Enumeration Method Goal Development Method References CHINOOK SALMON
Kuskokwim Area North (Main) Fork Goodnews River Single Aerial Surveya Percentile ADF&G 2004
Middle Fork Goodnews River Weir Count SRA Brannian et al. 2006; Molyneaux and Brannian 2006 Kanektok River Single Aerial Survey Percentile Conitz et al. 2015 Kuskokwim River (entire area) Run Reconstructionb SRA Hamazaki et al. 2012 Kogrukluk River Weir Count Proportion of Kuskokwim River goal Hamazaki et al. 2012 Kwethluk River Weir Count Proportion of Kuskokwim River goal Hamazaki et al. 2012 George River Weir Count Proportion of Kuskokwim River goal Hamazaki et al. 2012 Kisaralik River Single Aerial Survey Percentile ADF&G 2004
Aniak River Single Aerial Survey Percentile ADF&G 2004
Salmon River (Aniak R) Single Aerial Survey Percentile ADF&G 2004
Holitna River Single Aerial Survey Percentile ADF&G 2004
Cheeneetnuk River (Stony R) Single Aerial Survey Percentile ADF&G 2004
Gagarayah River (Stony R) Single Aerial Survey Percentile ADF&G 2004
Salmon River (Pitka Fork) Single Aerial Survey Percentile ADF&G 2004
Yukon River East Fork Andreafsky River Weir Count Percentile Volk et al. 2009
West Fork Andreafsky River Peak Aerial Surveyc Percentile ADF&G 2004
Anvik River Peak Aerial Survey Percentile ADF&G 2004
Nulato River (forks combined) Peak Aerial Survey Percentile ADF&G 2004
Chena River Tower, Mark–Recapture SRA Evenson 2002
Salcha River Tower, Mark–Recapture SRA Evenson 2002
Canada Mainstem Sonar Agreement (U.S./Canada Joint Technical Committee)
JTC 2010; JTC 2013
Norton Sound Kwiniuk River Tower Count Percentile Conitz et al. 2015
North River (Unalakleet R) Tower Count Percentile ADF&G 2004
CHUM SALMON Kuskokwim Area
Middle Fork Goodnews River Weir Count Percentile ADF&G 2004 Kogrukluk River Weir Count Percentile ADF&G 2004
-continued-
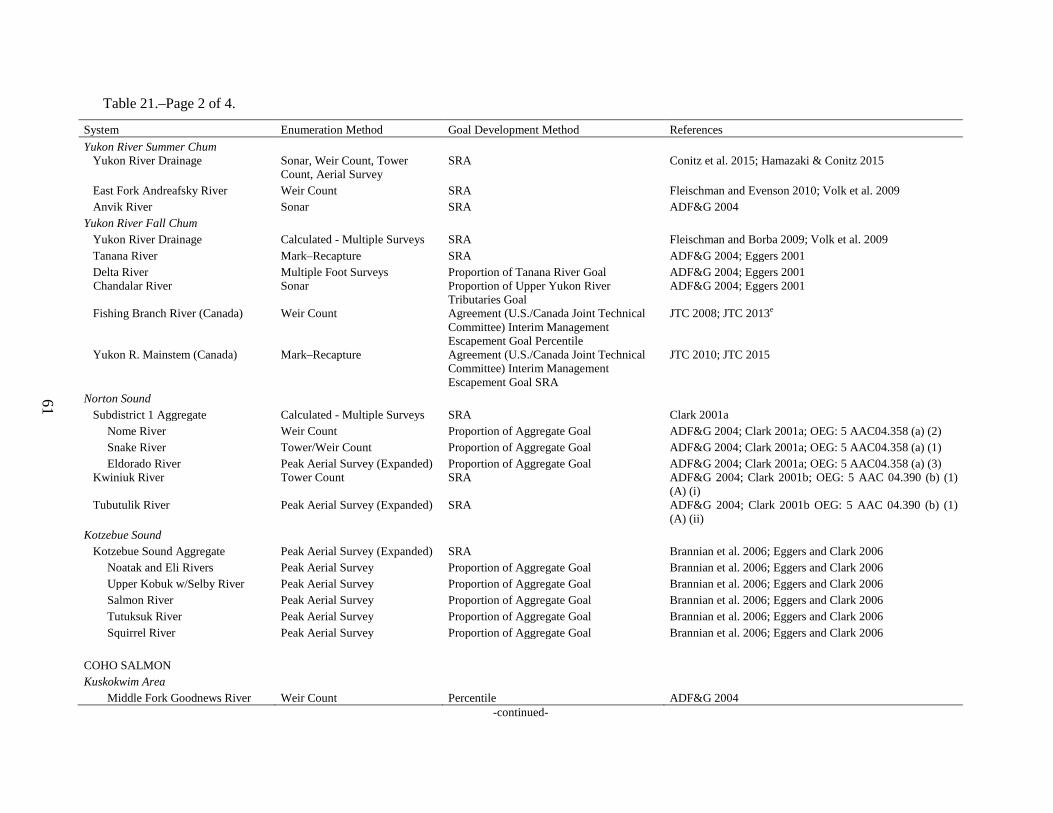
61
Table 21.–Page 2 of 4. System Enumeration Method Goal Development Method References Yukon River Summer Chum
Yukon River Drainage Sonar, Weir Count, Tower Count, Aerial Survey
SRA Conitz et al. 2015; Hamazaki & Conitz 2015
East Fork Andreafsky River Weir Count SRA Fleischman and Evenson 2010; Volk et al. 2009 Anvik River Sonar SRA ADF&G 2004
Yukon River Fall Chum Yukon River Drainage Calculated - Multiple Surveys SRA Fleischman and Borba 2009; Volk et al. 2009
Tanana River Mark–Recapture SRA ADF&G 2004; Eggers 2001 Delta River Multiple Foot Surveys Proportion of Tanana River Goal ADF&G 2004; Eggers 2001 Chandalar River Sonar Proportion of Upper Yukon River
Tributaries Goal ADF&G 2004; Eggers 2001
Fishing Branch River (Canada) Weir Count Agreement (U.S./Canada Joint Technical Committee) Interim Management Escapement Goal Percentile
JTC 2008; JTC 2013e
Yukon R. Mainstem (Canada) Mark–Recapture Agreement (U.S./Canada Joint Technical Committee) Interim Management Escapement Goal SRA
JTC 2010; JTC 2015
Norton Sound Subdistrict 1 Aggregate Calculated - Multiple Surveys SRA Clark 2001a
Nome River Weir Count Proportion of Aggregate Goal ADF&G 2004; Clark 2001a; OEG: 5 AAC04.358 (a) (2) Snake River Tower/Weir Count Proportion of Aggregate Goal ADF&G 2004; Clark 2001a; OEG: 5 AAC04.358 (a) (1) Eldorado River Peak Aerial Survey (Expanded) Proportion of Aggregate Goal ADF&G 2004; Clark 2001a; OEG: 5 AAC04.358 (a) (3)
Kwiniuk River Tower Count SRA ADF&G 2004; Clark 2001b; OEG: 5 AAC 04.390 (b) (1) (A) (i)
Tubutulik River Peak Aerial Survey (Expanded) SRA ADF&G 2004; Clark 2001b OEG: 5 AAC 04.390 (b) (1) (A) (ii)
Kotzebue Sound Kotzebue Sound Aggregate Peak Aerial Survey (Expanded) SRA Brannian et al. 2006; Eggers and Clark 2006
Noatak and Eli Rivers Peak Aerial Survey Proportion of Aggregate Goal Brannian et al. 2006; Eggers and Clark 2006 Upper Kobuk w/Selby River Peak Aerial Survey Proportion of Aggregate Goal Brannian et al. 2006; Eggers and Clark 2006 Salmon River Peak Aerial Survey Proportion of Aggregate Goal Brannian et al. 2006; Eggers and Clark 2006 Tutuksuk River Peak Aerial Survey Proportion of Aggregate Goal Brannian et al. 2006; Eggers and Clark 2006 Squirrel River Peak Aerial Survey Proportion of Aggregate Goal Brannian et al. 2006; Eggers and Clark 2006
COHO SALMON Kuskokwim Area
Middle Fork Goodnews River Weir Count Percentile ADF&G 2004 -continued-
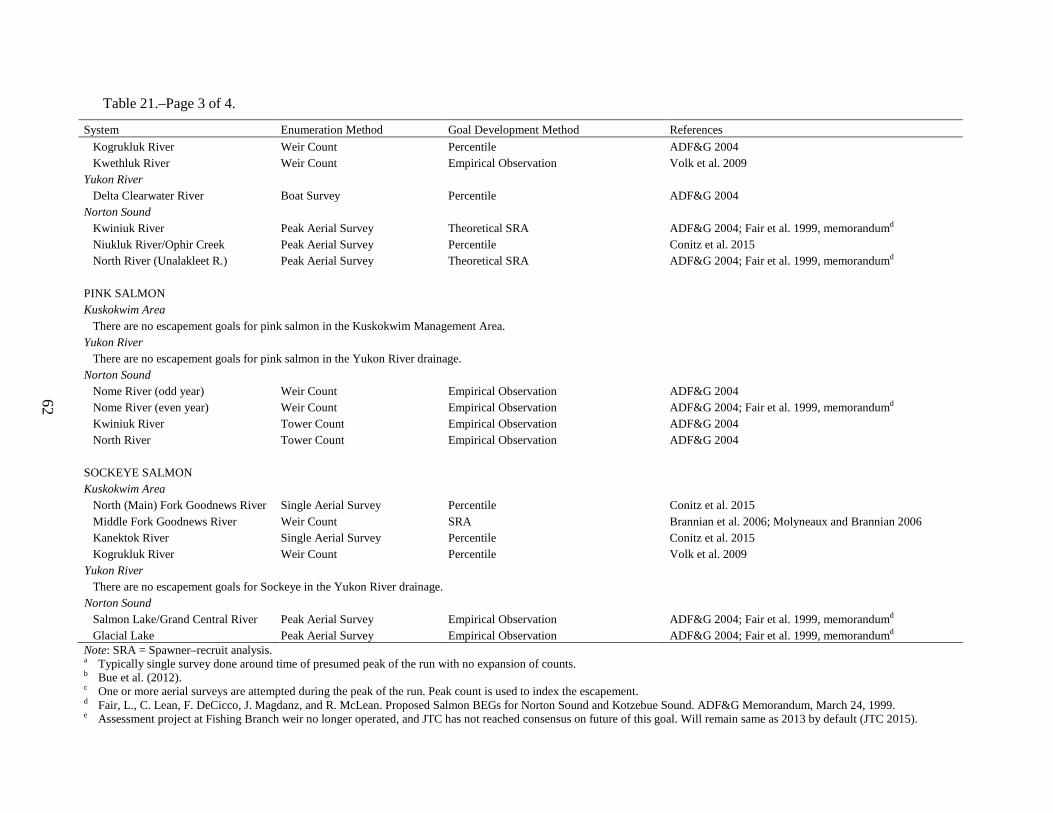
62
Table 21.–Page 3 of 4. System Enumeration Method Goal Development Method References
Kogrukluk River Weir Count Percentile ADF&G 2004
Kwethluk River Weir Count Empirical Observation Volk et al. 2009
Yukon River Delta Clearwater River Boat Survey Percentile ADF&G 2004
Norton Sound Kwiniuk River Peak Aerial Survey Theoretical SRA ADF&G 2004; Fair et al. 1999, memorandumd
Niukluk River/Ophir Creek Peak Aerial Survey Percentile Conitz et al. 2015 North River (Unalakleet R.) Peak Aerial Survey Theoretical SRA ADF&G 2004; Fair et al. 1999, memorandumd
PINK SALMON Kuskokwim Area There are no escapement goals for pink salmon in the Kuskokwim Management Area.
Yukon River There are no escapement goals for pink salmon in the Yukon River drainage.
Norton Sound Nome River (odd year) Weir Count Empirical Observation ADF&G 2004
Nome River (even year) Weir Count Empirical Observation ADF&G 2004; Fair et al. 1999, memorandumd Kwiniuk River Tower Count Empirical Observation ADF&G 2004
North River Tower Count Empirical Observation ADF&G 2004
SOCKEYE SALMON Kuskokwim Area North (Main) Fork Goodnews River Single Aerial Survey Percentile Conitz et al. 2015
Middle Fork Goodnews River Weir Count SRA Brannian et al. 2006; Molyneaux and Brannian 2006 Kanektok River Single Aerial Survey Percentile Conitz et al. 2015 Kogrukluk River Weir Count Percentile Volk et al. 2009
Yukon River There are no escapement goals for Sockeye in the Yukon River drainage.
Norton Sound Salmon Lake/Grand Central River Peak Aerial Survey Empirical Observation ADF&G 2004; Fair et al. 1999, memorandumd Glacial Lake Peak Aerial Survey Empirical Observation ADF&G 2004; Fair et al. 1999, memorandumd
Note: SRA = Spawner–recruit analysis. a Typically single survey done around time of presumed peak of the run with no expansion of counts. b Bue et al. (2012). c One or more aerial surveys are attempted during the peak of the run. Peak count is used to index the escapement. d Fair, L., C. Lean, F. DeCicco, J. Magdanz, and R. McLean. Proposed Salmon BEGs for Norton Sound and Kotzebue Sound. ADF&G Memorandum, March 24, 1999. e Assessment project at Fishing Branch weir no longer operated, and JTC has not reached consensus on future of this goal. Will remain same as 2013 by default (JTC 2015).
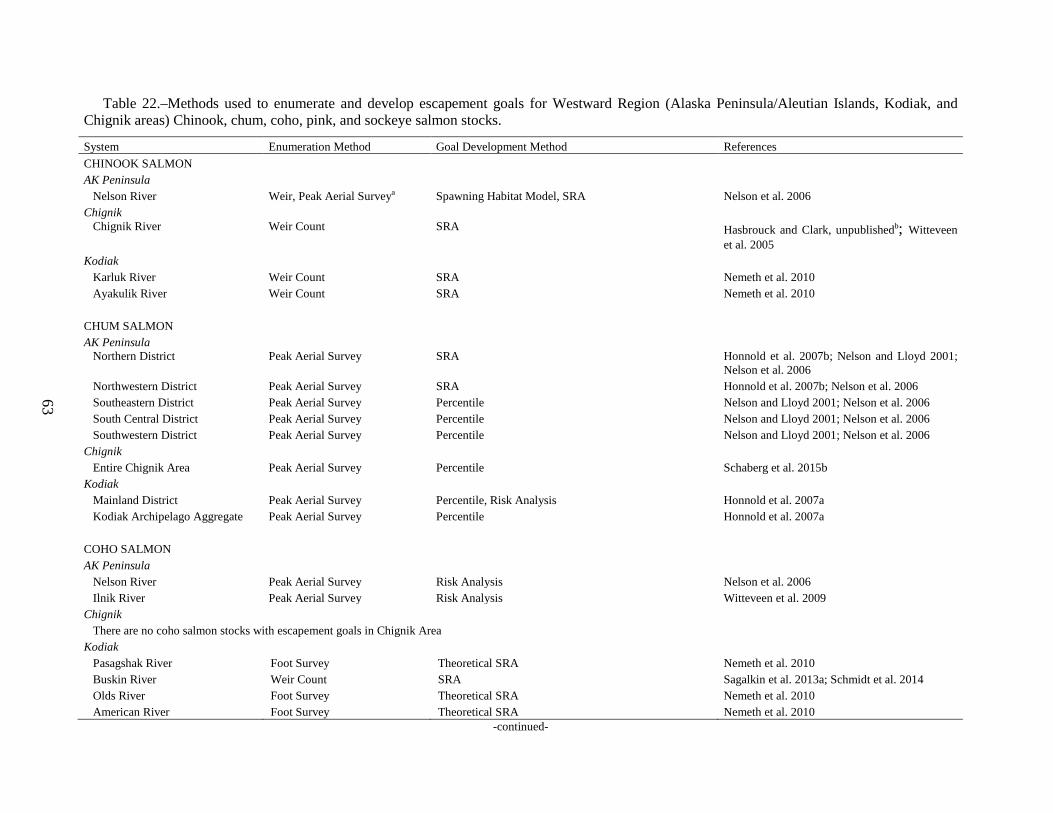
63
Table 22.–Methods used to enumerate and develop escapement goals for Westward Region (Alaska Peninsula/Aleutian Islands, Kodiak, and Chignik areas) Chinook, chum, coho, pink, and sockeye salmon stocks.
System Enumeration Method Goal Development Method References CHINOOK SALMON
AK Peninsula Nelson River Weir, Peak Aerial Surveya Spawning Habitat Model, SRA Nelson et al. 2006
Chignik Chignik River Weir Count SRA Hasbrouck and Clark, unpublishedb; Witteveen
et al. 2005 Kodiak
Karluk River Weir Count SRA Nemeth et al. 2010
Ayakulik River Weir Count SRA Nemeth et al. 2010
CHUM SALMON AK Peninsula Northern District Peak Aerial Survey SRA Honnold et al. 2007b; Nelson and Lloyd 2001;
Nelson et al. 2006 Northwestern District Peak Aerial Survey SRA Honnold et al. 2007b; Nelson et al. 2006 Southeastern District Peak Aerial Survey Percentile Nelson and Lloyd 2001; Nelson et al. 2006 South Central District Peak Aerial Survey Percentile Nelson and Lloyd 2001; Nelson et al. 2006 Southwestern District Peak Aerial Survey Percentile Nelson and Lloyd 2001; Nelson et al. 2006
Chignik Entire Chignik Area Peak Aerial Survey Percentile Schaberg et al. 2015b
Kodiak Mainland District Peak Aerial Survey Percentile, Risk Analysis Honnold et al. 2007a
Kodiak Archipelago Aggregate Peak Aerial Survey Percentile Honnold et al. 2007a
COHO SALMON AK Peninsula Nelson River Peak Aerial Survey Risk Analysis Nelson et al. 2006
Ilnik River Peak Aerial Survey Risk Analysis Witteveen et al. 2009
Chignik There are no coho salmon stocks with escapement goals in Chignik Area
Kodiak Pasagshak River Foot Survey Theoretical SRA Nemeth et al. 2010 Buskin River Weir Count SRA Sagalkin et al. 2013a; Schmidt et al. 2014 Olds River Foot Survey Theoretical SRA Nemeth et al. 2010 American River Foot Survey Theoretical SRA Nemeth et al. 2010
-continued-
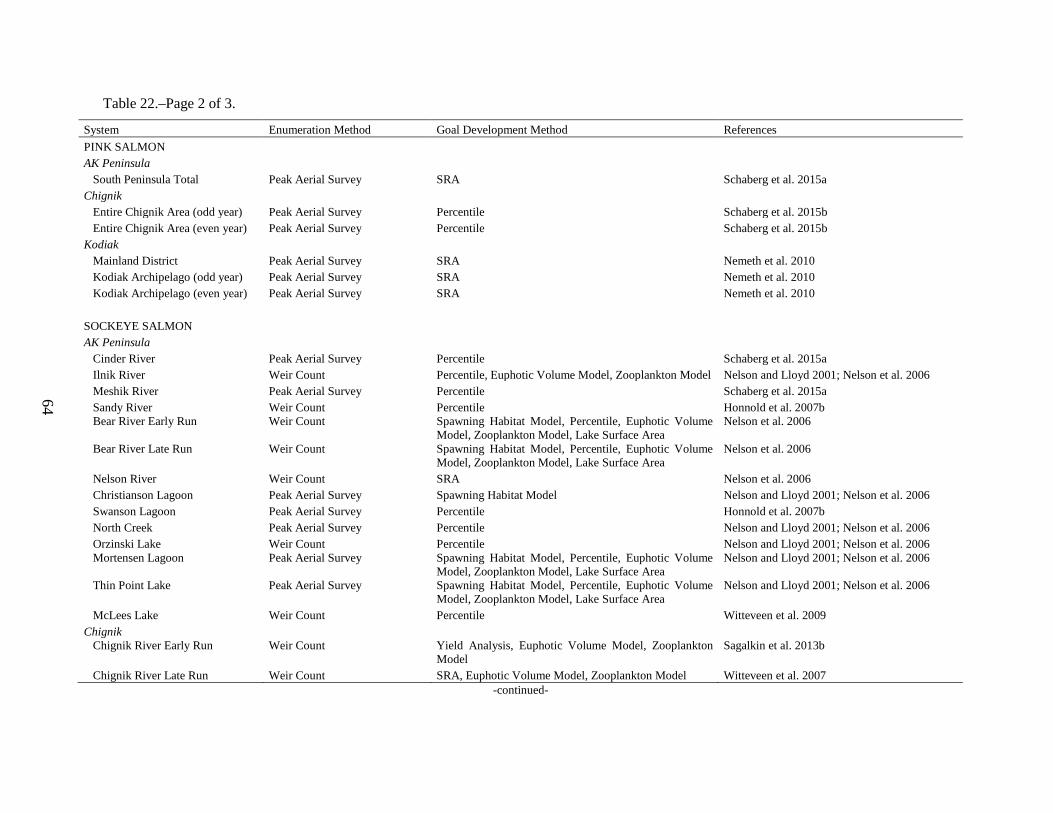
64
Table 22.–Page 2 of 3. System Enumeration Method Goal Development Method References PINK SALMON
AK Peninsula South Peninsula Total Peak Aerial Survey SRA Schaberg et al. 2015a
Chignik Entire Chignik Area (odd year) Peak Aerial Survey Percentile Schaberg et al. 2015b
Entire Chignik Area (even year) Peak Aerial Survey Percentile Schaberg et al. 2015b Kodiak
Mainland District Peak Aerial Survey SRA Nemeth et al. 2010
Kodiak Archipelago (odd year) Peak Aerial Survey SRA Nemeth et al. 2010
Kodiak Archipelago (even year) Peak Aerial Survey SRA Nemeth et al. 2010
SOCKEYE SALMON AK Peninsula Cinder River Peak Aerial Survey Percentile Schaberg et al. 2015a
Ilnik River Weir Count Percentile, Euphotic Volume Model, Zooplankton Model Nelson and Lloyd 2001; Nelson et al. 2006 Meshik River Peak Aerial Survey Percentile Schaberg et al. 2015a Sandy River Weir Count Percentile Honnold et al. 2007b
Bear River Early Run Weir Count Spawning Habitat Model, Percentile, Euphotic Volume Model, Zooplankton Model, Lake Surface Area
Nelson et al. 2006
Bear River Late Run Weir Count Spawning Habitat Model, Percentile, Euphotic Volume Model, Zooplankton Model, Lake Surface Area
Nelson et al. 2006
Nelson River Weir Count SRA Nelson et al. 2006
Christianson Lagoon Peak Aerial Survey Spawning Habitat Model Nelson and Lloyd 2001; Nelson et al. 2006 Swanson Lagoon Peak Aerial Survey Percentile Honnold et al. 2007b
North Creek Peak Aerial Survey Percentile Nelson and Lloyd 2001; Nelson et al. 2006 Orzinski Lake Weir Count Percentile Nelson and Lloyd 2001; Nelson et al. 2006 Mortensen Lagoon Peak Aerial Survey Spawning Habitat Model, Percentile, Euphotic Volume
Model, Zooplankton Model, Lake Surface Area Nelson and Lloyd 2001; Nelson et al. 2006
Thin Point Lake Peak Aerial Survey Spawning Habitat Model, Percentile, Euphotic Volume Model, Zooplankton Model, Lake Surface Area
Nelson and Lloyd 2001; Nelson et al. 2006
McLees Lake Weir Count Percentile Witteveen et al. 2009 Chignik
Chignik River Early Run Weir Count Yield Analysis, Euphotic Volume Model, Zooplankton Model
Sagalkin et al. 2013b
Chignik River Late Run Weir Count SRA, Euphotic Volume Model, Zooplankton Model Witteveen et al. 2007 -continued-
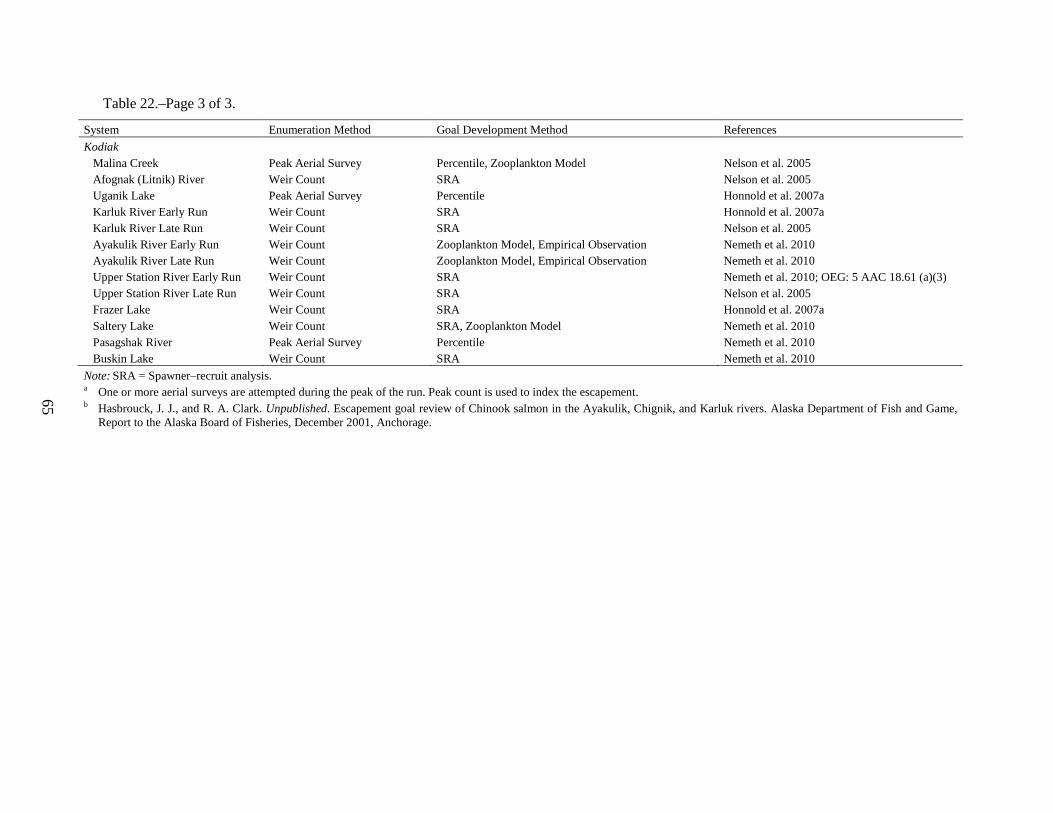
65
Table 22.–Page 3 of 3. System Enumeration Method Goal Development Method References Kodiak
Malina Creek Peak Aerial Survey Percentile, Zooplankton Model Nelson et al. 2005
Afognak (Litnik) River Weir Count SRA Nelson et al. 2005
Uganik Lake Peak Aerial Survey Percentile Honnold et al. 2007a
Karluk River Early Run Weir Count SRA Honnold et al. 2007a
Karluk River Late Run Weir Count SRA Nelson et al. 2005
Ayakulik River Early Run Weir Count Zooplankton Model, Empirical Observation Nemeth et al. 2010
Ayakulik River Late Run Weir Count Zooplankton Model, Empirical Observation Nemeth et al. 2010
Upper Station River Early Run Weir Count SRA Nemeth et al. 2010; OEG: 5 AAC 18.61 (a)(3) Upper Station River Late Run Weir Count SRA Nelson et al. 2005
Frazer Lake Weir Count SRA Honnold et al. 2007a
Saltery Lake Weir Count SRA, Zooplankton Model Nemeth et al. 2010
Pasagshak River Peak Aerial Survey Percentile Nemeth et al. 2010
Buskin Lake Weir Count SRA Nemeth et al. 2010
Note: SRA = Spawner–recruit analysis. a One or more aerial surveys are attempted during the peak of the run. Peak count is used to index the escapement. b Hasbrouck, J. J., and R. A. Clark. Unpublished. Escapement goal review of Chinook salmon in the Ayakulik, Chignik, and Karluk rivers. Alaska Department of Fish and Game,
Report to the Alaska Board of Fisheries, December 2001, Anchorage.

66

67
FIGURES
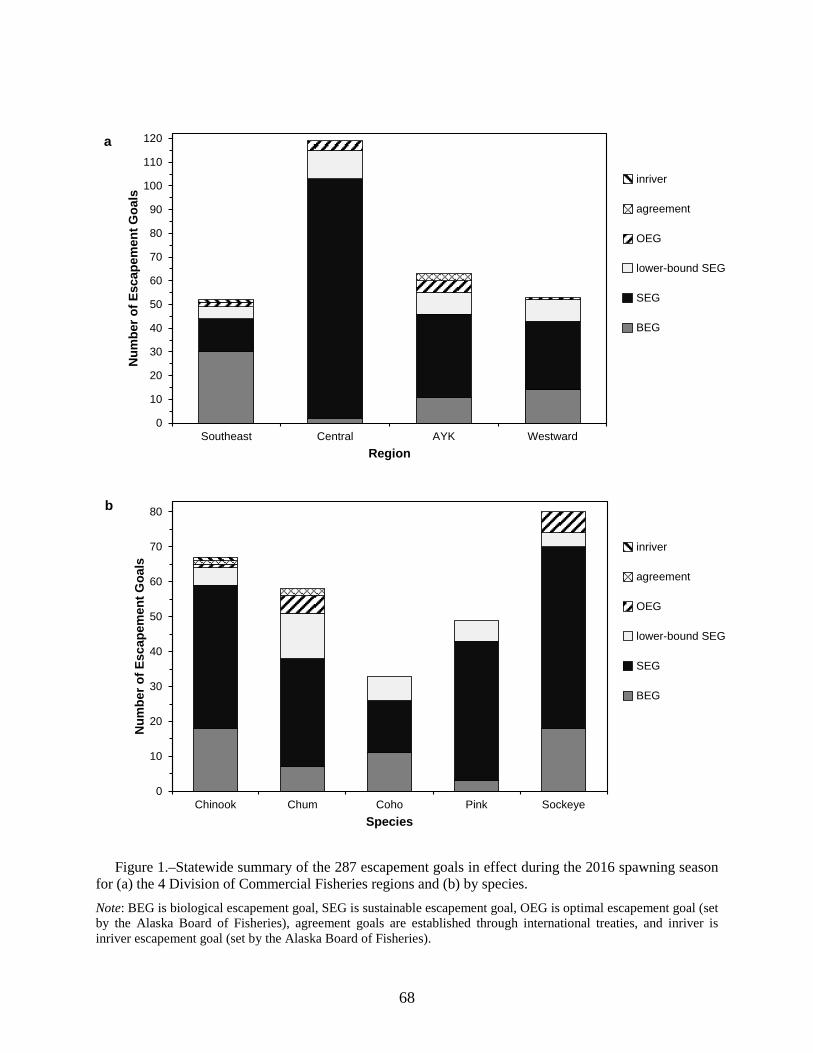
68
Figure 1.–Statewide summary of the 287 escapement goals in effect during the 2016 spawning season
for (a) the 4 Division of Commercial Fisheries regions and (b) by species. Note: BEG is biological escapement goal, SEG is sustainable escapement goal, OEG is optimal escapement goal (set by the Alaska Board of Fisheries), agreement goals are established through international treaties, and inriver is inriver escapement goal (set by the Alaska Board of Fisheries).
0
10
20
30
40
50
60
70
80
90
100
110
120
Southeast Central AYK Westward
Num
ber o
f Esc
apem
ent G
oals
Region
inriver
agreement
OEG
lower-bound SEG
SEG
BEG
a
0
10
20
30
40
50
60
70
80
Chinook Chum Coho Pink Sockeye
Num
ber o
f Esc
apem
ent G
oals
Species
inriver
agreement
OEG
lower-bound SEG
SEG
BEG
b
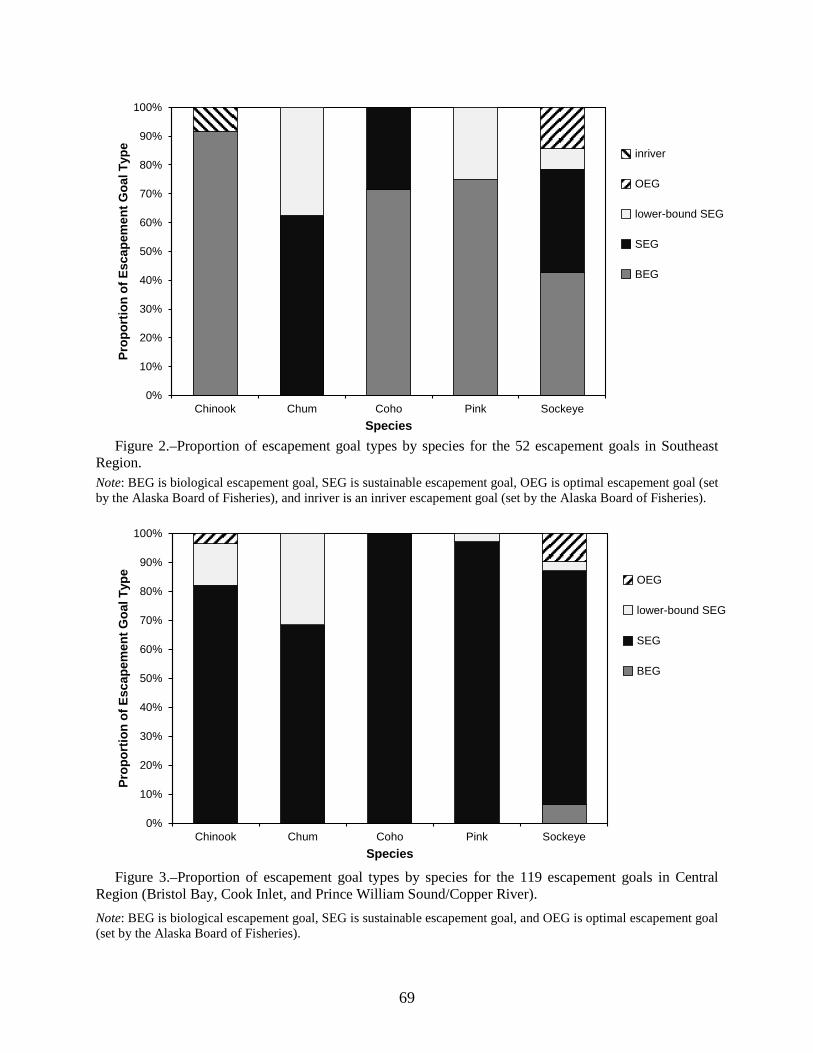
69
Figure 2.–Proportion of escapement goal types by species for the 52 escapement goals in Southeast
Region. Note: BEG is biological escapement goal, SEG is sustainable escapement goal, OEG is optimal escapement goal (set by the Alaska Board of Fisheries), and inriver is an inriver escapement goal (set by the Alaska Board of Fisheries).
Figure 3.–Proportion of escapement goal types by species for the 119 escapement goals in Central
Region (Bristol Bay, Cook Inlet, and Prince William Sound/Copper River). Note: BEG is biological escapement goal, SEG is sustainable escapement goal, and OEG is optimal escapement goal (set by the Alaska Board of Fisheries).
0%
10%
20%
30%
40%
50%
60%
70%
80%
90%
100%
Chinook Chum Coho Pink Sockeye
Prop
ortio
n of
Esc
apem
ent G
oal T
ype
Species
inriver
OEG
lower-bound SEG
SEG
BEG
0%
10%
20%
30%
40%
50%
60%
70%
80%
90%
100%
Chinook Chum Coho Pink Sockeye
Prop
ortio
n of
Esc
apem
ent G
oal T
ype
Species
OEG
lower-bound SEG
SEG
BEG
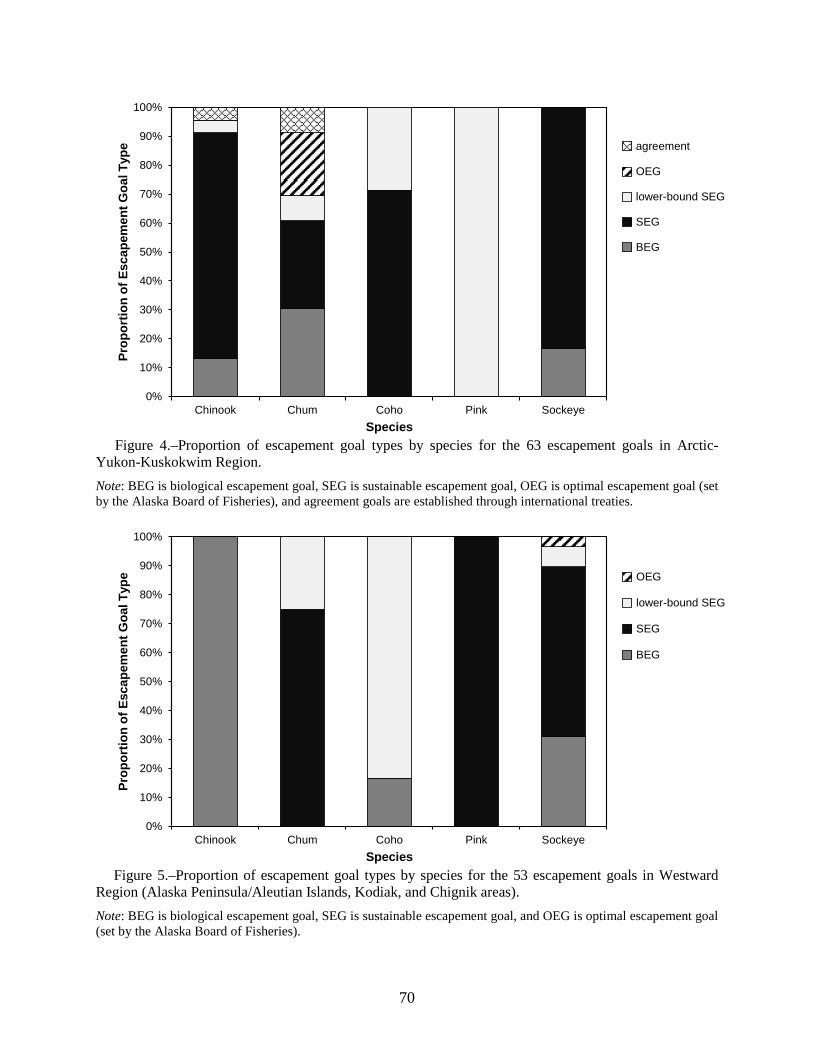
70
Figure 4.–Proportion of escapement goal types by species for the 63 escapement goals in Arctic-
Yukon-Kuskokwim Region. Note: BEG is biological escapement goal, SEG is sustainable escapement goal, OEG is optimal escapement goal (set by the Alaska Board of Fisheries), and agreement goals are established through international treaties.
Figure 5.–Proportion of escapement goal types by species for the 53 escapement goals in Westward
Region (Alaska Peninsula/Aleutian Islands, Kodiak, and Chignik areas). Note: BEG is biological escapement goal, SEG is sustainable escapement goal, and OEG is optimal escapement goal (set by the Alaska Board of Fisheries).
0%
10%
20%
30%
40%
50%
60%
70%
80%
90%
100%
Chinook Chum Coho Pink Sockeye
Prop
ortio
n of
Esc
apem
ent G
oal T
ype
Species
agreement
OEG
lower-bound SEG
SEG
BEG
0%
10%
20%
30%
40%
50%
60%
70%
80%
90%
100%
Chinook Chum Coho Pink Sockeye
Prop
ortio
n of
Esc
apem
ent G
oal T
ype
Species
OEG
lower-bound SEG
SEG
BEG
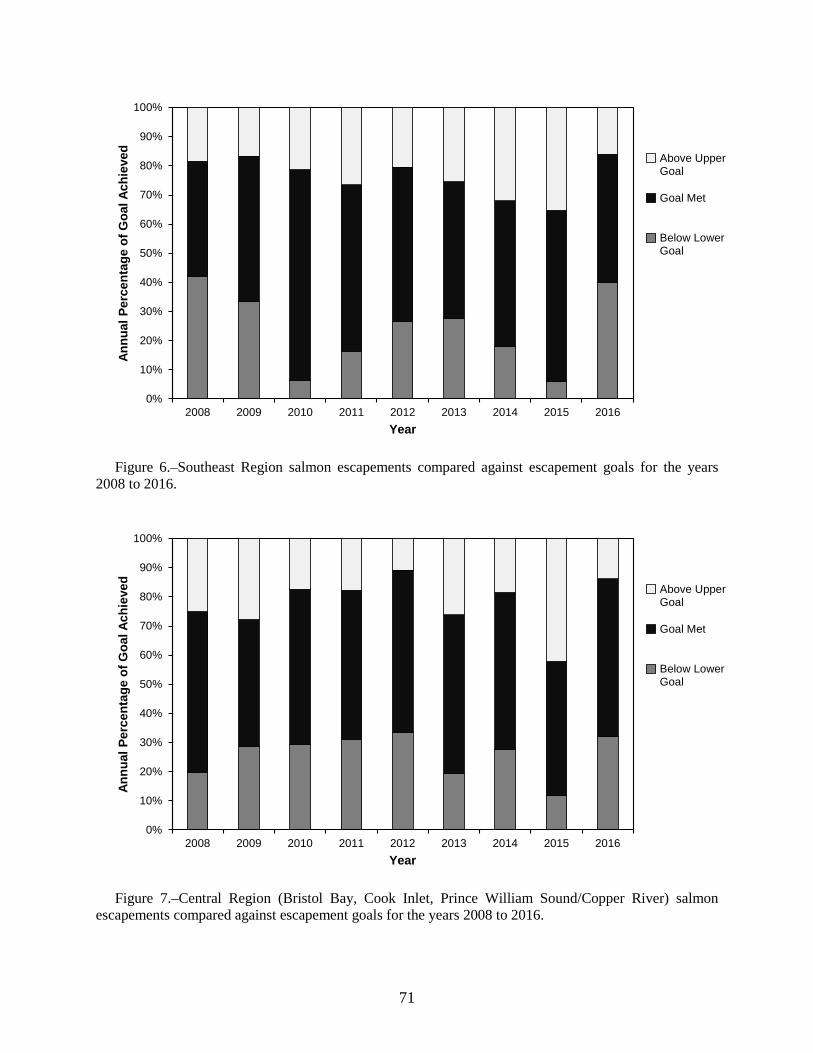
71
Figure 6.–Southeast Region salmon escapements compared against escapement goals for the years
2008 to 2016.
Figure 7.–Central Region (Bristol Bay, Cook Inlet, Prince William Sound/Copper River) salmon
escapements compared against escapement goals for the years 2008 to 2016.
0%
10%
20%
30%
40%
50%
60%
70%
80%
90%
100%
2008 2009 2010 2011 2012 2013 2014 2015 2016
Annu
al P
erce
ntag
e of
Goa
l Ach
ieve
d
Year
Above UpperGoal
Goal Met
Below LowerGoal
0%
10%
20%
30%
40%
50%
60%
70%
80%
90%
100%
2008 2009 2010 2011 2012 2013 2014 2015 2016
Annu
al P
erce
ntag
e of
Goa
l Ach
ieve
d
Year
Above UpperGoal
Goal Met
Below LowerGoal
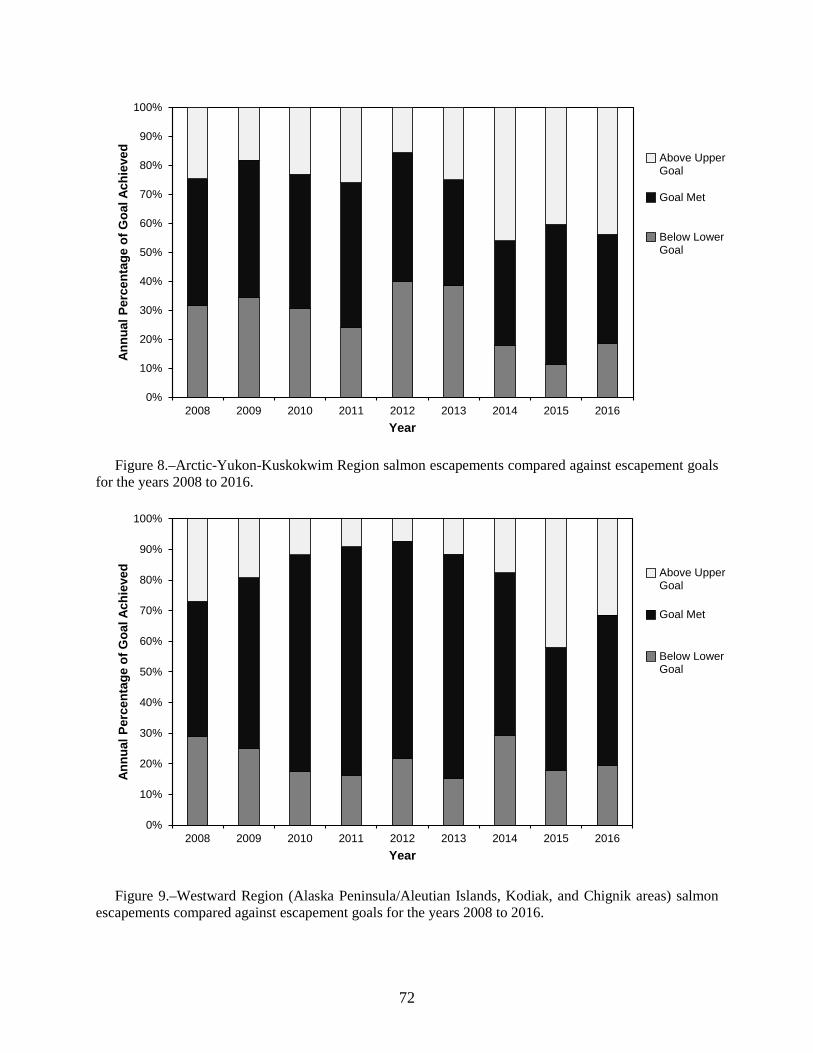
72
Figure 8.–Arctic-Yukon-Kuskokwim Region salmon escapements compared against escapement goals
for the years 2008 to 2016.
Figure 9.–Westward Region (Alaska Peninsula/Aleutian Islands, Kodiak, and Chignik areas) salmon
escapements compared against escapement goals for the years 2008 to 2016.
0%
10%
20%
30%
40%
50%
60%
70%
80%
90%
100%
2008 2009 2010 2011 2012 2013 2014 2015 2016
Annu
al P
erce
ntag
e of
Goa
l Ach
ieve
d
Year
Above UpperGoal
Goal Met
Below LowerGoal
0%
10%
20%
30%
40%
50%
60%
70%
80%
90%
100%
2008 2009 2010 2011 2012 2013 2014 2015 2016
Annu
al P
erce
ntag
e of
Goa
l Ach
ieve
d
Year
Above UpperGoal
Goal Met
Below LowerGoal
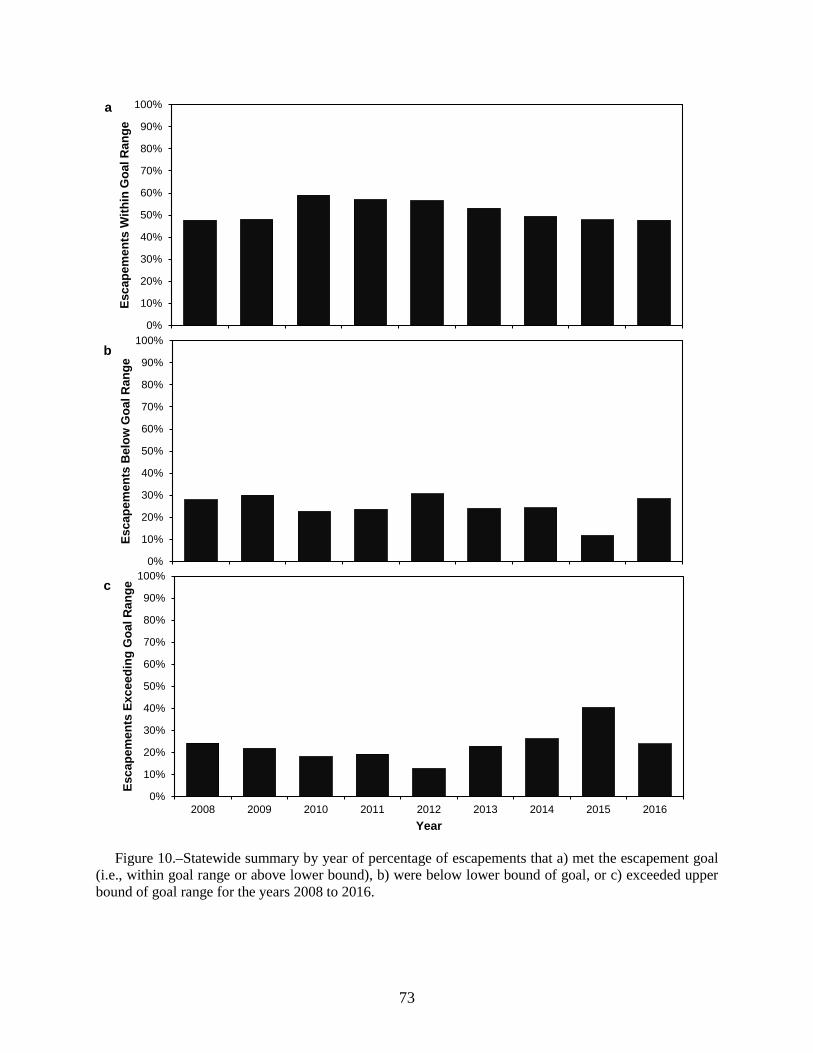
73
Figure 10.–Statewide summary by year of percentage of escapements that a) met the escapement goal
(i.e., within goal range or above lower bound), b) were below lower bound of goal, or c) exceeded upper bound of goal range for the years 2008 to 2016.
0%
10%
20%
30%
40%
50%
60%
70%
80%
90%
100%
2008 2009 2010 2011 2012 2013 2014 2015 2016
Esca
pem
ents
With
in G
oal R
ange
Year
0%
10%
20%
30%
40%
50%
60%
70%
80%
90%
100%
2008 2009 2010 2011 2012 2013 2014 2015 2016
Esca
pem
ents
Bel
ow G
oal R
ange
Year
0%
10%
20%
30%
40%
50%
60%
70%
80%
90%
100%
2008 2009 2010 2011 2012 2013 2014 2015 2016
Esca
pem
ents
Exc
eedi
ng G
oal R
ange
Year
a
c
b

74
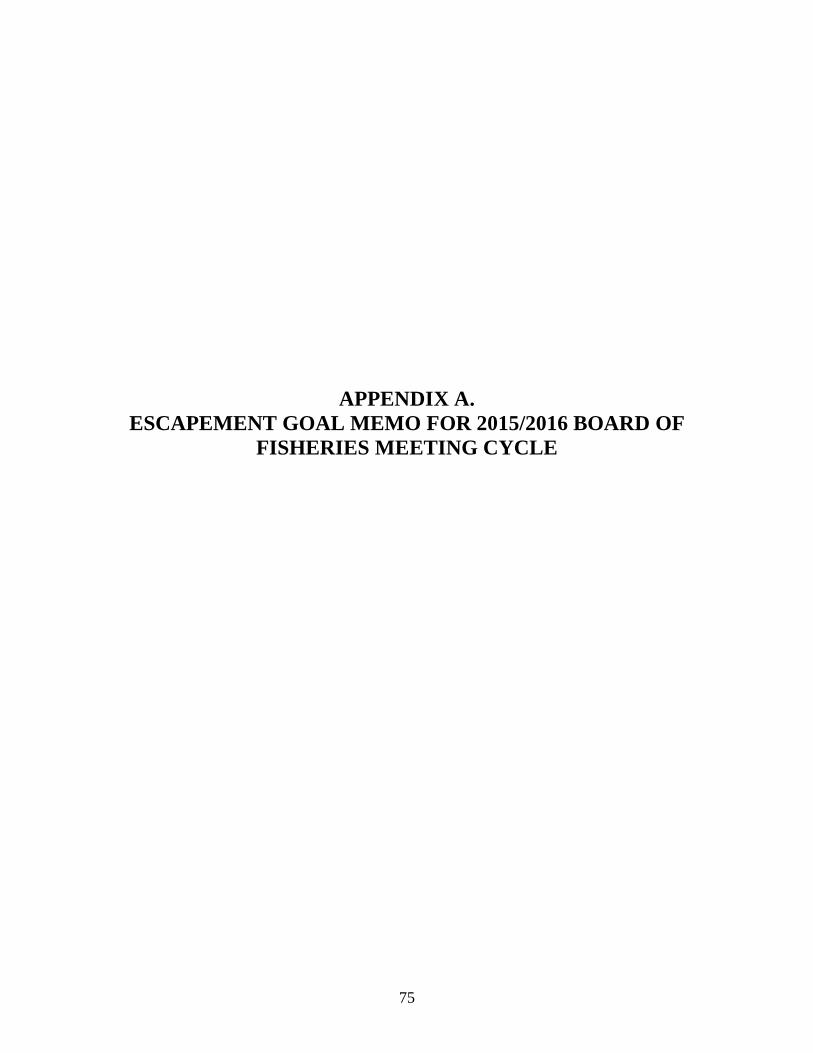
75
APPENDIX A.
ESCAPEMENT GOAL MEMO FOR 2015/2016 BOARD OF FISHERIES MEETING CYCLE
Recommended