The 7th GPM International Planning WorkshopBellesale
Kudan, Tokyo, Japan
Dec. 7 (Fri) 2007
Takuji Kubota (JAXA/EORC),
Ken’ichi
Okamoto (Osaka Pref. Univ.),
S. Shige, T. Ushio, T. Iguchi, N. Takahashi, K, Iwanami, K. Aonashi, M. Kachi, R. Oki, and collaborators
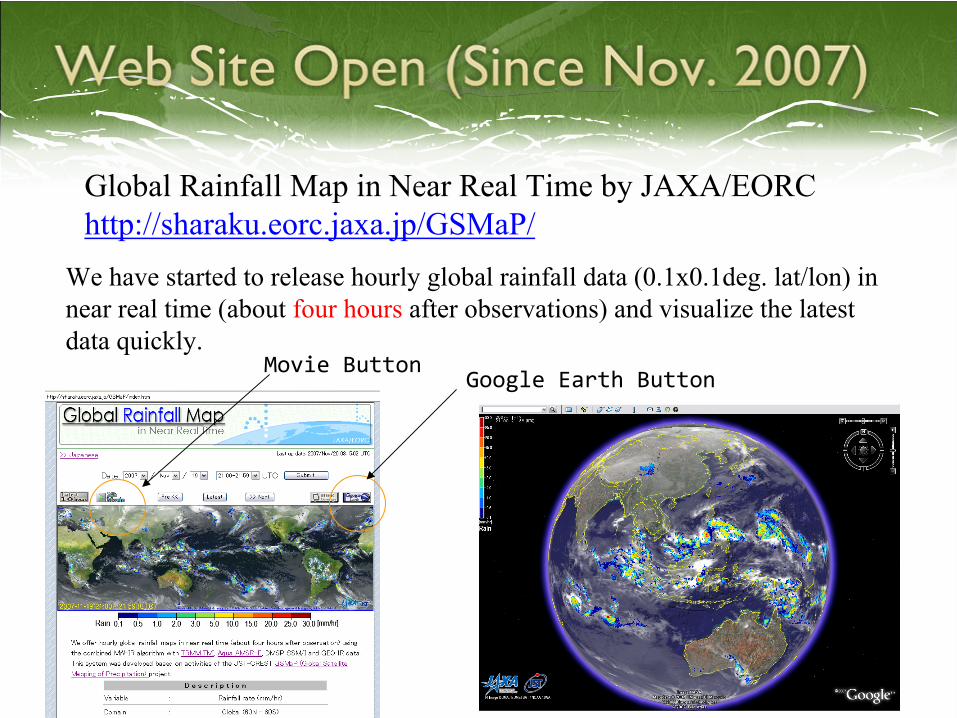
We have
started to release hourly global rainfall data (0.1x0.1deg. lat/lon) in near real time
(about four hours after observations) and visualize the latest
data quickly.
Global Rainfall Map in Near Real Time by JAXA/EORChttp://sharaku.eorc.jaxa.jp/GSMaP/
Movie ButtonGoogle Earth Button
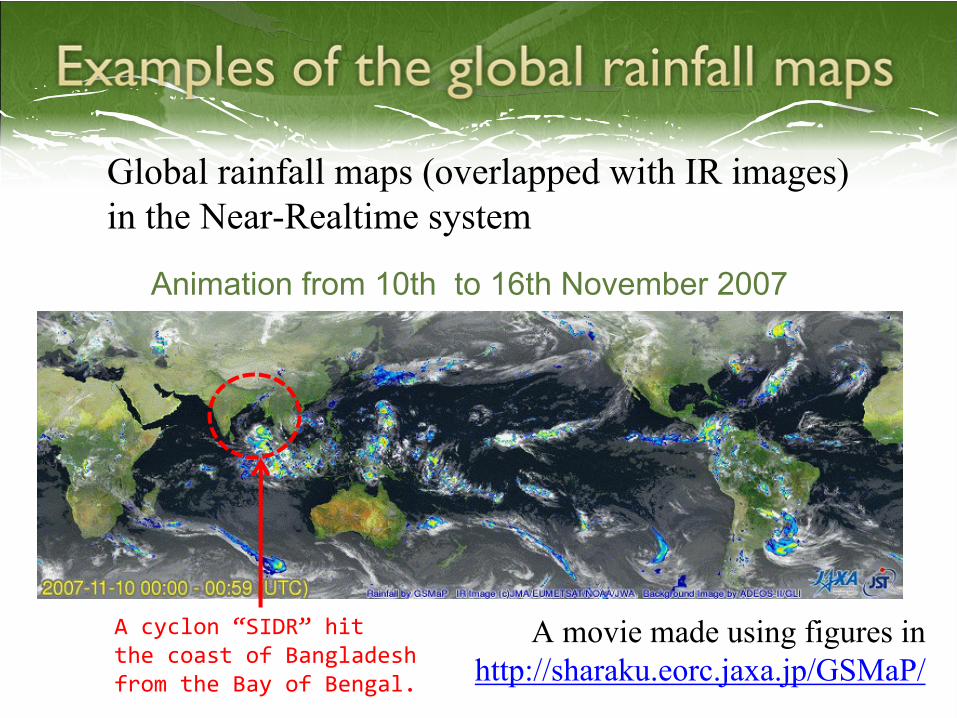
Animation from 10th to 16th November 2007
Global rainfall maps (overlapped with IR images) in the Near-Realtime
system
A movie made using figures inhttp://sharaku.eorc.jaxa.jp/GSMaP/
A cyclon
“SIDR”
hit
the coast of Bangladesh
from the Bay of Bengal.
The system was constructed using algorithms of the Global Satellite Mapping of Precipitation (GSMaP) project.Outline of the GSMaP project
A project sponsored by Japan Science and Technology Agency (JST)P. I. : Prof. K. Okamoto (Osaka Pref. Univ., Japan)Research activities from Nov. 2002 to Oct. 2007
The algorithms are mainly composed of Microwave radiometer (MWR) algorithm Blended MWR-IR algorithms
ftp
MWRIR
Rainfall retrieval from each MWR
sensor
decodingBlended MWR-IR algorithm
RTM Calculation
LUT for MWR
Global rainfall maps
Objective analysis
SST
ftp
X X + 4 hours
Atmospheric varibalesJMA Global analysis (GANAL)
JMA MGDSST
X + 3 hours
Public Server
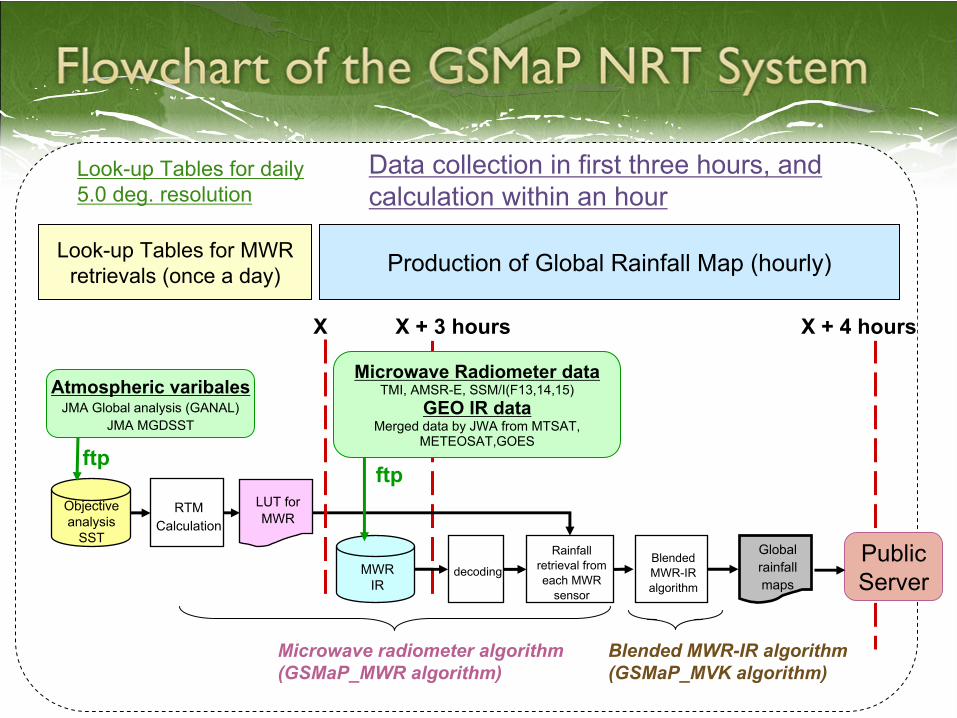
Look-up Tables for MWR retrievals (once a day) Production of Global Rainfall Map (hourly)
Data collection in first three hours, and calculation within an hour
Microwave radiometer algorithm(GSMaP_MWR
algorithm)
Microwave Radiometer dataTMI, AMSR-E, SSM/I(F13,14,15)
GEO IR dataMerged data by JWA from MTSAT,
METEOSAT,GOES
Blended MWR-IR algorithm (GSMaP_MVK
algorithm)
Look-up Tables for daily 5.0 deg. resolution
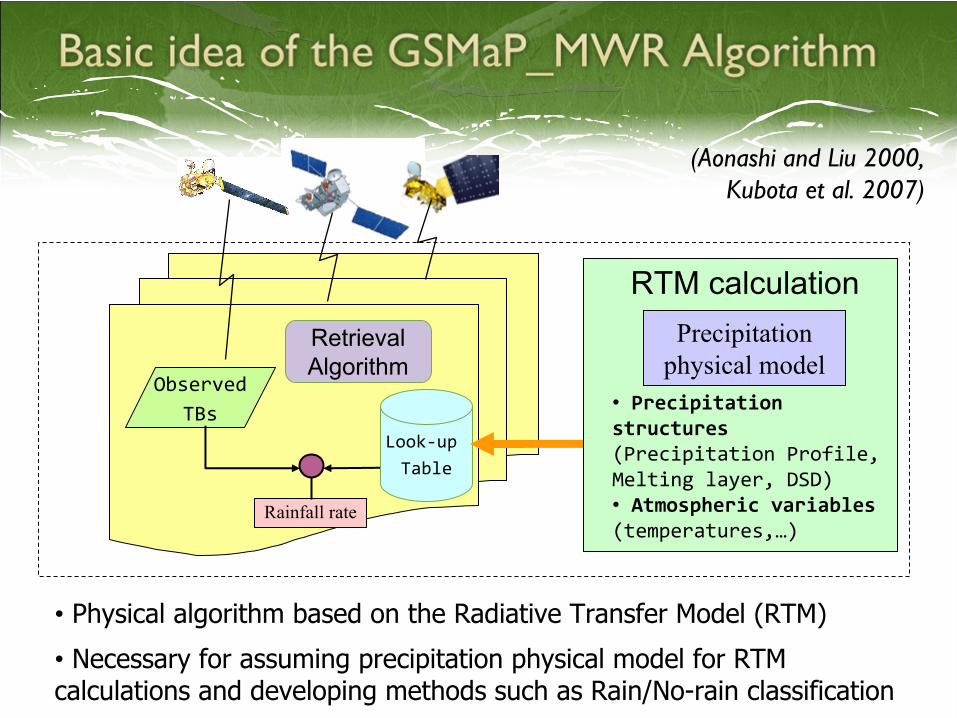
ObservedTBs
Rainfall rate
•
Precipitation
structures(Precipitation Profile,
Melting layer, DSD)•
Atmospheric variables
(temperatures,…)
Look‐up Table
RetrievalAlgorithm
• Physical algorithm based on the Radiative
Transfer Model (RTM)
•
Necessary for assuming precipitation physical model for RTM calculations and developing methods such as Rain/No-rain classification
Precipitation physical model
(Aonashi
and Liu 2000, Kubota et al. 2007)
RTM calculation
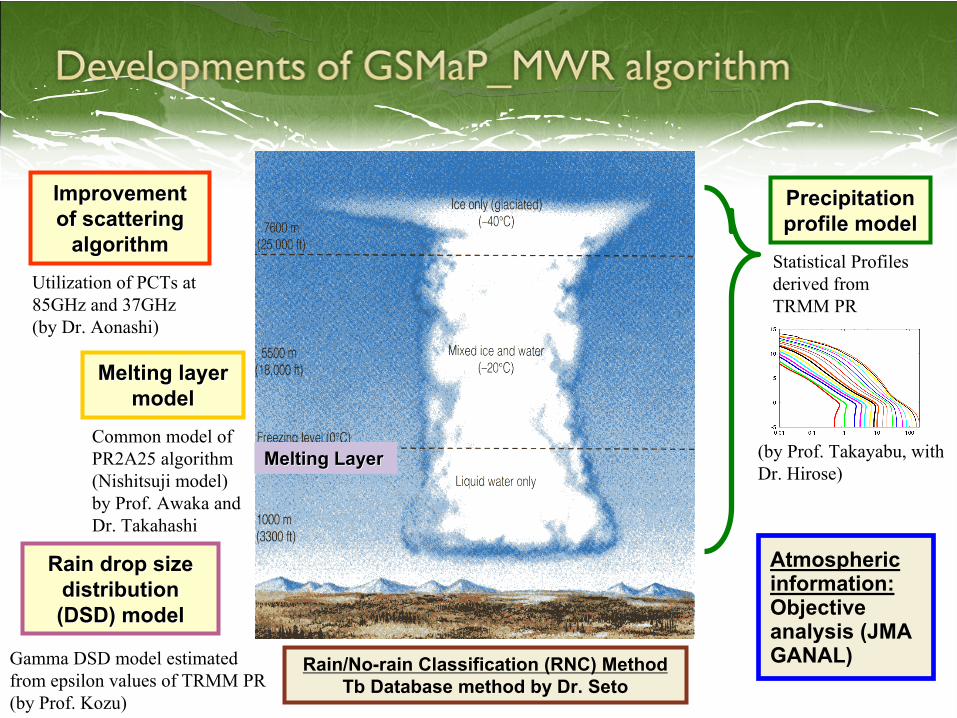
Atmospheric information:Objective analysis (JMA GANAL)Rain/No-rain Classification (RNC) Method
Tb Database method by Dr. Seto
Improvement Improvement of scattering of scattering
algorithmalgorithmUtilization of PCTs
at 85GHz and 37GHz(by Dr. Aonashi)
Melting LayerMelting Layer
Melting layer Melting layer modelmodel
Common model of PR2A25 algorithm (Nishitsuji
model)by Prof. Awaka
and Dr. Takahashi
Rain drop size Rain drop size distribution distribution (DSD) model(DSD) model
Gamma DSD model estimated from epsilon values of TRMM PR(by Prof. Kozu)
Precipitation Precipitation profile modelprofile model
Statistical Profiles derived from TRMM PR
(by Prof. Takayabu, with Dr. Hirose)
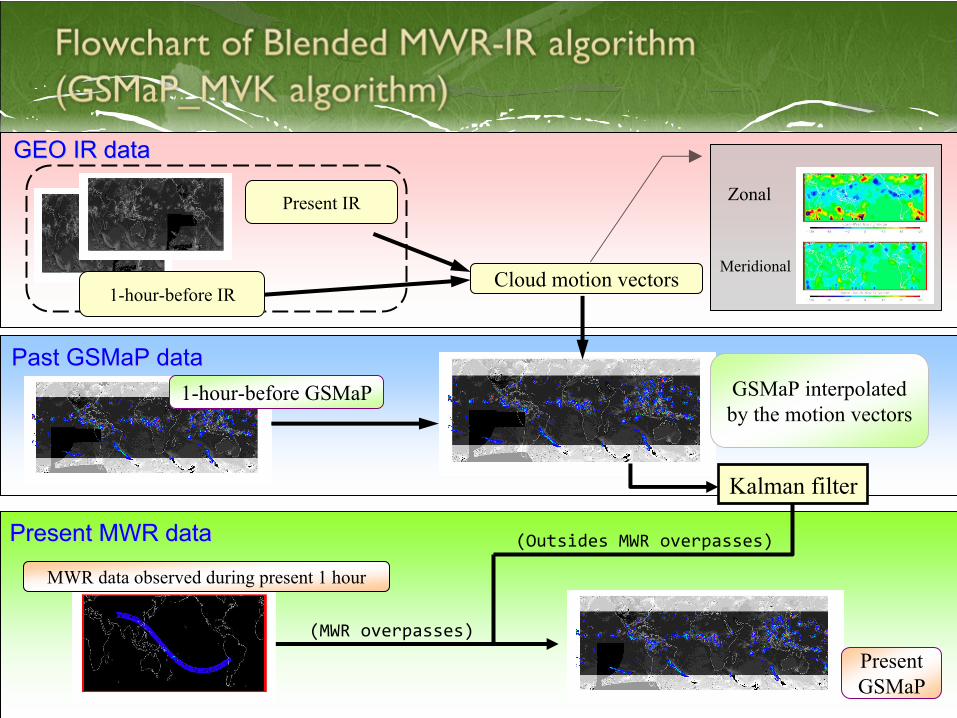
Present IR
GEO IR dataGEO IR data
Cloud motion vectors
Past GSMaP dataPast GSMaP data
MWR data observed during present 1 hour
Meridional
Zonal
Present MWR dataPresent MWR data
GSMaP interpolated by the motion vectors
Kalman
filter
1-hour-before IR
1-hour-before GSMaP
PresentGSMaP
(MWR overpasses)
(Outsides MWR overpasses)
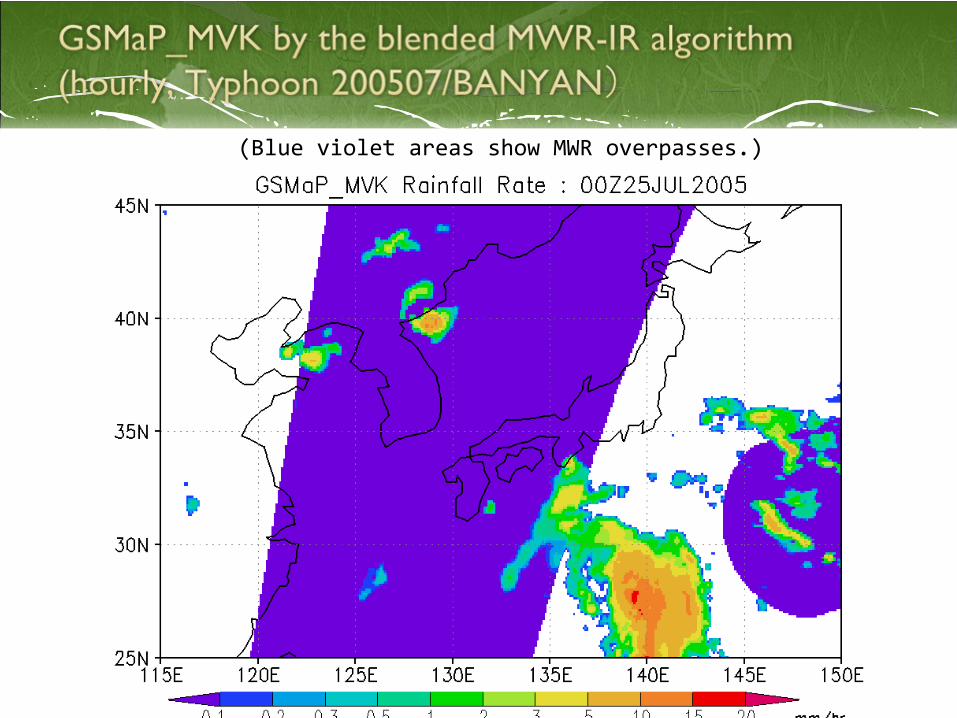
(Blue violet areas show MWR overpasses.)
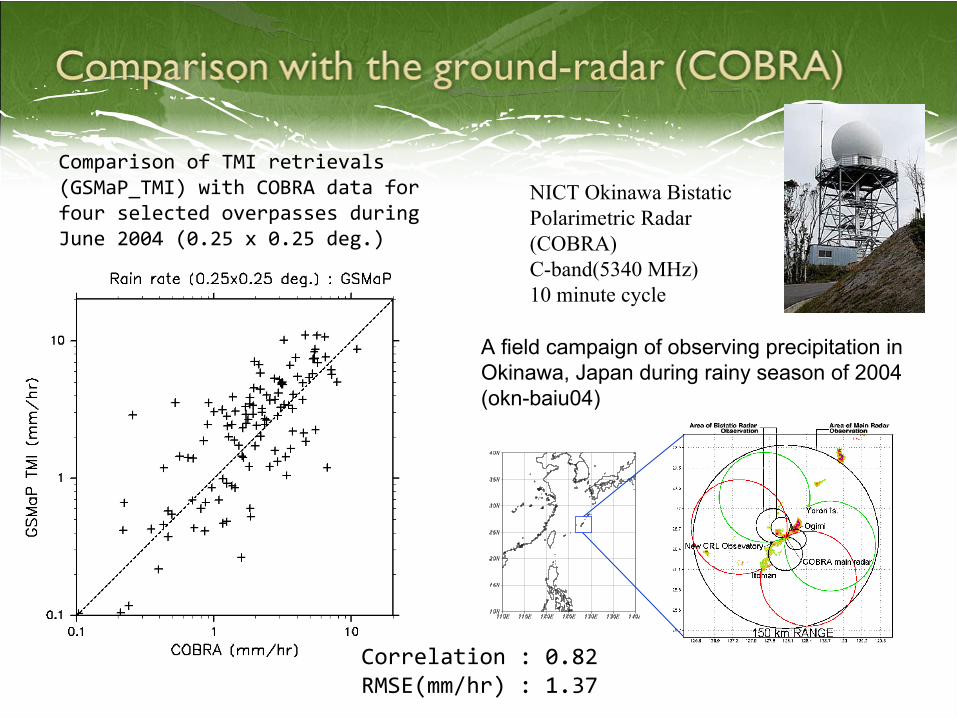
Correlation : 0.82RMSE(mm/hr) : 1.37
NICT Okinawa Bistatic
Polarimetric
Radar (COBRA)C-band(5340 MHz)10 minute cycle
Comparison of TMI retrievals
(GSMaP_TMI) with COBRA data for
four selected overpasses during
June 2004 (0.25 x 0.25 deg.)
A field campaign of observing precipitation in Okinawa, Japan during rainy season of 2004 (okn-baiu04)
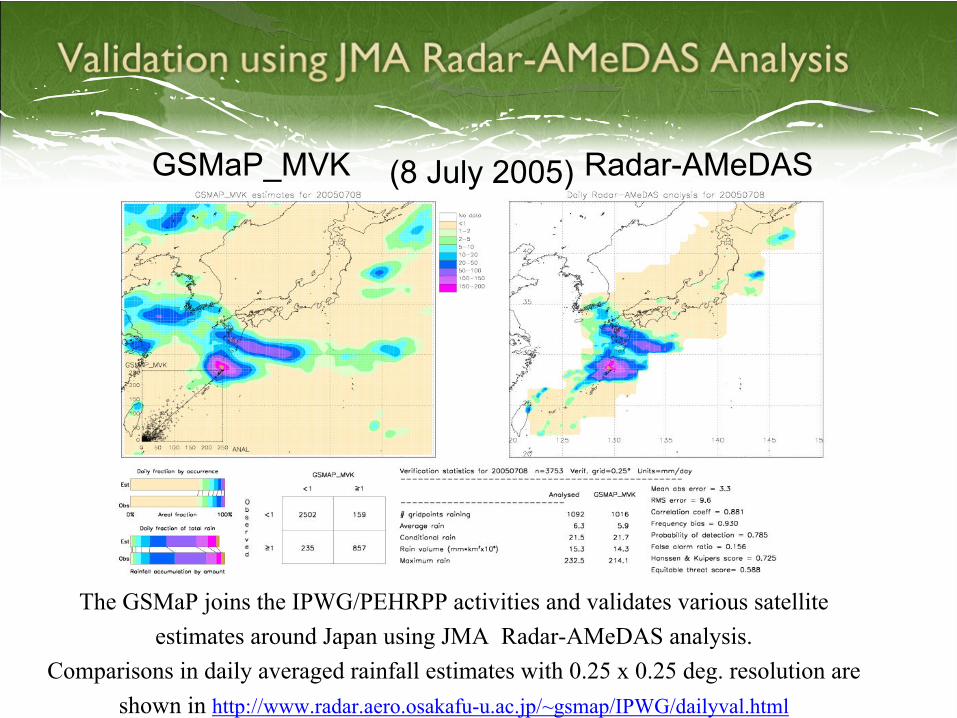
GSMaP_MVK Radar-AMeDAS(8 July 2005)
The GSMaP joins the IPWG/PEHRPP activities and validates various
satellite estimates around Japan using JMA Radar-AMeDAS
analysis.
Comparisons in daily averaged rainfall estimates with 0.25 x 0.25 deg. resolution are shown in http://www.radar.aero.osakafu-u.ac.jp/~gsmap/IPWG/dailyval.html
Correlation (Daily mean from all Radar-AMeDAS)
0.4
0.5
0.6
0.7
0.8
0.9
1
7/2 7/3 7/4 7/5 7/6 7/7 7/8 7/9 7/10 7/11
Date
Corr
ela
tion
GSMaP_MVK
GSMaP_MWR
CMORPH
3B42RT
GSMaP_MVK+
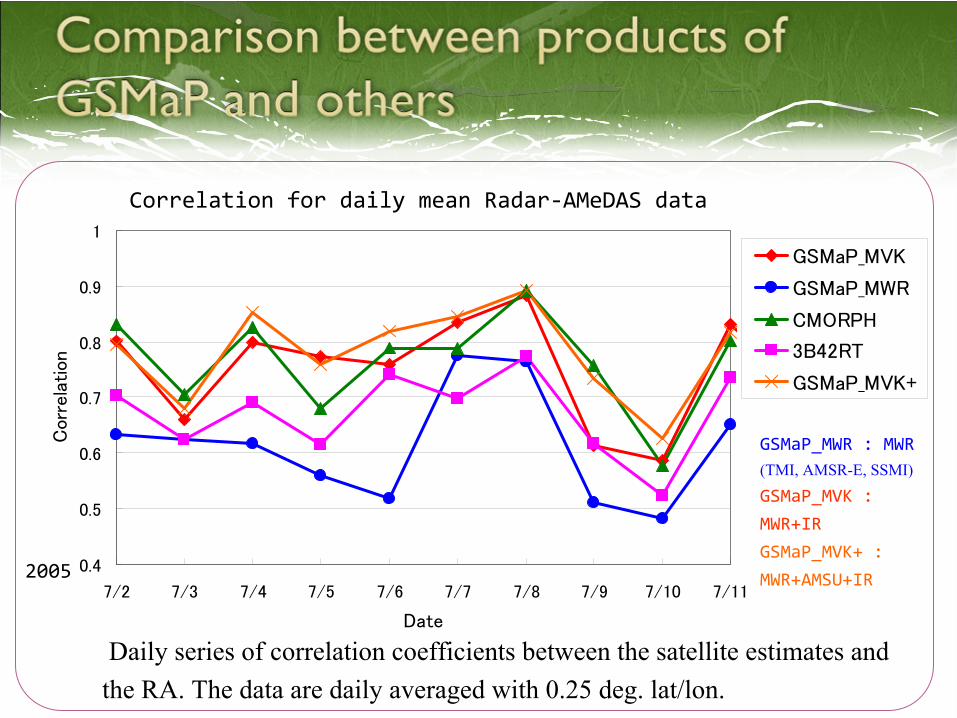
Daily series of correlation coefficients between the satellite estimates and the RA. The data are daily averaged with 0.25 deg. lat/lon.
2005
GSMaP_MWR
: MWR(TMI, AMSR-E, SSMI)
GSMaP_MVK
:
MWR+IR
GSMaP_MVK+ :
MWR+AMSU+IR
Correlation for daily mean Radar‐AMeDAS
data
Web site in near-real time using GSMaP algorithmshttp://sharaku.eorc.jaxa.jp/GSMaP/
Microwave radiometer algorithm (GSMaP_MWR algorithm)Algorithm developments using various attributes of TRMM PR observations
ex. Precipiation profile, DSD model, Scattering algorithm, Rain/no-rain Classification method
Developments based on the common physical model between MWR and PR algorithms
Melting layer model
Blended MWR-IR algorithm (GSMaP_MVK algorithm)Cloud motion vector and kalman filter
Validation
Recommended