Terrestrial biodiversity
200
4.5
State of the environment and biodiversity - Terrestrial biodiversity
Photo: Tui sitting on a branch of flax plant. (Source: Shutterstock).
201State of the environment and biodiversity - Terrestrial biodiversity
4.5
4.5State of the environment and biodiversity – Terrestrial biodiversity
Introduction 202
Key findings 202
Terrestrial biodiversity monitoring 202
Native land cover 202
Habitat loss, fragmentation and degradation 203
Threatened species 206
Terrestrial pests 211
Mammalian pests 211
Invertebrate pests 211
Plant pests 211
Conclusions on the state of terrestrial biodiversity 212
Case Study: Loss of wetlands in the Auckland region 213
Case Study: Vegetation clearance on the North Shore 214
References and further reading 216
Contents
202
4.5
State of the environment and biodiversity - Terrestrial biodiversity
Terrestrial biodiversity
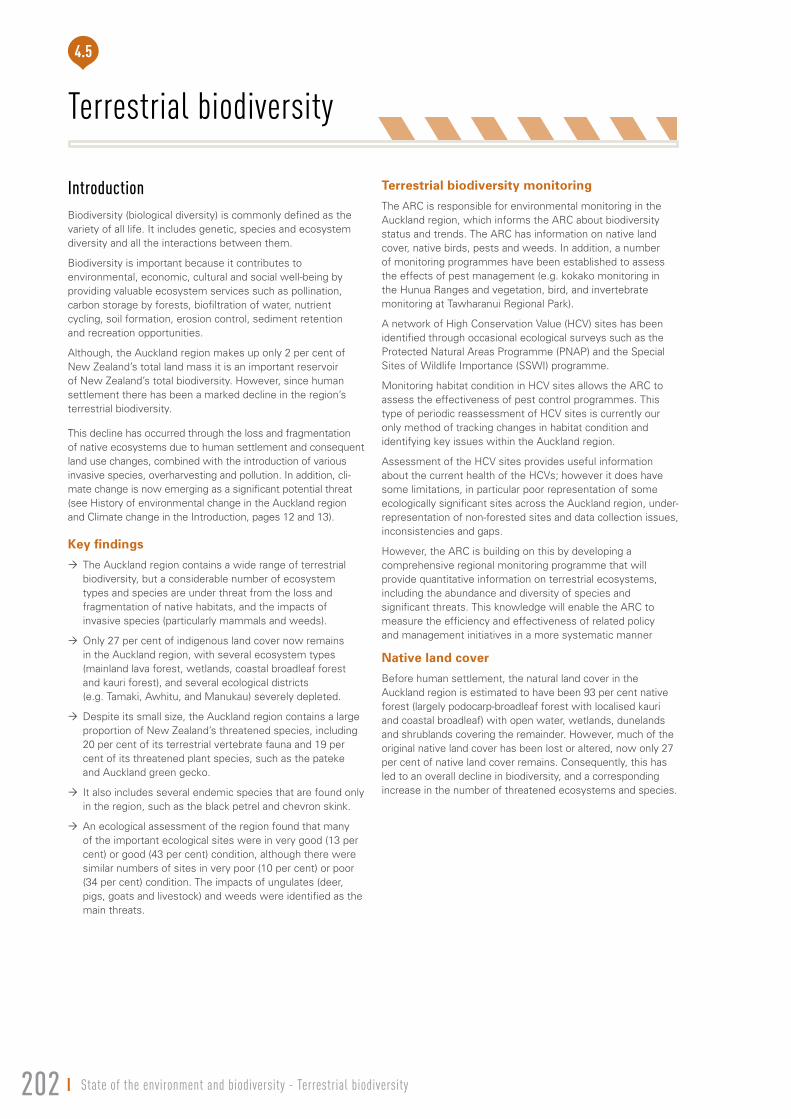
Introduction Biodiversity (biological diversity) is commonly defined as the variety of all life. It includes genetic, species and ecosystem diversity and all the interactions between them.
Biodiversity is important because it contributes to environmental, economic, cultural and social well-being by providing valuable ecosystem services such as pollination, carbon storage by forests, biofiltration of water, nutrient cycling, soil formation, erosion control, sediment retention and recreation opportunities.
Although, the Auckland region makes up only 2 per cent of New Zealand’s total land mass it is an important reservoir of New Zealand’s total biodiversity. However, since human settlement there has been a marked decline in the region’s terrestrial biodiversity.
This decline has occurred through the loss and fragmentation of native ecosystems due to human settlement and consequent land use changes, combined with the introduction of various invasive species, overharvesting and pollution. In addition, cli-mate change is now emerging as a significant potential threat (see History of environmental change in the Auckland region and Climate change in the Introduction, pages 12 and 13).
Key findings
The Auckland region contains a wide range of terrestrial ´biodiversity, but a considerable number of ecosystem types and species are under threat from the loss and fragmentation of native habitats, and the impacts of invasive species (particularly mammals and weeds).
Only 27 per cent of indigenous land cover now remains ´in the Auckland region, with several ecosystem types (mainland lava forest, wetlands, coastal broadleaf forest and kauri forest), and several ecological districts (e.g. Tamaki, Awhitu, and Manukau) severely depleted.
Despite its small size, the Auckland region contains a large ´proportion of New Zealand’s threatened species, including 20 per cent of its terrestrial vertebrate fauna and 19 per cent of its threatened plant species, such as the pateke and Auckland green gecko.
It also includes several endemic species that are found only ´in the region, such as the black petrel and chevron skink.
An ecological assessment of the region found that many ´of the important ecological sites were in very good (13 per cent) or good (43 per cent) condition, although there were similar numbers of sites in very poor (10 per cent) or poor (34 per cent) condition. The impacts of ungulates (deer, pigs, goats and livestock) and weeds were identified as the main threats.
Terrestrial biodiversity monitoring
The ARC is responsible for environmental monitoring in the Auckland region, which informs the ARC about biodiversity status and trends. The ARC has information on native land cover, native birds, pests and weeds. In addition, a number of monitoring programmes have been established to assess the effects of pest management (e.g. kokako monitoring in the Hunua Ranges and vegetation, bird, and invertebrate monitoring at Tawharanui Regional Park).
A network of High Conservation Value (HCV) sites has been identified through occasional ecological surveys such as the Protected Natural Areas Programme (PNAP) and the Special Sites of Wildlife Importance (SSWI) programme.
Monitoring habitat condition in HCV sites allows the ARC to assess the effectiveness of pest control programmes. This type of periodic reassessment of HCV sites is currently our only method of tracking changes in habitat condition and identifying key issues within the Auckland region.
Assessment of the HCV sites provides useful information about the current health of the HCVs; however it does have some limitations, in particular poor representation of some ecologically significant sites across the Auckland region, under-representation of non-forested sites and data collection issues, inconsistencies and gaps.
However, the ARC is building on this by developing a comprehensive regional monitoring programme that will provide quantitative information on terrestrial ecosystems, including the abundance and diversity of species and significant threats. This knowledge will enable the ARC to measure the efficiency and effectiveness of related policy and management initiatives in a more systematic manner
Native land cover
Before human settlement, the natural land cover in the Auckland region is estimated to have been 93 per cent native forest (largely podocarp-broadleaf forest with localised kauri and coastal broadleaf) with open water, wetlands, dunelands and shrublands covering the remainder. However, much of the original native land cover has been lost or altered, now only 27 per cent of native land cover remains. Consequently, this has led to an overall decline in biodiversity, and a corresponding increase in the number of threatened ecosystems and species.
Terrestrial biodiversity
4.5
203State of the environment and biodiversity - Terrestrial biodiversity
Habitat loss, fragmentation and degradation
Ecosystems are impacted in various ways when native habitats are lost or substantially modified. Plants and any other organisms that cannot move are usually destroyed, while the survival of other native species is reduced.
The process of habitat fragmentation is known to have an adverse impact on native biodiversity because it reduces the size of habitat area, increases the proportion of edge habitat and increases isolation from resources. Generally, larger habitat fragments are able to support species that require a large area, enabling them to maintain robust and healthy populations.
Habitat isolation can reduce the ability of species to disperse successfully across the landscape. Dispersal is essential for the long-term survival of many animal and plant species, particularly those that need a large area of habitat or specific resources. The degree of isolation is determined by the distance between the habitats, the characteristics of the surrounding landscapes and the dispersal patterns of different species.
Smaller fragments also have a higher proportion of edge area or ‘edge habitat’ that is influenced by adjacent land uses (e.g. agricultural or urban). Human-induced edge effects are known to have a direct effect on biodiversity in habitat fragments through changes in the amount of light, temperature, wind and moisture, and by improving access for unwanted organisms and other materials such as pollutants and invasive weeds. In turn, these factors typically result in indirect edge effects such as changes in plant densities, the amount of understorey cover (the plants between the tree canopy and the forest floor), shrub heights and species composition. Nevertheless, the importance of small habitat fragments can be high, particularly if they contain threatened ecosystems or threatened species.
Indicator 1: Habitat loss
The proportion of land cover types in the Auckland region is assessed using the Land Cover Database (LCDB). The first land cover database, LCDBI, was developed in 1996/97 and was followed by LCDBII in 2001/02. LCDBII was intended to assess the changes in land cover over the intervening five years but its limited accuracy has restricted our assessment of the extent of native land cover and ecosystem types.
Some native ecosystem types in Auckland are critically depleted and now cover less than 10 per cent of their original extent. These are:
kauri forests (9 per cent) ´
freshwater wetlands, including wetland forest ´(4 per cent)
coastal forests (3 per cent) ´
mainland lava forests (0.5 per cent). ´
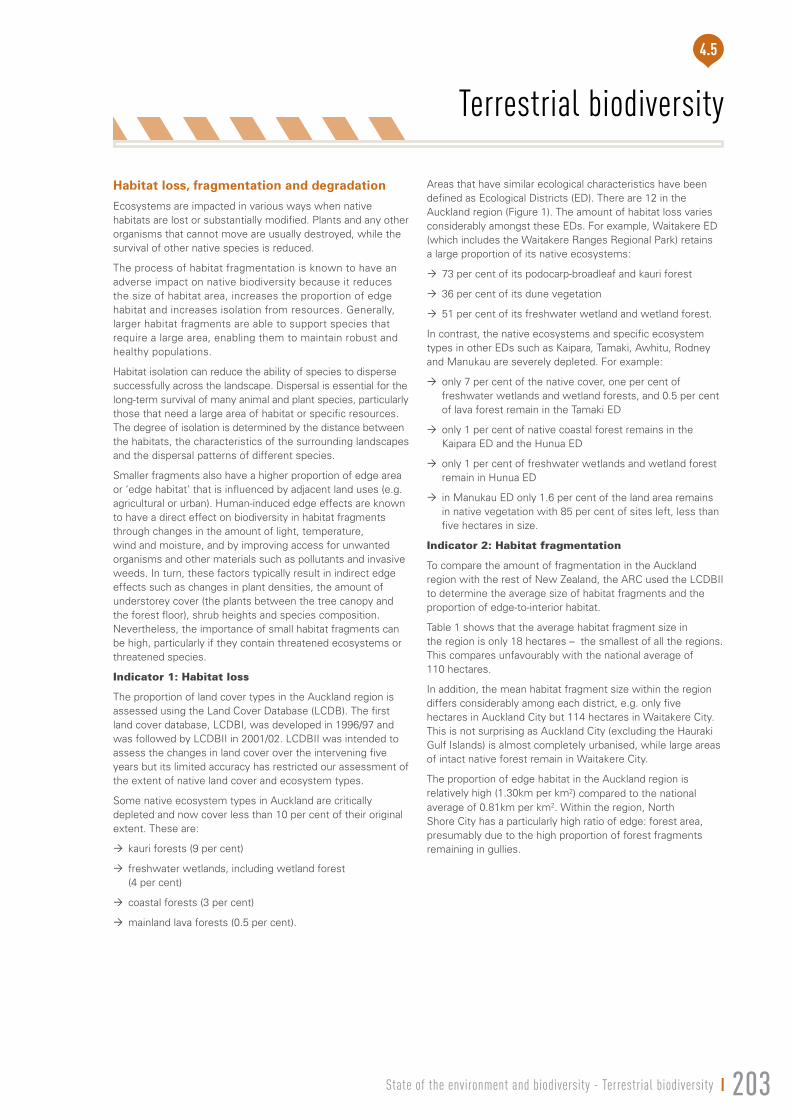
Areas that have similar ecological characteristics have been defined as Ecological Districts (ED). There are 12 in the Auckland region (Figure 1). The amount of habitat loss varies considerably amongst these EDs. For example, Waitakere ED (which includes the Waitakere Ranges Regional Park) retains a large proportion of its native ecosystems:
73 per cent of its podocarp-broadleaf and kauri forest ´
36 per cent of its dune vegetation ´
51 per cent of its freshwater wetland and wetland forest. ´
In contrast, the native ecosystems and specific ecosystem types in other EDs such as Kaipara, Tamaki, Awhitu, Rodney and Manukau are severely depleted. For example:
only 7 per cent of the native cover, one per cent of ´freshwater wetlands and wetland forests, and 0.5 per cent of lava forest remain in the Tamaki ED
only 1 per cent of native coastal forest remains in the ´Kaipara ED and the Hunua ED
only 1 per cent of freshwater wetlands and wetland forest ´remain in Hunua ED
in Manukau ED only 1.6 per cent of the land area remains ´in native vegetation with 85 per cent of sites left, less than five hectares in size.
Indicator 2: Habitat fragmentation
To compare the amount of fragmentation in the Auckland region with the rest of New Zealand, the ARC used the LCDBII to determine the average size of habitat fragments and the proportion of edge-to-interior habitat.
Table 1 shows that the average habitat fragment size in the region is only 18 hectares – the smallest of all the regions. This compares unfavourably with the national average of 110 hectares.
In addition, the mean habitat fragment size within the region differs considerably among each district, e.g. only five hectares in Auckland City but 114 hectares in Waitakere City. This is not surprising as Auckland City (excluding the Hauraki Gulf Islands) is almost completely urbanised, while large areas of intact native forest remain in Waitakere City.
The proportion of edge habitat in the Auckland region is relatively high (1.30km per km2) compared to the national average of 0.81km per km2. Within the region, North Shore City has a particularly high ratio of edge: forest area, presumably due to the high proportion of forest fragments remaining in gullies.
Terrestrial biodiversity
204
4.5
State of the environment and biodiversity - Terrestrial biodiversity
Kilometres0 2.5 5 10 15 20 25
Kilometres0 2.5 5 10 15 20 25
N
Rodney
Kaipara
Rangitoto
Inner Gulf Islands
Tamaki
Otamatea
Awhitu Manukau
Hunua
Waitakere
MokohinauIslands
Little Barrier Island
Great Barrier Island
Figure 1 Location of the 12 Ecological Districts in the Auckland region. (Source: ARC).
Terrestrial biodiversity
4.5
205State of the environment and biodiversity - Terrestrial biodiversity
Indicator 3: Habitat condition
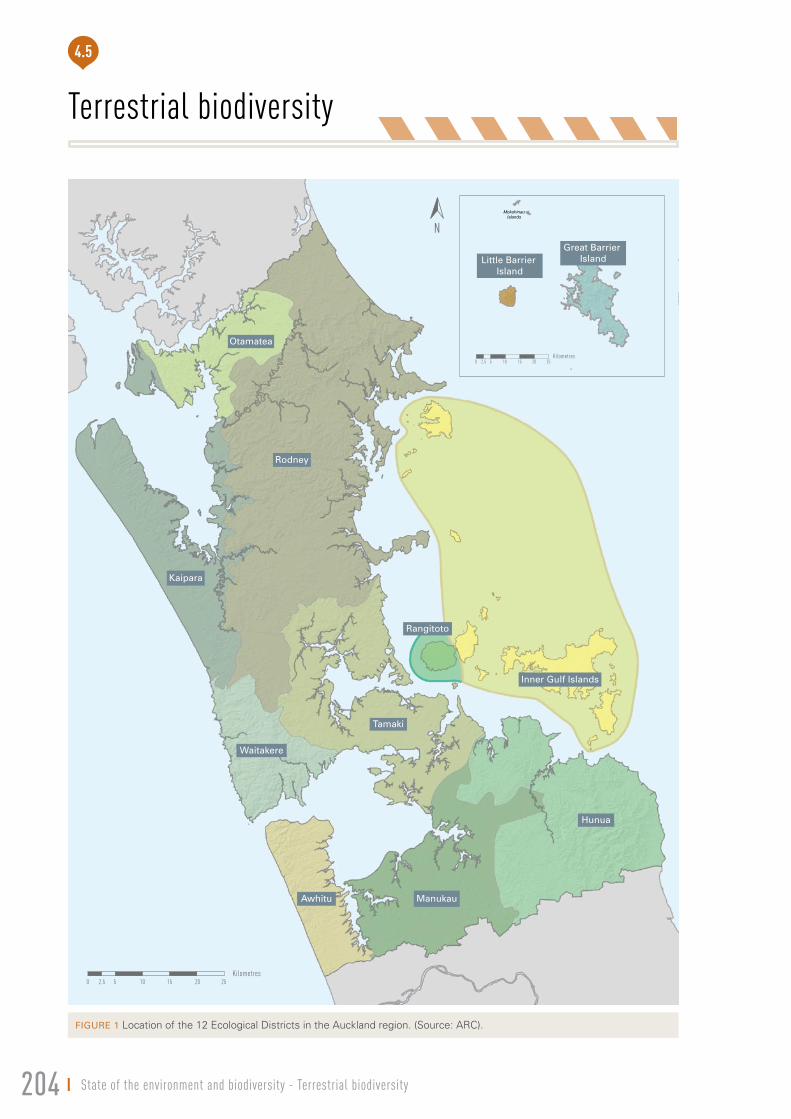
Over 200 HCV sites were assessed between 2004 and 2009 using the Forest Monitoring and Assessment Kit (FORMAK) method, which uses a four point scale to score sites according to 12 measures of forest condition. These measures were summed to provide an overall condition score ranging from 12 (lowest) to 48 (highest).
Each site was subjectively assigned to a forest condition category based on its score:
very poor (less than 31) ´
poor (31 to 36) ´
good (37 to 42) ´
very good (43 to 48). ´
A number of site characteristics such as the size of the HCV, the dominant surrounding land use type (agricultural, residential, forest reserve or exotic forest) and pest management history were also recorded, based on existing databases or conversations with landowners or land managers.
Figure 2 shows that just over half of the HCV sites were in very good (13 per cent) or good (43 per cent) condition, with the remainder in very poor (10 per cent) or poor (34 per cent) condition. In addition, two sites had been completely cleared.
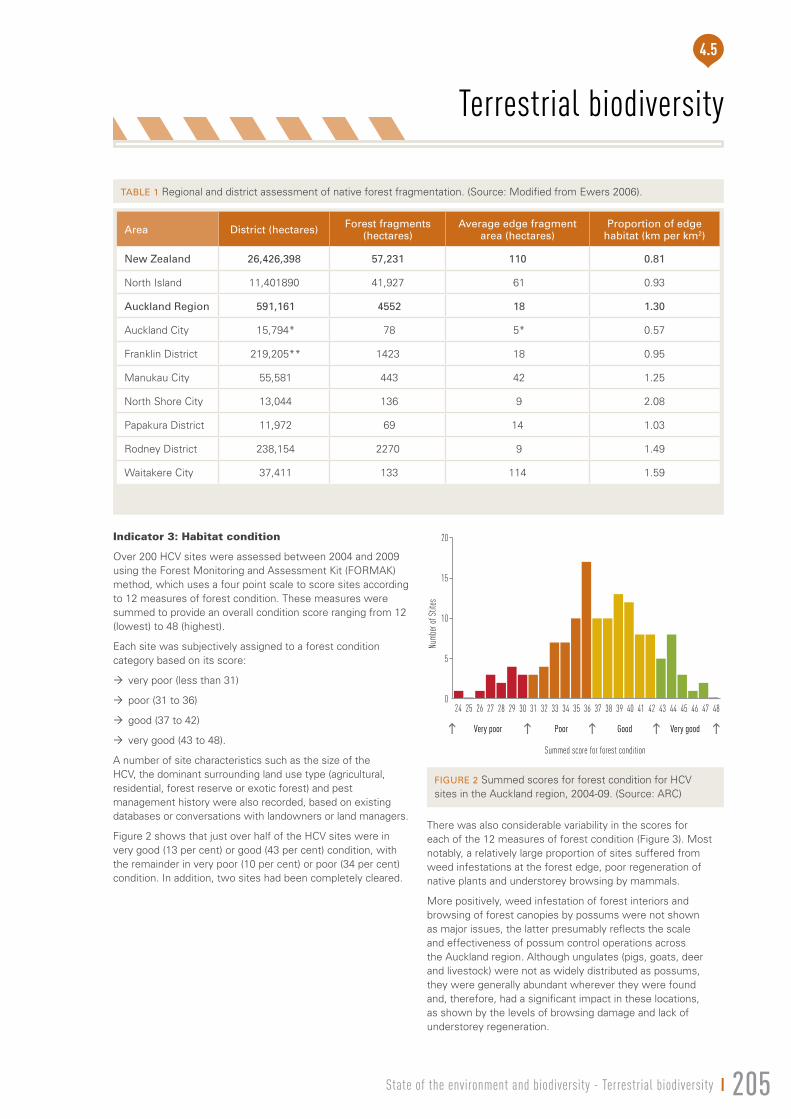
There was also considerable variability in the scores for each of the 12 measures of forest condition (Figure 3). Most notably, a relatively large proportion of sites suffered from weed infestations at the forest edge, poor regeneration of native plants and understorey browsing by mammals.
More positively, weed infestation of forest interiors and browsing of forest canopies by possums were not shown as major issues, the latter presumably reflects the scale and effectiveness of possum control operations across the Auckland region. Although ungulates (pigs, goats, deer and livestock) were not as widely distributed as possums, they were generally abundant wherever they were found and, therefore, had a significant impact in these locations, as shown by the levels of browsing damage and lack of understorey regeneration.
*Hauraki Gulf Islands are excluded from the analyses.** Includes portion of Franklin district outside the Auckland region.
area District (hectares) Forest fragments (hectares)
average edge fragment area (hectares)
Proportion of edge habitat (km per km2)
New Zealand 26,426,398 57,231 110 0.81
North Island 11,401890 41,927 61 0.93
auckland region 591,161 4552 18 1.30
Auckland City 15,794* 78 5* 0.57
Franklin District 219,205** 1423 18 0.95
Manukau City 55,581 443 42 1.25
North Shore City 13,044 136 9 2.08
Papakura District 11,972 69 14 1.03
Rodney District 238,154 2270 9 1.49
Waitakere City 37,411 133 114 1.59
Table 1 Regional and district assessment of native forest fragmentation. (Source: Modified from Ewers 2006).
0
5
10
Numb
er of
Stit
es
Summed score for forest condition
Poor Good Very goodVery poor
15
20
24 25 26 27 28 29 30 31 32 33 34 35 36 37 38 39 40 41 42 43 44 45 46 47 48
Figure 2 Summed scores for forest condition for HCV sites in the Auckland region, 2004-09. (Source: ARC)
Terrestrial biodiversity
206
4.5
State of the environment and biodiversity - Terrestrial biodiversity
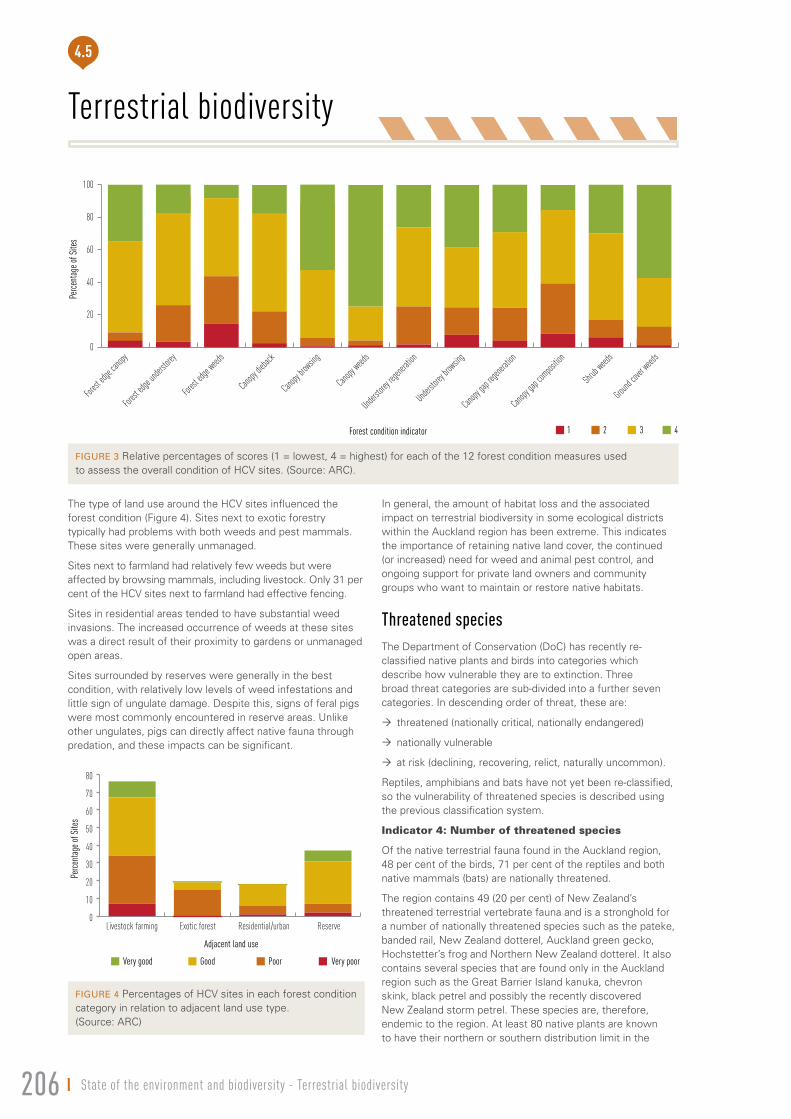
The type of land use around the HCV sites influenced the forest condition (Figure 4). Sites next to exotic forestry typically had problems with both weeds and pest mammals. These sites were generally unmanaged.
Sites next to farmland had relatively few weeds but were affected by browsing mammals, including livestock. Only 31 per cent of the HCV sites next to farmland had effective fencing.
Sites in residential areas tended to have substantial weed invasions. The increased occurrence of weeds at these sites was a direct result of their proximity to gardens or unmanaged open areas.
Sites surrounded by reserves were generally in the best condition, with relatively low levels of weed infestations and little sign of ungulate damage. Despite this, signs of feral pigs were most commonly encountered in reserve areas. Unlike other ungulates, pigs can directly affect native fauna through predation, and these impacts can be significant.
In general, the amount of habitat loss and the associated impact on terrestrial biodiversity in some ecological districts within the Auckland region has been extreme. This indicates the importance of retaining native land cover, the continued (or increased) need for weed and animal pest control, and ongoing support for private land owners and community groups who want to maintain or restore native habitats.
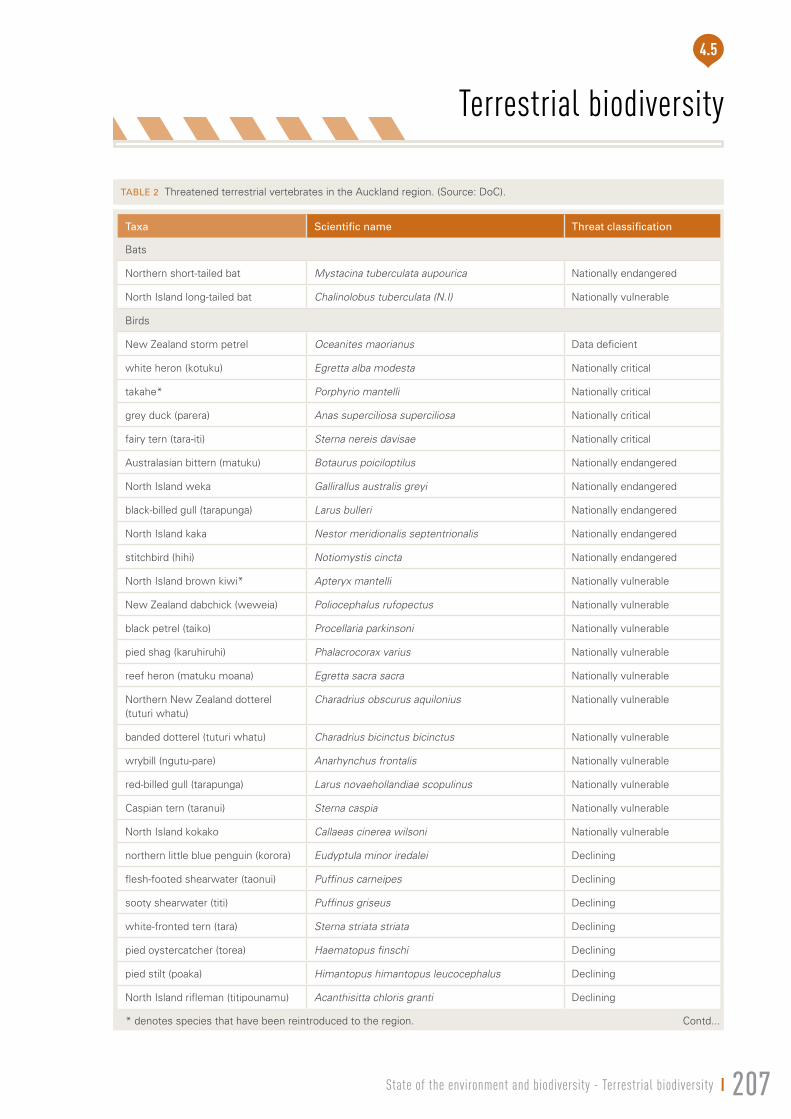
Threatened speciesThe Department of Conservation (DoC) has recently re-classified native plants and birds into categories which describe how vulnerable they are to extinction. Three broad threat categories are sub-divided into a further seven categories. In descending order of threat, these are:
threatened (nationally critical, nationally endangered) ´
nationally vulnerable ´
at risk (declining, recovering, relict, naturally uncommon). ´
Reptiles, amphibians and bats have not yet been re-classified, so the vulnerability of threatened species is described using the previous classification system.
Indicator 4: Number of threatened species
Of the native terrestrial fauna found in the Auckland region, 48 per cent of the birds, 71 per cent of the reptiles and both native mammals (bats) are nationally threatened.
The region contains 49 (20 per cent) of New Zealand’s threatened terrestrial vertebrate fauna and is a stronghold for a number of nationally threatened species such as the pateke, banded rail, New Zealand dotterel, Auckland green gecko, Hochstetter’s frog and Northern New Zealand dotterel. It also contains several species that are found only in the Auckland region such as the Great Barrier Island kanuka, chevron skink, black petrel and possibly the recently discovered New Zealand storm petrel. These species are, therefore, endemic to the region. At least 80 native plants are known to have their northern or southern distribution limit in the
Perc
enta
ge of
Site
s
Forest condition indicator 1 2 3 4
0
20
40
60
80
100
Forest
edge
canopy
Forest
edge
unders
torey
Forest
edge
weeds
Canopy
diebac
k
Canopy
browsin
g
Canopy
weeds
Unders
torey
regene
ration
Unders
torey
browsin
g
Canopy
gap re
genera
tion
Canopy
gap c
ompos
ition
Shrub
weeds
Ground
cover
weeds
Perc
enta
ge of
Site
s
Adjacent land use
0
10
20
30
40
50
60
70
80
Very good Good Poor Very poor
ReserveResidential/urbanExotic forestLivestock farming
Figure 3 Relative percentages of scores (1 = lowest, 4 = highest) for each of the 12 forest condition measures used to assess the overall condition of HCV sites. (Source: ARC).
Figure 4 Percentages of HCV sites in each forest condition category in relation to adjacent land use type. (Source: ARC)
Terrestrial biodiversity
4.5
207State of the environment and biodiversity - Terrestrial biodiversity
Taxa Scientific name Threat classification
Bats
Northern short-tailed bat Mystacina tuberculata aupourica Nationally endangered
North Island long-tailed bat Chalinolobus tuberculata (N.I) Nationally vulnerable
Birds
New Zealand storm petrel Oceanites maorianus Data deficient
white heron (kotuku) Egretta alba modesta Nationally critical
takahe* Porphyrio mantelli Nationally critical
grey duck (parera) Anas superciliosa superciliosa Nationally critical
fairy tern (tara-iti) Sterna nereis davisae Nationally critical
Australasian bittern (matuku) Botaurus poiciloptilus Nationally endangered
North Island weka Gallirallus australis greyi Nationally endangered
black-billed gull (tarapunga) Larus bulleri Nationally endangered
North Island kaka Nestor meridionalis septentrionalis Nationally endangered
stitchbird (hihi) Notiomystis cincta Nationally endangered
North Island brown kiwi* Apteryx mantelli Nationally vulnerable
New Zealand dabchick (weweia) Poliocephalus rufopectus Nationally vulnerable
black petrel (taiko) Procellaria parkinsoni Nationally vulnerable
pied shag (karuhiruhi) Phalacrocorax varius Nationally vulnerable
reef heron (matuku moana) Egretta sacra sacra Nationally vulnerable
Northern New Zealand dotterel (tuturi whatu)
Charadrius obscurus aquilonius Nationally vulnerable
banded dotterel (tuturi whatu) Charadrius bicinctus bicinctus Nationally vulnerable
wrybill (ngutu-pare) Anarhynchus frontalis Nationally vulnerable
red-billed gull (tarapunga) Larus novaehollandiae scopulinus Nationally vulnerable
Caspian tern (taranui) Sterna caspia Nationally vulnerable
North Island kokako Callaeas cinerea wilsoni Nationally vulnerable
northern little blue penguin (korora) Eudyptula minor iredalei Declining
flesh-footed shearwater (taonui) Puffinus carneipes Declining
sooty shearwater (titi) Puffinus griseus Declining
white-fronted tern (tara) Sterna striata striata Declining
pied oystercatcher (torea) Haematopus finschi Declining
pied stilt (poaka) Himantopus himantopus leucocephalus Declining
North Island rifleman (titipounamu) Acanthisitta chloris granti Declining
Contd...* denotes species that have been reintroduced to the region.
Table 2 Threatened terrestrial vertebrates in the Auckland region. (Source: DoC).
Terrestrial biodiversity
208
4.5
State of the environment and biodiversity - Terrestrial biodiversity
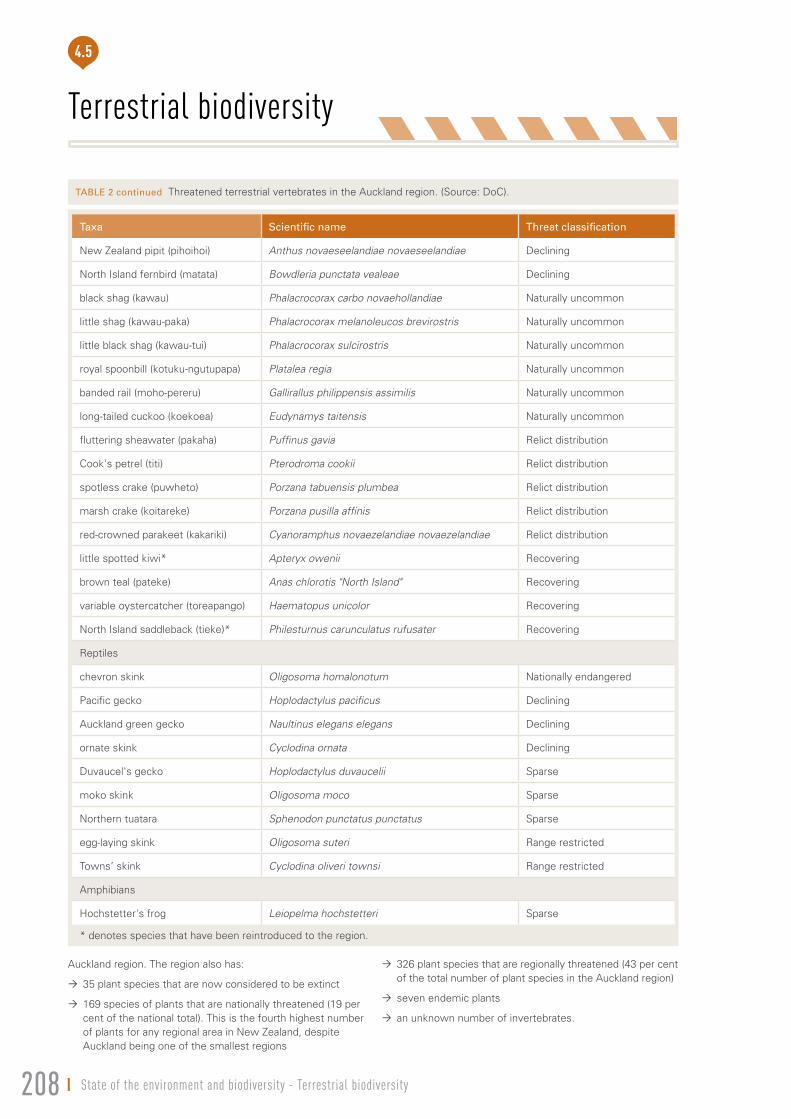
Auckland region. The region also has:
35 plant species that are now considered to be extinct ´
169 species of plants that are nationally threatened (19 per ´cent of the national total). This is the fourth highest number of plants for any regional area in New Zealand, despite Auckland being one of the smallest regions
326 plant species that are regionally threatened (43 per cent ´of the total number of plant species in the Auckland region)
seven endemic plants ´
an unknown number of invertebrates. ´
Taxa Scientific name Threat classification
New Zealand pipit (pihoihoi) Anthus novaeseelandiae novaeseelandiae Declining
North Island fernbird (matata) Bowdleria punctata vealeae Declining
black shag (kawau) Phalacrocorax carbo novaehollandiae Naturally uncommon
little shag (kawau-paka) Phalacrocorax melanoleucos brevirostris Naturally uncommon
little black shag (kawau-tui) Phalacrocorax sulcirostris Naturally uncommon
royal spoonbill (kotuku-ngutupapa) Platalea regia Naturally uncommon
banded rail (moho-pereru) Gallirallus philippensis assimilis Naturally uncommon
long-tailed cuckoo (koekoea) Eudynamys taitensis Naturally uncommon
fluttering sheawater (pakaha) Puffinus gavia Relict distribution
Cook's petrel (titi) Pterodroma cookii Relict distribution
spotless crake (puwheto) Porzana tabuensis plumbea Relict distribution
marsh crake (koitareke) Porzana pusilla affinis Relict distribution
red-crowned parakeet (kakariki) Cyanoramphus novaezelandiae novaezelandiae Relict distribution
little spotted kiwi* Apteryx owenii Recovering
brown teal (pateke) Anas chlorotis "North Island" Recovering
variable oystercatcher (toreapango) Haematopus unicolor Recovering
North Island saddleback (tieke)* Philesturnus carunculatus rufusater Recovering
Reptiles
chevron skink Oligosoma homalonotum Nationally endangered
Pacific gecko Hoplodactylus pacificus Declining
Auckland green gecko Naultinus elegans elegans Declining
ornate skink Cyclodina ornata Declining
Duvaucel's gecko Hoplodactylus duvaucelii Sparse
moko skink Oligosoma moco Sparse
Northern tuatara Sphenodon punctatus punctatus Sparse
egg-laying skink Oligosoma suteri Range restricted
Towns’ skink Cyclodina oliveri townsi Range restricted
Amphibians
Hochstetter's frog Leiopelma hochstetteri Sparse
Table 2 continued Threatened terrestrial vertebrates in the Auckland region. (Source: DoC).
* denotes species that have been reintroduced to the region.
Terrestrial biodiversity
4.5
209State of the environment and biodiversity - Terrestrial biodiversity
Little Barrier Island(Hauturu Island)
Great Barrier Island(Aotea Island)
Kaikoura Island(Selwyn Island)
MokohinauIslands
N
Kilometres0 2.5 5 10 15 20 25
Kilometres0 2.5 5 10 15 20 25
Surface water catchment
High: 30
Total number of threatened species
Low: 1
Legend
Bird distribution 1994-2004, copyright Ornithological Society of NZ, IncFreshwater fish distribution 1957-2007, NIWA freshwater fish databaseHerptofauna 1918-2005, DOC BioWeb DatabaseThreatened Plants 1970-2007, DOC BioWeb Database, Auckland Museum, Botanical Societies
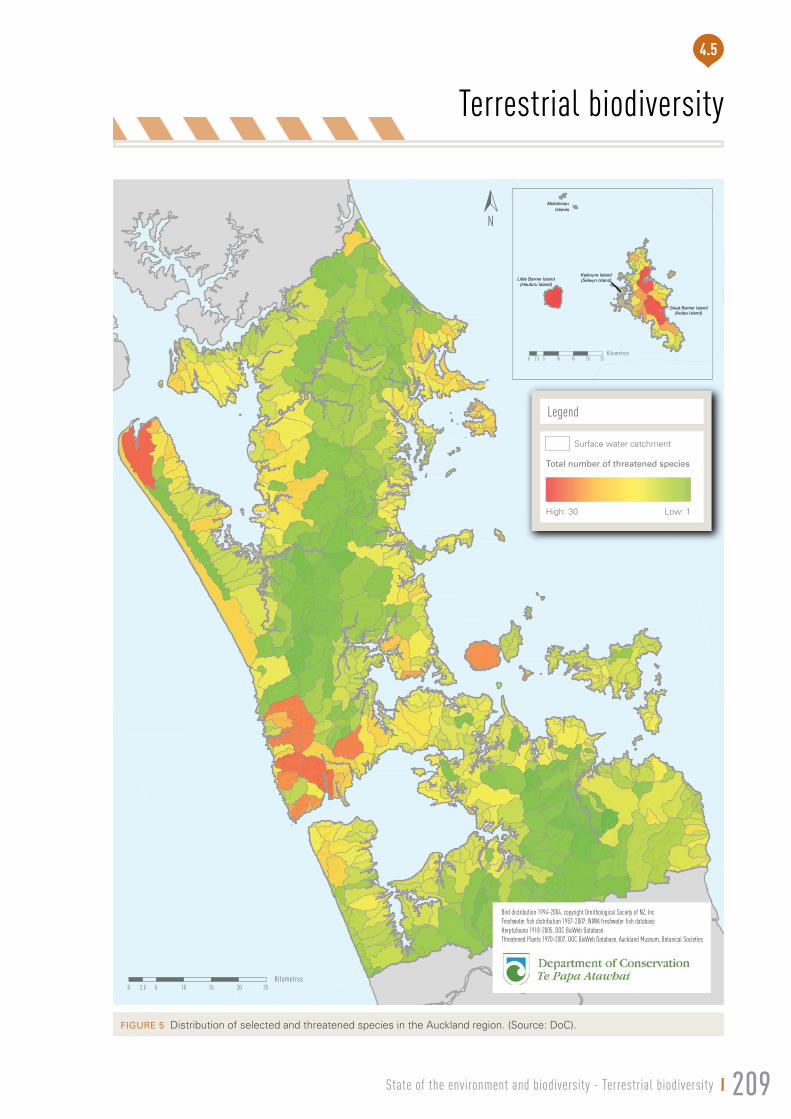
Figure 5 Distribution of selected and threatened species in the Auckland region. (Source: DoC).
Terrestrial biodiversity
210
4.5
State of the environment and biodiversity - Terrestrial biodiversity
Indicator 5: Spatial distribution of threatened species
The distribution of threatened birds, reptiles, amphibians, fish and plant species varies considerably across the Auckland region.
Many threatened species in the region now survive only on some offshore islands in the Hauraki Gulf. Such islands are relatively pristine and free of all or some introduced mammalian predators and competitors and invasive plant species. Islands which harbour significant numbers of threatened species include: Great Barrier Island, Little Barrier Island, Tiritiri Matangi, Motuora and Motuihe Islands.
High numbers of threatened species also occur in the Waitakere and Hunua Ranges and South Kaipara Head (Figure 5). The Kaipara and Manukau harbours contain enormous areas of mudflats and sandflats that are of international significance as feeding grounds for thousands of migratory and locally breeding shorebirds including the nationally vulnerable New Zealand dotterel and the wrybill plover.
The large number of threatened species in the Waitakere and Hunua Ranges reflect the quality and extent of intact native forest, wetlands and dunelands.
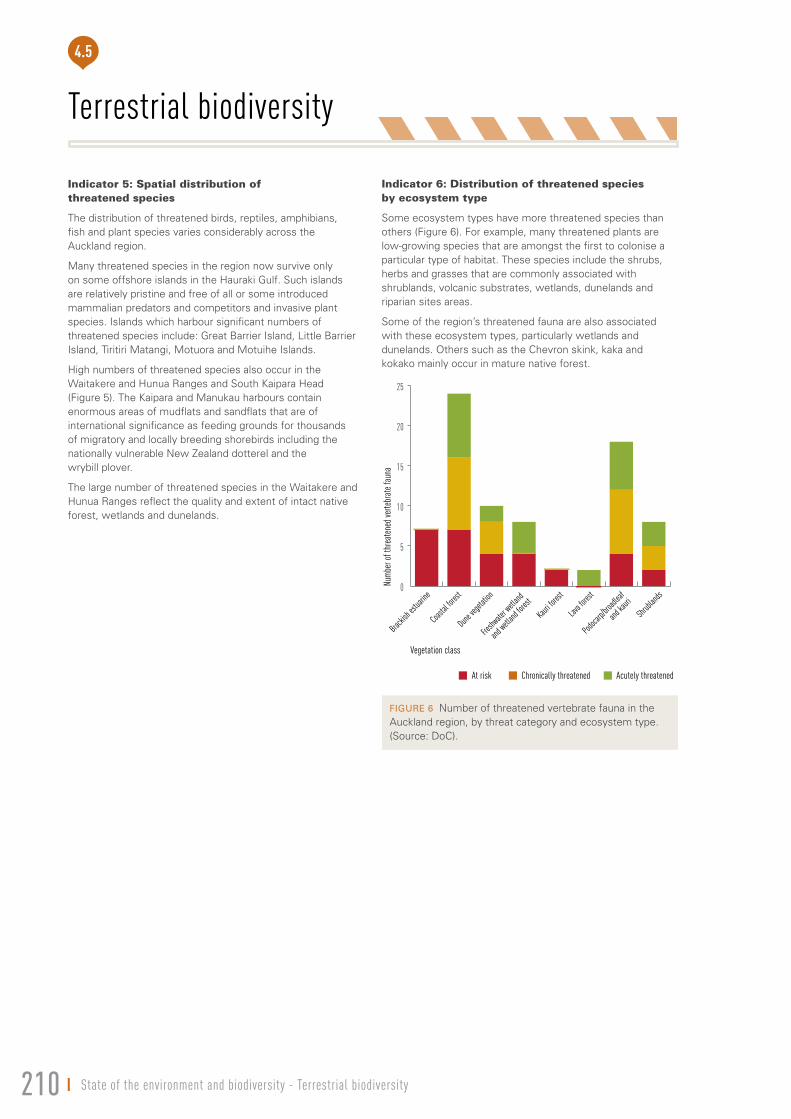
Indicator 6: Distribution of threatened species by ecosystem type
Some ecosystem types have more threatened species than others (Figure 6). For example, many threatened plants are low-growing species that are amongst the first to colonise a particular type of habitat. These species include the shrubs, herbs and grasses that are commonly associated with shrublands, volcanic substrates, wetlands, dunelands and riparian sites areas.
Some of the region’s threatened fauna are also associated with these ecosystem types, particularly wetlands and dunelands. Others such as the Chevron skink, kaka and kokako mainly occur in mature native forest.
Num
ber o
f thr
eate
ned v
erte
brat
e fau
na
Vegetation class
0
5
10
15
20
25
At risk Chronically threatened Acutely threatened
Shrubl
ands
Podoca
rp/bro
adleaf
and ka
uri
Lava fo
rest
Kauri fo
rest
Freshw
ater w
etland
and wetl
and for
est
Dune ve
getatio
n
Coasta
l fores
t
Brackis
h estu
arine
Figure 6 Number of threatened vertebrate fauna in the Auckland region, by threat category and ecosystem type. (Source: DoC).
Terrestrial biodiversity
4.5
211State of the environment and biodiversity - Terrestrial biodiversity
Terrestrial pestsAn exotic species is any non-native organism that has been introduced to a new location by human action or by natural means. Not all of these introduced species threaten the native biodiversity. About 10 per cent of any accidentally or deliberately introduced species will appear in the wild, 10 per cent of those will become established and 10 per cent of those will become invasive.
Species become ‘invasive’ when they spread rapidly and have an adverse impact on their new environment. Invasive species pose an ongoing threat to native terrestrial biodiversity because they may compete with, or consume, native plants and animals.
The Auckland region is a major international gateway. Ships, aircraft and their cargoes present potential biosecurity risks as they provide a potential mechanism for the accidental introduction of unwanted species. Several examples of deliberate introductions of exotic species to the Auckland are also known, e.g. most exotic plants were introduced as ornamental garden plants and possums were introduced for the fur trade.
Invasive animals, plants and other organisms such as pathogens have played a major role in the decline of native biodiversity. The effects of pest mammals, for example, have been as profound in the decline of native birds, reptiles, amphibians and invertebrates as the loss of habitat.
Mammalian pests
Native vegetation has been significantly altered by introduced mammalian herbivores and omnivores, which have radically changed the structure and composition of native forest ecosystems. In particular, possums cause extensive and catastrophic forest canopy collapse while deer and goats browse the understorey and, together with rodents, inhibit forest regeneration.
Mammalian predators have also had an adverse impact on native biodiversity. Rats and mice, in particular, are responsible for many extinctions and ecosystem changes as their generalist feeding habits mean that they eat plants, invertebrates, reptiles, mammals and birds. Possums, cats, mustelids (weasels, stoats and ferrets) and dogs also threaten native biodiversity. For example, feral cats eradicated the saddleback from Little Barrier Island and threatened colonies of black and Cook’s petrels.
Predatory mammals can also have an indirect adverse impact on ecological processes through predation of native species. Some avian seed dispersers such as moa are now extinct, while others such as the hihi and saddleback are now confined to predator-free offshore islands. Kokako and weka have severely restricted mainland distributions. The New Zealand pigeon (kereru) is widespread but reduced in numbers and the bellbird and whitehead are absent from most parts of Auckland. Consequently, the distribution of some plant species that rely on birds for pollination are limited. Species with large fruits (more than 1.4 cm diameter) such as tawa and taraire, now depend solely on the kereru for dispersal.
Invertebrate pests
Some introduced invertebrates can have adverse impacts on terrestrial ecosystems. Many social insects such as ants, wasps, bees and termites fit into this category because they can feed on a variety of foods and their reproductive and dispersal characteristics make them very effective invaders.
It is estimated that about 2200 species of introduced invertebrates are now established New Zealand, with the majority established in Auckland.
Two species of introduced Vespulia wasp are established in the Auckland region. Wasps can reach very high numbers and prey on some native invertebrate species. Wasps have been recorded attacking and killing reptiles and nesting birds, although the level of threat from wasp predation is not known. Wasps may also compete with native reptiles, birds and bats.
Wasps and other invertebrate predators are highly sensitive to climate. Wet winters reduce populations while warm dry conditions are ideal for explosive population growth. This warrants concern in view of projected climate changes for the Auckland region.
Plant pests
Terrestrial pest plants are invasive exotic plant species that invade natural ecosystems and cause major modifications to native biodiversity and ecosystem functions.
Pest plant species can have major effects on ecosystem processes by altering structure, function and biodiversity. In the Auckland region, wild ginger invades native forest and shrublands fragments altering the forest structure by decreasing the number and variety of native seedlings and improving the relative survival rate of species with larger seeds, such as kohekohe. Moreover pest plants have been implicated in the decline of numerous threatened species due to competition. For example, kikuyu and marram grasses have contributed to the decline of shore spurge (Euphorpia glaua) which has disappeared from the Auckland mainland.
The Auckland region has 750 native vascular plant species, 642 exotic naturalised plant species and thousands of exotic plant species used in horticulture. In 2004, about 10 per cent of the naturalised exotic plant species were recognised as pest plants by DoC. Three-quarters of these were originally introduced legitimately for ornamental use. Only 14 per cent were introduced for agriculture, horticulture or forestry and only 10 per cent naturalised through unintentional release. Consequently, there is a huge pool of potential pest plant species already in the country. A number of exotic naturalised species are likely to be ‘sleeper pest plant species’. These arrive in an area, then naturalise and remain localised for some time before they suddenly increase and become classified as a pest plant species.
Terrestrial biodiversity
212
4.5
State of the environment and biodiversity - Terrestrial biodiversity
Conclusions on the state of terrestrial biodiversity Terrestrial biodiversity in the Auckland region is under threat from various environmental factors. These include habitat alteration as a result of the loss and fragmentation of native land cover, and the adverse impacts of introduced species, grazing, overharvesting and pollution.
Of these factors, habitat alteration and introduced species are considered to be the main threats. Overharvesting and various types of pollution, however, can be the dominant threat on a local scale, or for a particular type of ecosystem. It is often difficult to attribute declines in terrestrial biodiversity to specific threats and it is also increasingly clear that the adverse impact from one threat can be exacerbated by the effects of other threats acting together (e.g. habitat fragmentation combined with invasive species).
As with other lowland areas of New Zealand, the Auckland region has lost a large proportion of the biodiversity of its terrestrial ecosystems. This loss has been disproportionately large with only 27 per cent of our native land cover remaining. Some ecosystems have less than 10 per cent of their original extent or have been lost altogether.
The Auckland region has 326 plants that are classified as nationally or regionally threatened, including 35 now considered regionally extinct and seven that are only found in the Auckland region. It also contains 49 threatened vertebrate fauna, and several of these are found only in the Auckland region.
The Auckland region is a hotspot for threatened ecosystems and species and the future of these ecosystems and species is heavily dependent on effective biodiversity management. While biodiversity decline in the Auckland region has been dramatic, there are still large and ecologically significant ecosystems and habitats such as the Kaipara and Manukau harbours, Waitakere and Hunua Ranges, as well as a number of nationally important offshore islands that lack some (or all) mammalian pests.
Terrestrial biodiversity
4.5
213State of the environment and biodiversity - Terrestrial biodiversity
Case Study: Loss of wetlands in the Auckland regionWetlands – permanently or temporarily wet areas – are possibly our most valuable freshwater and terrestrial ecosystem. They provide a variety of essential services such as biofiltration, flood control and carbon sequestration. The swamps, bogs, fens, salt marshes, and estuaries that make up the wetlands are also home to 22 per cent of our plant species and 30 per cent of our native fish.
New Zealand has one of the worst records for protecting wetlands, and more than 90 per cent have been destroyed; mostly drained for agriculture. Many of the remaining wetlands are degraded through changes to the water, pollution from nutrients and sedimentation, and invasive species. New Zealand’s wetlands now contain a greater proportion of threatened native species than any other terrestrial ecosystem.
The region’s record for wetland protection is worse than that for New Zealand as a whole, with remaining wetlands covering only 4 per cent of their original extent. Regionally it is estimated that almost one third of the nationally threatened plants in the Auckland region survive in wetlands, along with a number of threatened wetland birds (e.g. the New Zealand bittern), and fish (e.g. the black mudfish).
Notable remaining Auckland wetlands include:
the Waitemata, Kaipara and Manukau harbours ´and their associated estuaries
the Firth of Thames (internationally recognised ´wetland site)
Kaitoke swamp and Whangapoua estuary ´Great Barrier Island
Te Matuku, Rocky Bay and Awaawaroa wetlands ´on Waiheke Island
Te Henga wetland, Waitakere ´
the dune lakes at Kaipara (South Head), Pakiri ´and Awhitu peninsula
freshwater and saline wetlands in association ´ with dune systems at Kaipara and Whatipu
urban wetland remnants at Western Springs ´
Omaha kahikatea swamp forest. ´
The Wetlands of Representative and Ecological Importance (WERI) database was used to assess recent wetland losses. Wetlands in this database were identified in the 1980s and while the database only includes ecologically significant wetlands of more than 1 ha, it serves as a means to measure change. We compared aerial photographs taken in 2006/07 with those taken in the 1980s to discover which WERI sites were still present, and to measure any changes in their size and shape.
Despite limitations related to dataset accuracy, at least 94 per cent of the WERI sites appeared to be unchanged in terms of spatial extent. Ten wetlands could not be assessed because the relevant area was not covered by the WERI aerial photographs. Two wetlands (1 per cent) appeared to have been completely or substantially drained and cleared.
These findings suggest that the continued loss of larger wetlands (over 1 ha) within the Auckland region is relatively minor. However, the number of smaller wetlands (less than 1 ha) that have been lost was not assessed and anecdotal evidence suggests that these wetlands are the most vulnerable and continue to be lost. In rural areas many of these smaller wetlands are impacted by grazing.
Many of these smaller wetlands are only temporarily inundated with surface water (i.e. seasonal or ephemeral wetlands). Plant and invertebrate communities are therefore specifically adapted to these conditions and can be quite distinct from wetland communities found in larger permanent wetlands. For example, many aquatic invertebrates in temporary wetlands do not occur in permanent wetlands due to the presence of predatory fish.
Crucially, this study did not assess wetland quality or condition, and although there appears to have been little change in area for most of the WERI sites, their condition may have changed. Regional wetlands continue to be impacted by drainage, grazing, nutrients and pollution, and by invasive species. For example, Te Henga wetland has been impacted by the spread of grey and crack willow and a control programme is in place.
In 2007, in recognition of their value and current lack of protection, DoC and MfE declared the protection of biodiversity on wetlands (and dunelands) on private land to be a national priority. Only 38 per cent of the remaining 4 per cent of remaining regional wetlands are protected, so legal protection through land acquisitions and covenanting, as well as ecological restoration initiatives are considered paramount.
On a positive note, several wetlands have been substantially restored. The former oxidation ponds at the Mangere Wastewater Treatment Plant have been decommissioned and returned to harbour, the Tawharanui wetlands (in a pest-free area on the peninsula), and those in the Awhitu Regional Park have been greatly expanded, the Waiataura wetland in Auckland City has been restored and the Te Henga wetland is subject to a willow control programme. The trend to restore the region’s wetlands looks set to continue through efforts from a variety of organisations and conservation groups.
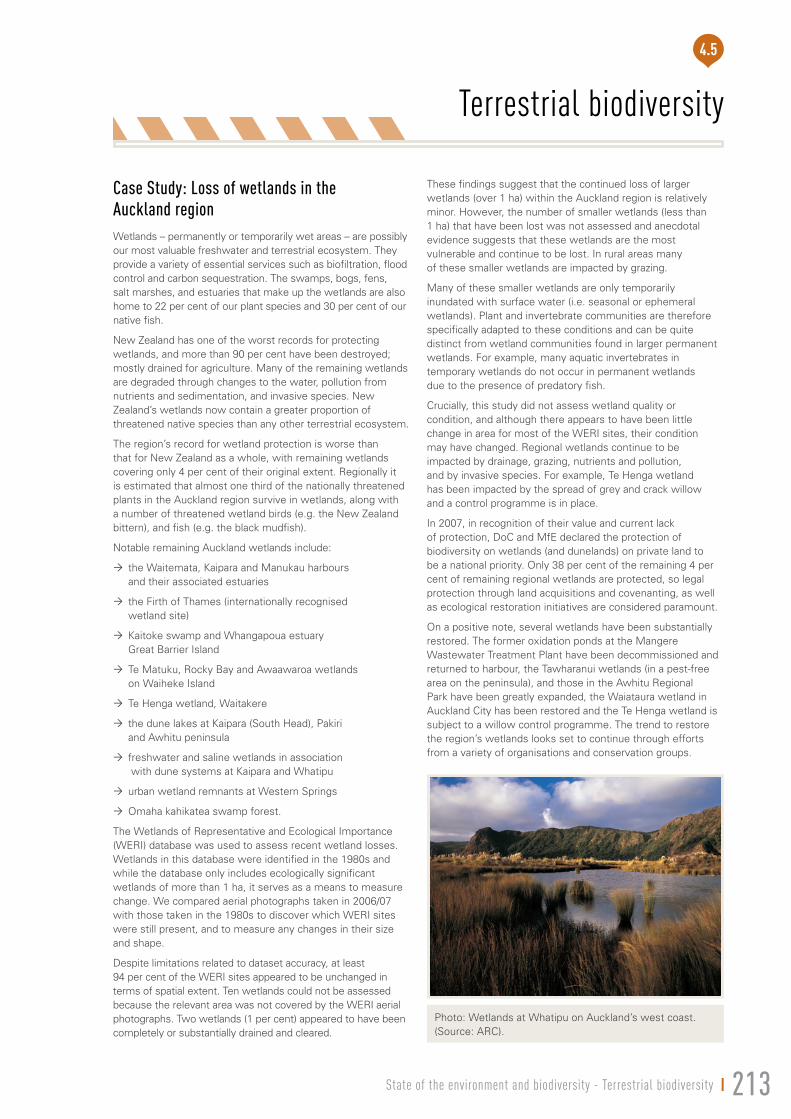
Photo: Wetlands at Whatipu on Auckland’s west coast. (Source: ARC).
Terrestrial biodiversity
214
4.5
State of the environment and biodiversity - Terrestrial biodiversity
Case Study: Vegetation clearance on the North ShoreNorth Shore City contains a large proportion of urban Auckland’s remaining native terrestrial habitats. These include ecologically significant remnants of kauri forest, broadleaved/podocarp forest, coastal forest, lava forest, shrubland, and wetlands.
The ARC and North Shore City Council have classified a number of these habitats as Significant Natural Areas (SNAs) with three levels of significance: Level 1 (high priority habitats); Level 2 (younger and more common habitat types), and Level 3 (ecological linkage areas). Level 3 areas tend to be impacted more by exotic species such as pines or wattles, but still provide important habitats and movement corridors for indigenous flora and fauna. Some significant habitats will not be included in the current SNA network because they have not been formally assessed.
To determine the extent of recent habitat loss and fragmentation in North Shore City’s SNAs, the ARC compared aerial photographs taken in 2001 and 2006. All habitat loss, both consented and non-consented, was measured and mapped. The reason for the loss was also identified.
In 2001 indigenous habitat classified as SNAs totalled approximately 2,234 hectares. By 2006, this had been reduced to 2,152 hectares, indicating that 59 hectares (about 3 per cent) of classified ecologically significant habitat were cleared between 2001 and 2006. It is also likely that unclassified ecologically significant habitats have been lost, though this is not been measured.
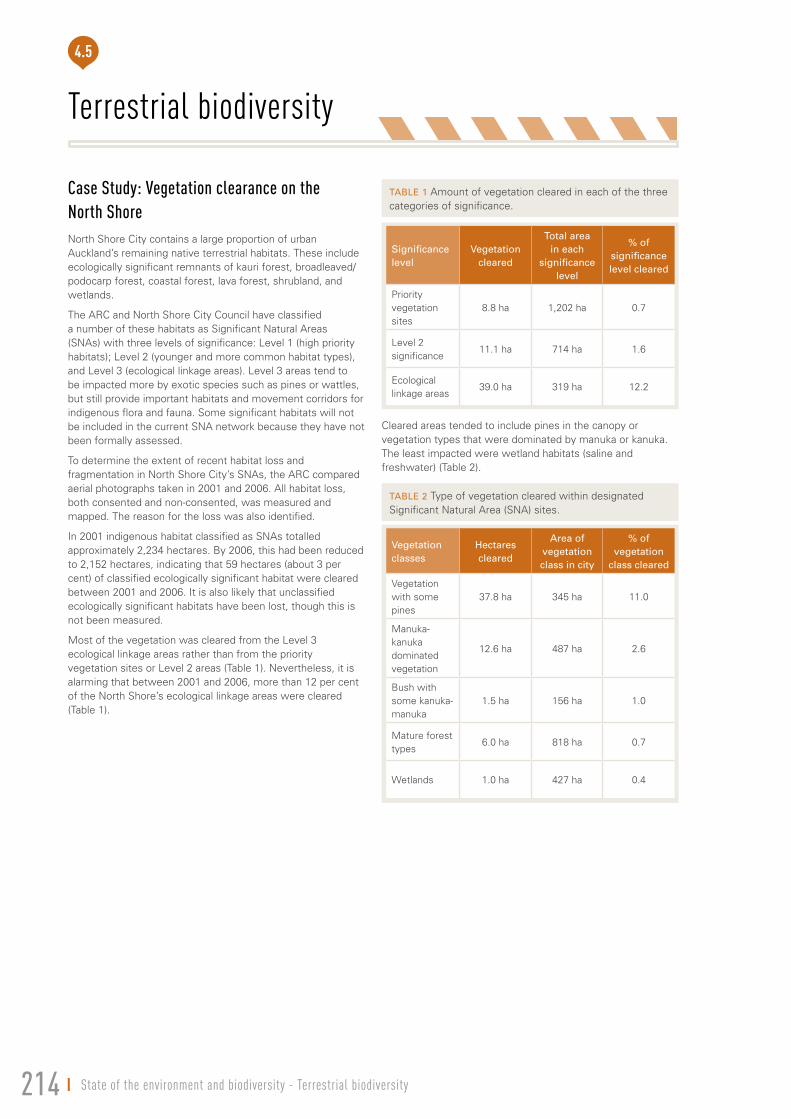
Most of the vegetation was cleared from the Level 3 ecological linkage areas rather than from the priority vegetation sites or Level 2 areas (Table 1). Nevertheless, it is alarming that between 2001 and 2006, more than 12 per cent of the North Shore’s ecological linkage areas were cleared (Table 1).
Cleared areas tended to include pines in the canopy or vegetation types that were dominated by manuka or kanuka. The least impacted were wetland habitats (saline and freshwater) (Table 2).
Vegetation classes
Hectares cleared
area of vegetation class in city
% of vegetation
class cleared
Vegetation with some pines
37.8 ha 345 ha 11.0
Manuka-kanuka dominated vegetation
12.6 ha 487 ha 2.6
Bush with some kanuka-manuka
1.5 ha 156 ha 1.0
Mature forest types
6.0 ha 818 ha 0.7
Wetlands 1.0 ha 427 ha 0.4
Table 2 Type of vegetation cleared within designated Significant Natural Area (SNA) sites.
Significance level
Vegetation cleared
Total area in each
significance level
% of significance level cleared
Priority vegetation sites
8.8 ha 1,202 ha 0.7
Level 2 significance
11.1 ha 714 ha 1.6
Ecological linkage areas
39.0 ha 319 ha 12.2
Table 1 Amount of vegetation cleared in each of the three categories of significance.
Terrestrial biodiversity
4.5
215State of the environment and biodiversity - Terrestrial biodiversity
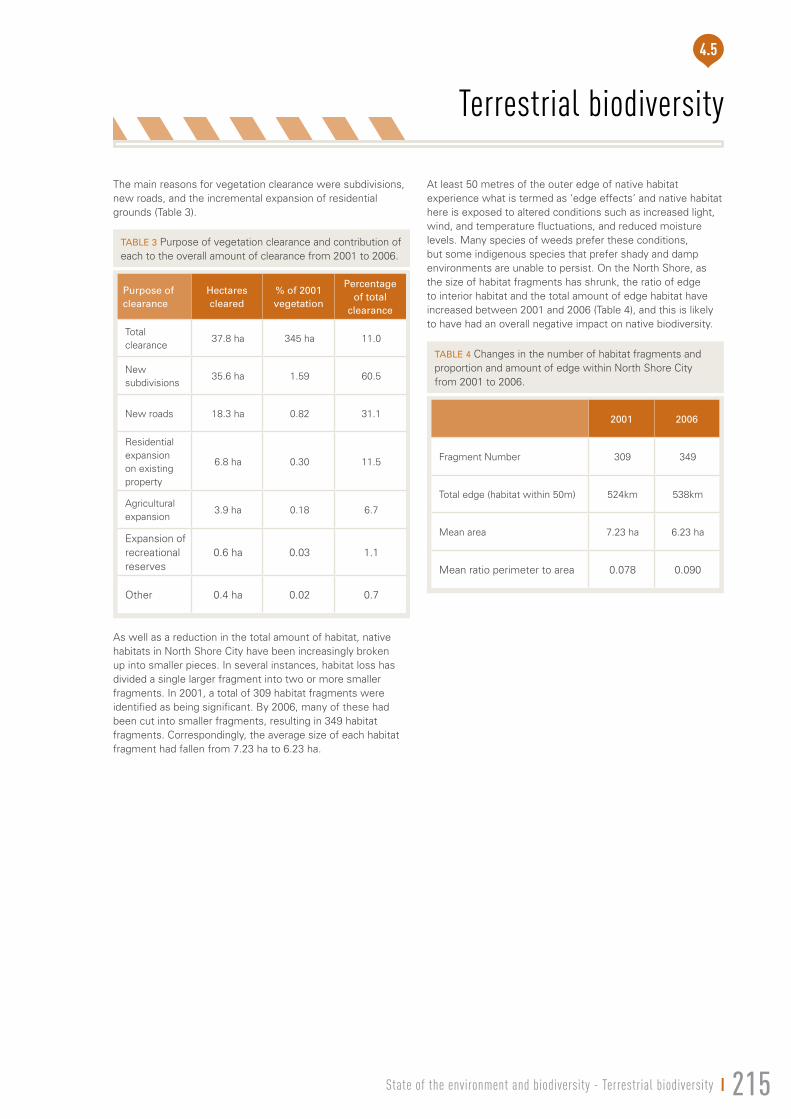
The main reasons for vegetation clearance were subdivisions, new roads, and the incremental expansion of residential grounds (Table 3).
As well as a reduction in the total amount of habitat, native habitats in North Shore City have been increasingly broken up into smaller pieces. In several instances, habitat loss has divided a single larger fragment into two or more smaller fragments. In 2001, a total of 309 habitat fragments were identified as being significant. By 2006, many of these had been cut into smaller fragments, resulting in 349 habitat fragments. Correspondingly, the average size of each habitat fragment had fallen from 7.23 ha to 6.23 ha.
At least 50 metres of the outer edge of native habitat experience what is termed as ‘edge effects’ and native habitat here is exposed to altered conditions such as increased light, wind, and temperature fluctuations, and reduced moisture levels. Many species of weeds prefer these conditions, but some indigenous species that prefer shady and damp environments are unable to persist. On the North Shore, as the size of habitat fragments has shrunk, the ratio of edge to interior habitat and the total amount of edge habitat have increased between 2001 and 2006 (Table 4), and this is likely to have had an overall negative impact on native biodiversity.
Purpose of clearance
Hectares cleared
% of 2001 vegetation
Percentage of total
clearance
Total clearance
37.8 ha 345 ha 11.0
New subdivisions
35.6 ha 1.59 60.5
New roads 18.3 ha 0.82 31.1
Residential expansion on existing property
6.8 ha 0.30 11.5
Agricultural expansion
3.9 ha 0.18 6.7
Expansion of recreational reserves
0.6 ha 0.03 1.1
Other 0.4 ha 0.02 0.7
Table 3 Purpose of vegetation clearance and contribution of each to the overall amount of clearance from 2001 to 2006.
2001 2006
Fragment Number 309 349
Total edge (habitat within 50m) 524km 538km
Mean area 7.23 ha 6.23 ha
Mean ratio perimeter to area 0.078 0.090
Table 4 Changes in the number of habitat fragments and proportion and amount of edge within North Shore City from 2001 to 2006.
Terrestrial biodiversity
216
4.5
State of the environment and biodiversity - Terrestrial biodiversity
References and further readingAnderson, S.H., 2003. The relative importance of birds and insects as pollinators of the New Zealand flora. New Zealand Journal of Ecology 27(2): 83–94.
Beever, R.E., Waipara, N.W., Gadgil, P.D., Ramsfield, T.D., Dick, M.A., Horner, I.J., 2009. Kauri (Agathis australis) under threat from Phytophthora? Phytophthoras in forests and natural ecosystems: proceedings of the fourth meeting of the international union of forest research organizations (IUFRO) working party S07.02.09. U.S. Department of Agriculture, Forest Service General Technical Report PSW-GTR-221. Available from http://www.fs.fed.us/psw/publications/documents/psw_gtr221/
Beggs, J., 2001. The ecological consequences of social wasps (Vespula). Biological Conservation 99 (11): 17–28.
Brockerhoff, E.G., Shaw, W.B., Hock, B., Kimberley, M., Paul, T., Quinn, J., Pawson, S., 2008. Re-examination of recent lossof indigenous cover in New Zealand and the relative contributions of different land uses. New Zealand Journal of Ecology 32(1):115–126.
Department of Conservation and Ministry for the Environment, (2000). New Zealand’s biodiversity strategy: our chance to turn the tide.
Dowding, J. E. and Murphy, E. C., 2001. The impact of predation by introduced mammals on endemic shorebirds in New Zealand: a conservation perspective. Biological Conservation 99: 47–64.
Ewers, R.M., Kliskey, A.D., Walker, S., Rutledge, D., Harding J.S., Didhael, R.K., 2006. Past and future trajectories of forest loss in New Zealand. Biological Conservation 133: 312–325.
Hitchmough, R., Bull, L., Cromarty, P., 2007. New Zealand threat classification systems list (2005). Science and Technical Publishing Unit, Department of Conservation.
Howell, C.J. and Sawyer, J.W.D., 2006. New Zealand naturalised vascular plant checklist. New Zealand Plant Network report.
Lindsay, H., Wild, C., Byers, S., 2009. Auckland Protection Strategy: a report to the Nature Heritage Fund Committee. Nature Heritage Fund.
Marshall, L., 2009. Ecological assessments of high conservation value sites in the Auckland region. Auckland Regional Council Draft Technical Report.
Molloy J., Bell, B., Clout, M., de Lange, P., Gibbs, G., Given, D., Norton, D., Smith, N., Stephens, T., 2002. Classifying species according to threat of extinction: a system for New Zealand. Department of Conservation Threatened Species Occasional Publication 22.
Stanley, R., de Lange, P., Cameron, E., 2005. Auckland regional threatened and uncommon vascular plant list. Auckland Botanical Society Journal 60: 152–157.
Williams, J.A. and West, C.J., 2000. Environmental weeds in Australia and New Zealand: issues and approaches to management. Austral Ecology 25: 425–444.
Terrestrial biodiversity
4.5
217State of the environment and biodiversity - Terrestrial biodiversity
Recommended