The Changing Face of Commercial Officesin India
� On Point • The Changing Face of Commercial Offices in India
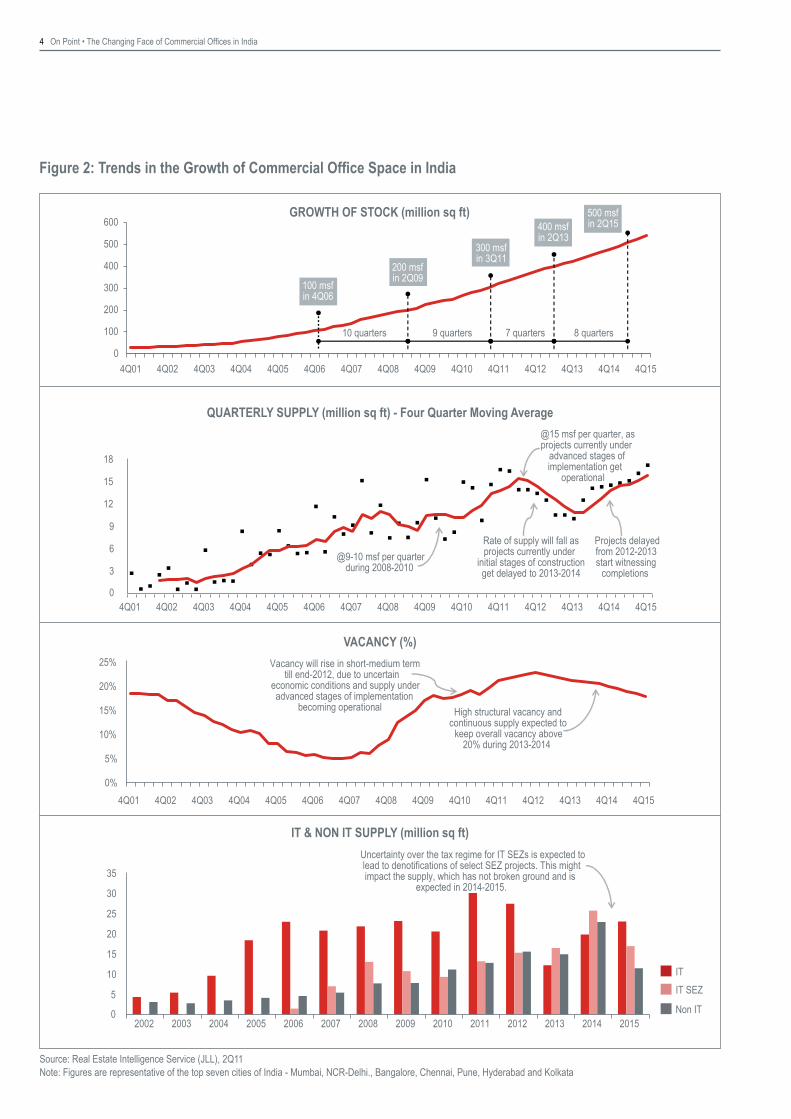
Since 1991, reforms of the erstwhile protectionist policies have propelled the liberalised Indian economy to greater heights through increasing foreign direct investments and rapidly expanding capital markets. The Indian economy has grown at a rate of 8-9% each year during 2003-2010, and is currently the fourth largest in the world in Purchasing Power Parity (PPP) terms. In this rapidly growing economy, a diverse typology of firms – large or small, domestic or foreign, have started or expanded operations. Several cities and locations have emerged, with growth in infrastructure and office spaces to cater to these firms. As a result, the Indian investment grade office market has become one of the fastest growing real estate destinations in the world, with over 265 million sq ft of operational space in 2010 and slated to nearly double in five years to reach 540 million sq ft by end-2015. After reaching the 100 million sq ft mark in 4Q06, the next 100 million sq ft of office space became operational within a span of just 2.5 years in 2Q09, and the total stock is expected to cross 300 million sq ft in 3Q11 (Figure 2).
People spend a third or more of their lives in offices or other places of work. Unsurprisingly, the focus to have better and efficient workplaces, which ensure safety, security and productivity, has been a keystone of real estate development globally.
In this research whitepaper, we illustrate the trends in the growth of commercial office space in India during the last decade and the occupiers that work in them. The paper then proceeds to recommend the strategy for office occupiers in the coming years.
SuburbanisationTill 1990s, offices in India were largely limited to the central business districts of various cities, functioning primarily as the central node where most of the commercial activities of the city took place. With limited population living in high densities around the central core, the setup was feasible with workers commuting to the central workplace daily. However, heightened migration in the last couple of decades due to increased commercial activity, along with a saturated urban core, has resulted in development of satellite and suburban nodes. Improvements in intra-city infrastructure and connectivity have facilitated the growth and acceptance of these peripheral locations. It has led to the development of large, world-class office spaces, which despite being located away from city
centres, provide a safe, secure and productive workplace. By 2015, 61% of office space in India will be located in the suburbs.
Rising Structural VacancyOffice vacancy in India has grown from 5.1% recorded in 2Q07 to 18.2% in 2Q11, due to the supply overhang over demand remaining through most of the quarters (Figure 2). While decline in demand from tenants during the economic slowdown in 2008-2009 is a factor, the rise in vacancy is also contributed by the increase in structural vacancy in the market. The increase in structural vacancy in a rapidly growing market is a result of a mismatch between the attributes and location of space offered by landlords against what is sought by tenants, which causes the space to remain vacant for a long duration, i.e. 3-4 years with diminished prospects of future occupancy. In several office markets, natural vacancy is rising, as tenants polarise their preferences towards select quality office properties, while rejecting others. Hence, despite the current headline vacancy of 18.2%, the effective average vacancy is lower in projects that are sought after by tenants.
Specialised Campuses and Built-to-Suit OptionsWith Government of India promoting software exports through Software Technology Parks of India (STPI) and Special Economic Zones (SEZ), the office sector witnessed a slew of office campuses and Built-to-Suit (BTS) Options being built, targeted at the expanding IT/ITES sector. As of 2Q11, nearly three-fourths of the operational office space in India is built for the IT/ITES sector, and by end-2015 this share is forecasted to remain the same. With power, connectivity and security specifications built-in to support IT/ITES firms, these campuses have dotted the suburban locations, providing state-of-the-art infrastructure and amenities to their tenants.
Professionalism and TransparencyIn 1968, Government of India encouraged collaboration with foreign architects and consultants in the construction industry through Guidelines for Foreign Collaboration, which stated that a local consultant would be the prime contractor in such collaborations. India accepted the World Trade Organisation’s General Agreement in Trade and Services (GATS) after the Uruguay round in 1995, which further opened the construction services sector for foreign
1 Investment grade office market doesn’t include captive campus developments owned and occupied by corporate firms, but only includes the rental office real estate developments either on lease or available for leasing in the market.� Figures on real estate quoted in the report are representative of seven cities – Mumbai, NCR-Delhi., Bangalore, Chennai, Pune, Hyderabad and Kolkata, unless otherwise mentioned specifically.
The Changing Face of Commercial Offices in India
On Point • The Changing Face of Commercial Offices in India 3
players, making it competitive for Indian service providers. As Foreign Direct Investment grew in India, the demand for world-class infrastructure and real estate also gained traction, facilitating the import of construction and design services from abroad. Per estimates by WTO Council for Trade in Services, India was the eleventh highest importer of construction services globally during 2007, with imports valued at USD 691 million. Apart from bringing professionalism and transparency to the sector, the access to global best services has also enabled a better flow of technical know-how and specialised construction techniques among Indian firms and their counterparts in developed economies.
World Class Designs at the Cost of Space EfficiencyOffice architecture in Indian cities has improved significantly during the last decade, in terms of aesthetics, sustainability, scale and amenities that it provides to the occupiers. While there is a growing demand from occupiers towards better and adequate amenities at the workplace, the efficiency of leasable area that is charged to occupiers has reduced considerably. Also, Common Area Maintenance (CAM) Charges have increased considerably, both due to persistent high inflation, as well as better ex-office infrastructure within the campus. The escalating cost of occupancy is a concern especially to IT/ITES occupiers that compete with other nations for outsourcing, and form a backbone of the demand for office space in India.
Growth of the Tier II and Emergence of the Tier III CitiesWhile the initial focus of development were the Tier I cities of Mumbai, NCR-Delhi and Bangalore, office markets in Tier II cities such as Chennai , Pune, Hyderabad and Kolkata have also developed significantly during the last decade. Favourable policies by the Central and the State Governments encouraged the development of IT infrastructure and parks in these cities. With these cities moving towards maturity, the focus is gradually shifting to replicate a similar growth story in Tier III cities, which offer untapped potential in terms of human resources, lower costs and improving infrastructure.
Increasing Employee Density and Alternate Workplace StrategiesIn a bid to reduce occupancy costs, few firms are gradually increasing the employee density at workplaces, challenging the convention of 100 sq ft per person. They are also employing alternate workplace strategies such as work-from-home concepts or employing business centres for flexible expansion within a city. While these are cost-effective measures from the firm’s viewpoint, employees benefit from lesser costs and time spent for commuting to the workplace. However, the balance between reduction in costs and employee productivity is a concern for most Commercial Real Estate managers.
3 If the twenty-seven countries of European Union are held as an aggregate at the top, India ranks eleventh in terms of import of construction services (World Trade Organisation Council for Trade Services – Construction and Related Engineering Services S/C/W/302 published on 18th September, 2009).4 Chennai has been categorised as a Tier I city since 2009.
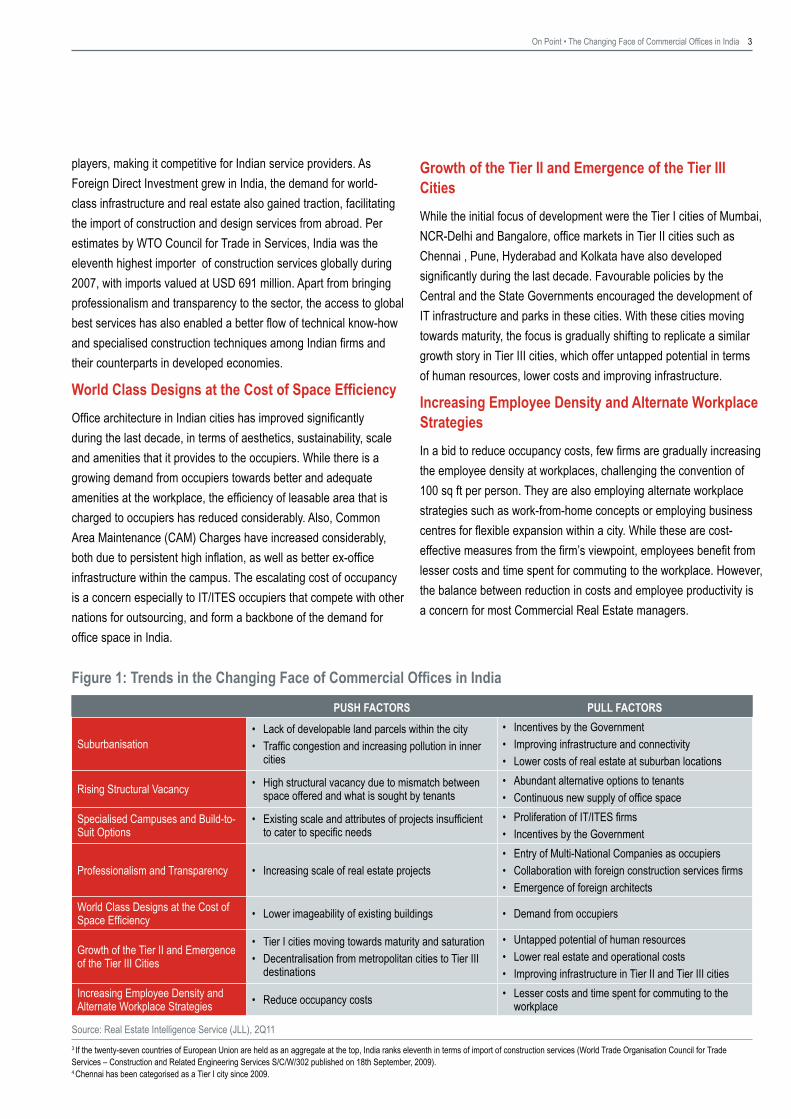
PUSH FACTORS PULL FACTORS
SuburbanisationLack of developable land parcels within the cityTraffic congestion and increasing pollution in inner cities
••
Incentives by the GovernmentImproving infrastructure and connectivityLower costs of real estate at suburban locations
•••
Rising Structural Vacancy High structural vacancy due to mismatch between space offered and what is sought by tenants
• Abundant alternative options to tenantsContinuous new supply of office space
••
Specialised Campuses and Build-to-Suit Options
Existing scale and attributes of projects insufficient to cater to specific needs
• Proliferation of IT/ITES firmsIncentives by the Government
••
Professionalism and Transparency Increasing scale of real estate projects•Entry of Multi-National Companies as occupiersCollaboration with foreign construction services firmsEmergence of foreign architects
•••
World Class Designs at the Cost of Space Efficiency Lower imageability of existing buildings• Demand from occupiers•
Growth of the Tier II and Emergence of the Tier III Cities
Tier I cities moving towards maturity and saturationDecentralisation from metropolitan cities to Tier III destinations
••
Untapped potential of human resourcesLower real estate and operational costsImproving infrastructure in Tier II and Tier III cities
•••
Increasing Employee Density and Alternate Workplace Strategies Reduce occupancy costs• Lesser costs and time spent for commuting to the
workplace•
Figure 1: Trends in the Changing Face of Commercial Offices in India
Source: Real Estate Intelligence Service (JLL), 2Q11
4 On Point • The Changing Face of Commercial Offices in India
Figure 2: Trends in the Growth of Commercial Office Space in India
Source: Real Estate Intelligence Service (JLL), 2Q11Note: Figures are representative of the top seven cities of India - Mumbai, NCR-Delhi., Bangalore, Chennai, Pune, Hyderabad and Kolkata
0%
5%
10%
15%
20%
25%
4Q01 4Q02 4Q03 4Q04 4Q05 4Q06 4Q07 4Q08 4Q09 4Q10 4Q11 4Q12 4Q13 4Q14 4Q15
High structural vacancy and continuous supply expected to
keep overall vacancy above 20% during 2013-2014
Vacancy will rise in short-medium term till end-2012, due to uncertain
economic conditions and supply under advanced stages of implementation
becoming operational
5
0
10
15
�0
�5
30
35
2002 2003 2004 2005 2006 2007 2008 2009 2010 2011 2012 2013 2014 2015
ITIT SEZ
Non IT
Uncertainty over the tax regime for IT SEZs is expected to lead to denotifications of select SEZ projects. This might impact the supply, which has not broken ground and is
expected in 2014-2015.
0
100
200
300
400
500
600
4Q01 4Q02 4Q03 4Q04 4Q05 4Q06 4Q07 4Q08 4Q09 4Q10 4Q11 4Q12 4Q13 4Q14 4Q15
100 msf in 4Q06
200 msf in 2Q0�
300 msf in 3Q11
400 msf in 2Q13
500 msf in 2Q15
10 quarters � quarters 7 quarters 8 quarters
GROWTH OF STOCK (million sq ft)
QUARTERLY SUPPLY (million sq ft) - Four Quarter Moving Average
VACANCY (%)
IT & NON IT SUPPLY (million sq ft)
@15 msf per quarter, as projects currently under
advanced stages ofimplementation get
operational
3
0
6
�
1�
15
18
4Q01 4Q02 4Q03 4Q04 4Q05 4Q06 4Q07 4Q08 4Q09 4Q10 4Q11 4Q12 4Q13 4Q14 4Q15
@9-10 msf per quarter during 2008-2010
Rate of supply will fall as projects currently under
initial stages of construction get delayed to 2013-2014
Projects delayed from 2012-2013 start witnessing
completions
On Point • The Changing Face of Commercial Offices in India 5
To encourage the growth of Indian IT/ITES industry and make it competitive with other outsourcing destinations, several incentives have been provided to IT/ITES firms and real estate developers by the Central and the State Governments. However, there have been some recent policy changes, which will have an impact on both demand and supply of office space in India.
Sunset Over Tax Benefits for Units Under STPI During 2011The tax benefits under Software Technology Parks of India (STPI) through Section 10A and Section 10B of the Income Tax Act ended in March 2011, which directly affects the margins of those IT/ITES firms, which are operating out of STP units. Although demand for IT SEZ projects showed traction in the last couple of quarters, the small-to-mid size firms that have low space requirements and are unwilling to invest the capital expenditure for fit-outs during relocation, shall choose to operate out of STP units, and not relocate to SEZ units. In addition, IT SEZ projects are typically located further away from the city, which increases commute costs and time to employees. The Central Government is considering a new incentive scheme for STP units, to promote IT/ITES development in Tier II and III cities.
Expected Implementation of Direct Taxes Code in 2012The expected implementation of the Direct Taxes Code from April 1, 2012 will make the Minimum Alternate Tax (MAT) and Dividend Distribution Tax (DDT) applicable to Special Economic Zones (SEZs), which will impact the margins for both SEZ developers as well as occupiers. Already, several SEZs have been denotified by developers, citing reasons such as the imminent economic meltdown, poor market response, non-availability of a skilled labour force, lack of demand for IT/ITES space and the imposition of MAT and DDT. We expect more denotifications of SEZ projects which have not broken ground yet or are at initial stages of construction, and this will reduce the office supply in pipeline.
Incentives under Various State IT Policies Expected to ContinueVarious State Governments such as Andhra Pradesh, Karnataka, Maharashtra, Tamil Nadu, Uttar Pradesh (for Noida / Greater Noida) and Haryana, among others provide incentive packages for IT/ITES
industry through the State IT Policies. Some of the incentives provided to the industry are:
1. Preferential allotment of land 2. Single window / desk clearances 3. Relaxation of Floor Space Index (FSI) and Zoning 4. Reduced or exempt Stamp Duty and Registration Charges 5. Reduced or exempt Sales Tax and others.
While exemptions under the Central Tax Regime are likely to come to an end, the incentives provided by the states are expected to continue, as different states compete to attract the IT/ITES firms and developers. Further, it is expected that State Governments will relax the provisions and criteria for occupying these IT projects to enable a diverse mix of occupiers, and reduce the risk of vacancy.
Considering the different policy regimes applicable to Office projects across Indian cities, investment grade office properties in India can be classified under the following categories:
IT
In India, several state governments have encouraged the development of office properties to cater to IT/ITES firms, through multiple incentives such as additional Floor Space Index (FSI), reduced stamp duty and registration, allotment of government land and relaxation in zoning. These buildings, which have been built specifically for the IT/ITES industry have been categorised as “IT” projects. Office properties, which are specifically bonded to STP units under the Software Technology Parks of India (STPI) scheme, are also categorised as “IT” projects.
IT SEZ
Under the provisions of the Special Economic Zones (SEZ) Act 2005, several zones in India have been notified as IT/ITES SEZs. Office properties that have been built within the notified IT/ITES SEZs, have been categorised as “IT SEZ” projects.
Non IT
Other commercial office properties which are neither categorised as IT/ITES nor IT/ITES SEZ have been categorised as “Non IT” projects
The Changing Typology of Commercial Office Properties
6 On Point • The Changing Face of Commercial Offices in India
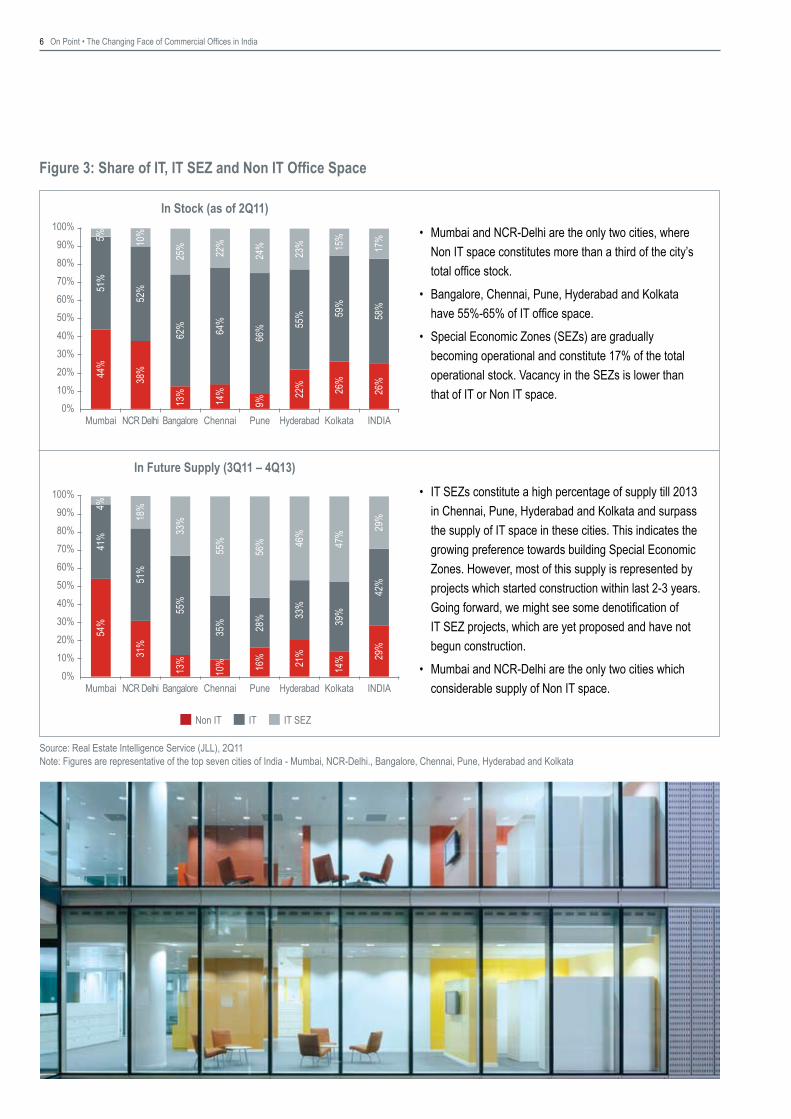
Mumbai and NCR-Delhi are the only two cities, where Non IT space constitutes more than a third of the city’s total office stock.Bangalore, Chennai, Pune, Hyderabad and Kolkata have 55%-65% of IT office space.Special Economic Zones (SEZs) are gradually becoming operational and constitute 17% of the total operational stock. Vacancy in the SEZs is lower than that of IT or Non IT space.
•
•
•
IT SEZs constitute a high percentage of supply till 2013 in Chennai, Pune, Hyderabad and Kolkata and surpass the supply of IT space in these cities. This indicates the growing preference towards building Special Economic Zones. However, most of this supply is represented by projects which started construction within last 2-3 years. Going forward, we might see some denotification of IT SEZ projects, which are yet proposed and have not begun construction.Mumbai and NCR-Delhi are the only two cities which considerable supply of Non IT space.
•
•
Figure 3: Share of IT, IT SEZ and Non IT Office Space
Source: Real Estate Intelligence Service (JLL), 2Q11Note: Figures are representative of the top seven cities of India - Mumbai, NCR-Delhi., Bangalore, Chennai, Pune, Hyderabad and Kolkata
100%
0%10%20%30%40%50%60%70%80%90%
Mumbai NCR Delhi Chennai Pune Hyderabad Kolkata INDIABangalore
62% 64%
66% 55
% 59%
58%
52%51
%
10%5%
25% 22%
24%
23% 15
%
17%
44%
38%
13%
14%
9%
22% 26%
26%
100%
0%10%20%30%40%50%60%70%80%90%
Mumbai NCR Delhi Chennai Pune Hyderabad Kolkata INDIABangalore
55%
35% 28% 33
%
39%
42%51
%
41%
18%4%
33%
55%
56% 46
%
47% 29
%
54%
31%
13%
10% 16
% 21%
14% 29
%
IT IT SEZNon IT
In Stock (as of 2Q11)
In Future Supply (3Q11 – 4Q13)
On Point • The Changing Face of Commercial Offices in India 7
The Changing Face of Commercial Office Occupiers in India
Since the advent of modern day offices in India, the Indian occupier is constantly metamorphosing itself to adapt to rapidly changing business environment. In this section, we examine the trends observed in the constantly changing occupier behaviour - their preferences and their origins, which affects the absorption and eventually, supply of office space.
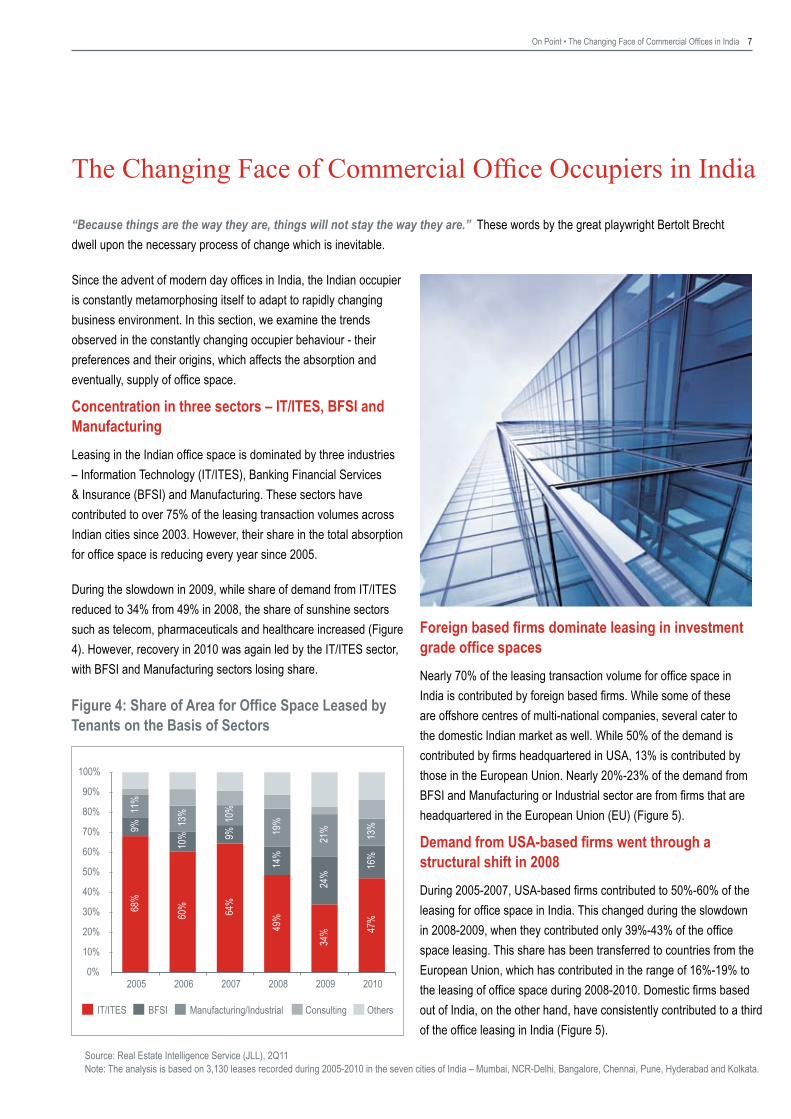
Concentration in three sectors – IT/ITES, BFSI and ManufacturingLeasing in the Indian office space is dominated by three industries – Information Technology (IT/ITES), Banking Financial Services & Insurance (BFSI) and Manufacturing. These sectors have contributed to over 75% of the leasing transaction volumes across Indian cities since 2003. However, their share in the total absorption for office space is reducing every year since 2005.
During the slowdown in 2009, while share of demand from IT/ITES reduced to 34% from 49% in 2008, the share of sunshine sectors such as telecom, pharmaceuticals and healthcare increased (Figure 4). However, recovery in 2010 was again led by the IT/ITES sector, with BFSI and Manufacturing sectors losing share.
Figure 4: Share of Area for Office Space Leased by Tenants on the Basis of Sectors
Source: Real Estate Intelligence Service (JLL), 2Q11Note: The analysis is based on 3,130 leases recorded during 2005-2010 in the seven cities of India – Mumbai, NCR-Delhi, Bangalore, Chennai, Pune, Hyderabad and Kolkata.
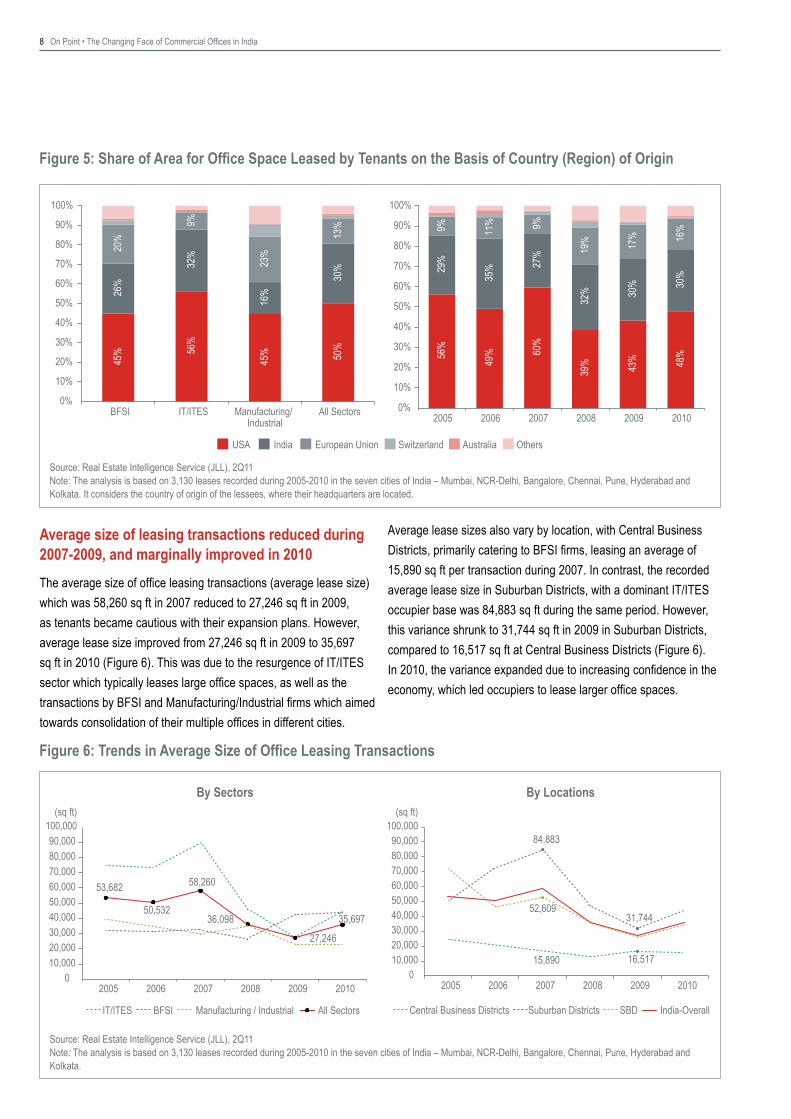
Foreign based firms dominate leasing in investment grade office spacesNearly 70% of the leasing transaction volume for office space in India is contributed by foreign based firms. While some of these are offshore centres of multi-national companies, several cater to the domestic Indian market as well. While 50% of the demand is contributed by firms headquartered in USA, 13% is contributed by those in the European Union. Nearly 20%-23% of the demand from BFSI and Manufacturing or Industrial sector are from firms that are headquartered in the European Union (EU) (Figure 5).
Demand from USA-based firms went through a structural shift in 2008During 2005-2007, USA-based firms contributed to 50%-60% of the leasing for office space in India. This changed during the slowdown in 2008-2009, when they contributed only 39%-43% of the office space leasing. This share has been transferred to countries from the European Union, which has contributed in the range of 16%-19% to the leasing of office space during 2008-2010. Domestic firms based out of India, on the other hand, have consistently contributed to a third of the office leasing in India (Figure 5).
“Because things are the way they are, things will not stay the way they are.” These words by the great playwright Bertolt Brecht dwell upon the necessary process of change which is inevitable.
IT/ITES BFSI Manufacturing/Industrial Consulting Others
68%
60% 64%
49%
34% 47
%
9%
10% 9%
14%
24%
16%
11%
13% 10%
1�%
�1% 13%
0%
10%
20%
30%
40%
50%
60%
70%
80%
90%
100%
2005 2006 2007 2008 2009 2010
8 On Point • The Changing Face of Commercial Offices in India
Figure 5: Share of Area for Office Space Leased by Tenants on the Basis of Country (Region) of Origin
Source: Real Estate Intelligence Service (JLL), 2Q11Note: The analysis is based on 3,130 leases recorded during 2005-2010 in the seven cities of India – Mumbai, NCR-Delhi, Bangalore, Chennai, Pune, Hyderabad and Kolkata. It considers the country of origin of the lessees, where their headquarters are located.
Average size of leasing transactions reduced during 2007-2009, and marginally improved in 2010The average size of office leasing transactions (average lease size) which was 58,260 sq ft in 2007 reduced to 27,246 sq ft in 2009, as tenants became cautious with their expansion plans. However, average lease size improved from 27,246 sq ft in 2009 to 35,697 sq ft in 2010 (Figure 6). This was due to the resurgence of IT/ITES sector which typically leases large office spaces, as well as the transactions by BFSI and Manufacturing/Industrial firms which aimed towards consolidation of their multiple offices in different cities.
Average lease sizes also vary by location, with Central Business Districts, primarily catering to BFSI firms, leasing an average of 15,890 sq ft per transaction during 2007. In contrast, the recorded average lease size in Suburban Districts, with a dominant IT/ITES occupier base was 84,883 sq ft during the same period. However, this variance shrunk to 31,744 sq ft in 2009 in Suburban Districts, compared to 16,517 sq ft at Central Business Districts (Figure 6). In 2010, the variance expanded due to increasing confidence in the economy, which led occupiers to lease larger office spaces.
Figure 6: Trends in Average Size of Office Leasing Transactions
Source: Real Estate Intelligence Service (JLL), 2Q11Note: The analysis is based on 3,130 leases recorded during 2005-2010 in the seven cities of India – Mumbai, NCR-Delhi, Bangalore, Chennai, Pune, Hyderabad and Kolkata.
By Sectors By Locations
45% 56
%
45% 50
%
26%
32%
16%
30%
20%
9%
23%
13%
0%
10%
20%
30%
40%
50%
60%
70%
80%
90%
100%
BFSI IT/ITES Manufacturing/Industrial
All Sectors
56%
49% 60
%
39% 43% 48%
��%
35% 27
%
32% 30
% 30%
9% 11% 9%
1�% 17% 16
%
0%
10%
20%
30%
40%
50%
60%
70%
80%
90%
100%
2005 2006 2007 2008 2009 2010
USA India European Union Switzerland Australia Others
58,260
27,246
35,697
53,682
50,53236,098
010,00020,00030,00040,00050,00060,00070,00080,00090,000
100,000
2005 2006 2007 2008 2009 2010
(sq ft)
IT/ITES BFSI Manufacturing / Industrial All Sectors
16,51715,890
52,60931,744
84,883
010,00020,00030,00040,00050,00060,00070,00080,00090,000
100,000
2005 2006 2007 2008 2009 2010
(sq ft)
Central Business Districts India-OverallSBDSuburban Districts
On Point • The Changing Face of Commercial Offices in India �
MUMB
AI
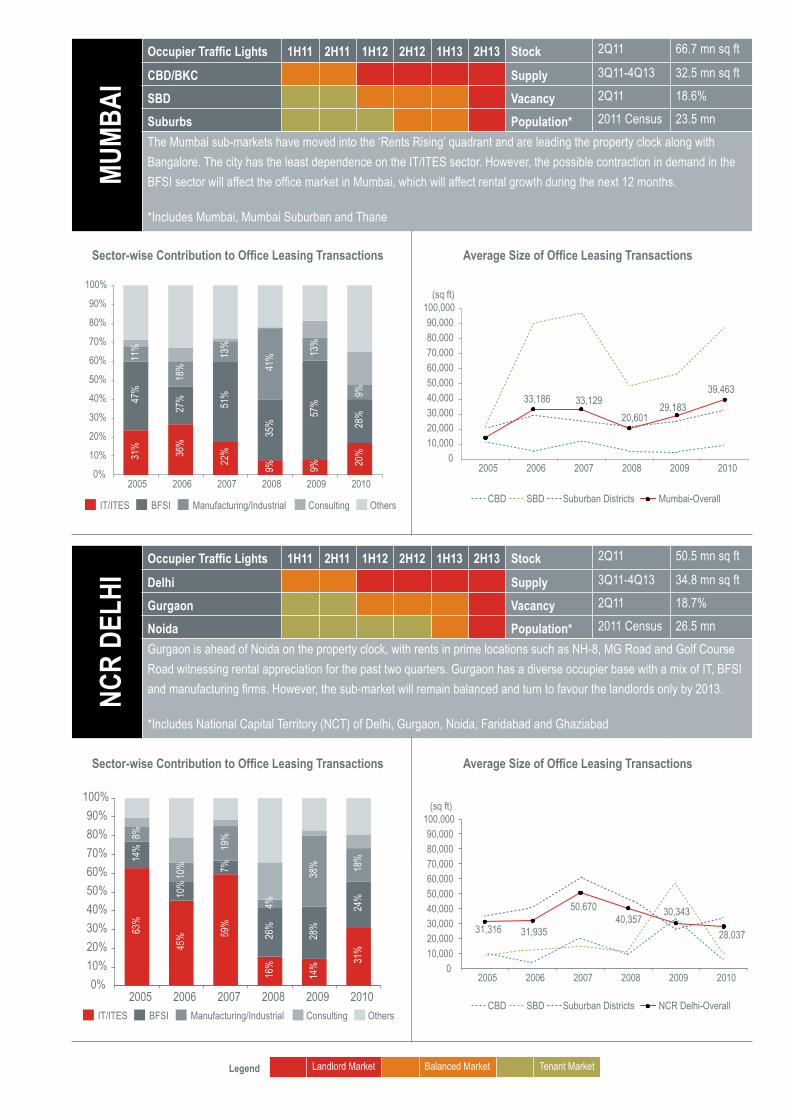
Occupier Traffic Lights 1H11 2H11 1H12 2H12 1H13 2H13 Stock 2Q11 66.7 mn sq ft
CBD/BKC Supply 3Q11-4Q13 32.5 mn sq ft
SBD Vacancy 2Q11 18.6%
Suburbs Population* 2011 Census 23.5 mnThe Mumbai sub-markets have moved into the ‘Rents Rising’ quadrant and are leading the property clock along with Bangalore. The city has the least dependence on the IT/ITES sector. However, the possible contraction in demand in the BFSI sector will affect the office market in Mumbai, which will affect rental growth during the next 12 months.
*Includes Mumbai, Mumbai Suburban and Thane
Sector-wise Contribution to Office Leasing Transactions Average Size of Office Leasing Transactions
Sector-wise Contribution to Office Leasing Transactions Average Size of Office Leasing Transactions
NCR
DELH
I Occupier Traffic Lights 1H11 2H11 1H12 2H12 1H13 2H13 Stock 2Q11 50.5 mn sq ft
Delhi Supply 3Q11-4Q13 34.8 mn sq ft
Gurgaon Vacancy 2Q11 18.7%
Noida Population* 2011 Census 26.5 mnGurgaon is ahead of Noida on the property clock, with rents in prime locations such as NH-8, MG Road and Golf Course Road witnessing rental appreciation for the past two quarters. Gurgaon has a diverse occupier base with a mix of IT, BFSI and manufacturing firms. However, the sub-market will remain balanced and turn to favour the landlords only by 2013.
*Includes National Capital Territory (NCT) of Delhi, Gurgaon, Noida, Faridabad and Ghaziabad
IT/ITES BFSI Manufacturing/Industrial Consulting Others
31% 36%
��%
9% 9% 20%
47%
27% 51%
35%
57%
28%
11%
18%
13%
41% 13
%
9%
0%
10%
20%
30%
40%
50%
60%
70%
80%
90%
100%
2005 2006 2007 2008 200� �010CBD Mumbai-OverallSBD Suburban Districts
33,12920,601
29,18339,463
33,186
010,00020,00030,00040,00050,00060,00070,00080,00090,000
100,000
2005 2006 2007 2008 2009 2010
(sq ft)
CBD NCR Delhi-OverallSBD Suburban Districts
50,67040,357
28,037
30,34331,316 31,935
2005 2006 2007 2008 2009 20100
10,00020,00030,00040,00050,00060,00070,00080,00090,000
100,000(sq ft)
IT/ITES BFSI Manufacturing/Industrial Consulting Others
63%
45% 59
%
16%
14% 31
%
14%
10%
7%
26%
28%
24%
8%
10%
19%
4%
38% 18
%
0%10%20%30%40%50%60%70%80%90%
100%
2005 2006 2007 2008 2009 2010
Legend Landlord Market Balanced Market Tenant Market
10 On Point • The Changing Face of Commercial Offices in India
Sector-wise Contribution to Office Leasing Transactions Average Size of Office Leasing Transactions
CHEN
NAI
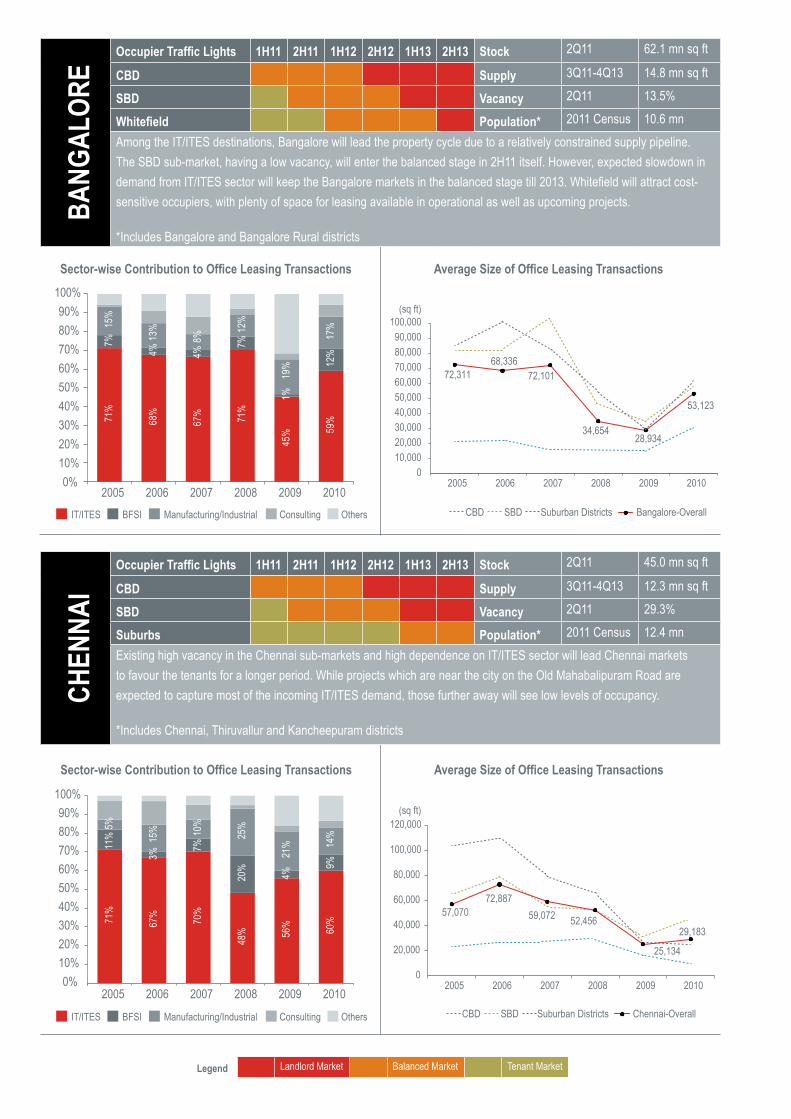
Occupier Traffic Lights 1H11 2H11 1H12 2H12 1H13 2H13 Stock 2Q11 45.0 mn sq ft
CBD Supply 3Q11-4Q13 12.3 mn sq ft
SBD Vacancy 2Q11 29.3%
Suburbs Population* 2011 Census 12.4 mnExisting high vacancy in the Chennai sub-markets and high dependence on IT/ITES sector will lead Chennai markets to favour the tenants for a longer period. While projects which are near the city on the Old Mahabalipuram Road are expected to capture most of the incoming IT/ITES demand, those further away will see low levels of occupancy.
*Includes Chennai, Thiruvallur and Kancheepuram districts
CBD Chennai-OverallSBD Suburban Districts
29,18359,072 52,456
25,134
57,07072,887
0
20,000
40,000
60,000
80,000
100,000
120,000
2005 2006 2007 2008 2009 2010
(sq ft)
IT/ITES BFSI Manufacturing/Industrial Consulting Others
71%
67% 70%
48% 56
% 60%
11%
3%
7%
20%
4%
9%
5%
15% 10
%
25%
�1% 14
%
0%10%20%30%40%50%60%70%80%90%
100%
2005 2006 2007 2008 2009 2010
Sector-wise Contribution to Office Leasing Transactions Average Size of Office Leasing Transactions
BANG
ALOR
EOccupier Traffic Lights 1H11 2H11 1H12 2H12 1H13 2H13 Stock 2Q11 62.1 mn sq ft
CBD Supply 3Q11-4Q13 14.8 mn sq ft
SBD Vacancy 2Q11 13.5%
Whitefield Population* 2011 Census 10.6 mnAmong the IT/ITES destinations, Bangalore will lead the property cycle due to a relatively constrained supply pipeline. The SBD sub-market, having a low vacancy, will enter the balanced stage in 2H11 itself. However, expected slowdown in demand from IT/ITES sector will keep the Bangalore markets in the balanced stage till 2013. Whitefield will attract cost-sensitive occupiers, with plenty of space for leasing available in operational as well as upcoming projects.
*Includes Bangalore and Bangalore Rural districts
CBD Bangalore-OverallSBD Suburban Districts
53,123
72,101
34,65428,934
72,31168,336
010,00020,00030,00040,00050,00060,00070,00080,00090,000
100,000
2005 2006 2007 2008 2009 2010
(sq ft)
IT/ITES BFSI Manufacturing/Industrial Consulting Others
71%
68%
67% 71%
45% 59
%
7%
4% 4%
7%
1%
1�%
15%
13%
8%
1�%
1�%
17%
0%10%20%30%40%50%60%70%80%90%
100%
2005 2006 2007 2008 2009 2010
Legend Landlord Market Balanced Market Tenant Market
On Point • The Changing Face of Commercial Offices in India 11
Sector-wise Contribution to Office Leasing Transactions Average Size of Office Leasing Transactions
HYDE
RABA
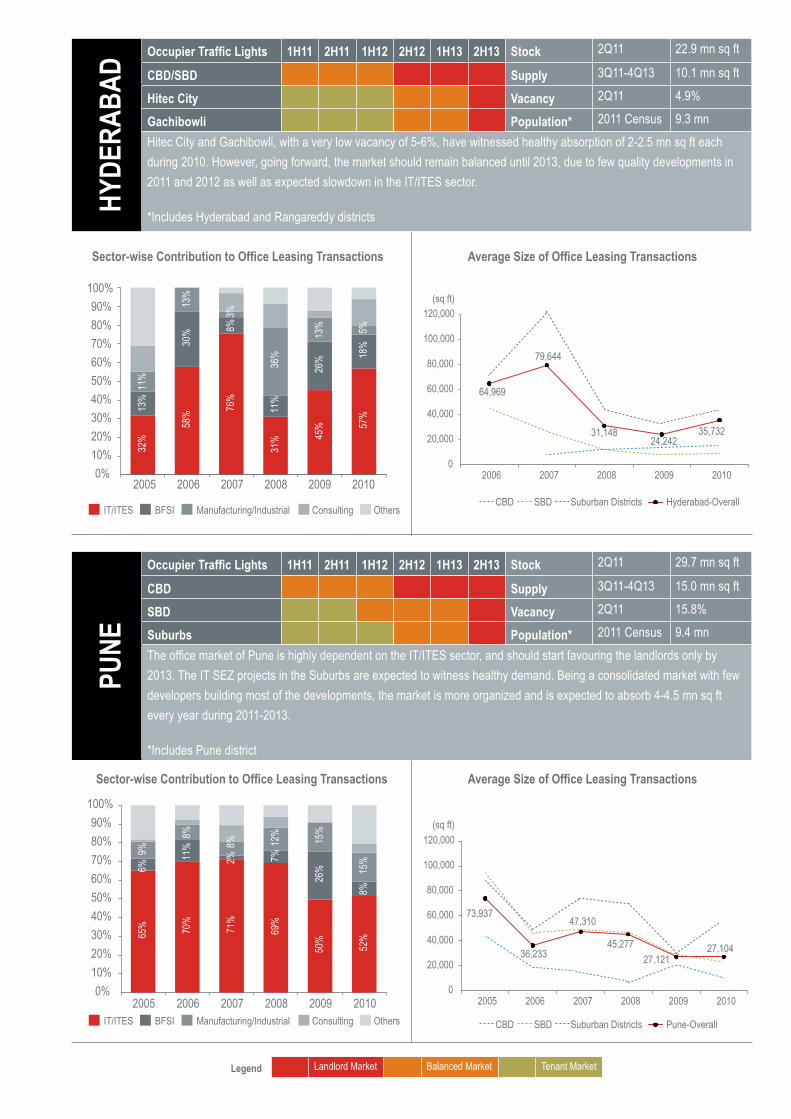
D Occupier Traffic Lights 1H11 2H11 1H12 2H12 1H13 2H13 Stock 2Q11 22.9 mn sq ft
CBD/SBD Supply 3Q11-4Q13 10.1 mn sq ft
Hitec City Vacancy 2Q11 4.9%
Gachibowli Population* 2011 Census 9.3 mnHitec City and Gachibowli, with a very low vacancy of 5-6%, have witnessed healthy absorption of 2-2.5 mn sq ft each during 2010. However, going forward, the market should remain balanced until 2013, due to few quality developments in 2011 and 2012 as well as expected slowdown in the IT/ITES sector.
*Includes Hyderabad and Rangareddy districts
IT/ITES BFSI Manufacturing/Industrial Consulting Others
32%
58% 76
%
31% 45
% 57%13
%
30% 8%
11%
26% 18
%
11%
13%
3%
36%
13% 5%
0%10%20%30%40%50%60%70%80%90%
100%
2005 2006 2007 2008 2009 2010CBD Hyderabad-OverallSBD Suburban Districts
79,644
64,969
35,73224,242
31,148
0
20,000
40,000
60,000
80,000
100,000
120,000
2006 2007 2008 2009 2010
(sq ft)
Sector-wise Contribution to Office Leasing Transactions Average Size of Office Leasing Transactions
PUNE
Occupier Traffic Lights 1H11 2H11 1H12 2H12 1H13 2H13 Stock 2Q11 29.7 mn sq ft
CBD Supply 3Q11-4Q13 15.0 mn sq ft
SBD Vacancy 2Q11 15.8%
Suburbs Population* 2011 Census 9.4 mnThe office market of Pune is highly dependent on the IT/ITES sector, and should start favouring the landlords only by 2013. The IT SEZ projects in the Suburbs are expected to witness healthy demand. Being a consolidated market with few developers building most of the developments, the market is more organized and is expected to absorb 4-4.5 mn sq ft every year during 2011-2013.
*Includes Pune district
IT/ITES BFSI Manufacturing/Industrial Consulting Others
65% 70%
71%
69%
50%
52%
6%
11%
2% 7%
26%
8%
�%
8%
8% 1�% 15%
15%
0%10%20%30%40%50%60%70%80%90%
100%
2005 2006 2007 2008 2009 2010CBD Pune-OverallSBD Suburban Districts
27,10436,233
73,937
27,12145,277
47,310
2005 2006 2007 2008 2009 20100
20,000
40,000
60,000
80,000
100,000
120,000(sq ft)
Legend Landlord Market Balanced Market Tenant Market
1� On Point • The Changing Face of Commercial Offices in India
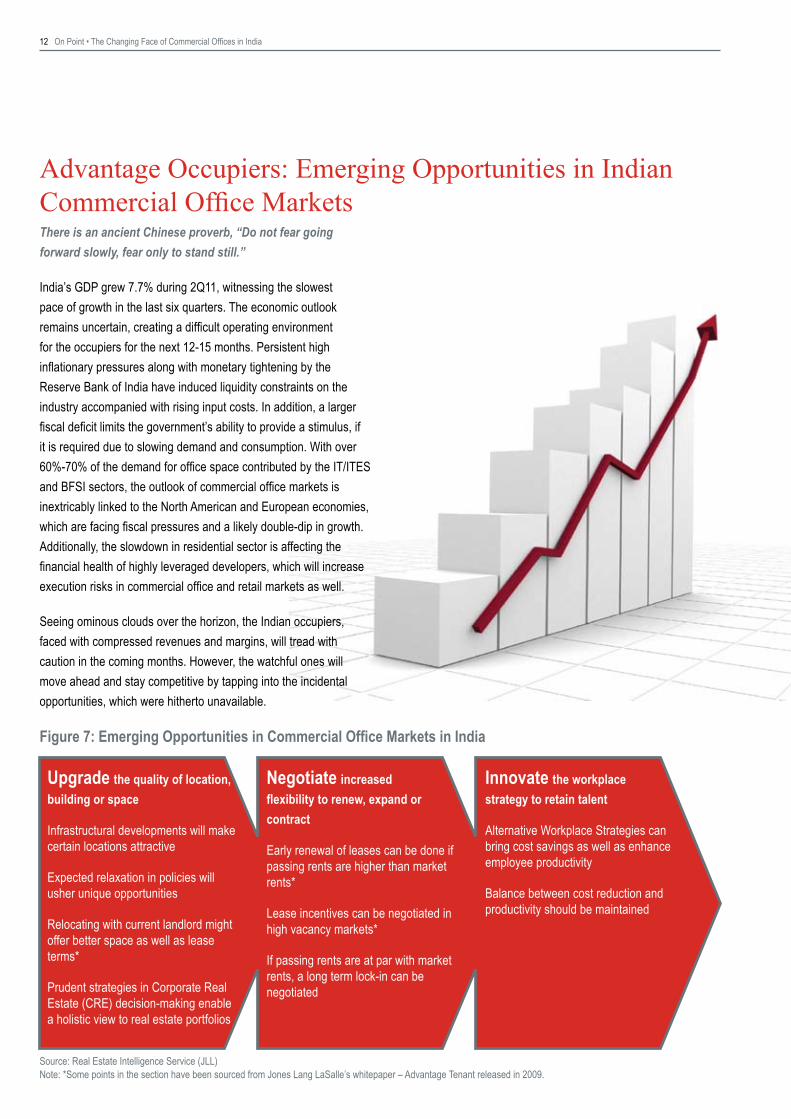
Advantage Occupiers: Emerging Opportunities in Indian Commercial Office MarketsThere is an ancient Chinese proverb, “Do not fear going forward slowly, fear only to stand still.”
India’s GDP grew 7.7% during 2Q11, witnessing the slowest pace of growth in the last six quarters. The economic outlook remains uncertain, creating a difficult operating environment for the occupiers for the next 12-15 months. Persistent high inflationary pressures along with monetary tightening by the Reserve Bank of India have induced liquidity constraints on the industry accompanied with rising input costs. In addition, a larger fiscal deficit limits the government’s ability to provide a stimulus, if it is required due to slowing demand and consumption. With over 60%-70% of the demand for office space contributed by the IT/ITES and BFSI sectors, the outlook of commercial office markets is inextricably linked to the North American and European economies, which are facing fiscal pressures and a likely double-dip in growth. Additionally, the slowdown in residential sector is affecting the financial health of highly leveraged developers, which will increase execution risks in commercial office and retail markets as well.
Seeing ominous clouds over the horizon, the Indian occupiers, faced with compressed revenues and margins, will tread with caution in the coming months. However, the watchful ones will move ahead and stay competitive by tapping into the incidental opportunities, which were hitherto unavailable.
Figure 7: Emerging Opportunities in Commercial Office Markets in India
Source: Real Estate Intelligence Service (JLL)Note: *Some points in the section have been sourced from Jones Lang LaSalle’s whitepaper – Advantage Tenant released in 2009.
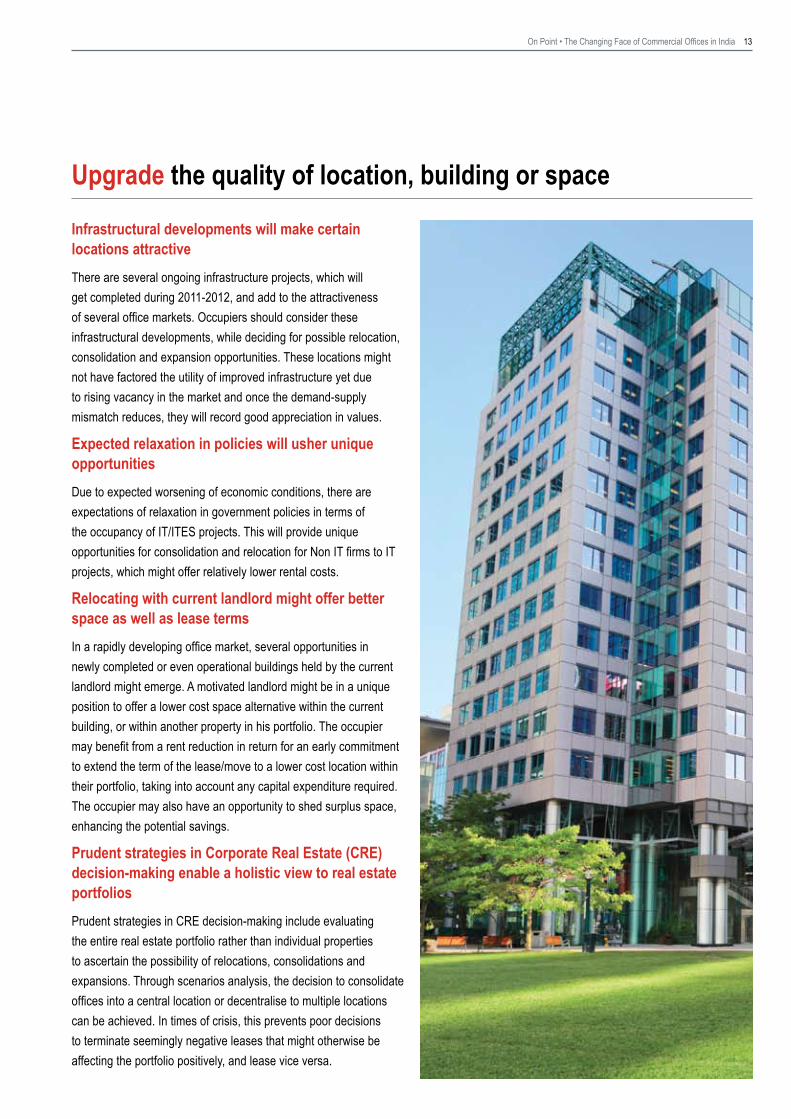
Upgrade the quality of location, building or space
Infrastructural developments will make certain locations attractive
Expected relaxation in policies will usher unique opportunities
Relocating with current landlord might offer better space as well as lease terms*
Prudent strategies in Corporate Real Estate (CRE) decision-making enable a holistic view to real estate portfolios
Negotiate increased flexibility to renew, expand or contract
Early renewal of leases can be done if passing rents are higher than market rents*
Lease incentives can be negotiated in high vacancy markets*
If passing rents are at par with market rents, a long term lock-in can be negotiated
Innovate the workplace strategy to retain talent
Alternative Workplace Strategies can bring cost savings as well as enhance employee productivity
Balance between cost reduction and productivity should be maintained
On Point • The Changing Face of Commercial Offices in India 13
Infrastructural developments will make certain locations attractiveThere are several ongoing infrastructure projects, which will get completed during 2011-2012, and add to the attractiveness of several office markets. Occupiers should consider these infrastructural developments, while deciding for possible relocation, consolidation and expansion opportunities. These locations might not have factored the utility of improved infrastructure yet due to rising vacancy in the market and once the demand-supply mismatch reduces, they will record good appreciation in values.
Expected relaxation in policies will usher unique opportunitiesDue to expected worsening of economic conditions, there are expectations of relaxation in government policies in terms of the occupancy of IT/ITES projects. This will provide unique opportunities for consolidation and relocation for Non IT firms to IT projects, which might offer relatively lower rental costs.
Relocating with current landlord might offer better space as well as lease termsIn a rapidly developing office market, several opportunities in newly completed or even operational buildings held by the current landlord might emerge. A motivated landlord might be in a unique position to offer a lower cost space alternative within the current building, or within another property in his portfolio. The occupier may benefit from a rent reduction in return for an early commitment to extend the term of the lease/move to a lower cost location within their portfolio, taking into account any capital expenditure required. The occupier may also have an opportunity to shed surplus space, enhancing the potential savings.
Prudent strategies in Corporate Real Estate (CRE) decision-making enable a holistic view to real estate portfoliosPrudent strategies in CRE decision-making include evaluating the entire real estate portfolio rather than individual properties to ascertain the possibility of relocations, consolidations and expansions. Through scenarios analysis, the decision to consolidate offices into a central location or decentralise to multiple locations can be achieved. In times of crisis, this prevents poor decisions to terminate seemingly negative leases that might otherwise be affecting the portfolio positively, and lease vice versa.
Upgrade the quality of location, building or space
14 On Point • The Changing Face of Commercial Offices in India
Negotiate increased flexibility to renew, expand or contract
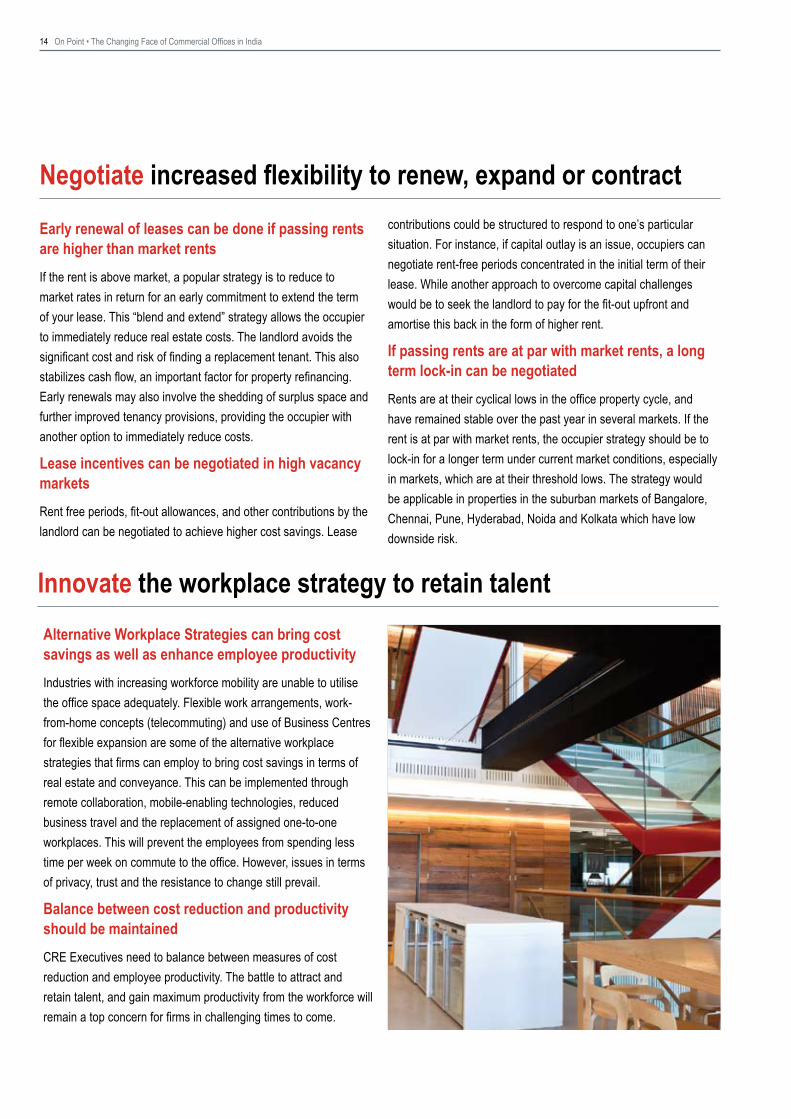
Innovate the workplace strategy to retain talentAlternative Workplace Strategies can bring cost savings as well as enhance employee productivityIndustries with increasing workforce mobility are unable to utilise the office space adequately. Flexible work arrangements, work-from-home concepts (telecommuting) and use of Business Centres for flexible expansion are some of the alternative workplace strategies that firms can employ to bring cost savings in terms of real estate and conveyance. This can be implemented through remote collaboration, mobile-enabling technologies, reduced business travel and the replacement of assigned one-to-one workplaces. This will prevent the employees from spending less time per week on commute to the office. However, issues in terms of privacy, trust and the resistance to change still prevail.
Balance between cost reduction and productivity should be maintainedCRE Executives need to balance between measures of cost reduction and employee productivity. The battle to attract and retain talent, and gain maximum productivity from the workforce will remain a top concern for firms in challenging times to come.
Early renewal of leases can be done if passing rents are higher than market rentsIf the rent is above market, a popular strategy is to reduce to market rates in return for an early commitment to extend the term of your lease. This “blend and extend” strategy allows the occupier to immediately reduce real estate costs. The landlord avoids the significant cost and risk of finding a replacement tenant. This also stabilizes cash flow, an important factor for property refinancing. Early renewals may also involve the shedding of surplus space and further improved tenancy provisions, providing the occupier with another option to immediately reduce costs.
Lease incentives can be negotiated in high vacancy marketsRent free periods, fit-out allowances, and other contributions by the landlord can be negotiated to achieve higher cost savings. Lease
contributions could be structured to respond to one’s particular situation. For instance, if capital outlay is an issue, occupiers can negotiate rent-free periods concentrated in the initial term of their lease. While another approach to overcome capital challenges would be to seek the landlord to pay for the fit-out upfront and amortise this back in the form of higher rent.
If passing rents are at par with market rents, a long term lock-in can be negotiatedRents are at their cyclical lows in the office property cycle, and have remained stable over the past year in several markets. If the rent is at par with market rents, the occupier strategy should be to lock-in for a longer term under current market conditions, especially in markets, which are at their threshold lows. The strategy would be applicable in properties in the suburban markets of Bangalore, Chennai, Pune, Hyderabad, Noida and Kolkata which have low downside risk.
On Point • The Changing Face of Commercial Offices in India 15
Authors
Himadri Mayank Assistant Vice President, Research & [email protected]+91 22 3307 1500 Himadri Mayank manages the operations of Jones Lang LaSalle’s research offering – Real Estate Intelligence Service (REIS), and is responsible for the team’s outputs, including research reports such as topical whitepapers. Since joining the firm in 2008, he has delivered several bespoke research projects in the office, retail and residential sectors based on specific client requirements.Himadri holds a bachelor’s degree from Indian Institute of Technology (IIT), Kharagpur and has over four years of experience in the field of real estate. He is pursuing the Chartered Financial Analyst (CFA) program offered by CFA Institute, Charlottesville and has passed the 2011 Level III CFA exam. He is the life member of Association for Promotion of Creative Learning, a not-for-profit organisation which aims to promote education for underprivileged through creativity and creative learning in society.
Srinivasa Reddy NS Manager, Research & [email protected]+91 80 4031 4833 Srinivasa Reddy joined Jones Lang LaSalle in March 2008. Based out of Bangalore, he contributes to research deliverables on the office, retail and residential real estate markets in India. He is also responsible for working on be-spoke projects and his expertise lies in the field of analytical market research, econometric modelling and forecasting.With over five years of industry research and business consulting experience, Srinivasa Reddy holds a masters degree in Economics.
Ashutosh Limaye Head – Research and [email protected]+91 22 3307 1500 Ashutosh Limaye is responsible for overseeing research and REIS business of JLL. He is also responsible for effective business development, selection, grooming and growth of professionals in the research division.He has 14 years of experience, including one and half years of post graduation in planning with specialization in Urban Planning. His contributions include real estate market intelligence and forecasting, formulations of economic and physical plans, assessments of policies, legislations and regulatory mechanisms for delivery of infrastructure services, study of urban governance initiatives for urban management programmes, identification of appropriate modes of private sector participation in infrastructure delivery for large-scale infrastructure and township projects in the urban context, financial cost-benefit analyses, project formulation and appraisals, and urban land management.
About Jones Lang LaSalleJones Lang LaSalle (NYSE:JLL) is a financial and professional services firm specializing in real estate. The firm offers integrated servicesdelivered by expert teams worldwide to clients seeking increased value by owning, occupying or investing in real estate. With 2010 globalrevenue of more than USD 2.9 billion, Jones Lang LaSalle serves clients in 70 countries from more than 1,000 locations worldwide, including200 corporate offices. The firm is an industry leader in property and corporate facility management services, with a portfolio of approximately1.8 billion square feet worldwide. LaSalle Investment Management, the company’s investment management business, is one of the world’slargest and most diverse in real estate with USD 45.3 billion of assets under management.Jones Lang LaSalle has over 50 years of experience in Asia Pacific, with over 20,800 employees operating in 77 offices in 13 countries acrossthe region. The firm was named the Best Property Consultancy in Asia Pacific at ‘The Asia Pacific Property Awards 2011 in association withBloomberg Television’. For further information, please visit our website, www.ap.joneslanglasalle.com
About Jones Lang LaSalle IndiaJones Lang LaSalle is India’s premiere and largest professional services firm specializing in real estate. With an extensive geographic footprint across eleven cities (Ahmedabad, Delhi, Mumbai, Bangalore, Pune, Chennai, Hyderabad, Kolkata, Kochi, Chandigarh and Coimbatore) and a staff strength of over 4000, the firm provides investors, developers, local corporates and multinational companies with a comprehensive range of services including research, analytics, consultancy, transactions, project and development services, integrated facility management, property and asset management, sustainability, warehousing and logistics, capital markets, residential, hotels, health care, senior living, education and retail advisory. For further information, please visit www.joneslanglasalle.co.in
Real Estate Intelligence Service (REIS) India is a subscription based research service designed to provide you with cutting edge insights into India’s diverse and challenging real estate markets through collation, analysis and forecasts of property market indicators and trends across all major Indian markets across various real estate asset classes - office, retail, residential. REIS empowers you with consistent and complete market data and analyses for all real estate indicators by specific micro markets. It is supplemented by value added services including client briefings, presentations and rapid market updates. For more details, contact, Ashutosh Limaye - [email protected]
COPYRIGHT © JONES LANG LASALLE All rights reserved. No part of this publication may be published without prior written permission from Jones Lang LaSalle. The information in this publication should be regarded solely as a general guide. Whilst care has been taken in its preparation no representation is made or responsibility accepted for the accuracy of the whole or any part. We stress that forecasting is a problematical exercise which at best should be regarded as an indicative assessment of possibilities rather than absolute certainties. The process of making forward projections involves assumptions regarding numerous variables which are acutely sensitive to changing conditions, variations in any one of which may significantly affect the outcome, and we draw your attention to this factor.
For more details, contact
Ashutosh Limaye Head – Research and [email protected]+91 22 3307 1500
Himadri Mayank Assistant Vice President, Research & [email protected]+91 22 3307 1500
Recommended